Article

Seasonal Variation and Operational Impacts on Ammonia Emission Factors from Hanwoo Manure Composting


1
Department of Safety Engineering, Graduate School, Seoul National University of Science & Technology, Seoul 01811, Republic of Korea
2
Department of Animal Industry Convergence, Kangwon National University, Chuncheon 24341, Republic of Korea
3
Animal Environment Division, National Institute of Animal Science, RDA, Wanju 55365, Republic of Korea
*
Authors to whom correspondence should be addressed.
Atmosphere 2026, 17(3), 268; https://doi.org/10.3390/atmos17030268
Submission received: 14 January 2026 / Revised: 28 February 2026 / Accepted: 2 March 2026 / Published: 4 March 2026
(This article belongs to the Section Air Pollution Control)

Abstract

This study aimed to derive a more accurate and representative ammonia emission factor specifically for Hanwoo manure composting. We monitored real-time emissions using a large-scale flux chamber 2400 m3), which we modified from an actual composting shed at a Hanwoo ranch in Chuncheon. Measurements were conducted across summer, autumn, and winter using a laser-based ammonia analyzer. The results indicated that ammonia emissions followed a seasonal order of Summer (61.7633 μg s−1 t−1) > Autumn (38.8512 μg s−1 t−1) > Winter (8.3189 μg s−1 t−1). The final calculated emission factor was 0.8368 kgNH3 yr−1 animal−1 as an all season average. While seasonal differences were statistically significant, hourly variations were less distinct compared to emission spikes induced by periodic mechanical agitation during the composting process. Our emission factor is significantly lower than national inventories, which is attributed to the inclusion of disturbances and the huge scale of the experimental chamber. These results offer a scientific foundation for updating the national inventory and provide a framework for future research on greenhouse gas emissions from diverse livestock sectors.

1. Introduction

Ammonia emitted into the atmosphere not only causes odor problems but also acts as a major precursor to ultrafine particulate matter (PM2.5) by reacting with acidic substances through atmospheric chemical reactions [1,2,3]. This secondarily formed particulate matter not only reduces visibility but also has significant impacts on human health, including respiratory disease [4].
Furthermore, when volatilized ammonia returns to the surface through wet or dry deposition, it accelerates soil acidification and triggers eutrophication in aquatic systems, leading to reduced biodiversity and a severe nitrogen imbalance across the entire ecosystem [5,6]. Therefore, as part of international efforts to mitigate climate change and improve air quality, reducing ammonia emissions from the agricultural and livestock sectors has become an essential task.
Globally, agriculture and livestock farming are identified as the primary sources of anthropogenic ammonia emissions, accounting for approximately 80–90% of the total [7,8,9]. Among livestock facilities, the manure treatment process—particularly the composting stage—is one of the stages where ammonia generation is most intensive. In Korea, as of 2023, manure management accounted for 77.1% (186,870 t yr−1) of total ammonia emissions (242,523 t yr−1), representing the largest source within the agricultural sector [10].
In 2021, the livestock sector dominated Korean agriculture, with pigs, Hanwoo, eggs, chickens, and milk ranking among the top ten commodities by production value [11]. Among them, Hanwoo are fed high-protein diets due to marbling-oriented feeding management tailored to consumer preferences. However, this leads to an increase in nitrogen excretion in manure [12]. Since approximately 83.8% of livestock manure in Korea is processed through composting according to national treatment statistics [13], calculating ammonia emissions from composting facilities is a core component of establishing the national ammonia inventory.
However, current research in Korea predominantly focuses on ammonia emissions from agriculture or the livestock barns [14,15]. Furthermore, the estimation of ammonia emissions relies heavily on default emission factors provided by the Intergovernmental Panel on Climate Change (IPCC) or European EMEP/EEA guidelines. These foreign coefficients have limitations in that they do not adequately reflect specific rearing environments (e.g., use of bedding, ventilation types), composting methods (e.g., forced aeration, turning), and Korea’s unique climatic conditions (seasonal variations in temperature and humidity) [16]. Hanwoo has different feeding standards and manure composition compared to Holstein [17], and ammonia emissions depending on the types and ratios of moisture regulating agents (sawdust and rice husks) [18]. Therefore, it is necessary to measure ammonia flux reflecting these characteristics.
The absence of accurate emission factors diminishes the effectiveness of particulate matter reduction policies in the livestock sector and increases the uncertainty of national emission statistics. While several studies have recently measured ammonia emissions at Korean livestock facilities [19], obtaining precise data from composting sites remains challenging due to fugitive emission sources and extended processing periods. In particular, actual measured data on emissions from composting sheds at the individual farm level or seasonal measurements are still insufficient. We hypothesize that emission factors derived from actual farm operations will differ significantly from IPCC default values and be strongly influenced by mechanical agitation.
Therefore, this study aims to analyze ammonia emission characteristics by conducting long-term monitoring of the composting process at actual Hanwoo cattle farms. This study aims to estimate ammonia emission factors specifically for Hanwoo manure composting by measuring its generated ammonia flux.

2. Materials and Methods

This study utilized a modified composting shed (Figure 1) in Chuncheon, Gangwon-do, which functioned as a flux chamber for ammonia emission monitoring. The composting shed measured 10 m in width, 60 m in length, and 4 m in average height, with a total volume of 2400 m3.
Previous studies achieved air changes per hour (ACHs) ranging from 10 to 60 [20,21], depending on their specific characteristics. Accordingly, we aimed to maintain an ACH within the 10 to 60 range. We used fans (Shinan Greentech Co., Ltd., Suncheon, Repblic of Korea) measuring 62 cm × 62 cm and an airflow capacity of 183 m3 min−1, each requiring 58 W of power. Given the farm’s power capacity of 250 W, a total of four fans were installed to facilitate airflow. These fans were positioned in pairs at the inlet and outlet of the flux chamber at a height of 2 m.
The manure was arranged in a pile approximately 2 m in width, 40 m in length, and 2 m in height on one side of the flux chamber. According to the farm’s standard operating procedure, the compost was turned once every two to three days using a tractor-mounted loader. This procedure involved excavating the manure from the bottom to flip and mix the upper and lower layers. Afterward, the mixed manure was restored to its original configuration to complete the turning process, which took about 30 min in total.
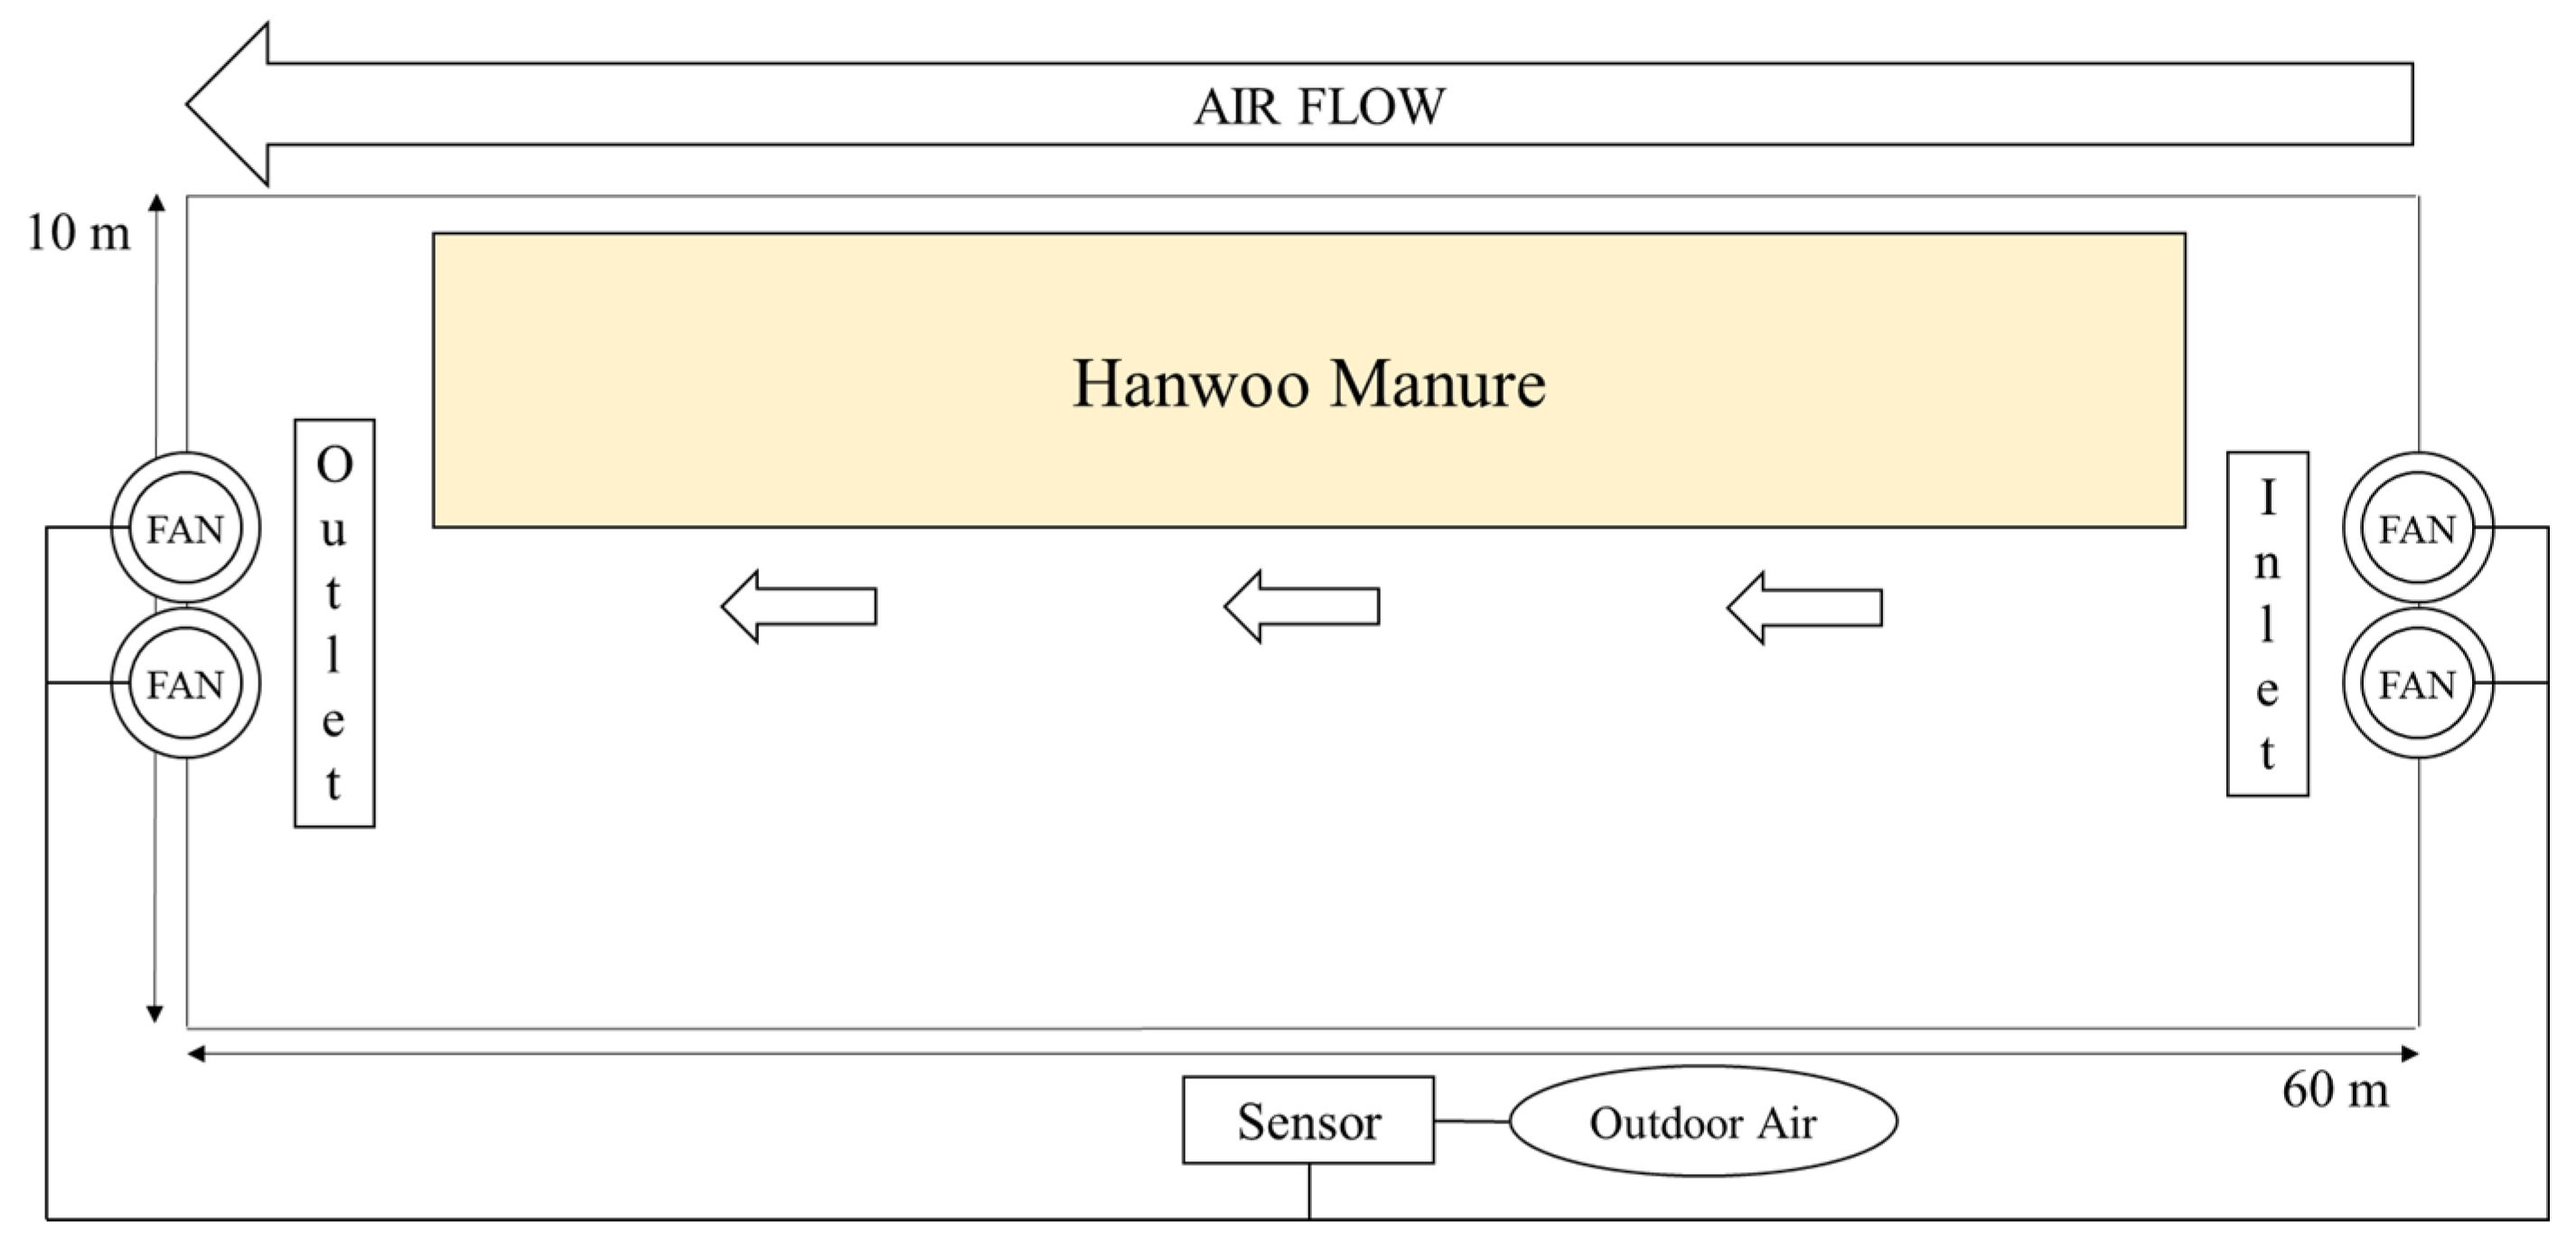
Ammonia concentrations were measured in real-time using a laser-based Ultraportable Ammonia Analyzer (ABB, Zurich, Switzerland). The analyzer was connected to five different sampling ports: two at the inlet fans, two at the outlet fans, and one at the outside the chamber. Measurement points were positioned at each fan to avoid cross-contamination of airflow between them, with an additional sampling port conducted outside for background concentration reference. Each point was monitored for 10 min to ensure sensor stabilization and capture temporal variations. Given the short measurement windows in summer and autumn, no additional calibration was conducted. However, in winter, a total of six calibrations were carried out at 10-day intervals. Figure 2 presents the detailed layout of the flux chamber, illustrating the integration of the fans, ammonia analyzer, and manure.
The mass concentration (μg m−3) was derived based on the ideal gas law: (Gas concentration × Pressure × Molecular weight)/(Temperature × Gas constant). The net gas concentration was obtained by subtracting the inlet concentration from the outlet concentration. Subsequently, the final emission factor (μg s−1 ton−1; representing gas emitted per second per ton of Hanwoo manure) was determined by incorporating the flow rate of the flux chamber and the weight of the manure. Atmospheric pressure data were sourced from the Korea Meteorological Administration (KMA) for the respective experimental dates, while the internal temperature within the flux chamber was measured using a thermometer. The detailed equations for calculating the emission factor are as follows:
C m = C o u t C i n × 10 9 × P × M W T × R × 10 6
E F = C m × Q W
  • EF: Emission Factor (μg s−1 ton−1)
  • Cm: Mass concentration of ammonia (μg m−3)
  • Cout: Ammonia Concentration of Outlet (ppb)
  • Cin: Ammonia Concentration of Inlet (ppb)
  • P: Measured atmospheric pressure (Pa)
  • MW: Molecular weight of Ammonia (g mol−1)
  • T: Measured temperature (K)
  • R: Gas Constant (8.314 J (mol K)−1)
  • Q: Flow rate of fan (6.1 m3 s−1)
  • W: Weight of manure (t)
The study initially aimed to monitor all four seasons (spring, summer, autumn, winter) in Korea. However, given the climatological similarities between spring and autumn, data collection focused on autumn to serve as a representative period for both seasons. Our analysis revealed that the ambient temperature and humidity surrounding the chamber in autumn were 13.6 °C and 50%, respectively, which closely align with the spring averages in Chuncheon (13.2 °C and 59%). Accordingly, we determined that utilizing autumn data as a surrogate for spring is statistically justifiable. Nevertheless, we acknowledge the inherent uncertainty associated with the absence of direct observations during the spring period.
The measurement periods for each season were as follows: September 2024 for summer (9 days), October 2024 for autumn (7 days), and January to March 2025 for winter (67 days). While September is traditionally considered autumn, the early part of the month in 2024 was classified as summer according to the Korea Meteorological Administration (KMA) standards [22]. The total weight of the mixture reached 111 tons (83 tons of manure and 28 tons of sawdust) during the summer and autumn trials, whereas it increased to 204 tons (143 tons of manure and 61 tons of sawdust) for the winter trial.
Each measurement session lasted from initial loading of the manure into the composting shed until maturation was fully achieved. The process was considered finished when the C/N ratio dropped to 20 or below and the vs. reduction rate reached at least 50% relative to the initial state. The entire compost pile was divided into five zones, with a 200 g sample collected from each. This procedure was performed daily during summer and autumn, and triennially (once every three days) during winter. The collected samples were transported to the laboratory for analysis, and the average values from the five zones were used to characterize the C/N ratio and vs. content of the entire compost. Table 1 summarizes the manure’s moisture content, total Kjeldahl nitrogen (TKN), volatile solids (VS), C/N ratio, and pH measured during the experimental period.
Internal temperature of the manure was not recorded during composting because scale of the pile precluded the use of conventional thermometers. Consequently, the relationship between microbial activity and internal temperature fluctuations could not be evaluated. Ambient temperature within the chamber exhibited seasonal variations, averaging 31.2 °C in summer, 15.7 °C in autumn, and 6.4 °C in winter. Similarly, the mean relative humidity was recorded at 43% in summer, 32% in autumn, and 25% in winter, respectively.
Statistical analysis was executed using Python (ver. 3.14) employing the following libraries: Pandas for data handling, SciPy (scipy.stats) for fundamental statistical tests, and scikit-posthocs for post hoc analysis. To assess the normality and homogeneity of variance, the Shapiro–Wilk test (shapiro) and Levene’s test (levene) were performed. The seasonal and hourly datasets exhibited skewed distributions due to sharp ammonia peaks during turning, leading to a violation of parametric assumptions. This statistical characteristic is inherently linked to the physical nature of the composting process. Specifically, the intermittent turning events triggered massive ammonia emission spikes, resulting in prominent outliers and a highly skewed distribution. Consequently, the non-parametric Kruskal–Wallis test was employed to evaluate the significance between groups. Dunn’s test was utilized for post hoc analysis with Bonferroni correction to determine specific group differences, with the significance level set at p < 0.05.

3. Results and Discussion

3.1. Seasonal Ammonia Emission Measurements

Table 2 summarizes the ammonia emission measurement results by season. The mean emissions were highest in summer, followed by autumn and winter, with an overall average of 9.0879 μg·s−1·ton−1 across the three seasons. A Kruskal–Wallis test revealed statistically significant differences among the seasonal groups (p < 0.001).
Previous studies on ammonia emission factors have reported various results, including 11.41 ± 5.86 kgNH3 animal−1 yr−1 for cattle rearing facilities using dynamic flux chambers [15], 9.4 ± 5.7 kgNH3 animal−1 yr−1 for dairy facilities [23], and 11.2 g day−1 pig−1 on force-ventilated sow housing [24].
The overall mean ammonia emission in this study was 9.0879 μg s−1 t−1. Based on an annual extrapolation of total emissions per ton of manure, this corresponds to 0.2866 kgNH3 yr−1 t−1. By applying the standard manure production rate for Hanwoo (8 kg animal−1 day−1) [25], this translates to 0.8368 kgNH3 yr−1 animal−1, which is significantly lower than the values reported in previous studies. Furthermore, this figure is approximately 94% lower than the current Korean ammonia emission factor for Hanwoo manure, which is 14.00 kgNH3 yr−1 animal−1 [26]. This substantial discrepancy is attributed to the inclusion of comprehensive seasonal data and the specific characteristics of the large-scale flux chamber used in the present study.
Even when calculating the emission factor using only the summer data, which yielded the highest value of 5.6875 kgNH3 yr−1 animal−1. This discrepancy persists even without incorporating the lower winter measurements, suggesting that the sensors may not have captured the full extent of the emitted ammonia flux.
Due to the substantial volume of the flux chamber (2400 m3), we maintained the highest ACH of 9.15 within the farm’s available power capacity. However, this value is lower compared to previous studies [20,21]. However, this value is lower than those reported in previous studies [20,21]. An increase in chamber volume often leads to a lower ACH, potentially resulting in an underestimation of the gas flux [27]. Furthermore, empirical evidence from small-scale wind tunnel experiments has shown a direct proportional relationship between ventilation rates and mass transfer coefficients [28], with relatively low ammonia fluxes being observed under low ACH conditions [29]. Consequently, the relatively low ACH in our setup is presumed to have influenced the measurements, likely leading to some degree of flux underestimation.
Furthermore, since the composting facility was retrofitted into a flux chamber, potential ammonia leakage due to imperfect sealing cannot be entirely ruled out. Consequently, it is essential to verify gas transport dynamics in large-scale flux chambers by employing tracer gas techniques in future research.

3.2. Ammonia Emission Factor Patterns Based on Compost Maturation Progress by Season

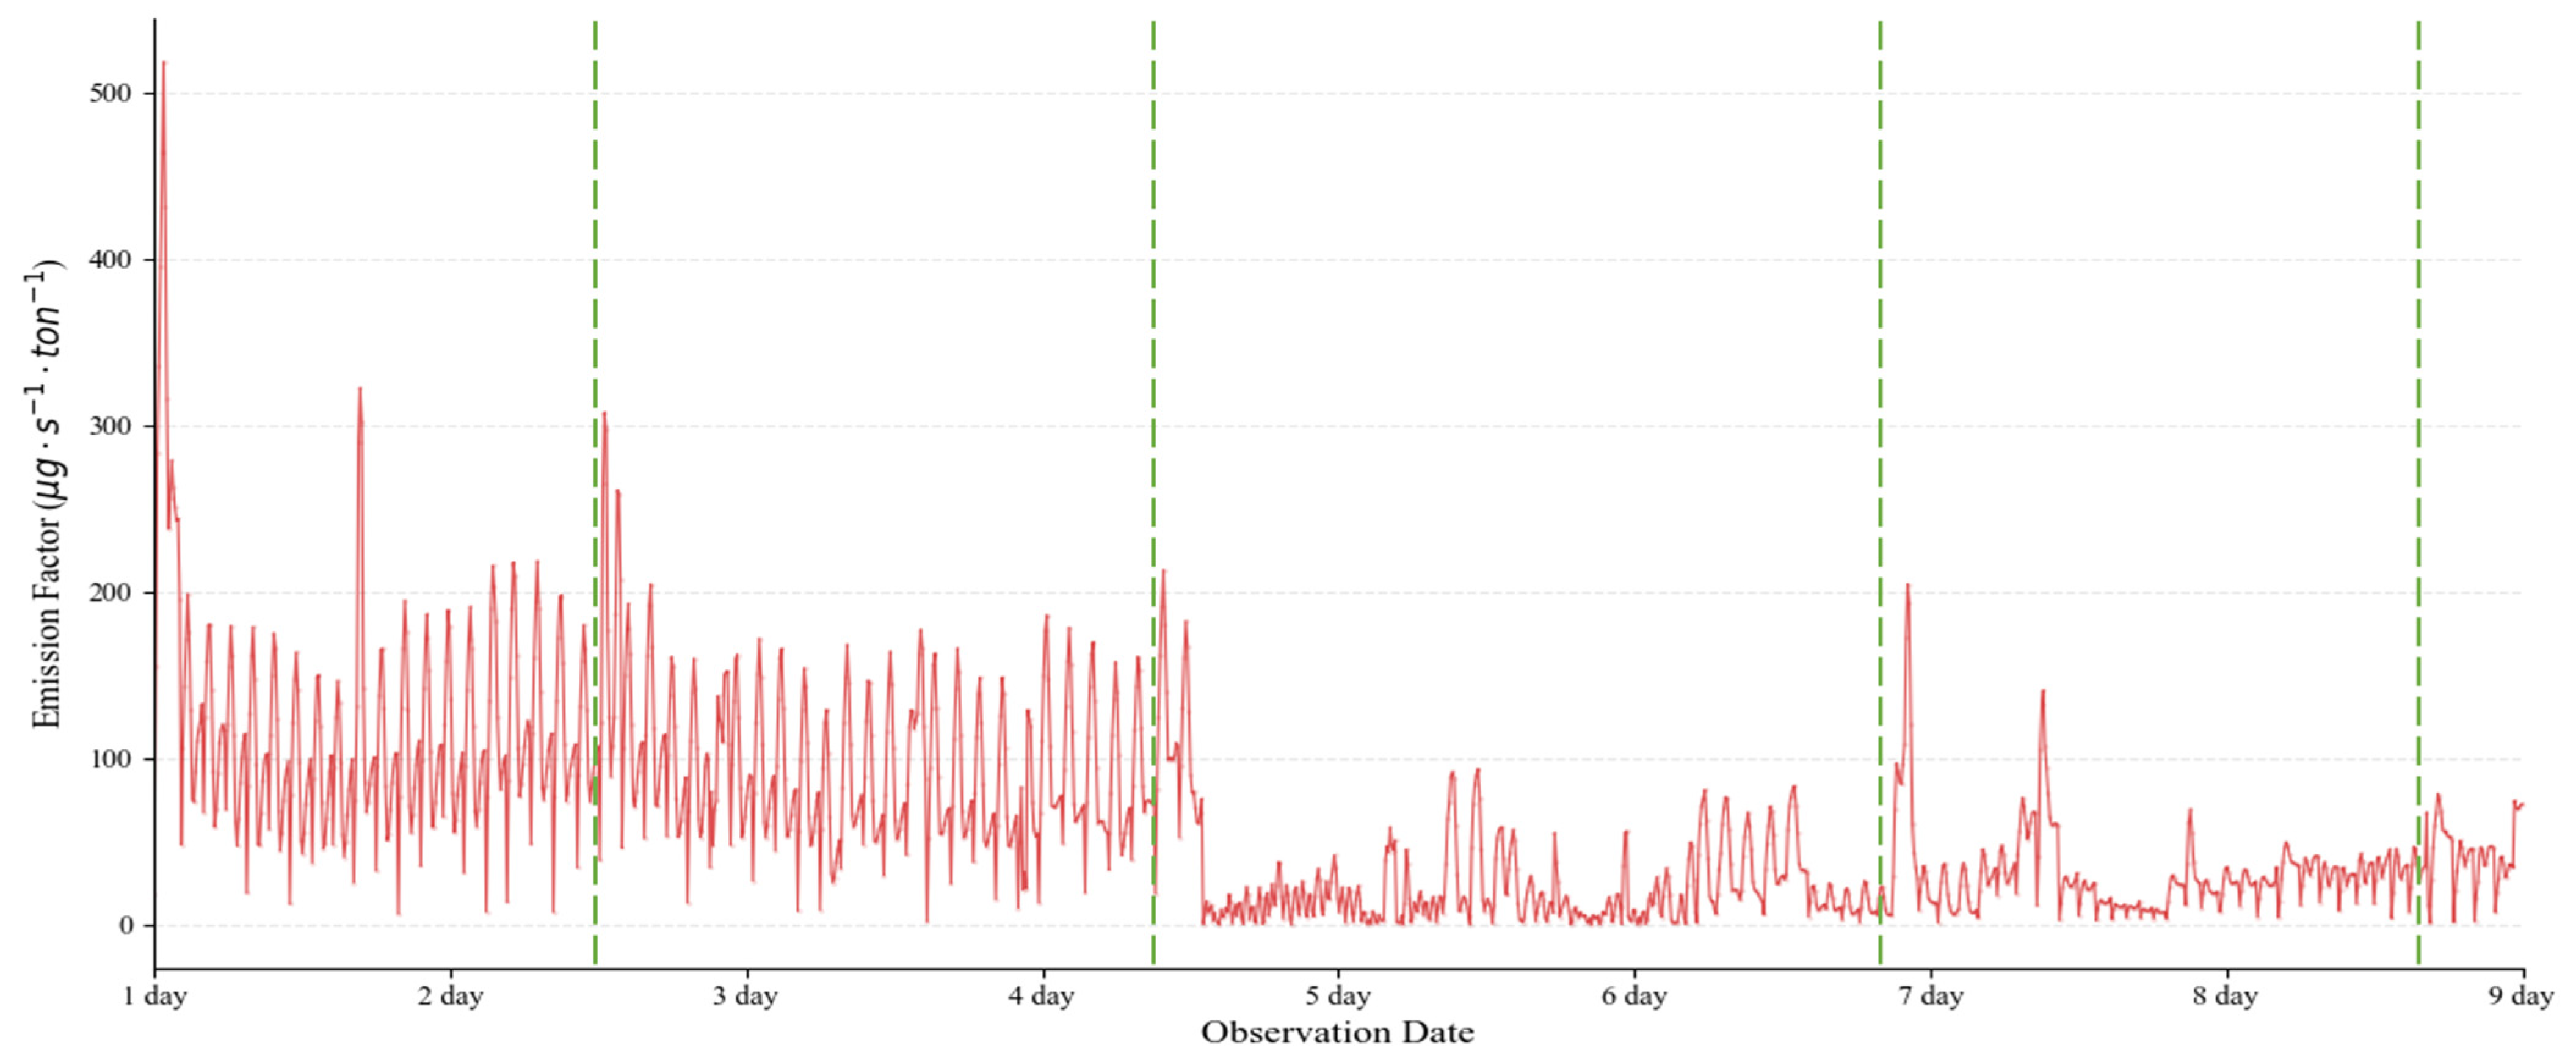
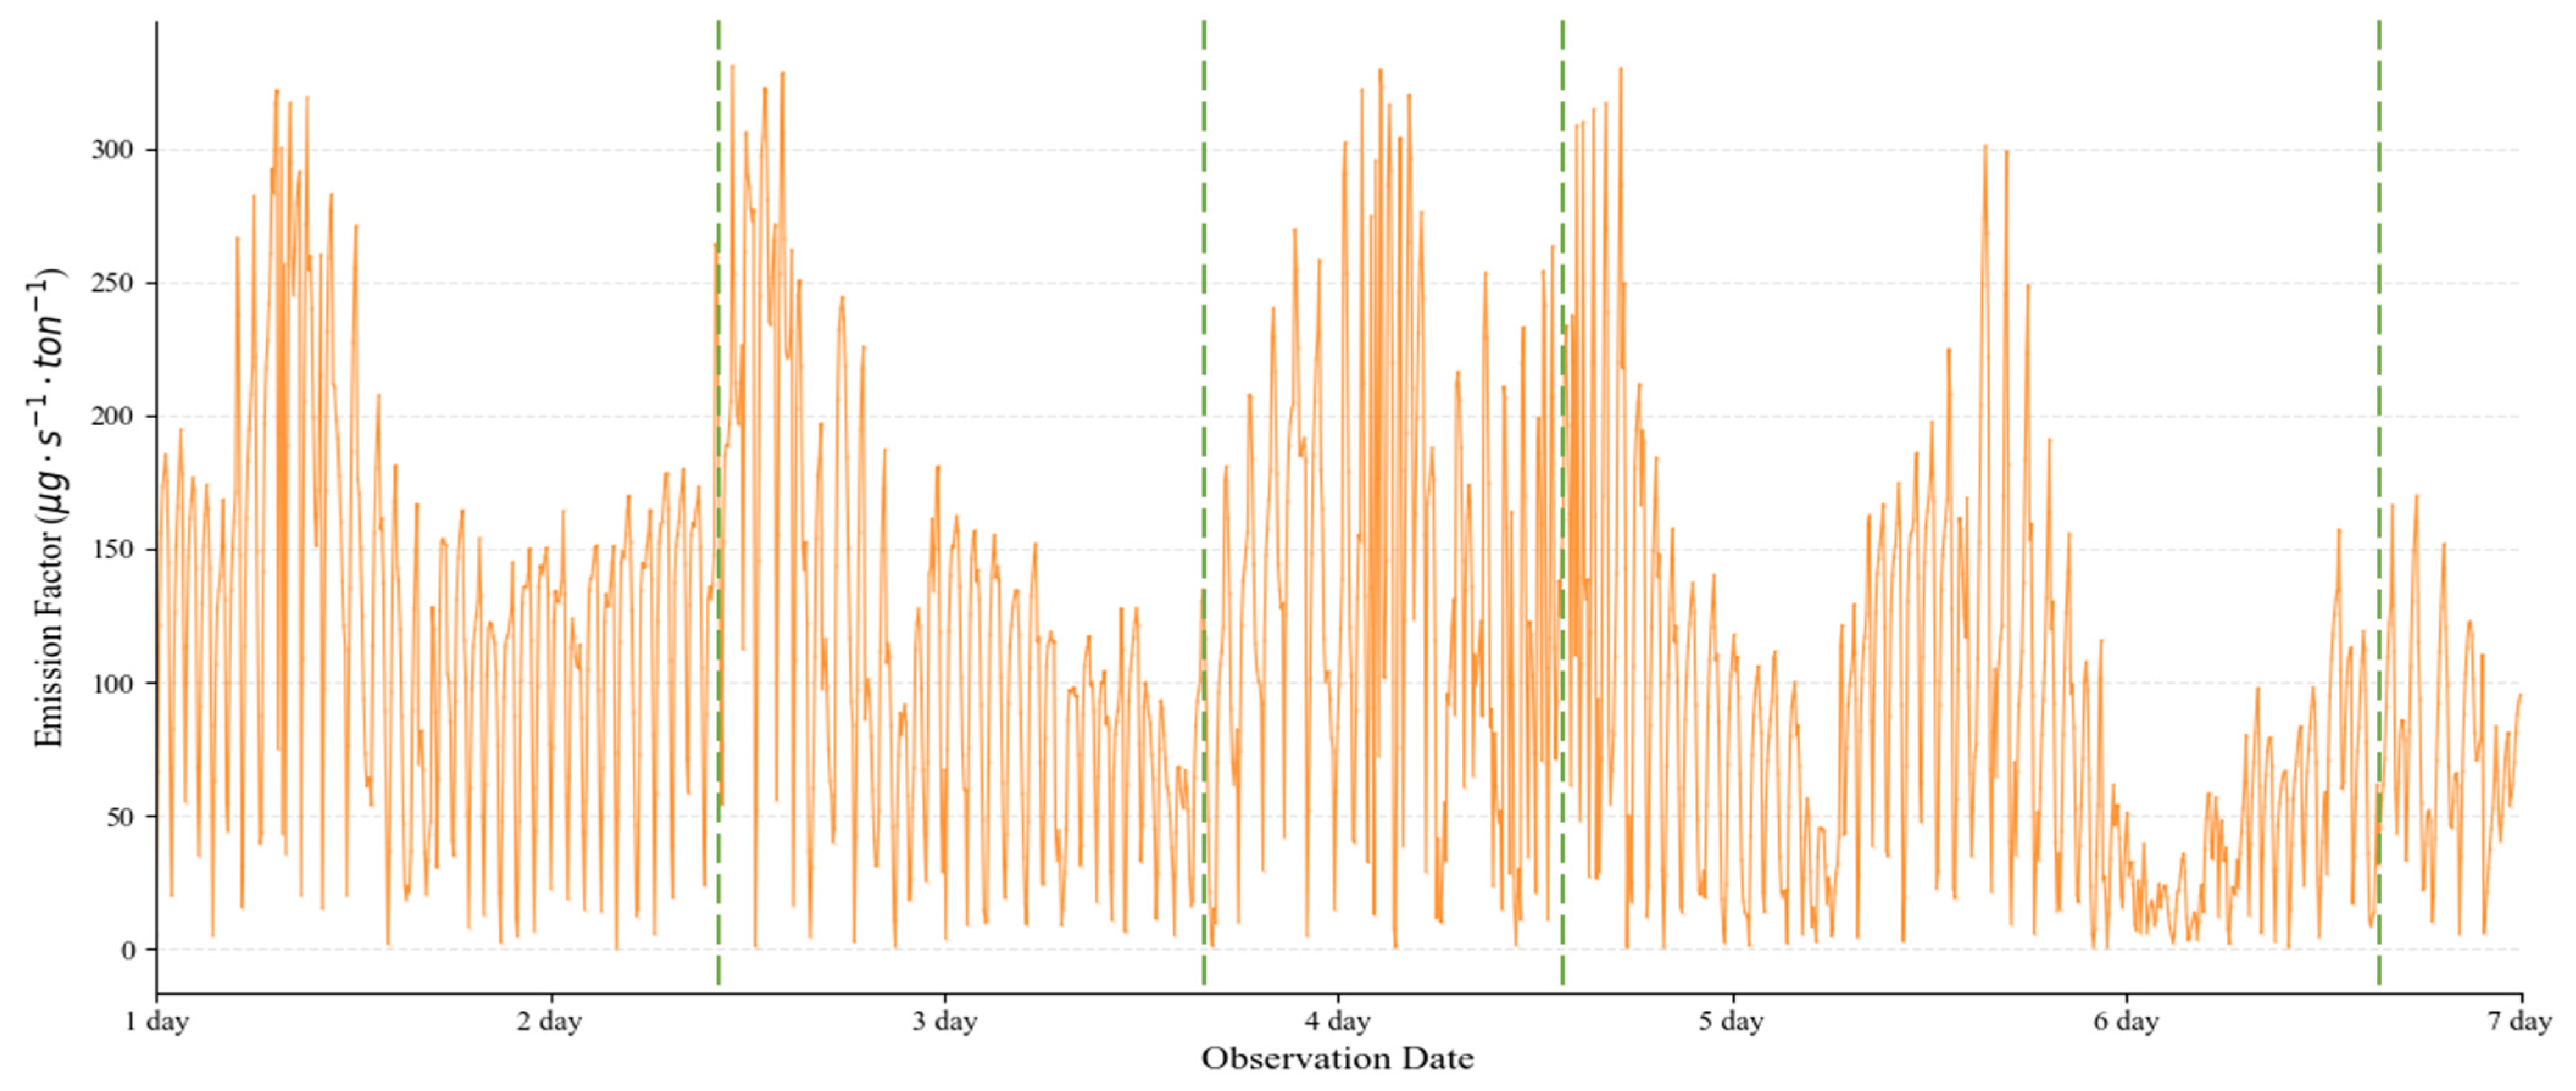
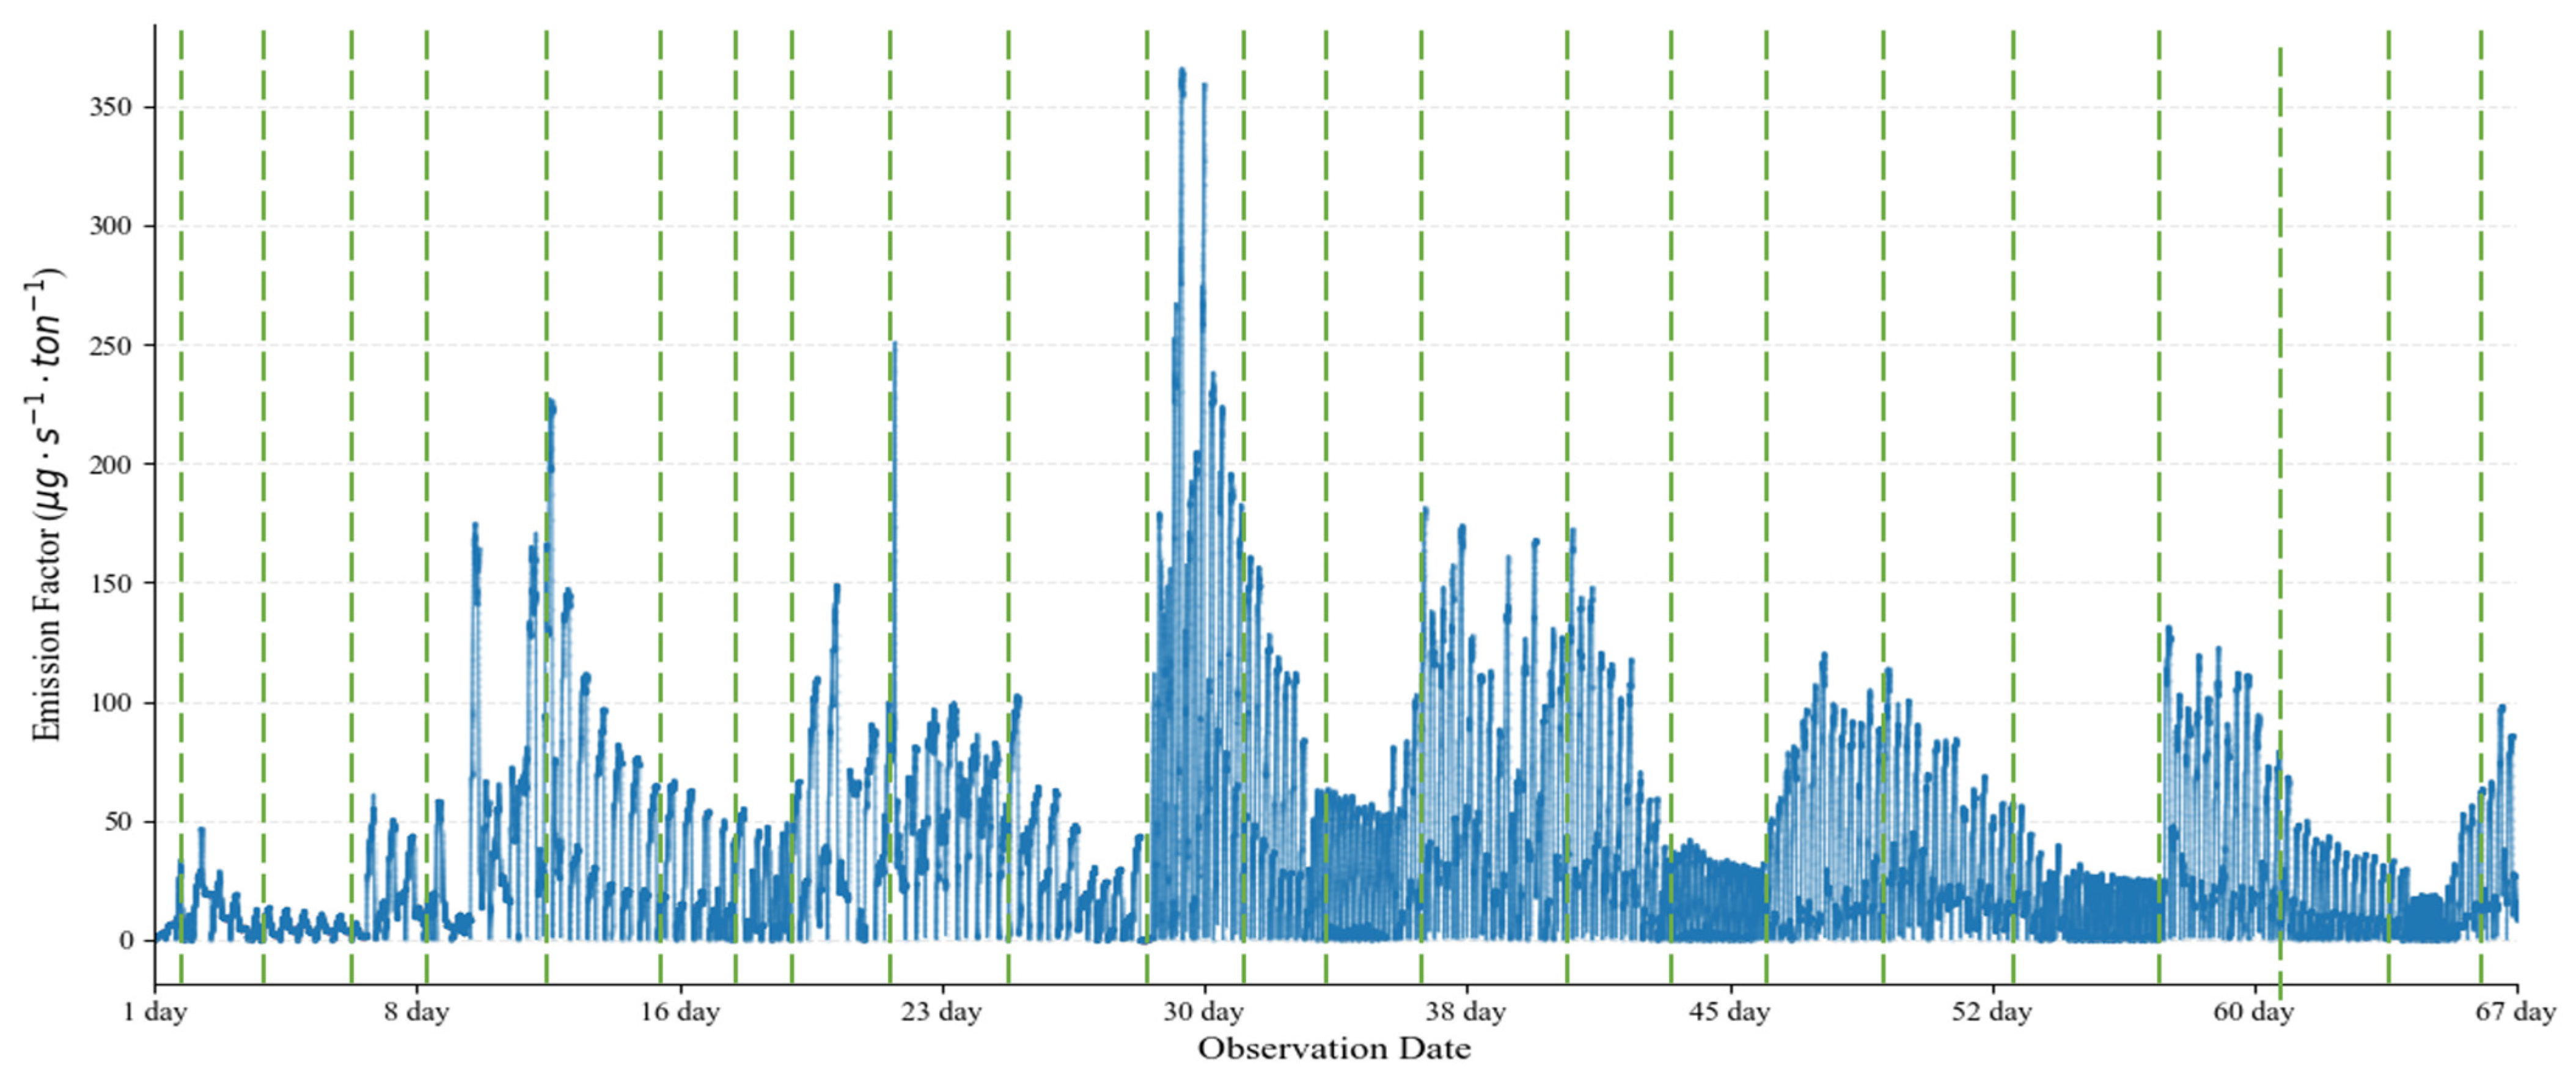
The seasonal patterns of ammonia emission factors during the composting process are presented in Figure 3, Figure 4 and Figure 5. These figures illustrate the temporal fluctuations in emission factors throughout the measurement period. The dashed lines indicate the periods when turning occurred; this operation was conducted every 2–3 days, with each event taking approximately 30 min. Turning was performed 31 times in total: four times each during summer and autumn, and 23 times during winter. On average, ammonia emissions surged by 426% when comparing the three-hour windows immediately preceding and following the turning events.
While it is well-established that ammonia volatilization typically correlates with increasing temperatures [30], this study observed peak emissions at times decoupled from the daily temperature maximum (2–3 PM). Furthermore, the lack of a significant increase in the emission factor during peak daylight hours suggests a lagged response related to the timing of mechanical agitation and subsequent changes in the internal temperature of the compost. The flux chamber utilized in this research was a modified version of a standard composting facility on a Hanwoo farm, where mechanical agitation is conducted every 1–3 days to promote maturation. This process triggers the sudden release of large quantities of ammonia sequestered within the pile [31,32], indicating that agitation acts as the primary driver of high ammonia emissions, overshadowing other environmental factors [33].
Airflow dynamics within the flux chamber may have also influenced the measurement results. The chamber in this study featured a height of 4 m and a volume of 2400 m3. This scale is substantially larger than conventional flux chambers typically dimensioned in centimeters [34,35]. Such a vast enclosure makes it difficult to establish a steady-state, uniform flow. Furthermore, the frequent entry and exit of workers for agitation purposes periodically disrupted the stabilized airflow. Even in large-scale emission surveys, smaller flux chambers remain the predominant choice [29]. This lack of consistent airflow may have delayed the transport of emitted ammonia to the sensors, potentially confounding the analysis of emission patterns across different time intervals.
However, these limitations can also be viewed as the distinctive strengths of this research. Unlike conventional small-scale experiments, we utilized an actual composting shed on a functional farm as a large-scale flux chamber. The results may have been subject to disturbances from worker activity and mechanical agitation. However, these factors provide a unique opportunity to evaluate the results as a comprehensive emission factor that reflects actual composting variables. Additionally, by conducting measurements across multiple seasons rather than focusing on a single period, the overall representativeness of the ammonia emission factor was significantly enhanced.
Several follow-up studies are proposed to build upon the findings of this research. First, as the evaluation of emission factors using flux chambers expands across various livestock manure treatments [36,37], future research should include a more diversified range of manure types using actual maturation methods. Second, comparative measurements using conventional small-scale flux chambers under identical conditions could help benchmark the impact of various environmental variables against our large-scale results. Finally, the methodology applied in this study is readily applicable to estimate emission factors for other greenhouse gases, such as CH4 and N2O.
Furthermore, spring measurements were omitted and substituted with autumn data. While these two seasons share climatological similarities, uncertainties remain due to potential variations in factors such as manure composition, solar radiation, and photoperiod. Future research should address these limitations by conducting direct measurements across all four seasons to ensure higher precision and data reliability.

3.3. Hourly Patterns of Ammonia Emission Factors

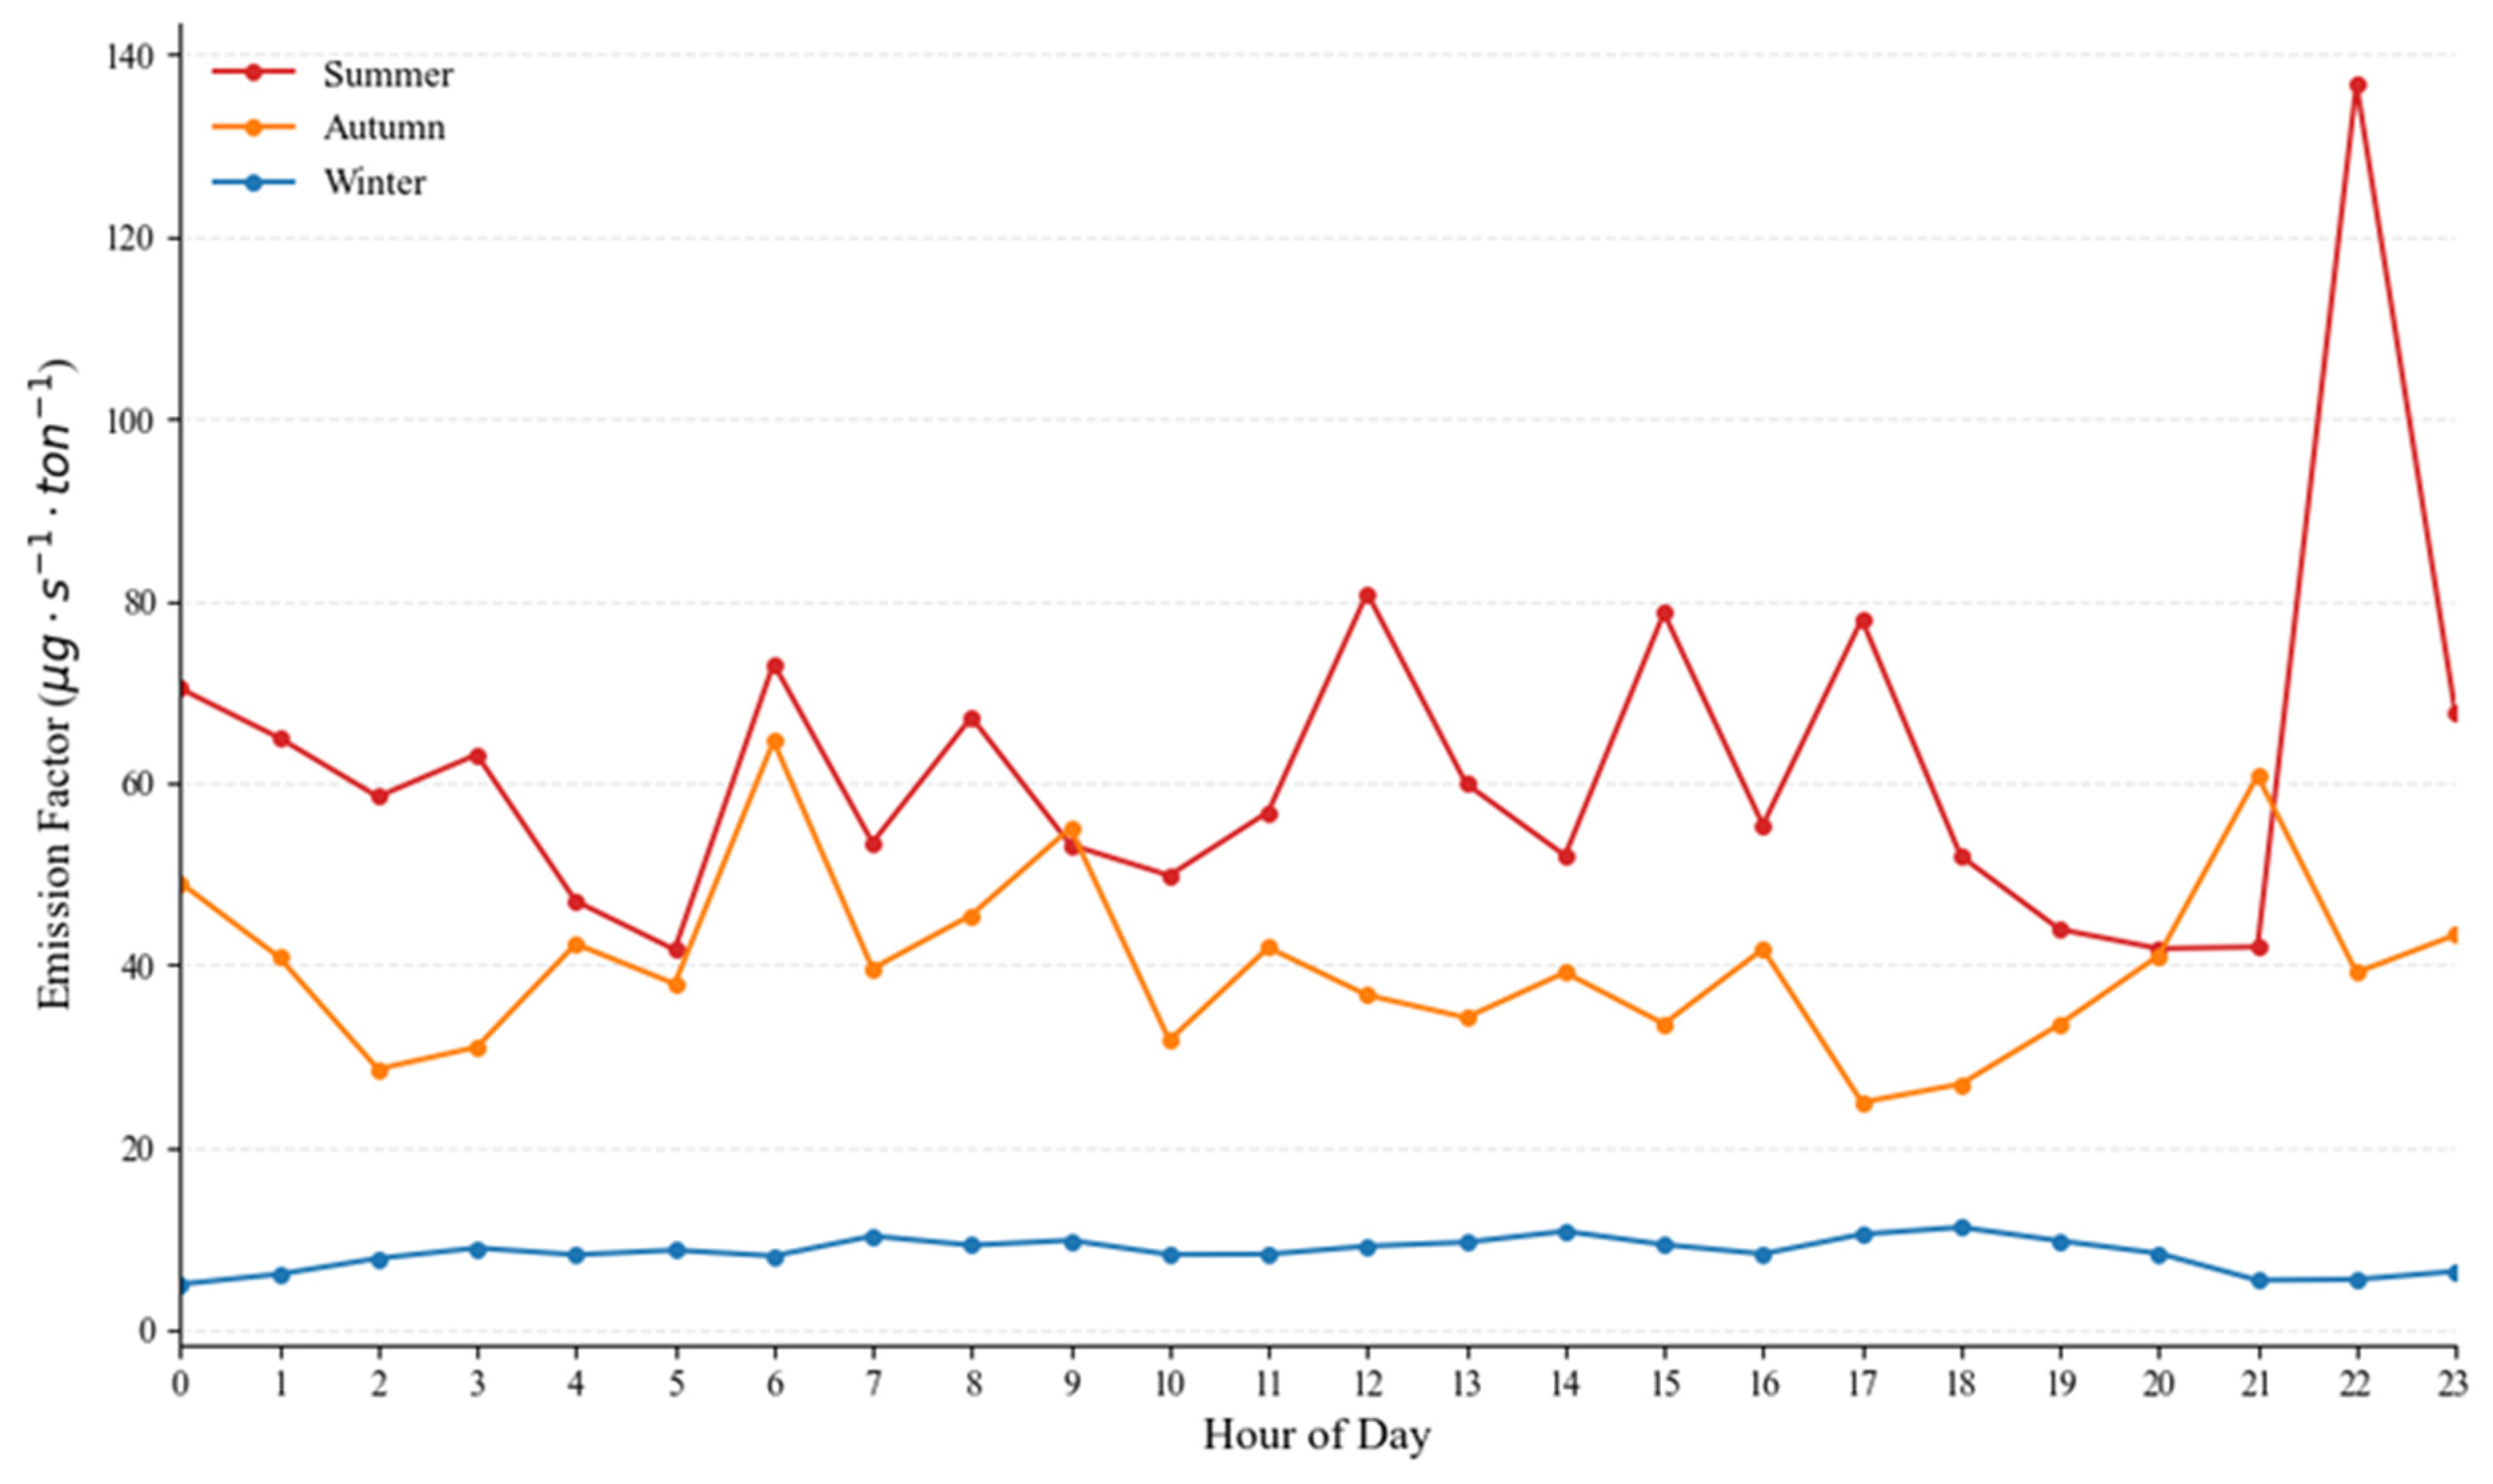
Figure 6 illustrates the seasonal variations in emission factors over a 24 h period. The data represent hourly averages, calculated from the 0th to the 59th minute of each hour. In summer and autumn, a discernible temporal pattern was observed, characterized by emissions that steadily rose and subsequently declined. The peak emission levels were recorded at 06:00 in autumn and 22:00 in summer. In contrast, the winter season exhibited no distinct hourly trend.
Conversely, the Kruskal–Wallis test conducted across different time intervals revealed a contrasting trend. The analysis was performed by categorizing the 24 h cycle into eight groups at 3 h intervals. The effect size (η2) of the group models was 0.04150 for the pooled seasonal data, 0.01481 for autumn, 0.01696 for summer, and 0.04254 for winter. According to Cohen’s criteria, the effect sizes for all datasets are classified as small (0.01 ≤ η2 ≤ 0.06) [38]. This indicates that while statistical differences exist between time intervals, the actual proportion of variance explained by the time of day is relatively limited.
Table 3 presents the results of Dunn’s post hoc analysis following the Kruskal–Wallis test by time of day. The analysis identified three homogeneous subsets for summer, two for autumn, and seven for winter. In the case of summer, the distinctions between groups remained ambiguous, despite elevated emission levels and hourly variations. Conversely, in winter, the emission characteristics were statistically and distinctly categorized by time interval. These hourly emission patterns align with the variations observed over the entire measurement period, as shown in Figure 3, Figure 4 and Figure 5.

4. Conclusions

We measured ammonia emissions during the composting of Hanwoo (Korean beef) manure at an actual ranch in Korea and calculated emission factors based on the empirical findings. The measurements were conducted during summer, autumn, and winter, with emission rates exhibiting a decreasing trend from summer to winter. The final emission factors were determined to be 5.6875 kgNH3 yr−1 animal−1 for summer, 3.5776 kgNH3 yr−1 animal−1 for autumn, 0.7660 kgNH3 yr−1 animal−1 for winter, and an overall seasonal average of 0.8368 kgNH3 yr−1 animal−1. These values are significantly lower than both current national guidelines and results from previous literature. Statistically significant differences were observed in mean emission factors across seasons. While hourly statistical analysis revealed significant differences between time intervals, no distinct diurnal trend was observed over the course of the day.
The primary reasons for the discrepancy between our findings and previous research stem from the unique experimental design—which incorporated variables from conventional farms—and the immense scale of the flux chamber. Periodic mechanical agitation and variables associated with farm workers within the chamber likely influenced the measured ammonia emission factors. Specifically, there is a possibility that the total volatilized ammonia was not fully captured due to stagnant air zones resulting from the relatively low ACH. Furthermore, potential leakage points may have existed due to the structural retrofit of the composting shed into a large-scale flux chamber.
Despite these limitations, this study is pivotal as it utilizes comprehensive seasonal data and incorporates actual composting practices to derive more realistic ammonia emission factors. Based on our findings, further research should be conducted targeting various livestock manure types and assessing greenhouse gases in conjunction with ammonia. The findings of this study provide a robust basis for the registration of a new national emission factor for Korea. Future verification experiments conducted across multiple farms will further refine these findings by addressing technical constraints such as chamber mixing efficiency. Such advancements will lead to even more robust and standardized emission factors, providing a higher level of scientific certainty for national inventory reporting.

Author Contributions

Conceptualization, K.-Y.K.; methodology, K.-Y.K.; software, W.-J.L.; validation, K.-Y.K.; formal analysis, W.-J.L.; investigation, W.-J.L. and G.-W.P.; resources, J.-K.K.; data curation, G.-W.P.; writing—original draft preparation, W.-J.L.; writing—review and editing, K.-Y.K. and J.-K.K.; project administration, J.-K.K.; funding acquisition, K.-Y.K. All authors have read and agreed to the published version of the manuscript.

Funding

This study was supported by “Cooperative Research Program for Agriculture Science & Technology Development (Project No. RS-2022-RD010222)”, Rural Development Administration, Republic of Korea. And the APC was funded by Rural Development Administration, Republic of Korea.

Institutional Review Board Statement

Not applicable.

Informed Consent Statement

Not applicable.

Data Availability Statement

The original contributions presented in this study are included in the article. Further inquiries can be directed to the corresponding authors.

Conflicts of Interest

The authors declare no conflicts of interest.

References

  1. Brunekreef, B.; Harrison, R.M.; Künzli, N.; Querol, X.; Sutton, M.A.; Heederik, D.J.; Sigsgaard, T. Reducing the health effect of particles from agriculture. Lancet Respir. Med. 2015, 3, 831–832. [Google Scholar] [CrossRef] [Scilit]
  2. Thakrar, S.K.; Balasubramanian, S.; Adams, P.J.; Azevedo, I.M.; Muller, N.Z.; Pandis, S.N.; Polasky, S.; Pope, C.A., III; Robinson, A.L.; Apte, J.S. Reducing mortality from air pollution in the United States by targeting specific emission sources. Environ. Sci. Technol. Lett. 2020, 7, 639–645. [Google Scholar] [CrossRef] [Scilit]
  3. Megaritis, A.; Fountoukis, C.; Charalampidis, P.; Pilinis, C.; Pandis, S.N. Response of fine particulate matter concentrations to changes of emissions and temperature in Europe. Atmos. Chem. Phys. 2013, 13, 3423–3443. [Google Scholar] [CrossRef] [Scilit]
  4. Feng, S.; Gao, D.; Liao, F.; Zhou, F.; Wang, X. The health effects of ambient PM2. 5 and potential mechanisms. Ecotoxicol. Environ. Saf. 2016, 128, 67–74. [Google Scholar] [CrossRef] [Scilit] [PubMed]
  5. Galloway, J.N.; Aber, J.D.; Erisman, J.W.; Seitzinger, S.P.; Howarth, R.W.; Cowling, E.B.; Cosby, B.J. The nitrogen cascade. Bioscience 2003, 53, 341–356. [Google Scholar] [CrossRef] [Scilit]
  6. Sutton, M.A.; Howard, C.M.; Erisman, J.W.; Billen, G.; Bleeker, A.; Grennfelt, P.; Van Grinsven, H.; Grizzetti, B. The European Nitrogen Assessment: Sources, Effects and Policy Perspectives; Cambridge University Press: Cambridge, UK, 2011. [Google Scholar]
  7. Hristov, A.N.; Hanigan, M.; Cole, A.; Todd, R.; McAllister, T.A.; Ndegwa, P.M.; Rotz, A. Ammonia emissions from dairy farms and beef feedlots. Can. J. Anim. Sci. 2011, 91, 1–35. [Google Scholar] [CrossRef] [Scilit]
  8. Van Damme, M.; Clarisse, L.; Franco, B.; Sutton, M.A.; Erisman, J.W.; Kruit, R.W.; Van Zanten, M.; Whitburn, S.; Hadji-Lazaro, J.; Hurtmans, D.; et al. Global, regional and national trends of atmospheric ammonia derived from a decadal (2008–2018) satellite record. Environ. Res. Lett. 2021, 16, 055017. [Google Scholar] [CrossRef] [Scilit]
  9. Wyer, K.E.; Kelleghan, D.B.; Blanes-Vidal, V.; Schauberger, G.; Curran, T.P. Ammonia emissions from agriculture and their contribution to fine particulate matter: A review of implications for human health. J. Environ. Manag. 2022, 323, 116285. [Google Scholar] [CrossRef] [Scilit]
  10. Clean Air Policy Support System. Emissions by Source Category. 2026. Available online: https://www.air.go.kr/eng/capss/emission/sector.do?menuId=191 (accessed on 10 February 2026).
  11. Ministry of Agriculture, Food and Rural Affairs. Agricultural and Forestry Production Index. 2023. Available online: https://kosis.kr/statHtml/statHtml.do?orgId=114&tblId=DT_114_2014_S0002&conn_path=I2 (accessed on 10 February 2026).
  12. Jeon, S.; Cho, H.; Kang, H.; Kang, K.; Lee, M.; Park, E.; Hong, S.; Seo, S. Effects of the crude protein concentration on the growth performance and blood parameters in growing Hanwoo steers (Bos taurus coreanae). Korean J. Agric. Sci. 2021, 48, 975–985. [Google Scholar] [CrossRef] [Scilit]
  13. Ministry of Climate, Energy and Environment. Livestock Manure Generation and Treatment Status. 2025. Available online: https://www.index.go.kr/unity/potal/main/EachDtlPageDetail.do?idx_cd=1475 (accessed on 10 February 2026).
  14. Hong, S.-C.; Kim, J.-H.; Kim, M.-W. Estimation of ammonia emission with compost application in plastic house for leafy perilla cultivation. Korean J. Environ. Agric. 2021, 40, 149–160. [Google Scholar] [CrossRef] [Scilit]
  15. Sa, J.; Jeon, E. Estimation of ammonia flux and emission factor from cattle housing using dynamic flux chamber. J. Environ. Health Sci. 2010, 36, 33–43. [Google Scholar] [CrossRef] [Scilit]
  16. Kim, M.-S.; Koo, N.; Kim, J.-G. A comparative study on ammonia emission inventory in livestock manure compost application through a foreign case study. Korean J. Environ. Biol. 2020, 38, 71–81. [Google Scholar] [CrossRef] [Scilit]
  17. Yu, H.; Kim, H.; Kim, D.; Choi, H.; Baek, G.; Lee, C. Seasonal and storage effects on characteristics and anaerobic digestibility of cattle manure. Bioresour. Technol. 2026, 440, 133535. [Google Scholar] [PubMed]
  18. Lee, W.J.; Park, G.W.; Kim, K.Y. Estimation of emission factors of ammonia and greenhouse gases generated from composting manure of Korean beef. J. Anim. Environ. Sci. 2024, 26, 10–14. [Google Scholar] [CrossRef] [Scilit]
  19. Liu, Z.; Liu, Y.; Murphy, J.P.; Maghirang, R. Ammonia and methane emission factors from cattle operations expressed as losses of dietary nutrients or energy. Agriculture 2017, 7, 16. [Google Scholar] [CrossRef] [Scilit]
  20. Wheeler, E.F.; Topper, P.; Brandt, R.; Brown, N.; Adviento-Borbe, A.; Thomas, R.; Varga, G. Multiple-chamber instrumentation development for comparing gas fluxes from biological materials. Appl. Eng. Agric. 2011, 27, 1049–1060. [Google Scholar] [CrossRef] [Scilit]
  21. Perez, R.R.A. Evaluation and Application of a Dynamic Emissions Chamber for Quantifying Gaseous Emissions from Laying Hen Manure. Master’s Thesis, Iowa State University, Ames, IA, USA, 2011. [Google Scholar]
  22. Korea Meteorological Administration. Seasonal Length. Climate Information Portal. 2026. Available online: http://climate.go.kr/home/CCS/contents_2021/influence/inf_2-1.php (accessed on 10 February 2026).
  23. Mukhtar, S.; Mutlu, A.; Capareda, S.C.; Parnell, C.B. Seasonal and spatial variations of ammonia emissions from an open-lot dairy operation. J. Air Waste Manag. Assoc. 2008, 58, 369–376. [Google Scholar] [CrossRef] [Scilit]
  24. Park, S.; Jung, M.; Seo, S.; Woo, S.; Hwang, O.; Park, J. Estimation of ammonia emission factors for a mechanically-ventilated sow facility in fall. J. Clim. Change Res. 2022, 13, 501–509. [Google Scholar] [CrossRef] [Scilit]
  25. Rural Development Administration. Livestock Excreta Emission Source Unit. 2025. Available online: https://www.nongsaro.go.kr/portal/ps/psg/psga/psgaa/exhstwonUnitCalc.ps?menuId=PS03132 (accessed on 10 February 2026).
  26. Clean Air Policy Support System. National Air Pollutant Emissions Calculation Method Manual (VII). 2025. Available online: https://www.air.go.kr/article/view.do?boardId=8&articleId=491&boardId=8&menuId=49&currentPageNo=1 (accessed on 10 February 2026).
  27. Eckley, C.S.; Gustin, M.; Lin, C.J.; Li, X.; Miller, M.B. The influence of dynamic chamber design and operating parameters on calculated surface-to-air mercury fluxes. Atmos. Environ. 2010, 44, 193–203. [Google Scholar] [CrossRef] [Scilit]
  28. Ye, Z.; Zhang, G.; Li, B.; Strøm, J.S.; Tong, G.; Dahl, P.J. Influence of airflow and liquid properties on the mass transfer coefficient of ammonia in aqueous solutions. Biosyst. Eng. 2008, 100, 422–434. [Google Scholar] [CrossRef] [Scilit]
  29. Pedersen, J.; Hafner, S.D.; Pacholski, A.; Karlsson, V.I.; Rong, L.; Labouriau, R.; Kamp, J.N. Evaluation of optimized flux chamber design for measurement of ammonia emission after field application of slurry with full-scale farm machinery. Atmos. Meas. Tech. 2024, 17, 4493–4505. [Google Scholar] [CrossRef] [Scilit]
  30. Dewes, T. Effect of pH, temperature, amount of litter and storage density on ammonia emissions from stable manure. J. Agric. Sci. 1996, 127, 501–509. [Google Scholar] [CrossRef] [Scilit]
  31. Onwosi, C.O.; Igbokwe, V.C.; Odimba, J.N.; Eke, I.E.; Nwankwoala, M.O.; Iroh, I.N.; Ezeogu, L.I. Composting technology in waste stabilization: On the methods, challenges and future prospects. J. Environ. Manag. 2017, 190, 140–157. [Google Scholar] [CrossRef] [Scilit] [PubMed]
  32. Parkinson, R.; Gibbs, P.; Burchett, S.; Misselbrook, T. Effect of turning regime and seasonal weather conditions on nitrogen and phosphorus losses during aerobic composting of cattle manure. Bioresour. Technol. 2004, 91, 171–178. [Google Scholar] [CrossRef] [Scilit]
  33. Bai, M.; Flesch, T.; Trouvé, R.; Coates, T.; Butterly, C.; Bhatta, B.; Hill, J.; Chen, D. Gas emissions during cattle manure composting and stockpiling. J. Environ. Qual. 2020, 49, 228–235. [Google Scholar] [CrossRef] [Scilit] [PubMed]
  34. Parker, D.B.; Casey, K.D.; Todd, R.W.; Waldrip, H.M.; Marek, G.M.; Auvermann, B.W.; Marek, T.H.; Webb, K.; Willis, W.M.; Pemberton, B.; et al. Improved chamber systems for rapid, real-time nitrous oxide emissions from manure and soil. Trans. ASABE 2017, 60, 1235–1258. [Google Scholar] [CrossRef] [Scilit]
  35. Cattaneo, M.; Tayà, C.; Burgos, L.; Morey, L.; Noguerol, J.; Provolo, G.; Cerrillo, M.; Bonmatí, A. Assessing ammonia and greenhouse gas emissions from livestock manure storage: Comparison of measurements with dynamic and static chambers. Sustainability 2023, 15, 15987. [Google Scholar] [CrossRef] [Scilit]
  36. Acevedo, R.R.; Li, H.; Xin, H.; Roberts, S.A. Evaluation of a flux chamber for assessing gaseous emissions and treatment effects of poultry manure. In Proceedings of the Annual International Meeting of the American Society of Agricultural and Biological Engineers (ASABE), Reno, NV, USA, 21–24 June 2009; p. 1. [Google Scholar]
  37. Vac, S.C.; Popiţa, G.E.; Frunzeti, N.; Popovici, A. Evaluation of greenhouse gas emission from animal manure using the closed chamber method for gas fluxes. Not. Bot. Horti Agrobot. Cluj-Napoca 2013, 41, 576–581. [Google Scholar] [CrossRef] [Scilit]
  38. Cohen, J. A power primer. In Methodological Issues and Strategies in Clinical Research, 4th ed.; Kazdin, A.E., Ed.; American Psychological Association: Worcester, MA, USA, 2016; pp. 279–284. [Google Scholar] [CrossRef] [Scilit]
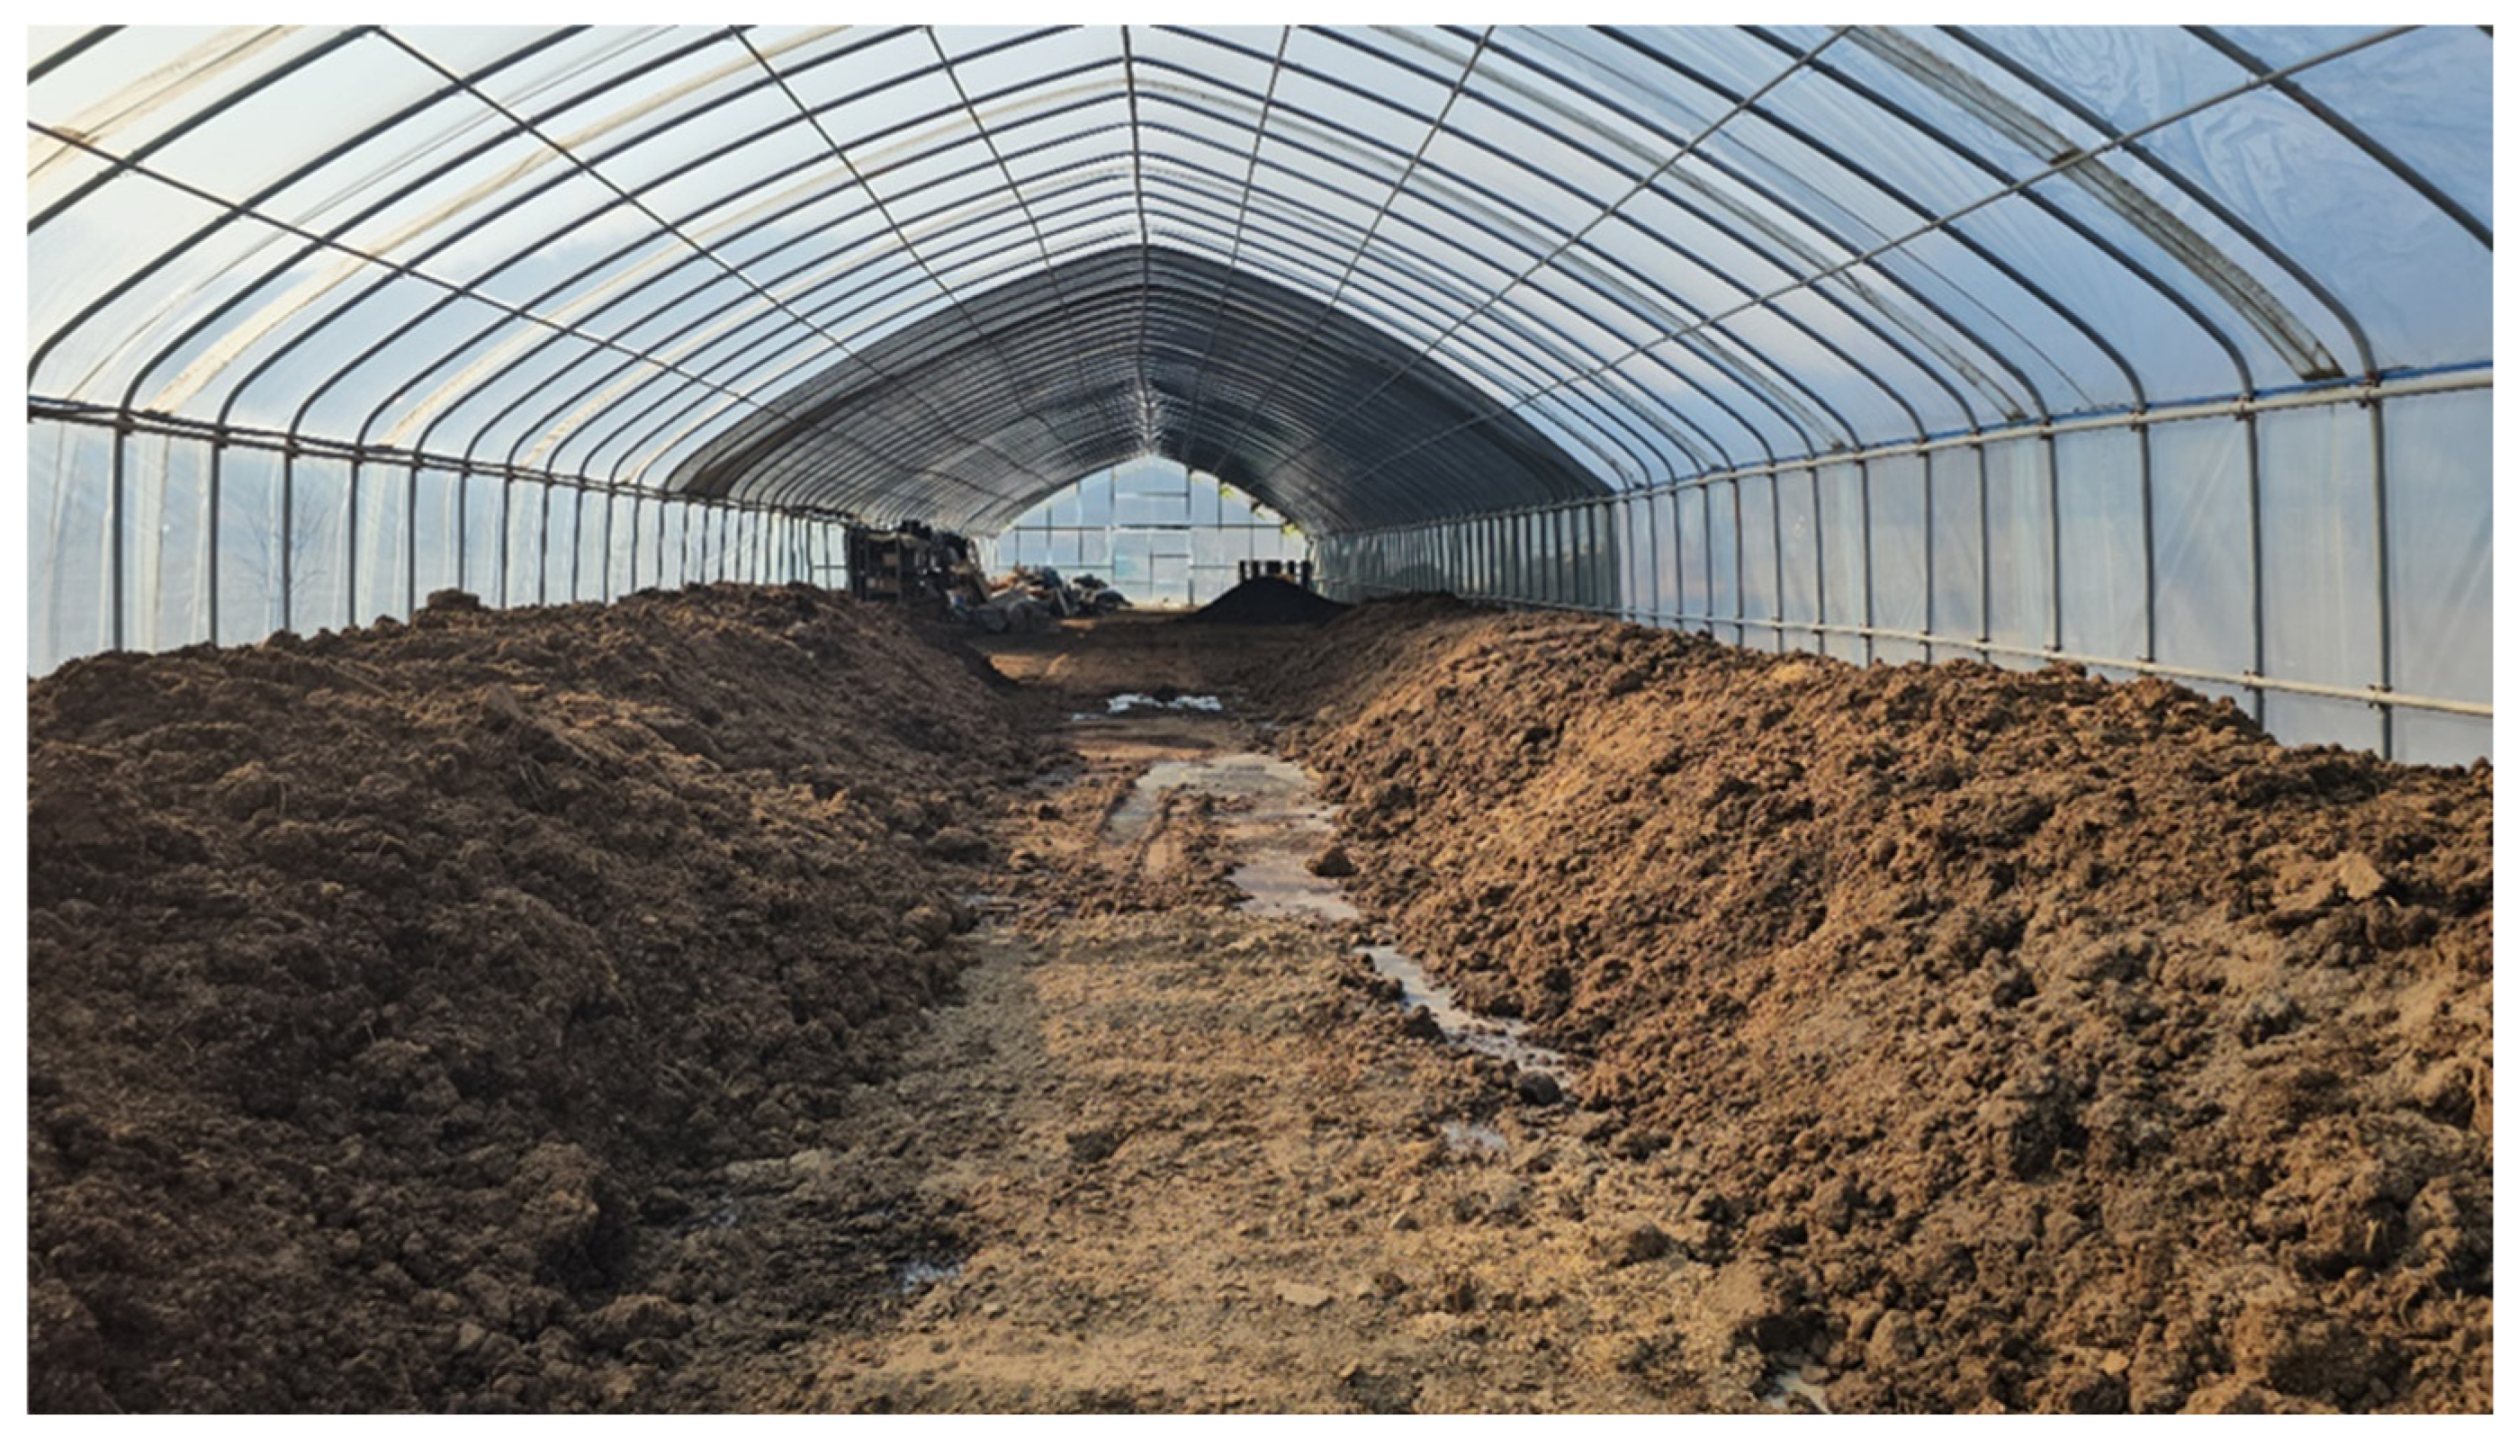
Figure 1. Picture of the composting shed. The composting shed was converted as a flux chamber for this study.
Atmosphere 17 00268 g001
Figure 2. Floor plan of flux chamber. Two fans were installed at a height of 2 m above the ground at both the inlet and outlet. Sensors sequentially measured a total of five points, including each fan location and the ambient air for calibration. Manure was piled on one side of the chamber for composting. The large arrow above and the small three arrows below the manure indicate the flow of air.
Atmosphere 17 00268 g002
Figure 3. Temporal variations in emission factors during summer season. The dashed lines indicate the time when turning occurred.
Atmosphere 17 00268 g003
Figure 4. Temporal variations in emission factors during autumn season. The dashed lines indicate the time when turning occurred.
Atmosphere 17 00268 g004
Figure 5. Temporal variations in emission factors during winter season. The dashed lines indicate the time when turning occurred.
Atmosphere 17 00268 g005
Figure 6. Hourly fluctuation in emission factors throughout the day.
Atmosphere 17 00268 g006
Table 1. Moisture percentage, total Kjeldahl nitrogen (TKN), volatile solids (VS), C/N ratio and pH of manure. ‘Start’ and ‘End’ represent the analytical values at the initial and the final of the composting process.
FactorSeasonStartEnd
Moisture 1Summer61.242.0
Autumn58.745.9
Winter67.542.9
TKN 2Summer8526.94234.8
Autumn10,487.16252.2
Winter9853.04417.2
VS 2Summer291,640.7144,637.6
Autumn296,516.9141,855.3
Winter287,924.3132,475.2
C/N ratioSummer23.619.8
Autumn23.119.4
Winter26.817.2
pHSummer8.618.54
Autumn8.748.06
Winter8.468.55
1 Unit: %. 2 Unit: mg L−1.
Table 2. Arithmetic mean and standard deviation (SD) by season.
SeasonMean 1SD 1
Summer61.763358.6701
Autumn38.851244.6897
Winter8.318911.4605
1 Unit: μg s−1 t−1.
Table 3. Homogeneous subsets of hourly ammonia emission factors based on Kruskal–Wallis test and Dunn’s test post hoc analysis for integrated and seasonal data.
TimeSummerAutumnWinter
00–02 h63.65 ± 51.90 1 (ab 2)39.09 ± 45.31 (ab)6.20 ± 10.39 (f)
03–05 h50.73 ± 45.27 (bc)36.63 ± 44.03 (b)8.62 ± 11.08 (e)
06–08 h64.49 ± 57.43 (ab)47.56 ± 45.13 (a)9.15 ± 11.12 (c)
09–11 h53.24 ± 46.55 (abc)42.28 ± 45.54 (ab)8.79 ± 11.96 (d)
12–14 h64.98 ± 49.58 (a)36.48 ± 44.09 (b)9.99 ± 12.55 (a)
15–17 h71.25 ± 68.12 (a)33.09 ± 40.17 (b)9.26 ± 12.11 (bc)
18–20 h45.77 ± 46.24 (c)33.93 ± 44.21 (b)9.55 ± 11.91 (b)
21–23 h88.57 ± 101.48 (a)47.02 ± 48.37 (ab)5.78 ± 9.43 (g)
1 Unit: μg s−1 t−1. 2 Subsets indicated by letters a–g are categorized separately for the integrated dataset and each individual season.
Disclaimer/Publisher’s Note: The statements, opinions and data contained in all publications are solely those of the individual author(s) and contributor(s) and not of MDPI and/or the editor(s). MDPI and/or the editor(s) disclaim responsibility for any injury to people or property resulting from any ideas, methods, instructions or products referred to in the content.