Article

Application of Solar HVAC System in Residential Buildings for Winter Conditions in Mediterranean Climate


by
Eusébio Conceição
1,2,*,
João Gomes
3,
Margarida Conceição
4,
Maria Inês Conceição
4,
Maria Manuela Lúcio
1 and
Hazim Awbi
5
1
Faculdade de Ciências e Tecnologia, Universidade do Algarve, Campus de Gambelas, 8005-139 Faro, Portugal
2
ADAI, Departamento de Engenharia Mecânica, Rua Luís Reis Santos, Pólo II, 3030-788 Coimbra, Portugal
3
ISE, Universidade do Algarve, Campus da Penha, 8005-139 Faro, Portugal
4
Instituto Superior Técnico, Universidade de Lisboa, 1049-001 Lisboa, Portugal
5
School of Built Environment, University of Reading, Reading RG6 6AW, UK
*
Author to whom correspondence should be addressed.
Atmosphere 2026, 17(2), 211; https://doi.org/10.3390/atmos17020211
Submission received: 20 December 2025 / Revised: 12 February 2026 / Accepted: 13 February 2026 / Published: 17 February 2026
(This article belongs to the Special Issue Modelling of Indoor Air Quality and Thermal Comfort)

Abstract

The design of thermal strategies applied in buildings based on the use of renewable energies can play an important role in the development of a built environment that is better adapted to the climate. This paper is focused on the application of a renewable solar energy system coupled with a Heating, Ventilation and Air-Conditioned (HVAC) system to promote occupants’ thermal comfort (TC) and indoor air quality (IAQ) in buildings during heating season. In the building thermal design, a building thermal dynamic model is used to calculate the temperatures of the opaque and transparent building surfaces, the temperature of the water supply ducts, the TC level and the IAQ level, among other variables. The TC conditions of the occupants were evaluated using the Predicted Mean Vote index, commonly used in the literature in similar studies. IAQ was assessed by the usual carbon dioxide concentration in environments where most of the pollution is of human origin. The numerical study was carried out in a virtual residential building consisting of two floors and seven compartments. The building is occupied at night and at midday. Two cases were studied, considering, respectively, the non-use and use of the solar HVAC system. The solar HVAC system consists of solar water collectors, installed above the roof area, and thermo-convector heat exchangers, installed inside each occupied space. The results show that the application of this solar HVAC system in a Mediterranean-type climate is able to guarantee, during occupancy, acceptable TC levels in three compartments and near acceptable TC levels in one compartment. Regarding IAQ, acceptable level can be achieved throughout the day.

1. Introduction

An important part of the EU 2030 and 2050 energy consumption reduction goals is focused on the building sector, given that it accounts for about 40% of total European energy use [1,2]. However, thermal comfort and indoor air quality (IAQ) are also two relevant challenges for this sector, because they are essential requirements for an adequate built environment [3]. Ventilation systems have a huge importance when the aim is to reduce the level of pollutant particles and regulating the hygrothermal conditions of the air, but they also produce an air movement that impacts on the human perception of thermal comfort [4]. In addition, these systems have a great impact on the energy consumption of the buildings [5], especially in this post-COVID-19 pandemic time, when it has become necessary to increase the supply of outside air in order to make the dispersion and removal of pollutants in indoor air more effective [6].
There are many ways of distributing the air into a room [7]. According to Awbi [8], the two most frequent systems are mixed ventilation (MV) and displacement ventilation (DV). On one hand, MV systems have a simple design and are usually supply air at ceiling level. They have a lower performance for improving IAQ and require high ventilation rates that imply poorer energy efficiency [9]. On the other hand, DV systems distribute air at floor level, generating a considerable vertical temperature gradient. Although they have higher performance for IAQ provision at lower ventilation rate and air velocity, and therefore lower energy consumption, they are only effective for cooling needs and sometimes cause draft risk at ankle level [10,11]. Therefore, research into new ventilation systems that can simultaneously provide a livable built environment with low energy consumption is justified.
In order to significantly reduce the environmental impact and energy consumption of a building, the implementation of passive strategies for reducing energy demand is essential [12]. But, generally, the use of passive measures is not enough for avoiding the energy demands of the buildings, so it is necessary to use solutions that simultaneously involve active and passive energy technologies [13]. For example, combining an adequate ventilation system with a renewable thermal energy production can be one solution [14,15]. The use of sustainable energy solutions, such as solar renewable and passive energy technologies, has become promising [16]. Over the last years, the scientific interest in solar air-conditioning technologies has grown considerably [17,18,19,20,21].
Nowadays the solar air-conditioning technologies comprehend different systems that can be divided into two groups: ones powered by electricity (photovoltaic modules) or by thermal energy (solar collectors). Bataineh and Taamneh [22] carried out a critical review in which they found that thermal systems are able to convert much more solar radiation than photovoltaic systems into thermal energy. In addition, thermal systems are not affected by energy self-supply regulations.
Within the group of thermal energy and focusing on solar heating, systems have two main components: solar collector (outdoor heat exchanger) and thermal convector (indoor heat exchanger). There are different types of solar collectors, but the most commonly used in solar heating systems are flat plate and evacuated tube collectors [23]. Shukla et al. [24] provided a recent review of solar collector developments applied to solar heating systems. It should also be underlined that Jaisankar et al. [25] carried out a review which affirmed that the solar thermal conversion efficiency of solar water heating systems is 53% higher than solar electrical direct conversion systems.
There are several published researches assessing the performance of different solar-assisted heat pumps (SAHPs) for heating systems as it is considered a key technology for achieving the decarbonization of building stock [26]. Buker and Riffat [27], after reviewing a variety of system configurations of SAHPs for low-temperature water heating applications, concluded that an optimum configuration cannot be established because their performance depends on the building area, thermal demand and climatic conditions.
Recent studies show that technological solutions involving the use of solar water collectors to heat indoor air have been applied with positive results in energy efficiency gains and improved thermal performance [28,29,30,31]. Nevertheless, to the knowledge of the authors, there is a lack of studies analyzing the combined performance of solar Heating, Ventilation and Air-Conditioned (HVAC) systems and innovative ventilation systems. It is worth highlighting the work carried out by Fong et al. [32], which estimates annual savings in primary energy consumption above 50% when combining stratum ventilation and solar air-conditioning systems in buildings located in a subtropical climate, instead of the conventional mixing ventilation and conventional air-conditioning systems.
In warm climates, like the one in southern Europe, solar radiation will increase every year, given global warming impact. Thus, taking advantage of the huge quantity of solar radiation available in these climates should be mandatory in order to be able to reduce the greenhouse gas emissions that are provoking climate change [33,34]. As stated by Castillo-González [34], solar HVAC systems applied in buildings can contribute to a significant decrease in energy consumption and CO2 emissions. But there is still a big need for making progress in solar HVAC technology to improve their performance and reduce the economical investment [34,35]. Over the last few years, research in this area has focused primarily on solar HVAC systems used for cooling the interior spaces of buildings [36,37]. Lately, solar HVAC systems for heating are being developed, mainly based on Phase Change Material [38]. Therefore, the development of new solar HVAC systems for heating interior spaces that can be controllable in order to make them more efficient and independent of fossil fuel energy sources is crucial.
The main purpose of this research is to evaluate the performance of a new HVAC system powered by solar thermal energy in order to achieve acceptable thermal comfort and IAQ conditions in a virtual house located in southern Europe. The solar HVAC system developed in this work consists of solar water collectors installed on the building’s roof and water–air thermo-convectors installed inside the building’s compartments. For this purpose, numerical simulations of the building thermal response to the use of this combined solar HVAC system have been developed for winter conditions. The results will be discussed considering controlled use of this solar HVAC system during the day and will be compared with cases that do not use this system.

2. Concepts

When assessing HVAC systems, standards like in ASHRAE Standard 55 [39] and ISO 7730 [40] are the thermal comfort regulations most used by the scientific community, usually evaluating the thermal comfort on the basis of the Predicted Mean Vote (PMV) and the Predicted Percentage Dissatisfied (PPD) indices [41]. Fanger [41] determined these indices using the following variables:
  • Indoor environmental: air temperature (ta), relative air humidity (RH), mean radiant temperature (tr) and relative air velocity (va);
  • Personal: metabolic rate and clothing insulation.
These indices are commonly used in research studies on thermal comfort [42,43,44,45]. The PMV model has accuracy issues, primarily because its assumptions about steady-state, homogeneous environments struggle with real buildings, simplifying complex human responses and building dynamics, not fully accounting for adaptation, leading to discrepancies with actual human comfort votes. It has limitations, especially with solar radiation and underestimation in natural ventilated spaces, and inaccuracies arising from measurement errors in inputs like air velocity, mean radiant temperature, metabolic rate and clothing insulation, due to poor experimental practices, leading to poor agreement with actual human thermal sensation [46,47,48,49]. As pointed out by Alfano et al. [50], one issue is the sensitivity of PMV to the measurements of the variables involved, which can lead to significant variations in the PMV value obtained. Another important aspect cited by the authors is the software used in the PMV calculation [50]. That is, unreliable PMV assessments may eventually be due to software that poorly implements the standards guidelines. Furthermore, the authors believe that the program proposed by ISO 7730 requires additional information that may not be properly identified [50].
The way to calculate the PMV and PPD indices can be found in ISO 7730 [40]. Indoor thermal environments are classified by ISO 7730 [40] according to three categories: A, for PMV values between −0.2 and +0.2; B, for PMV values between −0.5 and +0.5; and C, for PMV values between −0.7 and +0.7.
The assessment of the IAQ is at the same level of importance as comfort for the evaluation of a ventilation system and it is commonly studied through the carbon dioxide (CO2) concentration level in indoor environments where the main source of pollution comes from human breathing [51,52,53]. This concentration level depends on the volume of the compartment, the number of occupants in that compartment, as well as the air change rate used. The ASHRAE Standard 62.1 [54] limits the CO2 level up to 700 ppm above outdoor air level in order to be considered an acceptable IAQ level (actually, around 1100 ppm). In line with the European standards, ISO 17772 [55,56] and EN 16798 [57,58], IAQ is considered acceptable by the Portuguese standard on ventilation requirements and indoor air quality, Portaria nº 353-A/2013 [59], when CO2 concentration is below 1250 ppm. Note that, according to EN 16798-1, ventilation requirements are intrinsically linked to the Indoor Environmental Quality category selected for diluting emissions (bioeffluents) from occupants. This standard provides for four categories, where Category I represents the highest level of expectation and Category IV represents the lowest level of expectation [60]. These standards impose air change rates depending on the type of contaminant, the type of building, the activity carried out and the number of occupants in each compartment [54,55,56,57,58,59].

3. Numerical Models

In the present work a Computer-Aided Design (CAD) software and a building thermal dynamic (BTD) numerical model were applied.

3.1. CAD Software

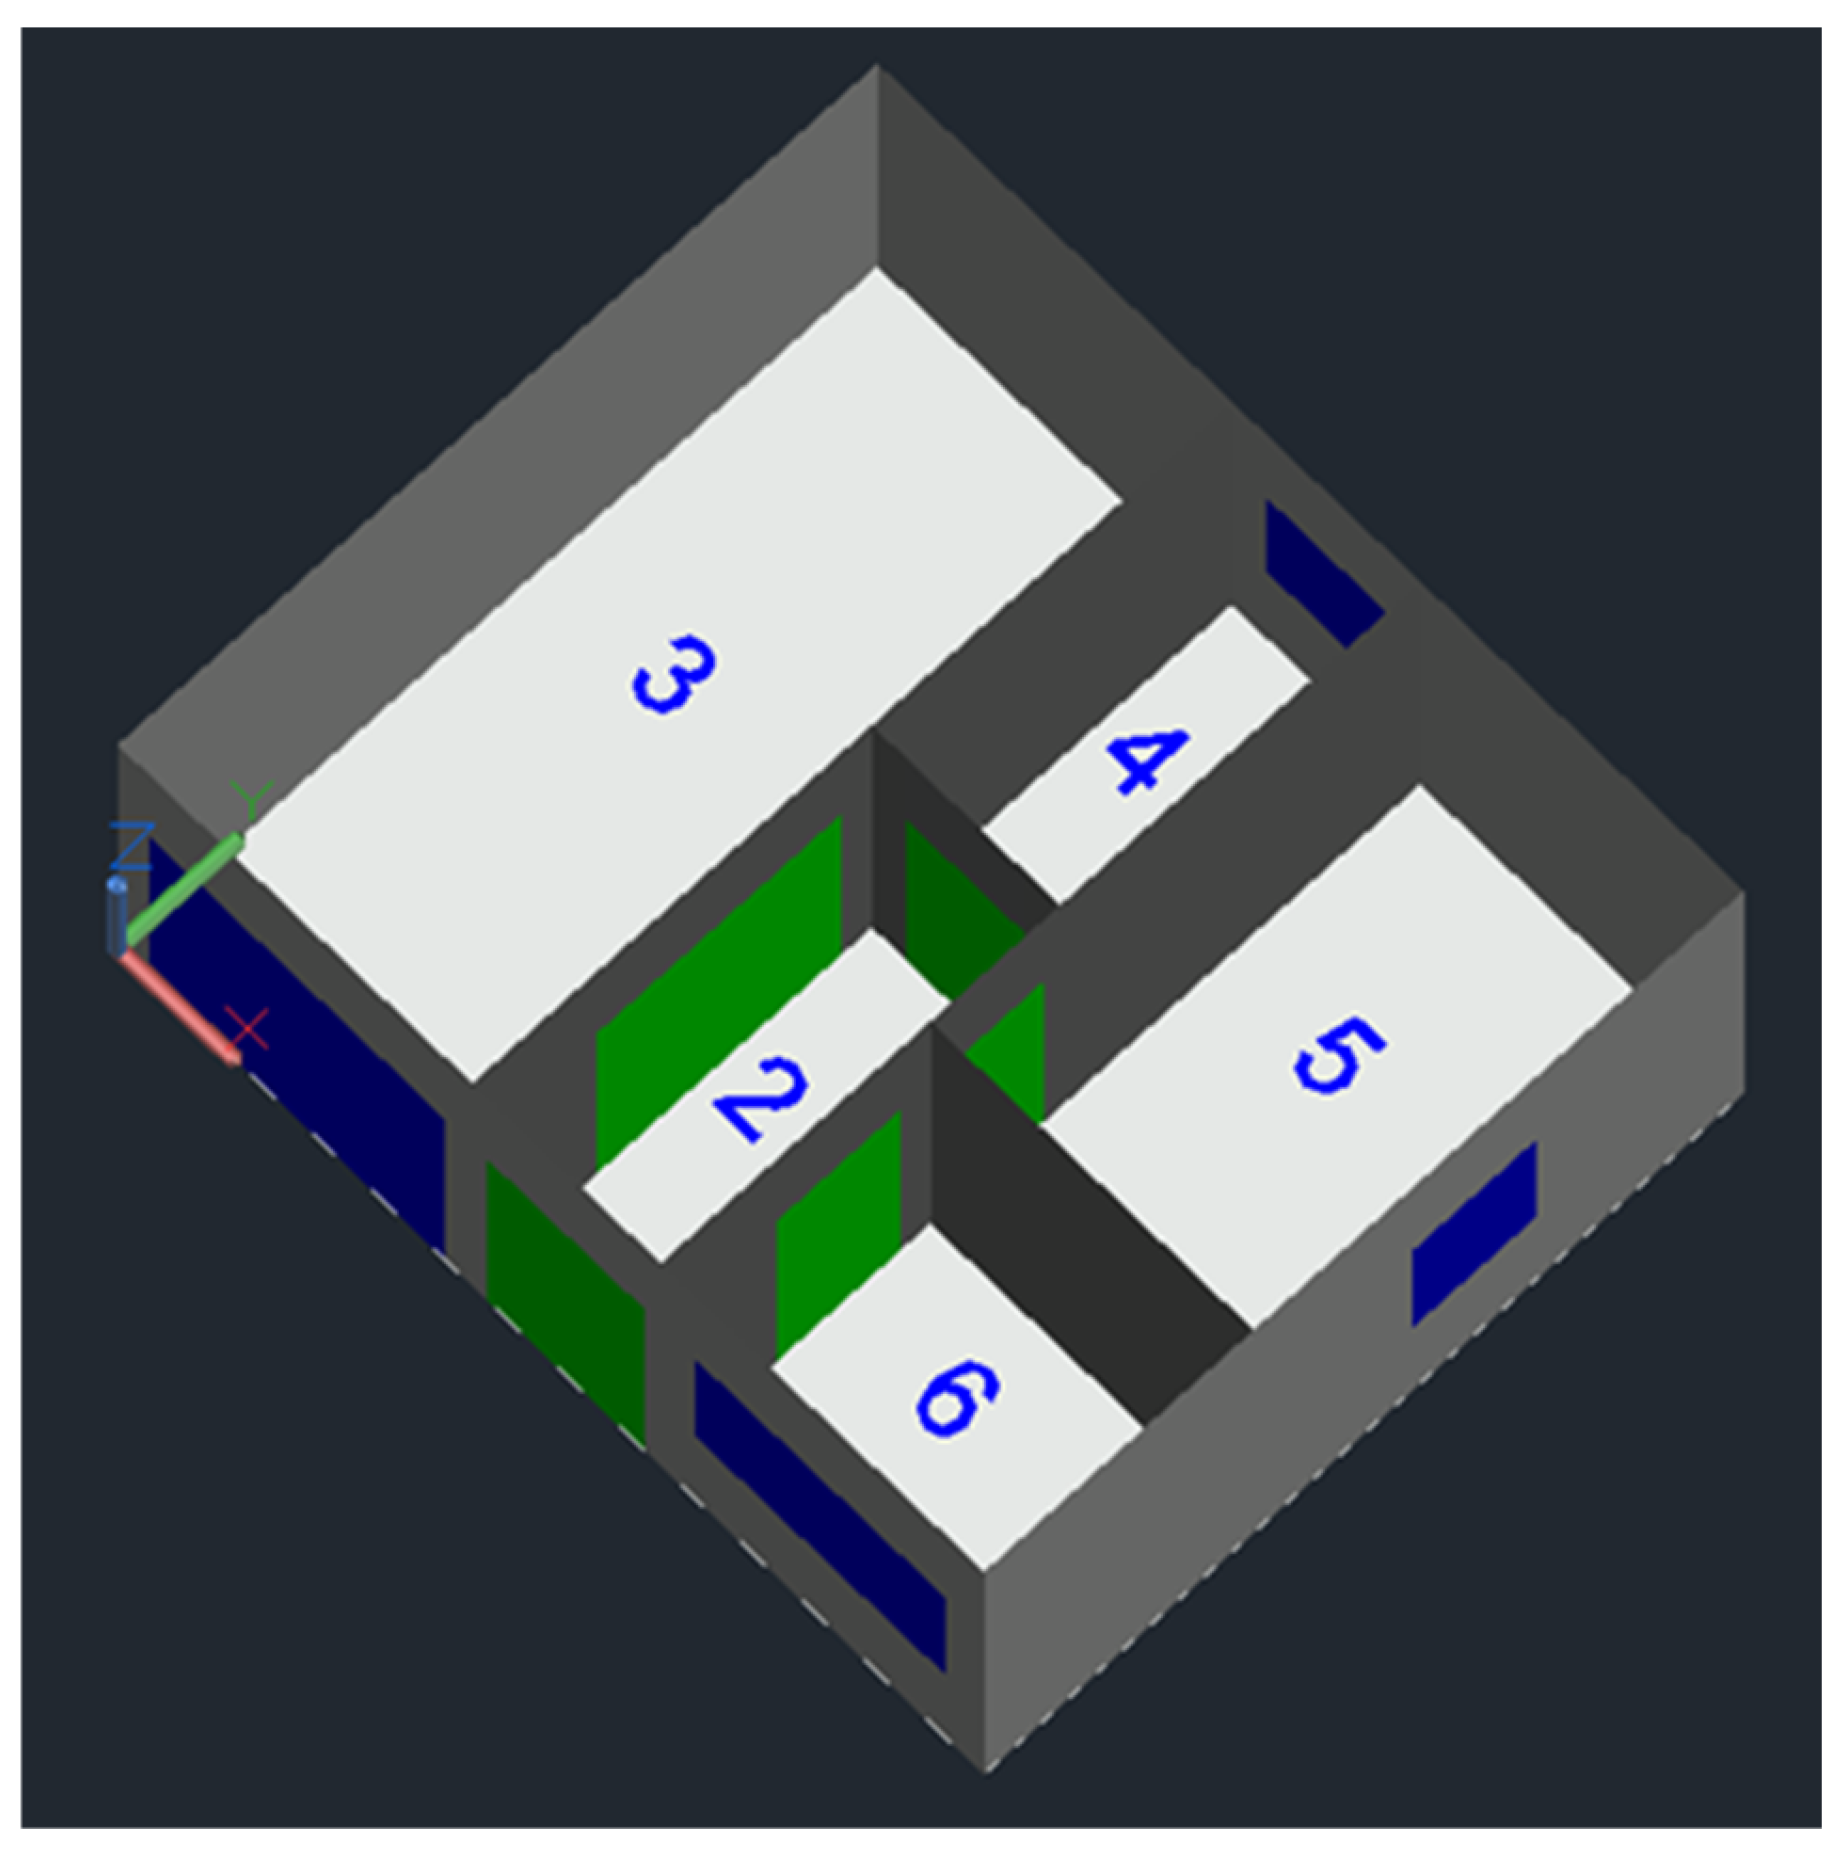
CAD software was used to develop the design of the residential building (Figure 1) used in this study as well as the solar HVAC system implemented in it. The building consists of two floors (ground floor and attic) and seven compartments. Five compartments are located on the ground floor and two compartments are located in the attic. The main façade of the building faces south.
The external space is designated the number 1, the internal spaces of the building located on the ground floor, usually occupied, are designated the numbers 2 to 6 (Figure 2) and the internal spaces of the building located in the attic, without occupation, are designated by the numbers 7 and 8. Below is a brief description of spaces 1 to 6:
  • Space 1—External environment: The variables air temperature, air relative humidity, wind speed and direction obtained for this space are used as input data in the Building Dynamic Response numerical model;
  • Space 2—Building entrance hall; it has a glazed entrance door facing south;
  • Space 3—Living room; it has a large window facing south;
  • Space 4—Kitchen; it has a small window facing north;
  • Space 5—Bedroom; it has a window facing east;
  • Space 6—Bathroom; it has a window facing south.

3.2. Building Thermal Dynamic Numerical Model

The BTD numerical model used is described and validated with transient mode in Conceição and Lúcio [61,62] and in steady-state mode in Conceição and Lúcio [63]. In transient mode, the average difference between numerical and experimental indoor air temperature is approximately 2 °C for winter conditions and is around 1 °C for summer conditions. In steady-state mode, a mean accuracy of 0.987 was obtained, based on the measured and calculated values for the surrounding (walls, ceiling and floor) test chamber temperatures.
The BTD numerical model has been applied and developed over the last few years covering different types of works [64,65,66]. This numerical model evaluates several temperatures (interior air spaces, opaque main bodies, transparent bodies, interior bodies, ducts and water vapor), using the energy balance integral equation, and the mass of water vapor and contaminants (e.g., CO2 concentration) inside the spaces, as well as the mass of water in the opaque and transparent surfaces and inside the ducts, using the mass balance integral equation. The building’s main bodies (doors, ceiling, ground, walls, etc.) and the ducts are divided into several layers. This type of numerical model is an important tool in the development of energy-efficient building designs that incorporate renewable energies and promote occupant thermal comfort and IAQ in increasingly adverse climatic environments [67,68,69].
The BTD numerical model also calculates the energy consumption and photovoltaic energy production, allows evaluating the thermal comfort level of occupants (for example, through the PMV index) and the IAQ level (for example, through CO2 concentration), among other calculation parameters.
The BTD numerical model is divided into three blocks: input; resolution; and output.
The BTD input data are as follows:
  • Building geometry: This geometry is developed numerically through geometric equations or CAD software. In this study, CAD software is used (see Section 3.1). This data is used in the evaluation of the energy and mass balance integral equations;
  • Materials that make up the building: Introduction of all layers of materials in the building and ducts and their respective characteristics; namely, thickness, thermal conductivity, specific mass and specific heat;
  • Environmental external conditions: Air temperature, air relative humidity, wind velocity, wind direction, and CO2 concentration;
  • Geographic conditions: Building location (latitude) and height above sea level;
  • Space occupancy cycle: Number of people and their respective time distribution throughout the day in the building’s spaces;
  • Ventilation typologies: Characterization of the distribution of air flows, throughout the day, between the different spaces and between the spaces and the external environment so that it is possible to assess the mass exchange between spaces and between the spaces and the external environment;
  • Other data input.
The resolution of the numerical model which is performed in transient conditions, is obtained through the Runge–Kutta–Felberg method with error control. This resolution method allows the calculation, over time, of the temperature and mass concentration in the various elements of the building as well as in the interior spaces of the building, using a system of mass and energy balance integral equations [65].
The output data of the numerical model are as follows:
  • Heat transfer coefficients by natural, forced or mixed convection;
  • Mass transfer coefficients by diffusion;
  • Solar radiation on external and internal surfaces. When calculating solar radiation, existing shading devices are taken into account;
  • Incident solar radiation, absorbed solar radiation by transparent bodies (glasses) and opaque bodies, and the transmitted solar radiation through the transparent (glasses) bodies. The phenomenon of radiation considers the presence of all shading devices;
  • Heat exchange by radiation, in each space. In this calculation, the radiosity equations and mean radiant temperature concepts are used;
  • Mass adsorption and desorption;
  • Temperatures in the following opaque bodies: doors, walls, floor and ceiling;
  • Temperatures in the glazed bodies;
  • Temperatures in the body of each duct section;
  • Temperature of the water inside the ducts;
  • Temperatures of the seats, desks and other interior bodies;
  • Internal air temperature of the building’s spaces;
  • Mass concentration of the water vapor inside the building’s indoor spaces;
  • Mass concentration of contaminants (e.g., CO2) inside the building’s indoor spaces;
  • Thermal comfort assessed by PMV and PPD indexes. These indexes depend on the internal environmental variables (ta, va, tr and RH), clothing insulation level and metabolic level [40,41];
  • IAQ assessed by CO2 concentration released in the respiration process. When calculating this value, the air exchange rate, the number of occupants in the space and the volume of the compartment are taken into account.

4. Methodology

The numerical methodology developed for this work is described in detail in the following subsections.

4.1. Case Study

In this numerical study, the residential building (Figure 1) used consists of two floors, with five compartments (numbered according to Figure 2) on the ground floor and two compartments in the attic. The building’s dimensions are as follows: 7 m wide, 6 m deep and a ground floor ceiling height of 3 m. Compartment 2 has an area of 4.7 m2, compartment 3 has an area of 17 m2, compartment 4 has an area of 4.3 m2, compartment 5 has an area of 10 m2 and compartment 6 has an area of 5.5 m2. The compartments on the ground floor will be occupied hourly, while the compartments in the attic are unoccupied. With the aim of improving the thermal comfort conditions of the occupants, a solar HVAC system will be used to heat the air inside the spaces.
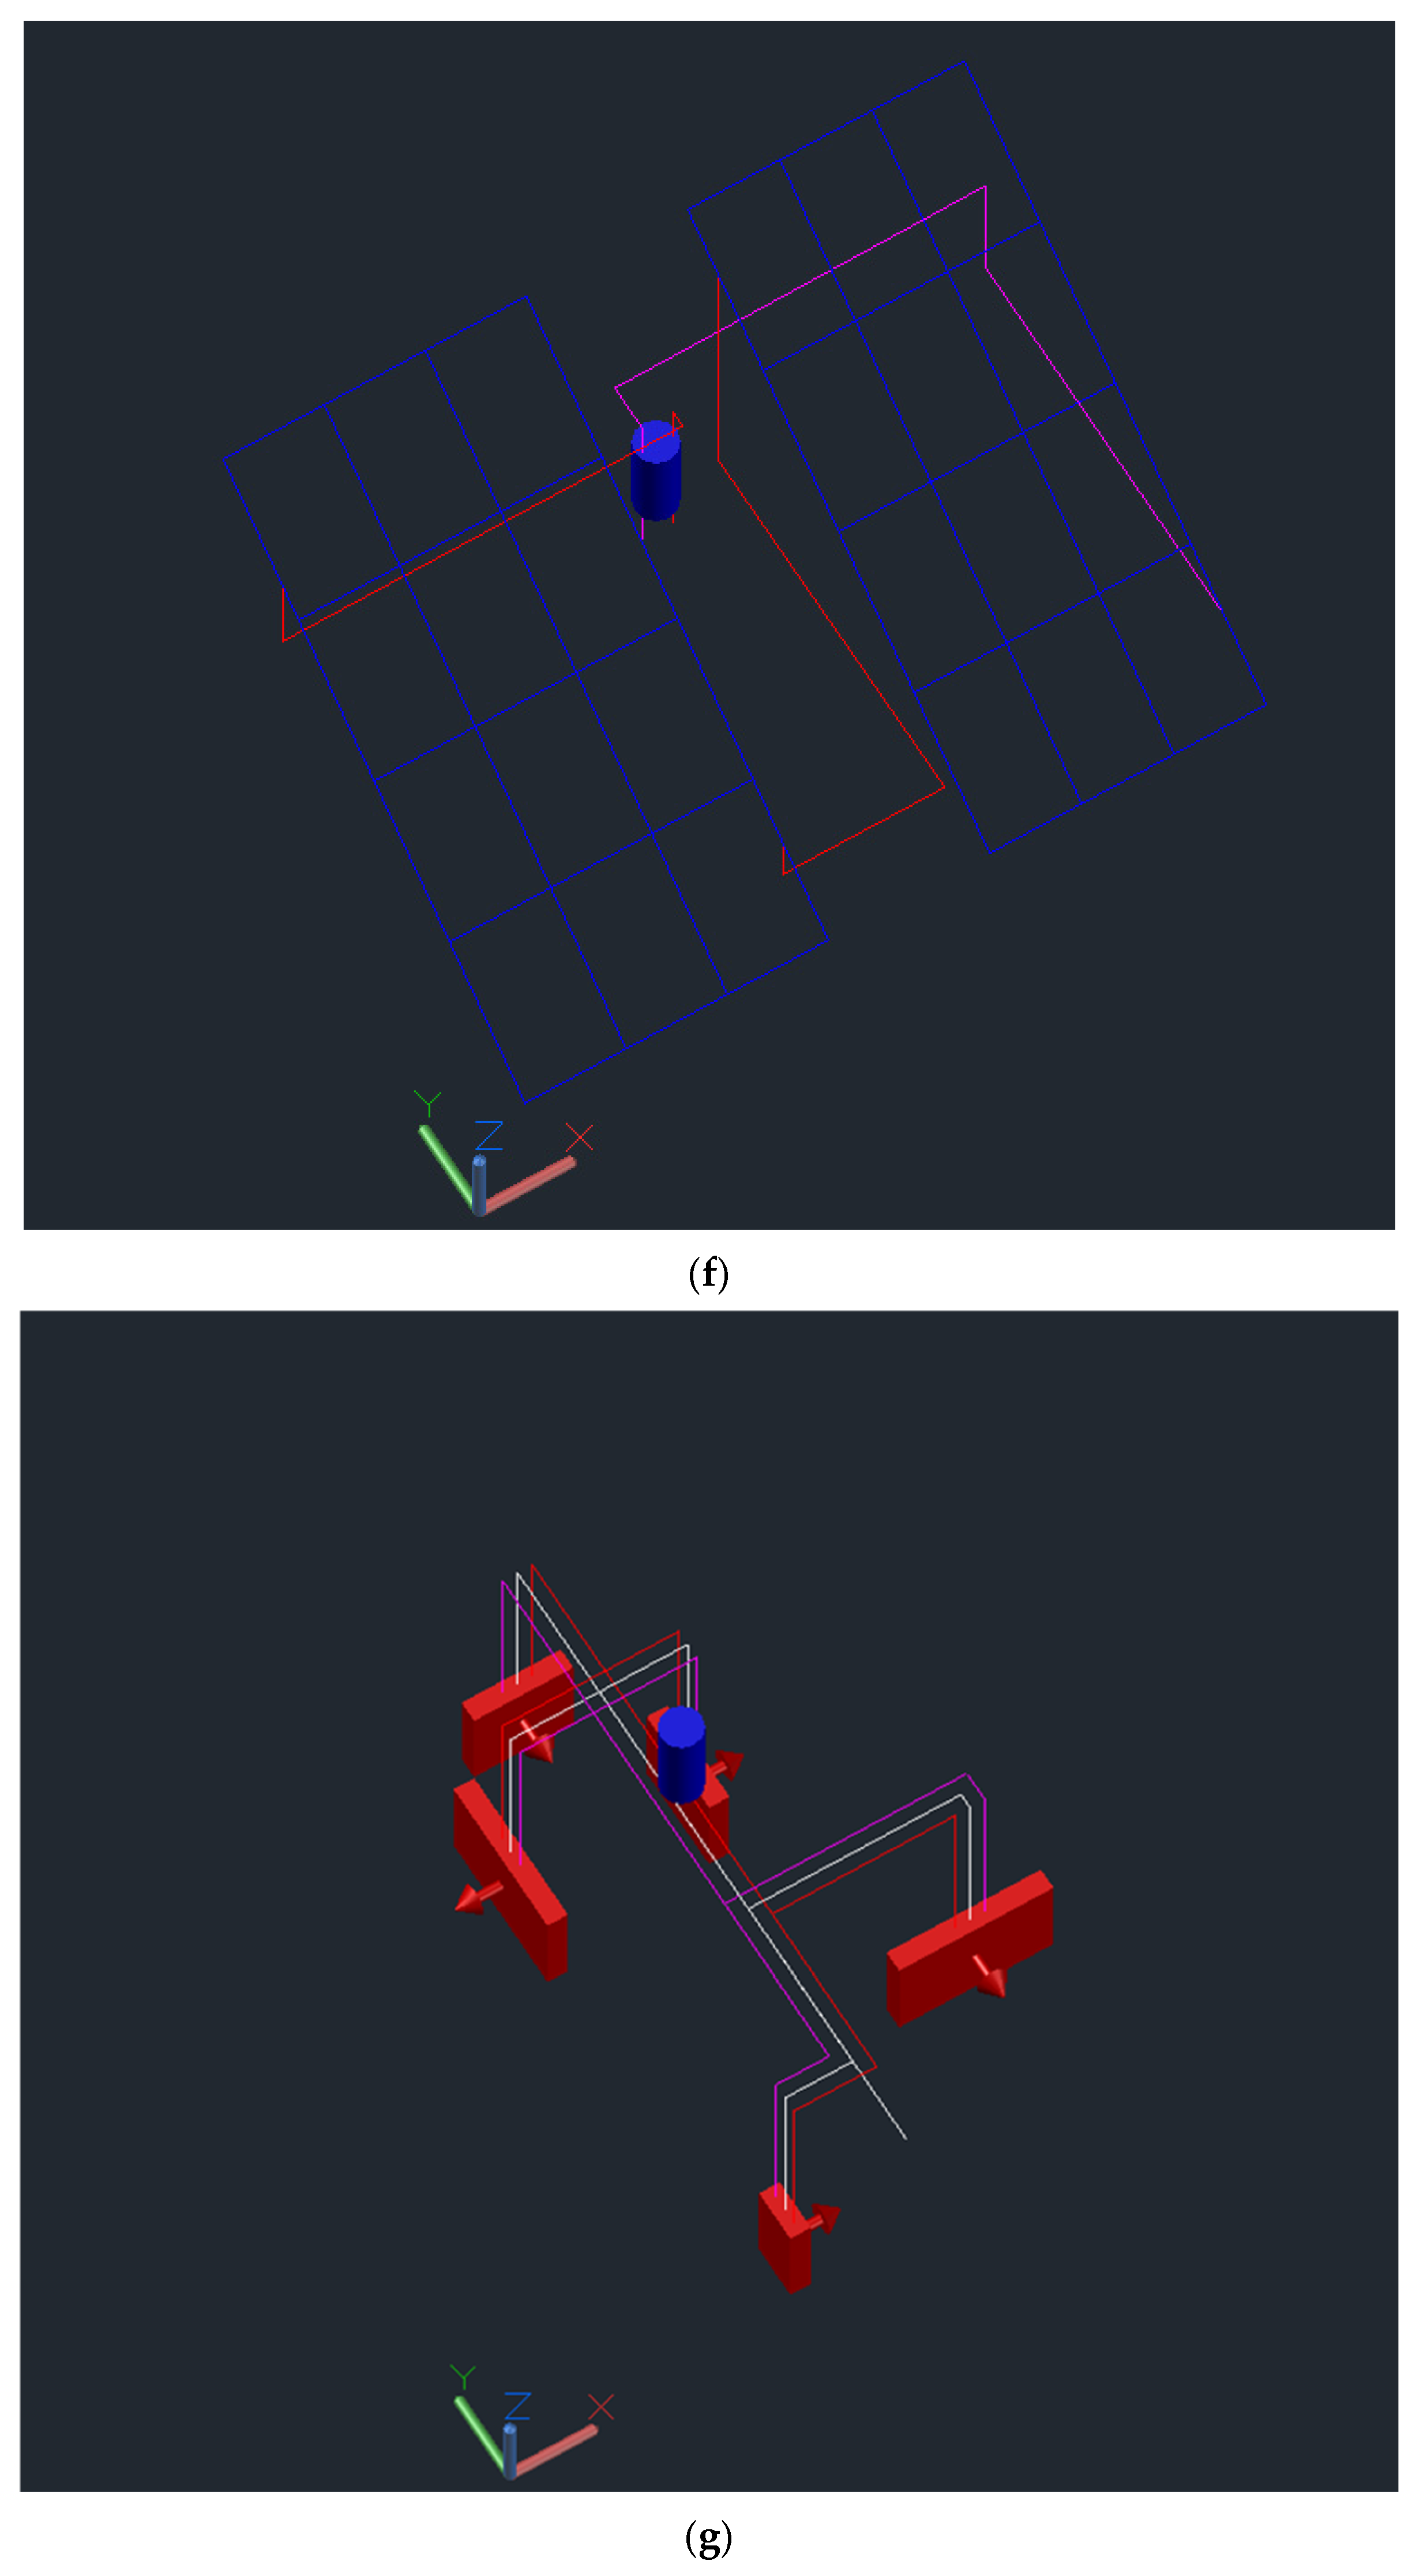
The solar HVAC system (Figure 3) is based on:
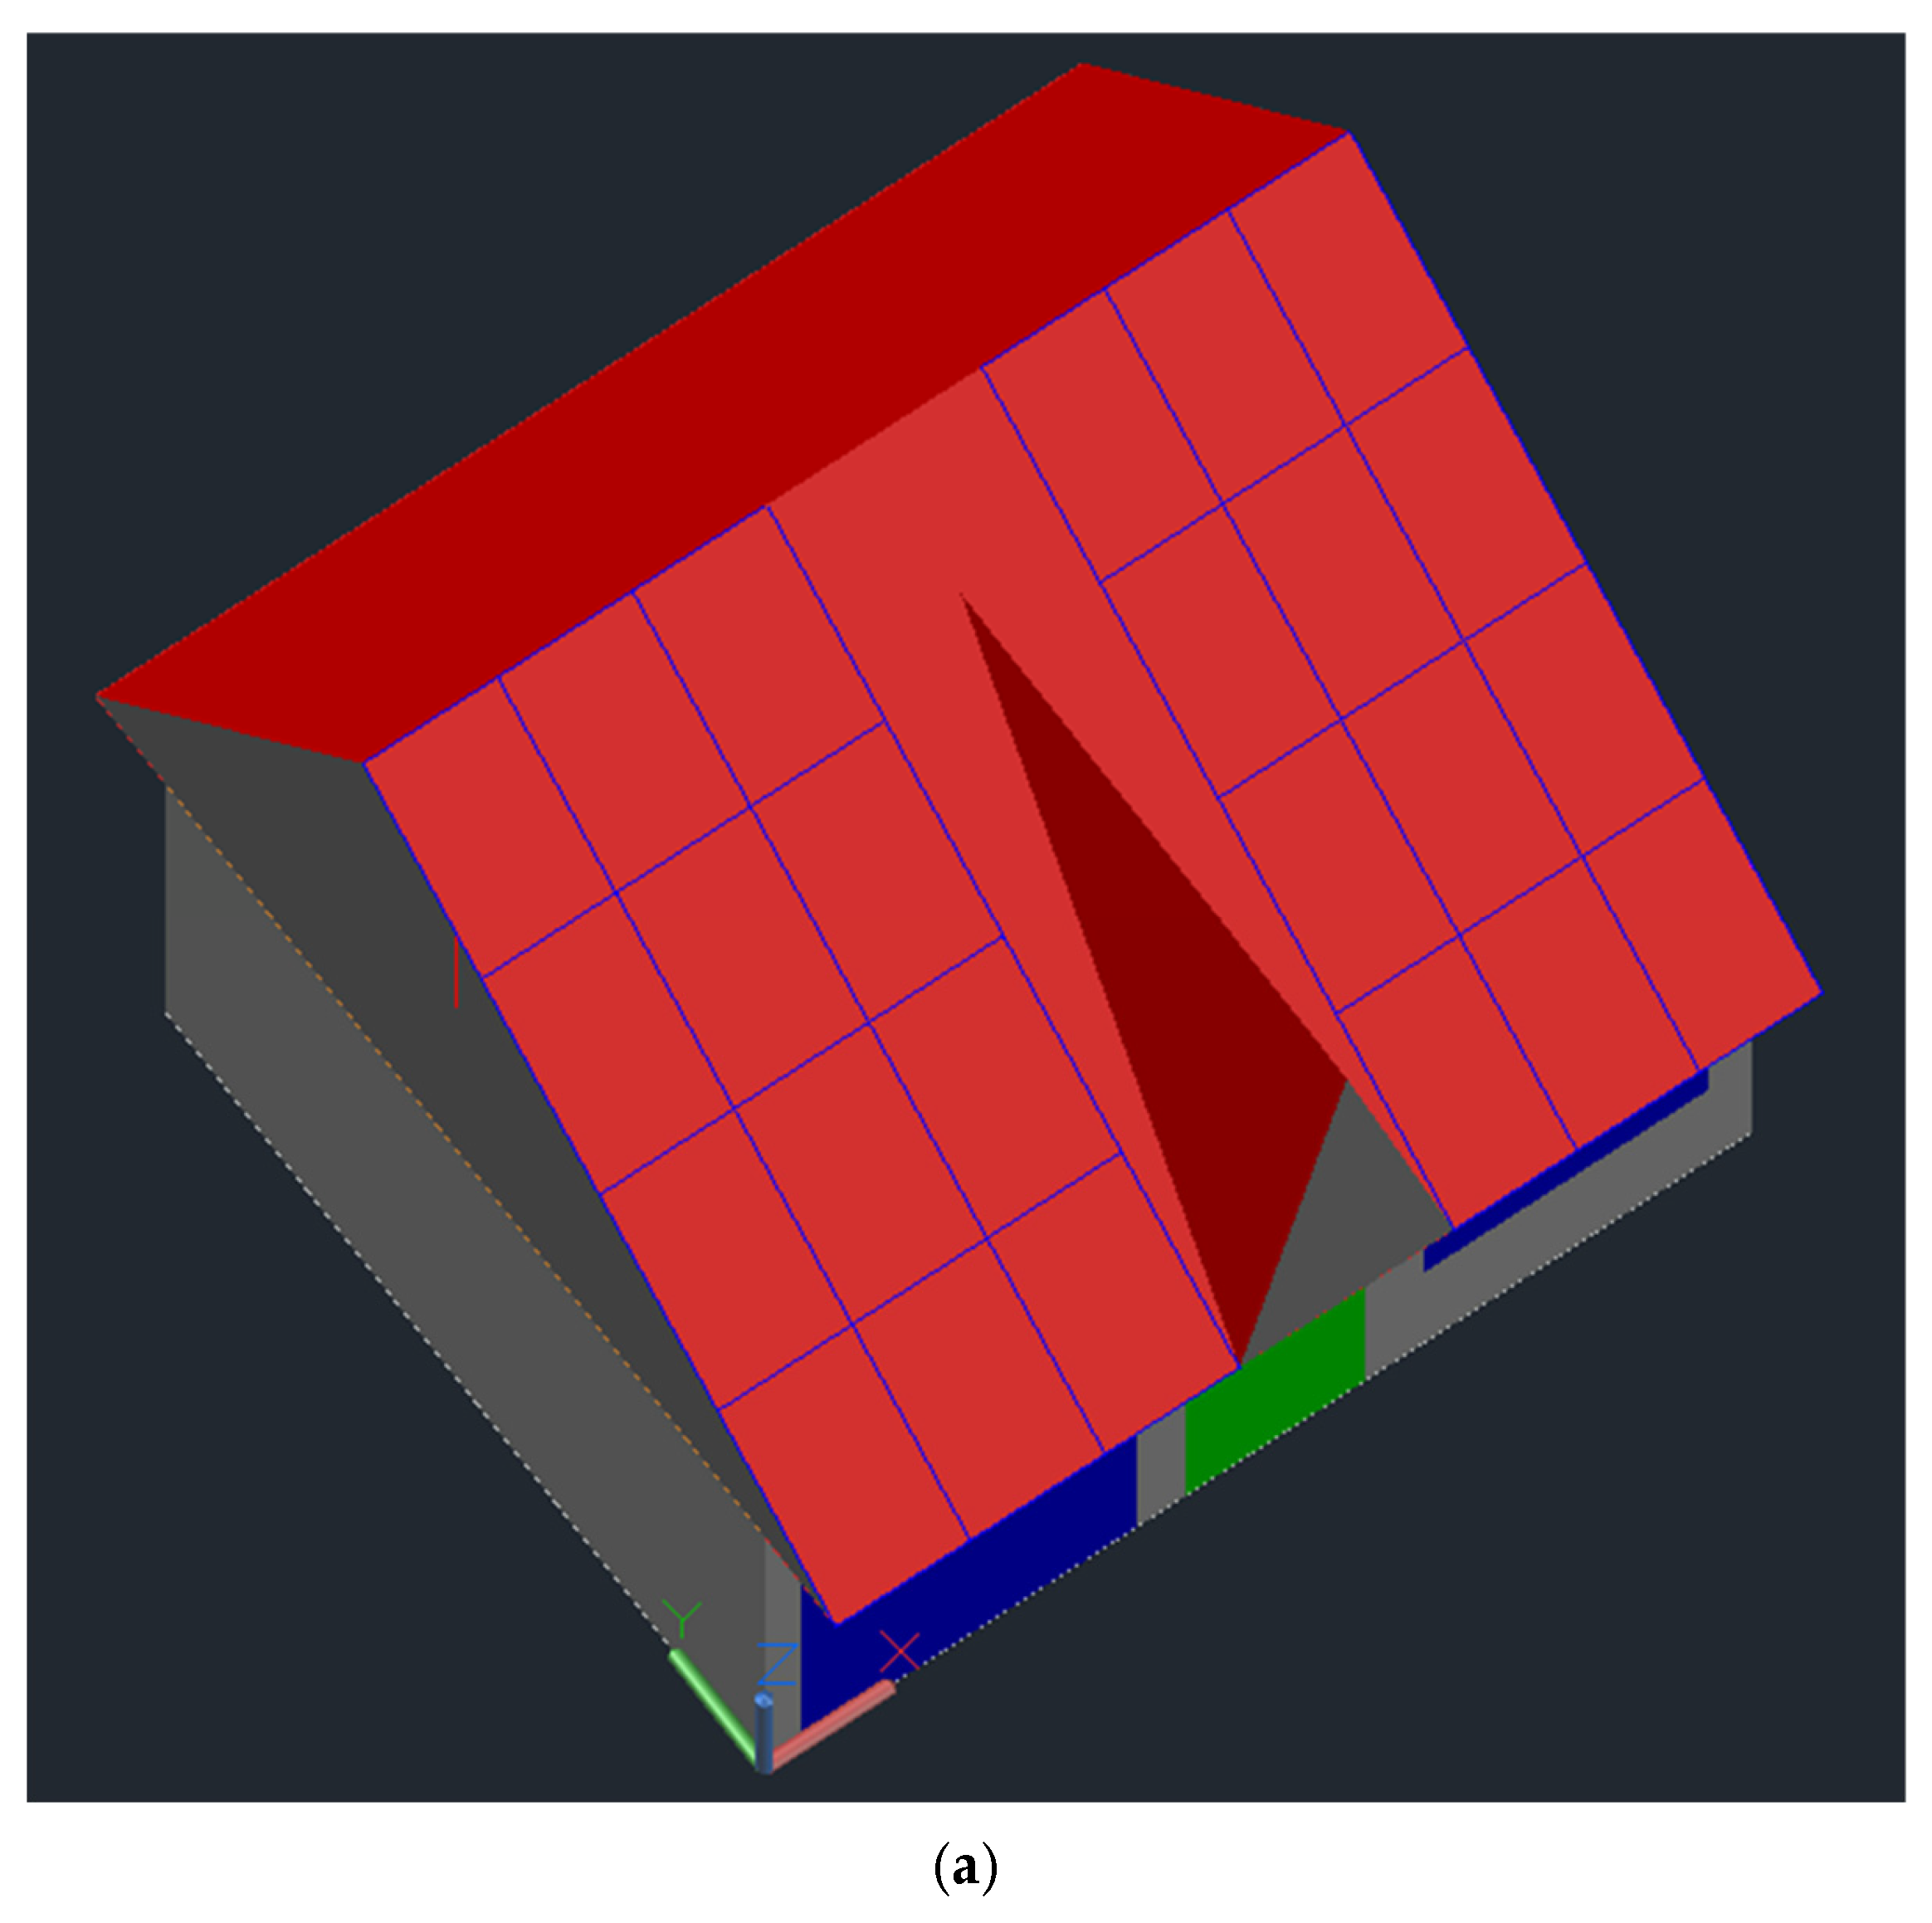
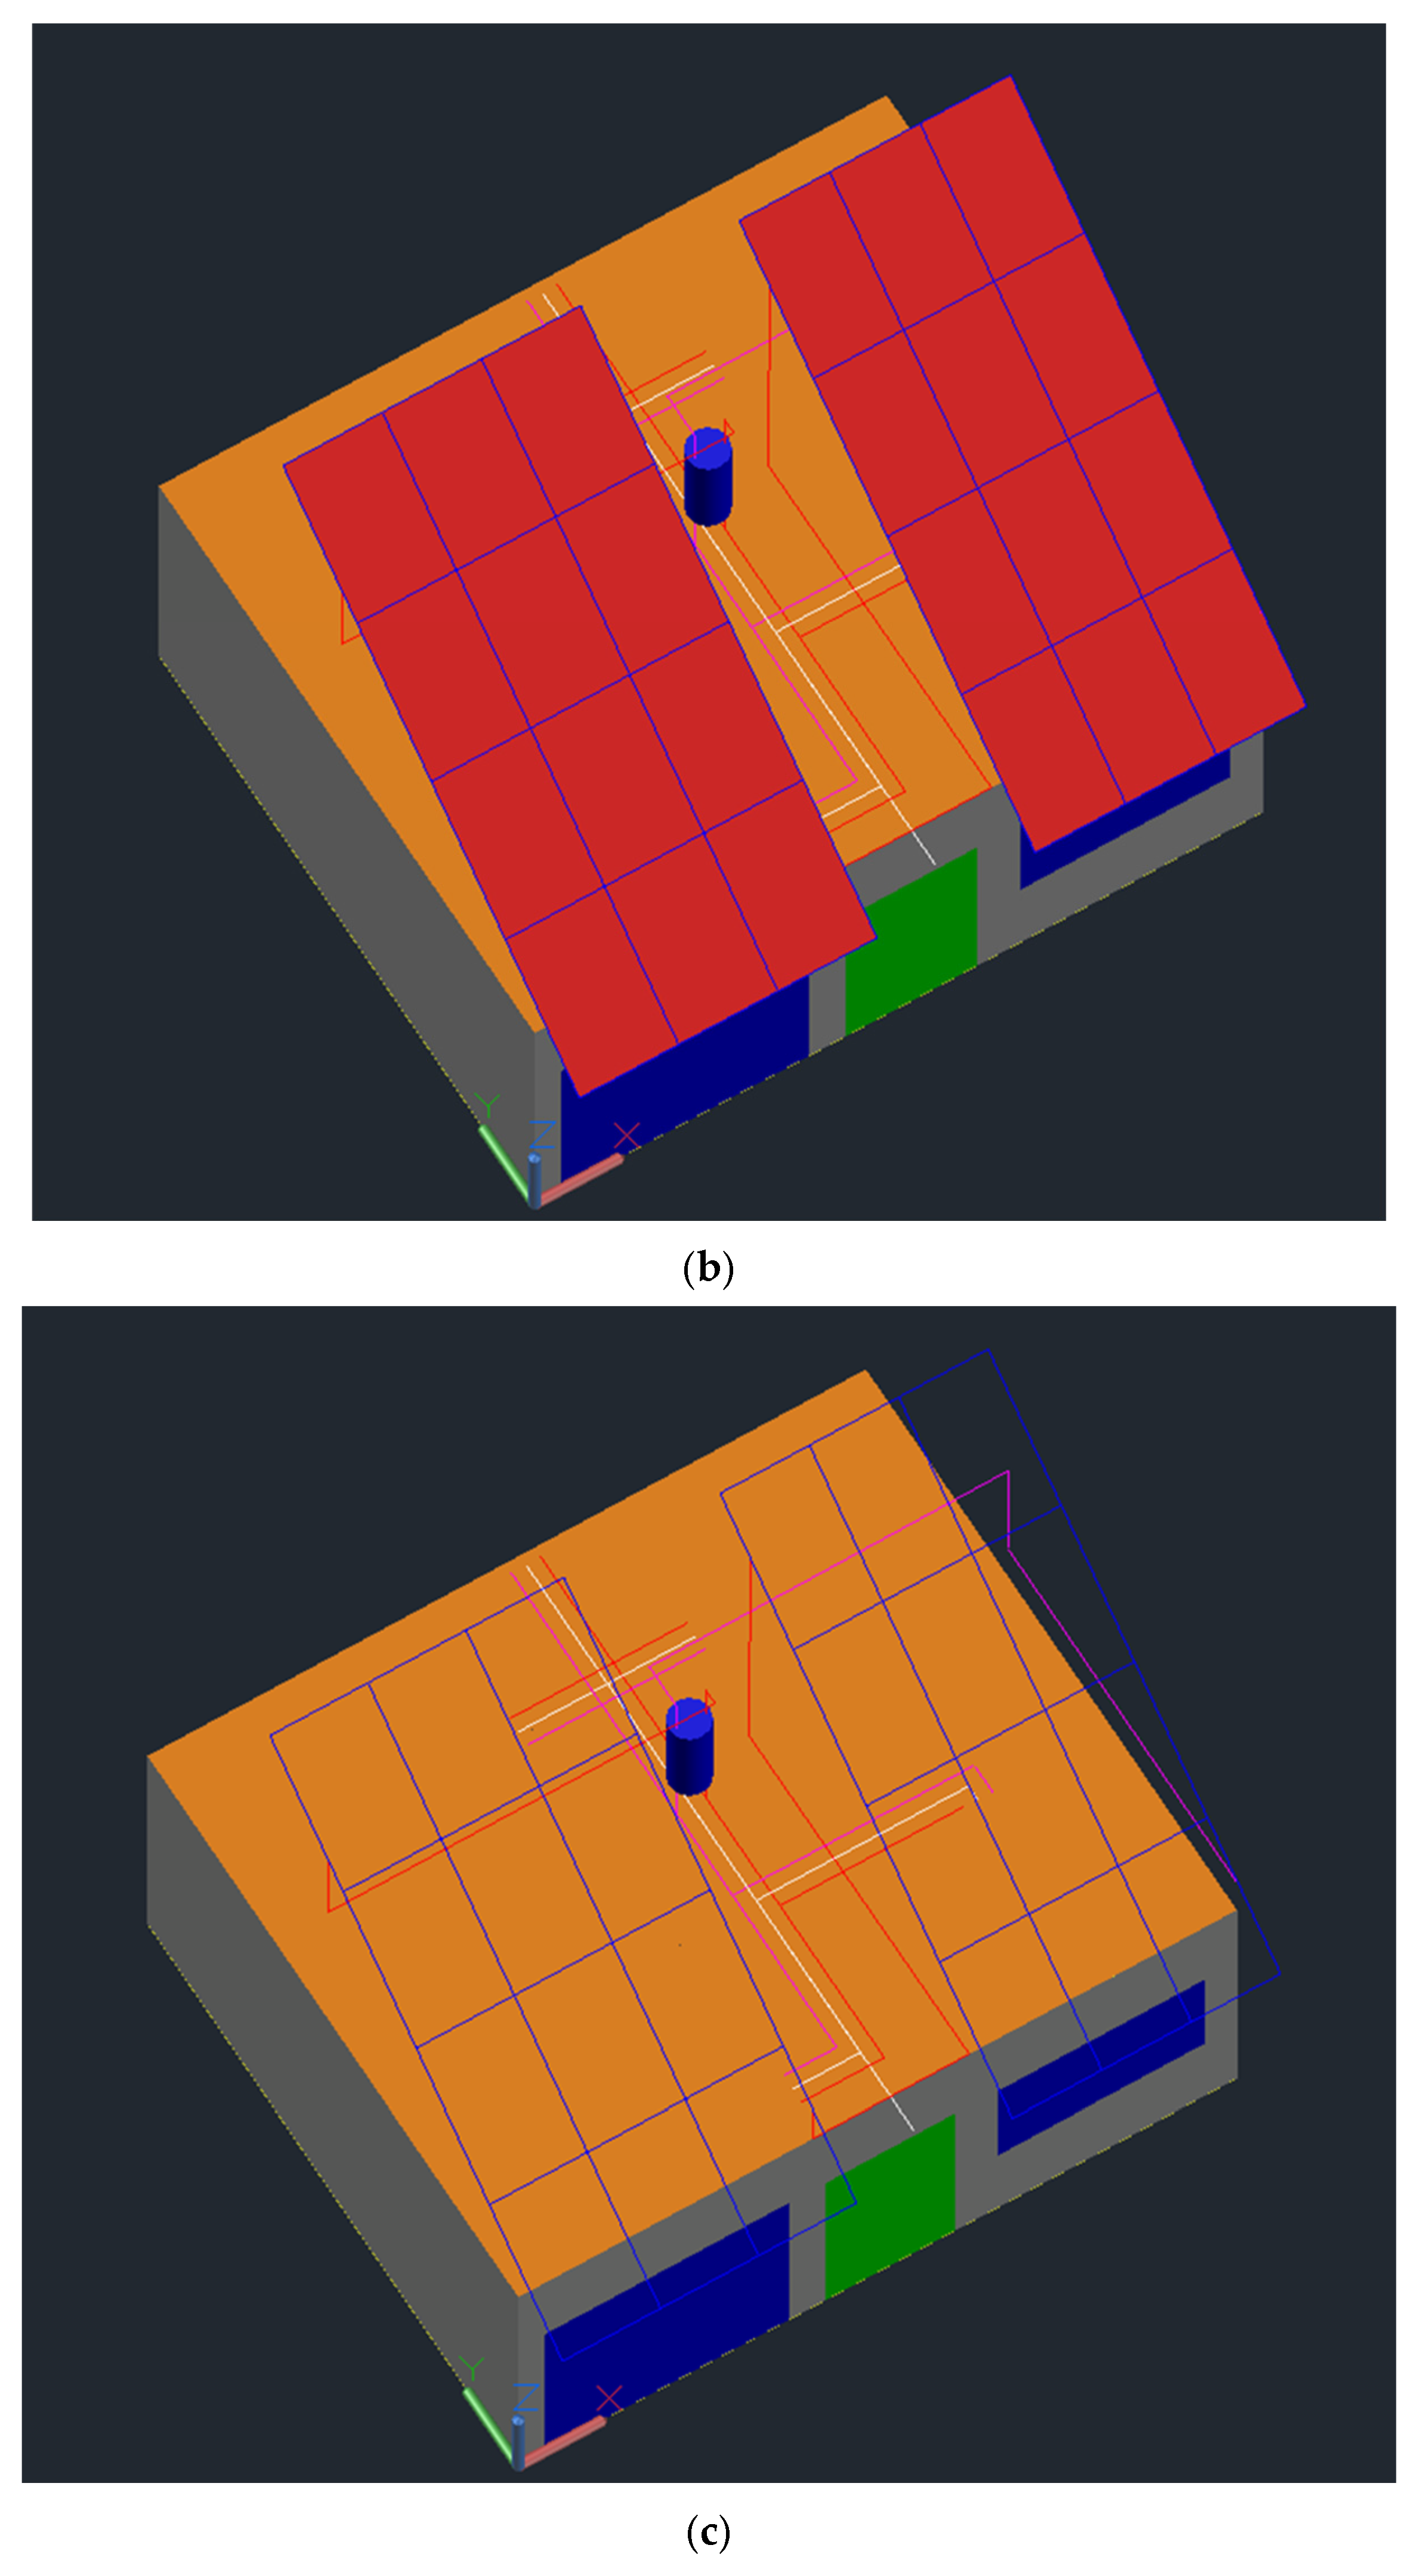
  • Solar water collectors, installed on the roof, whose water will be heated by solar radiation. The system consists of a duct system and a water tank. The heated water will be used in thermo-convectors. The tank is connected to water–air thermo-convectors to heat the cold air using the heated water;
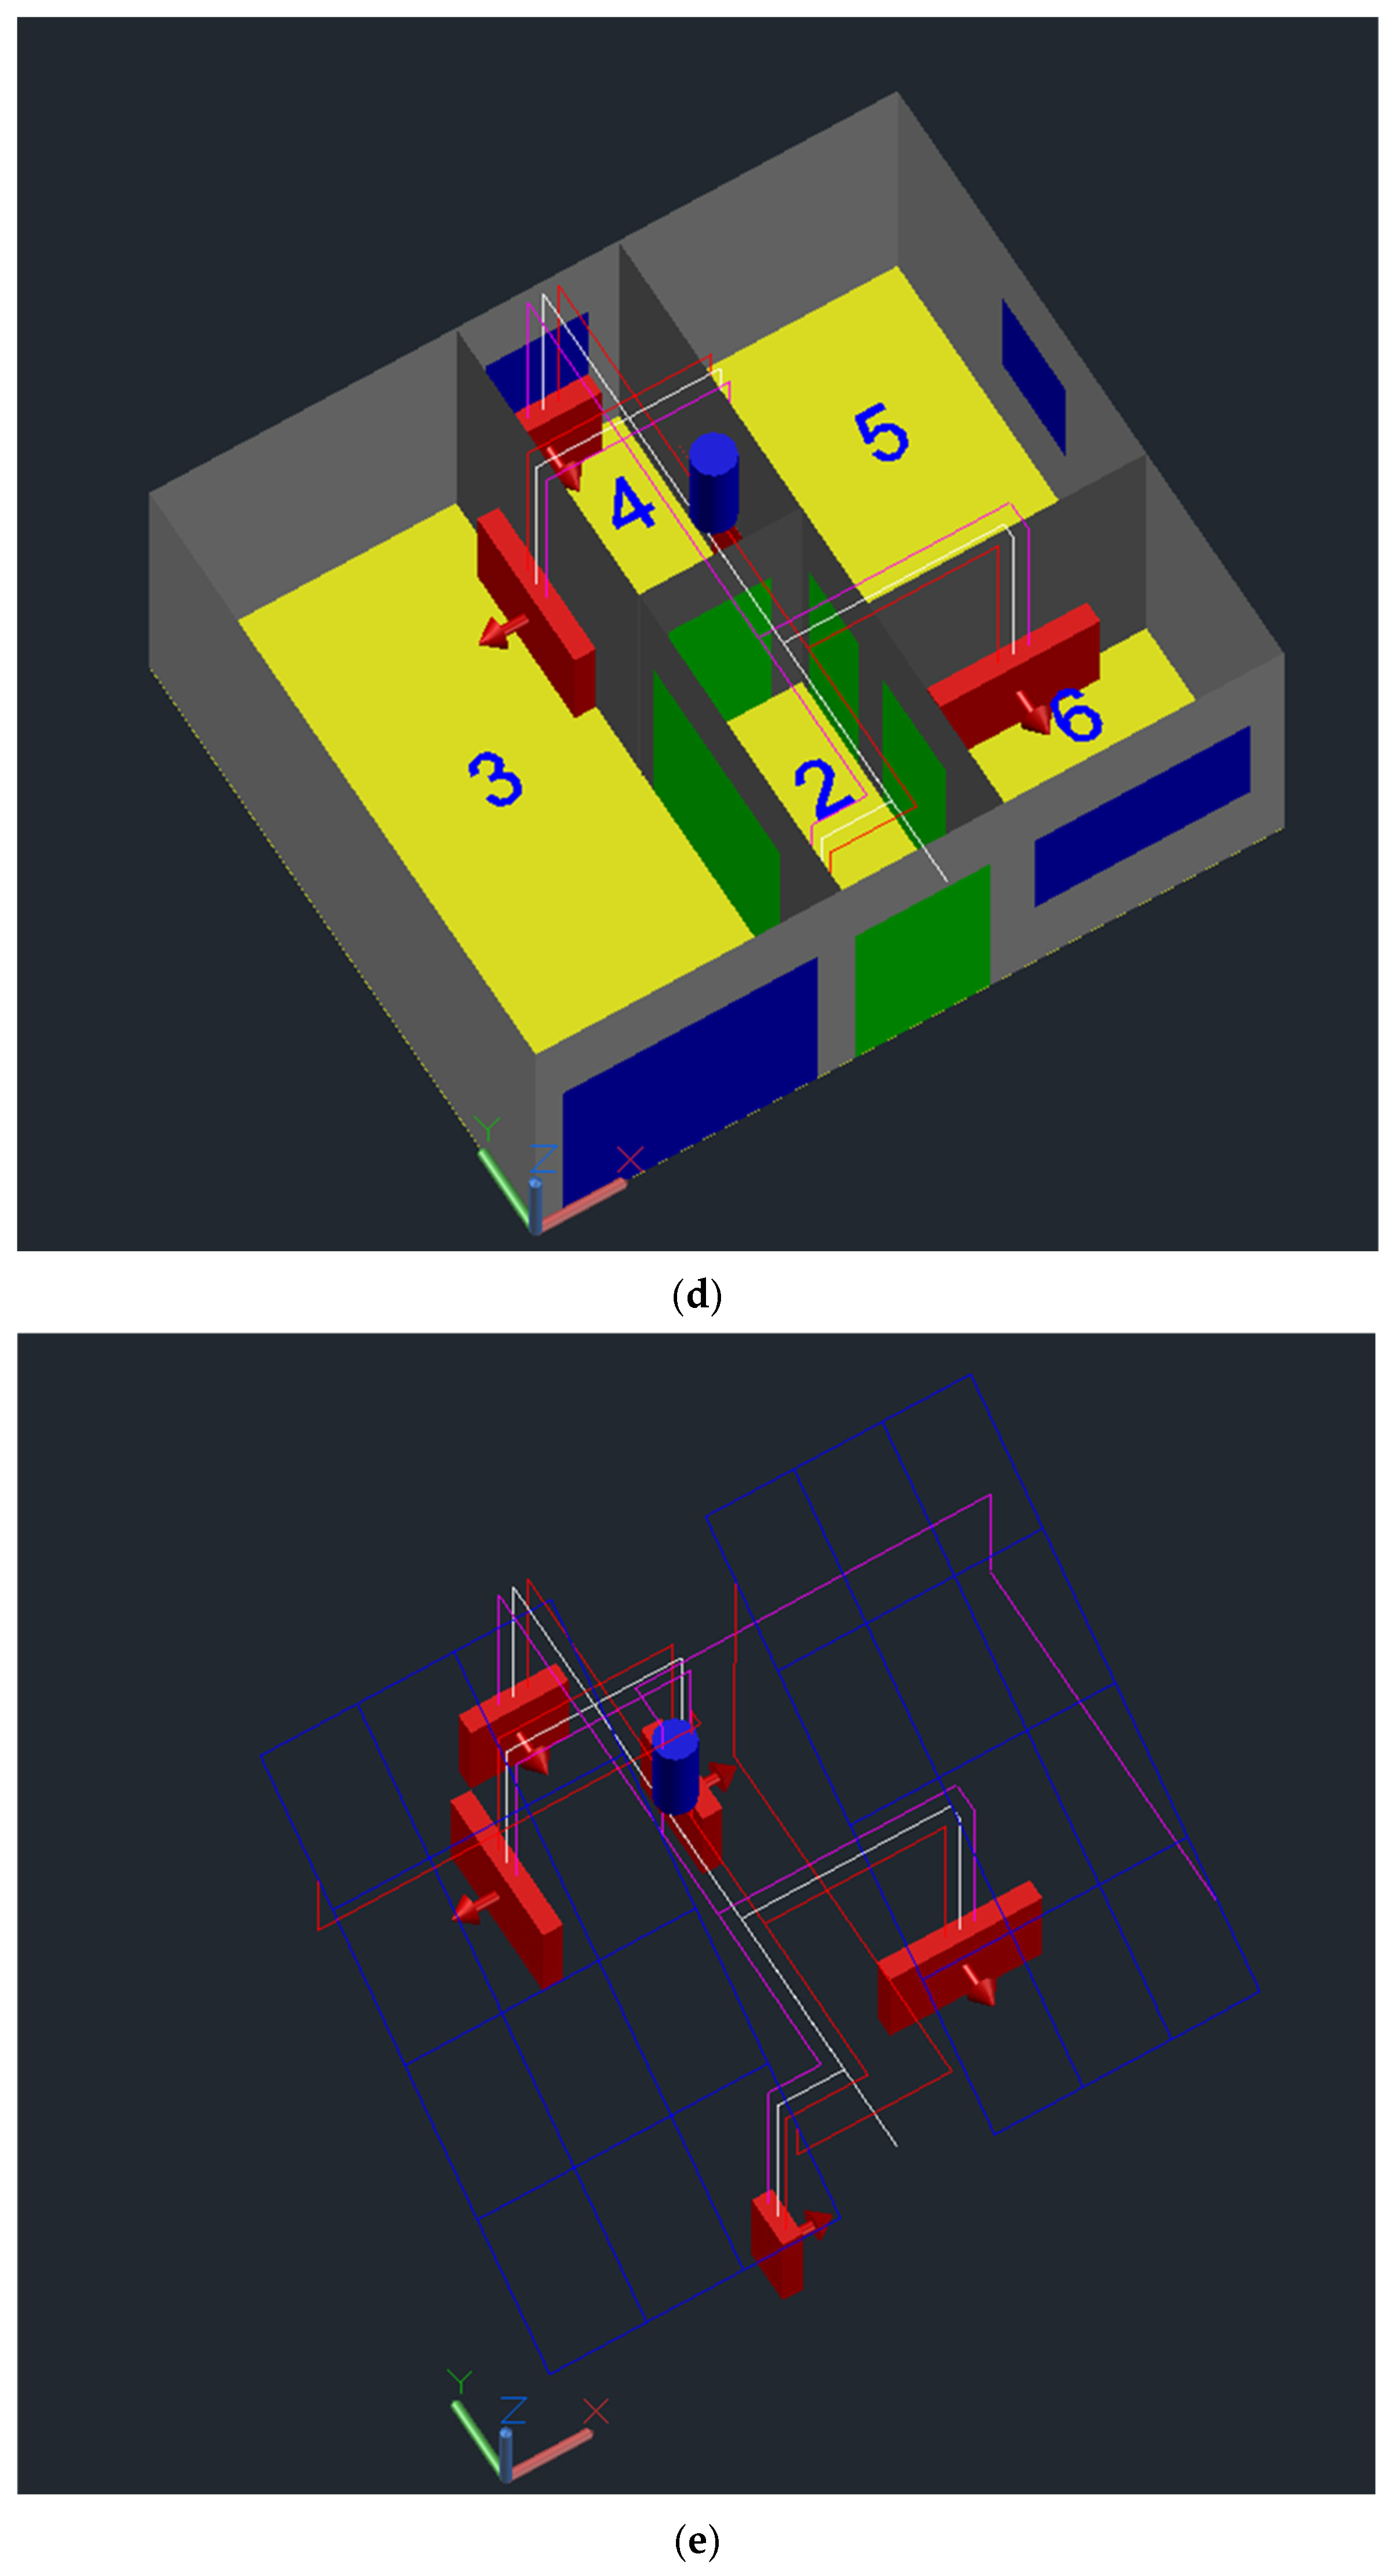
  • Water–air heat exchanger thermo-convectors, installed inside each space with planned occupancy, namely spaces numbered 2, 3, 4, 5 and 6. In this way, this system allows the interior air to be heated.
In Figure 3, the red circuit represents the transport of warmer water, the magenta circuit represents the transport of cooler water, and the white circuit represents the transport of air from the outside. The tank (blue cylinder) is located in the attic, the thermo-convectors (red parallelepiped) are located in the occupied spaces, and the direction of flow inside the space is represented by an arrow located in front of the thermo-convectors.
The solar HVAC system has the following characteristics: the total area of the water collectors is 30 m2, the water flow rate is 1 m3/h and the tank capacity is 100 L.

4.2. Building Materials

Opaque bodies such as external and internal walls, panels, roofs and floors, and transparent bodies such as window glass were considered in this study. Interior bodies, such as furniture, were not considered. Shutter or shading systems were also not considered in windows.
The ground and soil were divided into several layers. The layer closest to the floor has the smallest thickness, while the layer furthest from the floor has the greatest thickness. The total depth considered (floor and soil) was 40 m.
The wall in contact with the external environment, consisting of double bricks, is made up of 13 layers: Two outer layers of cement, six layers of brick, one layer of thermal insulation and four layers of brick and air. The total thickness considered was 30 cm (U-value of 0.12 W/m2K).
The interior wall, made of simple brick, is constructed from 7 layers: Two outer layers of cement; and five inner layers, 3 of brick and two of brick and air. The total thickness considered was 20 cm (U-value of 0.20 W/m2K).
The single and double bricks present parallel and series thermal resistance.
The coverage is made up of 9 layers of different materials: cement, mesh and insulation. The ceiling includes gypsum board, insulation materials, cement, intermediary materials, wood, impermeable materials, and roof tiles, with a thickness of 40 cm (U-value of 0.59 W/m2K).
The door has 3 layers: Two layers of wood and a central layer of air. The total thickness considered was 5 cm (U-value of 0.94 W/m2K).
The window is constructed from a single layer of 4 mm glass.
For opaque bodies (internal and external), divided into several layers, integral energy balance equations are developed for each layer. These equations consider the thermal properties of the materials, such as thermal conductivity and heat capacity, calculated as a function of the temperature of the material and the thickness and area of each layer. In the layers in contact with the external environment, radiative thermal properties (taking into account incident solar radiation) and convective properties (taking into account the natural, forced or mixed heat transmission coefficient, calculated as a function of the speed and temperature of the air, internal and external, and the dimensions) are considered.
In the transparent body, an integral energy balance equation is developed. This equation considers the thermal properties of the glass, calculated as a function of its temperature, radiative thermal properties (taking into account solar radiation) and convective properties (taking into account the natural, forced or mixed heat transmission coefficient, calculated as a function of the speed and temperature of the internal and external air, and the dimensions).
In addition to opaque and transparent bodies, the software also considers internal spaces. In these spaces, the respective volumes, occupancy and air flows exchanged between the different spaces and between the spaces and the external environment are considered.
During the simulation, the software, based on the data calculated at each instant, evaluates the value of the properties, parameters, temperature and mass of water vapor and carbon dioxide.

4.3. External and Geographic Conditions

The residential building is located in Faro, south of Portugal, 37.03° N–7.97° E, at an altitude of about 20 m above sea level, whose climate is Mediterranean-type. The numerical simulation was carried out for the heating season, considering a typical winter day (21 December) in the region with clear skies. Note that the previous five days were also simulated to ensure the accuracy of the results.
The input meteorological data used for the BTD numerical model are outdoor air temperature, outdoor relative air humidity, wind speed and wind direction. These data were obtained between the 0 and 24 h, with a clear sky, and are a representative average of December (winter conditions). The measurements were obtained from a weather station located nearby the residential building. The values of the external environmental variables are as follows:
  • Outdoor air temperature, with values between 4.7 °C (at 6.26 am) and 15.0 °C (at 1.26 pm), with fluctuations of around 1.0 °C;
  • Outdoor air relative humidity, with values between 64.0% (at 7.45 am) and 37.2% (at 1.26 pm), with fluctuations of around 5.0%;
  • Average value of wind speed is 12.30 m/s, with fluctuations around 5.83 m/s;
  • CO2 concentration in the external environment was taken to be 400 ppm.

4.4. Occupancy Cycle

Considering working days, the residential building is occupied during the lunch period and in the evening. The occupancy cycle is shown in Table 1.
The occupants’ clothing insulation level considered is 1 clo for winter conditions, and the metabolic level is 1.2 met (typical sedentary activity) [40].

4.5. Ventilation Topology

The ventilation topology is as follows:
  • When the space is occupied, the air flow rate is proportional to the number of occupants, that is, 35 m3/h per person [59]. This value is in accordance with category I of EN 16798-1 [57];
  • When the space is unoccupied, the airflow rate is one air change per hour (ACH) obtained by air infiltration.
The air infiltration rate was obtained experimentally using the decay concentration method in the work presented in Conceição et al. [64]. The air exchange rate due to leaks was obtained in a classroom with the window and door closed and the air-conditioning system turned off [64]. The average exchange rate was obtained using a mixing system operating through a set of connected fans placed internally [64]. The tracer gas used was CO2. At the beginning of the test, 3 industrial fans were used to ensure good mixing of CO2 with the air, and during the test, without occupancy, the evolution of CO2 was recorded [64]. According to the results obtained in the work of Conceição et al. [64], it is adopted in the present study for a value of 1 ACH in order to ensure some natural air exchange with the outside to guarantee an acceptable IAQ.
Thermal insulation in a building is ensured by opaque and transparent elements. Opaque elements include walls in contact with the interior environment, walls in contact with the interior/exterior environment, floors, doors, and roof. Transparent elements include windows and glass doors. Air infiltration into interior spaces through windows and glass doors were considered in this study. In these cases, a value of 1 ACH is adopted for the air exchange rate. Air infiltrations from the kitchen chimney and bathroom extractor fan, among other air infiltrations, were not considered in this study.

4.6. Solar HVAC System Operation

In order to be able to compare the results, two simulations were performed for winter conditions considering the installation or not of the solar HVAC system.
When the solar HVAC system is installed, its operation mode is as follows:
  • The solar HVAC system is running between 8 a.m. and 7 p.m. in the spaces (numbered 2, 3, 4, 5 and 6) with expected occupancy;
  • The solar HVAC system is turned off between 7 p.m. and 8 a.m. in the same spaces mentioned above.
In the solar HVAC system, a control strategy was implemented using the PMV index. The implemented control strategy was described in Conceição et al. [70]. In winter conditions, the control system starts the heating mode when the PMV index is slightly below −0.7. It was considered that occupants’ thermal comfort conditions will be guaranteed at least within category C of ISO 7730 [40].

5. Results and Discussion

This section presents the numerical results obtained by the BTD software to the use with a solar HVAC system and comparing the results when it is not used, for typical winter conditions. The results are focused on the air velocity, indoor and outdoor air temperature, indoor and outdoor relative air humidity, mean radian temperature, PMV, and CO2 concentration of the residential building.

5.1. Environmental Variables

The simulation carried out allowed to calculate the values of ta, tr, RH and va. These values are used in calculating the PMV index. For this purpose, the evolution of the average values of ta and tr obtained inside spaces 2 to 8 (see Figure 2) of the residential building is presented. Two situations were evaluated: solar HVAC system on and solar HVAC system off.
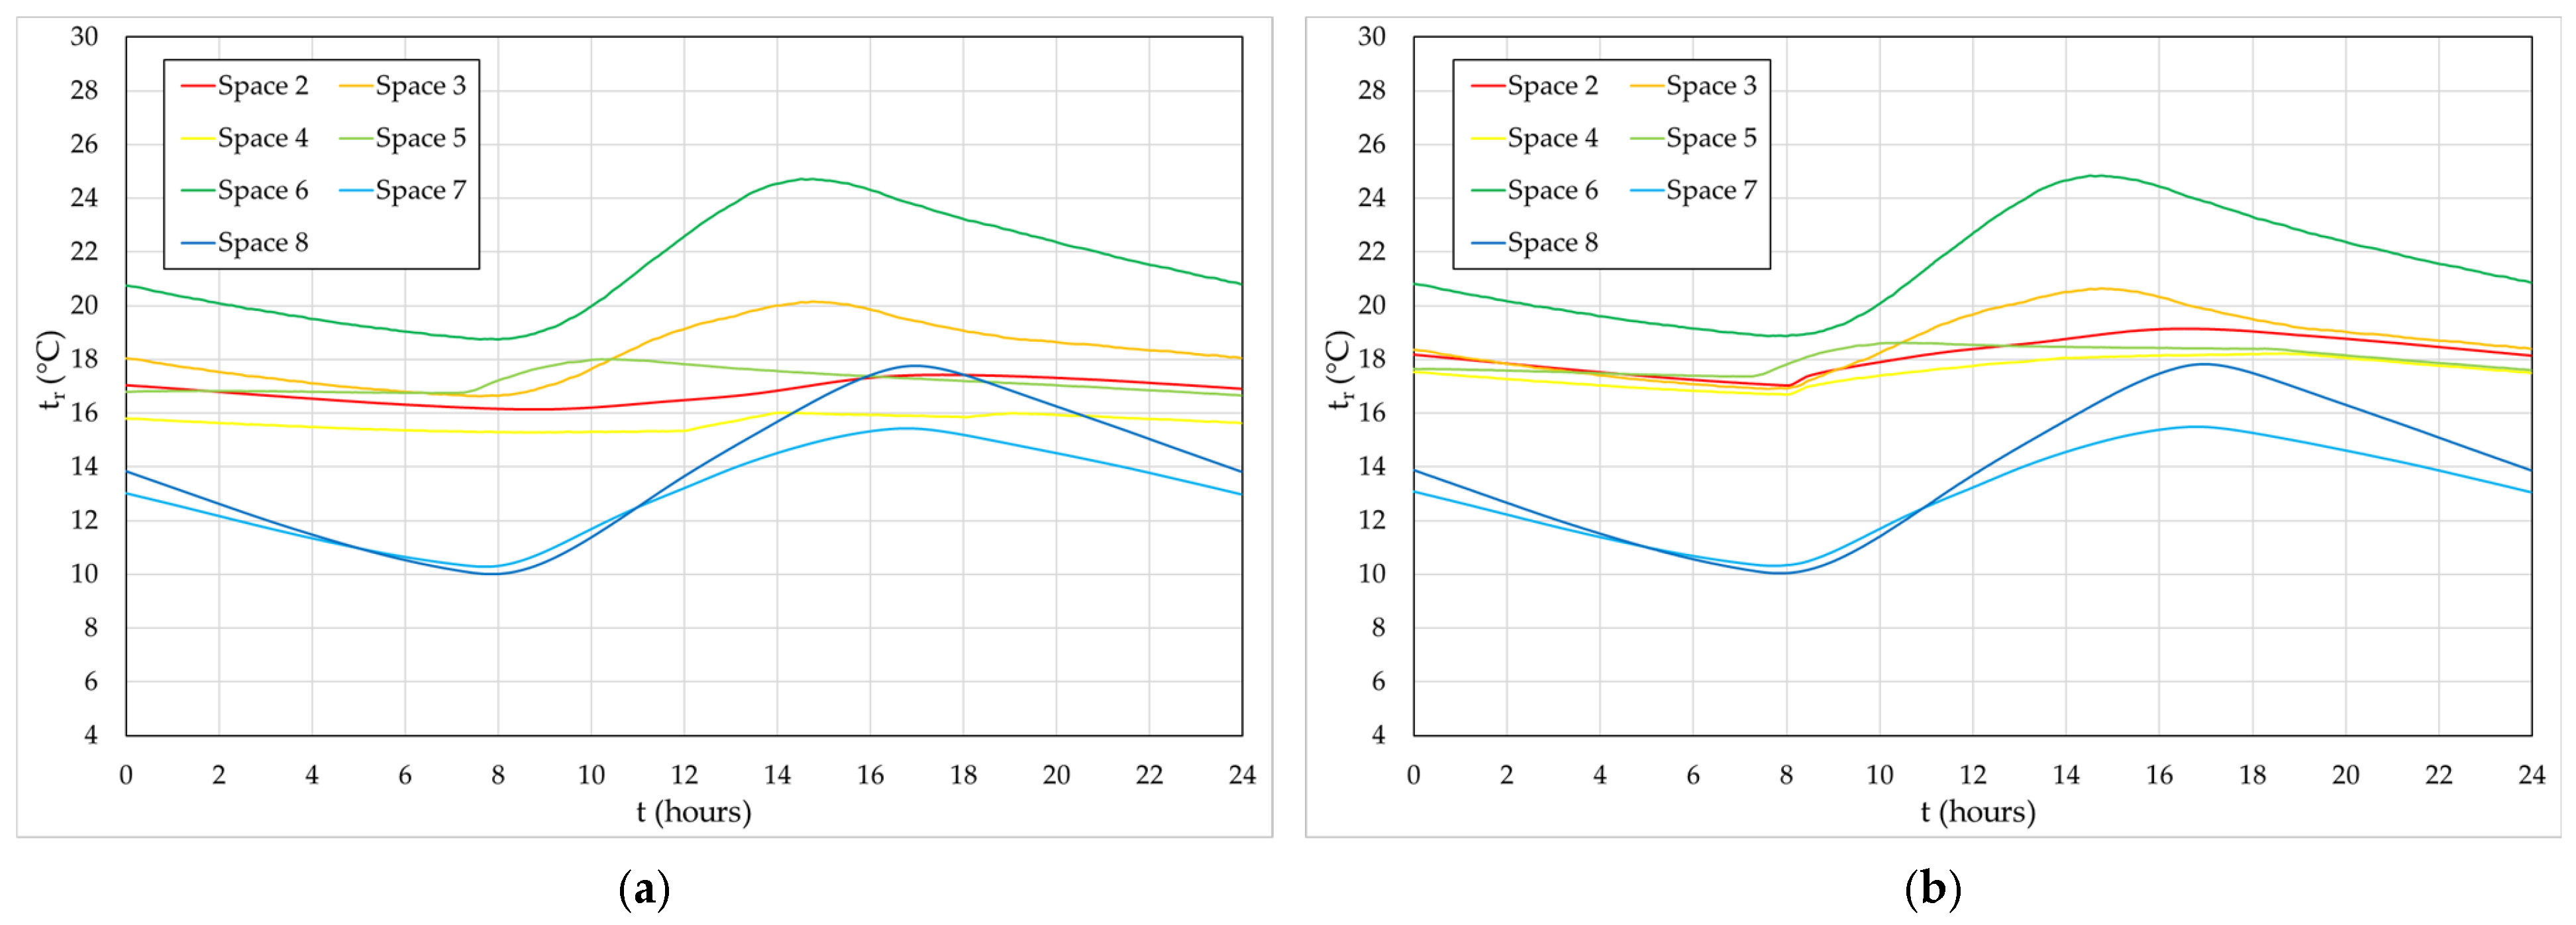
It should be noted that the calculation of tr is based on the mean temperatures of the ceiling, surrounding walls, and floor by using the Zone-Average method [71,72]. These temperatures are weighted considering the area corresponding to each of the surrounding surfaces, making the emissivity value equal to 1. The value thus obtained is a representative of the estimated average of tr in the center of the space under consideration. These temperatures are weighted by the area of each of the surfaces (floor, surrounding walls, and ceiling), taking the emissivity as equal to 1. Therefore, the tr value obtained represents its estimated average at the center of the space. This method is used because the location of the occupants in the space is unknown, and only their number is known. However, there will be some uncertainties that may affect the determination of the PMV index, although in short-term assessments the eventual errors introduced by the method used here are usually within the expected accuracy [71].
However, it is worth mentioning a critical issue in building simulation: different Building Energy Performance Simulation tools show significant differences in long-term thermal comfort assessment, even though they may present concordant results regarding the overall energy performance of the building [73]. These discrepancies are due to the way users manage input data and critically analyze the results obtained, as well as how software interacts with operative temperatures and handles the calculation of heat transfer by radiation [73].
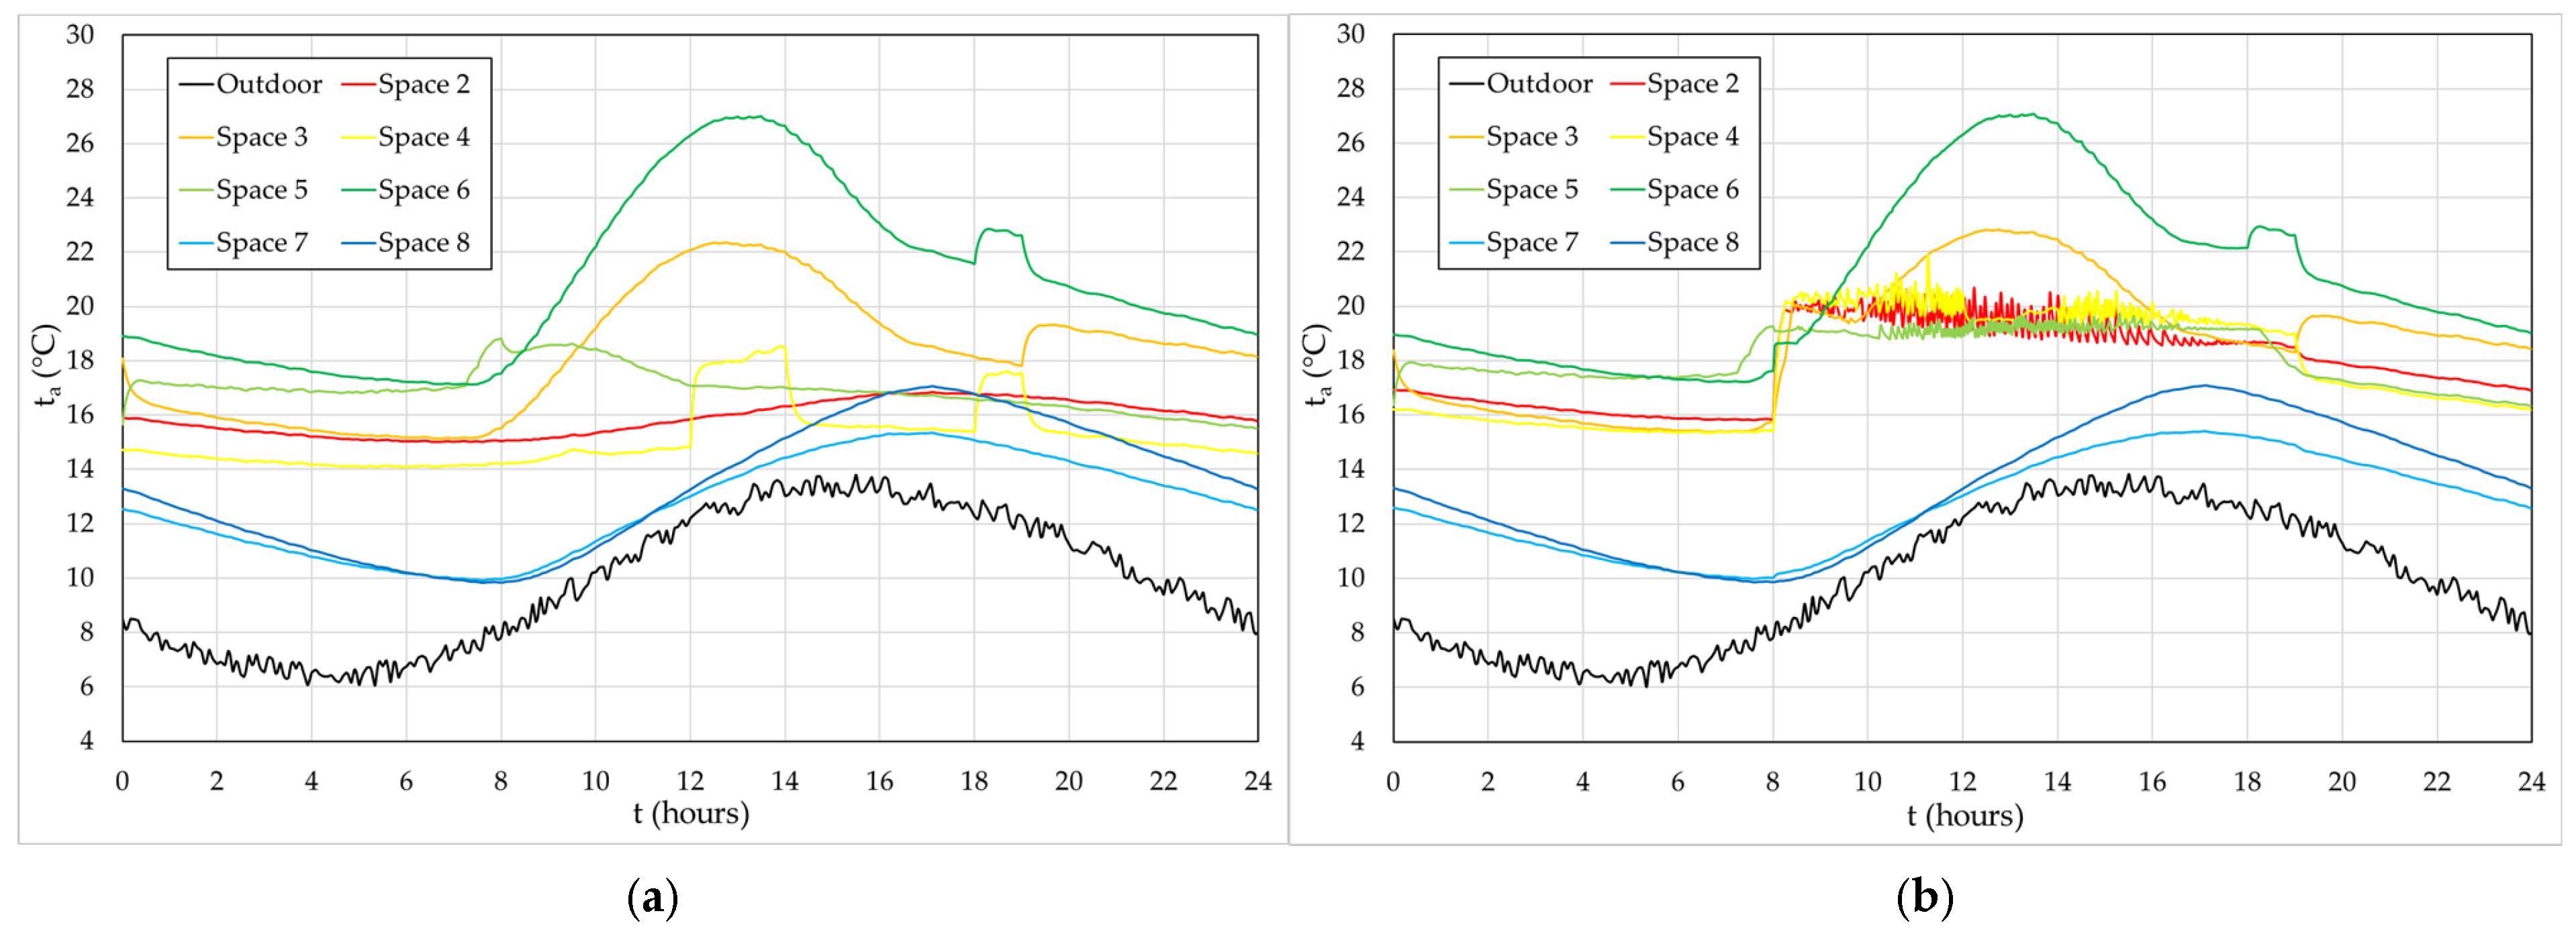
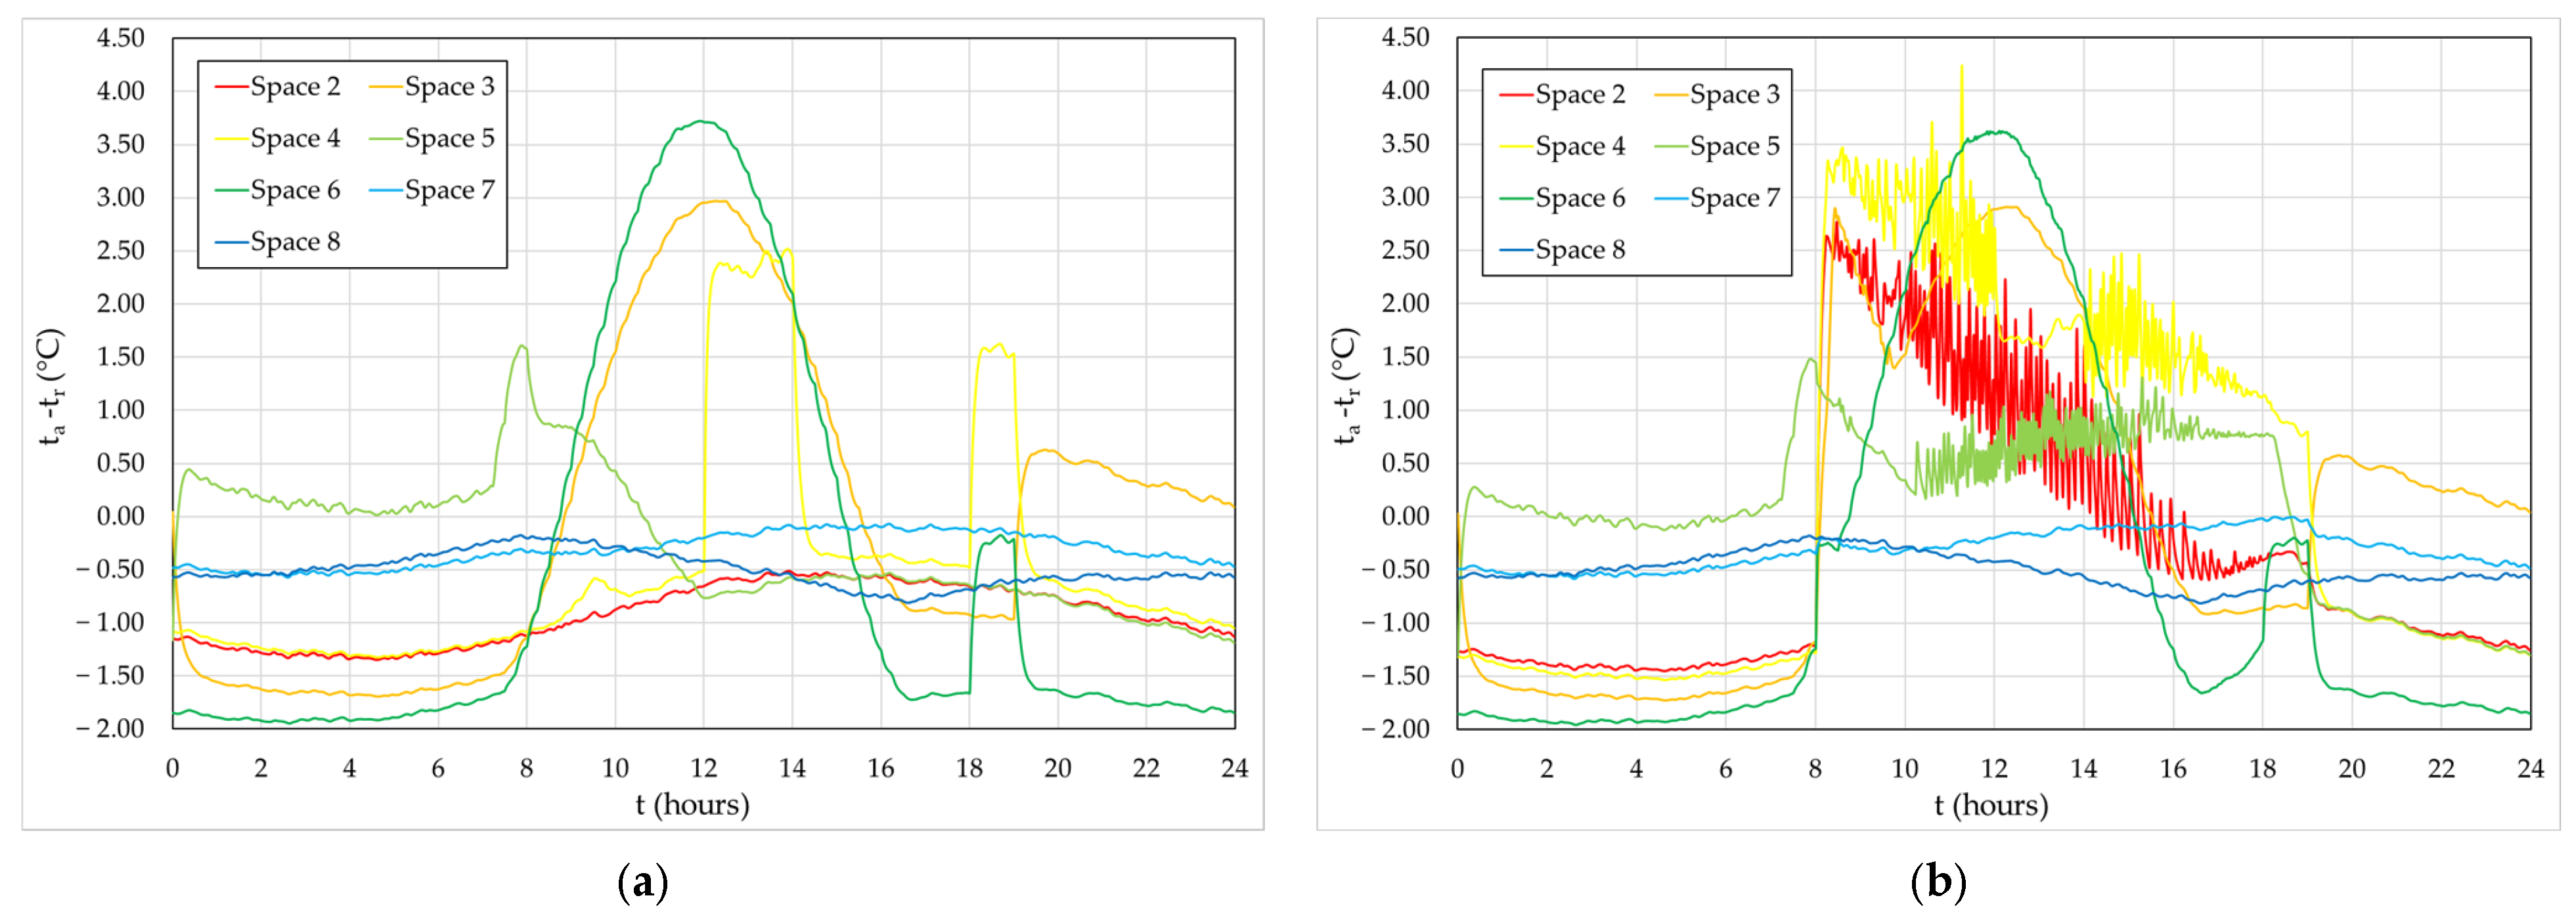
Figure 4a and Figure 4b show, respectively, the evolution of ta when the solar HVAC system is off and when the solar HVAC system is on. Figure 5a and Figure 5b show, respectively, the evolution of tr when the solar HVAC system is off and when the solar HVAC system is on. Finally, Figure 6a and Figure 6b show, respectively, the evolution of the difference between ta and tr when the solar HVAC system is off and when the solar HVAC system is on.
When the solar HVAC system is turned off, the ta values inside the spaces are higher than the temperature values in the outside environment. The highest ta value occurs in spaces 3 and 6 with windows facing south, due to the effect of solar radiation incident on these windows, which have a relatively large area. The lowest ta values are seen in spaces 7 and 8 located in the attic. Space 4 with the window facing north presents ta values between 14–16 °C, when unoccupied, and around 18 °C when occupied. Space 5 with a window facing east has ta values between 16–18 °C. Values of ta increase when the space is occupied due to the human body also being a heat source.
When the solar HVAC system is on, as seen previously, the ta value inside the spaces remains higher than the temperature in the external environment. As seen previously, the highest ta values continue to be present in spaces 3 and 6 facing south, while the lowest ta values are present in spaces 7 and 8 located in the attic. Spaces 2, 4 and 5 are subject to the solar HVAC system between approximately 8 a.m. and 7 p.m. The operation of the solar HVAC system can produce ta values between 19 °C and 22 °C in the spaces heated by it, values that fall within those proposed in the Portuguese standard [59]. Spaces 3 and 6 are only subject to the solar HVAC system in the early morning; during the rest of the day the evolution of ta remains approximately the same as the in case at which the solar HVAC system is turned off. As the value of ta in spaces 3 and 6 presents very high values, the operation of the solar HVAC system tends to be deactivated. Of the spaces heated by the solar HVAC system, space 4 has the highest ta values, space 5 has the lowest ta values and space 2 has the highest ta values in the morning and lowest in the afternoon. This phenomenon is mainly due to the variation in the value of tr.
In the case where the solar HVAC system is turned off, in spaces with windows facing south (during the day) or when the spaces are occupied, it is generally found that the value of ta is greater than the value of tr. In this case, the contribution of solar radiation and the presence of heat from occupants to heating the indoor air are noticeable. Otherwise, it turns out that the value of ta is smaller than the value of tr.
In general, in spaces with windows facing south (during the day), in occupied spaces (during the night), and in spaces subject to the solar HVAC system when turned on, the value of ta is higher than the value of tr. Otherwise, it is observed that air ta is lower than tr.
On the other hand, it is observed that in attic spaces, whether during the day or night, the value of ta is always lower than the value of tr.

5.2. Thermal Comfort

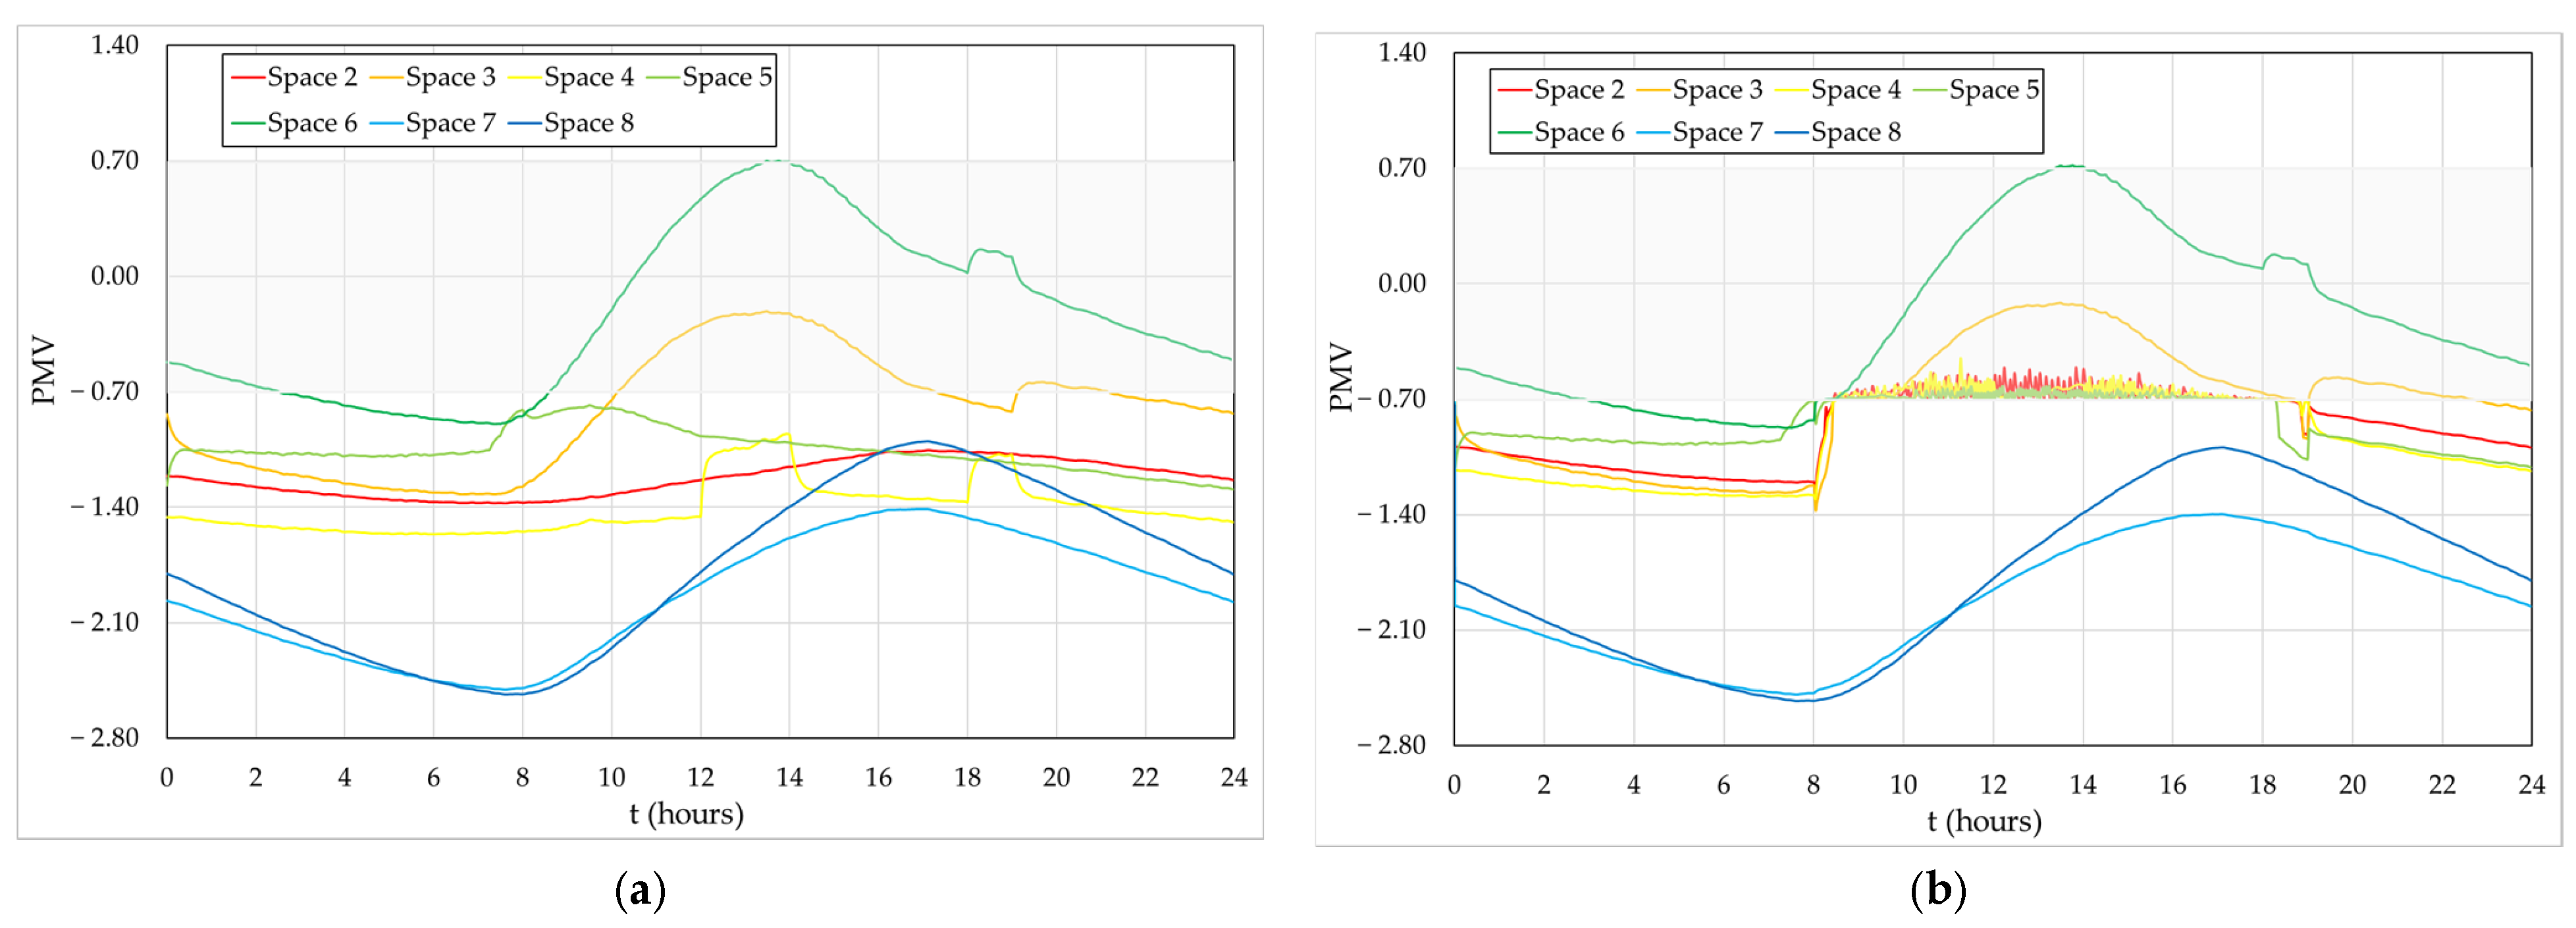
Thermal comfort is assessed by the evolution of the PMV index in internal spaces. PMV depends on ta, tr, RH, va, metabolic rate, and activity level (see Section 2 and Section 4.4). The operation of the solar HVAC system is considered to be controlled by the PMV index (see Section 4.6). Figure 7a and Figure 7b show, respectively, the evolution of PMV index when the solar HVAC system is turned off and when the solar HVAC system is on.
When the solar HVAC system is turned off, the PMV index shows higher values in spaces 3 and 6 with south-facing windows and lower values in spaces located 7 and 8 in the attic. In the remaining spaces 2, 4 and 5 the values are between approximately −1.6 and approximately −0.8. During the day, spaces 3 and 6 with south-facing windows present acceptable levels of thermal comfort, within the values recommended in category C [40]: in space 6 for PMV positive values and in space 3 for PMV negative values. This occurs due to the heating of the internal spaces caused by the entry of solar radiation into these spaces. At other times of the day, when there is no solar radiation, these spaces are able to maintain acceptable or almost acceptable comfort levels due to the tr values obtained (between around 17 °C and around 21 °C) during this period. The remaining spaces 2, 4 and 5 have thermal comfort levels slightly lower than those recommended by category C [40], as given the availability of their windows facing east and north, they do not benefit from the heating provided by the entry of a sufficient amount of solar radiation.
When the solar HVAC system is on during the day, there is an improvement in thermal comfort levels in the spaces on the ground floor of the residential building. Between 8:30 a.m. and 6:15 p.m., in all these spaces (2, 3, 4, 5 and 6) it is possible to obtain acceptable levels of thermal comfort within category C [40]: spaces 2, 3, 4 and 5 have negative PMV values; in space 6, until 10:30 a.m. has negative PMV values, after this time it has positive PMV values.
When the solar HVAC system is on, considering that it is a system that depends on the presence of solar radiation, in the heating season, generally before 9 a.m. and after 6 p.m., it is not possible to guarantee acceptable levels of thermal comfort assuming PMV values within category C [40], the least restricted, despite the PMV values being very close to the acceptable negative value of −0.7. During the night, when the solar HVAC system is on during the day, thermal comfort levels are found to be closer to the lower acceptable level (PMV equal to −0.7), than when the solar HVAC system is off.
Olesen and Parsons [74] and Van der Linden et al. [75] developed studies regarding the concepts of Warm Uncomfortable Hours (WUH) and Cold Uncomfortable Hours (CUH). Uncomfortable hours are used either in comparative studies between different buildings or in comparative studies between different compartments in the same building. Uncomfortable hours allow for a comparative assessment of thermal comfort conditions due to heat (considering the positive values of the PMV index) and cold (considering the negative values of the PMV index), during a long period of occupancy. This concept is presented in ISO 7730 [40].
In this study, the WUH and CUH values in compartments 3, 4, 5 and 6 (see Figure 2) were evaluated when the solar HVAC system was switched off and switched on (Table 2).
As can be seen in Table 2, there are no WUH values in any compartment whether the solar HVAC system is switched off or on, an expected result in winter conditions, when incident solar radiation levels are not sufficient to overheat interior spaces.
Compartments 2 and 6 have zero CUH values; compartment 2 is a transition space, and compartment 6 has a significant glazed area facing south, allowing significant solar radiation to enter and contributing to a mild air temperature in this space. Compartment 5 exhibits the highest CUH values when the solar HVAC system is switched on and off. This is due to its location with one façade facing north and another facing east, where there is only one window, of relatively small area, which only allows solar radiation to enter during the morning. Given the volume of space to be heated, the use of a solar HVAC system can only reduce the CUH value by 18.8%. In compartments 3 and 4, the use of the solar HVAC system reduces the CUH value by 55.0% and 85.7%, respectively. Although compartment 3 has a considerable volume, it also has a glazed surface area, allowing solar radiation to contribute significantly to heating the interior air of this space. Although compartment 4 has its façade facing north, the volume of this space is relatively small, so placing the water–air thermo-convector below the window allows this space to be heated effectively.
The methodology implemented in this numerical study, under winter conditions in a Mediterranean-type climate, allows us to provide a built environment that is more adapted to a climate (especially taking into account climate change) that tends to have increasingly higher outdoor air temperatures.

5.3. Indoor Air Quality

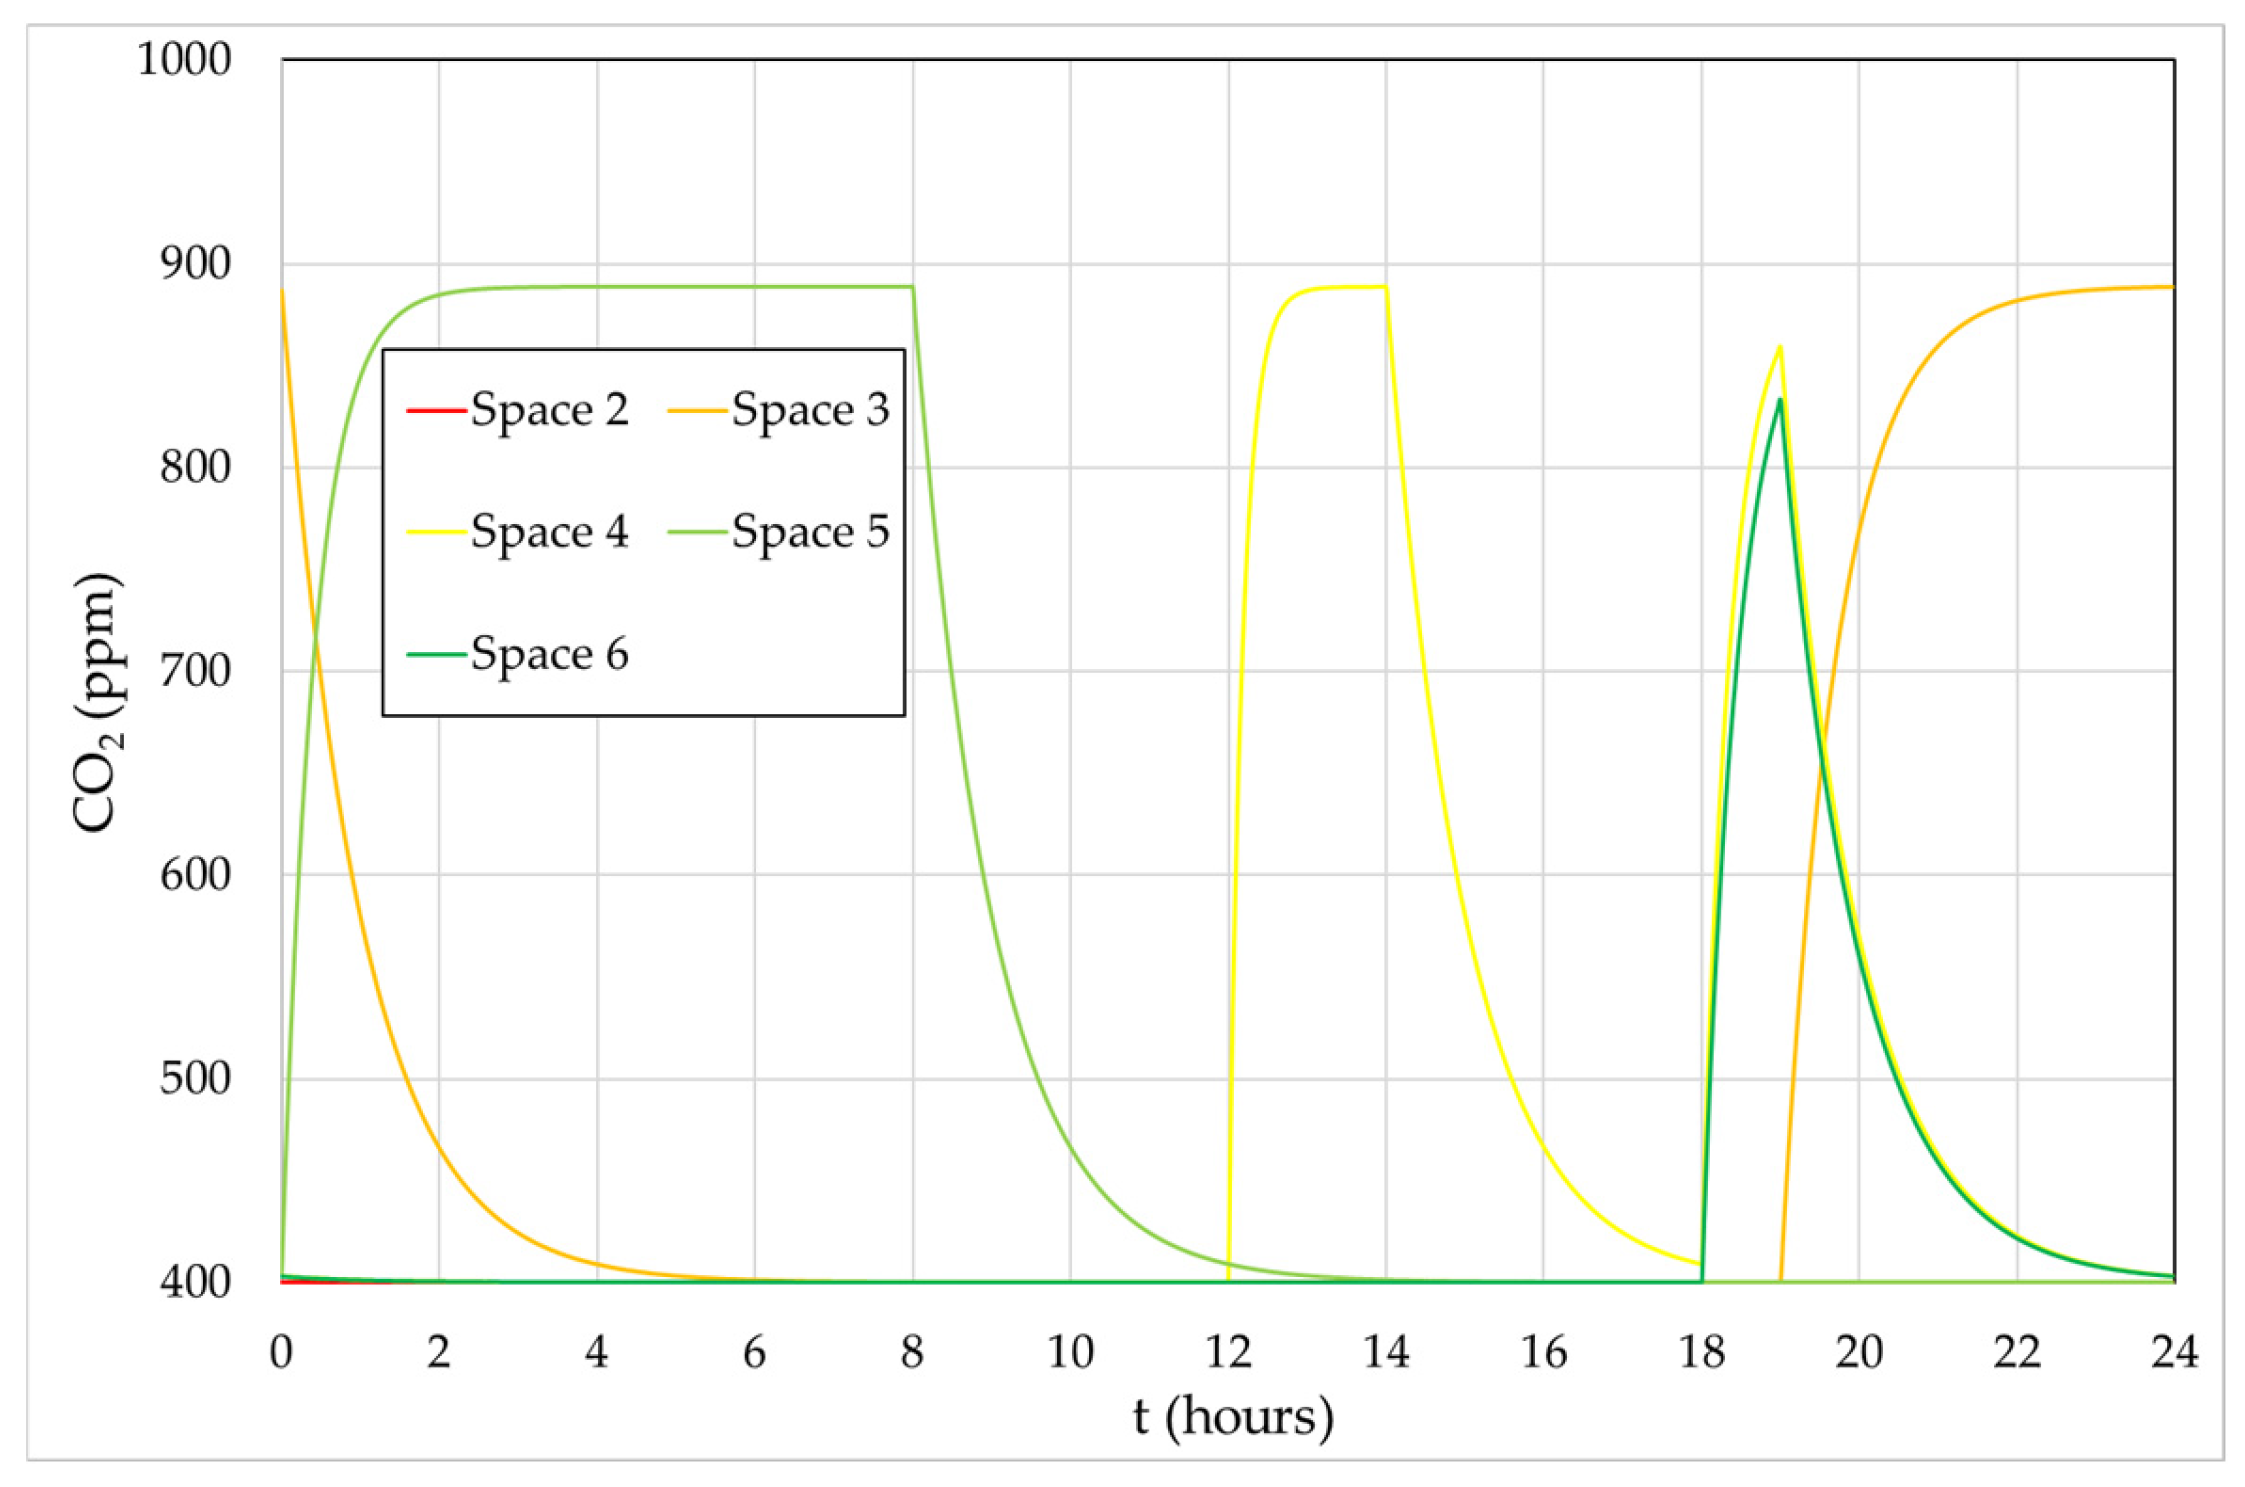
In this numerical study, the IAQ is evaluated by the CO2 concentration obtained within the spaces. The CO2 concentration is calculated assuming that the main source of pollution results from human respiration. In Figure 8, the evolution of the CO2 concentration inside spaces 2, 3, 4, 5 and 6 can be seen.
The results obtained from the CO2 concentration show that the IAQ achieved in the ground floor compartments of the residential building is acceptable, because they are below 1250 ppm, the limit proposed in Portuguese legislation [59], in line with the limits (1100–1250 ppm) proposed by international standards [54,55,56,57,58]. Therefore, it is verified that the ventilation applied is adequate. The CO2 concentration is higher when the compartment is occupied by two people, reaching a value of approximately 890 ppm, than when the compartment is occupied by one person, reaching a value of approximately 830 ppm. However, one must be aware that the evolution of the CO2 concentration also depends on the volume of the compartment.

6. Discussion

This study examined the thermal behavior of a residential building equipped with a heating system based on water solar collectors placed on the roof, supported by a water tank storage system, and thermo-convectors installed in occupied spaces. A comparative study was conducted considering the use of thermo-convectors, with control based on the PMV index, and the non-use of thermo-convectors. The use of this type of heating system substantially improves the level of thermal comfort. However, at the beginning and end of the day, due to lower levels of solar radiation, the heating level is lower. On the other hand, since the aim is to improve the level of thermal comfort in occupied indoor spaces, controlling the heating system through the PMV index allows simultaneously achieving the best thermal comfort conditions and directing energy consumption towards this goal, by better managing the stored heat potential.
This study was developed for a specific day of the year, the shortest day of the year, the one with the lowest levels of incident solar radiation considering the building’s location, corresponding to the Winter Solstice. The air temperature and relative humidity values are typical for this type of day. Therefore, this day tends to represent the most disadvantageous thermal conditions, both in terms of available solar radiation and the lowest air temperature levels, for the use of a heating system based on passive solar energy. On other winter days, this solar HVAC system will most likely offer better levels of thermal comfort for people inside the spaces. However, since this solar HVAC system strongly depends on direct solar radiation, on days when only diffuse solar radiation is available, it will not be as efficient.
In developing this type of HVAC system, it is very important to consider the insulation of the ducts and the use of the smallest possible dimensions due to the associated heat losses. On the other hand, the location of the thermo-convectors is crucial: they should be placed in the lower area of the compartments, due to the rising of hot air, and placed on walls as close as possible to the central area of the space (when possible). However, the geometry of the space and its applicability may condition the location of their installation.
In order to guarantee acceptable levels of IAQ, it is necessary to transport fresh air directly from the outside to the inside space. When occupied, this transport will be ensured through a duct system; otherwise, it will be dependent on air infiltration through windows and doors. The colder the external environment, the greater the thermal load to be considered.
The application of solar energy for heating the interior of buildings contributes to improving the thermal comfort level of occupants with reduced energy consumption. However, sometimes it may be necessary to use more than one source of energy simultaneously. For example, combined with the use of solar radiation, biomass could also be used, using firewood for heating [76], or geothermal energy, using heat pumps [26].
Other solar energy application solutions, such as those that use Dual-Skin Façades [77] or indoor greenhouses [78], can also improve the level of thermal comfort of occupants with low energy consumption. However, these types of ambient heating strategies are only useful in spaces that are close to the heat source, because hot air cannot be efficiently transported over long distances from that heat source. The solution presented in this work, using solar water collectors and thermo-convector heat exchangers, with water used in the transport, makes it possible to heat interior spaces, even those furthest from the heat source.
This study presents some limitations; namely, regarding the evaluation of the building’s thermal performance, the focus is solely on the winter season and a specific type of climate, and with regard to the evaluation of the IAQ, the focus is solely on one pollutant (CO2). Therefore, as perspectives for future work, it is intended to extend the evaluation of the thermal performance of this residential building to the summer and mid-seasons. This will allow for a more comprehensive understanding of thermal comfort, especially when the risk of overheating in summer is considered, and the effectiveness of passive strategies is questioned during the spring and autumn seasons. Furthermore, being a residential building, it is advisable to evaluate the impact of other pollutants, such as volatile organic compounds and particulate matter, among others, on the IAQ. It may also involve assessing the level of thermal comfort of occupants at specific locations (to avoid certain location errors) and evaluating the performance of this type of system in larger spaces, using more than one thermo-convector heat exchanger in each a space, by employing other numerical techniques such as Computational Fluid Dynamics.

7. Conclusions

In this numerical work, a solar HVAC system was developed consisting of water collectors installed on the roof of a residential building, heated by the incident solar radiation, coupled with a system of water-air thermo-convectors installed in the compartments of that building. The purpose of this system is to supply heated air to the compartments of a residential building in winter conditions, using a renewable solar energy source, thus improving the thermal comfort conditions of the occupants and obtaining a built environment more adapted to climate change.
In order to assess the performance of this solar HVAC system, the results obtained with its installation were compared with the results obtained without its presence. Note that this system only operates when there is solar radiation and that its operation is controlled by the PMV index values.
The main conclusions are the following:
  • During the day, the indoor air temperature and the PMV index in space 6 with a south-facing window are not affected by the use of the solar HVAC system as the entry of solar radiation into that space is sufficient to guarantee acceptable levels of thermal comfort.
  • During the day, the indoor air temperature and the PMV index in space 3 with a south-facing window are affected by the use of the solar HVAC system in the early morning and late afternoon, contributing to these periods to provide acceptable levels of thermal comfort. Between these two periods, the acceptable level of thermal comfort is due to the entry of solar radiation into this space.
  • During the day, the indoor air temperature values and the PMV index in spaces 2, 4 and 5 are positively affected by the use of the solar HVAC system, contributing to improving thermal comfort levels so that they are within acceptable levels between mid-morning and late afternoon.
  • During the night occupancy period, thermal comfort levels are close to the acceptable level due to negative values of the PMV index.
  • The use of the solar HVAC system allows for a reduction in CUH values of 55.0%, 85.7% and 18.8% in compartments 3, 4 and 5, respectively.
  • In general, in spaces with windows facing south (during the day), in occupied spaces (during the night), and in spaces where the solar HVAC system is on, the value of the indoor air temperature is higher than the value of the mean radiant temperature.
  • The proposed ventilation system provides an acceptable IAQ level.
For future work, it is proposed to study the thermal performance of buildings, both residential and other types, throughout the different seasons of the year: winter, summer, and mid-seasons. In winter, using internal greenhouse systems by utilizing internal spaces of the building with transparent surfaces exposed to solar radiation. In summer, using cooling systems based on geothermal energy and adjustable shading systems. In the mid-seasons, using passive construction solutions focusing on thermal insulation, and passive ventilation strategies. Regarding IAQ, the intention is to extend the study to the influence of other pollutants, such as volatile organic compounds and particulate matter, on the ventilation strategies to be implemented in buildings.

Author Contributions

Conceptualization, E.C., J.G., M.C., M.I.C., M.M.L. and H.A.; Methodology, E.C., J.G., M.C., M.I.C., M.M.L. and H.A.; Software, E.C., J.G., M.C., M.I.C., M.M.L. and H.A.; Writing—original draft, E.C., J.G., M.C., M.I.C., M.M.L. and H.A.; Writing—review & editing, E.C., J.G., M.C., M.I.C., M.M.L. and H.A.; Formal analysis, E.C., J.G., M.C., M.I.C., M.M.L. and H.A. All authors have read and agreed to the published version of the manuscript.

Funding

This research received no external funding.

Institutional Review Board Statement

Not applicable.

Informed Consent Statement

Not applicable.

Data Availability Statement

Data is contained within the article.

Acknowledgments

The authors would like to acknowledge the project (SAICT-ALG/39586/2018), DOI: https://doi.org/10.54499/SAICT-ALG/39586/2018, from the Algarve Regional Operational Program (CRESC Algarve 2020), under the PORTUGAL 2020 Partnership Agreement, through the European Regional Development Fund (ERDF) and the National Science and Technology Foundation (FCT). The authors also would like to acknowledge the project (UIDB/50022/2020), DOI: https://doi.org/10.54499/UIDB/50022/2020, under the National Science and Technology Foundation (FCT).

Conflicts of Interest

The authors declare no conflicts of interest.

References

  1. EU Commission and Parliament. Directive 2010/31/EU of the European Parliament and of the Council of 19 May 2010 on the Energy Performance of Buildings. Available online: http://eurlex.europa.eu/LexUriServ/LexUriServ.do?uri=OJ:L:2010:153:0013:0035:en:PDF (accessed on 28 December 2024).
  2. EU Commission and Parliament. Directive 2012/27/EU of the European Parliament and of the Council of 25 October 2012 on Energy Efficiency. Available online: http://eur-lex.europa.eu/legal-content/EN/TXT/PDF/?uri=CELEX:32012L0027&from=EN (accessed on 28 December 2024).
  3. Torriani, G.; Lamberti, G.; Fantozzi, F.; Babich, F. Exploring the impact of perceived control on thermal comfort and indoor air quality perception in schools. J. Build. Eng. 2023, 63, 105419. [Google Scholar] [CrossRef]
  4. Larsson, U.; Moshfegh, B. Comparison of ventilation performance of three different air supply devices: A measurement study. Int. J. Vent. 2017, 16, 244–254. [Google Scholar] [CrossRef]
  5. Krajčík, M.; Arıcı, M.; Ma, Z. Trends in research of heating, ventilation and air conditioning and hot water systems in building retrofits: Integration of review studies. J. Build. Eng. 2023, 76, 107426. [Google Scholar] [CrossRef]
  6. Aviv, D.; Chen, K.; Teitelbaum, E.; Sheppard, D.; Pantelic, J.; Rysanek, A.; Meggers, F. A fresh (air) look at ventilation for COVID-19: Estimating the global energy savings potential of coupling natural ventilation with novel radiant cooling strategies. Appl. Energy 2021, 292, 116848. [Google Scholar] [CrossRef]
  7. Cao, G.; Awbi, H.; Yao, R.; Fan, Y.; Sirén, K.; Kosonen, R.; Zhang, J. A review of the performance of different ventilation and airflow distribution systems in buildings. Build Environ. 2014, 73, 171–186. [Google Scholar] [CrossRef]
  8. Awbi, H. Ventilation of Buildings; Taylor & Francis: London, UK, 2003. [Google Scholar]
  9. Yin, H.; Li, A.; Liu, Z.; Chen, T. Experimental study on airflow characteristics of a square column attached ventilation mode. Build Environ. 2016, 109, 112–120. [Google Scholar] [CrossRef]
  10. Janbakhsh, S.; Moshfegh, B. Experimental study of a ventilation system based on wall confluent jets. Build Environ. 2014, 80, 18–31. [Google Scholar] [CrossRef]
  11. Shan, X.; Zhou, J.; Chang, W.; Yang, E. Comparing mixing and displacement ventilation in tutorial rooms: Students’ thermal comfort, sick building syndromes, and short-term performance. Build Environ. 2016, 102, 128–137. [Google Scholar] [CrossRef]
  12. Blázquez, T.; Ferrari, S.; Suárez, R.; Sendra, J. Adaptive approach-based assessment of a heritage residential complex in southern Spain for improving comfort and energy efficiency through passive strategies: A study based on a monitored flat. Energy 2019, 181, 504–520. [Google Scholar] [CrossRef]
  13. Wu, Z.; Shi, X.; Fang, F.; Wen, G.; Mi, Y. Co-optimization of building energy systems with renewable generations combining active and passive energy-saving. Appl. Energy 2023, 351, 121514. [Google Scholar] [CrossRef]
  14. Ascione, F. Energy conservation and renewable technologies for buildings to face the impact of the climate change and minimize the use of cooling. Sol. Energy 2017, 154, 34–100. [Google Scholar] [CrossRef]
  15. Del Amo, A.; Martínez-Gracia, A.; Bayod-Rújula, A.; Cañada, M. Performance analysis and experimental validation of a solar-assisted heat pump fed by photovoltaic-thermal collectors. Energy 2019, 169, 1214–1223. [Google Scholar] [CrossRef]
  16. Elaouzy, Y.; El Fadar, A.; Achkari, O. Building-integrated passive and renewable solar technologies: A review from 3E perspectives. Sustain. Energy Technol. Assess. 2024, 72, 104079. [Google Scholar] [CrossRef]
  17. Kalkan, N.; Young, E.; Celiktas, A. Solar thermal air conditioning technology reducing the footprint of solar thermal air conditioning. Renew. Sustain. Energy Rev. 2012, 16, 6352–6383. [Google Scholar] [CrossRef]
  18. Al-Alili, A.; Hwang, Y.; Radermacher, R. Review of solar thermal air conditioning technologies. Int. J. Refrig. 2014, 39, 4–22. [Google Scholar] [CrossRef]
  19. Aman, J.; Ting, D.; Henshaw, P. Residential solar air conditioning: Energy and exergy analyses of an ammonia-water absorption cooling system. Appl. Therm. Eng. 2014, 62, 424–432. [Google Scholar] [CrossRef]
  20. Behi, M.; Mirmohammadi, S.; Ghanbarpour, M.; Behi, H.; Palm, B. Evaluation of a novel solar driven sorption cooling/heating system integrated with PCM storage compartment. Energy 2018, 164, 449–464. [Google Scholar] [CrossRef]
  21. Ma, Z.; Ren, H.; Lin, W. A review of heating, ventilation and air conditioning technologies and innovations used in solar-powered net zero energy Solar Decathlon houses. J. Clean. Prod. 2019, 240, 118158. [Google Scholar] [CrossRef]
  22. Bataineh, K.; Taamneh, Y. Review and recent improvements of solar sorption cooling systems. Energy Build. 2016, 128, 22–37. [Google Scholar] [CrossRef]
  23. Ge, T.S.; Wang, R.Z.; Xu, Z.Y.; Pan, Q.W.; Du, S.; Chen, X.M.; Ma, T.; Wu, X.N.; Sun, X.L.; Chen, J.F. Solar heating and cooling: Present and future development. Renew. Energy 2018, 126, 1126–1140. [Google Scholar] [CrossRef]
  24. Shukla, R.; Sumathy, K.; Erickson, P.; Gong, J. Recent advances in the solar water heating systems: A review. Renew. Sustain. Energy Rev. 2013, 19, 173–190. [Google Scholar] [CrossRef]
  25. Jaisankar, S.; Ananth, J.; Thulasi, S.; Jayasuthakar, S.T.; Sheeba, K.N. A comprehensive review on solar water heaters. Renew. Sustain. Energy Rev. 2011, 15, 3045–3050. [Google Scholar] [CrossRef]
  26. Fan, Y.; Zhao, X.; Han, Z.; Li, J.; Badiei, A.; Akhlaghi, Y.G.; Liu, Z. Scientific and technological progress and future perspectives of the solar assisted heat pump (SAHP) system. Energy 2021, 229, 120719. [Google Scholar] [CrossRef]
  27. Buker, M.S.; Riffat, S.F. Solar assisted heat pump systems for low temperature water heating applications: A systematic review. Renew. Sustain. Energy Rev. 2016, 55, 399–413. [Google Scholar] [CrossRef]
  28. Vengadesan, E.; Bharathwaj, D.; Kumar, B.; Senthil, R. Experimental study on heat storage integrated flat plate solar collector for combined water and air heating in buildings. Appl. Therm. Eng. 2022, 243, 122598. [Google Scholar] [CrossRef]
  29. Yoo, M. Optimal Design and Parameter Estimation for Small Solar Heating and Cooling Systems. Sustainability 2023, 15, 16352. [Google Scholar] [CrossRef]
  30. Yang, B.; Wang, C.; Ji, X.; Nie, J.; Zhang, R.; Li, Y.; Chen, Q. A solar-assisted regenerative desiccant air conditioning with indirect evaporative cooling for humid climate region. Appl. Therm. Eng. 2024, 243, 122598. [Google Scholar] [CrossRef]
  31. Yin, N.; Chang, R.; Wei, H.; Wei, B. Thermal performance of plate type solar Air/Water composite collector study. Sol. Energy 2025, 216, 119105. [Google Scholar] [CrossRef]
  32. Fong, K.; Lee, C.; Lin, Z. Investigation on effect of indoor air distribution strategy on solar air-conditioning systems. Renew. Energy 2019, 131, 413–421. [Google Scholar] [CrossRef]
  33. Anand, S.; Gupta, A.; Tyagi, S. Solar cooling systems for climate change mitigation: A review. Renew. Sustain. Energy Rev. 2015, 41, 143–161. [Google Scholar] [CrossRef]
  34. Castillo-González, J.; Comino, F.; Navas-Martos, F.; Ruiz de Adana, M. Life cycle assessment of an experimental solar HVAC system and a conventional HVAC system. Energy Build. 2022, 256, 111697. [Google Scholar] [CrossRef]
  35. Dezfouli, M.; Dehghani-Sanij, A.; Kadir, K.; Sopian, K. Development and life cycle cost analysis of a solar hybrid HVAC system for use in buildings in tropical climates. Sustain. Energy Technol. Assess. 2023, 57, 103143. [Google Scholar] [CrossRef]
  36. Rashid, F.L.; Eleiwi, M.A.; Mohammed, H.I.; Ameen, A.; Ahmad, S. A Review of Using Solar Energy for Cooling Systems: Applications, Challenges, and Effects. Energies 2023, 16, 8075. [Google Scholar] [CrossRef]
  37. Ibrahim, N.; Yahiaoui, A.; Garkuwa, J.; Mansour, R.; Rehman, S. Solar cooling with absorption chillers, thermal energy storage, and control strategies: A review. J. Energy Storage 2024, 97, 112762. [Google Scholar] [CrossRef]
  38. Ma, Y.; Deng, D.; Tao, Y.; Du, Q.; Wang, Y.; Cheng, Y.; Tu, J. Experimental analysis of a solar-driven modular latent heat storage system for ventilation air heating under real and dynamic meteorological conditions. Energy Build. 2026, 350, 116674. [Google Scholar] [CrossRef]
  39. ANSI/ASHRAE Standard-55; Thermal Environmental Conditions for Human Occupancy. American Society of Heating, Refrigerating and Air-Conditioning Engineers: Atlanta, GA, USA, 2023.
  40. ISO 7730:2025; Ergonomics of the Thermal Environment Analytical Determination and Interpretation of Thermal Comfort Using Calculation of the PMV and PPD Indices and Local Thermal Comfort Criteria. ISO: Geneva, Switzerland, 2025.
  41. Fanger, P. Thermal Comfort: Analysis and Applications in Environmental Engineering; Danish Technical Press: Copenhagen, Denmark, 1970. [Google Scholar]
  42. Park, J.; Choi, H.; Kim, D.; Kim, T. Development of novel PMV-based HVAC control strategies using a mean radiant temperature prediction model by machine learning in Kuwaiti climate. Build. Environ. 2021, 206, 108357. [Google Scholar] [CrossRef]
  43. Faraji, A.; Rashidi, M.; Rezaei, F.; Rahnamayiezekavat, P. A Meta-Synthesis Review of Occupant Comfort Assessment in Buildings (2002–2022). Sustainability 2023, 15, 4303. [Google Scholar] [CrossRef]
  44. Khechiba, A.; Djaghrouri, D.; Benabbas, M.; Leccese, F.; Rocca, M.; Salvadori, G. Balancing Thermal Comfort and Energy Consumption in Residential Buildings of Desert Areas: Impact of Passive Strategies. Sustainability 2023, 15, 8383. [Google Scholar] [CrossRef]
  45. Choi, E.; Yun, J.; Choi, Y.; Seo, M.; Moon, J. Impact of thermal control by real-time PMV using estimated occupants personal factors of metabolic rate and clothing insulation. Energy Build. 2024, 307, 113976. [Google Scholar] [CrossRef]
  46. d’Ambrosio Alfano, F.R.; Palella, B.I.; Riccio, G. The role of measurement accuracy on the thermal environment assessment by means of PMV index. Build. Environ. 2011, 46, 1361–1369. [Google Scholar] [CrossRef]
  47. Gallardo, A.; Palme, M.; Lobato-Cordero, A.; Beltrán, R.D.; Gaona, G. Evaluating Thermal Comfort in a Naturally Conditioned Office in a Temperate Climate Zone. Buildings 2016, 6, 27. [Google Scholar] [CrossRef]
  48. Ricciu, R.; Galatioto, A.; Desogus, G.; Besalduch, L. Uncertainty in the evaluation of the Predicted Mean Vote index using Monte Carlo analysis. J. Environ. Manag. 2018, 223, 16–22. [Google Scholar] [CrossRef] [PubMed]
  49. Tartarini, F.; Schiavon, S. Comparative analysis of PMV Models accuracy implemented in the ISO 7730:2005 and ASHRAE 55:2023. Build. Environ. 2025, 275, 112766. [Google Scholar] [CrossRef]
  50. d’Ambrosio Alfano, F.R.; Olesen, B.W.; Palella, B.I.; Pepe, D.; Riccio, G. Fifty Years of PMV Model: Reliability, Implementation and Design of Software for Its Calculation. Atmosphere 2020, 11, 49. [Google Scholar] [CrossRef]
  51. Tam, C.; Zhao, Y.; Liao, Z.; Zhao, L. Mitigation Strategies for Overheating and High Carbon Dioxide Concentration within Institutional Buildings: A Case Study in Toronto, Canada. Buildings 2020, 10, 124. [Google Scholar] [CrossRef]
  52. Hattori, S.; Iwamatsu, T.; Miura, T.; Tsutsumi, F.; Tanaka, N. Investigation of Indoor Air Quality in Residential Buildings by Measuring CO2 Concentration and a Questionnaire Survey. Sensors 2022, 22, 7331. [Google Scholar] [CrossRef]
  53. Pei, G.; Freihaut, J.; Rim, D. Long-term application of low-cost sensors for monitoring indoor air quality and particle dynamics in a commercial building. J. Build. Eng. 2023, 79, 107774. [Google Scholar] [CrossRef]
  54. ANSI/ASHRAE Standard 62-1; Ventilation for Acceptable Indoor Air Quality. American Society of Heating, Refrigerating and Air-Conditioning Engineers: Atlanta, GA, USA, 2022.
  55. ISO 17772-1:2017; Energy Performance of Buildings—Indoor Environmental Quality—Part 1: Indoor Environmental Input Parameters for the Design and Assessment of Energy Performance of Buildings. ISO: Geneva, Switzerland, 2017.
  56. ISO/TR 17772-2; Energy Performance of Buildings—Overall Energy Performance Assessment Procedures—Part 2: Guideline for Using Indoor Environmental Input Parameters for the Design and Assessment of Energy Performance of Buildings (Technical Report). ISO: Geneva, Switzerland, 2018.
  57. EN 16798-1; Energy Performance of Buildings—Ventilation for Buildings—Part 1: Indoor Environmental Input Parameters for Design and Assessment of Energy Performance of Buildings Addressing Indoor Air Quality, Thermal Environment, Lighting and Acoustics—Module M1-6. CEN: Brussels, Belgium, 2019.
  58. DS/CEN/TR 16798-2:2019; Energy Performance of Buildings—Ventilation for Buildings—Part 2: Interpretation of the Requirements in EN 16798-1—Indoor Environmental Input Parameters for Design and Assessment of Energy Performance of Buildings Addressing Indoor Air Quality, Thermal Environment, Lighting and Acoustics (Module M1-6). Danish Standard Association: Nordhavn, Denmark, 2019.
  59. Portaria 353-A/2013; Regulamento de Desempenho Energético dos Edifícios de Comércio e Serviços (RECS)—Requisitos de Ventilação e Qualidade do Ar Interior—Portaria no 353-A/2013 de 4 de Dezembro. 2013. 1ª série 245. 6644-(2)–6644-(9). Diário República: Lisboa, Portugal, 2013. (In Portuguese)
  60. Khovalyg, D.; Kazanci, O.; Halvorsen, H.; Gundlach, I.; Bahnfleth, W.; Toftum, J.; Olesen, B. Critical review of standards for indoor thermal environment and air quality. Energy Build. 2020, 213, 10819. [Google Scholar] [CrossRef]
  61. Conceição, E.; Silva, A.; Lúcio, M. Numerical study of thermal response of school buildings in winter conditions. In Proceedings of the 9th Conference on Air Distribution in Rooms (Roomvent 2004), Coimbra, Portugal, 5–8 September 2004. [Google Scholar]
  62. Conceição, E.; Lúcio, M. Numerical study of thermal response of school buildings in summer conditions. In Proceedings of the 8th International Conference and Exhibition on Healthy Buildings (HB 2006), Lisbon, Portugal, 4–8 June 2006. [Google Scholar]
  63. Conceição, E.Z.E.; Lúcio, M.M.J.R. Numerical Simulation of the Application of Solar Radiant Systems, Internal Airflow and Occupants’ Presence in the Improvement of Comfort in Winter Conditions. Buildings 2016, 6, 38. [Google Scholar] [CrossRef]
  64. Conceição, E.; Lúcio, M. Air Quality Inside a School Building: Air Exchange Monitoring, Evolution of Carbon Dioxide and Assessment of Ventilation Strategies. Int. J. Vent. 2006, 5, 259–270. [Google Scholar] [CrossRef]
  65. Conceição, E.; Lúcio, M. Numerical Simulation of Passive and Active Solar Strategies in Buildings with Complex Topology. Build. Simul. 2010, 3, 245–261. [Google Scholar] [CrossRef]
  66. Conceição, E.; Gomes, J.; Awbi, H. Influence of the Airflow in a Solar Passive Building on the Indoor Air Quality and Thermal Comfort Levels. Atmosphere 2019, 10, 766. [Google Scholar] [CrossRef]
  67. Fawwaz Alrebei, O.; Obeidat, L.M.; Ma’bdeh, S.N.; Kaouri, K.; Al-Radaideh, T.; Amhamed, A.I. Window-Windcatcher for Enhanced Thermal Comfort, Natural Ventilation and Reduced COVID-19 Transmission. Buildings 2022, 12, 791. [Google Scholar] [CrossRef]
  68. Zhang, C.; Yu, Z.; Zhu, Q.; Shi, H.; Yu, Z.; Xu, X. Air-Permeable Building Envelopes for Building Ventilation and Heat Recovery: Research Progress and Future Perspectives. Buildings 2024, 14, 42. [Google Scholar] [CrossRef]
  69. Huang, C.; Sun, Y.; Wang, H.; Pang, M.; Wang, W.; Wei, W. Thermal performance analysis and optimization of air-supported membrane building envelope based on numerical simulation. Thin-Walled Struct. 2025, 206, 112615. [Google Scholar] [CrossRef]
  70. Conceição, E.; Gomes, J.; Ruano, A. Application of HVAC systems with control based on PMV index in university buildings with complex topology. IFAC PapersOnLine 2018, 51, 20–25. [Google Scholar] [CrossRef]
  71. Alfano, F.; Pepe, D.; Riccio, G.; Vio, M.; Palella, B. On the effects of the mean radiant temperature evaluation in the assessment of thermal comfort by dynamic energy simulation tools. Build. Environ. 2023, 236, 110254. [Google Scholar] [CrossRef]
  72. Lee, D.; Jo, J. Measuring and implementing mean radiant temperature in buildings: Technical review. Renew. Sustain. Energy Rev. 2025, 207, 114908. [Google Scholar] [CrossRef]
  73. d’Ambrosio Alfano, F.R.; Olesen, B.W.; Pepe, D.; Palella, B.I. Working with Different Building Energy Performance Tools: From Input Data to Energy and Indoor Temperature Predictions. Energies 2023, 16, 743. [Google Scholar] [CrossRef]
  74. Olesen, B.; Parsons, K. Introduction to thermal comfort standards and to the proposed new version of EN ISO 7730. Energy Build. 2002, 34, 537–548. [Google Scholar] [CrossRef]
  75. Van der Linden, K.; Boerstra, A.; Raue, A.; Kurvers, S. Thermal indoor climate building performance characterized by human comfort response. Energy Build. 2002, 34, 737–744. [Google Scholar] [CrossRef]
  76. Singh, G.; Das, R. Experimental study of a combined biomass and solar energy-based fully grid-independent air-conditioning system. Clean Technol. Environ. Policy 2021, 23, 1889–1912. [Google Scholar] [CrossRef]
  77. Alkhatib, H.; O’Neill, N.; Norton, B. Month-by-month prioritization of heating and ventilation from an adaptive mechanically-ventilated double-skin façade. Energy Rep. 2025, 14, 2627–2641. [Google Scholar] [CrossRef]
  78. Conceição, E.; Gomes, J.; Conceição, M.I.; Conceição, M.; Lúcio, M.M.; Awbi, H. Application of Indoor Greenhouses in the Production of Thermal Energy in Circular Buildings. Energies 2025, 18, 3962. [Google Scholar] [CrossRef]
Figure 1. Geometry of the residential building. Its main façade faces south.
Atmosphere 17 00211 g001
Figure 2. Numbering of spaces located on the ground floor of the residential building.
Atmosphere 17 00211 g002
Figure 3. Solar HVAC system: (a) Solar water collectors installed on the roof; (b) solar water collectors and detail of the circuit in the attic and first floor; (c) detail of the circuit in the attic and first floor; (d) details of the circuit on the first floor and inside the compartments; (e) details of entire circuit; (f) details of circuit in the attic; (g) details of circuit inside the compartments.
Atmosphere 17 00211 g003aAtmosphere 17 00211 g003bAtmosphere 17 00211 g003cAtmosphere 17 00211 g003d
Figure 4. Evolution of ta: (a) solar HVAC system off; (b) solar HVAC system on.
Atmosphere 17 00211 g004
Figure 5. Evolution of tr: (a) solar HVAC system off; (b) solar HVAC system on.
Atmosphere 17 00211 g005
Figure 6. Evolution of ta–tr: (a) solar HVAC system off; (b) solar HVAC system on.
Atmosphere 17 00211 g006
Figure 7. Evolution of PMV index: (a) solar HVAC system off; (b) solar HVAC system on. The area shaded in light gray corresponds to the thermal comfort zone according to category C [45].
Atmosphere 17 00211 g007
Figure 8. Evolution of CO2 in the spaces located on the ground floor of the residential building.
Atmosphere 17 00211 g008
Table 1. Occupancy cycle.
Space NumberTime Period (Hours)
0:00–8:008:00–12:0012:00–14:0014:00–18:0018:00–19:0019:00–24:00
3000002
4002010
5200000
6000010
Table 2. Uncomfortable hours due to heat (WUH) and cold (CUH).
Compartment23456
Solar HVAC system offWUH00000
CUH03.425.8615.330
Solar HVAC system onWUH00000
CUH01.540.8412.450
Disclaimer/Publisher’s Note: The statements, opinions and data contained in all publications are solely those of the individual author(s) and contributor(s) and not of MDPI and/or the editor(s). MDPI and/or the editor(s) disclaim responsibility for any injury to people or property resulting from any ideas, methods, instructions or products referred to in the content.