Abstract
The indoor climate quality in classrooms at the University of Coimbra, Portugal, was investigated as part of the 3SqAir project, supported by the Interreg SUDOE program. This research focused on two equipped classrooms with different ventilation systems: natural and mechanical ventilation. Both classrooms were continuously monitored for IEQ parameters: thermal comfort, indoor air quality, noise, and lighting during heating and cooling seasons. Air temperature, relative humidity, CO2 concentration, particulate matter, nitrogen dioxide, volatile organic compounds, formaldehyde, sound pressure level, and illuminance were measured. Outdoor weather conditions were also recorded. The primary focus was on air temperature, CO2 concentrations, and relative humidity, while air change rates (ACH) were estimated using the Tracer Gas Method. The results showed inadequate thermal conditions in both classrooms, particularly during the heating season. Most weekly mean CO2 concentrations were within acceptable limits, while ACH were below standard recommendations in four CO2 decay phases. Simulations of CO2 decay revealed further air quality gaps in each room. Corrective measures within the 3SqAir project framework were suggested for approval and implementation while monitoring continues. This work represents the first phase in an evolving study towards developing sustainable strategies for improving indoor air quality in classrooms.
1. Introduction
1.1. IAQ and Its Relevance in School Buildings (SBs)
Indoor air quality (IAQ) is a key parameter in evaluating indoor environmental quality (IEQ), together with thermal comfort, visual comfort, and acoustic comfort [1,2]. IEQ assessments have been carried out in different built environments like office buildings [3,4], hospital buildings [5,6], shopping malls/nonresidential buildings/commercial buildings [7], including transport cabins [8,9,10,11,12], with suggestions and recommendations on improving IAQ including adequate ventilation strategies. Several studies have been conducted on IAQ in school buildings (SBs) and their impact on students’ health, performance, or comfort [13,14,15,16] while assessing other IEQ parameters; their main goal centered around occupants’ health and well-being by improving IAQ conditions. Air quality can directly or indirectly affect public health, as highlighted by Tham [17] in a reflective review conducted between 1986 and 2016. The study reiterates concerns about indoor air pollution and how contaminants interact and contribute to accentuating adverse effects on humans in different built environments. This is particularly critical for built environments with high population density for long hours, such as offices, buses, school buildings, etc. SBs are important indoor spaces for pupils/students: in terms of occupancy duration, they rank second, only next to their homes [18]. This is because they spend an extended period within the SB, interacting with other students and teachers while taking classes. SBs and other educational facilities, where students converge for educational purposes, are commonly crowded spaces. SBs include kindergartens, with young children whose immune systems are still developing [19], primary schools, secondary schools, and tertiary schools, with young adults. The age range and vulnerability category in SBs underscore the importance of evaluating their indoor conditions.
Over the past 20 years, several EU projects on IEQ in SBs have been carried out to monitor, analyze, identify, and address possible challenges that impact students’ health and performance. The European Indoor Air Monitoring and Exposure Assessment project (AIRMEX) is one of the many EU projects. It was conducted to evaluate the relationship between indoor air pollutants and chronic human exposure to these pollutants, especially in public buildings, including schools, across different locations [20,21]. This study focused on high-density public buildings, especially locations with a high frequency of children. SBs in eleven European cities were monitored indoors and outdoors as they fit these requirements. The goal was to identify and quantify principal air pollutants in public buildings [22] while focusing on a few chemical families. Their results indicated that personal exposure concentration was either higher or similar to the indoor air pollution values. Also, both personal exposure and indoor pollution values were found to be higher than outdoor pollution values for the study chemicals. The SEARCH project, School Environment and Respiratory Health of Children project, is another project that prioritized air quality and children’s health [23]. The pan-European SEARCH II project, the second phase of the SEARCH initiative, which included countries like Belarus, Kazakhstan, Tajikistan, and Ukraine, was developed to expand the monitoring of children’s health and air quality and to assess energy use in selected schools in 10 countries. They identified key sources of indoor air pollutants in the classrooms and made recommendations such as the siting of SBs away from places directly impacted by heavy traffic or industry; the use of appropriate ventilation regimes; the use of water-resistant paints in classrooms; and the avoidance of crowdedness in classrooms [23]. The Schools Indoor Pollution and Health- Observatory Network project (SINPHONIE) [24] was also conducted in schools. The SINPHONIE project aimed to improve air quality in school buildings and kindergartens, deploying steps to reduce the risk and burden of respiratory disease in children and teachers from both outdoor and indoor pollution through recommendations, policy actions, risk management options, etc. Studies were conducted in 54 cities across 23 countries to monitor and collect data on the distribution of indoor air pollutants and thermal parameters to determine their association with some health symptoms in the occupants [25]. The initial results, pending further confirmation, indicated an association between indoor air pollutants in SBs and health problems in children. The INAIR project titled “Transnational Adaption Actions for Integrated Indoor Air Quality Management” was conducted between 2016 and 2019 in 64 primary SBs across Hungary, Italy, Slovenia, the Czech Republic, Poland, etc. The project aimed to assess the impact of IAQ on vulnerable school children and to seek to improve the health of the school environment through policy development and practical actions to reduce the adverse effects of poor IAQ [26,27]. The results showed that Particulate Matter 2.5 (PM2.5), radon, formaldehyde, and carbon dioxide (CO2) in the classrooms are the air pollutants of most concern due to their concentration levels. It also highlighted the need to reduce the concentration of air pollutants like benzene, acetaldehyde, and ethylbenzene [14]. Other studies have highlighted the impact of IEQ on students’ learning outcomes. A recent review by Toyinbo 2023 [28] appraised the importance of IEQ to pupils and how poor IEQ impacts learning outcomes. Another study in Finnish elementary schools showed the association between ventilation rate and learning outcomes, and the influence of the ventilation type in use and ventilation rate in classrooms. They were able to associate lower test results in mathematics in schools with poor ventilation rates [29].
1.2. The 3SqAir Project
The present study is an outcome of the 3SqAir project [30] “Sustainable Smart Strategy for Air Quality Assurance in Classrooms”. The project was funded and conducted within the Interreg Sudoe program. The project was carried out with six pilots located in Spain, France, and Portugal. The pilots included SBs with different educational levels, identified as demo sites 1–6. All demo sites presented good diversity both in geographical locations and teaching cycles. In Spain, the CIFP Usurbil LHII—Usurbilgo Lanbide Eskola in Usurbil- Gipuzkoa served as demo site 1, while the Donostia School of Architecture at the University of the Basque Country in Donostia-San Sebastián was designated as demo site 2. In France, demo sites 3 and 4 were represented by the Université Toulouse III- Paul Sabatier and the College Gérard Philipe, respectively. In Portugal, demo site 5 was the Instituto Superior Técnico (IST) Alameda Campus in Lisbon, and demo site 6 was the Department of Mechanical Engineering at the University of Coimbra, Polo II campus.
At the Department of Mechanical Engineering (DEM-FCTUC), three specific locations were monitored: a naturally ventilated room (6.3), a mechanically ventilated room (3.3), and a corridor. This diverse selection of pilot sites ensured a comprehensive examination of indoor air quality across different educational environments and ventilation systems. The study conducted in demo site 6, DEM-FCTUC, in rooms 6.3 and 3.3 alone is explored in the presented work. It evaluates the data obtained during the school year 2022 and 2023. The results obtained are presented for heating and cooling seasons to describe each room’s thermal and air quality conditions for regular teaching periods and non-teaching periods (school breaks, exams, Christmas, and summer breaks). Indoor climate quality (ICQ) gaps are identified, and recommendations within the framework of the 3SqAir project are suggested for implementation.
1.3. Research Novelty and Article Structure
This study contributes to the existing body of knowledge on IAQ in educational settings by providing a comprehensive analysis of both naturally and mechanically ventilated classrooms in a university environment. Unlike previous studies that often focused on primary or secondary schools, this research offers insights into IAQ conditions in higher education facilities. Furthermore, the continuous monitoring approach used in this study allows for a more nuanced understanding of IAQ variations across different seasons and occupancy patterns. Finally, the study offers practical corrective measures that are implementable to improve indoor climate conditions. Section 2 describes the materials and methods used in the study, including a detailed description of the 3SqAir project and the case study location. Section 3 presents the monitoring results, focusing on thermal comfort parameters and CO2 levels. Section 3 also discusses the implications of these findings and suggests potential corrective measures. Finally, Section 4 concludes the study and outlines future research directions within the framework of the 3SqAir project.
2. Materials and Methods
2.1. 3SqAir Description
The 3SqAir project, which spanned about 30 months, started in November 2020 amidst the COVID-19 pandemic [31]. This global health crisis has further emphasized the importance of adequate IAQ in the built environment [32,33]. The main objective of the 3SqAir project was to develop a common strategy to ensure optimal IAQ in educational buildings, implementing innovative, sustainable, and intelligent solutions, including passive and active IAQ teams, low-carbon technologies, and automatic and manual actions that included changes in human behavior. To implement these objectives, the project utilized the Research and Innovation Strategies for Smart Specialization strategy (RIS3), which helped promote smart specialization and competitiveness at regional, national, and transnational levels through collaborative networking between R&D centers, enterprises, decision-making bodies, and higher education. The intelligent solutions designed to improve the IAQ included efficient equipment to reduce emissions, collaborative platforms for smart energy management, recommendations to minimize polluting components in classrooms, and tools to engage end-users. The results of pilot studies carried out in partner countries ensured the creation of new networks of experts. The dissemination of good practices also increased the support of stakeholders, leading to the development of a common action plan to ensure IAQ in SUDOE classrooms.
2.1.1. 3SqAir Specific Objectives
To achieve the primary goal of developing a common strategy for ensuring optimal IAQ in classrooms, the 3SqAir project outlined the following specific objectives:
- Design an intelligent and sustainable strategy that guarantees classroom air quality to promote smart solutions and change students’ and teachers’ behavior. The aim is to improve IAQ, emissions, and energy efficiency in the SUDOE space’s classrooms.
- Ensure intelligent classroom management, measurement, and visualization of IAQ using open-source and open-hardware tools.
- Demonstrate the impact of improving classroom air quality on students’ performance and SBs’ energy efficiency.
2.1.2. Demo Sites
The 3SqAir project selected six diverse demo sites across Spain, France, and Portugal to implement and evaluate the proposed strategies. These sites represent various educational levels, building types, and geographical locations, providing a comprehensive view of IAQ challenges in different settings.
- Spain: Demo site 1—CIFP Usurbil LHII—Usurbilgo Lanbide Eskola is a Vocational School built in 1989 with six buildings over 6550 m2. Two rooms were monitored at CIFP Usurbil LHII—Usurbilgo Lanbide Eskola. Demo site 2—Donostia School of Architecture is a university building built in 1992. It has a total covered area of 4620 m2. Two rooms were monitored in demo site 2.
- France: Demo site 3—Université Toulouse III—Paul Sabatier, built in 1969. Two classrooms in two buildings on the university campus were monitored. Demo site 4—College Gerard Philipe is a high education building constructed in the 1970s, with renovation work completed in 2008. It has a total functional area of 7800 m2, eight buildings, and eight monitored areas.
- Portugal: Demo site 5—Instituto Superior Técnico—Campus da Alameda was constructed in 1980 and has a total covered area of 26,900 m2. The monitored areas were a civil pavilion building and a Kindergarten. Demo site 6—Department of Mechanical Engineering at the Polo II campus of the University of Coimbra was constructed in 1995 and has a covered area of 7000 m2. A corridor and two classrooms were monitored areas.
2.2. Case Study Presentation
DEM-FCTUC, located at the Polo II engineering campus of the University of Coimbra, serves as demo site 6 for this study. Constructed in 1995, the building spans about 7000 m2 and houses classrooms, offices, meeting rooms, laboratories, administrative rooms, a library, and a cafeteria. The facility accommodates about 1000 students, 60 teachers, and 10 administrative and nontechnical workers. The red arrow indicates the building where the investitated took place as shown in (Figure 1).
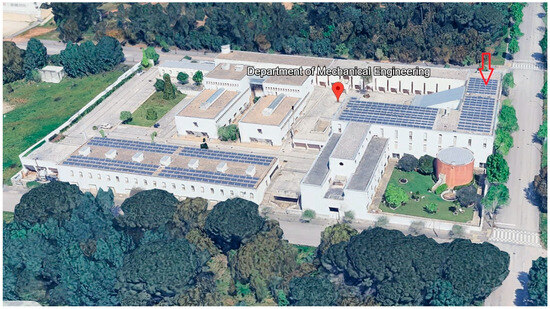
Figure 1.
DEM-FCTUC aerial view–the arrow points at the studied rooms’ locations.
Three areas were selected for monitoring within the Mechanical Engineering Department’s didactic block (Figure 2, Figure 3, Figure 4 and Figure 5): Room 6.3, Room 3.3, and a corridor. Room 6.3 is a naturally ventilated classroom, with no fan, measuring 6m by 10 m and covering a total area of 60 m2. It features four east-facing windows with a total glazed area of 10 m2. The room is heated by warm-water radiators connected to a centralized natural gas boiler.
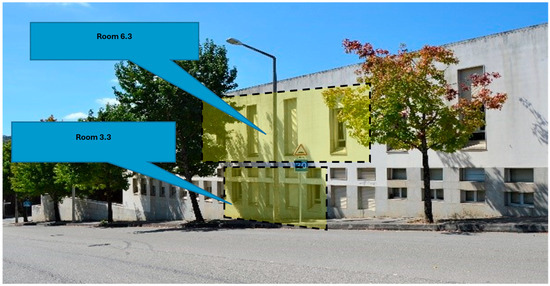
Figure 2.
External façade (East oriented) of the two monitored classrooms.
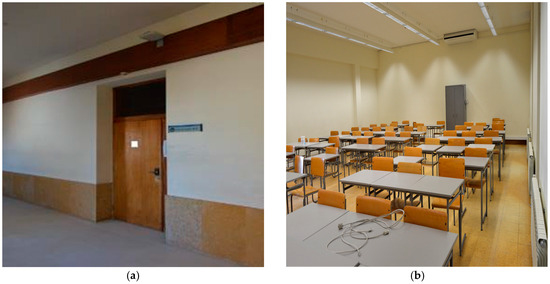
Figure 3.
Room 6.3 (a) General view of the entrance. (b) Internal view of the monitored room 6.3.
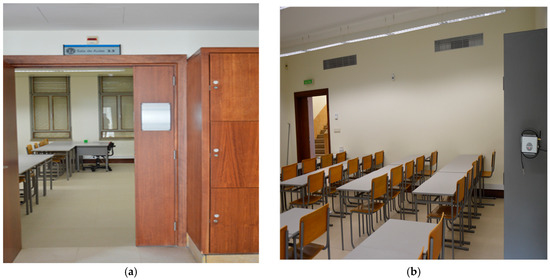
Figure 4.
Room 3.3 (a) General view of the entrance. (b) Internal view of the monitored room 3.3.
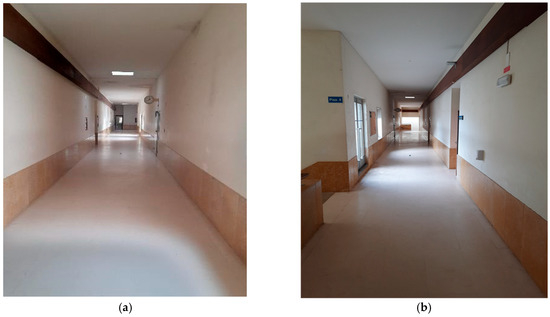
Figure 5.
Corridor (a,b) views of the monitored corridor, access to classrooms in the didactic block, including room 6.3.
Room 3.3 is also a classroom on the ground floor of the didactic block, measuring 6.5 m by 6.5 m, with an area of 42 m2. This classroom also has east-facing windows and is equipped with a mechanically ventilated all-air HVAC system. The entrance door faces west into a corridor that allows for direct interaction with outdoor conditions. It has a total glazed area of 8 m2.
The monitored corridor is on the first floor, adjacent to room 6.3. It has an outdoor performance. It was decided to monitor this corridor for its semi-outdoor characteristics, which enable it to provide valuable information about external climate conditions without being directly influenced by sunlight, wind, or rain (Figure 5). This diverse selection of monitoring locations within DEM-FCTUC allowed for a comprehensive assessment of IAQ under varying ventilation conditions within the SB.
2.3. Methods
The study employed a mixed-methods approach, combining subjective and objective methods to assess IAQ. A survey was used to sample occupants’ perceptions, while objective monitoring and data collection were carried out in Building 1 of the didactic block at DEM-FCTUC. To analyze the IAQ, the concentrations of the following contaminants were measured including carbon dioxide (CO2), volatile organic compounds (VOC), formaldehyde, nitrogen dioxide (NO2), and particulate matter (PM10, PM4, PM2.5, and PM1). Air temperature (Ta) and relative humidity (RH) were also measured to assess the thermal environment. Sound pressure and illuminance were also measured to characterize the acoustic and visual indoor conditions. All IEQ parameters were sampled using a 10 min time step. The collected data were recorded, saved in the cloud, and accessed via a web platform. During this process, outdoor weather conditions such as air temperature, wind direction and speed, relative humidity, precipitation, and solar radiation were monitored by a meteorological station locally installed at the DEM-FCTUC premises [34].
2.3.1. Monitoring Systems
Two types of monitoring devices were used for the IEQ assessment. The first device is the Catie IEQ station box, developed by CATIE (Centre Aquitain des Technologies de l’Information et Electroniques, Talence, France), a project partner. As shown in Figure 6a, the Catie station box was equipped with sensors, electronic cards with microcontrollers, and a radio interface, all encased in a rugged external box casing. It features a Zest_sensor_P-T-RH to measure air temperature (Ta), atmospheric pressure, and relative humidity (RH). This sensor integrates an external 1-wire temperature sensor through a J4 connector and controls an external fan through a microcontroller. Data are exchanged between the sensors using the inter-integrated circuit bus via specific addresses 0 × 48, 0 × 40, and 0 × 70 for Ta, RH, and atmospheric pressure, respectively. The Catie IEQ station operates on a 12V power source, which is stepped down to 3.3 V by an ADP7118 low-dropout voltage regulator. Also, it includes a Zest_sensor_CO2 for measuring CO2 concentration and a Zest_sensor_Dust for detecting particulate matter (PM). Four Catie boxes were deployed at DEM-FCTUC, labeled Measurement System (Meas. Sys.) 5, 6, 7, and 8.
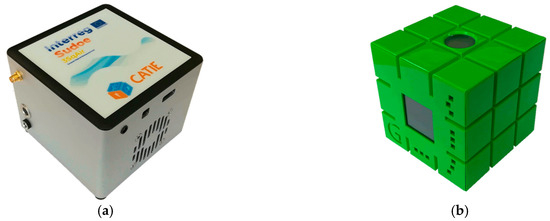
Figure 6.
Monitoring device: (a) Image of a Catie IEQ box. (b) Image of a GreenMe cube.
The second device used is the GreenMe cube, manufactured by the French company GreenMe (Paris, France). This sophisticated plastic cube collects environmental data through its internal sensors, as seen in Figure 6b. Small perforations on the cube allow air to reach the sensors. It collects data on approximately 10 environmental parameters, including volatile organic compounds (VOCs), Ta, noise levels, and others. Two units of GreenMe cubes, labeled Cube 35 and Cube 42, were used at DEM-FCTUC.
A Supervisory Control and Data Acquisition (SCADA) control system (Figure 7) was used for data visualization and supervision, with temperature setpoints at 22 °C. Additionally, an outdoor meteorological weather station, Vantage Pro2™ (6152, 6153) and Vantage Pro2™ Plus (6162, 6163) Wireless Weather Stations, manufactured by Davis Instruments an American company, based in Hayward, CA, USA, (www.davisinstruments.com accessed on 10 February 2025) sited at the DEM-FCTUC, were used to measure the outdoor weather conditions, as portrayed in Figure 8a,b.
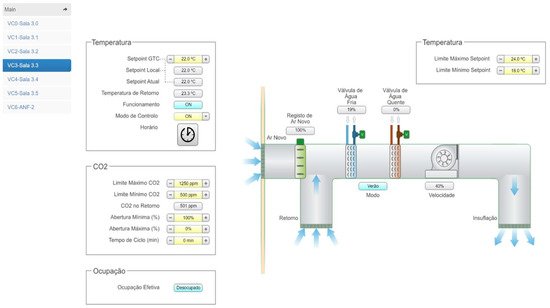
Figure 7.
SCADA interface of building management system.
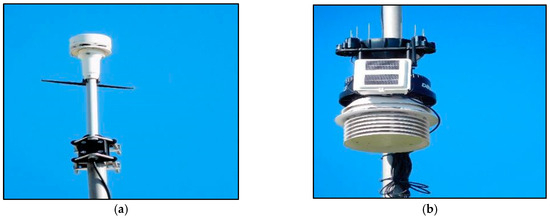
Figure 8.
(a,b) Meteorological weather station at DEM-FCTUC.
The project partners verified the metrological quality of the measuring systems before beginning operations. The sensorsquality assurance and control tests (QA/QC) showed R2 values of 0.88–0.93 for PM10, 0.91–0.94 for PM2.5, and 0.94–0.98 for CO2. These results confirmed that the sensors were satisfactory, and that the monitoring system offered a good quality-to-price ratio.
2.3.2. Monitoring System Distribution
The monitoring devices were strategically installed on the 1st of June 2022 for a continuous data collection campaign. In Room 6.3, three monitoring devices were positioned (two Catie boxes and one GreenMe cube): Cube 35 was placed on the lecturer’s desk in the front right corner at about 0.73m from the floor. Meas. Sys. 5 was placed a short distance from cube 35 in the right-hand corner of the classroom at a height of about 1.0 m, as shown in Figure 9a. Meas. Sys. 6 was mounted at the back of the room, at the side of the classroom cabinet. Both stations (in front and at the back of room 6.3) were observed to record quite similar values for the measured parameters in the same time frame. Similarly, Room 3.3 had two monitoring devices (One Catie box and one GreenMe cube): Cube 42 was positioned at the front of the class, approximately 0.73 m above the floor next to the lecturer’s desk, and Meas. Sys. 7 was placed at the back of the classroom, on the side of the classroom cabinet, Figure 9b. To complete the monitoring setup, Meas. Sys. 8 was mounted in the first-floor semi-outdoor corridor area, positioned 3 m above the floor, Figure 9c.

Figure 9.
Monitoring systems location (a) Room 6.3; (b) Room 3.3; (c) semi-external corridor.
2.4. Monitoring Campaign
The continuous monitoring and data collection campaign started on 1 June 2022, at the end of the 2021/2022 academic session. The data collected will be analyzed for the monitored zones to describe the conditions in each room.
2.4.1. Campaign Duration
This study focuses on the continuous data collected between November 2022 and October 2023 for occupied and unoccupied periods. This duration was selected to ensure data for each season is presented in a continuous format. Below is a summary of the University of Coimbra’s (UC) calendar for the 2022/2023 and 2023/2024 academic sessions in Table 1 [35] showing teaching and non-teaching periods at the DEM-FCTUC.

Table 1.
A snapshot of the UC academic calendar for 2022/2023 and 2023/2024.
Occupied period—This is the class period with regular teaching activities. Monday through Friday, between 9 a.m. to 8 p.m. (9:00–20:00), excluding Christmas holidays, exams (regular and re-sit), Easter holidays, school breaks, and summer breaks. In two months of regular teaching activities, the average occupancy level in room 3.3 was estimated to be 10 people, with the highest recorded number of occupants being 28. In room 6.3, the average occupancy was estimated to be 18 people, and the highest recorded number was 50.
2.4.2. Coimbra Historical Climate
Coimbra’s historical climate is presented to define the heating or cooling seasons. Climatological data for Coimbra from 1981 to 2010 is used to determine the monthly temperature range over 30 years. The record high temperature, average maximum temperature, average minimum temperature, and record low temperature are presented for each month in Table 2 [36]. In Table 2, periods with rising temperatures (from 6 °C) are highlighted in orange, with higher temperatures being darker shades. While temperatures below 6 °C are highlighted in lighter colours from white to blue. Also, an average temperature value, Tavg, is derived from the mean of the average maximum and minimum temperatures for each month. Based on the Tavg values, each month is categorized as a heating or cooling season. Tavg values below 15 °C are classified as the heating season, while Tavg values above 15 °C are categorized as the cooling season. Tavg values against each month are presented in Table 3.

Table 2.
Climatological data for Coimbra between 1981 and 2010.

Table 3.
Mean of the average max and average min temperature by months for Coimbra (1981–2010).
The values of Tavg are plotted against each month to determine, as presented in the bar chart below.
Figure 10 presents a chart of Tavg against month, and as earlier defined, the heating season is every month with a Tavg value below 15 °C, while the cooling season includes the months with a Tavg value above 15 °C. The blue colour denotes low temperatures (cold) while the red colour denotes warm or hot temperatures. The red horizontal broken line cutting across the chart from the 15 °C point separates the heating and the cooling months. January, February, March, April, November, and December are the heating seasons, denoted in blue bars, as Tavg is below 15 °C, while May, June, July, August, September, and October are the cooling seasons, denoted in red bars, with Tavg above 15 °C.
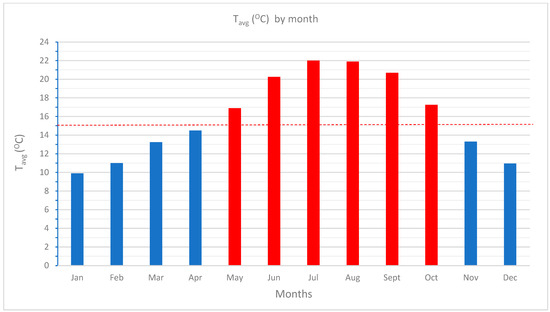
Figure 10.
Chart of Tavg against month.
3. Results and Discussion
3.1. Results
Results are presented for campaign periods between November 2022 and October 2023, with the heating season being November 2022–April 2023 and the cooling season being May 2023–October 2023. Based on the results, corrective measures will be suggested for implementation within the framework of the 3SqAir project while monitoring continues. To describe the conditions in each monitored zone, data for carbon dioxide (CO2), air temperature (Ta), and relative humidity (RH) were analyzed for two seasons, the heating and cooling seasons.
The result is based on the outcomes from monitoring equipment measurement system 5 (Meas. Sys. 5) and measurement system 7 (Meas. Sys. 7) in room 6.3 and room 3.3 alone to describe the IAQ and thermal conditions. The period “Classes” from Table 1 was defined as the period of occupancy, i.e., the period of regular teaching activities. In Figure 11, Figure 12, Figure 13 and Figure 14 below, each period is highlighted and labeled at the top of the chart area and separated by vertical broken lines. The class period is labeled “Regular teaching period”, and the unoccupied periods are labeled “Christmas break /Exams”, “Easter break”, or “School break/Exams/Summer break”. For the heating season, the following weeks fall within the regular teaching period: the 1st to 7th week, the 16th to 22nd week, and the 24th to 26th week. The cooling season weeks are the 1st to 3rd weeks and the 21st to 27th weeks. Each parameter is represented with points marking the mean weekly value (mean-Ta, mean-RH, and mean-CO2), the maximum weekly value (max-Ta, max-RH, and max-CO2), and the minimum weekly value (min-Ta, min-RH, and min-CO2). The mean weekly value is the average of all the recorded readings for a given parameter in a week. The maximum weekly value indicates the highest recorded reading for a parameter in the referenced one-week period. In contrast, the minimum weekly value is the lowest recorded reading for the same parameter in the same week. The red points indicate the maximum weekly values, the black points indicate the mean weekly values, and the green points indicate the minimum weekly values.
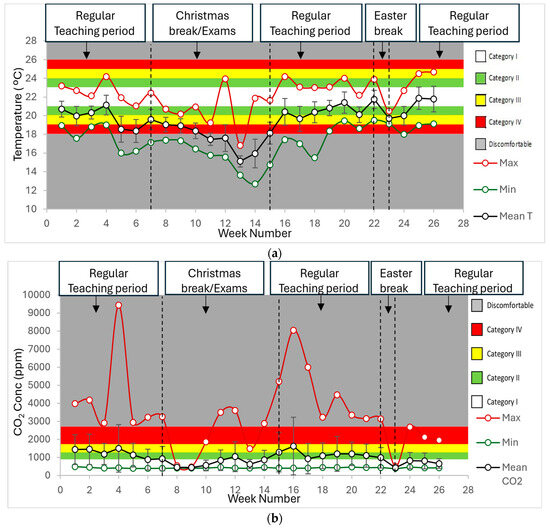
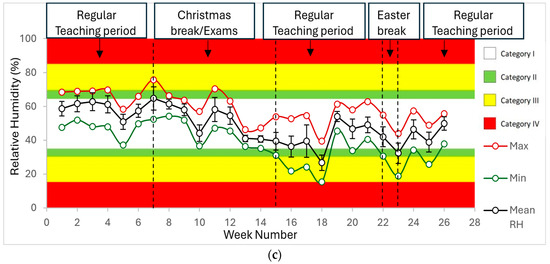
Figure 11.
Room 6.3 heating season indicating weekly maximum, mean, and minimum (a) Ta (b) CO2 (c) RH.
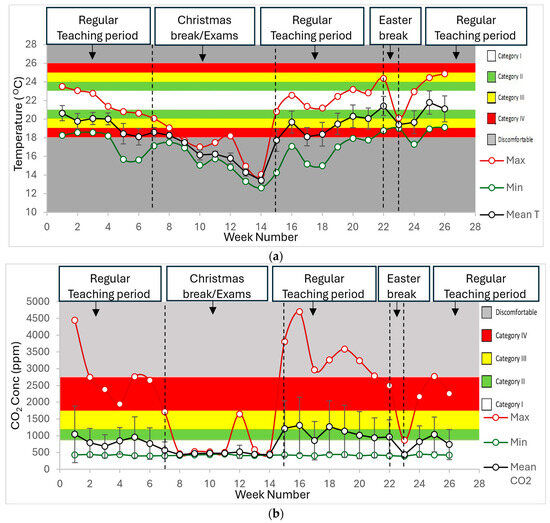
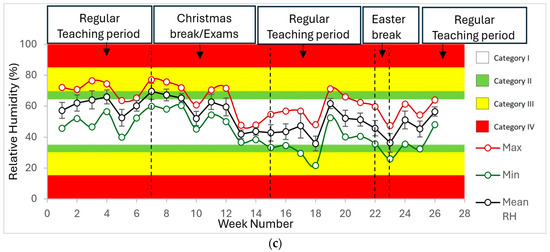
Figure 12.
Room 3.3 heating season—weekly maximum, mean, and minimum (a) Ta (b) CO2 (c) RH.
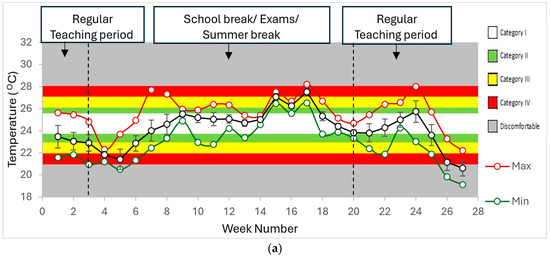
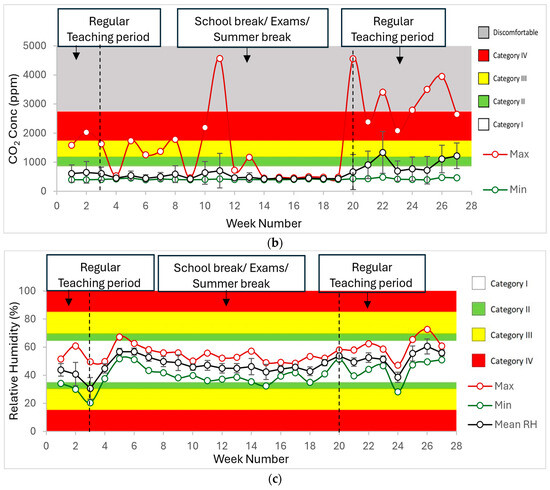
Figure 13.
Room 6.3 cooling season (a) Ta (b) CO2 (c) RH.
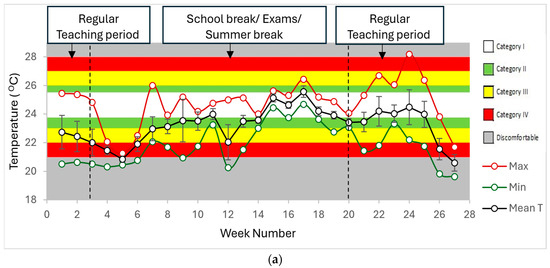
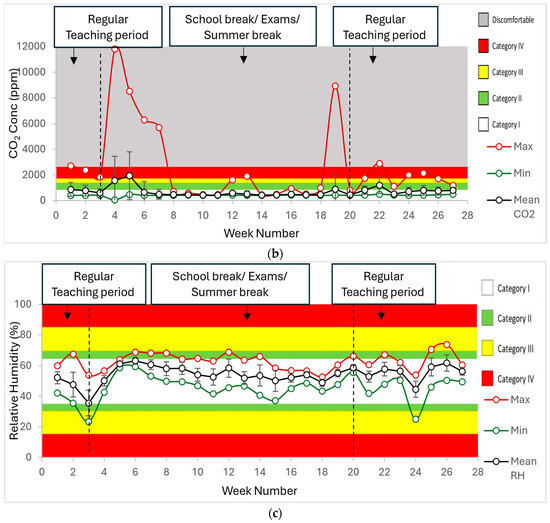
Figure 14.
Room 3.3 cooling season (a) Ta (b) CO2 (c) RH.
3.1.1. Heating Season-1st of November 2022 Until 30th of April 2023
The results obtained in the naturally ventilated room 6.3 (Meas. Sys. 5) during the heating season (1st of November 2022 until 30th of April 2023), between 9 a.m. and 8 p.m. (9:00–20:00) are presented in Figure 11, by three parameters: air temperature (Ta), carbon dioxide concentration (CO2), and relative humidity (RH). Ta parameter is presented in Figure 11a, CO2 in Figure 11b, and RH in Figure 11c. During this period for room 6.3, the maximum air temperature was recorded in week 26 (late afternoon with Ta at about 24.7 °C; this week is within the regular teaching activity period with classroom occupation. This air temperature reading was recorded between 17:00 and 18:00 on the 16th of April 2023). The lowest air temperature recorded was in week 14, during the school exam period outside the regular teaching activity, while the lowest classroom temperature during occupancy was in week 18, with Ta at 15.5 °C on the 3rd of March 2023. We observed the highest recorded CO2 concentration in the classroom in week 4 during the regular teaching period, 9432 ppm. The highest CO2 conc was 3614 ppm outside the regular teaching period in week 12.
The result from Meas. sys.7 in room 3.3 is presented below in Figure 12 for 26 weeks, indicating Ta, CO2, and RH results. It shows the highest air temperature in room 3.3 during the occupancy period in week 26 at about 24.9 °C. This occurred between 15:00 and 16:00 on the 27th of April 2023, while the lowest air temperature during occupancy was 15 °C in week 18. The CO2 conc did not exceed 4700 ppm.
3.1.2. Cooling Season-1st of May 2023 Until 31st of October 2023
The result for the mechanically ventilated room 6.3, (Meas. sys 5), Figure 13. During the cooling season, the air temperature was highest in week 24, at above 28 °C for the occupied period. This occurred on the 12th of October 2023 between 15:00 and 16:00. The lowest air temperature was 19.1 °C on Monday the 30th of October 2023, during the regular teaching activity period with occupancy. The CO2 conc was highest during occupancy at 3951 ppm in week 26.
For room 3.3 (Meas. sys 7), the Ta, CO2, and RH results are presented in Figure 14.
In Figure 14 above, the results in room 3.3 are presented with the highest air temperature in week 24, about 28.2 °C on the 9th of October 2023 between 16:00 and 17:00, and the lowest air temperature of 19.6 °C in week 27. This occurred on the 31st of October 2023 between 9:00 and 10:00 during the occupancy period. An unusual CO2 level of 11,807 ppm was recorded in week 4, outside the regular activity period, notably during the “Queima das Fitas” student party week [35]. Also, in week 19, CO2 peaked at 8920 ppm.
It is essential to highlight the following in the results presented:
- In the heating season, week 1 has 5 days as the month starts on a Tuesday. Week 27 has 1 day, the final day of the analyzed period. After excluding weekends, only 26 weeks were presented for the heating season.
- In the cooling season, week 1 has 6 days as the month starts on a Monday, while week 27 has only 3 days.
- Data between November 18th, 2022, at 21:30 and 21 November 2022, at 14:24 were not captured due to interruptions in both classrooms.
- Also, there were no recorded readings between the 25th of November 2022 at 17:24 and the 28th of November 2022 at 10:51.
- Due to an interruption, no readings were recorded between the 2nd of October 2023 at 15:04 and the 6th of October 2023 (15:24).
- No readings were recorded from the 21st of Oct 2023, at about 19:54, until Monday, the 23rd of Oct 2023, at about 12:59.
The interruptions are noteworthy but are not expected to alter the overall results describing the conditions in each room. The interruptions occurred in both studied rooms at approximately the same time and duration.
To further describe the indoor conditions in each room, the air change rate (ACH), or λ (h−1), is estimated using CO2 decay for one week within the regular teaching period in both the heating and cooling seasons. For the heating season, week 2 (06 November 2022 to 12 November 2022) is considered, while week 22 (24 September 2023 to 30 September 2023) is considered for the cooling season. The ACH will be estimated using the Tracer Gas Method (TGM) by applying the concentration decay method, which measures the effective fresh ACH [37,38]. In this case, naturally emitted CO2 from occupants is our tracer gas. The TGM is well described and applied in a study conducted at the University of Coimbra by Dias Pereira et al. 2019, “Experimental analysis of the ventilation rate in an amphitheater operating under the COVID-19 pandemic constraints” [33]. According to a study, “Evaluation of Air Exchange Rate and Particulate Matter Deposition Rate in a Classroom” carried out at the University of Coimbra, the authors stated that in a uni-zone, the concentration of a pollutant can be modeled using an exponential equation, such as the type in Equation (1), when the rate of emission of the pollutant in the uni-zone and the flow of fresh air remain constant [39].
where
- C(t) is the pollutant concentration at time t.
- Cequi is the asymptotic value of the concentration when equilibrium is reached.
- C0 is the initial concentration value.
- λ is the infiltration rate of the indoor compartment (ACH)
Equation (1) can also be written as
Taking the natural logarithm of Equation (2) gives
Equation (3) can be compared to
This implies,
This represents the excess concentration of CO2 at each time point relative to the value of the equilibrium concentration.
Y ⇔ ln(C(t)-Cequi).
Where Cequi is the concentration of CO2 outdoors.
- X ⇔ t.
- m ⇔ −λ.
- b ⇔ ln(C0-Cequi).
We, therefore, obtain the ACH by plotting the natural logarithms of the excess concentration of CO2 to the outdoor air (ln(C(t) − Cequi) against hours (h).
From the equation of the linear regression of the decay curve, comparable to and λ is obtained.
Figure 15 shows CO2 decay in four phases in one week, between 6 and 12 November 2022.
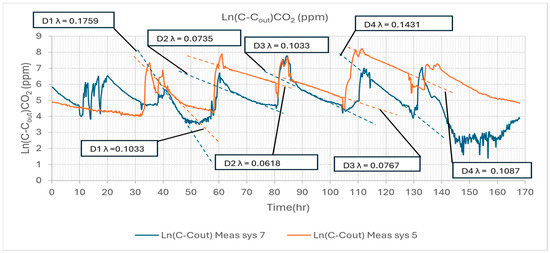
Figure 15.
Air change rate- CO2 decay in rooms 6.3 (Meas. sys 5), 3.3 (Meas. sys 7)—heating season.
Figure 16 presents CO2 decay in four phases over one week between 24 and 30 September 2023.
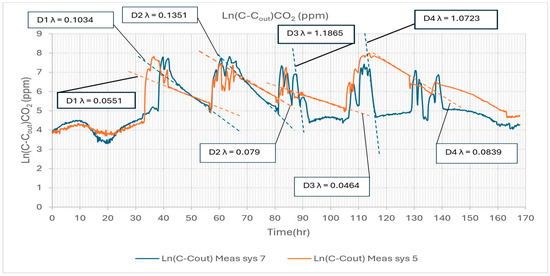
Figure 16.
Air change rate- CO2 decay in rooms 6.3 (Meas. sys 5), 3.3 (Meas. sys 7)—cooling season.
3.2. Discussion
The results at the DEM-FCTUC demo-site 6 were presented for the heating and cooling seasons in rooms 6.3 and 3.3 to describe the indoor climate conditions. The results were presented for three parameters—Ta, CO2, and RH—over a 26 and 27-week period.
3.2.1. Heating Season—1st of November 2022 Until 31st of October 2023
Room 6.3, a naturally ventilated classroom with an area of 60 m2, was analyzed for its indoor air quality (IAQ) and thermal comfort parameters. Figure 11a–c illustrates the conditions in this room, presenting data on air temperature, CO2 levels, and relative humidity. These measurements were evaluated against the comfort categories established in the EN 16798–1 standard [40] to assess the room’s overall environmental quality. The analysis aimed to determine the extent to which the monitored parameters aligned with recommended comfort ranges, providing insights into the effectiveness of the natural ventilation system in maintaining a suitable indoor environment for occupants [36].
Each parameter’s weekly mean, maximum, and minimum values were indicated over 26 weeks. In Figure 11c, mean-RH is between Category I and II (Cat I-II) in 26 weeks except in week 18, which is at Cat III. These are acceptable comfort category zones, although max-RH and min-RH have their highest and lowest points at 75% and 15%, respectively. The standard deviation from the mean is minimal, keeping RH mainly between Cat II. Relative humidity in room 6.3 for both occupied and unoccupied periods is, therefore, acceptable [41]. Also, the RH conditions during the regular teaching period and the unoccupied period were not notably different.
The CO2 concentration (conc) in Figure 11b shows mean-CO2 between Cat I and III for the 26 weeks. During the regular teaching period—that is, the occupancy period—mean-CO2 is mainly between Cat II-III, with standard deviations up to Cat IV and the Discomfortable zone. This differs from the Christmas break/Exams/Easter break period with little to no occupancy, whereas mean-CO2 is mainly in Cat I. The max-CO2 during occupancy shows high values above the comfortable range, between Cat IV-Discomfortable, and a peak above 9000 ppm in the 4th week. Despite max-CO2 being above 2000 ppm during the occupied period, mean-CO2 indicates CO2 levels were mostly acceptable at Cat I-III. It is important to note that the CO2 concentration alone may not give an overall picture of the IAQ conditions in the room, as there are other IAQ-influencing pollutants indoors [42]. The rate of CO2 buildup and decay process can inform the effectiveness of the ventilation system in the room. The air change rate (ACH) will be considered to describe the IAQ conditions in the room further.
The thermal condition in the room is presented in Figure 11a, which shows the mean-Ta between Cat I-III during the regular teaching period. Max-Ta is between Cat I-III, and min-Ta is between Cat III and the Discomfortable zone, highlighting a few times when the air temperature was below the acceptable comfort level. During other periods with little or no occupancy, the mean-Ta was mainly between Cat IV and the Discomfortable zone. During occupancy, the overall thermal conditions are average. Improvements are needed to keep the air temperature in the room always between Cat I and II.
Room 3.3 is a mechanically ventilated classroom with an area of 42 m2. Figure 12a–c describes the conditions in room 3.3. Like the conditions in room 6.3, Figure 12c shows the RH in room 3.3 to be acceptable with mean RH at Cat I for 26 weeks. Max RH and min RH remained between Cat I and III. The standard deviation of the mean RH is minimal and has little influence on the comfort category.
In Figure 12b, the mean CO2 was mainly between Cat I and III for 26 weeks. The standard deviation of mean CO2 fell between Cat I and IV, not exceeding 2000 ppm. Max CO2 was between Cat IV and the zone of discomfort, with a peak on the 16th week at 4700 ppm. Based on the mean CO2 values in Figure 12b, the average CO2 concentration was good. The ACH will be used to describe the IAQ conditions in the room further.
Figure 12a presents the thermal conditions in room 3.3 for the heating season, where the mean-Ta is across four comfort categories, Cat I-IV, during the regular teaching period. The regular teaching period is about 17 weeks out of the 26 weeks, with 10 weeks out of the 17 weeks between Cat II and III. The min-Ta is between the Cat IV-Discomfortable zone, indicating low temperatures possibly due to inadequate heating in the room. At the same time, the max-Ta is between Cat I-IV during the occupancy period, with max-Ta at peak value, 24.6 °C. During the heating season, the thermal condition in room 3.3 is mostly fair. Still, it requires improvement, such as improving classroom heating to keep the indoor temperature consistent at Cat I and II throughout the season.
To further describe the IAQ conditions in the rooms, we estimate the ACH (λ) using the Tracer Gas Method (TGM) [43], whereas the naturally emitted CO2 is the tracer gas. ACH estimation is obtained over one week, throughout the day, including Saturday and Sunday. The result is presented in Figure 15, where the CO2 decay trendline is plotted against time, and the ACH is obtained from the linear regression of the time series of the natural logarithms of the excess concentration of CO2 relative to outdoor air in rooms 6.3 and 3.3. Meas. Sys. 7 is represented by the blue decay line, while meas. Sys 5 is represented by the orange decay line in Figure 15. The selected period is during a regular teaching period when occupancy is expected to be high during the day. The obtained ACH (λ) (h−1) is presented in Table 4 for each room, divided into four decay slopes: D1, D2, D3, and D4.

Table 4.
ACH λ in rooms 6.3 and 3.3—heating season.
ACH per hour in rooms 6.3 and 3.3 is shown in Table 4 for the D1, D2, D3, and D4 decay phases. Two things can be immediately noticed from the Table 4 results:
- The infiltration rates obtained during the night decay in each room are less than the value suggested by ASHRAE for non-occupancy periods (0.5–1) [44].
- In each decay phase, the infiltration in room 3.3 with mechanical ventilation is higher than in room 6.3 with natural ventilation.
With the ACH values obtained in Figure 15 and Table 4 for D1, D2, D3, and D4, a MICROSOFT EXCEL CO2 decay simulator was used to predict the decay trend after 8 h, if a 1200 ppm (2160 mg/m3) of CO2 is introduced with no occupants, where Cext is 390 ppm (720 mg/m3).
Below, Figure 17 presents the simulation results in both rooms after 8 h of unoccupied time. The orange dotted line (Meas. sys 5) is for room 6.3, and the blue dotted line (Meas. sys 7) is for room 3.3.
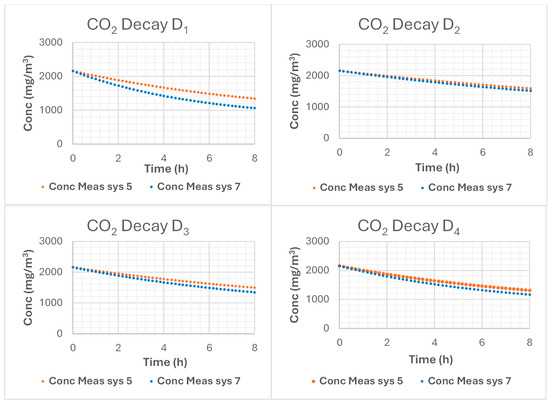
Figure 17.
Decay simulation in rooms 6.3 and 3.3 for the heating season.
After 8 h, D1 CO2 conc is 747.77 ppm (1346 mg/m3) in room 6.3 and 591.66 ppm (1065 mg/m3) in room 3.3, a 38% and 51% decay, respectively. D2 CO2 conc is 886.66 ppm (1596 mg/m3) and 842.77 ppm (1517 mg/m3), D3 CO2 conc is 831.66 ppm (1497 mg/m3) and 747.77 ppm (1346 mg/m3) and D4 CO2 conc is 732.77 ppm (1319 mg/m3) and 652.11 ppm (1172 mg/m3) in rooms 6.3 and 3.3, respectively. From the results, the D1, D2, D3, and D4 phases would take 76 h, 128 h, 103 h, and 72 h, respectively, for a complete CO2 decay to an outdoor level of 400 ppm (720 mg/m3) in room 6.3. Meanwhile, it would take 44 h, 107 h, 76 h, and 55 h for a complete decay to 400 ppm (720 mg/m3) in room 3.3. The ACH in room 3.3 is higher than in the naturally ventilated room 6.3. Given the duration for complete decay in both rooms, indoor air is insufficiently replaced with fresh outdoor air. Notably, the decay evaluated for ACH in the study rooms was impacted by infiltration and air exchange parameters. Moreover, several factors can be responsible for low ACH, such as an inadequate or faulty ventilation system, as highlighted by [45], and cost-cutting measures [46]. Closed windows and doors are also influencing factors. The situation of closed windows and doors highlights the need for awareness among teachers, students, and school workers on the impact that timely window opening can have on IAQ. For room 6.3, with only natural ventilation, the potential impact of closed windows or doors on the room’s air replacement rate is higher. Although a significant difference in ACH was observed between the rooms, with higher values in room 3.3, it is still well below ASHRAE recommendations [44]. It is important to add that poor fresh air replacement in the room influences the increased risk of airborne infection [47] and contributes to extended exposure to higher levels of CO2, including other indoor air pollutants that can impact cognitive function [48,49,50,51].
3.2.2. Cooling Season—1st of May 2023 Until 31st of October 2023
Figure 13a–c describes the indoor climate conditions in room 6.3 for the cooling season. The relative humidity condition shown in Figure 13c indicates that mean-RH is between Cat I-II for 27 weeks. Max-RH and min-RH are between Cat I and III for all periods. Given these, the relative humidity conditions are good and acceptable based on the comfort category.
The CO2 conc from Figure 13b shows mean-CO2 mostly between Cat I-II during the regular teaching period, where mean-CO2 is only in Cat III for 2 out of 10 weeks of occupancy. During the regular teaching period, the max-CO2 is mainly between Cat III and the Discomfort zone. The peak max-CO2 is at 4750 ppm outside the regular teaching period in week 11 (during the exam period), while the peak max-CO2 during the regular teaching period is 3951 ppm. Overall, the CO2 concentration is acceptable considering the mean-CO2 values, although max-CO2 values were mainly in the Cat IV and the Discomfortable zones. Estimating the ACH in the room will help to describe the IAQ conditions in this room better.
The thermal condition in the room is shown in Figure 13a. The regular teaching period is of more importance as this describes the thermal situation during periods of occupancy, weeks 1 to 3, and weeks 21 to 27 (10 weeks). Mean-Ta is across all comfort zones, between the Cat I and the Discomfort zone, where 8 weeks are between Cat I-III, and 2 weeks are between Cat IV and the Discomfortable zone. Max-Ta is between Cat I and the Discomfortable zone during this period, highlighting air temperature being uncomfortably high a few times in the room. Min-Ta is mainly between Cat III and the Discomfortable zone. The overall thermal condition in the room is fair, but there is a need for improvement, as adequate cooling will reduce periods of max-Ta having unacceptable elevated temperatures or overcooling with min-Ta falling below 22 °C. The goal is to improve thermal conditions to ensure Ta is between Cat I and II.
Figure 14a–c also describes the indoor climate conditions in room 3.3 for the cooling season. Figure 14c shows the mean-RH, max-RH, and min-RH for 27 weeks. RH is acceptable with mean-RH at Cat I for the 27 weeks, while max-RH and min-RH are between Cat I-III. Figure 14b describes the CO2 concentration level in the room. The mean-CO2 is between Cat I-II for the 10 weeks of the regular teaching period. Max-CO2 during this period is mostly between Cat II and IV, with only 2 weeks in the Discomfortable zone. The peak max-CO2 recorded is 11,807 ppm, which happened in week 4, during the student party week (Queima das Fitas), while the peak max-CO2 during occupancy is 2891 ppm. The mean-CO2 values show an acceptable CO2 concentration in the room. The ACH in the room will help to describe better the room’s IAQ conditions. Figure 14a shows the thermal conditions in room 3.3. The focus is on the regular teaching period (10 weeks), from weeks 1 to 3, and weeks 21 to 27. Mean-Ta cuts across the five comfort categories, with 7 weeks between Cat I-III, and the other 3 weeks between Cat IV and the Discomfortable zone. Max-Ta shows 8 weeks in Cat I and III, and 2 weeks between Cat IV and the Discomfortable zone. Min-Ta lies mainly between Cat IV and the Discomfortable zone, with only 2 weeks in Cat II-III. These min-Ta values in Cat IV and the Discomfortable mostly occur in the mornings between 9:00 and 10:00. The overall thermal condition is fair, with a need to improve to keep air temperature between Cat I and II. Table 5 below presents the ACH for the cooling period between the 24th of September 2023 and the 30th of September 2023, as estimated in Figure 16.

Table 5.
ACH λ in rooms 6.3 and 3.3—cooling season.
The ACH in room 3.3 is higher than in room 6.3 and is at least twice the rate for each phase. Figure 18 shows the results obtained using the Microsoft Excel CO2 decay simulator to predict the decay trend over 8 h when 1200 ppm (2160 mg/m3) of CO2 is introduced.
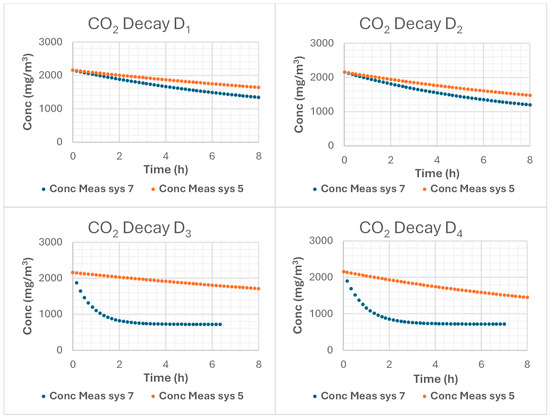
Figure 18.
Decay simulation in rooms 6.3 and 3.3 for the cooling season.
The orange dotted line in Figure 18 represents room 6.3, and the blue dotted line represents room 3.3. Figure 18 shows D1 CO2 conc at 913.76 ppm (1644.78 mg/m3) in room 6.3 and 747.3 ppm (1345.14 mg/m3) in room 3.3 at the end of 8 h. D2 CO2 conc is 823.43 ppm (1482.19 mg/m3) and 668.12 ppm (1202.62 mg/m3) in rooms 6.3 and 3.3, respectively. D3 CO2 conc is 951.12 ppm (1712.03 mg/m3) in room 6.3, but complete decay occurred earlier in room 3.3 due to higher ACH. D4 CO2 conc is 806.93 ppm (1452.49 mg/m3) in room 6.3 after 8 h and completely decayed earlier in room 3.3. It will take 131 h, 91 h, 156 h, and 86 h, respectively, in D1, D2, D3, and D4 phases for CO2 to decay to the outdoor level of 400 ppm (720 mg/m3) in room 6.3. In comparison, complete decay will occur in room 3.3 after 69 h, 53 h, 5 h, and 6 h, respectively, for the D1, D2, D3, and D4 decay phases.
The extended period for the complete decay of CO2 to outdoor levels in rooms 6.3 and 3.3 highlights poor ventilation, amounting to stale indoor air. The age of air describes how long it takes for fresh outdoor air to replace the old indoor air, and classrooms with low ACH typically have stale air [52]. Some studies investigating air quality in classrooms observed an association between poor ventilation, stale air, extended exposure to elevated CO2 concentration, and heightened health issues [53,54,55,56].
3.2.3. Comparative Assessment of Rooms 6.3 and 3.3
Table 6 compares the overall conditions in rooms 6.3 and 6.3. Both rooms show RH is suitable for the two seasons. Air temperature conditions appear to be better in room 6.3 than in room 3.3 during the heating season, with mean-Ta at Cat I-II in 10 occupied weeks compared to only 5 weeks in Cat I-II for room 3.3. Thermal conditions in both rooms need improving; min-Ta was consistently in Cat IV and the Discomfortable range, falling to as low as 16 °C and 15 °C in rooms 6.3 and 3.3, respectively. During the cooling season, both rooms perform similarly, with almost identical patterns, although room 6.3 reflects a slightly better Ta, with mean-Ta in Cat I-II for 7 weeks compared to 5 weeks in room 3.3. Ta peaked at 28 °C in room 6.3 and 28.2 °C in room 3.3. To better understand the impact of these temperature readings, a subjective survey of the occupants’ perception is required, as used in several studies [57,58,59,60,61,62]. On average, the CO2 conc level is adequate in rooms 6.3 and 3.3. However, room 6.3 recorded an unusual peak at 9432 ppm in the heating season. In comparison, room 3.3 recorded an unusual CO2 peak in the cooling season at 11,807 ppm, although this occurred outside the regular teaching period. Overall, room 3.3 appears to have better CO2 conditions in both seasons. It is essential to mention that, during these monitoring periods, neither the teachers nor the students were informed of the CO2 levels reached during occupancy. Therefore, the process and decision to open windows or doors were entirely based on the subjective perception of the occupants for air quality, thermal comfort, or noise.

Table 6.
Comparative conditions in rooms 6.3 and 3.3.
The estimated ACH for one week shows low CO2 infiltration rates in both classrooms, below recommendations for classrooms [44]. Room 3.3 notably had a higher ACH in both seasons. Given that room 3.3 is mechanically ventilated, the low ACH may be associated with reduced airflow due to blockage in the air filters. The presence of clogs or dirt in the filters has an impact on the mechanical ventilation system’s performance [63]. It is important to note that a low infiltration rate comes with a higher risk of infection [64]. Also, underperforming mechanical components in the ventilation system can account for the observed low infiltration rate in the room. Scheduling routine cleaning or replacement of the filter, including general service, can help improve outcomes. In addition, the situation of the mechanical ventilation system being turned off during the period of non-occupancy in a bid to reduce energy cost may contribute to the low ACH [65]. These findings highlight the need to improve ACH to increase the rate of fresh air inflow. IEQ gaps were identified, and corrective measures within the framework of the 3SqAir project were suggested to be implemented in each room while monitoring continues in Table 7.

Table 7.
Corrective measures in Room 6.3 and Room 3.3.
With ongoing monitoring in the rooms, corrective measures will be implemented subject to approval, marking a new phase for evaluation. Data from the new phase will be processed and analyzed to determine the impact of the implemented corrective measures on both measured and perceived IAQ. This provides a basis for further recommendations for evolving IAQ solutions. The results will serve as guidelines for implementing a sustainable smart strategy for indoor climate quality assurance in school buildings.
The study’s results are limited by these factors:
- The use of only three parameters to describe the conditions in each room- Ta, CO2, and RH; other pollutants such as PM10, PM2.5, and NO2 were excluded from the results.
- Although data for sound pressure level and illuminance were monitored to characterize acoustic and visual comfort, the study focused only on thermal and IAQ parameters.
- The study reports data processed from only one measuring system out of the two or three devices installed in each classroom.
- The result of the subjective evaluation of occupants was also not included in this study, as occupants’ responses may have been influenced during the survey delivery and collection process.
For a more holistic evaluation, the occupant’s perception will be included in the next evaluation phase.
4. Conclusions
The study was carried out within the framework of the 3SqAir project, which started in November 2020 as a relevant and timely project amid the COVID-19 pandemic. The 3SqAir project was conducted in Spain, France, and Portugal, with two demo sites in each country. This study serves as an overview, reporting the preliminary investigation of the IAQ and thermal conditions in two classrooms at Demo site 6, DEM-FCTUC, for two seasons, the heating and cooling seasons. The classrooms, rooms 6.3 and 3.3, employ different ventilation systems: natural ventilation and mechanical ventilation, respectively. The analyzed parameters are the weekly mean, maximum, and minimum values of measured temperature Ta, Carbon dioxide (CO2), Relative humidity (RH), and air change rate (ACH) for both occupied and unoccupied periods to describe the conditions in each room. The results showed similar good RH conditions in both rooms between Category I-II (Cat I-II) and the EN 16798–1 standard in the two seasons. Ta levels in the heating season suggest the need for improvements, with min-Ta consistently in Cat IV and the Discomfort range. However, the naturally ventilated room 6.3 performed better than the mechanically ventilated room 3.3. During the cooling season, thermal conditions were ok in both rooms, although Ta in a few weeks had uncomfortable peaks about 28 °C and lows below 20 °C. An adequate cooling strategy is required to keep the air temperature between Cat I and II without compromising air quality and energy efficiency. The CO2 concentration level during the heating season in room 6.3 was adequate, considering the mean weekly values of CO2. However, max-CO2 was consistently above 2000 ppm, with an unusual peak above 9000 ppm during occupancy. The conditions were better during the cooling season, considering the flexibility of opening the doors and windows. A similar acceptable CO2 concentration level was observed in room 3.3 for both seasons, although CO2 peaked at an unusual concentration of 11,807 ppm outside the regular teaching period in the cooling season. The air change rate (ACH) was estimated in one week for each room in the two seasons over four decay phases: D1, D2, D3, and D4. The results showed inadequate ACH in both rooms, below the recommended values by ASHRAE for classrooms. The mechanically ventilated room 3.3 had higher ACH than the naturally ventilated room 6.3, almost twice the ACH values for each analyzed decay phase. A simulation of CO2 decay in each room using the estimated ACH values further highlighted the IAQ gaps in the rooms.
Conclusively, both rooms were observed to have thermal comfort gaps, especially during the heating season, and IAQ gaps due to low ACH; adequate corrective measures have been suggested for implementation to improve the rooms’ performances. Upon implementation, a new phase of evaluation will be carried out. These findings inform preliminary recommendations for evolving solutions towards a sustainable smart strategy for classroom climate quality assurance. As corrective measures are being implemented, subjective assessment of occupants’ perceptions will be included in the next phase for a holistic evaluation of classroom conditions.
Author Contributions
Conceptualization, J.O., J.-P.K.B.N. and J.O.O.; methodology, J.O., J.-P.K.B.N., J.O.O. and L.D.P.; validation, J.O. and L.D.P.; formal analysis, J.O.; investigation, J.O., J.-P.K.B.N., J.O.O. and L.D.P.; data curation, J.O., J.-P.K.B.N. and J.O.O; writing—original draft preparation, J.O; writing—review and editing, J.O., J.-P.K.B.N., J.O.O., R.A.d.S.S., L.D.P. and M.G.d.S.; visualization, J.O. and R.A.d.S.S.; supervision, M.G.d.S.; project administration, L.D.P. and M.G.d.S.; funding acquisition, M.G.d.S. All authors have read and agreed to the published version of the manuscript.
Funding
This research was funded in whole or in part by the Fundação para a Ciência e a Tecnologia, I.P. (FCT, https://ror.org/00snfqn58 accessed on 10 of February 2025) under Grant (FCT)—IUDB/50022/2020, IUDP/50022/2020, LA/P/0079/2020, DOI: 10.54499/LA/P/0079/2020. The authors J.O. and J.O.O have grants as follows; J.O. with grant Ref: PRT/28/2022/Research Grant—EC2U | WP6 and J.O.O. with grant Ref: UI/BD/152067/2021. For the purpose of Open Access, the author has applied a CC-BY public copyright license to any Author‘s Accepted Manuscript (AAM) version arising from this submission. The experimental setup was funded by the 3SqAir project, SOE4/P1/E1004.
Institutional Review Board Statement
Not applicable.
Informed Consent Statement
Not applicable.
Data Availability Statement
The raw data supporting the conclusions of this article will be made available by the authors on request.
Acknowledgments
The present work was developed in the framework of the Energy for Sustainability Initiative of the University of Coimbra and was supported by ADAI-LAETA.
Conflicts of Interest
The authors declare no conflicts of interest.
Abbreviations
The following abbreviations are used in this manuscript:
| ACH | Air change rate |
| AIRMEX | European Indoor Air Monitoring and Exposure Assessment project |
| Cat | Category |
| Conc | Concentration |
| CO2 | Carbon dioxide |
| DEM-FCTUC | Department of Mechanical Engineering, University of Coimbra |
| D1 | Decay phase 1 |
| D2 | Decay phase 2 |
| D3 | Decay phase 3 |
| D4 | Decay phase 4 |
| EU | European Union |
| IAQ | Indoor air quality |
| ICQ | Indoor climate quality |
| IEQ | Indoor environmental quality |
| Meas. Sys | Measurement system |
| Max-CO2 | Maximum weekly carbon dioxide |
| Max-Ta | Maximum weekly temperature |
| Max-RH | Maximum weekly relative humidity |
| Mean-CO2 | Mean weekly carbon dioxide |
| Mean-Ta | Mean weekly temperature |
| Mean-RH | Mean weekly relative humidity |
| Min-CO2 | Minimum weekly carbon dioxide |
| Min-Ta | Minimum weekly temperature |
| Min-RH- | Minimum weekly relative humidity |
| NO2 | Nitrogen dioxide |
| Ta | Air temperature |
| TGM | Tracer Gas Method |
| PM1 | Particulate matter 1 |
| PM2.5 | Particulate matter 2.5 |
| PM10 | Particulate matter 10 |
| QA/QC | Quality assurance/Quality control |
| RH | Relative humidity |
| RIS3 | Research and Innovation Strategies for Smart Specialization |
| SB(s) | School building(s) |
| SCADA | Supervisory Control and Data Acquisition |
| SEARCH | School Environment and Respiratory Health of Children |
| SINPHONIE | Schools Indoor Pollution and Health- Observatory Network project |
| UC | University of Coimbra |
| VOC | Volatile organic compounds |
| 3SqAir | Sustainable Smart Strategy for Air Quality Assurance in Classrooms |
References
- Mihai, T.; Iordache, V. Determining the Indoor Environment Quality for an Educational Building. Energy Procedia 2016, 85, 566–574. [Google Scholar] [CrossRef]
- Niza, I.L.; Bueno, A.M.; da Silva, M.G.; Broday, E.E. Air quality and ventilation: Exploring solutions for healthy and sustainable urban environments in times of climate change. Results Eng. 2024, 24, 103135. [Google Scholar] [CrossRef]
- Geng, Y.; Lin, B.; Yu, J.; Zhou, H.; Ji, W.; Chen, H.; Zhang, Z.; Zhu, Y. Indoor environmental quality of green office buildings in China: Large-scale and long-term measurement. Build. Environ. 2019, 150, 266–280. [Google Scholar] [CrossRef]
- Felgueiras, F.; Mourão, Z.; Moreira, A.; Gabriel, M.F. Indoor environmental quality in offices and risk of health and productivity complaints at work: A literature review. J. Hazard. Mater. Adv. 2023, 10, 100314. [Google Scholar] [CrossRef]
- Liu, Y.; Wang, Z.; Zhang, Z.; Hong, J.; Lin, B. Investigation on the Indoor Environment Quality of health care facilities in China. Build. Environ. 2018, 141, 273–287. [Google Scholar] [CrossRef]
- Nyembwe, J.P.K.B.; Munanga, J.K.; Simões, N.; da Silva, M.G. Ventilation Strategies to Mitigate Air Pollution Impact on Hospital Professionals in Intensive Care Units in the Democratic Republic of Congo. Buildings 2024, 14, 1996. [Google Scholar] [CrossRef]
- Tang, H.; Ding, Y.; Singer, B.C. Post-occupancy evaluation of indoor environmental quality in ten nonresidential buildings in Chongqing, China. J. Build. Eng. 2020, 32, 101649. [Google Scholar] [CrossRef]
- Ogundiran, J.O.; Nyembwe, J.P.K.B.; Ribeiro, A.S.N.; da Silva, M.G. A Field Survey on Indoor Climate in Land Transport Cabins of Buses and Trains. Atmosphere 2024, 15, 589. [Google Scholar] [CrossRef]
- da Silva, M.G.; Broday, E.E.; Ruivo, C.R. Indoor climate quality assessment in civil aircraft cabins: A field study. Therm. Sci. Eng. Prog. 2023, 37, 101581. [Google Scholar] [CrossRef]
- Cao, X.; Zevitas, C.D.; Spengler, J.D.; Coull, B.; McNeely, E.; Jones, B.; Loo, S.M.; MacNaughton, P.; Allen, J.G. The on-board carbon dioxide concentrations and ventilation performance in passenger cabins of US domestic flights. Indoor Built Environ. 2019, 28, 761–771. [Google Scholar] [CrossRef]
- Wang, H.; Wei, W.; Wang, K.; Kong, H.; Vieira, C.L.Z.; Koutrakis, P.; Huang, S.; Xiong, J.; Giorio, C. A global multidimensional analysis of air pollution in land, sea, and air transport cabins reveals substantial health risks. One Earth 2025, 8, 101156. [Google Scholar] [CrossRef]
- Wang, H.; Guo, D.; Zhang, W.; Zhang, R.; Gao, Y.; Zhang, X.; Liu, W.; Wu, W.; Sun, L.; Yu, X.; et al. Observation, prediction, and risk assessment of volatile organic compounds in a vehicle cabin environment. Cell Rep. Phys. Sci. 2023, 4, 101375. [Google Scholar] [CrossRef]
- Sadrizadeh, S.; Yao, R.; Yuan, F.; Awbi, H.; Bahnfleth, W.; Bi, Y.; Cao, G.; Croitoru, C.; de Dear, R.; Haghighat, F.; et al. Indoor air quality and health in schools: A critical review for developing the roadmap for the future school environment. J. Build. Eng. 2022, 57, 104908. [Google Scholar] [CrossRef]
- Szabados, M.; Csákó, Z.; Kotlík, B.; Kazmarová, H.; Kozajda, A.; Jutraz, A.; Kukec, A.; Otorepec, P.; Dongiovanni, A.; Di Maggio, A.; et al. Indoor air quality and the associated health risk in primary school buildings in Central Europe—The InAirQ study. Indoor Air 2021, 31, 989–1003. [Google Scholar] [CrossRef]
- Dong, J.; Goodman, N.; Rajagopalan, P. A Review of Artificial Neural Network Models Applied to Predict Indoor Air Quality in Schools. Int. J. Environ. Res. Public Health 2023, 20, 6441. [Google Scholar] [CrossRef]
- Ismail, I.F.; Zainol Adnan, A.I.; Al-Mekhlafi, A.M.Q.; Abdelkarim Mohamed, B.A.M.; Nasir, N.F.; Hariri, A.; Mat Isa, N. Indoor Air Quality (IAQ) in Educational Institutions: A Review on Risks of Poor IAQ, Sampling Strategies, and Building-Related Health Symptoms. J. Saf. Health Ergon. 2020, 2, 1–9. [Google Scholar]
- Tham, K.W. Indoor air quality and its effects on humans—A review of challenges and developments in the last 30 years. Energy Build. 2016, 130, 637–650. [Google Scholar] [CrossRef]
- Bakó-Biró, Z.; Clements-Croome, D.J.; Kochhar, N.; Awbi, H.B.; Williams, M.J. Ventilation rates in schools and pupils’ performance. Build. Environ. 2012, 48, 215–223. [Google Scholar] [CrossRef]
- Gascon, M.; Morales, E.; Sunyer, J.; Vrijheid, M. Effects of persistent organic pollutants on the developing respiratory and immune systems: A systematic review. Environ. Int. 2013, 52, 51–65. [Google Scholar] [CrossRef]
- Geiss, O.; Giannopoulos, G.; Tirendi, S.; Barrero-Moreno, J.; Larsen, B.R.; Kotzias, D. The AIRMEX study—VOC measurements in public buildings and schools/kindergartens in eleven European cities: Statistical analysis of the data. Atmos. Environ. 2011, 45, 3676–3684. [Google Scholar] [CrossRef]
- Stylianos, K.; Otmar, G.; Vittorio, R. European Indoor Air Monitoring and Exposure Assessment Project. JRC Publications Repository 2016. Available online: https://publications.jrc.ec.europa.eu/repository/handle/JRC103078 (accessed on 7 January 2025).
- Geiss, O.; Barrero-Moreno, J.; Kotzias, D.; Tirendi, S.; Reina, V.; Gotti, A.; Cimino-Reale, G.; Casati, B.; Marafante, E.; Sarigiannis, D. Exposure to multiple air contaminants in public buildings, schools and kindergartens-the European indoor air monitoring and exposure assessment (airmex) study. Fresenius Environ. Bull. 2009, 18, 670. [Google Scholar]
- School Environment and Respiratory Health of Children (SEaRCH) The Project is Implemented with the Generous Support of the Italian Ministry for the Environment, Land and Sea Ministry for the Environment Land and Sea. 2010. Available online: https://www.rec.hu (accessed on 16 September 2024).
- Annesi-Maesano, I.; Csobod, É.; Carrer, P.; Kephalopoulos, S.; Madureira, J.; Rudnai, P.; de Oliveira Fernandes, E. SINPHONIE (Schools Indoor Pollution and Health Observatory Network in Europe): Executive Summary of the Final Report; Publications Office of the European Union: Luxembourg, 2014. [Google Scholar] [CrossRef]
- Baloch, R.M.; Maesano, C.N.; Christoffersen, J.; Banerjee, S.; Gabriel, M.; Csobod, É.; Fernandes, E.d.O.; Annesi-Maesano, I.; Szuppinger, P.; Prokai, R.; et al. Indoor air pollution, physical and comfort parameters related to schoolchildren’s health: Data from the European SINPHONIE study. Sci. Total Environ. 2020, 739, 139870. [Google Scholar] [CrossRef] [PubMed]
- Szigeti, T.; National Public Health Center, Budapest, Hungary. Introduction to the In AirQ project and the main achievements. In Proceedings of the International Conference on Integrated Problem-Solving Approaches to Ensure Schoolchildren’s Health, Budapest, Hungary, 23–24 May 2019. [Google Scholar]
- SUMMARY REPORT. 2020. Available online: https://programme2014-20.interreg-central.eu/Content.Node/InAirQ/CE69-INAIRQ-Summary-report.pdf (accessed on 18 December 2024).
- Toyinbo, O. Indoor Environmental Quality, Pupils’ Health, and Academic Performance—A Literature Review. Buildings 2023, 13, 2172. [Google Scholar] [CrossRef]
- Toyinbo, O.; Shaughnessy, R.; Turunen, M.; Putus, T.; Metsämuuronen, J.; Kurnitski, J.; Haverinen-Shaughnessy, U. Building characteristics, indoor environmental quality, and mathematics achievement in Finnish elementary schools. Build. Environ. 2016, 104, 114–121. [Google Scholar] [CrossRef]
- Interreg Sudoe. 3SqAir Project. Available online: https://www.3sqair.com/ (accessed on 2 January 2024).
- Cucinotta, D.; Vanelli, M. WHO declares COVID-19 a pandemic. Acta Biomed. 2020, 91, 157–160. [Google Scholar] [CrossRef]
- Scotford, E. Rethinking clean air: Air quality law and COVID-19. J. Environ. Law 2020, 32, 349–353. [Google Scholar] [CrossRef]
- Pereira, L.D.; da Costa, J.J.; da Silva, M.C.G. View of Experimental analysis of the ventilation rate in an amphitheater operating under the COVID-19 pandemic constraints. In Proceedings of the CLIMA 2022 The 14th REHVA HVAC World Congress, Rotterdam, The Netherlands, 22–25 May 2022. [Google Scholar] [CrossRef]
- Weather Underground. UC.POLO2-ICOIMB23. Available online: https://www.wunderground.com/dashboard/pws/ICOIMB23 (accessed on 6 December 2024).
- University of Coimbra. Academic Calendar. UC Services and Academic Information. Available online: https://www.uc.pt/en/academicos/regulamentos/calendario (accessed on 6 December 2024).
- The Portuguese Institute for Sea and Atmosphere (IPMA). Climatological Normals—1981-2010 (provisional)—Coimbra. IPMA, IP. Available online: https://web.archive.org/web/20171204061202/http://www.ipma.pt/pt/oclima/normais.clima/1981-2010/006/# (accessed on 7 January 2025).
- Nikolopoulos, N.; Nikolopoulos, A.; Larsen, T.S.; Nikas, K.S.P. Experimental and numerical investigation of the tracer gas methodology in the case of a naturally cross-ventilated building. Build. Environ. 2012, 56, 379–388. [Google Scholar] [CrossRef]
- Cui, S.; Cohen, M.; Stabat, P.; Marchio, D. CO2 tracer gas concentration decay method for measuring air change rate. Build. Environ. 2015, 84, 162–169. [Google Scholar] [CrossRef]
- Ogundiran, J.; Sigour, M.; Mastouri, H.; da Silva, M.C.G. Evaluation of Air Exchange Rate and Particulate Matter Deposition Rate in a Classroom; COS: Washington, DC, USA, 2024. [Google Scholar] [CrossRef]
- Babich, F.; Torriani, G.; Corona, J.; Lara-Ibeas, I. Comparison of indoor air quality and thermal comfort standards and variations in exceedance for school buildings. J. Build. Eng. 2023, 71, 106405. [Google Scholar] [CrossRef]
- Ryan, I.; Deng, X.; Thurston, G.; Khwaja, H.; Romeiko, X.; Zhang, W.; Marks, T.; Yu, F.; Lin, S. Measuring students’ exposure to temperature and relative humidity in various indoor environments and across seasons using personal air monitors. Hyg. Environ. Health Adv. 2022, 4, 100029. [Google Scholar] [CrossRef]
- Persily, A.; Mandin, C.; Bahnfleth, W.P.; Sekhar, C.; Kipen, H.; Wargocki, P.; Lau, J.; Weekes, L.C.N. ASHRAE’s New Position Document on Indoor Carbon Dioxide, ASHRAE, 2022. Available online: https://tinyurl.com/2p97a7zw (accessed on 10 December 2024).
- Remion, G.; Moujalled, B.; El Mankibi, M. Review of tracer gas-based methods for the characterization of natural ventilation performance: Comparative analysis of their accuracy. Build. Environ. 2019, 160, 106180. [Google Scholar] [CrossRef]
- ANSI/ASHRAE. Ventilation for Acceptable Indoor Air Quality—ASHRAE ANSI/ASHRAE Standard 62-2001. 2022. Available online: www.ashrae.org/technology (accessed on 20 April 2024).
- Ramalho, O.; Mandin, C.; Ribéron, J.; Wyart, G. Air Stuffiness and Air Exchange Rate in French Schools and Day-Care Centres. Int. J. Vent. 2013, 12, 175–180. [Google Scholar] [CrossRef]
- Batterman, S.; Su, F.C.; Wald, A.; Watkins, F.; Godwin, C.; Thun, G. Ventilation rates in recently constructed U.S. school classrooms. Indoor Air 2017, 27, 880–890. [Google Scholar] [CrossRef]
- Settimo, G.; Indinnimeo, L.; Inglessis, M.; De Felice, M.; Morlino, R.; di Coste, A.; Carriera, F.; Di Fiore, C.; Avino, P. CO2 Levels in Classrooms: What Actions to Take to Improve the Quality of Environments and Spaces. Sustainability 2024, 16, 8619. [Google Scholar] [CrossRef]
- Du, B.; Tandoc, M.C.; Mack, M.L.; Siegel, J.A. Indoor CO2 concentrations and cognitive function: A critical review. Indoor Air 2020, 30, 1067–1082. [Google Scholar] [CrossRef]
- Allen, J.G.; MacNaughton, P.; Satish, U.; Santanam, S.; Vallarino, J.; Spengler, J.D. Associations of cognitive function scores with carbon dioxide, ventilation, and volatile organic compound exposures in office workers: A controlled exposure study of green and conventional office environments. Environ. Health Perspect. 2016, 124, 805–812. [Google Scholar] [CrossRef]
- Mendell, M.J.; Eliseeva, E.A.; Davies, M.M.; Spears, M.; Lobscheid, A.; Fisk, W.J.; Apte, M.G. Association of classroom ventilation with reduced illness absence: A prospective study in California elementary schools. Indoor Air 2013, 23, 515–528. [Google Scholar] [CrossRef]
- Wargocki, P.; Porras-Salazar, J.A.; Contreras-Espinoza, S.; Bahnfleth, W. The relationships between classroom air quality and children’s performance in school. Build. Environ. 2020, 173, 106749. [Google Scholar] [CrossRef]
- Park, S.H.; Lee, K.R.; Yook, S.J.; Koo, H.B. Enhancement and Homogenization of Indoor Air Quality in a Classroom Using a Vertical Airflow Ventilation Scheme. Toxics 2022, 10, 545. [Google Scholar] [CrossRef]
- Cabovská, B.; Bekö, G.; Teli, D.; Ekberg, L.; Dalenbäck, J.-O.; Wargocki, P.; Psomas, T.; Langer, S. Ventilation strategies and indoor air quality in Swedish primary school classrooms. Build. Environ. 2022, 226, 109744. [Google Scholar] [CrossRef]
- Korsavi, S.S.; Montazami, A.; Mumovic, D. Ventilation rates in naturally ventilated primary schools in the UK.; Contextual, Occupant and Building-related (COB) factors. Build. Environ. 2020, 181, 107061. [Google Scholar] [CrossRef]
- Vornanen-Winqvist, C.; Salonen, H.; Järvi, K.; Andersson, M.A.; Mikkola, R.; Marik, T.; Kredics, L.; Kurnitski, J. Effects of ventilation improvement on measured and perceived indoor air quality in a school building with a hybrid ventilation system. Int. J. Environ. Res. Public Health 2018, 15, 1414. [Google Scholar] [CrossRef]
- Pollozhani, F.; McLeod, R.S.; Schwarzbauer, C.; Hopfe, C.J. Assessing school ventilation strategies from the perspective of health, environment, and energy. Appl. Energy 2024, 353, 121961. [Google Scholar] [CrossRef]
- Zomorodian, Z.S.; Tahsildoost, M.; Hafezi, M. Thermal comfort in educational buildings: A review article. Energy Rev. 2016, 59, 895–906. [Google Scholar] [CrossRef]
- Das, S.; Subudhi, S. A review on different methodologies to study thermal comfort. Int. J. Environ. Sci. Technol. 2022, 19, 2155–2171. [Google Scholar] [CrossRef]
- Yang, Y.; Lyu, J.; Lian, Z.; Xie, Y.; Jiang, Y.; Lin, J.; Niu, J. Subjective information in thermal comfort evaluation methods: A critical review. Energy Build. 2024, 325, 115019. [Google Scholar] [CrossRef]
- Llanos-Jiménez, J.; Suárez, R.; Alonso, A.; Sendra, J.J. Objective and Subjective Indoor Air Quality and Thermal Comfort Indices: Characterization of Mediterranean Climate Archetypal Schools After the COVID-19 Pandemic. Indoor Air 2024, 2024, 2456666. [Google Scholar] [CrossRef]
- Nico, M.A.; Liuzzi, S.; Stefanizzi, P. Evaluation of thermal comfort in university classrooms through objective approach and subjective preference analysis. Appl. Ergon. 2015, 48, 111–120. [Google Scholar] [CrossRef]
- Mao, H.; Tsuchida, S.; Suzuki, Y.; Kanada, R.; Hori, T.; Terada, T.; Tsukamoto, M. Subjective and Objective Thermal Comfort Estimation Using Wearable Sensors and Environmental Sensors. J. Inf. Process. 2023, 31, 308–320. [Google Scholar] [CrossRef]
- Nassif, N. The impact of air filter pressure drop on the performance of typical air-conditioning systems. Build. Simul. 2012, 5, 345–350. [Google Scholar] [CrossRef]
- Pease, L.F.; Salsbury, T.I.; Anderson, K.; Underhill, R.M.; Flaherty, J.E.; Vlachokostas, A.; Burns, C.A.; Wang, N.; Kulkarni, G.; James, D.P. Size dependent infectivity of SARS-CoV-2 via respiratory droplets spread through central ventilation systems. Int. Commun. Heat Mass Transf. 2022, 132, 105748. [Google Scholar] [CrossRef]
- Pereira, L.D.; Neto, L.; Bernardo, H.; da Silva, M.G. An integrated approach on energy consumption and indoor environmental quality performance in six Portuguese secondary schools. Energy Res. Soc. Sci. 2017, 32, 23–43. [Google Scholar] [CrossRef]
Disclaimer/Publisher’s Note: The statements, opinions and data contained in all publications are solely those of the individual author(s) and contributor(s) and not of MDPI and/or the editor(s). MDPI and/or the editor(s) disclaim responsibility for any injury to people or property resulting from any ideas, methods, instructions or products referred to in the content. |
© 2025 by the authors. Licensee MDPI, Basel, Switzerland. This article is an open access article distributed under the terms and conditions of the Creative Commons Attribution (CC BY) license (https://creativecommons.org/licenses/by/4.0/).