Article

Source Apportionment of Ground-Level Ozone and Assessment of Emission Reduction Strategies in Shenyang, China


1
Chinese Research Academy of Environment Sciences, Beijing 100012, China
2
Hebei Meteorological Service, Shijiazhuang 210054, China
3
Shenyang Academy of Environmental Sciences, Shenyang 110067, China
*
Author to whom correspondence should be addressed.
Atmosphere 2026, 17(2), 179; https://doi.org/10.3390/atmos17020179
Submission received: 24 December 2025 / Revised: 3 February 2026 / Accepted: 6 February 2026 / Published: 9 February 2026
(This article belongs to the Section Air Quality)

Abstract

This study presents an in-depth analysis of ground-level ozone (O3) episodes in Shenyang from May to July 2019, utilizing advanced source apportionment modeling techniques: Ozone Source Apportionment Technology (OSAT), Geographic Ozone Assessment Technology (GOAT), and the High-order Decoupling Direct Method (HDDM). The research aimed to characterize the sources of O3 and assess the potential impact of emission reduction strategies on O3 concentrations. The results demonstrate that reducing emissions of both NOx and VOCs can lower O3 levels, with VOC controls proving to be more effective. During the ozone season, regional transport was identified as the dominant contributor to pollution, accounting for approximately 90% of the total, while local sources (sources within Shenyang’s administrative boundary) contributed only about 10%. On days with severe pollution, the long-range transport of O3 precursors was found to be the primary driver of Maximum Daily 8 h average O3 (MDA8 O3) exceedances in Shenyang. This study indicates that local measures alone are insufficient to eliminate O3 exceedances; for instance, in some scenarios, even with a simultaneous 60% reduction in both local anthropogenic VOCs and NOx emissions, MDA8 O3 levels would not meet the national standard of 160 µg·m−3. Therefore, effective mitigation strategies must include regionally coordinated, time-dependent controls. This study also highlights that local industrial and mobile sources contribute to over 70% of ozone formation, suggesting that targeting these sectors could yield the most significant local benefits. This research underscores the need for a comprehensive approach to O3 management, combining both local and regional efforts to address the complex issue of ground-level ozone pollution.

1. Introduction

In recent years, China has made progress in controlling airborne particulate pollution [1,2,3,4], but surface O3 pollution has become increasingly prominent as PM levels decline [5,6,7,8]. Shenyang, a core city of Northeast China, is vital to the regional revitalization plan, and its O3 issue merits attention [9,10,11]. Data from Shenyang’s national air-quality stations show that polluted days fell from 151 in 2013 to 63 in 2023, a drop of nearly 25%. While overall air quality has improved, O3 has become the dominant pollutant on more of these days. In 2013, O3 was the primary pollutant on only 10 non-attainment days, but this peaked at 45 days in 2017. Although the figure fell to 12 days in 2021, it remained above 20 days in other recent years. Meanwhile, the 90th percentile of MDA8 O3 stayed high, falling only slightly from 167 µg·m−3 in 2017 to 155 µg·m−3 in 2023, indicating that O3 now limits further air-quality gains in Shenyang.
Recent field campaigns have significantly deepened our understanding of ground-level O3 in Shenyang, with previous studies systematically examining its variability and meteorological drivers. During 2017–2022, the 90th percentile of MDA8 O3 in urban Shenyang rose from 164 µg·m−3 to 192 µg·m−3 even though city-wide NOx emissions decreased by 26% [12], a pattern attributable to enhanced ozone production efficiency under VOC-limited conditions. O3 pollution in Shenyang exhibits pronounced seasonality, with summer peaks strongly driven by high temperatures, intense solar radiation, and the summer monsoon [13,14,15]. Liu et al. showed that under hot-dry-moderate-wind conditions, suburban O3 production around Shenyang can outpace urban production by 20–30% [16]. Li et al. further found that a 10% rise in green-patch aggregation trims peak O3 by 2–4 ppb under hot–stagnant conditions, revealing landscape-scale cooling and deposition feedbacks as key controls in Shenyang [17]. Collectively, the above studies establish that O3 variability in Shenyang is governed not only by seasonal meteorology (temperature, humidity, monsoon circulation) but also by land-surface characteristics and precursor emissions [5,18,19,20]; disentangling and quantifying the relative contributions of meteorological drivers versus emission changes under mitigation scenarios therefore remains a critical, unresolved task.
Air-quality models can quantitatively assess how changes in emissions and meteorology affect regional O3 concentrations and are therefore essential for identifying the sources of urban and regional O3 [21,22,23,24]. The Comprehensive Air Quality Model with extensions (CAMx) is widely used for such simulations and for evaluating emission-control strategies [25,26,27,28]. In this study we applied the CAMx-OSAT module, the main tool for O3 source apportionment, to quantify the contributions of regional and industrial sources to O3 in Shenyang [29]. Previous CAMx-OSAT studies in Xining, Putian and Xinzhou have successfully identified the principal O3 sources in those cities and provided scientific guidance for local controls [30,31,32]. To date, Shenyang-based O3 research has relied mainly on observational analyses; integrated source apportionment and geographic O3 assessment remain scarce. Yet northeast China borders the Beijing–Tianjin–Hebei megacity region, and pollutant transport between the two areas is substantial. Moreover, as a major gateway for China’s opening to the north and a hub for Northeast Asian cooperation, Shenyang’s air quality directly affects its international image. Therefore, we combine OSAT and GOAT to quantify the regional, industrial and geographic origins of O3 in Shenyang, and use the high-order decoupled direct method (HDDM) to evaluate the O3 response to precursor (NOx and VOCs) emission reductions. The results will inform the design of effective O3 control policies for the region.

2. Selection of Simulation Period

From 2013 to 2025, polluted days in Shenyang fell steadily. They peaked at 175 in 2014 (47.9% of the year) and dropped to 37 by 2025 (10.1%), underscoring Shenyang’s tangible progress in air-pollution prevention and control.
As total polluted days declined, O3 became the dominant pollutant on an increasing share of non-attainment days (Figure 1). It should be noted that the primary pollutant was identified according to the calculation procedure prescribed by the National Ambient Air Quality Standards [33]. Only 10 such days were recorded in 2013, but this rose to 44 in 2017. Although the figure eased slightly in 2018–2019, it still accounted for ~40% of polluted days, indicating that O3 now limits further air-quality gains in Shenyang. In the years that followed, O3 remained the dominant pollutant in Shenyang on roughly 40% of days, with only minor fluctuations tied to the exceptional circumstances of the COVID-19 period.
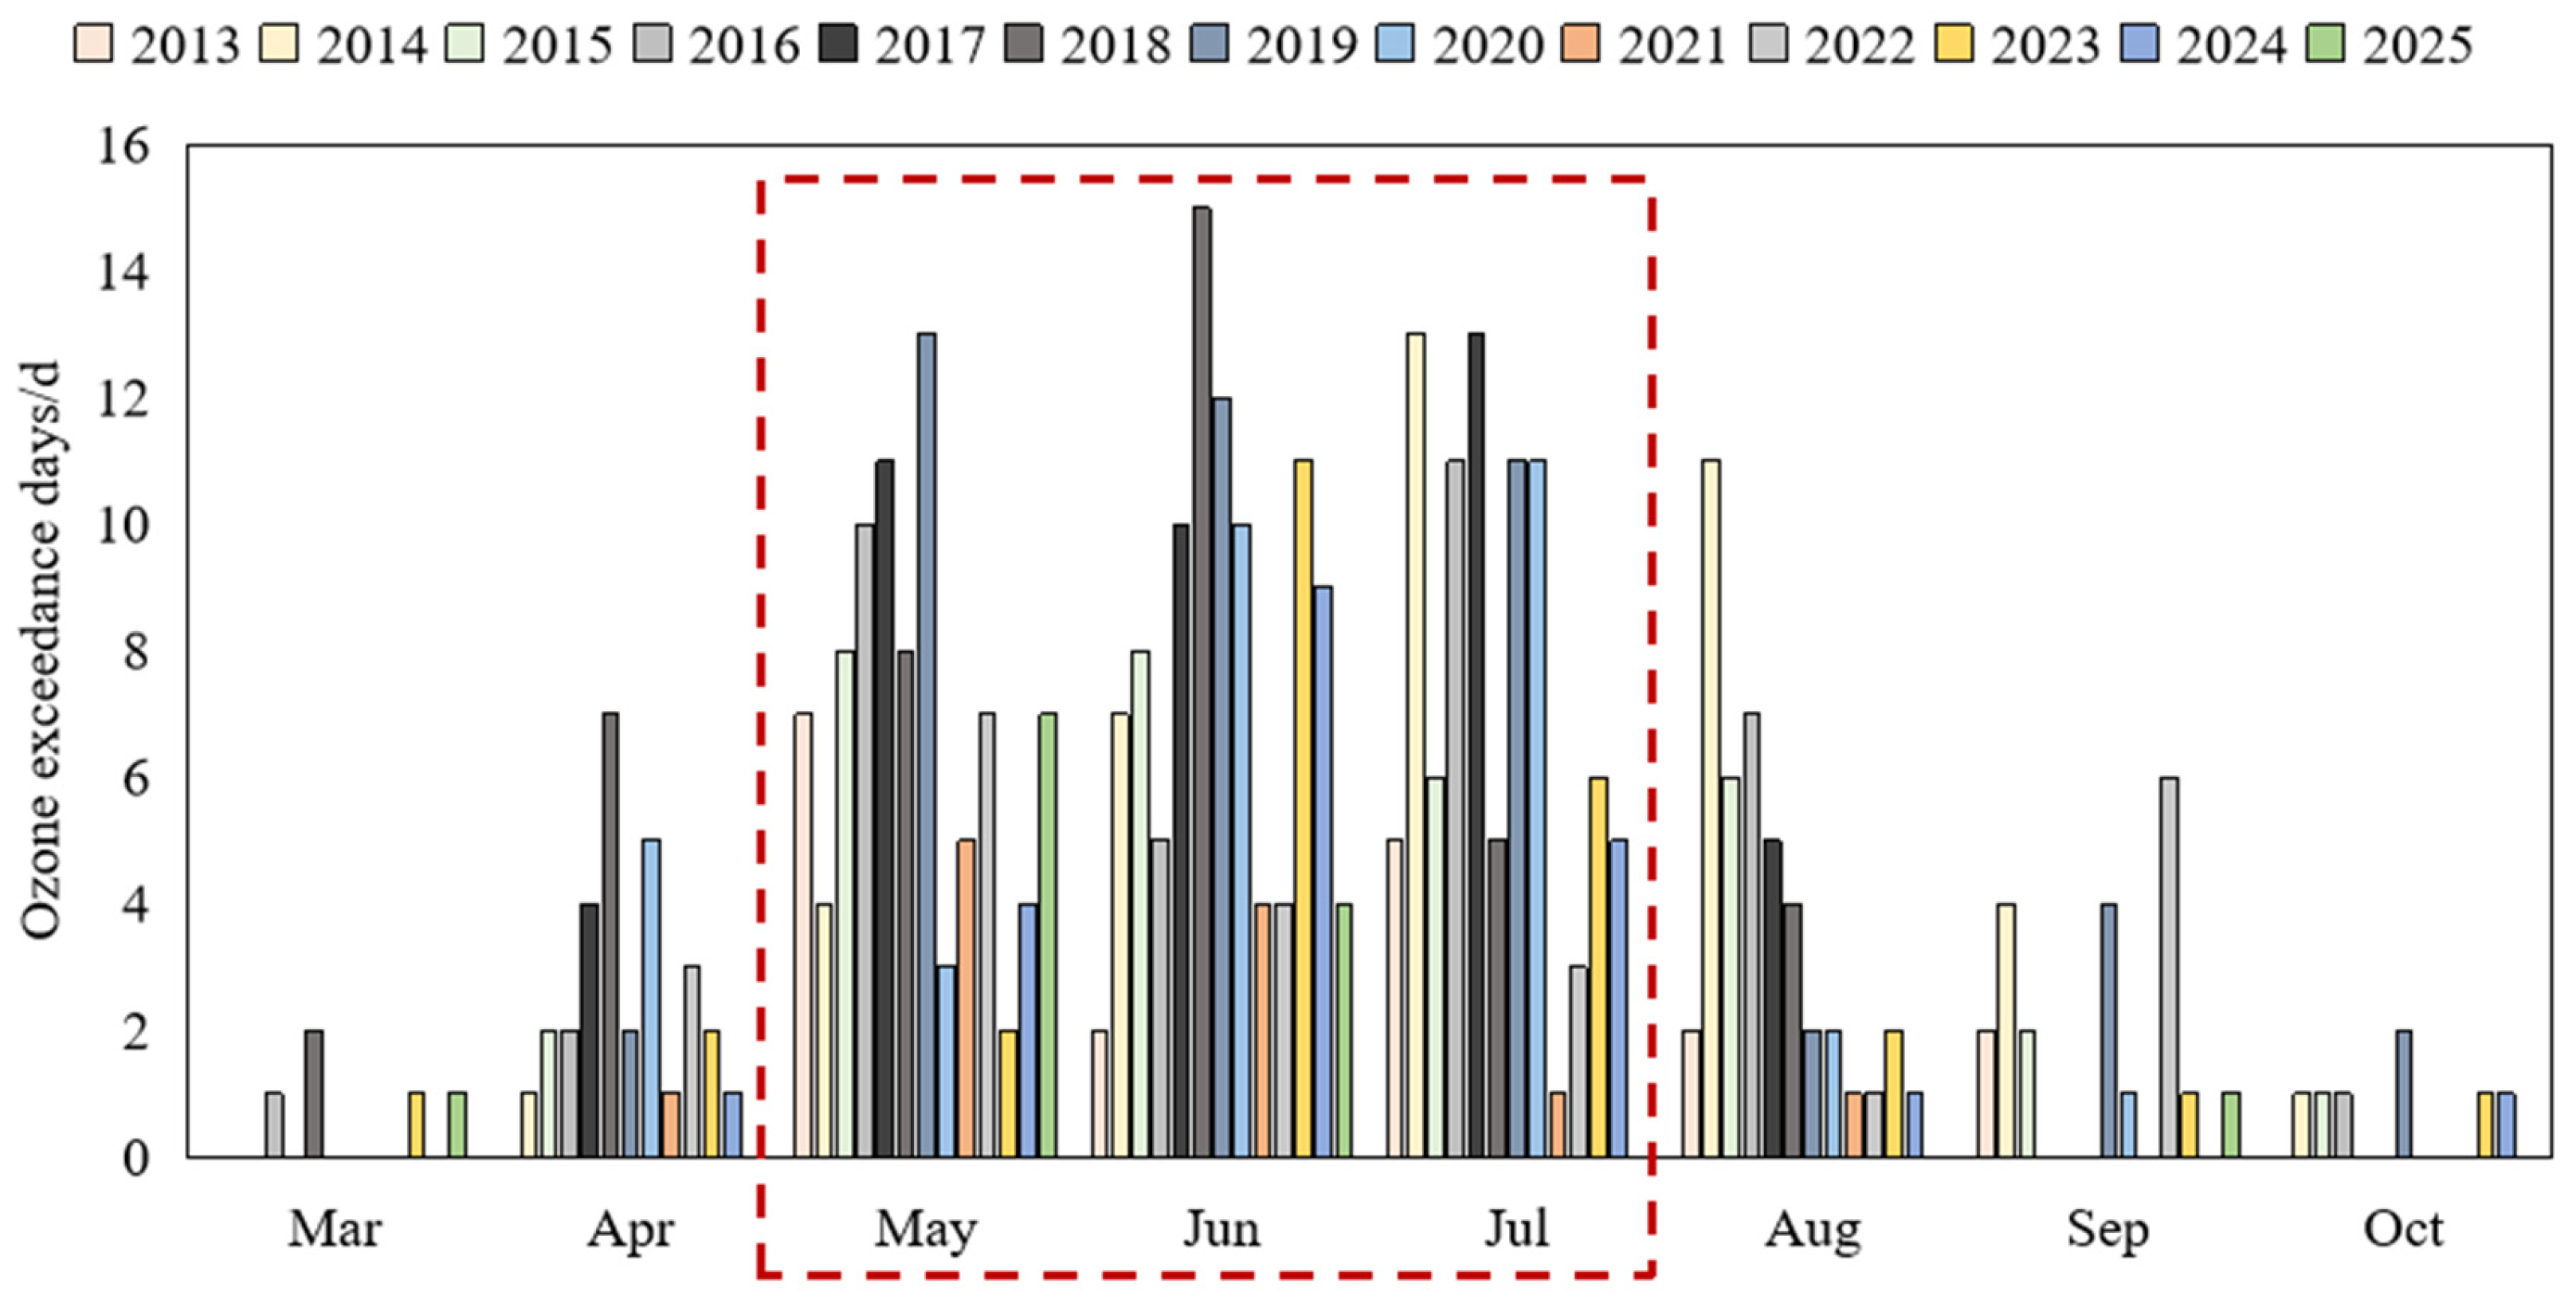
Temperature and hours of sunshine are the main meteorological drivers of surface O3 [13,14,34]. In Figure 2, Statistical analysis of exceedance days in Shenyang for 2013–2025 shows that high O3 concentrations occur mainly in late spring and summer, especially from May to July. An extremely high MDA8 O3 value, 262 µg·m−3, was recorded on 24 May 2019, and no such high MDA8 O3 value had been observed in any of the subsequent years. Consequently, the WRF-CAMx model was applied to simulate O3 concentrations in Shenyang for May–July 2019, defined here as the O3 season. To quantify regional and sectoral contributions, we therefore focused on the heavy O3 episode spanning 21–27 May 2019 that encompassed this peak (24 May 2019).

3. Research Method

3.1. Model Setting

The simulation employed double-layer nested grids with the third-generation air-quality model CAMx v6.2 (Lambert conformal projection; central longitude 110° E, latitude 35° N). The outer domain (Domain 1) covered China (57–161° E, 1–59° N) at 36 km × 36 km resolution with 200 × 160 cells. The inner domain (Domain 2), nested at the 101st column and 87th row of Domain 1, encompassed Shenyang, Liaoning Province and the Beijing–Tianjin–Hebei region (109–127° E, 33–45° N) at 12 km × 12 km resolution with 119 × 101 cells. Twenty vertical layers extend to ~15 km. Meteorological fields were supplied by WRF v3.9 with a 1 h time step and grid spacing identical to CAMx. Emissions were derived from the MEIC 2019 inventory (0.25° × 0.25°, Tsinghua University), processed with the U.S. EPA’s Sparse Matrix Operator Kernel Emissions (SMOKE) model, and further refined with local Shenyang data for SO2, NOx, VOCs, PM2.5 and PM10. Biogenic VOCs were computed with MEGAN. Gas-phase chemistry used SAPRC99 and aerosol chemistry the coarse-particle model; photolysis rates were calculated with the TUV model.
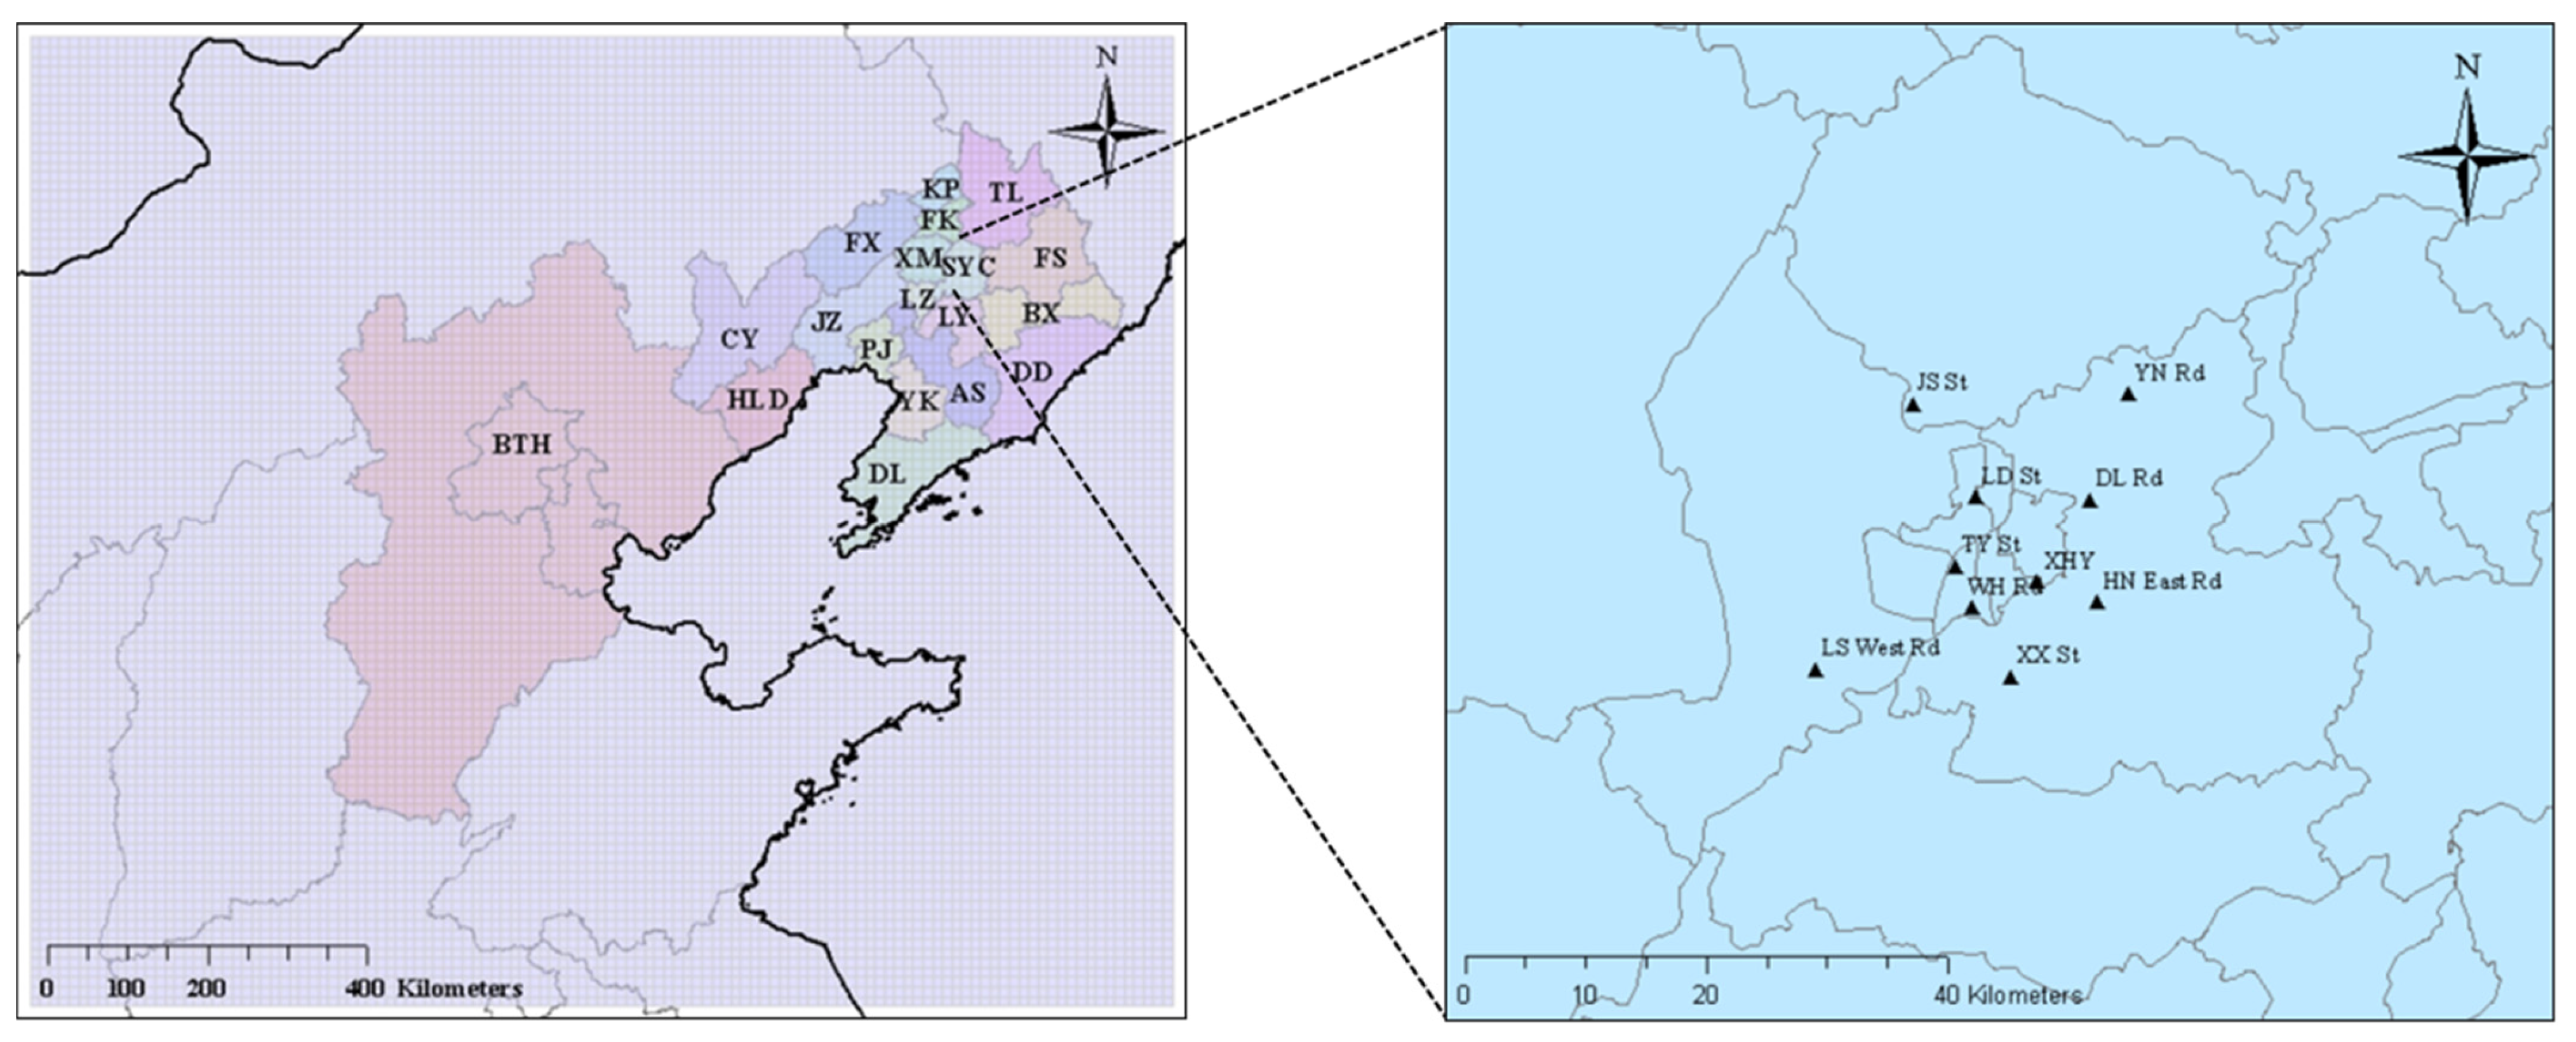
As shown in Figure 3, for the regional and geographic source analysis, the domain was divided into 20 source regions as listed below: Shenyang urban district (SYC), Kangping (KP), Faku (FK), Xinmin (XM), Liaozhong (LZ), Anshan (AS), Benxi (BX), Fushun (FS), Fuxin (FX), Jinzhou (JZ), Liaoyang (LY), Tieling (TL), Panjin (PJ), Huludao (HLD), Dandong (DD), Dalian (DL), Chaoyang (CY), Yingkou (YK), Beijing–Tianjin–Hebei (BTH), and other areas (OTH), that is, the remaining areas within the modeling domain. OSAT was then used to quantify the contributions of these regions to O3 and its precursors (NOx and VOCs), while the contributions of local industrial, residential, transport and power-plant emissions to NOx, VOCs and O3 in Shenyang were evaluated separately. Geographic O3 formation was analyzed with GOAT. The receptor locations are the 10 national-grade air-quality monitoring stations operated within Shenyang’s urban districts, as listed below: Dongling Road (DL Rd), Xinxiu Street (XX St), Jingshen Street (JS St), Hunnan East Road (HN East Rd), Liaoshen West Road (LS West Rd), Yunong Road (YN Rd), Taiyuan Street (TY St), Xiaoheyan (XHY), Wenhua Road (WH Rd), and Lingdong Street (LD St). The modeled concentrations were extracted from the corresponding grid cells, and their arithmetic mean was taken to represent the city-wide result for Shenyang.

3.2. Quantitative Analysis of Contributions

OSAT and GOAT embedded in the CAMx model were employed to quantify the contributions of different emission sources and geographical regions to ambient O3 concentrations in the study domain.
OSAT employs a pollutant-tagging approach to quantify the contribution of O3 precursors from different regions and source categories to O3 formation. That is, OSAT tags the produced O3, enabling the apportionment of contributions between locally generated and externally transported O3. OSAT distinguishes between O3 formed under NOx-limited versus VOC-limited regimes, attributing production to the limiting reagent. The method provides source-specific O3 contributions at each grid cell and timestep, enabling identification of dominant emission sectors and regional transport pathways.
GOAT extends OSAT by geographically tagging O3 and its precursors according to their origin within user-defined receptor regions [35]. The technique employs a boundary-trajectory approach to track air mass transport, combining source region information with chemical apportionment. GOAT calculates the fractional contribution of each geographical source region to O3 concentrations at designated receptor locations by integrating along backward trajectories. This method effectively separates local production from regional transport, quantifying trans-boundary O3 contributions under varying meteorological conditions.

3.3. Assessment of Control Measures

Sensitivity analysis examines how the atmospheric system responds to changes in one or more variables and can quantify the relationship between ambient O3 and emissions from different sources.
The decoupled direct method (DDM) is a widely used forward sensitivity analysis technique that computes semi-normalized sensitivity coefficients [36,37,38], as given by:
S i j * = p ˜ j C i p j = p ˜ j C i ( j p ˜ j ) = C i j
In the equation, p ˜ j denotes the original source emissions, and j denotes the fractional reduction (0–1).
The sensitivity parameters computed by DDM share the same units as the pollutant concentrations. DDM is more direct, efficient and stable than alternative sensitivity-calculation methods, and its sensitivity coefficients immediately reveal how emission reductions affect concentrations. For example, if Sij > 0, cutting emissions from source j lowers the concentration of pollutant i; if Sij < 0, the reduction is ineffective or even raises concentrations.
Built on DDM, the high-order decoupled direct method (HDDM) computes first- and second-order sensitivity coefficients together with interaction terms [39]. Like DDM, its sensitivity parameters carry the same units as the pollutant concentrations. Once the sensitivity of concentration to emissions is known, the quantitative relationship between concentration and source control can be established via Taylor expansion; thus, the impacts of different NOx and VOC control scenarios on ground-level O3 in Shenyang are given by:
Δ C O 3 Δ NO x S NO x ( 1 ) + Δ VOCs S VOCs ( 1 ) + 1 2 Δ NO x 2 S NO x ( 2 ) + 1 2 Δ VOCs 2 S VOCs ( 2 ) + Δ NO x Δ VOCs S NO x VOCs ( 2 )

4. Results and Discussion

4.1. Validation of Simulation Results

WRF was used to simulate and verify meteorological conditions (temperature, relative humidity and wind speed) in Shenyang from May to July 2019. Meteorological observations were obtained from Shenyang national meteorological station (WMO ID 54342), whose measurements are taken as representative of the city. WRF captures these variables well: temperature bias = −0.69 °C, RMSE = 2.55 °C, R = 0.80; relative-humidity bias = −1.71%, RMSE = 13.06%, R = 0.68. Near-surface wind speeds are overestimated, with bias = 2.04 m/s, RMSE = 2.40 m/s and R = 0.56. These findings agree with earlier studies reporting overestimated wind speeds in plains and valleys [40,41]. High wind speeds promote regional transport dominance by advecting upwind pollutants into the study area and diluting local emissions, potentially leading to an overestimation of exogenous O3 contributions while masking weak local source signals in source apportionment results [42].
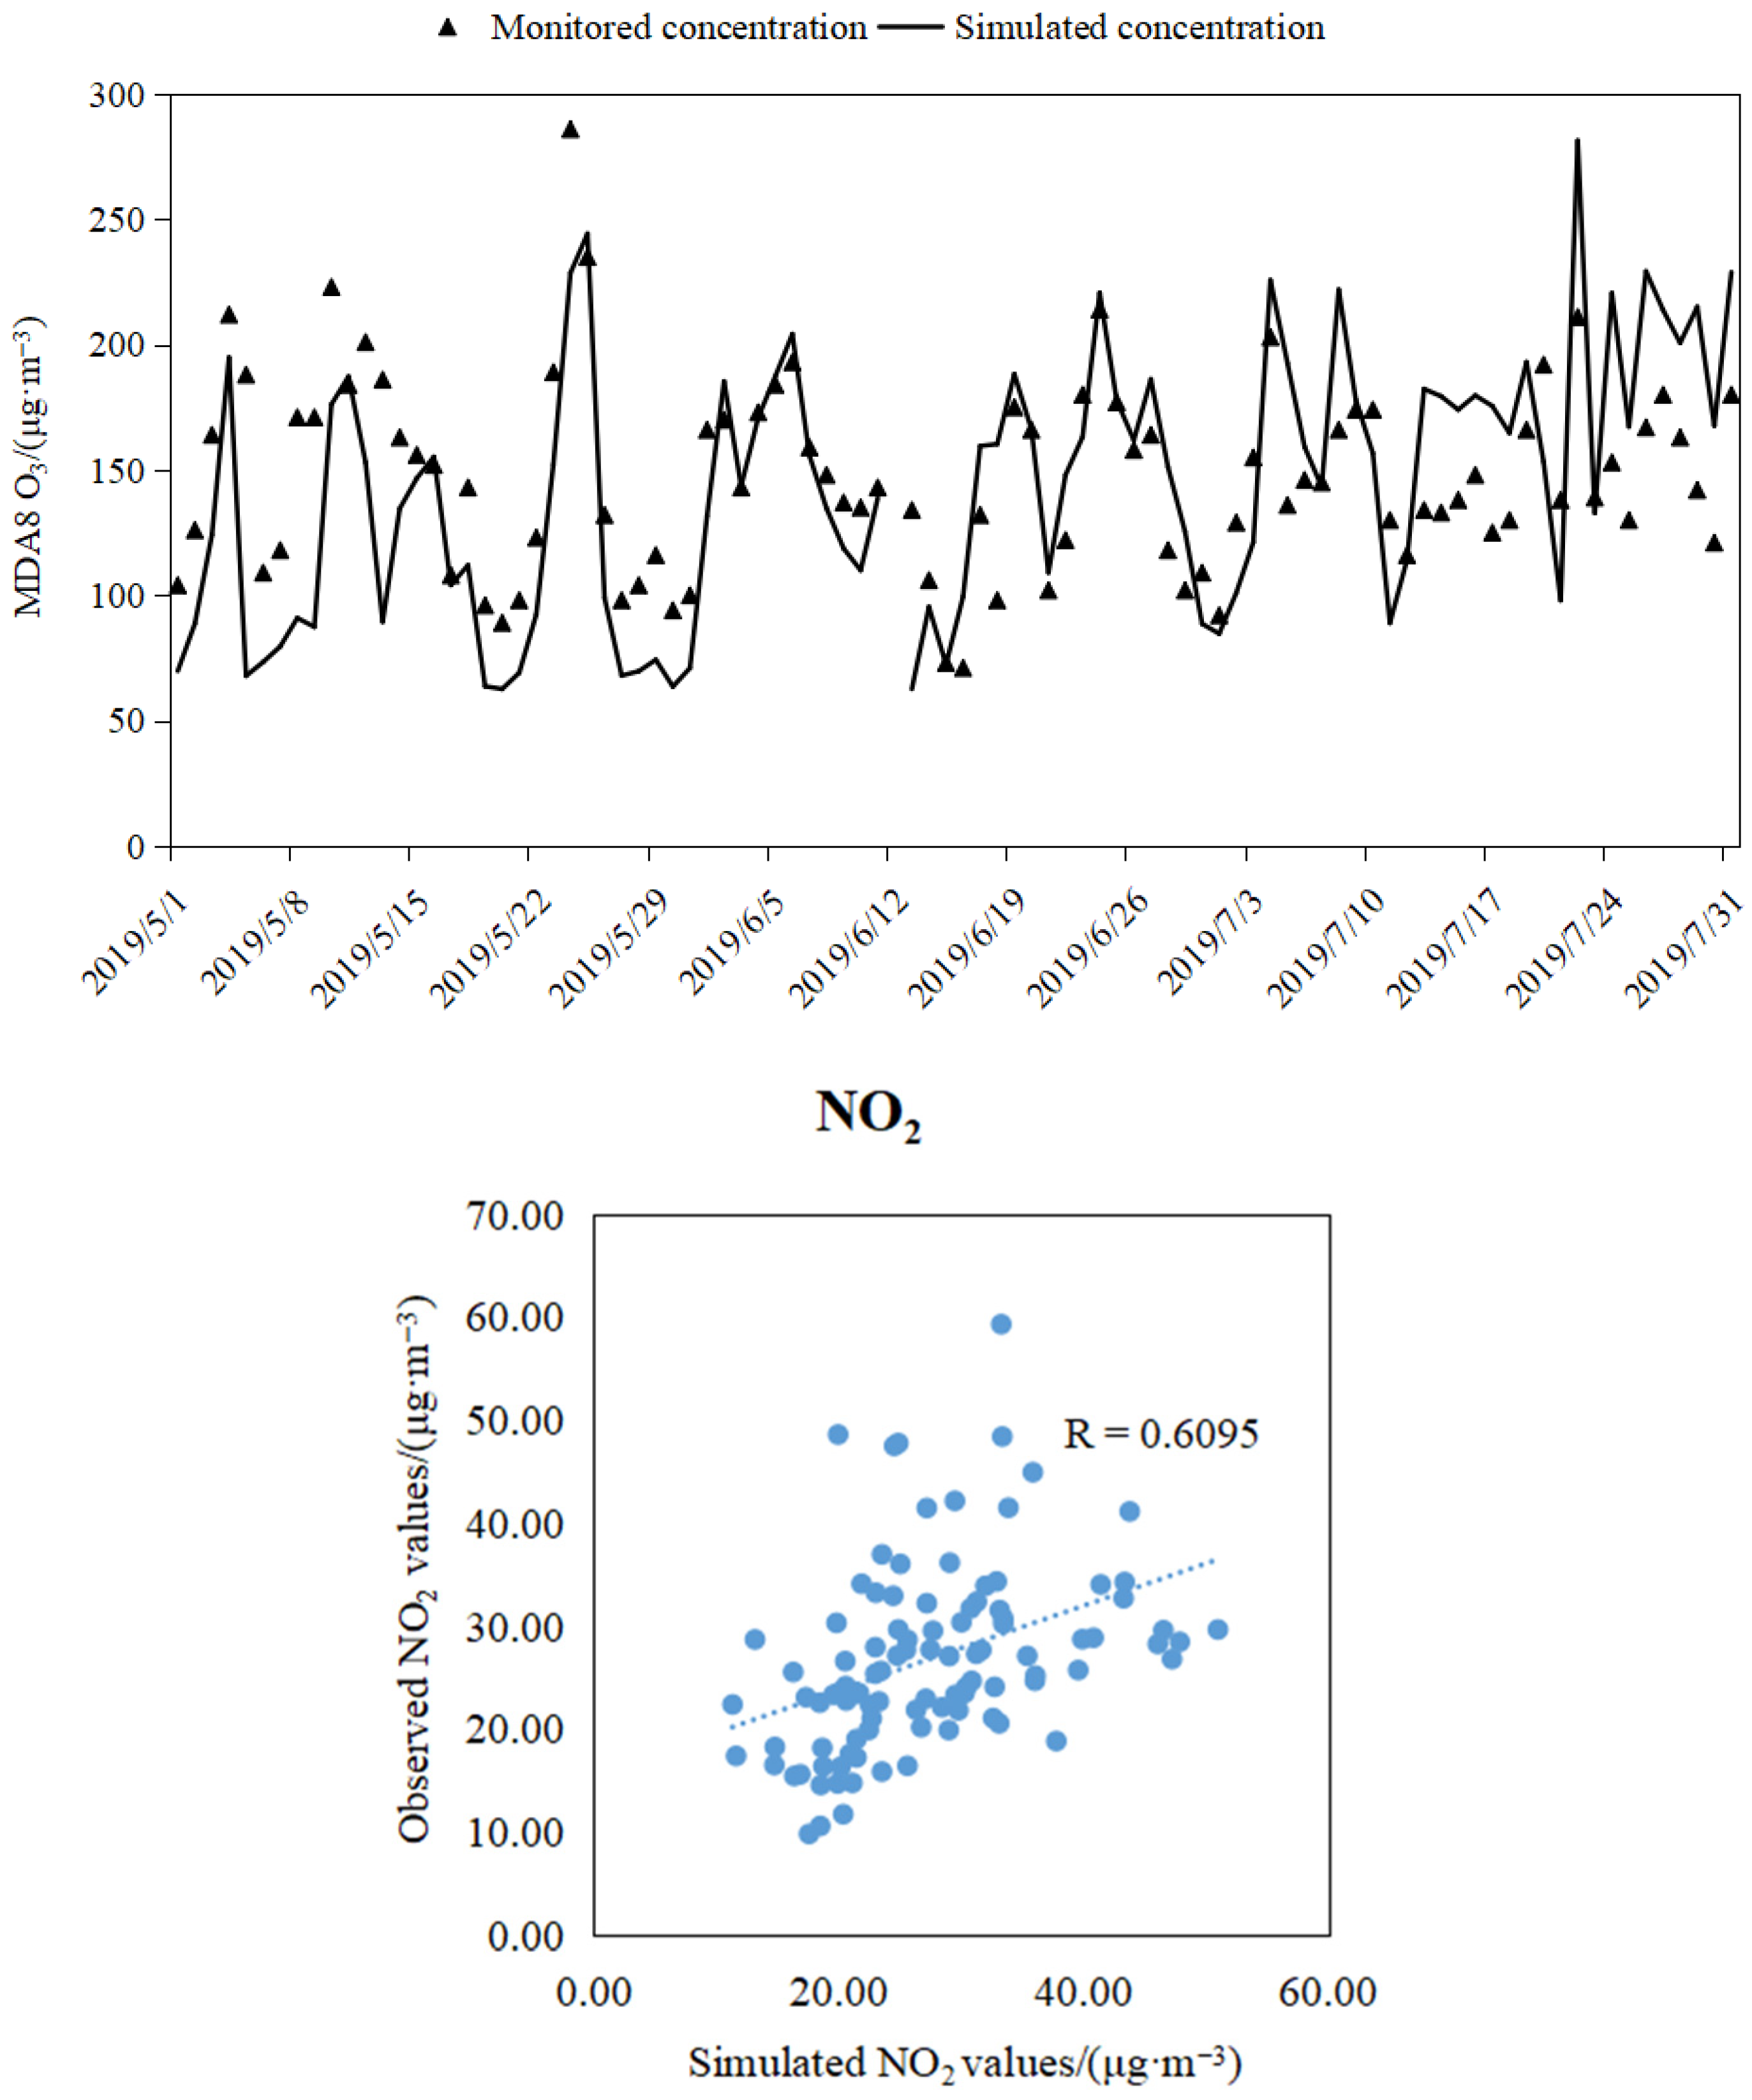
Based on CAMx, atmospheric pollutant concentrations in Shenyang from May to July 2019 were simulated and evaluated against national monitoring sites. As shown in Table 1 and Figure 4, CAMx reproduces ambient NO2 and O3 well, with correlation coefficients R > 0.6. Normalized mean bias (NMB) and normalized mean error (NME) for both species were within ±0.5 and <0.5, respectively, indicating acceptable error [43]. Inventory uncertainties and the chemical mechanism are the main sources of NO2 simulation error and also contribute to O3 uncertainty [36]; additionally, the level of detail in the VOC emission inventory (spatial distribution, speciation, etc.) affects O3 simulation accuracy.

4.2. Identification of O3 Control Zones in Shenyang

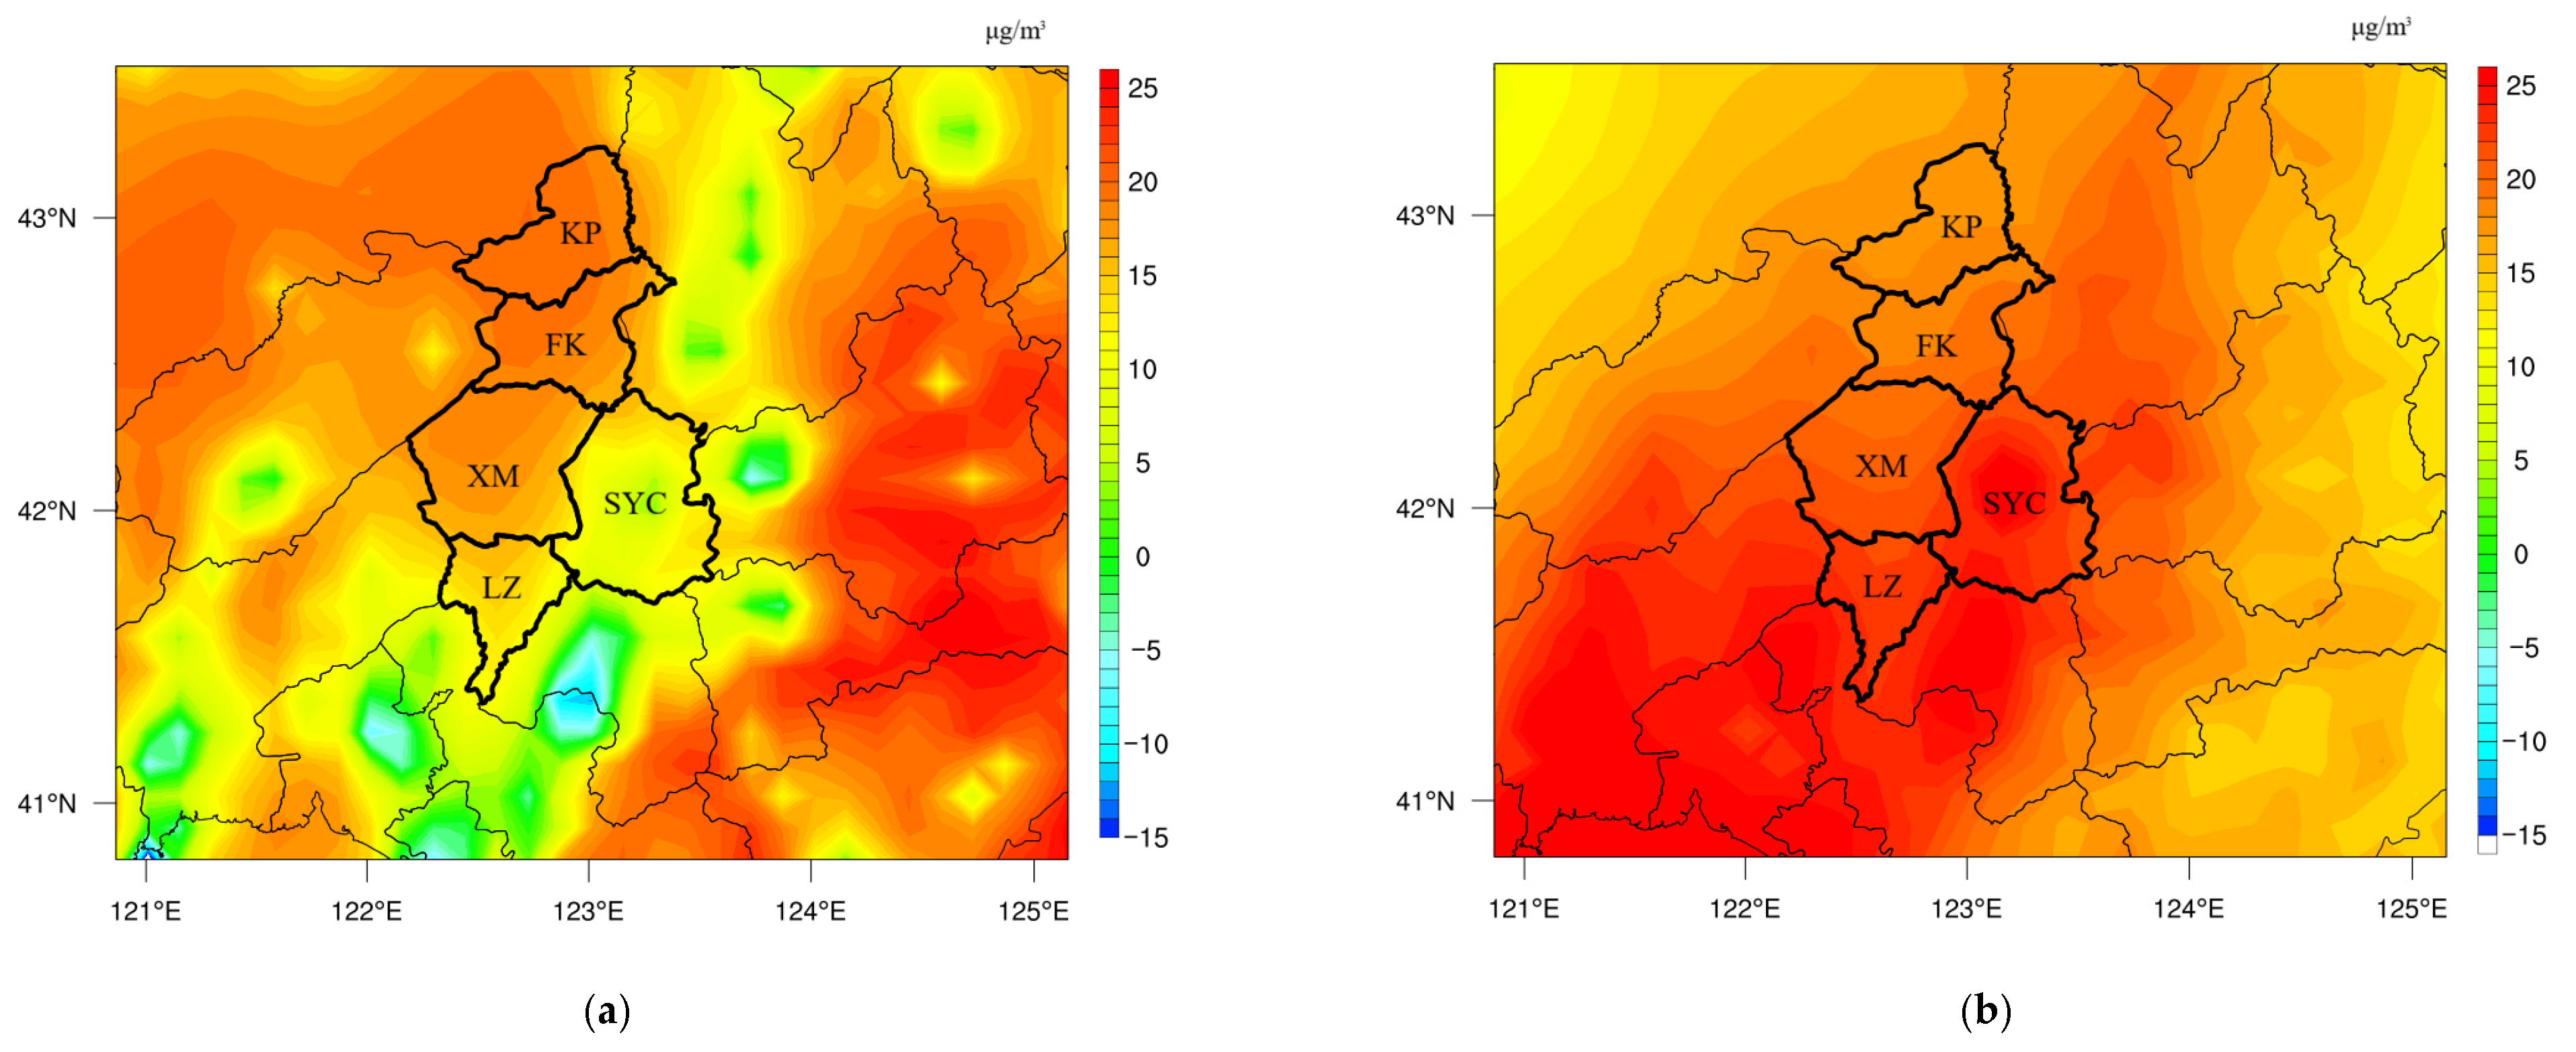
CAMx-DDM was used to quantify the sensitivity of ambient O3 in Shenyang to NOx and VOC emissions. Figure 5 shows that MDA8 O3 in the north-west (KP, FK, XM) was positively sensitive to both precursors, but more strongly to NOx, indicating a NOx-limited regime; concurrent reductions are required, with NOx control yielding the greater benefit. In contrast, south-east Shenyang (SYC, LZ) exhibited markedly higher sensitivity to VOCs than to NOx, implying a VOC-limited regime where VOCs reductions are more effective. These patterns agree with Wang et al., Li et al. and Zhang et al. [44,45,46], who reported that Chinese urban and industrially developed areas are typically VOC-limited, whereas suburbs are NOx-limited or transitional.
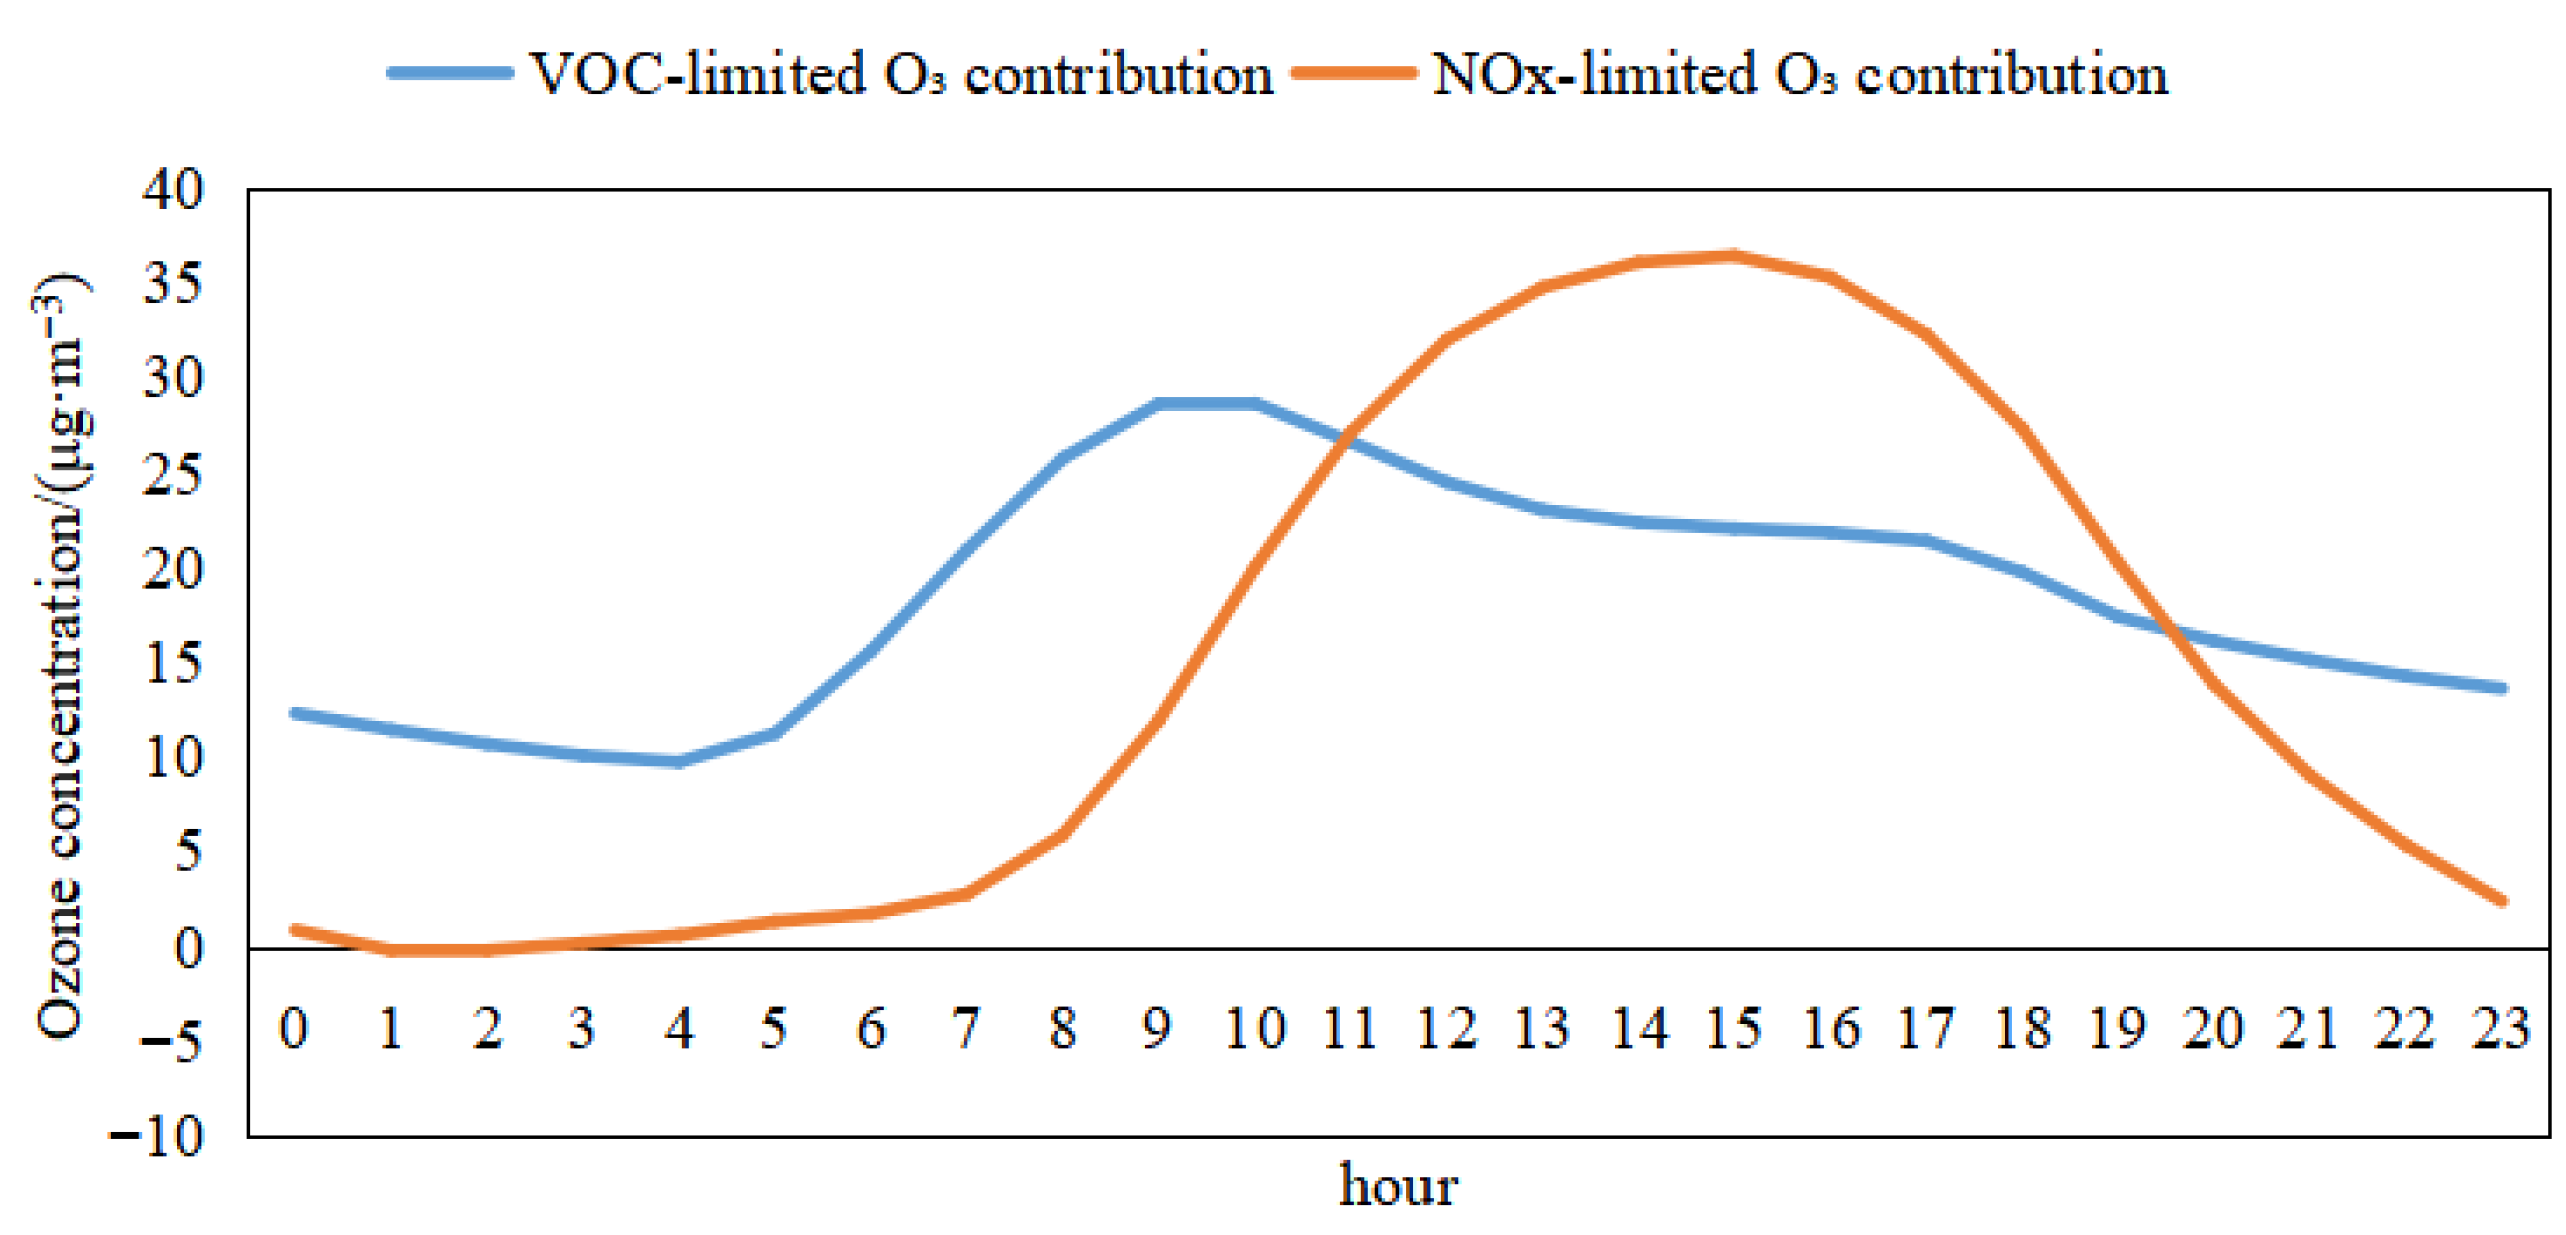
Based on the above findings, we examined the hourly sensitivity of O3 to VOCs and NOx in Shenyang (averaged over the O3 season). The reported values are the grid-cell averages extracted at the latitude–longitude positions of Shenyang’s national ambient air-quality monitoring stations. As shown in Figure 6, O3 is more sensitive to VOCs; however, between 11:00 and 19:00 it is more sensitive to NOx. Reducing NOx emissions is therefore most effective during daytime, whereas VOC controls are more beneficial at other times. Time-varying emission controls thus offer the greatest potential for O3 mitigation. Consistent with previous CMAQ-HDDM-3D modeling studies over the Yangtze River Delta region that demonstrated a convex response of O3 to NOx emissions—with positive first-order and negative second-order sensitivities during afternoon peak hours, suggesting NOx reduction is more effective than VOC-only control for mitigating peak O3 [47]—this study further highlights the importance of time-specific and precursor-targeted emission control strategies for effective O3 management.

4.3. Regional and Local Industrial Contributions to O3 Concentration

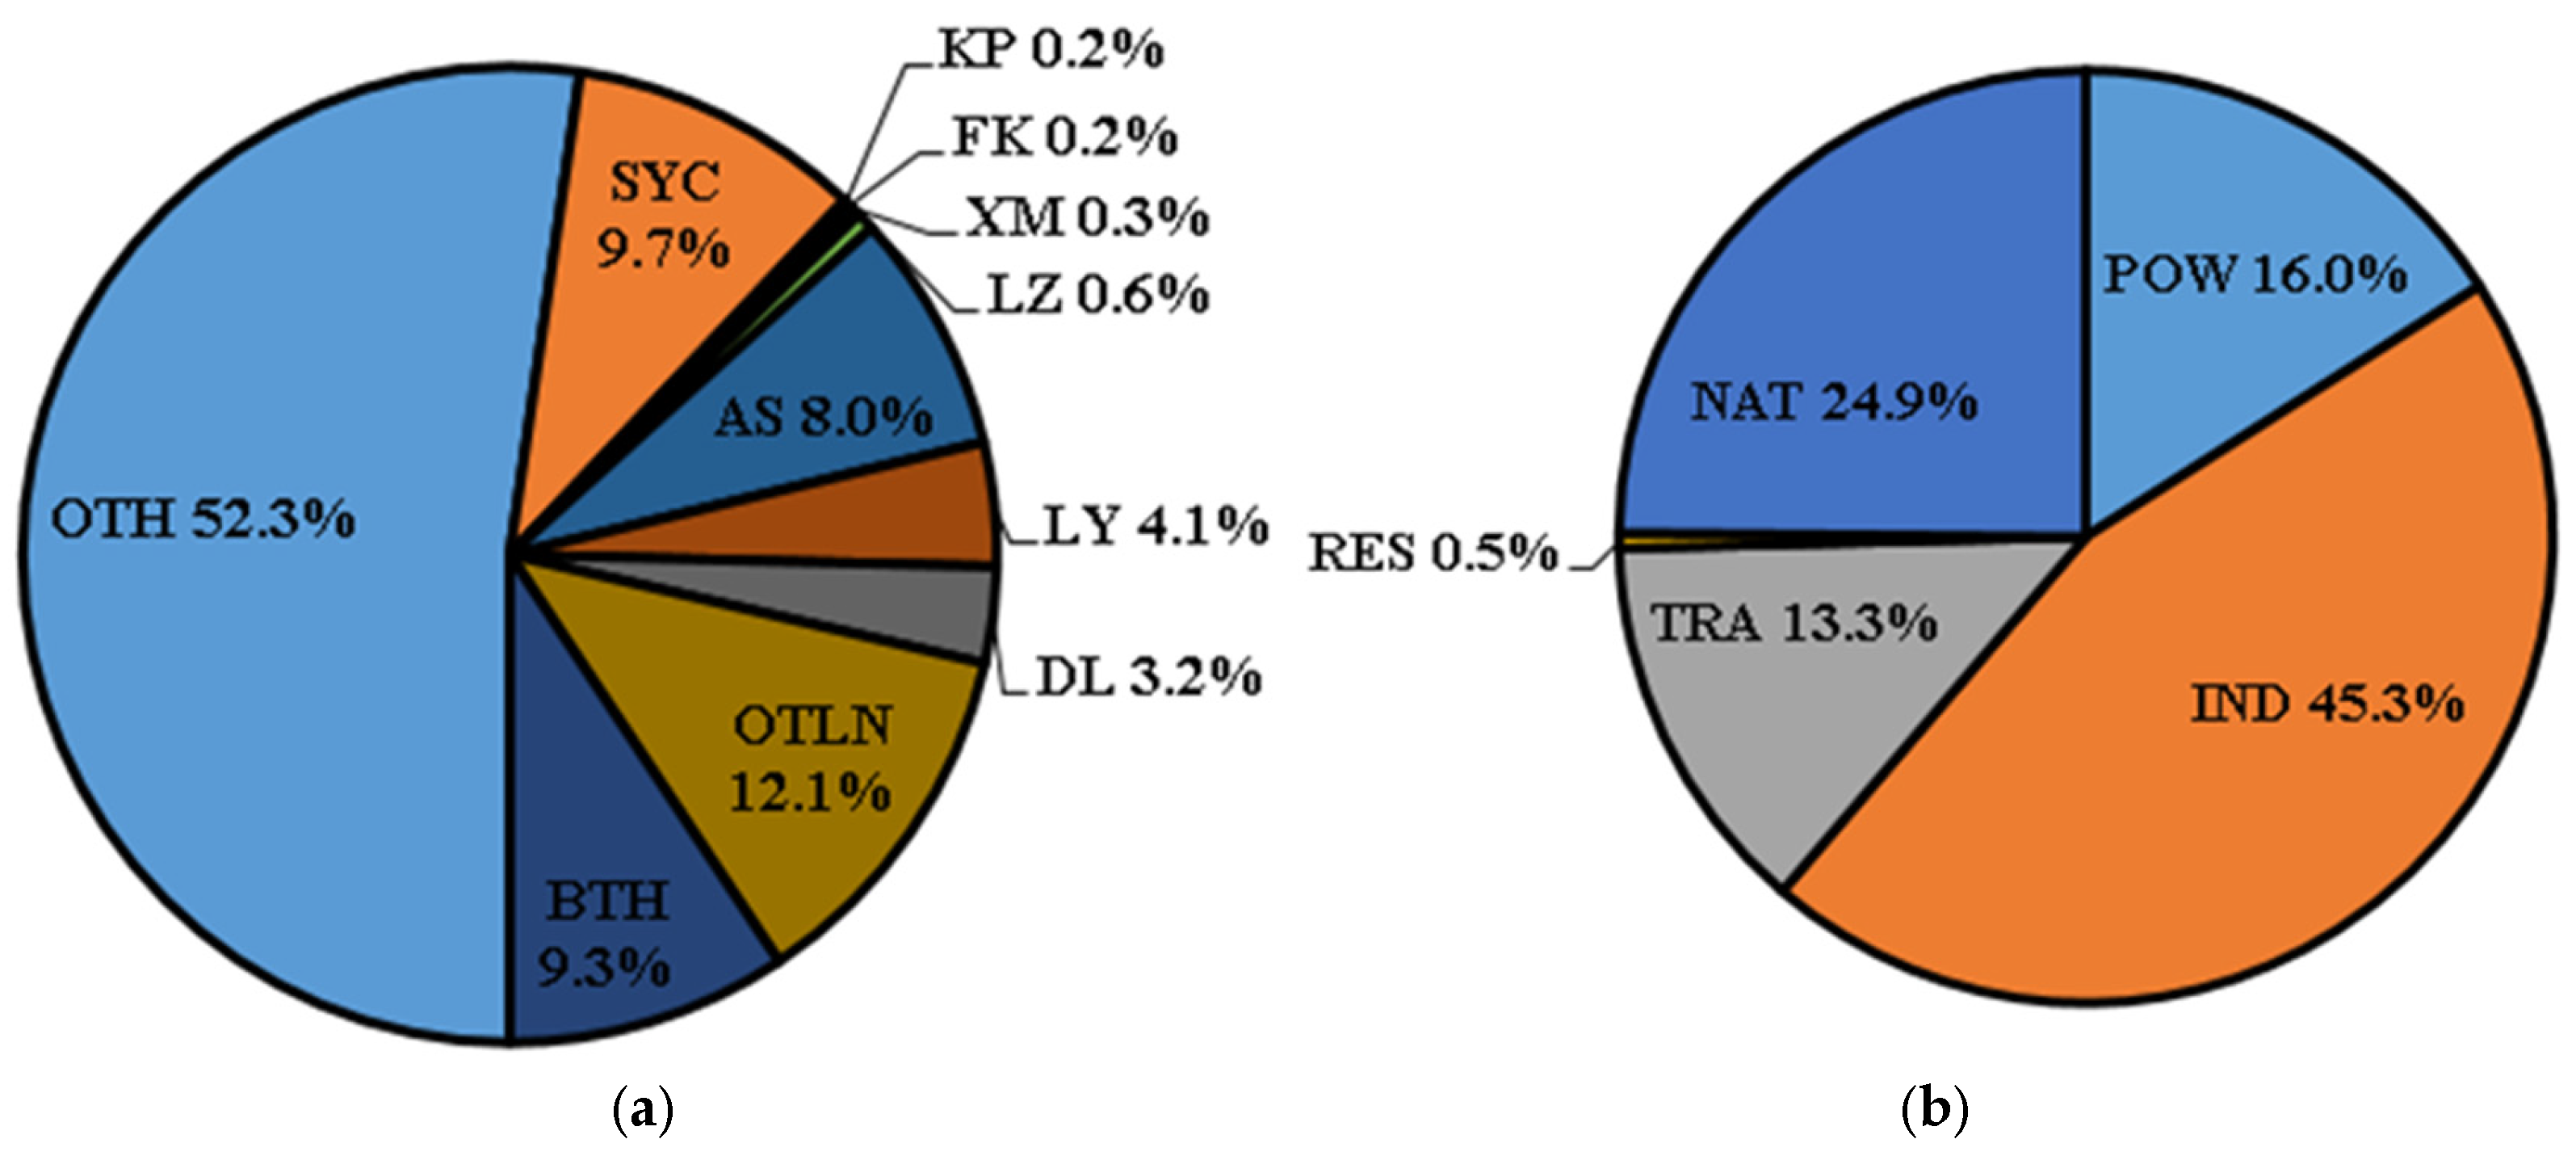
Figure 7 shows that more than half of the O3 originated from other regions (OTH), according to the regional contribution simulation for O3 in Shenyang (May–July 2019). Within Liaoning, Shenyang urban district (SYC) contributed 9.7%, and Anshan (AS) led at 8.0%, followed by Liaoyang (LY) and Dalian (DL); the remaining cities collectively added 12.1%. Beijing–Tianjin–Hebei (BTH) supplied 9.3%. It can be inferred from the above results that regional transport plays the predominant role. This can be attributed to the fact that regional transport not only elevates the local pollution baseline but also offsets local mitigation benefits through precursor advection, thereby fundamentally limiting the effectiveness of isolated urban control measures. Locally, industrial sources (IND) dominated at over 45%, natural emissions (NAT) contributed about 25%, power plants (POW) and transport (TRA) provided 16.0% and 13.3%, respectively, and residential (RES) sources had the smallest impact.

4.4. Evaluation of Ozone-Precursor Emission Reductions

Based on the O3 control zone results and the MDA8 O3 data from Shenyang’s national air-quality monitoring sites, O3 pollution days from May to July 2019 were classified into three levels:
  • Class III (160 < MDA8 O3 ≤ 170 µg·m−3, mean 166 µg·m−3, slight), including 8 days;
  • Class II (170 < MDA8 O3 ≤ 200 µg·m−3, mean 182 µg·m−3, moderate), including 11 days;
  • Class I (MDA8 O3 > 200 µg·m−3, mean 218 µg·m−3, severe), including 5 days.
The 90th percentile of the MDA8 O3 for the same period was also analyzed. Emission reduction scenarios for NOx and VOCs ranging from 10% to 60% (in 10% steps) were applied to evaluate the control effectiveness and the feasibility of attaining the O3 standard in Shenyang.
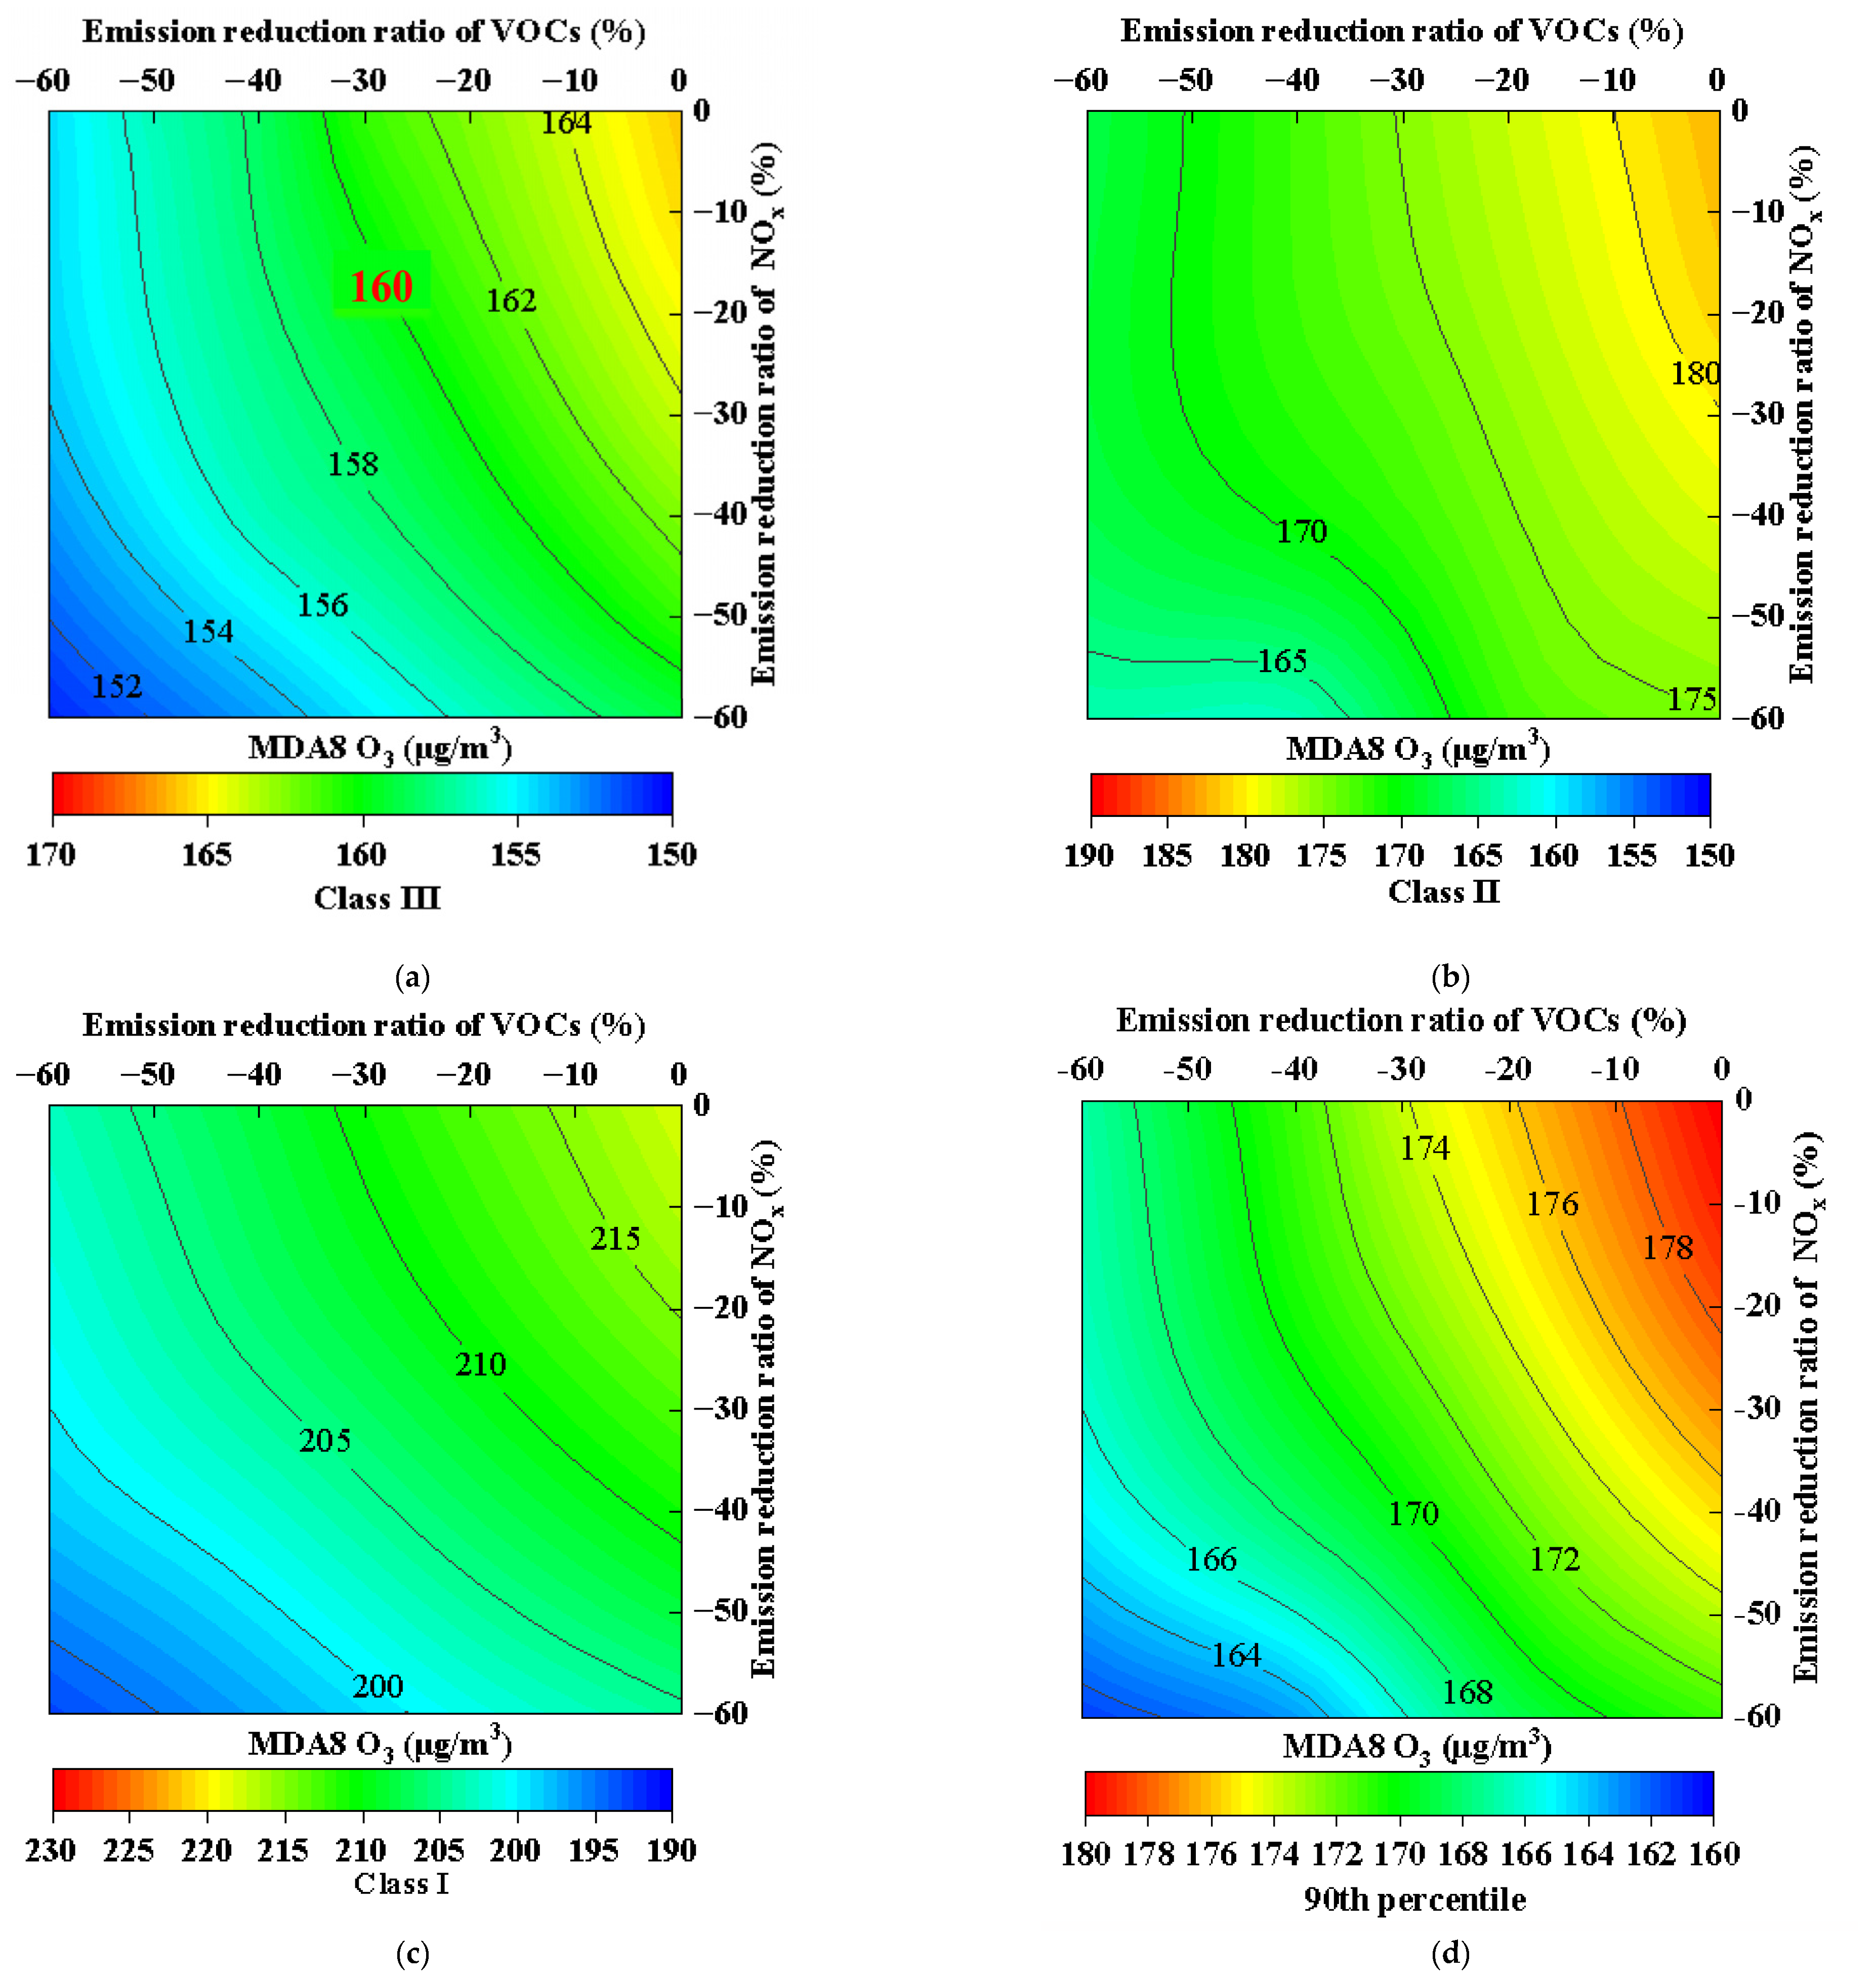
Figure 8 and Table 2 show that reducing anthropogenic NOx and VOC emissions in Shenyang markedly lowers ambient O3, consistent with CMAQ-HDDM studies identifying northeast China’s spring–summer O3 as a NOx–VOC joint-control regime (Itahashi et al., 2013 [39]).
Our analysis demonstrates that the efficacy of local emission controls is strongly dependent on O3 pollution severity. Under moderate conditions (Class III), a 60% reduction in either VOCs or NOx achieves the MDA8 O3 standard (160 µg/m3), with VOCs proving more effective; simultaneous 60% reductions yield an additional ~11 µg/m3 decrease.
However, this approach fails under elevated pollution. For Class II and I scenarios, simultaneous 60% precursor reductions decrease MDA8 O3 by >20 µg/m3 and ~25 µg/m3, respectively, indeed leading to measurable air-quality improvements, yet remain non-compliant. Similarly, at the 90th percentile, joint 60% reductions achieve only a ~19 µg/m3 decrease, insufficient to meet standards. Thus, local controls alone are inadequate for severe O3 events.
These limitations reflect the fundamentally regional nature of O3 pollution, where transboundary precursor transport overwhelms local emission reductions during peak episodes. Consequently, regional joint prevention and control is essential for severe pollution management. Furthermore, the pronounced hourly variations in O3 sensitivity to NOx and VOCs necessitate time-resolved, precursor-specific mitigation strategies—such as staggered regional controls aligned with diurnal photochemical dynamics—to optimize efficacy and minimize socioeconomic costs. Future policies should integrate tiered responses: intensive local actions for routine conditions, escalating to coordinated regional interventions during severe episodes.

5. Analysis of Typical O3 Pollution Process in Shenyang

5.1. Analysis of O3 Pollution Attribution

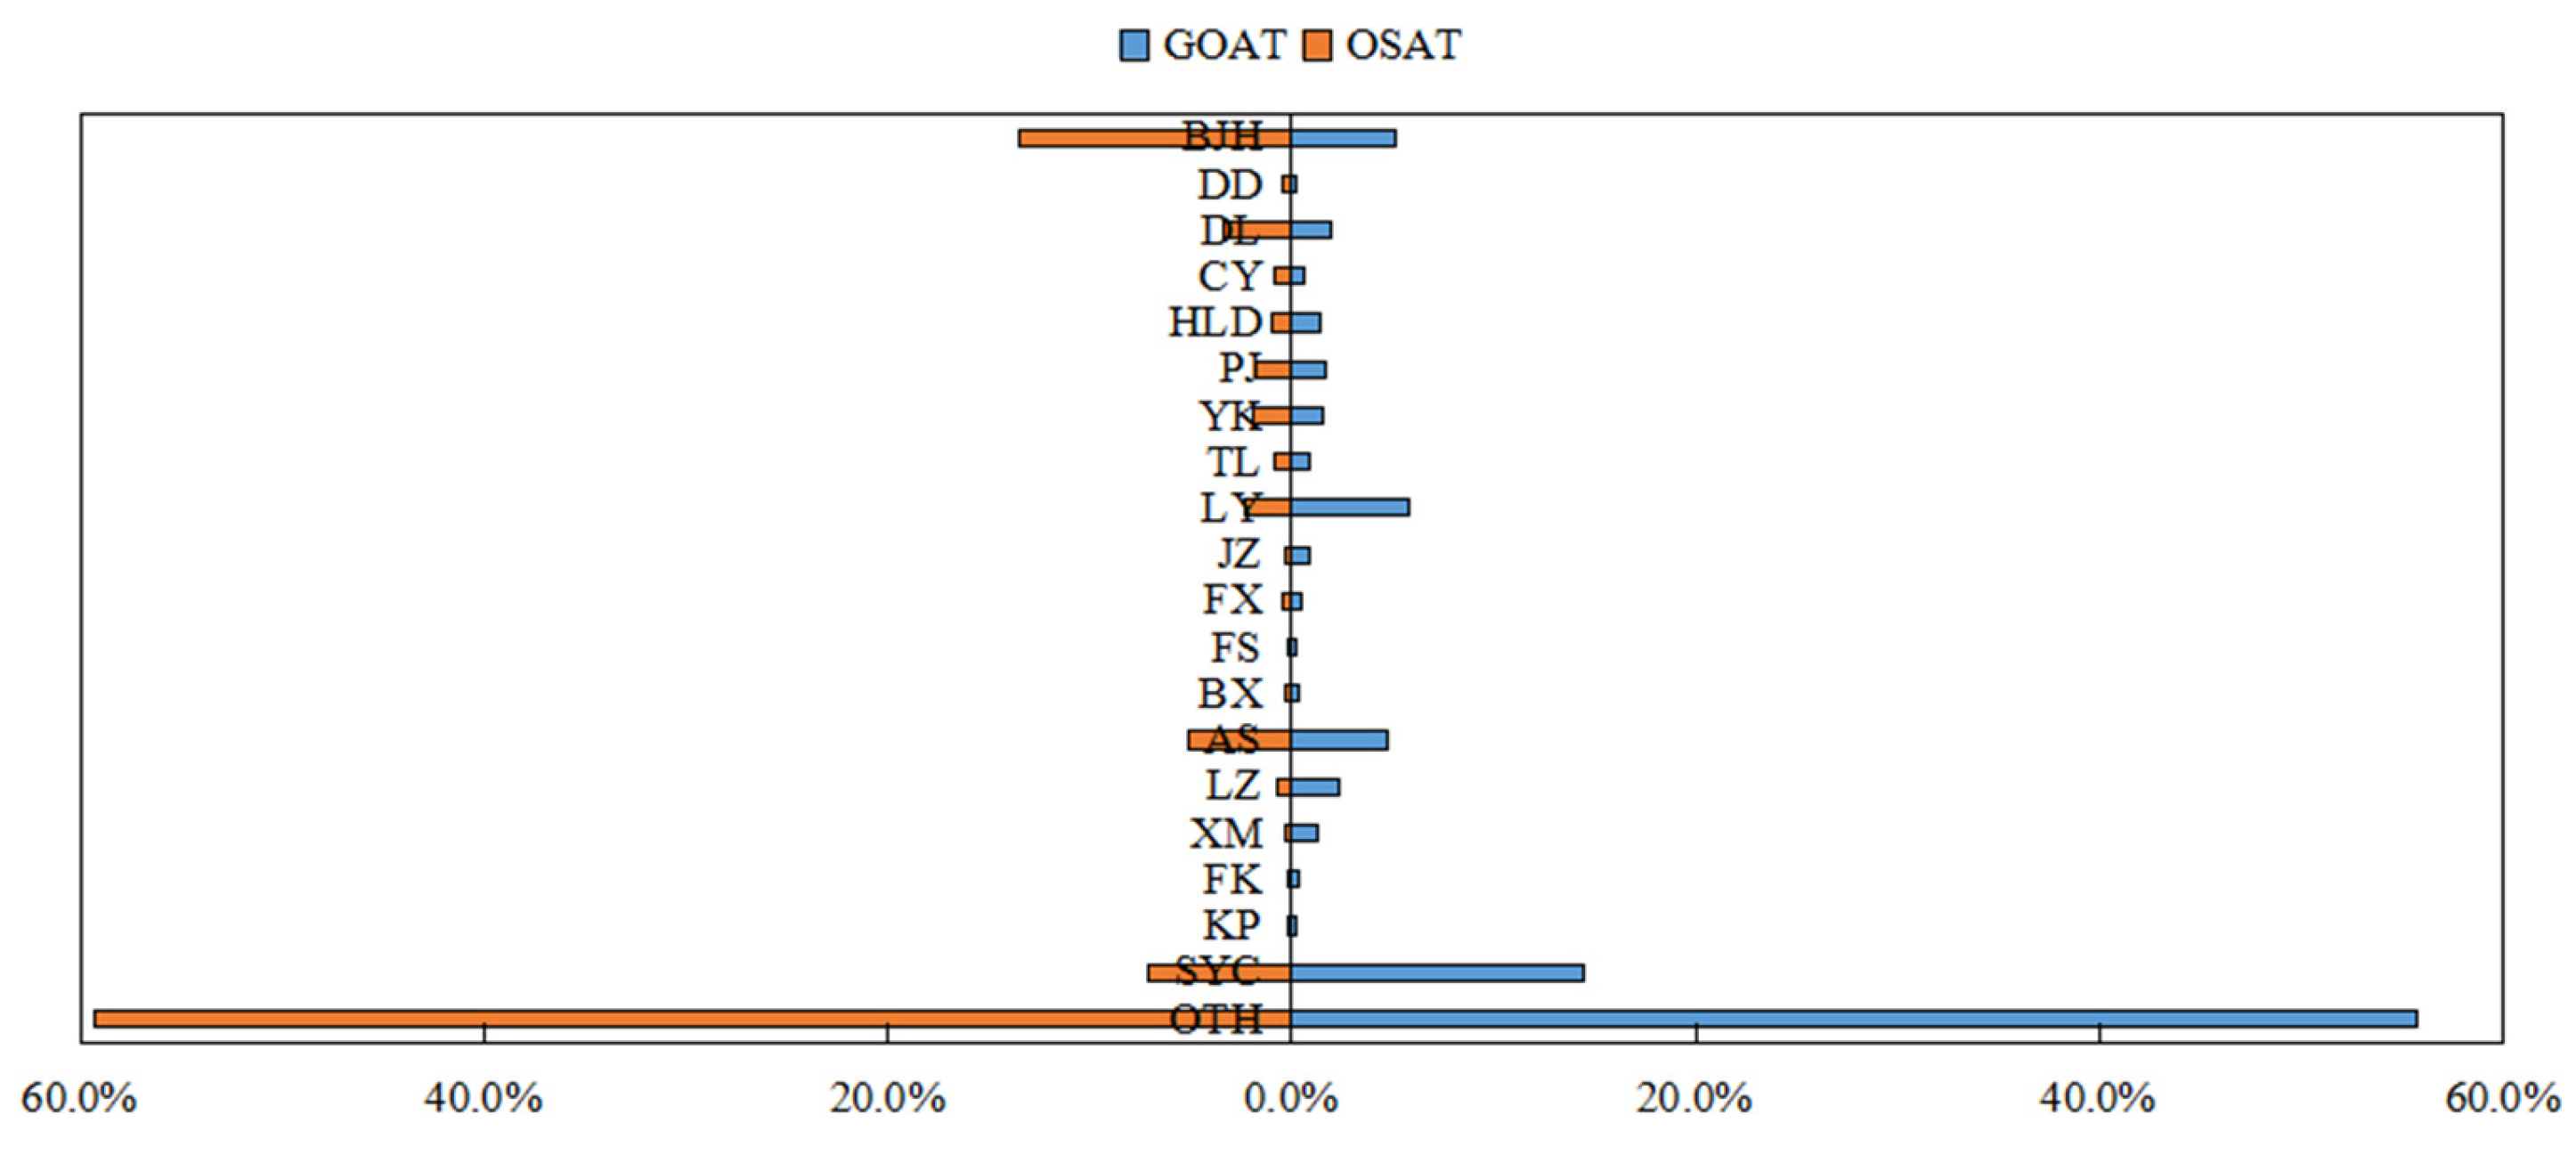
As shown in Figure 9, no significant difference exists between OSAT and GOAT results for the mean O3 pollution event in Shenyang during 21–27 May 2019. Both indicate that other regions (OTH) dominate, contributing ~60%. The key distinction is in source attribution: OSAT allocates more O3 to long-range transport, whereas GOAT highlights local formation. Nevertheless, long-range transport remains a major driver during O3 pollution episodes [35].

5.2. Industrial Contributions During the O3 Pollution Episode

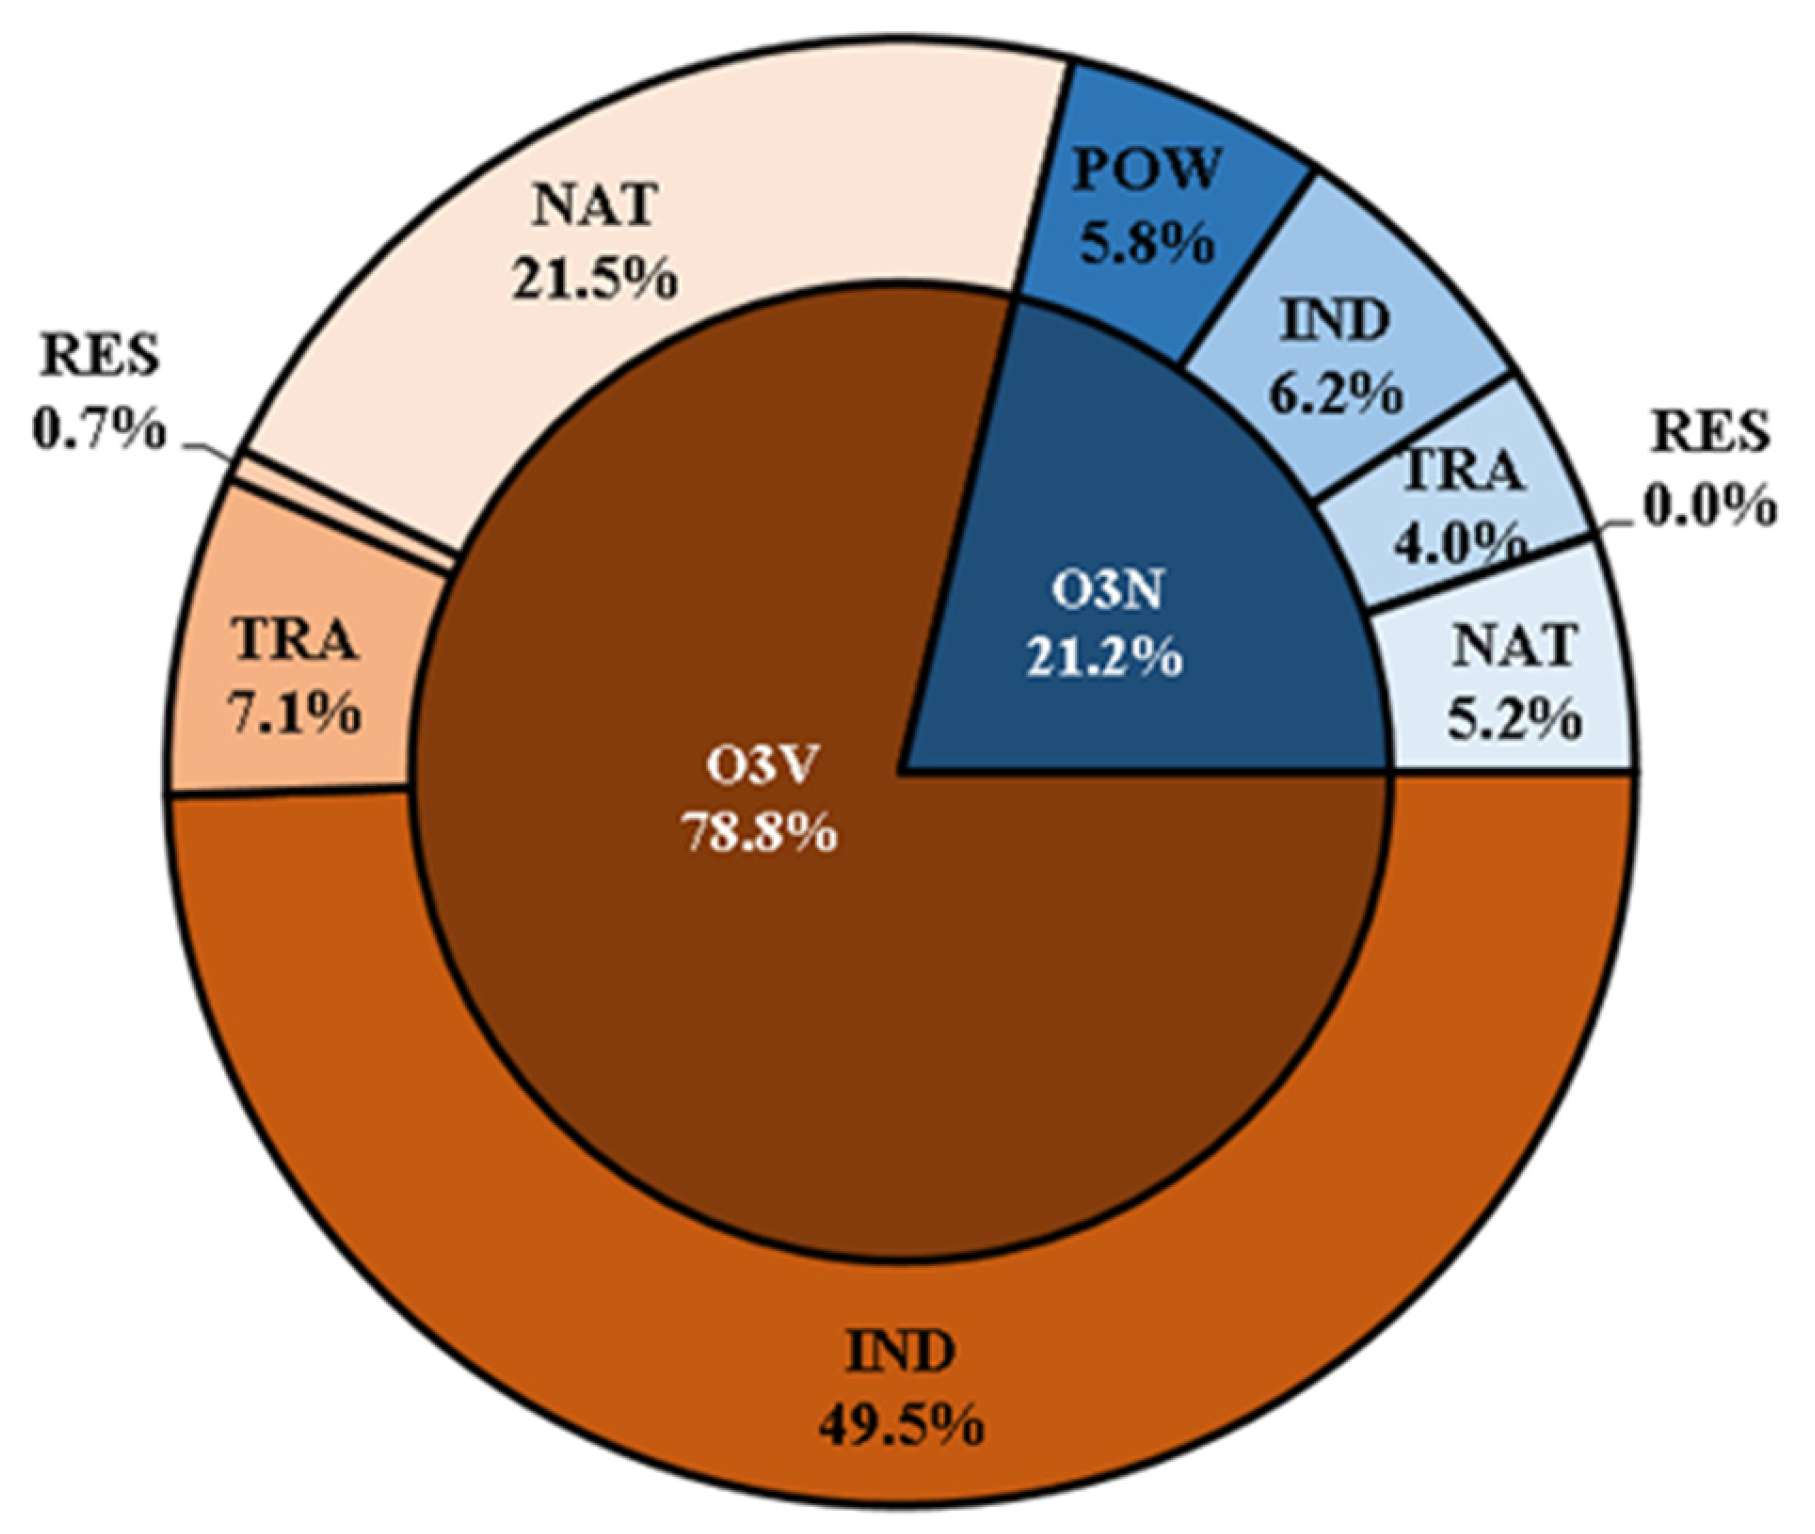
Figure 10 shows that during 21–27 May 2019, 78.8% of O3 was formed under VOC-limited conditions, with industrial sources contributing the largest share—accounting for nearly 50% of total O3 production, followed by natural sources. Meanwhile, 22.2% under NOx-limited conditions, industry and power each contributed about 6% of total O3 production. Therefore, during severe O3 episodes, priority should be given to reducing large industrial VOC emissions (e.g., from coating, printing and dyeing operations).

6. Conclusions

This study conducts O3 simulations for Shenyang during the O3 season. O3 source apportionment was used to quantify regional and sectoral contributions, and high-order sensitivity analysis evaluated the effectiveness of various emission reduction scenarios. Shenyang lies in a NOx–VOC collaborative control zone; simultaneous reductions in anthropogenic NOx and VOCs alleviate O3 pollution. Because O3 sensitivity to these precursors exhibits pronounced hourly variations, time-varying controls are essential for effective mitigation.
Sectoral analysis shows that industrial VOC emissions—contributing nearly 50% of local O3—should be prioritized for mitigation. However, O3 in Shenyang is heavily influenced by regional transport of O3 and its precursors, making it difficult to meet air-quality standards through local measures alone. While deep local emission reduction remains essential as a foundation for long-term air-quality improvement, regional joint prevention and control is the key to solving severe pollution episodes. Secondary pollutant management thus requires integrating local and regional strategies, particularly to address transboundary transport and chemical interactions.

Author Contributions

Methodology, Y.L. and X.D.; validation, N.Z., Y.H. and H.L.; data curation, W.T.; writing—original draft preparation, Y.L.; writing—review and editing, Y.Y., Z.Z. and Z.W. All authors have read and agreed to the published version of the manuscript.

Funding

This research is funded by the project of Systematic Engineering Development and Demonstration Application of Air Pollution Prevention and Control (Project No. 2022YFC3703405), the project of Mechanisms and Regulation Demonstration of Reactive Nitrogen Impacts on Regional PM2.5 and O3 Pollution (Project No. 2022YFC3701105).

Institutional Review Board Statement

The study did not require ethical approval.

Informed Consent Statement

Not applicable.

Data Availability Statement

The original contributions to the study are included in the article; further inquiries can be directed to the corresponding author.

Conflicts of Interest

The authors declare no conflicts of interest.

References

  1. Ministry of Ecology and Environment of the People’s Republic of China. China Air Quality Ameliorated Report (2013–2018); Ministry of Ecology and Environment of the People’s Republic of China: Beijing, China, 2019; pp. 1–5.
  2. Wang, W.X.; Chai, F.H.; Ren, Z.H.; Wang, X.F.; Wang, S.L.; Li, H.; Gao, R.; Xue, L.K.; Peng, L.; Zhang, X.; et al. Process, achievements and experience of air pollution control in China since the founding of the People’s Republic of China 70 years ago. Res. Environ. Sci. 2019, 32, 1621–1635. [Google Scholar]
  3. Dao, X.; Ji, D.S.; Zhang, X.; Tang, G.G.; Liu, Y.; Wang, L.L.; Cheng, L.J.; Wang, Y.S. Characteristics of chemical composition of PM2.5 in Beijing-Tianjin-Hebei and its surrounding areas during the heating period. Res. Environ. Sci. 2021, 34, 1–10. [Google Scholar]
  4. Li, H.; Wang, S.L.; Zhang, W.J.; Wang, H.; Wang, H.; Wang, S.B.; Li, H.S. Characteristics and influencing factors of urban air quality in Beijing-Tianjin-Hebei and its surrounding areas(‘2+26’ cities). Res. Environ. Sci. 2021, 34, 172–184. [Google Scholar]
  5. Jiang, H.; Chang, H.M. Analysis of China’s ozone pollution situation, preliminary investigation of causes and prevention and control recommendations. Res. Environ. Sci. 2021, 34, 1576–1582. [Google Scholar]
  6. Fu, Y.; Liao, H.; Yang, Y. Interannual and decadal changes in tropospheric ozone in China and the associated chemistry-climate interactions: A review. Adv. Atmos. Sci. 2019, 36, 975–993. [Google Scholar] [CrossRef]
  7. Yu, Y.J.; Meng, X.Y.; Wang, Z.; Zhou, W.; Yu, H.X. Driving factors of the significant increase in surface ozone in the Beijing-Tianjin-Hebei region, China, during 2013–2018. Environ. Sci. 2020, 41, 106–114. [Google Scholar]
  8. Hong, L.; Hou, X.W.; Liu, D.; Zou, C.X. Impact of Economic and Environmental Factors on O3 Concentrations in the Yangtze River Delta Region of China. Atmosphere 2023, 14, 1487. [Google Scholar] [CrossRef]
  9. Wang, Z.R. Analysis on Temporal Variation Characteristics of Shenyang Air Quality Index (AQI) and Its Prediction Models; Shenyang Agriculture University: Shenyang, China, 2019. [Google Scholar]
  10. Li, Q.Q. Spatial and Temporal Distribution Characteristics and Influencing Factors of Ozone Concentration in Shenyang Area; Shenyang Aerospace University: Shenyang, China, 2019. [Google Scholar]
  11. Li, Z. Air Quality Analysis and Pollution Source Analysis of a Typical Region in Shenyang; Liaoning University: Shenyang, China, 2019. [Google Scholar]
  12. Zhu, J.; Chen, L.; Liao, H.; Gao, Y.; Qiu, Y.; Wang, H.; Li, N. Contrasting changes in ozone during 2019–2021 between eastern and other regions of China. Atmos. Pollut. Res. 2023, 14, 101843. [Google Scholar]
  13. Zhang, C.H.; Zhao, T.L.; Lu, Z.Y.; Wang, D.D.; Chen, Y.S.; Yang, R.W.; Wang, F. Analysis of change characteristics of air pollutants and meteorological influencing factors in Shenyang. Environ. Sci. Technol. 2020, 43, 39–46. [Google Scholar]
  14. Wang, C.; Wang, S.; Yang, B.B.; Zhang, L.H.; Wang, L.; Liu, M. Study of the effect of meteorological conditions on the ambient air ozone concentrations in Shenyang. Environ. Monit. China 2015, 31, 32–37. [Google Scholar]
  15. Li, L.G.; Liu, N.W.; Shen, L.D.; Zhao, Z.Q.; Wang, H.B.; Wang, Y.F.; Li, X.L.; Ma, Y.J. Ozone concentration at various heights near the surface layer in Shenyang, Northeast China. Front. Environ. Sci. 2022, 10, 1011508. [Google Scholar] [CrossRef]
  16. Liu, N.W.; Ren, W.H.; Li, X.L.; Ma, X.G.; Zhang, Y.H.; Li, B.K. Distribution and urban-suburban differences in ground-level ozone and its precursors over Shenyang, China. Meteorol. Atmos. Phys. 2019, 131, 669–679. [Google Scholar] [CrossRef]
  17. Li, Y.; Liu, N.W.; Ren, W.H.; Li, B.K. Spatial patterns of urban green space and their modulation on ozone formation in Shenyang, China. Sci. Total Environ. 2024, 905, 168327. [Google Scholar]
  18. Li, H.; Peng, L.; Bi, F.; Li, L.; Bao, J.M.; Li, J.L.; Zhang, H.; Chai, F.H. Strategy of coordinated control of PM2.5 and ozone in China. Res. Environ. Sci. 2019, 32, 1763–1778. [Google Scholar]
  19. Cristofanelli, P.; Bonasoni, P. Background ozone in the southern Europe and Mediterranean area: Influence of the transport processes. Environ. Pollut. 2009, 157, 1399–1406. [Google Scholar] [CrossRef] [PubMed]
  20. Yang, L.F.; Xie, D.P.; Yuan, Z.B.; Huang, Z.J.; Wu, H.B.; Han, J.L.; Liu, L.J.; Jia, W.C. Quantification of Regional Ozone Pollution Characteristics and Its Temporal Evolution: Insights from Identification of the Impacts of Meteorological Conditions and Emissions. Atmosphere 2021, 12, 279. [Google Scholar] [CrossRef]
  21. Li, T.Y.; Wu, N.G.; Deng, X.J.; Deng, T.; Chen, J.Y.; Shen, J.; Deng, S.X.; Liang, H.L. Forecasting performance evaluation of GRACES in Guangdong province. J. Trop. Meteological 2021, 37, 207–217. [Google Scholar]
  22. Ying, F.; Lai, Y.; Jiang, B.H.; Zhang, Q.; Yan, L.; Ye, H.; Zheng, Y.X.; Hong, C.P.; Zhang, X. The influence of regional transport on PM2.5 and O3 pollution during the G20 summit security period in Hangzhou and their pollution characteristics. Environ. Pollut. Control 2020, 33, 2771–2784. [Google Scholar]
  23. Lai, A.Q.; Chen, X.Y.; Liu, Y.M.; Jiang, M.; Wang, X.M.; Wei, X.L.; Fan, Q. Numerical simulation of a complex pollution episode with high concentrations of PM2.5 and O3 over the Pearl River Delta region, China. China Environ. Sci. 2017, 37, 4022–4031. [Google Scholar]
  24. Zhang, H.Y.; Wang, X.S.; Lu, K.D.; Zhang, Y.H. Impact of typical meteorological conditions on the O3 and PM10 pollution episodes in the Pearl River Delta in autumn. Acta Sci. Nat. Univ. Pekin. 2014, 50, 565–576. [Google Scholar]
  25. Ciarelli, G.; Aksoyoglu, S.; Haddad, I.E.; Bruns, E.A.; Crippa, M.; Poulain, L.; Äijälä, M.; Carbone, S.; Freney, E.; O’Dowd, C.; et al. Modelling winter organic aerosol at the European scale with CAMx: Evaluation and source apportionment with a VBS parameterization based on novel wood burning smog chamber experiments. Atmos. Chem. Phys. 2017, 17, 1–34. [Google Scholar] [CrossRef]
  26. Gao, Z.Q.; Zhou, X.H. A review of CAMx, CMAQ, WRF-Chem and NAQPMS models: Application, evaluation and uncertainty factors. Environ. Pollut. 2024, 343, 123183. [Google Scholar] [CrossRef] [PubMed]
  27. Shahbazi, H.; Ganjiazad, R.; Hosseini, V.; Hamedi, M. Investigating the influence of traffic emission reduction plans on Tehran air quality using WRF/CAMx modeling tools. ScienceDirect 2017, 57, 484–495. [Google Scholar] [CrossRef]
  28. Zhang, Y.; Shen, J.; Li, Y. An atmospheric vulnerability assessment framework for environment management and protection based on CAMx. J. Environ. Manag. 2018, 207, 341–354. [Google Scholar] [CrossRef]
  29. Collet, S.; Minoura, H.; Kidokoro, T.; Sonoda, Y.; Kinugasa, Y.; Karamchandani, P.; Johnson, J.; Shah, T.; Jung, J.; DenBleyker, A. Future year ozone source attribution modeling studies for the eastern and western United States. J. Air Waste Manag. Assoc. 2014, 64, 1174–1185. [Google Scholar] [CrossRef]
  30. Liu, D.S.; Li, J.; Su, X.Q.; Zuo, R.T. Source apportionment of ozone in Xining using CAMx-OSAT method. Acta Sci. Circumstantiae 2021, 41, 386–394. [Google Scholar]
  31. Zheng, Y.; Zhou, G.Z.; Li, Y.; Tang, W.; Du, X.H.; Gao, R.; Meng, F. Analysis and source apportionment of ozone pollution in Putian city. Res. Environ. Sci. 2019, 32, 1340–1347. [Google Scholar]
  32. Wu, F. Study on numerical simulation of ozone source analysis in summer in Xinzhou city. Energy Environ. Prot. 2021, 35, 79–85. [Google Scholar]
  33. GB 3095-2012; Ambient Air Quality Standards. Ministry of Ecology and Environment (MEE): Beijing, China, 2012.
  34. Hua, X.H.; Wang, M.; Yao, Z.; Hao, R.; Wang, H.L. Characteristics and Sensitivity Analysis of Ozone Pollution in a Typical Inland City in China. Atmosphere 2024, 15, 160. [Google Scholar] [CrossRef]
  35. Shen, J.; Zhang, Y.H.; Wang, X.S.; Li, J.F.; Chen, H.; Liu, R.; Zhong, L.J.; Jiang, M.; Yue, D.L.; Chen, D.H.; et al. An Ozone Episode over the Pearl River Delta in October 2008. Atmos. Environ. 2015, 122, 852–863. [Google Scholar] [CrossRef]
  36. Yang, Y.; Wilkinson, J.G.; Russell, A.G. Fast, direct sensitivityanalysis of multidimensional photochemical models. Environ. Sci. Technol. 1997, 31, 2859–2868. [Google Scholar] [CrossRef]
  37. Dunker, A.M.; Yarwood, G.; Ortmann, J.P. Comparison of source apportionment and source sensitivity of ozone in a threedimensional air quality model. Environ. Sci. Technol. 2002, 36, 2953–2964. [Google Scholar] [CrossRef] [PubMed]
  38. Yan, R.S. Ozone sensitivity analysis and emission controls in Dezhou in summer. Environ. Sci. 2020, 41, 3961–3968. [Google Scholar]
  39. Itahashi, S.; Uno, I.; Kim, S. Seasonal source contributions oftropospheric ozone over East Asia based on CMAQ-HDDM. Atmos. Environ. 2013, 70, 204–217. [Google Scholar] [CrossRef]
  40. Zhang, Y.; Chen, J.H.; Tang, B.Y.; Fan, W.B.; Wei, Y.H.; Xiang, W.G.; Jin, C.Y.; Qian, J.; Liu, Z. Numerical simulation of meteorological elements of a pollution episode in Sichuan Basin based on two reanalysis datasets. Acta Sci. Circumstantiae 2020, 40, 3093–3102. [Google Scholar]
  41. Gao, D.; Xie, M.; Chen, X.; Wang, T.J.; Liu, Q.; Zhan, C.C.; Ren, J.Y. Numerical modeling of effects of climate change on air quality in the Yangtze River Delta region. Equip. Environ. Eng. 2019, 16, 115–122. [Google Scholar]
  42. Hopke, P.K. Review of receptor modeling methods for source apportionment. J. Air Waste Manag. Assoc. 2016, 66, 237–259. [Google Scholar] [CrossRef]
  43. US EPA. Guidance for Regulatory Application of the Urban Airshed Model (UAM); US Environmental Protection Agency, Office of Air Quality Planning and Standards: Research Triangle Park, NC, USA, 1991.
  44. Wang, T.; Xue, L.K.; Brimblecombe, P.; Lam, Y.F.; Li, L.; Zhang, L. Ozone pollution inChina: A review of concentrations, meteorological influences, chemical precursors, and effects. Sci. Total Environ. 2017, 575, 1582–1596. [Google Scholar] [CrossRef]
  45. Li, K.; Jacob, D.J.; Liao, H.; Shen, L.; Zhang, Q.; Bates, K.H. Anthropogenic drivers of 2013-2017 trends in summer surface ozone in China. Proc. Natl. Acad. Sci. USA 2019, 116, 422–427. [Google Scholar] [CrossRef]
  46. Zhang, Y.J.; Zhao, Y.C.; Li, J.; Wu, Q.Z.; Wang, H.; Du, H.Y.; Yang, W.Y.; Wang, Z.F.; Zhu, L.L. Modeling Ozone Source Apportionment and Performing Sensitivity Analysis in Summer on the North China Plain. Atmosphere 2020, 11, 992. [Google Scholar] [CrossRef]
  47. Wang, Y.J.; Yaluk, E.A.; Chen, H.; Jiang, H.; Huang, H.; Zhu, A.S.; Xiao, S.L.; Xue, J.; Lu, G.B.; Bian, J.T.; et al. The Importance of NOx Control for Peak Ozone Mitigation Based on a Sensitivity Study Using CMAQ-HDDM-3D Model During a Typical Episode Over the Yangtze River Delta Region, China. J. Geophys. Res. Atmos. 2022, 127, e2022JD036555. [Google Scholar] [CrossRef]
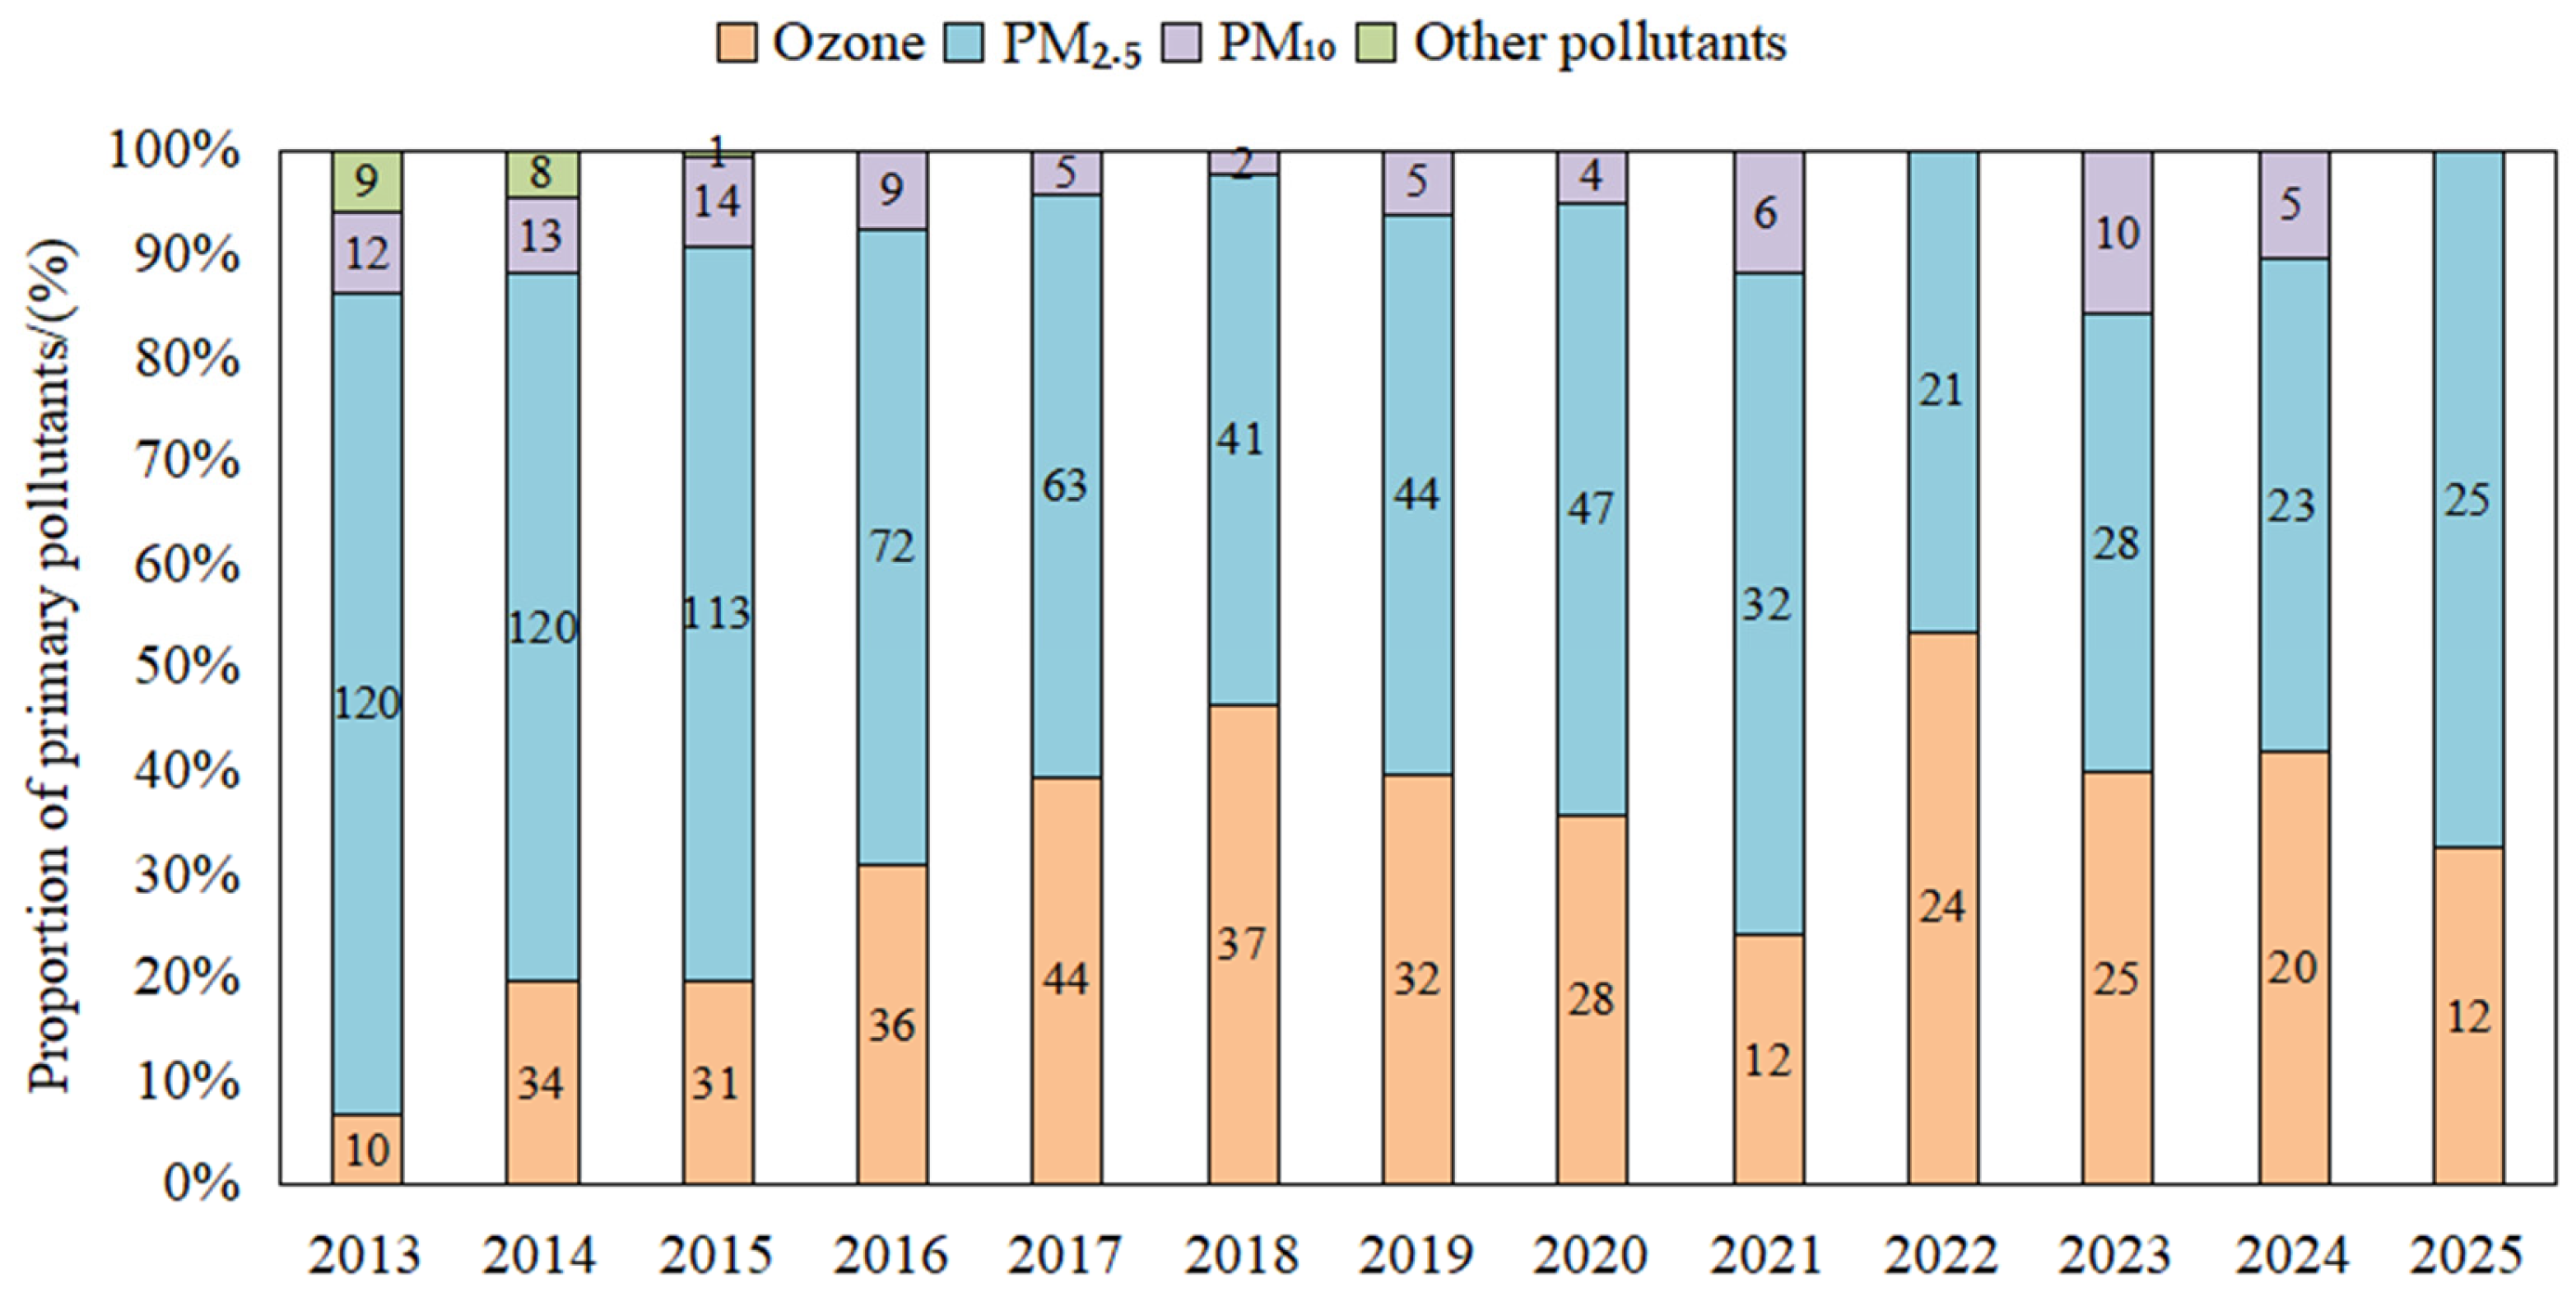
Figure 1. Trends in the number and proportion of days with different primary pollutants in Shenyang, 2013–2025.
Atmosphere 17 00179 g001
Figure 2. Monthly distribution of O3 exceedance days in Shenyang, 2013–2025. Note: The months marked with red boxes are those with a higher number of ozone exceedance days.
Atmosphere 17 00179 g002
Figure 3. Schematic of the simulation domain, regional source regions and receptors.
Atmosphere 17 00179 g003
Figure 4. Comparisons of simulated MDA8 O3 and NO2 against observed data in Shenyang from May to July in 2019.
Atmosphere 17 00179 g004
Figure 5. Sensitivity of O3 to (a) NOx and (b) VOC emissions in Shenyang and surrounding areas (120.8–125.2° E, 40.7–43.5° N).
Atmosphere 17 00179 g005
Figure 6. Time series of ozone contributions formed under NOx-limited and VOC-limited conditions.
Atmosphere 17 00179 g006
Figure 7. Regional (a) and local industrial (b) contributions to O3 in Shenyang, May–July 2019.
Atmosphere 17 00179 g007
Figure 8. O3 response to local NOx and VOCs emission reductions under varying pollution scenarios in Shenyang. Note: The number 160 marked in red in the figure represents the secondary standard limit for O3 concentration.
Atmosphere 17 00179 g008
Figure 9. Comparison of OSAT and GOAT source apportionments during an O3 pollution episode in Shenyang.
Atmosphere 17 00179 g009
Figure 10. Sectoral contributions to MDA8 O3 dominated by NOx and VOCs in Shenyang, 21–27 May 2019.
Atmosphere 17 00179 g010
Table 1. Model–observation comparison of NO2 and O3 concentrations in Shenyang, May–July 2019.
O3NO2
Monitored concentration (μg/m3)134.6927.53
Simulated concentration (μg/m3)136.2226.47
R0.710.61
NMB−0.003−0.04
NME0.230.22
Note: Observed NO2 and O3 data for Shenyang were provided by the Shenyang Academy of Environmental Sciences.
Table 2. O3 response to local NOx and VOCs emission reductions under varying pollution scenarios in Shenyang.
Emission Reduction RatioMDA8 O3 Concentration
VOCsNOxClass IIIClass IIClass I90th percentile
00166 182 218 180
020165 181 215 179
040163 179 211 176
060159 175 205 172
200163 178 213 175
2020161 177 211 174
2040159 175 207 172
2060156 173 201 170
400158 173 208 171
4020158 177 206 174
4040157 171 202 168
4060153 163 197 162
600155 168 203 166
6020154 168 201 166
6040153 168 198 165
6060151 163 193 161
Note: Baseline values (0% reduction) are observation-adjusted measurements. Scenario values are calculated by multiplying baseline values with Relative Response Factors (RRFs) obtained from model simulations; The colors in the table are related to the magnitude of the values: larger values are displayed in red, while smaller values are shown in green.
Disclaimer/Publisher’s Note: The statements, opinions and data contained in all publications are solely those of the individual author(s) and contributor(s) and not of MDPI and/or the editor(s). MDPI and/or the editor(s) disclaim responsibility for any injury to people or property resulting from any ideas, methods, instructions or products referred to in the content.