Article

Load-Dependent Shipping Emission Factors Considering Alternative Fuels, Biofuels and Emission Control Technologies

by
Achilleas Grigoriadis
1,
Theofanis Chountalas
2,
Evangelia Fragkou
1,
Dimitrios Hountalas
2 and
Leonidas Ntziachristos
1,*
1
Laboratory of Applied Thermodynamics, Department of Mechanical Engineering, Aristotle University, P.O. Box 458, 54124 Thessaloniki, Greece
2
Laboratory of Internal Combustion Engines, National Technical University of Athens, 15772 Athens, Greece
*
Author to whom correspondence should be addressed.
Atmosphere 2026, 17(2), 122; https://doi.org/10.3390/atmos17020122
Submission received: 21 November 2025 / Revised: 13 January 2026 / Accepted: 22 January 2026 / Published: 23 January 2026
(This article belongs to the Special Issue Air Pollution from Shipping: Measurement and Mitigation)

Abstract

Shipping is a high-energy-intensive sector and a major source of climate-relevant and harmful air pollutant emissions. In response to growing environmental concerns, the sector has been subject to increasingly stringent regulations, promoting the uptake of alternative fuels and emission control technologies. Accurate and diverse emission factors (EFs) are critical for quantifying shipping’s contribution to current emission inventories and projecting future developments under different policy scenarios. This study advances the development of load-dependent EFs for ships by incorporating alternative fuels, biofuels and emission control technologies. The methodology combines statistical analysis of data from an extensive literature review with newly acquired on-board emission measurements, including two-stroke propulsion engines and four-stroke auxiliary units. To ensure broad applicability, the updated EFs are expressed as functions of engine load and are categorized by engine and fuel type, covering conventional marine fuels, liquified natural gas, methanol, ammonia and biofuels. The results provide improved resolution of shipping emissions and insights into the role of emission control technologies, supporting robust, up-to-date emission models and inventories. This work contributes to the development of effective strategies for sustainable maritime transport and supports both policymakers and industry stakeholders in their decarbonization efforts.

1. Introduction

Shipping plays a pivotal role in global trade, transporting approximately 80% of goods by volume [1] and representing the most carbon-efficient mode of freight transport in terms of emissions per tonne-kilometer [2]. However, this essential activity comes with significant environmental drawbacks, notably the emission of climate-forcing substances and air pollutants that adversely affect human health and ecosystems [3]. In 2022, the maritime sector accounted for 14.2% of carbon dioxide (CO2) emissions from the European Union (EU) transport sector [4] and contributed 2.9% of global total anthropogenic CO2 emissions in 2018 [5]. In addition to CO2, shipping is also a source of other Greenhouse Gases (GHGs), such as methane (CH4) and nitrous oxide (N2O), which are typically included in CO2-equivalent assessments, due to their global warming potential [6]. Beyond GHGs, ships emit substantial amounts of air pollutants [7]. Maritime emissions are responsible for 3.2% and 14.2% of global anthropogenic sulphur dioxide (SO2) and nitrogen oxide (NOx) emissions, respectively [8]. In 2022, particulate matter (PM) emissions from ships reached 88 Gg, representing approximately 43% of all transport-related PM emissions in the EU [4]. Exposure to these air pollutants poses serious health risks [9]. PM, in particular, can penetrate deep into the respiratory system and enter the bloodstream, leading to respiratory illnesses, cardiovascular disease and increased mortality risk [10,11]. The environmental and health implications of emissions from maritime transport underscore the urgency for effective mitigation strategies [12].
In line with the objectives of the Paris Agreement and the United Nations Sustainable Development Goals (SDGs), both the International Maritime Organization (IMO) and the EU have adopted ambitious regulatory measures targeting GHG emissions in order to address the climate and environmental challenges posed by the shipping sector. At the 80th Marine Environment Protection Committee session (MEPC 80), the IMO adopted a revised GHG reduction strategy, committing to reach net-zero GHG emissions from international shipping by 2050. The strategy also includes intermediate targets, aiming for at least a 20% reduction by 2030 and 40% by 2040, compared to 2008 levels [13]. In its latest session (MEPC 83, April 2025), IMO provisionally approved a Global GHG Fuel Standard and a Carbon Levy system, which set an approximately 100 USD per tonne of CO2 equivalent, applicable to ships above 5000 gross tonnage. These measures are designed to accelerate the transition to low- and zero-emission alternative fuels while disincentivizing the use of carbon-intensive marine fuels. Similarly, the EU has implemented the FuelEU Maritime Regulation, which introduces a gradually tightening limit on the GHG intensity of on-board energy use, aiming for an 80% reduction by 2050 relative to a 2020 baseline. The regulation also promotes the uptake of renewable and low-carbon fuels and mandates the use of Onshore Power Supply (OPS) for containerships and passenger ships in EU ports, particularly from 2030 onward [14]. In parallel, the EU has integrated maritime transport into the EU Emissions Trading System (EU ETS), which is a cap-and-trade mechanism. Under the ETS, ship operators are required to monitor and report their GHG emissions and to surrender allowances annually to cover those emissions [15,16]. The scheme is being phased in, covering 40% of CO2 emissions in 2024, 70% in 2025 and 100% from 2027 onward. From 2026, it will also encompass CH4 and N2O emissions, expanding the scope of climate accountability in the maritime sector [17].
In addition to regulations aimed at reducing GHG emissions, control legislation is also in place for harmful air pollutants. SOx emissions are mitigated by capping the fuel sulphur content to 0.5% globally, with this limit further reduced to 0.1% in designated Emission Control Areas (ECAs) [18]. Existing Sulphur Emission Control Areas (SECA) include the North Sea, the Baltic Sea and the coastal waters of North America and the United States Caribbean, while the Mediterranean Sea has recently been designated as the newest SECA, effective from 1 May 2025 [19]. NOx emissions are regulated as part of the engine certification process, which takes into account factors, such as the engine’s manufacturing year and rotational speed. In addition, stricter NOx limits apply within ECAs [20]. PM emissions are not directly regulated by maritime legislation but are instead indirectly controlled through the enforcement of fuel sulphur limits [21].
In response to the increasingly stringent GHG and air pollutants emissions regulatory framework, the shipping industry has been actively investing in the development and deployment of technical solutions aimed at meeting long-term environmental targets [22]. These solutions primarily involve a transition away from conventional marine fuels, such as residual and distillate fuels, towards lower-carbon alternatives, like Liquefied Natural Gas (LNG) [23,24] and methanol [25,26,27], as well as zero-carbon options, such as ammonia [28,29,30,31]. Another promising pathway is the utilization of biofuels, which can be employed either as blends with conventional marine fuels or as drop-in replacements, depending on their chemical compatibility and engine requirements [32]. In addition to fuel options, on-board emission control technologies are being increasingly adopted to mitigate air pollutant emissions. These include Exhaust Gas Cleaning Systems (EGCS or scrubbers) for the reduction of SOx [33,34,35] and Selective Catalytic Reduction (SCR) [36,37] or Exhaust Gas Recirculation (EGR) systems [38,39] for the abatement of NOx. On-board Carbon Capture and Storage (CCS) systems are emerging as a promising technological solution for the maritime sector to reduce CO2 emissions directly at the exhaust source [40,41]. These systems are designed to capture CO2 from engine flue gases before it is released into the atmosphere, offering a potential pathway to deep decarbonization. CCS can be integrated with ships operating on both conventional fossil-based marine fuels [40] and low- or zero-carbon alternatives [42,43], thereby enhancing overall emission reduction potential regardless of the fuel type used. These measures are essential for achieving compliance with international and regional regulations, while advancing the decarbonization of the maritime sector.
Accurate estimation of emissions is a critical first step in assessing the effectiveness of alternative fuels, biofuels and emission control technologies for broader implementation in the maritime sector [44]. A key parameter in this process is the Emission Factors (EF), which are differentiated based on fuel type, engine technology and the specific emission estimation method employed. EFs are fundamental for quantifying the shipping sector’s contribution to current emission inventories and for projecting future emission trajectories under various regulatory or policy scenarios [45]. Several well-established emission inventory tools, such as the IMO Ship Emissions Toolkit [46], the EMEP/EEA Air Pollutant Emission Inventory Guidebook [47] and the STEAM model [48,49], rely heavily on accurate and up-to-date EFs. The development of EFs is an evolving process that requires continuous refinement to reflect the adoption of new engine technologies, operational practices and emerging alternative fuels, introduced to meet increasingly stringent environmental standards.
These existing emission inventory tools currently lack a systematic and comprehensive representation of EFs for biofuels, alternative fuels and emission control technologies. This limitation constrains their applicability and reduces their effectiveness in estimating future pollutant emissions under different policy and technology scenarios. Specifically, the EMEP/EEA shipping guidebook includes EFs for LNG and certain emission control technologies, but does not account for biofuels, methanol, or ammonia [47]. Similarly, the IMO GHG Study covers LNG and methanol, but excludes ammonia and does not explicitly consider emission control technologies [5,46]. In addition, key parameters such as specific fuel oil consumption (SFOC), detailed gaseous and particulate pollutants and particle speciation are not consistently or explicitly represented in existing inventory frameworks. This study addresses these gaps by providing a complete and up-to-date dataset of EFs that accounts for the increasing deployment of biofuels, alternative fuels and emission control technologies, thereby enabling more accurate emission inventories and better reflecting the ongoing transition toward cleaner maritime energy systems.
The development of EFs requires continuous scientific effort, particularly through the implementation of robust emission measurement campaigns using various methodologies [50,51]. These methods include on-board measurements during real-world ship operations [34,52,53,54], test-bed measurements under laboratory conditions [55,56], and less frequently, in-plume measurements using remote sensing techniques [57]. On-board measurements involve the installation of high-precision analyzers or simplified sensors directly into the exhaust system of ships during actual voyages, capturing emissions under realistic operational profiles [34,35,58,59]. Test-bed measurements, on the other hand, are performed by mounting engines on dedicated test benches in a laboratory environment, allowing for detailed emission characterization under standardized and repeatable operating conditions [55,60,61]. In the case of large marine engines, this is not usually feasible, with the closest equivalent process being the factory acceptance tests. In-plume remote sensing methods measure pollutant concentrations in the ship’s exhaust plume from either mobile platforms (e.g., drones, small boats) [62,63] or fixed coastal stations (e.g., bridges) [64], offering a non-intrusive means of monitoring emissions.
This study draws upon both peer-reviewed scientific publications and technical reports from global sources, as well as emission measurements conducted directly by the authors, to develop representative EFs applicable to modern maritime operations [64], offering a non-intrusive means of monitoring emissions.
Based on the identified scientific gaps and the limited availability of comprehensive emission measurement data for the development of accurate and up-to-date shipping EFs, the main contributions of this study are summarized as follows:
  • Comprehensive synthesis of existing knowledge: An extensive literature review was conducted, encompassing more than 90 peer-reviewed scientific publications and technical reports from global sources related to vessel emissions. Available shipping emission data were systematically collected and categorized to establish a robust foundation for EF development.
  • Generation of new empirical evidence: The study introduces new emission measurement data provided directly by the authors from on-board and test-bench campaigns covering more than 150 marine engines. These measurements provide detailed information on SFOC and gaseous pollutant emissions for both two-stroke and four-stroke marine engines.
  • Coverage of emerging fuels and control technologies: The measurements conducted as part of the present study covered marine engines operating on conventional marine fuels, biofuels and LNG. Furthermore, configurations equipped with emission control technologies were tested, thereby significantly expanding the empirical basis for characterizing ship emission performance.
The principal novelty of this work lies in the integrated inclusion and synthesis of emission data from vessels operating on alternative fuels, biofuels and emission control technologies within a unified set of load-dependent EF dataset. This addresses important gaps in current emission inventories and modeling tools. The methodology combines statistical analysis of emission data from an extensive literature review with newly obtained data by authors’ campaign measurements. The resulting dataset provides improved resolution of ship emission behavior across operating conditions and engine configurations, enhancing the accuracy and applicability of EFs in emission inventories, air quality models and policy scenario analyses. By delivering an updated, comprehensive and technology-inclusive EF dataset, this study makes a substantive contribution to the scientific foundation required for evidence-based environmental policymaking and supports the ongoing transition toward sustainable and climate-neutral maritime transport.
The structure of the present paper is as follows: Section 2 presents a comprehensive literature review on alternative marine fuels, including biofuels and emission control technologies. Section 3 describes the materials and methodologies employed in the study. Section 4 presents, analyzes and discusses the key results. Finally, Section 5 summarizes the main conclusions, highlights the novel contributions of this research and suggests future research directions.

2. Review of Alternative Options

This section presents a literature review of current and future options that are designed to reduce shipping emissions, including alternative fuels, biofuels and emission control technologies.

2.1. Liquified Natural Gas

Modern two-stroke marine engines operating on Natural Gas (NG) are typically dual-fuel (DF) and based on two distinct combustion principles. Regardless of the engine type, NG is first introduced into the combustion chamber, followed by the injection of a small amount of more easily ignitable pilot fuel, typically Marine Gas Oil (MGO) or Very-Low-Sulphur Fuel Oil (VLSFO), to initiate combustion through auto-ignition. The pilot fuel typically accounts for 1–5% of the total energy input, with the share increasing at lower engine loads [65].
The key difference between the two engine types lies in the gas injection method. High-Pressure Gas Injection (HPGI) engines follow the diesel cycle, whereas Low-Pressure Gas Injection (LPGI) engines, which introduce gas earlier during the compression phase, operate similarly to the otto cycle. Each technology has its operational characteristics and challenges. High-pressure systems are particularly sensitive to the precise timing and quality of pilot fuel injection, while low-pressure systems may face issues related to ignition stability and combustion control. As a result, both technologies require careful handling and operational experience, especially when deployed on large two-stroke marine engines.
HPGI engines inject NG near the Top Dead Center (TDC), almost simultaneously with the pilot diesel injection [66]. Combustion is initiated through the auto-ignition of the diesel pilot, and the process is dominated by diffusion combustion. Since the working medium in the cylinder is air only, there is no risk of pre-ignition during compression. This allows for higher compression ratios, thus improved thermal efficiency. The outcome is improved fuel efficiency and combustion performance. Additionally, methane slip, a significant drawback of LPGI systems, is largely mitigated in HPGI engines. A key disadvantage of HPGI systems is high NOx emissions, which prevents compliance with the IMO Tier III standard without the use of EGR or SCR systems. Furthermore, the cryogenic infrastructure required for high-pressure gas injection is complex and significantly increases capital and operational costs [24].
By contrast, LPGI engines do not require complex high-pressure injection, as NG is injected earlier in the compression phase at low pressure. The combustion mechanisms of the lean burn otto cycle of these engines result in lower in-cylinder temperature and minimal NOx emissions, thus after-treatment systems are not required. The aforementioned advantages result in significantly lower costs and operational simplicity. Nevertheless, LPGI engines also present significant drawbacks, specifically higher NG consumption and significantly greater methane slip, the latter being a major environmental concern.
LNG typically consists of approximately 95% methane and 4% ethane, with the remaining fraction comprising other Hydrocarbons (HC) [67]. LNG is stored on-board ships in liquid form to significantly reduce its volume, approximately 600 times compared to its gaseous state. LNG is liquefied by cooling it to −162 °C and is subsequently stored in cryogenic tanks designed to maintain these extremely low temperatures [68].

2.2. Methanol

Methanol is emerging as a promising and sustainable alternative marine fuel, offering the potential to mitigate both GHG emissions and harmful air pollutants [69]. Methanol has distinct fuel properties compared to conventional marine fuels, since it contains about half the energy content as well as a lower carbon content by mass [68]. Specifically, its molecular weight is 32.04 g/mol, and its Lower Heating Value (LHV) is approximately 19.9 MJ/kg. Methanol contains no sulphur, has a lower carbon content by weight, and about 50% of the LHV of conventional MGO.
A key advantage of methanol is that it remains liquid at ambient temperature and pressure, enabling the use of existing marine diesel infrastructure with relatively minor modifications. Drawbacks include its toxicity and low flashpoint, which necessitate special handling and safety precautions [70]. However, methanol is biodegradable when released in water, e.g., in the unlikely event of an accident, and is considered less harmful to marine ecosystems than other alternative fuels, such as ammonia [27].
Methanol is typically used in dual-fuel Internal Combustion Engines (ICE), where a small quantity of diesel fuel is injected as a pilot to initiate ignition [71]. Since methanol molecules contain no sulphur, its use can reduce SOx emissions by up to 99% compared to conventional marine fuels. The remaining sulphur emissions originate solely from the pilot fuel, usually MGO. Methanol combustion can also reduce NOx emissions by approximately 30% compared to Tier II engines operating with conventional fuels [71]. Despite this, its inherent oxygen content contributes to higher flame temperatures, which can increase thermal NOx formation and prevent compliance with IMO NOx Tier III limits in ECAs without additional aftertreatment systems [70].
One of methanol’s major advantages is its compatibility with existing marine infrastructure, owing to its liquid state under ambient conditions. Similarly to Heavy Fuel Oil (HFO), methanol can be stored and bunkered using existing storage and distribution systems with relatively low retrofitting costs. Modifications are required to address its low flashpoint and ensure safe handling. Methanol bunkering can be carried out either from dedicated bunker vessels or directly from shore-based facilities, such as pipelines.
The methanol industry has a global footprint, with production facilities across Asia, America, Europe, Africa and Middle East. Globally, NG is the dominant feedstock for methanol production, except in China, where coal is the primary raw material. The total global methanol production capacity exceeds 110 million tons per year, with approximately 90 production plants worldwide. Of this volume, about 9 million tons are used as fuel, mainly in gasoline blends [27].
Currently, “grey” methanol, produced from fossil feedstocks, mainly NG, is widely available. In contrast, renewable methanol, defined as methanol produced either from biomass (biomethanol) or using renewable electricity (e-methanol), is scarce and limited to a few regions in relatively small quantities. This limited availability poses a significant challenge to the widespread adoption of “green” methanol as a sustainable marine fuel [27].

2.3. Ammonia

Ammonia is considered one of the most promising future marine fuels, primarily due to its carbon-free molecular structure, which positions it as a key candidate in the maritime sector’s efforts to decarbonize [31]. As a sulphur-free fuel, ammonia is compatible with global emission regulations, including operation within SECAs. However, a significant drawback is its potential to generate elevated levels of N2O, a potent climate-warming gas, largely due to the additional nitrogen present in its molecular composition [72]. In general, N2O is formed as a byproduct of chemical oxidation during combustion, especially when excess oxygen is available at high temperatures [73]. Furthermore, ammonia combustion is associated with increased NOx emissions and the release of unburned ammonia (ammonia slip), which is highly toxic and poses significant health risks at elevated concentrations [74]. These challenges highlight the importance of effective emission control from ammonia combustion. SCR systems have been shown to mitigate all three key pollutants, namely NOx, N2O and unburned ammonia, offering a viable pathway for reducing the environmental and health impacts of ammonia-fueled shipping [75].
Ammonia can be stored as a liquid either at ambient temperature under high pressure or atmospheric pressure at cryogenic temperatures around −33 °C [76]. In some applications, it is stored at intermediate temperature and pressure conditions [31]. For pressurized storage tanks, inspection and safety requirements are governed by national and international pressure vessel codes and standards in most countries.
Several fuel conversion technologies are under development or evaluation for the use of ammonia in marine applications. The most prominent include
  • Dual-fuel ICEs;
  • Internal combustion engines operating on 100% ammonia;
  • Fuel cells (FC) [76].
Each of these technologies presents unique advantages and challenges. Dual-fuel ICEs provide flexibility and allow for gradual integration of ammonia as a fuel, while 100% ammonia engines aim for full decarbonization but face technical challenges related to ignition, combustion stability and N2O emissions. FCs, on the other hand, offer high efficiency and zero-emission potential when operating with “green” ammonia, though their commercial readiness and fuel infrastructure still require further development [76].

2.4. Biofuels

A potential short- and mid-term solution for the decarbonization of shipping is the use of biofuels in pure form, or as a blend with conventional marine fuels. Biofuels can be utilized to reduce the carbon footprint of marine vessels without requirement of significant investment from shipowners, apart from the elevated cost of the fuel itself, due to their classification as drop-in fuels, suitable for use in marine engines. An additional benefit of the lack of an initial investment cost is that biofuels are one of the few carbon reduction solutions that may be used in older vessels. Despite the relative ease with which biofuels can be utilized in marine engines, several technical challenges and limitations remain. Biodiesel and its blends exhibit distinct physical and chemical properties compared to conventional marine fuels [77,78]. Key parameters that differ, which may impact engine performance and particularly the fuel supply system, include density, viscosity, compressibility, cetane number, LHV and oxygen content [79]. These differences can affect fuel supply rate, atomization, combustion dynamics, and consequently pollutant formation, especially NOx emissions, as confirmed by a wide range of studies [79,80,81]. The effect on NOx formation depends on a combination of the aforementioned factors, but it is established that the higher oxygen content in biodiesel generally results in increased NOx emissions [82,83]. Assessing the end impact of these properties is challenging due to the considerable variability in fuel characteristics, which depend heavily on the production pathway and feedstock used [84], as well as on how their effect varies for specific engine properties in terms of overall design and active settings [81].
The high variability of biodiesel properties that influence NOx emissions is confirmed by the different results across studies [32,85,86,87], necessitating extensive engine testing to establish a representative correlation between biodiesel content and expected NOx emission changes. Between 2020 and 2022, multiple tests [32,88] were conducted using biodiesel blends ranging from 20% to 100% engine load. At present, only blends with up to 30% biodiesel content (e.g., B20 or B30) are approved for marine use without special permission [89]. These tests, conducted under the overview of regulating parties, involved large two-stroke propulsion main engines (ME) and four-stroke auxiliary engines (AE) on multiple commercial vessel types with promising results. A comprehensive summary of such measurements is provided by Chountalas et al. (2023) [32], focusing on B30 fuel blends. Specific Fuel Oil Consumption (SFOC) for large two-stroke engines showed only a marginal increase of about 1–2% compared to MGO, while the increase was slightly higher for AEs. When compared to HFO and pure VLSFO, consistent differences in SFOC were observed only in generator applications, and these were also relatively minor. This finding is important, as fuel consumption affects the total carbon emissions, which are not completely neutral with the use of biofuel blends. It is noted that the SFOC increase calculations take into account the LHV difference between these fuels.
The operational behavior of marine engines running on higher biodiesel content or neat biodiesel (B100) remains under investigation and while use for commercial activity can be performed, it requires on-board emissions testing for every case. Results from available tests show significant variability across different engine types. Some trials [85] have reported a notable increase in specific NOx emissions compared to MGO, with behavior resembling that of heavier distillate fuels. However, these findings are not yet generalizable. Regarding fuel consumption, an increase is generally expected due to the lower LHV of biodiesel compared to conventional marine fuels, although this varies significantly depending on the production method and feedstock used [90]. This variability also affects the lifecycle GHG emission reduction achievable with B100, which is estimated to exceed 80% in favorable cases [91].
In addition to biodiesel and its blends, another pathway for biofuel use in shipping is through biomethane, which can be used to partially decarbonize LNG operations. However, the large quantities of biomethane required to fully substitute LNG make it difficult to estimate production costs and scalability. Therefore, biomethane is currently viewed more as a carbon-reducing additive to LNG in targeted applications, accounting for the lifecycle environmental benefit, rather than a standalone fuel capable of meeting the full energy demand of maritime transport [69]. Synthetic Natural Gas (SNG) offers similar properties to conventional LNG [92], with the key advantage of a near-zero carbon footprint when produced from renewable resources, namely biomass feedstocks and green energy inputs [93]. However, the use of bio-SNG and SNG in maritime transport remains in the demonstration phase, with global availability still highly limited [94]. Notably, bio-SNG was successfully tested in September 2021 on a container vessel equipped with a standard four-stroke marine DF engine, demonstrating its technical viability for such applications once production volumes increase [95].

2.5. Scrubbers

SOx emissions from ships are regulated primarily through limits on the maximum sulphur content of marine fuels. As of 1 January 2020, the IMO mandated a global reduction in Fuel Sulphur Content (FSC) from 3.5% to 0.5% by mass [18]. In designated SECAs, an even stricter limit of 0.1% FSC applies.
To comply with these regulations, ships must use fuels with a sulphur content not exceeding 0.5% under normal operating conditions in all geographical areas and switch to fuels with a maximum of 0.1% sulphur content when operating within SECAs or ports with stricter environmental requirements. A key disadvantage of low-sulphur fuels is their higher cost compared to high-sulphur alternatives [96] and in some cases supply issues may be present.
As an alternative compliance strategy, the use of high-sulphur HFO in combination with EGCS, commonly known as scrubbers, has been approved and widely adopted [97]. Scrubbers can reduce SO2 emissions from exhaust gases by up to 99% [47,98], thereby achieving an equivalent level of compliance with sulphur emission limits.
Three main types of scrubber systems commonly used in maritime applications are open-loop, closed-loop and hybrid systems. Open-loop scrubbers utilize the natural alkalinity of seawater to neutralize SOx in the exhaust gas stream. In contrast, closed-loop systems typically use freshwater with the addition of an alkaline chemical reagent, such as sodium hydroxide [34]. Hybrid scrubbers can operate in either mode, allowing ships to adapt to regional restrictions on effluent discharge depending on the operating area [99].
A significant distinction between open- and closed-loop systems lies in the management of washwater effluent. Open-loop systems discharge large volumes of untreated washwater directly into the sea, raising environmental concerns, particularly in coastal or enclosed waters [100]. Closed-loop systems, on the other hand, release only small volumes of treated effluent, while the majority of the pollutants in the washwater are retained on-board in a dedicated holding tank and later discharged to port reception facilities.
Scrubber performance is not directly dependent on engine load, though for larger engines exhaust mass flow is a limiting factor near full load but is instead regulated based on the FSC. Thus, when fuels with higher sulphur content are used, the scrubber must operate more intensively to ensure compliance with SO2 emission limits. Moreover, when entering SECA, achieving the stricter 0.1% sulphur-equivalent limit requires an even higher level of SO2 removal from the exhaust gases [101].

2.6. Selective Catalytic Reduction

SCR systems are employed on ships to reduce NOx emissions by converting them into harmless nitrogen and water. The process uses ammonia, typically stored in the form of an urea-water solution, and a specialized catalyst to facilitate the chemical reaction.
Two main SCR installation configurations are used in large marine engines, depending on the location of the catalyst relative to the turbocharger: pre-turbocharger (High-Pressure, HP) and post-turbocharger (Low-Pressure, LP) systems [102]. The main distinction between the two lies in the minimum exhaust gas temperature required for effective operation, also corresponding to minimum engine load, and the maximum FSC that can be tolerated by the catalyst components [103].
HP-SCR systems are generally capable of operating with fuels that have a higher FSC, with some variants allowing the use of even heavy grade fuels. However, high FSC fuel use remains limited due to concerns over catalyst degradation. At low exhaust gas temperatures, the presence of sulphur compounds can lead to catalyst fouling, significantly reducing conversion efficiency. HP-SCR configurations are recommended primarily for large two-stroke engines, which typically exhibit low exhaust gas temperatures due to their scavenging process and high air–fuel ratios [104]. Even in these cases, operation at low engine loads can result in suboptimal exhaust temperatures, in which case tuning changes compared to conventional engines are required for safe and efficient SCR operation.
To address this, HP-SCR-equipped engines often incorporate a Cylinder Bypass Valve (CBV), which diverts a portion of the intake air directly into the exhaust manifold [102]. This reduces the total air entering the cylinder, leading to higher exhaust gas temperature at the catalyst inlet. The primary drawback of HP-SCR systems is the associated increase in pumping losses and a reduction in turbocharger efficiency, which together contribute to a marginal increase in fuel consumption, typically in the range of 0.5 to 2.0 g/kWh, with the effect more pronounced at lower loads [102,105].
In contrast, LP-SCR systems are better suited for four-stroke propulsion engines and auxiliary generators, which inherently operate at higher exhaust gas temperatures [104]. Their application in two-stroke engines is uncommon and requires specific tuning to raise the exhaust gas temperature to within the effective operational range of the catalyst [102]. Common approaches are changes in fuel injection and exhaust valve opening angle and the use of exhaust gas bypassing, where a portion of the exhaust stream is diverted upstream of the turbocharger via an Exhaust Gas Bypass (EGB) valve to increase the temperature at the catalyst inlet [102,105]. The fuel consumption penalty in LP configurations is negligible and generally lower than in HP systems. As with HP-SCR, efficiency decreases with low engine loads. LP-SCR systems equipped with 2-stroke engines require the use of ultra-low sulphur fuels in all cases due to the lower exhaust gas temperature, despite the aforementioned measures taken by the manufacturers.
The optimal operating window for SCR systems typically lies within an engine load range of 60% to 80%. Within this range, exhaust gas temperatures are sufficiently high to ensure proper catalyst function and effective NOx reduction [61]. NOx conversion efficiency at this load range can reach up to 90% [106]. However, when the engine operates below 20% load, exhaust temperatures fall below the minimum required for SCR activation, rendering the system inoperative during maneuvering, for example, near ports [101].

2.7. Exhaust Gas Recirculation

EGR is employed in marine engines to reduce oxygen concentration and average combustion temperature in the cylinder, thereby limiting NOx formation [107]. This is achieved by replacing a portion of the intake air with recirculated exhaust gases, which are low in oxygen and possess high specific heat capacity [108]. The EGR rate varies depending on engine type and load condition, but it is typically high and can reach up to 50%, especially in 2-stroke engines due to the scavenging process.
EGR systems are utilized in both conventional diesel engines and DF engines operating with high-pressure gas injection. In DF operation, EGR also results in a significant reduction in methane slip during NG combustion [109], even for relatively low recirculation percentage.
The implementation of an EGR system requires not only piping and valves to manage the flow of recirculated exhaust gases, but also a dedicated system for gas cleaning and cooling before mixing the exhaust with intake air. Cleaning is essential before the gas passes through the cooler, as it removes PM and SOx, though in most cases MGO use is mandated during EGR use to avoid fouling. The gas treatment unit requires a washwater handling system, where the water used to scrub the exhaust is recirculated and must be purified to keep SOx and particulate concentrations at safe levels. SOx removal necessitates the use of caustic soda (NaOH), along with appropriate infrastructure for handling the reagent and any resulting sludge. While the operation of EGR systems, including NaOH consumption, leads to increased operating costs, this increase is considered relatively moderate [105,110] and compares well to the cost of SCR use which requires urea, a volatile commodity in terms of pricing [111] and the mandatory renewal of the catalyst at set intervals [37,112].
The NOx reduction potential of EGR is significant, which is a key requirement of the IMO Tier III regulations, mandating an 80% reduction compared to Tier II limits. EGR is capable of meeting these targets. According to recent study, EGR systems can achieve NOx reductions in the range of 65% to 90%, depending on engine type, operating conditions, and EGR rate [106].
The main drawback of EGR technology is its adverse impact on fuel consumption [106,110]. In large two-stroke marine diesel engines, fuel consumption can increase by approximately 5% at medium loads [106]. When combined with the aforementioned system’s complexity and operational requirements, this results in non-negligible operating expenses. However, the precise cost varies significantly depending on the application, making detailed cost assessments against an SCR solution case-specific [37,110]. In addition to its impact on fuel efficiency, EGR operation is associated with increased emissions of CO, HC and PM. The recirculation of exhaust gases into the combustion chamber reduces oxygen availability, lowers peak combustion temperature and prolongs combustion duration. These conditions favor the formation of incomplete combustion products and simultaneously hinder their oxidation, ultimately leading to elevated emissions of these pollutants.
Importantly, EGR systems are typically only required when vessels are operating within designated ECAs, where NOx Tier III limits apply. For most commercial ships, the time spent in ECAs is limited [37,112,113,114], which helps contain the annual operational costs associated with Tier III compliance.
In comparison, SCR systems, the dominant configuration in commercial shipping, tend to offer slightly higher NOx reduction efficiency than EGR, especially when applied to two-stroke engines. SCR systems typically achieve reductions in the range of 75% to 90%. Similarly to EGR, SCR performance depends on engine type, load profile, exhaust gas temperature and the correct dosing of the urea solution. It is critical to regulate urea injections carefully to avoid excess ammonia slip, given its toxicity and potential environmental impact [115].

2.8. Diesel Particulate Filters

DPFs are employed to reduce PM emissions and are recognized as an effective technology for minimizing soot emissions from diesel engines. The fundamental mechanisms behind DPF technology include inertial impact, interception, diffusion and sedimentation. Because these are physical processes, particulates accumulate on the filter surface over extended operation periods, gradually increasing backpressure and reducing filtration efficiency. Thus, the critical aspect of DPF functionality is the regeneration of the filter substrate to restore its performance [116].
DPFs can achieve particulate emission reduction of around 90%, making them highly effective in curbing black carbon and soot. However, their use entails a modest fuel consumption penalty, typically around 1.5%. Moreover, the use of residual fuels, which contain higher levels of ash and sulphur content, can cause severe operational issues, such as filter clogging and corrosion. Consequently, DPFs are generally compatible only with cleaner distillate fuels, limiting their application in the marine sector [117].
In maritime context, DPFs are most commonly found on cruise ships, where reducing visible exhaust smoke and soot contributes to a cleaner on-board environment and improved passenger experience. In contrast, DPFs are a mandatory emission control technology in the automotive sector, particularly for road-going diesel vehicles, where strict regulatory limits on particulate emissions are in place [118,119].

2.9. Diesel Oxidation Catalyst

Diesel oxidation catalysts (DOCs) are installed on ships primarily to reduce emissions of Carbon monoxide (CO), HC and the organic fraction of PM [98,116]. A typical DOC consists of a cordierite substrate with a permeable honeycomb structure and an active catalytic layer containing noble metals, such as palladium and platinum. The substrate commonly features a pore density of approximately 400 cells per square inch. DOCs operate efficiently within an exhaust gas temperature range of 220–700 °C [120]. These systems are not yet widespread in the maritime sector but are occasionally installed either as standalone units or in combination with particulate oxidation catalysts or DPFs [120]. Engines equipped with DOCs typically operate on distillate fuels (MGO) or other low-sulphur fuels, as the catalyst is highly sensitive to sulphur poisoning. In contrast, their application with residual fuels (HFO) is limited, since the high sulphur and ash content can rapidly deactivate the catalyst and degrade its performance. DOCs can also be integrated into methanol-fueled engines to mitigate elevated CO and HC emissions, as well as to reduce formaldehyde emissions, a potent GHG and toxic compound [120].

3. Materials and Methods

3.1. On-Board Emission Measurement Method

The procedure followed for the on-board emission and engine performance measurements was carried out according to the IMO directives, specifically the NOx Technical Code (NTC) of MARPOL Annex VI [20]. IMO provides guidelines for multiple approaches to the NOΧ emissions testing procedure for on-board measurements. In the extensive measurement campaign presented in this study, the direct measurement and monitoring method was used, which resulted in the highest accuracy emission measurements. The measurement campaign involved acquisition of both emissions and performance data from large slow-speed 2-stroke propulsion engines and medium-speed 4-stroke auxiliary engines of commercial vessels for various marine fuel types, including MGO, VLSFO, HFO and B30. For the newer Tier-III vessels, tested data was collected at both Tier-II and Tier-III operations to assess the impact of emission control technologies, HP and LP SCR and EGR, on exhaust gas composition as well as engine performance.
Emissions and performance testing was conducted at a minimum of three distinct engine loads according to the requirements of the NTC. According to the regulations for 2-stroke slow-speed engines, measurements may be conducted at 25%, 50%, 75% and 100% of maximum rated engine power, each load assigned with a specific weighting factor for aggregated emissions calculation. For medium and high-speed 4-stroke auxiliary engines, measurements can also be conducted at 10% load. For the measurement procedure to be officially accepted as complete, the total weighting factor of measurement points should be a minimum of 0.5. A summary of the engine load points and the corresponding weighting factors is provided in Table 1 for the E3 cycle—2-stroke engines—and the D2 cycle—4-stroke auxiliaries. It is noted that for the duration of each measurement the maximum load deviation has to be kept between ±5%.
Following the measurement procedure, the specific NOx emissions are calculated using the carbon balance method, as instructed by the official NTC guidelines. This method is applied to calculate the exhaust gas mass flow from the engines and the specific NOx emissions in g/kWh can then be estimated using the measured NOx concentration and engine power output. Direct measurement of exhaust mass flow on-board is very challenging and in most cases not feasible [20]. The main challenge of accurately applying the carbon balance method is the reliance of involved calculations on the measured fuel consumption values, which can include high levels of uncertainty. This is more prevalent for AEs, as for most large commercial vessels’ multiple engines, usually three, share one flowmeter, making individual consumption measurements challenging. Other accuracy issues may be present affecting fuel consumption measurements of propulsion engines, such as poor flowmeter installation, old or poorly maintained equipment, etc., that cannot be easily remedied during commercial operation.
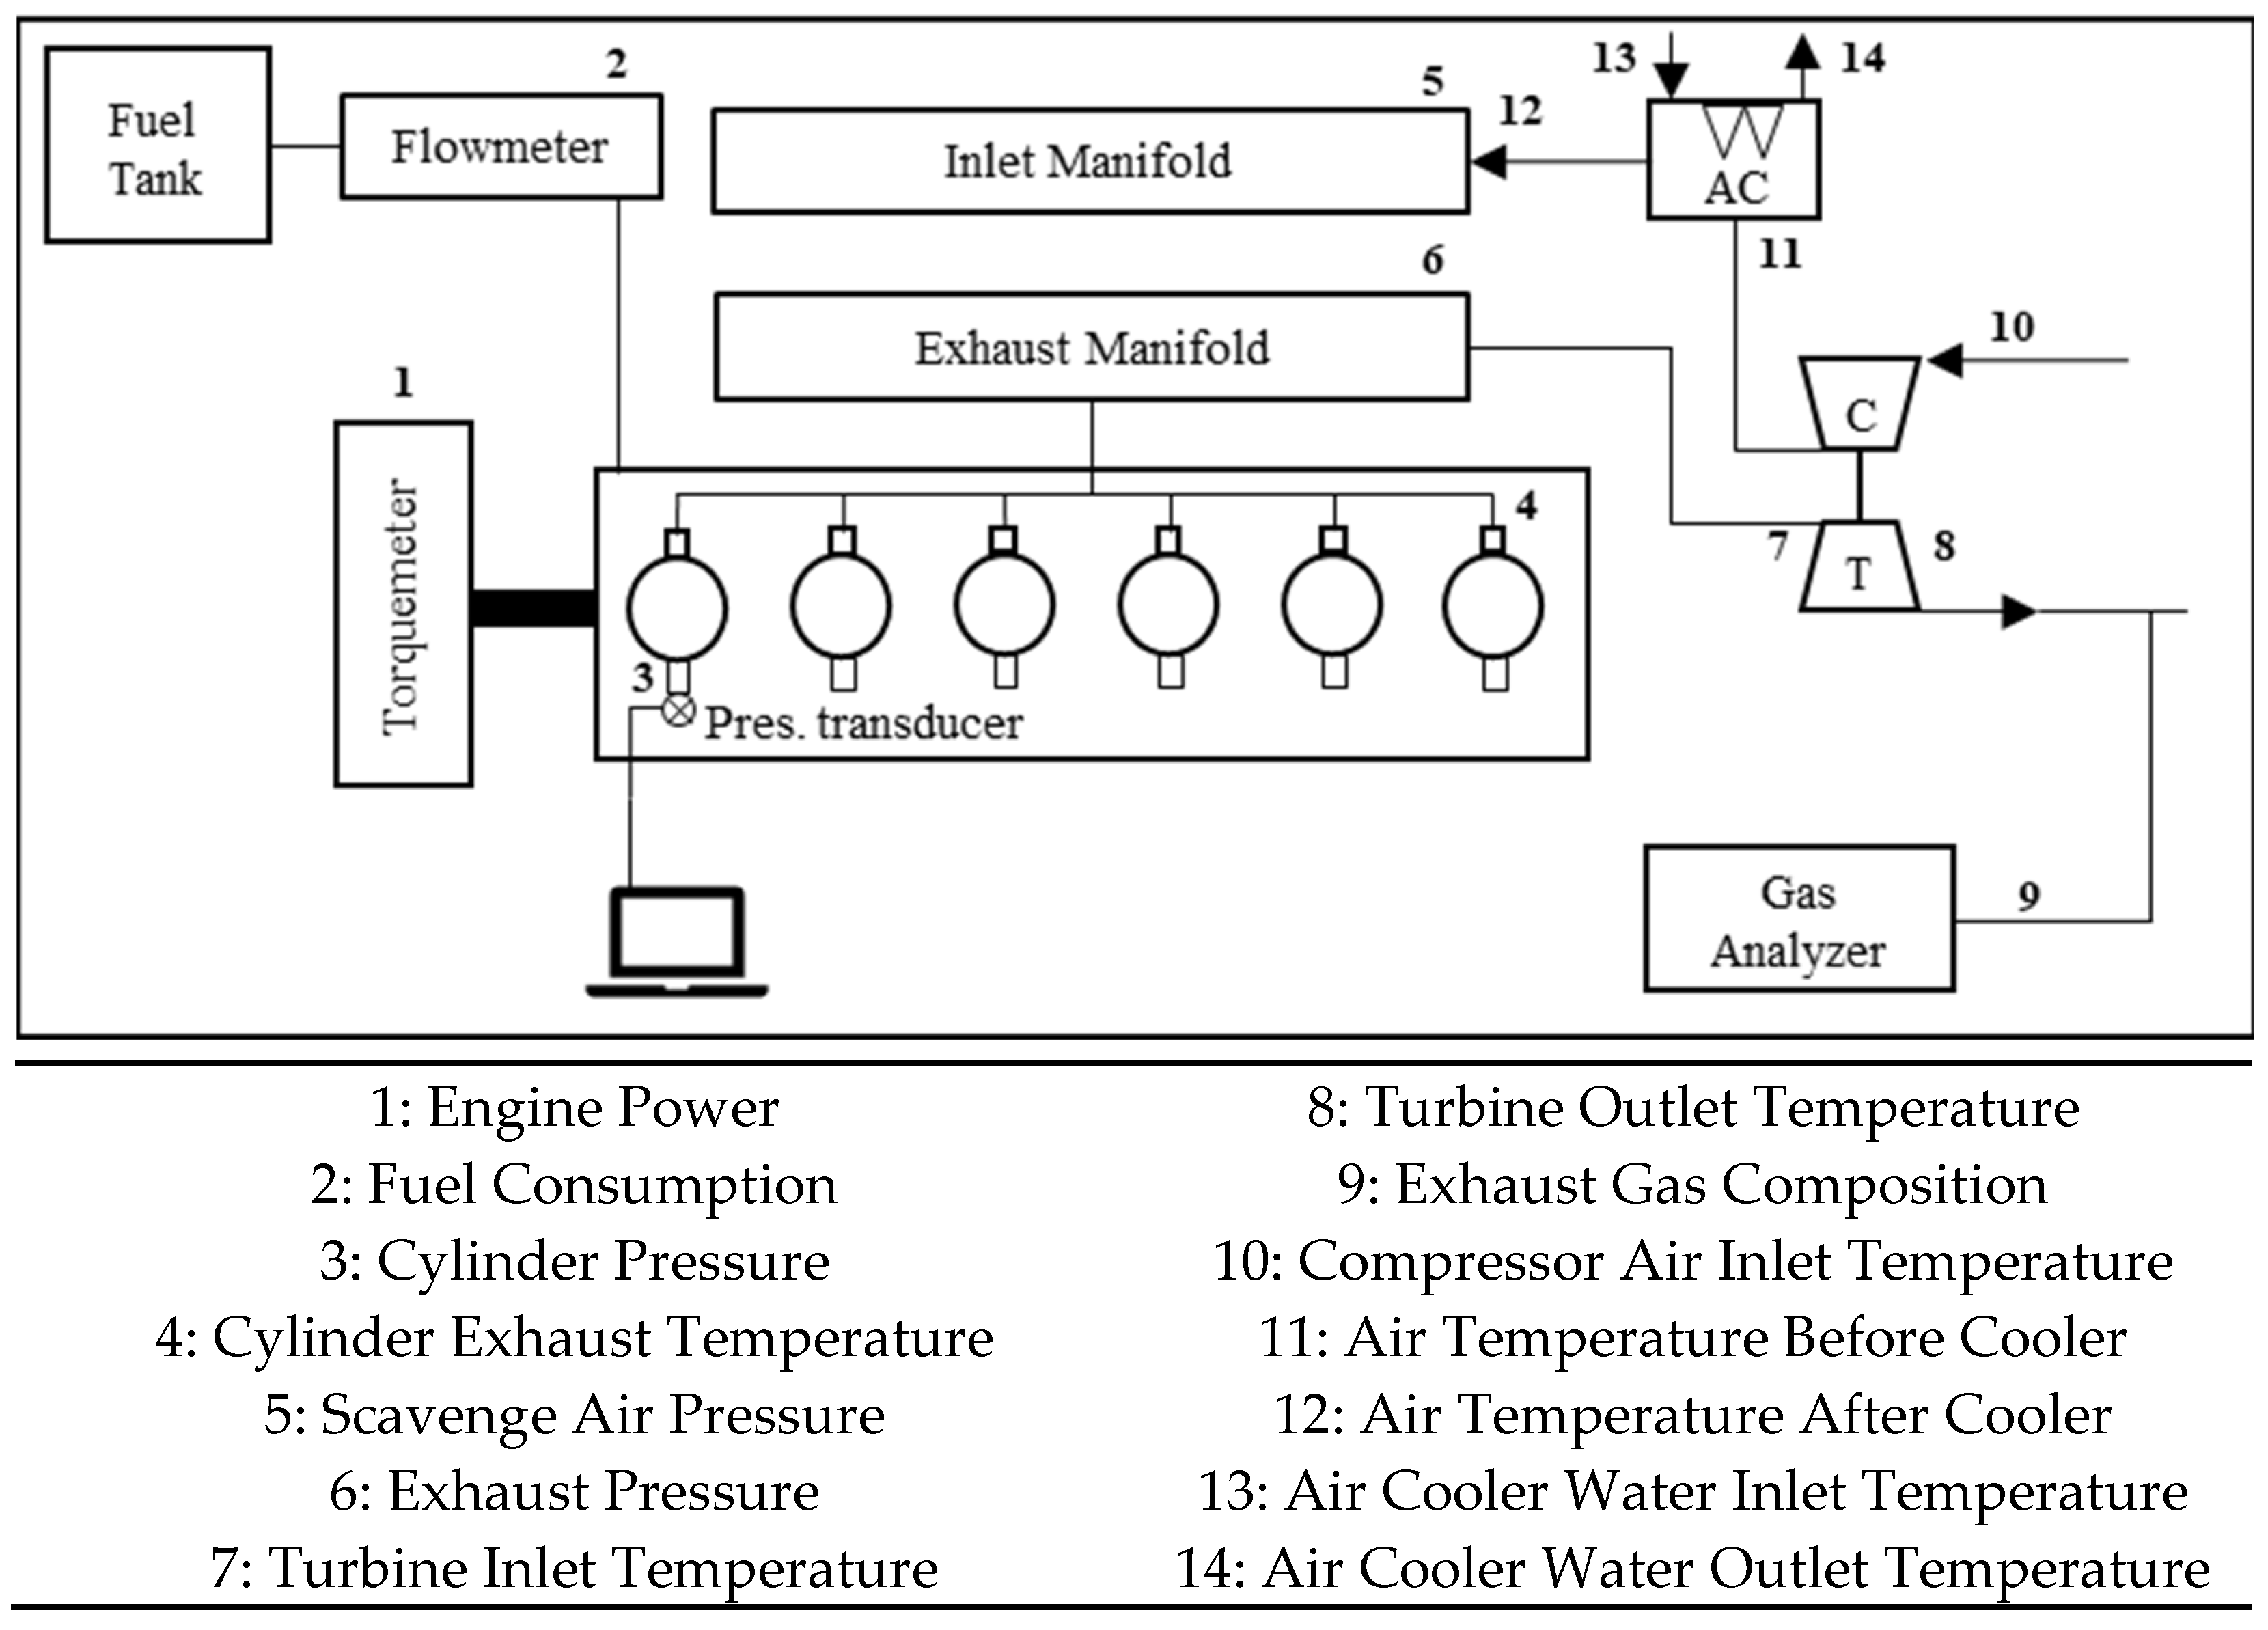
In order to overcome this limitation, frequently applicable to on-board measurements, a different methodology was used to estimate fuel consumption and compare against the flowmeter indications. The methodology is based on acquiring cylinder pressure traces by mounting a piezoelectric pressure sensor to the typically available indicator valves in each cylinder. Processing of the pressure traces allows for the estimation of fuel consumption using the heat release rate methodology [88,121], which has been found to provide highly accurate results. Another benefit of this method is that analysis of the cylinder pressure traces and heat release rate allows for the verification of normal engine performance during the measurement procedure, which is useful when testing alternative fuels, such as biofuels. A schematic of the overall measurement setup is provided in Figure 1.
Exhaust gas composition measurements were conducted using a portable gas analyzer officially approved by MARPOL for use in marine applications. The instrument specifications are provided in Table 2 along with the accuracy values of each sensor included. The sampling rate was set at 1 Hz, while each measurement period was set at 10 min. In addition to the flue gas composition, various engine and environmental parameters were recorded for each measurement according to the guidelines of the NTC. A list of these parameters alongside the average instrument accuracy, with slight differences between the multiple vessels tested, is provided in Table 3.

3.2. Data Collection

Engine load is an appropriate and robust explanatory variable for expressing emission factors, as ships operate over a limited number of characteristic load points during real-world service [45]. The majority of a vessel’s operational time is spent under steady-state conditions, either during cruising or while idling at berth or at anchor [122]. Although the relative share of time spent in each operating phase varies by vessel type, the maneuvering phase generally represents a small fraction of total operating time and is characterized by transient engine behavior with rapid load fluctuations [101]. Overall, engine operation can be considered steady for more than 94% of total operating time, supporting the use of engine load as a representative variable for emission factor development. Figure S1 illustrates the typical engine load ranges for main and auxiliary engines across the most common operating phases, noting that these ranges may vary depending on vessel type.
The methodology employed for the development of EFs is primarily based on an extensive literature review, which led to the collection of 325 publications, studies and reports focused on ship emissions. Out of these, 94 sources were ultimately used, comprising around 300 individual emission measurement results derived using a variety of methods. The majority of these included on-board field measurements (63 studies) and engine bench tests (28 studies) involving marine engines mounted on dynamometers. Additionally, two plume sampling campaigns and one combining on-board and plume measurement were examined. Studies were selected for EF development based on two main criteria: (i) the active implementation of emission measurements using one of the three recognized methodologies (on-board, test-bed, or in-plume) and (ii) the availability of emission rates explicitly linked to a defined engine load condition.
For each testing configuration, various emission rates were collected, including gaseous pollutants (NOx, SO2, HC, etc.), CO2, particulate matter and number (PM/PN) and energy consumption rates. All these data were compiled into a centralized database and categorized according to fuel type, engine type, ship category and other relevant parameters. As the development of EFs is a dynamic and ongoing process, this database is continuously updated with reported emission measurements from ships derived from new publications and reports.
To assess the impact of emission control technologies, a statistical analysis was performed using the literature data stored in the centralized database. EFs and associated information collected from publications and technical reports were organized systematically [117]. The dataset included EFs both upstream (pre-control) and downstream (post-control) of the emission control technologies. Data were grouped by the specific emission control technology used. The percentage reduction in EFs was calculated by comparing upstream and downstream emission values under the same engine load to quantify the effectiveness of each technology for each pollutant. Further analysis was conducted by fuel category (residual versus distillate) to investigate fuel-dependent differences, particularly since these technologies, such as scrubbers, are explicitly designed to mitigate fuel-related emissions.
In addition to the literature-derived data used for developing the updated EF dataset, new field measurement data were incorporated to further enhance the accuracy of EFs. As detailed previously, these new data were obtained from on-board campaigns and newly acquired test-bench measurements, where engine performance, including fuel consumption and NOx emissions, were measured from two-stroke MEs and four-stroke AEs. The total sample comprises measurements from 33 two-stroke MEs and 132 four-stroke AEs for fuel consumption values, while the emissions data pool was updated with data from 12 MEs and 13 AEs. This sample size is considered comparatively large within the context of marine emission studies, which often rely on data from a very limited number of engines, sometimes even a single unit [34,59], due to the substantial cost, safety constraints, and logistical and operational challenges associated with conducting measurements on commercial vessels. The emission testing procedure comprised measurements at distinct engine loads, under relatively stable operating conditions, typically at 25%, 50%, 75%, and 100% of maximum load, according to the IMO requirements [20]. Measurements were conducted using residual and distillate fuels, biofuel blends up to 30% Fatty Acid Methyl Esters (FAME) content (B30), as well as LNG. A limited number of measurements involving SCR and EGR systems installed on 2-stroke engines was also included in this dataset.
To derive the EFs for CO2 and NOx using the largest possible available database, data were also derived from official engine certification tests, which are mandatory for engine family type approval [20] and contain fuel consumption and detailed emissions data for the total engine operating range at very high accuracy. Factory acceptance tests are always conducted using MGO or a combination of high-quality MGO and LNG in the case of DF engines. In the case of large 2-stroke marine engines, factory acceptance tests are the closest equivalent to laboratory testing, which is normally not feasible due to sheer size constraints. The on-board trials allowed measurements using a broader range of fuels, including HFO, VLSFO and various types of B30 biofuel blend. The newly acquired data were cross-referenced with results from official certification trials that include low load measurements of the highest accuracy possible for a marine engine.
Data from the two sources, literature-based studies and on-board measurements, were first harmonized by converting all values to consistent units to ensure comparability and facilitate processing. The two datasets were then integrated into a unified database. Subsequently, the data were systematically classified into distinct categories according to fuel type, engine type and emission control technology. This categorization enabled a more detailed and robust evaluation of emission performance across different fuels, engine configurations and abatement technologies.

3.3. Load-Dependent Emission Factors Methodology

The methodology for developing EFs for ships builds upon and extends the work of Grigoriadis et al. (2021) [45]. The collected emission rates were used to derive both an average emission performance and the dependency of the EF on engine load based on the following steps:
  • As a first step, a single engine load point had to be selected to serve as a reference point. For each pollutant, the reference load was chosen based on the most frequently reported load condition in the available literature. Depending on engine type and pollutant, the most commonly reported operating point was 50% engine load in the vast majority of cases, while 25% or 75% load appeared only in a limited number of studies for specific engine types or pollutants.
  • Average emission values were calculated for each pollutant at this reference load and designated as Base Emission Factors (BEFs). These BEFs were established for marine engine categories, including slow-speed (SSD), medium-speed (MSD), and high-speed (HSD) diesel engines, and for a range of fuel types including residual fuels, distillates, LNG, methanol and ammonia.
  • Emission rates reported at load points other than the reference were then normalized relative to the emission rate at the reference load. This normalization procedure was applied individually for each data source, resulting in a cluster of normalized values centered around 1.0 for each reference study. By applying this method across all literature sources and aggregating the normalized values, the relative effect of engine load on emissions could be determined independently of the absolute emission levels reported in each study.
  • Finally, a single load-dependent emission function was derived for each pollutant by applying regression analysis to the combined set of normalized data points [45].

4. Results and Discussion

4.1. Base Emission Factors

The average of the individual EFs, collected from the literature review and the additional field measurements, at a 50% reference engine load was used to estimate the SFOC BEF levels in MJ/kWh distinguished by engine type (Table 4).
The values presented in Table 4 have been revised from the existing BEFs for SFOC published by Grigoriadis et al. (2021) [45]. In the original dataset, engine types were categorized into three groups, namely SSD, MSD and HSD, without distinguishing between MEs or AEs. The present study introduces a refined classification, adding a distinct category for AEs. For MEs, the SFOC BEFs are further differentiated according to engine type, while AEs are represented as a single category, as the available data are insufficient to enable further classification by rotational speed. A major advancement in the updated BEFs is the revision of baseline fuel consumption levels across different engine types. Specifically, SSD MEs exhibit lower SFOC values compared to MSD and HSD engines. This difference reflects the superior thermodynamic and combustion efficiency of SSD engines, which typically achieve higher overall performance and lower SFOC [123,124]. Conversely, AEs show the highest SFOC values, as they are exclusively four-stroke engines characterized by lower efficiency and are primarily designed to generate electrical power for the ship’s auxiliary systems [125].

4.1.1. Biofuels BEFs

Operation on biofuels, pure or in blend form, exhibits slightly lower efficiency compared to conventional fuels, due to their composition and their effect on engines’ fuel supply equipment and overall, on the combustion process. SFOC optimization for biofuel use can be achieved but requires alteration of engine tuning, mainly the start of injection angle. Based on experimental findings [88], this study suggests that SFOC BEFs for biofuels should be increased by 1% for two-stroke engines and 2.5% for four-stroke engines relative to conventional fuels.
NOx emissions from biofuels are generally higher than those produced by conventional marine fuels, primarily due to the elevated oxygen content in their molecular structure [126], which promotes higher combustion temperatures and enhanced oxidation. Experimental results [88] indicate that the increase is around 10%, although substantial variability may occur among different engine types and operating conditions, even within engines of the same general design. Table 5 depicts NOx BEFs for biofuels distinguished based on engine types and NOx Tier level at 50% engine load.
The decline observed from Table 5 in BEFs across successive Tier levels highlights the measurable impact of increasingly stringent emission regulations on reducing real-world engine emissions.
The BEFs for CO, HC and PM associated with biofuels are presented in Table 6. These BEFs were derived through statistical analysis of measured values reported in literature sources [126,127,128,129,130,131,132]. The reference engine load for biofuel BEFs was set at 25%.
CO and HC exhibit lower BEFs for biofuels by around 35% and 82%, respectively, compared to conventional marine fuels [130]. This reduction is primarily attributed to the lower carbon content and higher inherent oxygen content of biofuels, which promote more complete combustion. Furthermore, the higher proportion of biofuel in the blend reduces the concentration of aromatic and polycyclic HCs, further limiting the formation of unburned HCs. Similarly, PM BEFs are lower for biofuels by approximately 77% compared to conventional fuels (0.5% FSC), due to the significantly lower sulphur content in biofuels. The absence of sulphur suppresses sulphate formation, which is a major constituent of PM in residual fuels, thereby resulting in a significant reduction in overall PM emissions.

4.1.2. LNG BEFs

The BEFs for LNG regarding NOx, CO and HC were derived from a combination of literature studies [65,67,133] and field measurements [106]. NOx for HPGI technology was specifically obtained from the work of Chountalas, (2023) [106]. For methanol, the BEFs were derived from the experimental findings of Fridell et al. (2021) [70] and Wang et al. (2020) [120]. In the case of ammonia, available emission measurement data remain extremely limited, as engine concepts are still in the research and development phase and only a small number of pilot ship installations currently exist. The BEFs for uncontrolled ammonia combustion were therefore based on Schwarzkopf et al.’s (2023) study [72], taking into account that ammonia is a carbon-free fuel but requires the use of pilot fuel injection to ensure stable and efficient combustion. At present, ammonia-fueled marine engines are not commercially deployed, and their application is restricted to pilot and demonstration projects. As no direct emission measurements from ammonia-fueled marine engines were available, the resulting EFs should be regarded as preliminary estimates. Table 7 presents the NOx, CO, HC, CH4 and N2O BEFs for LNG low- and high-pressure DF, methanol high-pressure DF and ammonia high-pressure DF engines. The reference load was set at 40% for the LNG low-pressure dual fuel engine NOx and CO and 50% for the LNG low-pressure HC and CH4, LNG, methanol and ammonia high-pressure dual fuel engines.
The NOx BEFs for LNG in LPGI technology are significantly lower, around 95%, than those of conventional marine fuels [134]. This reduction is primarily attributed to the lower maximum combustion temperatures achieved in these engines. As a result, marine engines utilizing LNG in LPGI configurations are capable of meeting the stricter IMO NOx Tier III emission limits without additional aftertreatment systems, such as EGR or engine tuning measures. It is noted that EGR at a relatively low recirculation rate may still be used in these engines in order to limit methane slip [109]. In contrast, HPGI engines exhibit NOx emissions at levels comparable to those of diesel engines but are still around 30% lower compared to Tier I SSD engines [134]. Consequently, to comply with the Tier III limits, these engines must be equipped with emission control technologies, currently SCR or EGR systems. Despite this requirement, HPGI engines provide the benefit of greater fuel efficiency and significantly lower methane slip [106].
CO and HC emissions from LNG-fueled engines are approximately threefold and sixfold higher, respectively, compared to those from conventional diesel engines. The elevated HC emissions are mainly attributed to unburned methane (methane slip) escaping through the exhaust. In fact, methane typically represents about 95% of the total HC emissions, closely reflecting the methane fraction of the LNG fuel [67]. Furthermore, engine rotational speed plays a significant role in the formation of CO and HC. Generally, two-stroke engines exhibit lower emissions than four-stroke counterparts, primarily due to their longer oxidation time resulting from lower operating speeds, as well as their larger combustion chamber geometry. The higher volume-to-surface area ratio in two-stroke engines promotes more complete oxidation of fuel, thereby enhancing combustion efficiency and reducing unburned methane emissions [133].

4.1.3. Methanol BEFs

The use of methanol as a marine fuel results in approximately 40% lower NOx emissions compared to conventional petroleum-based fuels at reference load point. Nevertheless, this reduction is insufficient for several methanol engine technologies, including HPGI systems (Table 7), to comply with the stringent IMO NOx Tier III emission limits. The intrinsic oxygen content of methanol promotes higher in-cylinder temperatures and enhances thermal NOx formation during combustion, thereby constraining its potential for further NOx reduction. Consequently, the integration of dedicated NOx control technologies, such as SCR or EGR, remains necessary to ensure compliance with methanol-fueled ships operating within NECAs.
Similarly, CO and HC emissions from methanol are higher by over 600% and 200%, respectively, compared to conventional fuels at reference load point. This highlights the need for further research into optimizing methanol combustion efficiency. Without such advancements, the installation of emission control technologies, such as DOC, may be considered a viable alternative to reduce such emissions [120]. The study by Wang et al. (2020) [120] demonstrated, using an inland marine engine, that CO and HC emissions are reduced to near-negligible levels downstream of a DOC in a methanol-fueled engine configuration. However, further research is required to investigate the performance and effectiveness of oxidation catalysts installed downstream of methanol-fueled engines in large ocean-going vessels, where operating conditions, engine scales and exhaust characteristics may differ substantially.

4.1.4. Ammonia BEFs

Regarding ammonia, NOx emissions are generally higher compared to other alternative fuels due to its chemical composition. Despite this, it is estimated that using ammonia as fuel results in approximately 24% lower NOx emissions compared to conventional marine fuels. However, to comply with the stricter NOx Tier III standards, the installation of emission control technologies, such as SCR systems is required. Since ammonia is carbon-free, CO and HC emissions are only generated from the pilot fuel, which is mostly MGO. N2O EFs for alternative fuels are also reported in Table 7 due to their relevance to global warming potential. Among the fuels considered, ammonia exhibits the highest N2O EFs, highlighting the need for carefully designed emission control strategies capable of simultaneously managing NOx, N2O and NH3 slip.
Regarding CO2 emissions, both LNG and methanol are classified as low-carbon marine fuels, with their total carbon emissions originating from the combustion of both the alternative fuel and the pilot fuel. In contrast, ammonia is a carbon-free energy carrier, and therefore, the associated CO2 emissions stem exclusively from the pilot fuel required to initiate and stabilize combustion. All alternative fuels considered in this study are inherently sulphur-free; consequently, SO2 emissions originate solely from the sulphur content of the pilot fuel.

4.2. Load-Dependent Functions

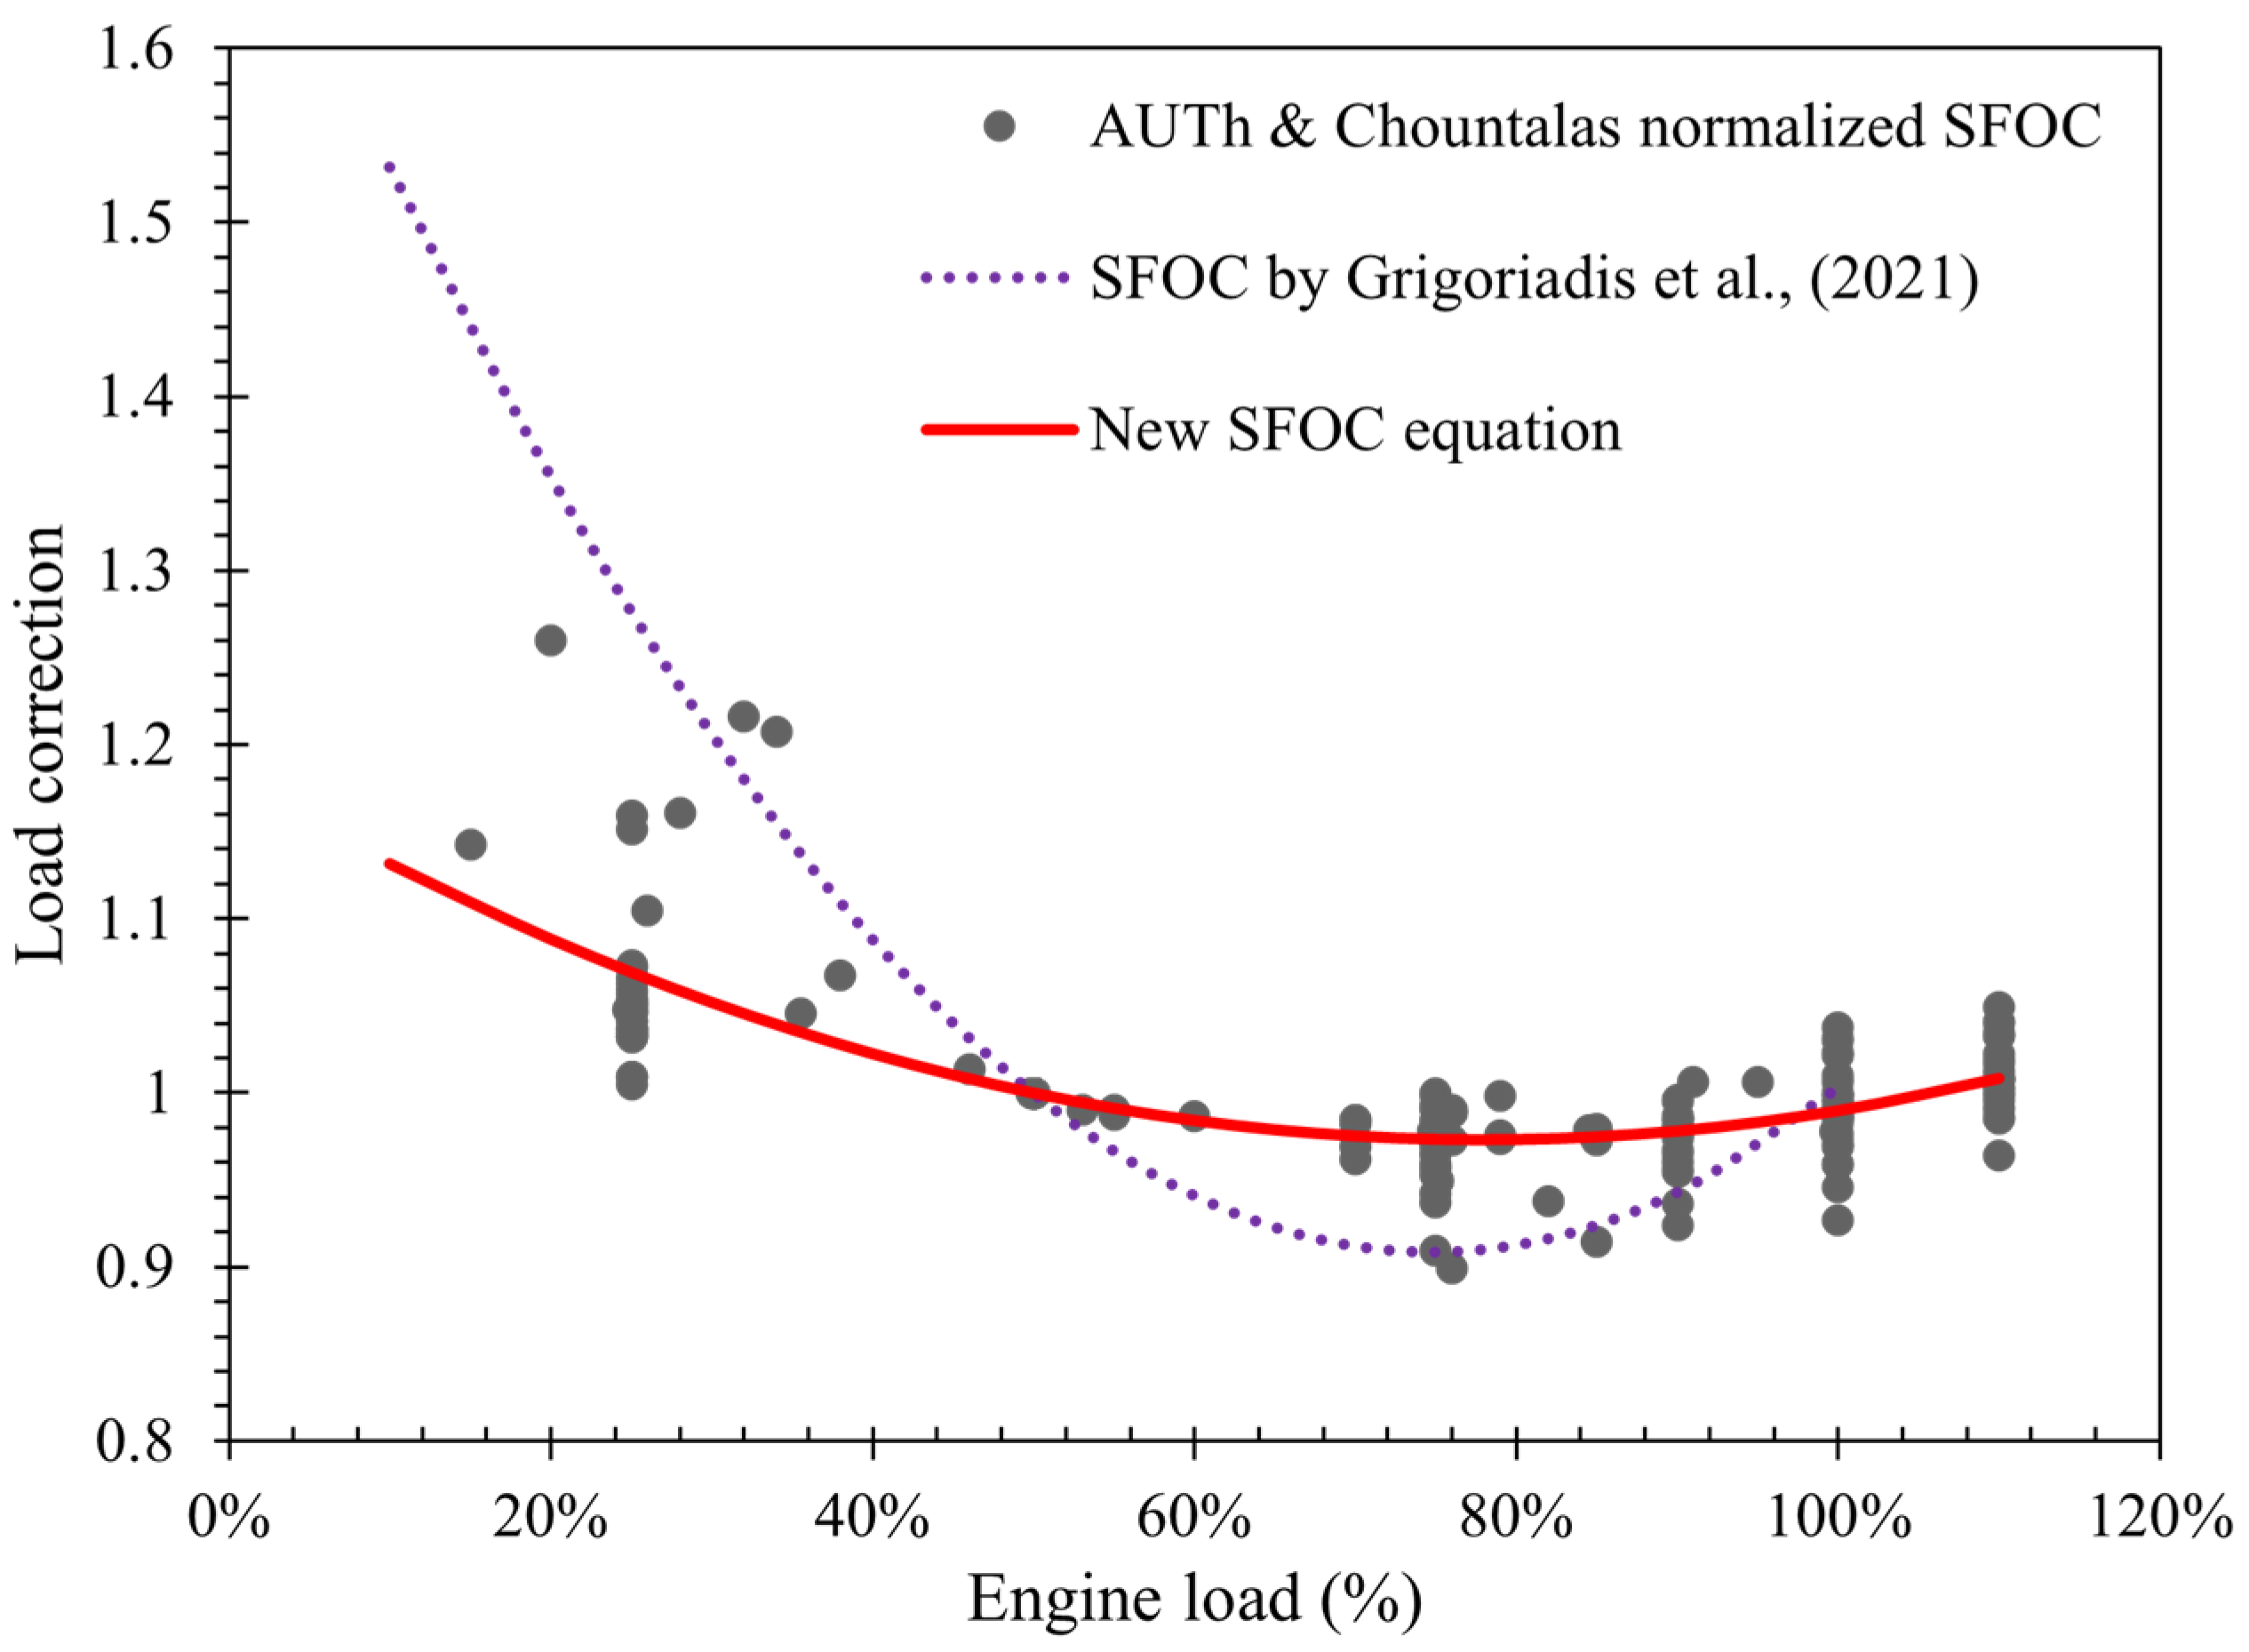
Figure 2 illustrates the dimensionless relationship between SFOC and engine load for both the existing (Grigoriadis et al., 2021) [45] and the updated curves. The most common engine load for which EFs were found in the literature and field measurements was 50%. All other values were normalized relative to this reference point. EFs for both MEs and AEs are included in the same group of data points, as our analysis did not reveal any significant differences in results based on engine type.
The SFOC, which reflects the efficiency of marine engines, tends to decrease as the engine load increases, reaching a minimum at around 75% load before rising again. This behavior is typical for marine diesel engines, which are optimized for maximum fuel efficiency at cruising conditions, typically occurring at 75% load. As shown in Figure 2, the updated curve addresses the overestimation of fuel consumption at low loads, an important contribution of this study based on additional on-board measured data of high accuracy. Specifically, at 20% engine load the updated SFOC curve predicts 20% lower fuel consumption compared to the existing curve. This improvement is relevant as ships often operate at reduced speeds due to the “slow steaming” strategy, aimed at reducing energy consumption. As a result, the engine load is lower compared to higher-speed navigation and the updated curve more accurately reflects these conditions.

4.2.1. Load-Dependent Pollutant Emissions for Biofuels

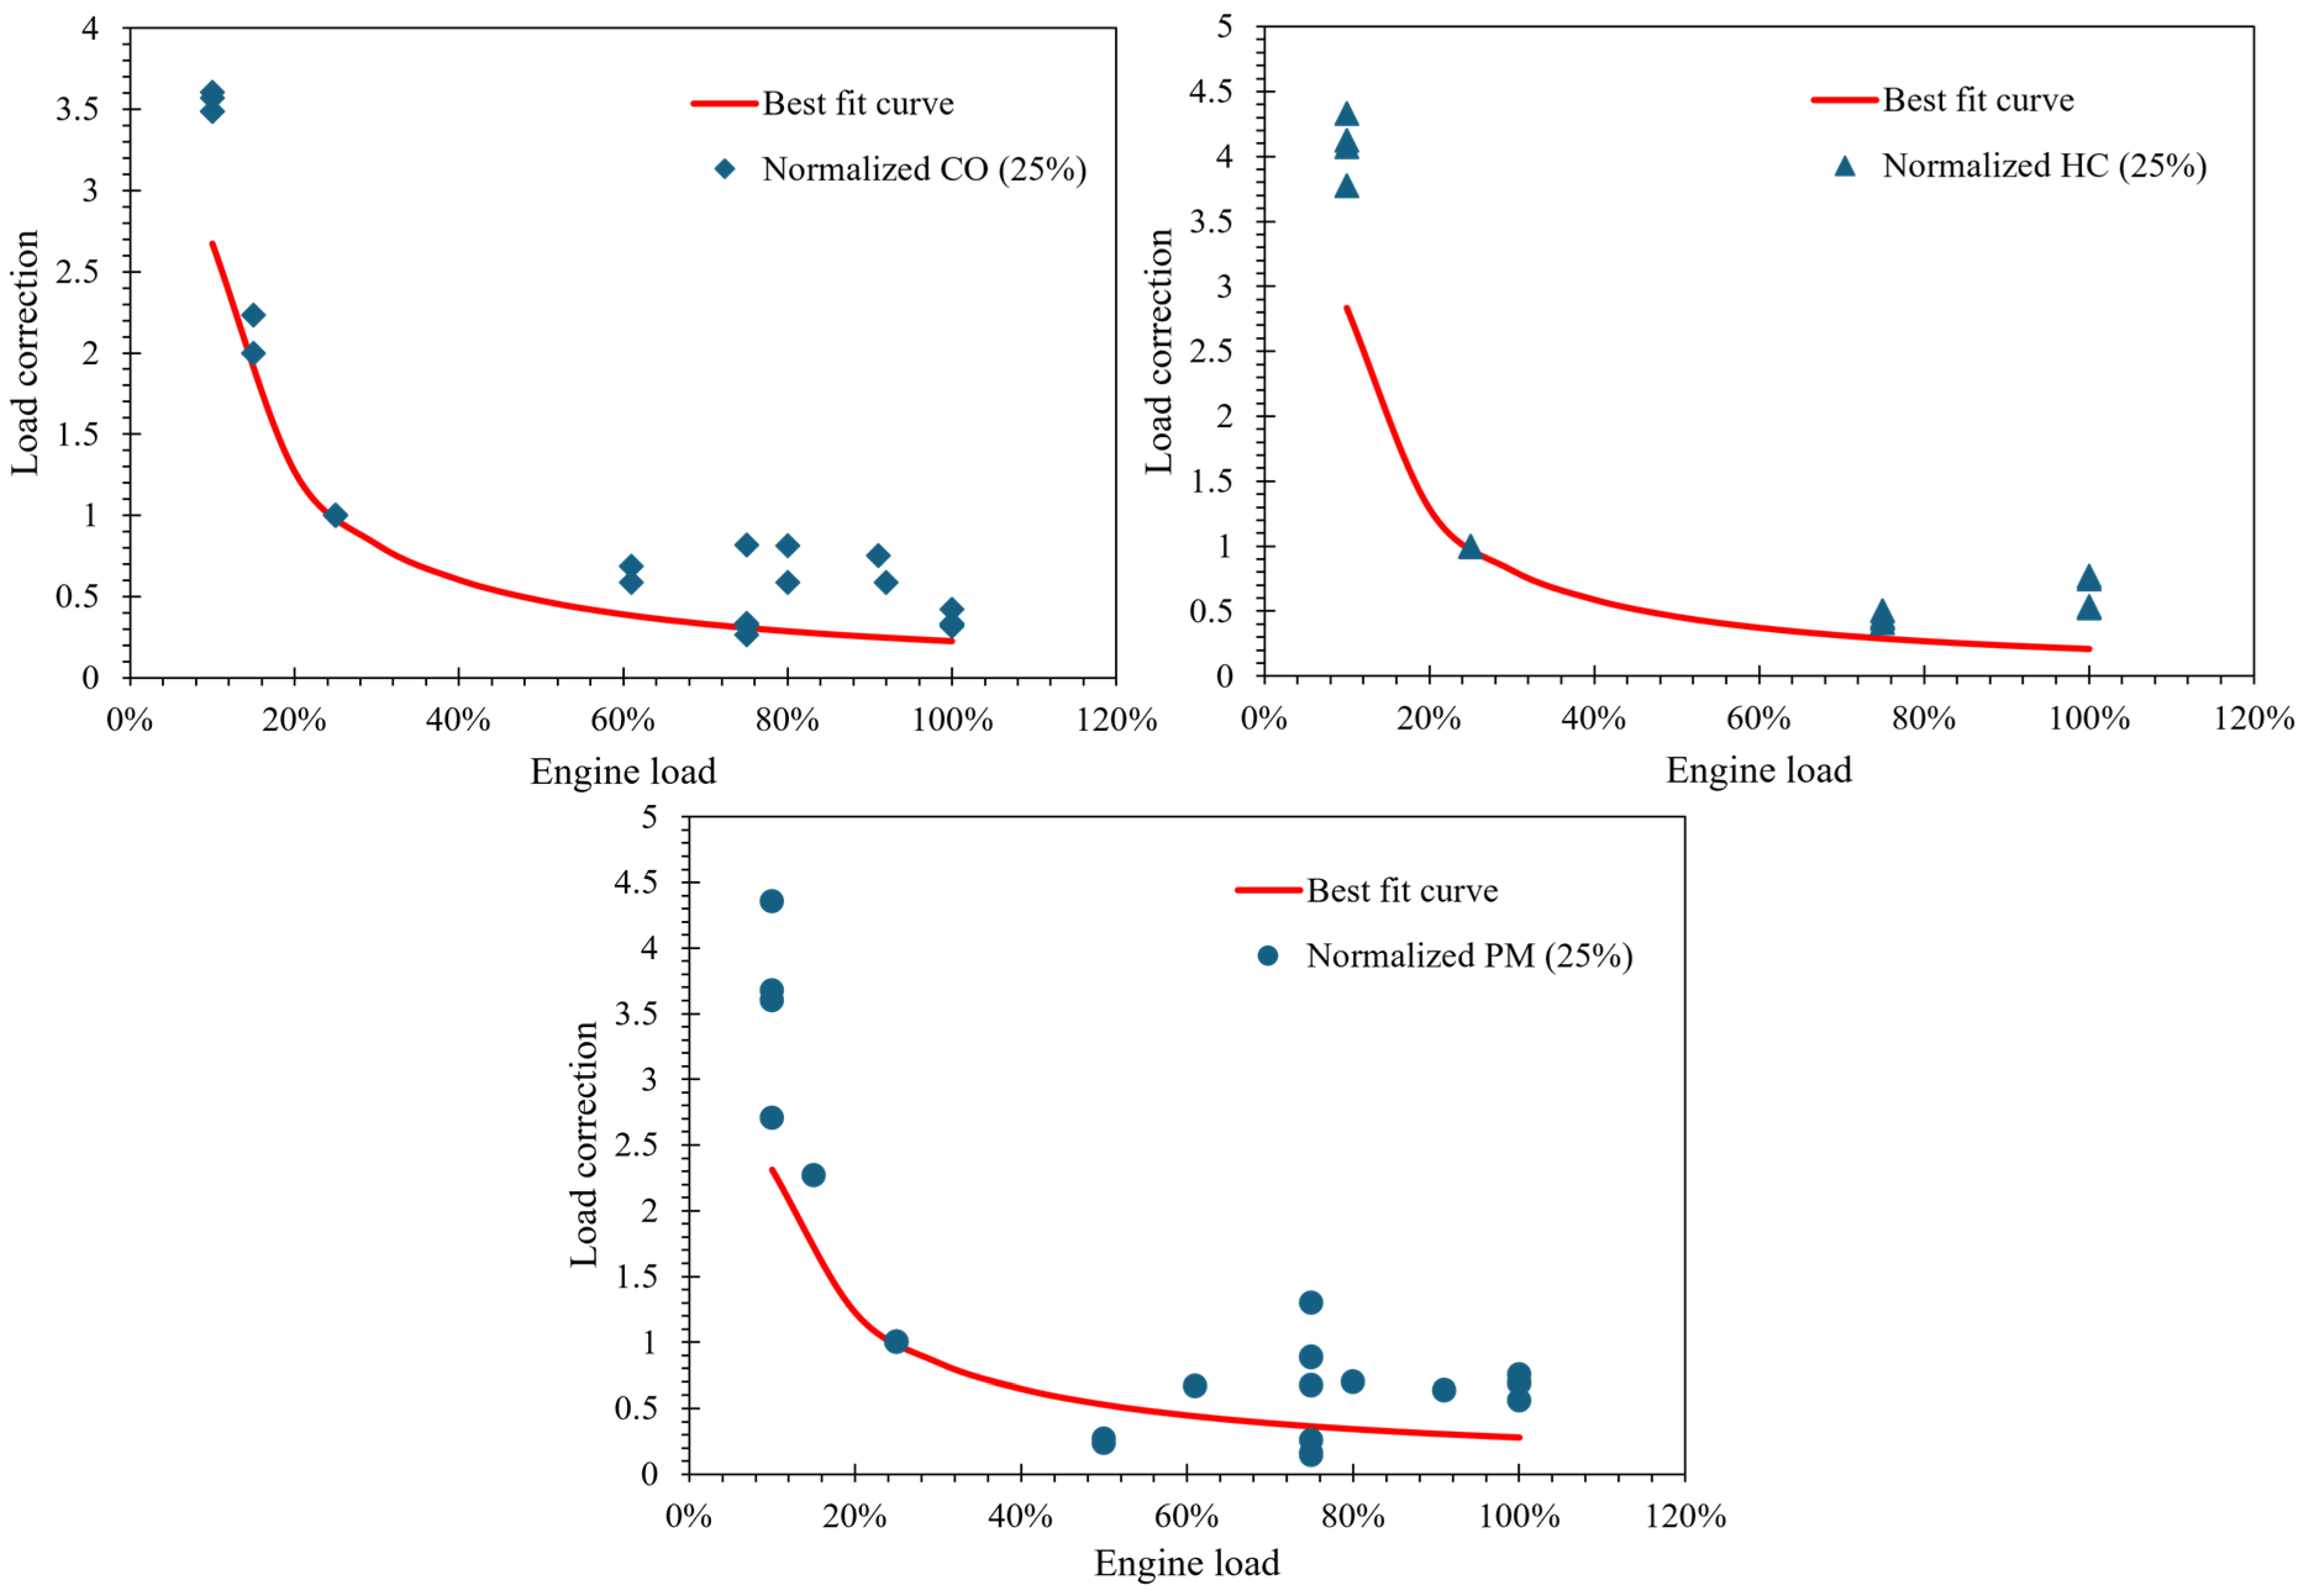
The dimensionless NOx function for conventional fuels remains unchanged, as formulated by Grigoriadis et al. (2021) [45]. Since biofuels do not significantly affect engine performance, the normalized NOx versus operating load curve distinguished by Tier standards for conventional fuels can be used to estimate NOx emissions for biofuels of up to 30% FAME content (B30). For other gaseous pollutants, CO, HC and PM, the corresponding engine normalized load-dependent functions are presented in Figure 3. The reference load was set at 25%.
From the individual plots in Figure 3, it is evident that CO, HC and PM emissions decrease as engine load increases. This trend is attributed to the similar properties of biofuels to conventional fuels, where higher engine loads lead to more efficient combustion, resulting in reduced pollutant emissions.

4.2.2. Load-Dependent Pollutant Emissions for LNG and Methanol

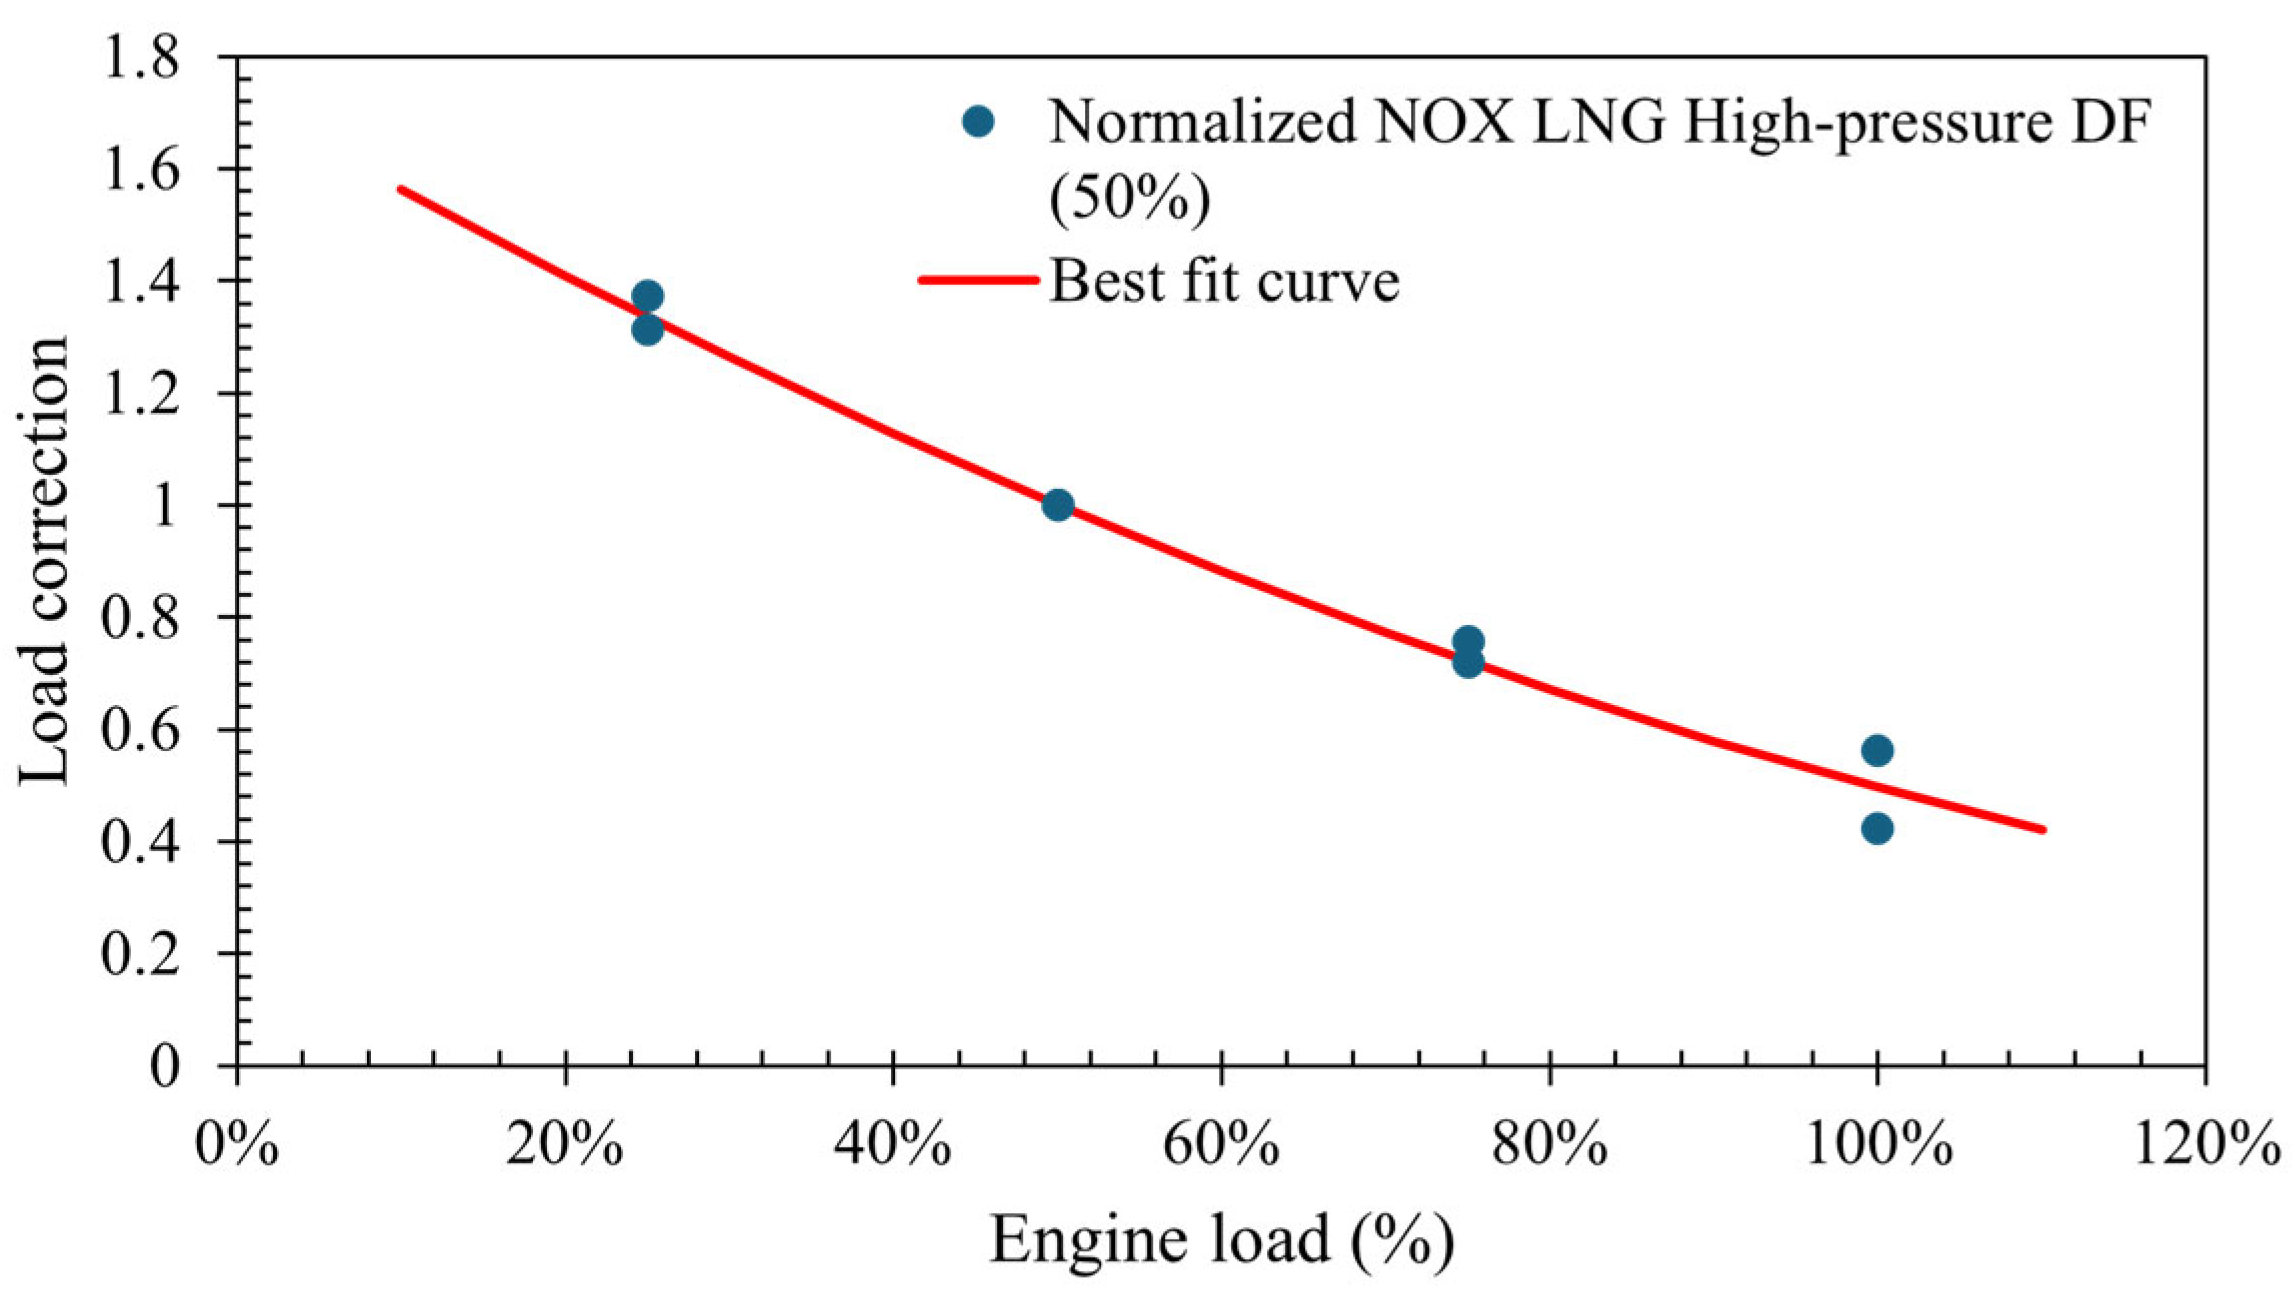
Figure 4 presents the normalized NOx function for an HPGI engine using LNG as the primary fuel. The reference load used for the normalization process was 50%.
From Figure 4, it is observed that the NOx curve decreases as the engine load increases. When compared to conventional fuels, the LNG curve shows a similar trend, though it begins to decrease at higher loads. Due to the limited number of available LNG data points and the specific characteristics of NOx performance, it is not possible to draw definitive conclusions from this comparison.
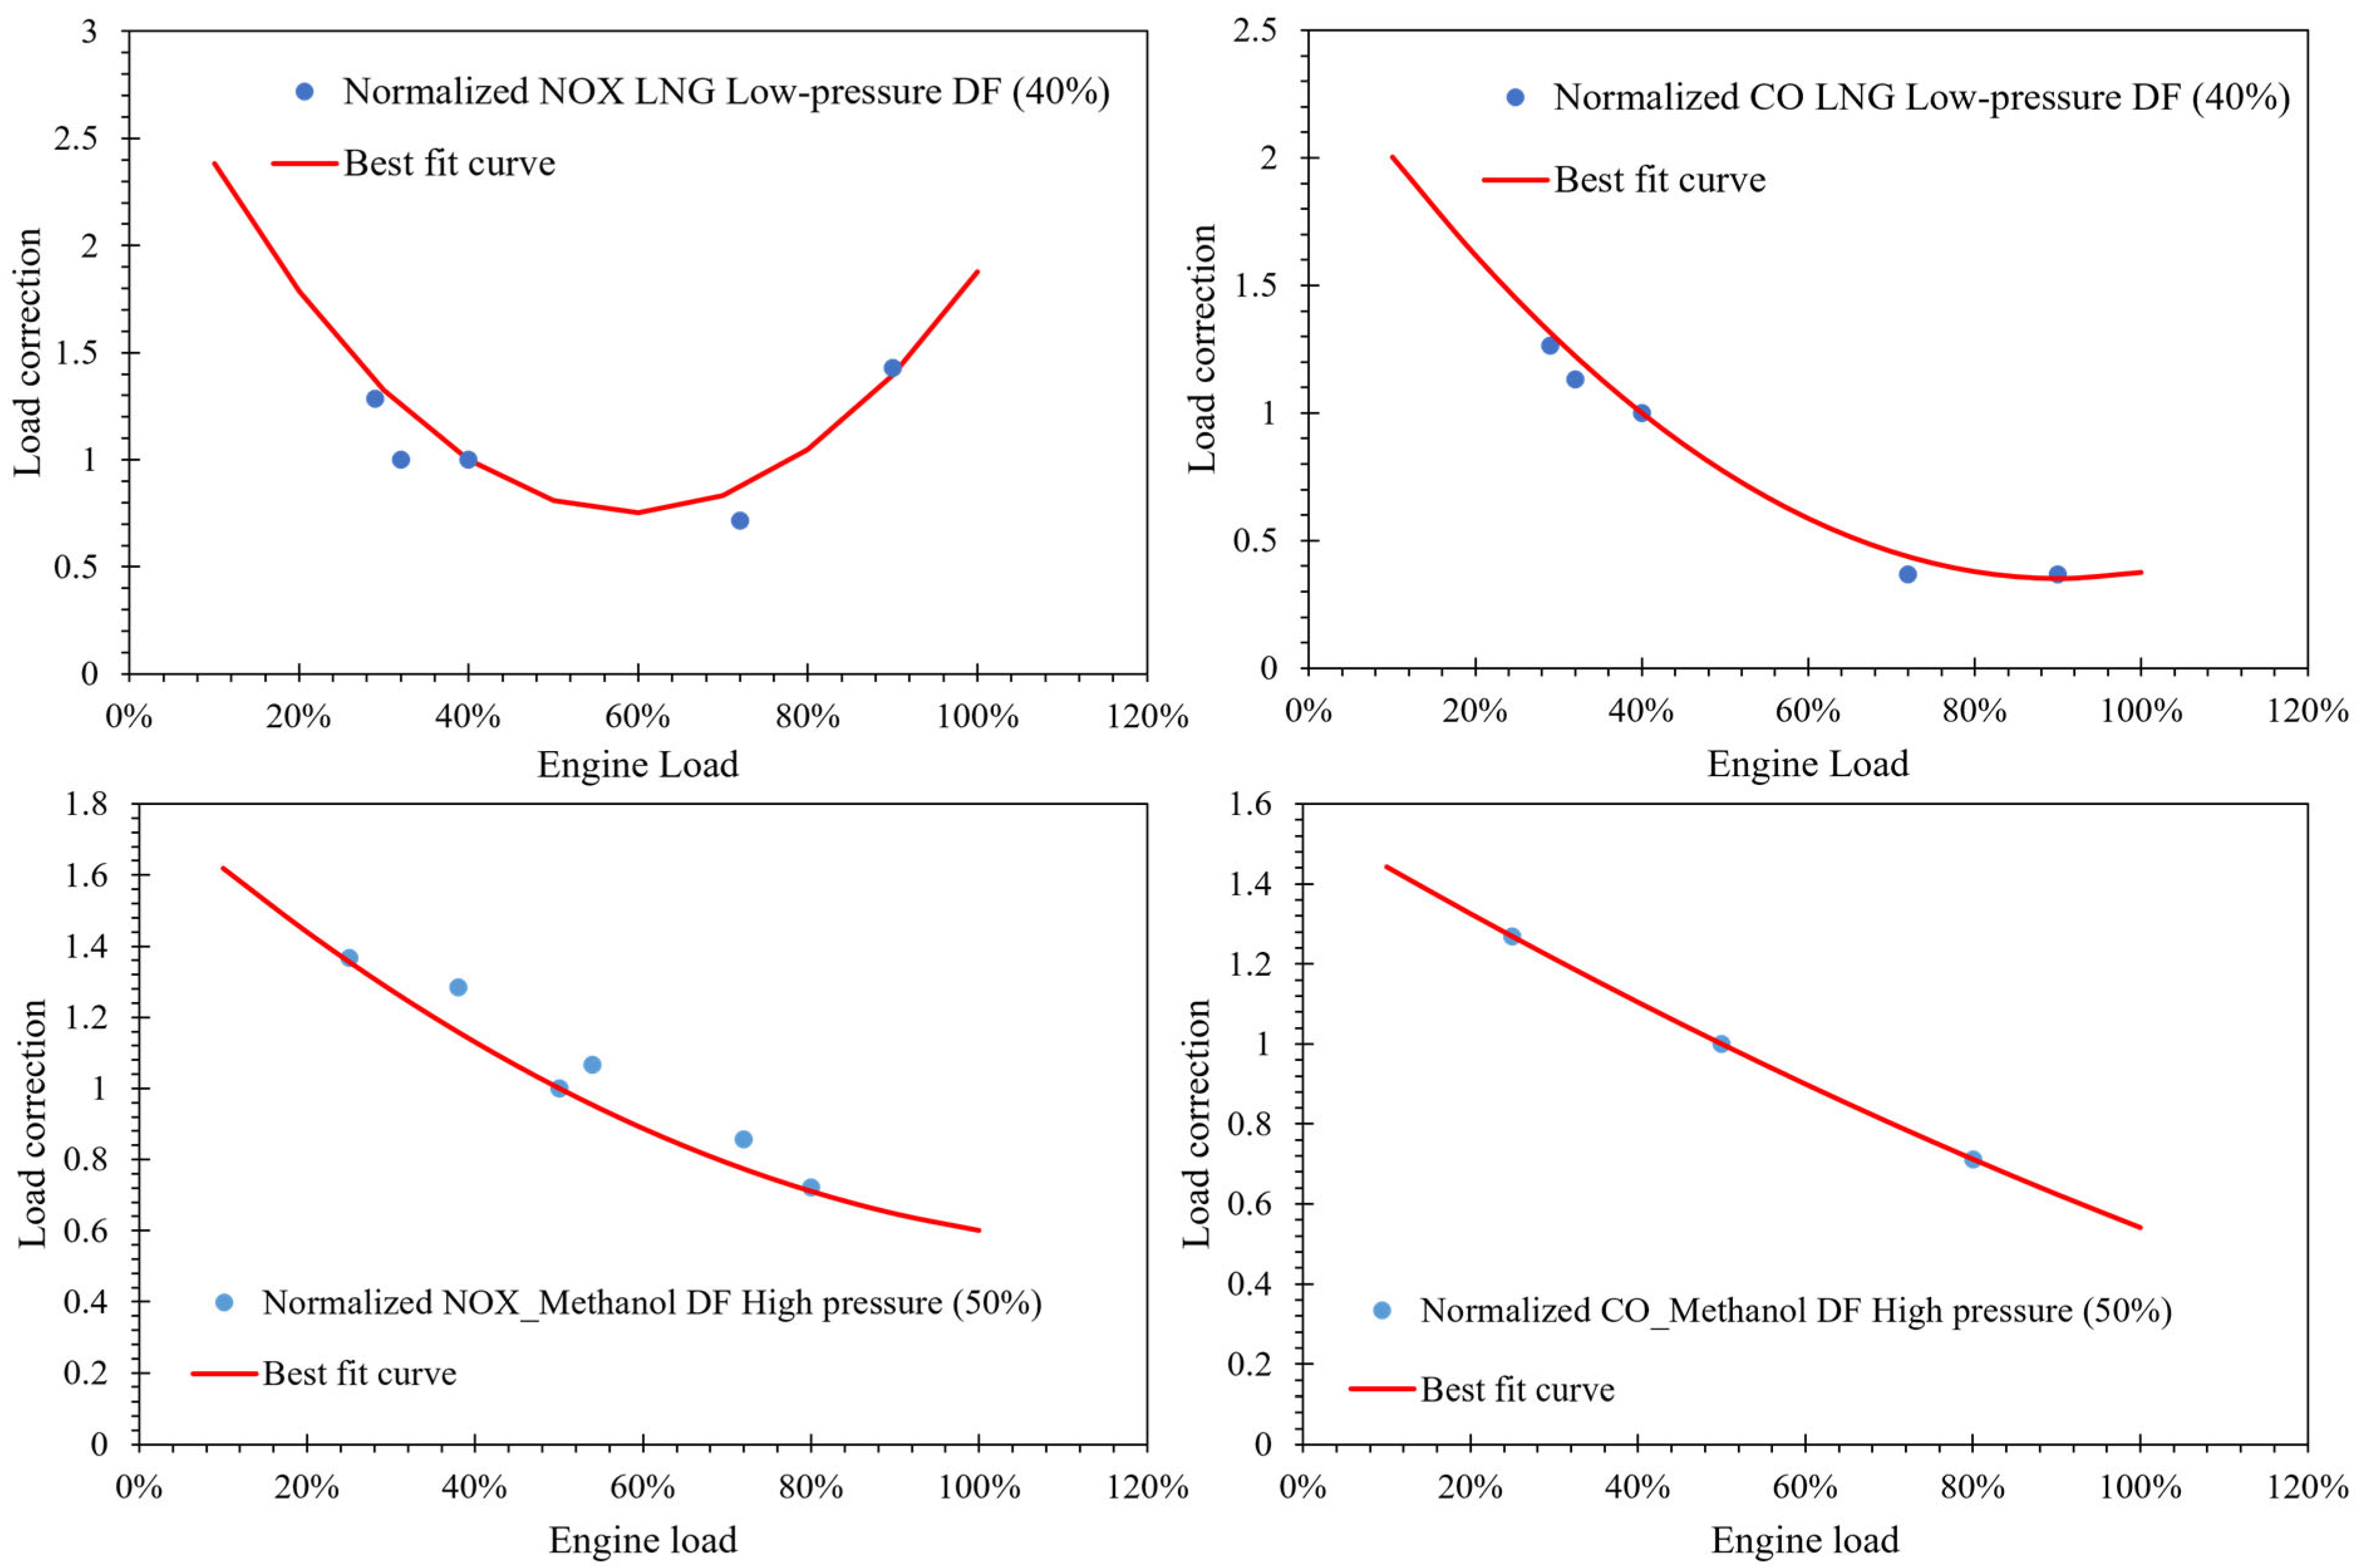
Figure 5 illustrates the normalized relationship between engine load and EFs for NOx and CO for LNG low-pressure DF and methanol high-pressure DF engines. The reference load was set at 40% for the LNG engine and 50% for the methanol engine, corresponding to the most frequently reported load conditions in the literature.
CO emissions decrease as engine load increases, while NOx emissions are minimal around the 60% load region, with higher emissions at both low and high load regions for LNG. A similar trend of decreasing emissions with increasing load is observed for methanol. It is important to note that the confidence level for these trends is low due to the limited number of measurements available and is expected to vary by engine type revision as the LNG to conventional fuel (MGO, HFO, etc.) ratio per load point is changed for newer iterations, as observed by Chountalas, (2023) [106].
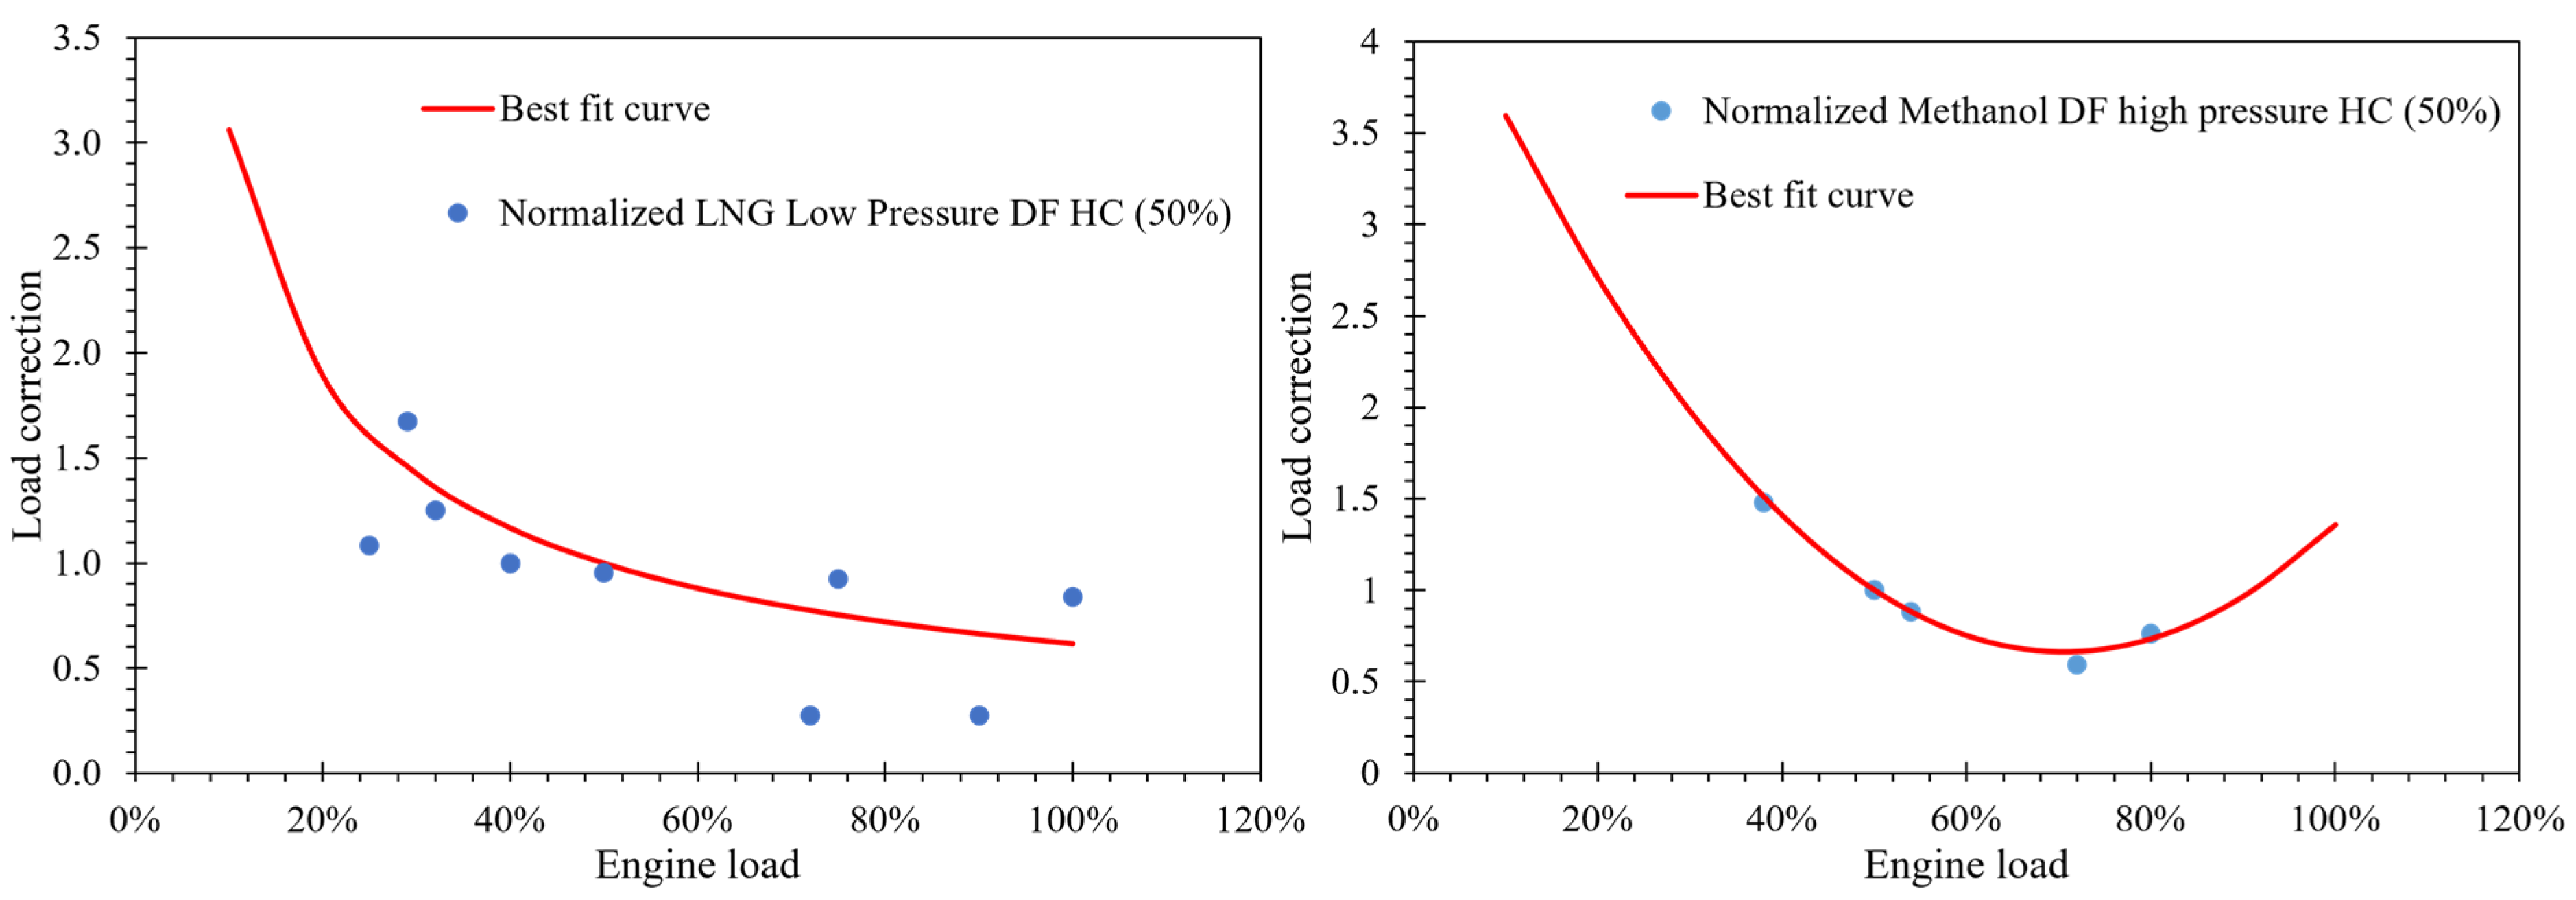
Regarding HC, the available sources allow for a comparative assessment of the performance of LNG and methanol engine types in low- and high-pressure configuration, respectively. Emission values were normalized at 50% engine load, and the resulting load-dependent emission trends are presented in Figure 6.
The results presented in Figure 6 reveal a trend similar to that observed in conventional diesel engines: HC emissions are relatively high at lower engine loads and decrease as the load increases. CH4 emissions from LNG-fueled engines follow the same load-dependent correction curve as HC emissions. However, as with NOx emissions, the limited number of available data sources does not allow for drawing definitive conclusions. This underscores the need for additional experimental studies on alternative fuels and the distinction between engine technology applied to better quantify their influence on air-quality-related pollutants.
A load-dependent formulation for N2O emissions could not be developed due to the lack of sufficient experimental data. Consequently, a constant BEF is proposed for application across all engine load conditions.
The complete EF database is provided in the Supplementary Material, which includes the full set of equations and BEFs for gaseous and particulate pollutants, as well as SFOC values. Conventional marine fuels (residual and distillate) are presented in Table S1, biofuels in Table S2, and alternative fuels (LNG, methanol and ammonia) in Table S3. Although residual and distillate fuels are not analyzed in detail in this study, the corresponding EFs are included to ensure that users have access to a comprehensive and integrated EF dataset covering conventional and alternative fuels, biofuels and the influence of emission control technologies.
To better quantify uncertainty for practical applications, Table S4 presents the calculated 95% confidence intervals and the corresponding coefficients of determination (R2) for each pollutant and technology examined in this study. Owing to the limited number of available emission measurements for alternative fuels, the resulting regressions often exhibit relatively high R2 values, while the associated 95% confidence intervals for the base emission factors remain wide. This reflects the good fit of the load-dependent functions to the available data but also highlights the increased uncertainty of the estimated BEFs due to the limited sample size.

4.3. Emission Reduction Factors for Control Technologies

Emission control technologies are installed on ships to reduce harmful pollutants resulting from fuel combustion. The primary targeted pollutants from control technologies are those regulated by legislation, namely SOx and NOx, while PM is indirectly controlled through the use of low-sulphur fuels. The design, configuration and operational characteristics of each emission control system strongly influence its overall pollutant removal efficiency. For example, scrubbers are primarily designed to reduce SOx emissions from the exhaust, but can also affect emissions of PM, NOx and other pollutants, both in the atmosphere and in marine discharges. This downstream secondary effect of an emission control system can be either beneficial, leading to a reduction in non-targeted pollutants, or adverse, resulting in an unintended increase. Therefore, emission control technologies should be assessed not only for their intended pollutant reduction performance but also for their broader environmental impacts on other emission species. This study aims to provide quantitative information on the emission reduction effectiveness of the most widely used emission control technologies, namely scrubbers, SCR, EGR, DOC and DPF [117].
The emission reduction rates presented in Table 8 are derived from the average percentage change in pollutant emissions (CO, NOx, SO2, HC, PM) and energy consumption rate for each emission control technology. The analysis also considered differences in fuel type, residual and distillate fuels, to capture fuel-specific effects, particularly since some control technologies (e.g., scrubbers) are explicitly intended to address emissions from high-sulphur residual fuels. Positive reduction values indicate a decrease in EFs following the application of abatement technologies, while negative values indicate an increase. The emission reduction factors and associated energy penalties presented in Table 8 are assumed to be constant across all engine operating loads and engine–fuel configurations.
As shown in Table 8, the use of scrubbers is associated with an energy penalty equivalent to a 2.15% increase in fuel consumption. This is attributed to the operation of auxiliary components, such as seawater pumps, as engine efficiency is practically not affected by the additional backpressure in most cases. Scrubbers are installed to reduce SO2 emissions and enable compliance with established international sulphur limits: the global 0.5% sulphur cap and the stricter 0.1% limit in SECAs. Their reduction efficiency varies depending on the sulphur content of the fuel and the sailing region, such as within SECA zones. Specifically, when a vessel operates on a SECA, SO2 scrubbing demand is increased in order to comply with the stricter limit [101].
In addition to SO2, scrubbers exhibit secondary effects on PM emissions. PM is a pollutant of critical concern due to its significant health and environmental impacts, although it is not yet directly regulated under most maritime frameworks [21]. While most available studies [135,136] suggest that scrubbers reduce PM emissions, the number of investigations remains limited, and the evidence cannot be generalized. In addition, the lack of official regulations presents no strong incentive to shipping companies to proceed with detailed measurement campaigns. Measurement campaigns conducted within the framework of the EU-funded Evaluation, control and Mitigation of the EnviRonmental impacts of shippinG Emissions (EMERGE) research project, reported by Grigoriadis et al. (2024) [34], revealed that PM concentrations were higher downstream of the scrubber compared to upstream. This suggests that further research is required to better understand downstream scrubber emission behavior.
SCR systems are used to reduce NOx emissions, achieving a reduction efficiency of up to approximately 85–89%, depending on the fuel type. However, SCR performance is highly dependent on engine load, SCR type and engine make. Optimal SCR operation occurs at engine loads of 60–80%, where exhaust gas temperatures are sufficiently high to activate the catalyst. At low engine loads (below 20%), exhaust temperatures drop and the SCR system becomes inactive to prevent fouling [101]. The energy penalty associated with SCR operation is estimated at around 1.5%, primarily due to increased backpressure in the case of HP SCR, while for LP SCR the penalty is minimal.
EGR is an alternative NOx control technology with an efficiency of 65–80%, depending on engine type, load and the recirculation rate. As discussed in Section 2.7, a major drawback of EGR is the associated increase in specific fuel consumption, which is estimated at 3.5% as a mean value and is higher for low and medium loads, which are the more common ones in an average commercial voyage. As a result of the higher fuel consumption, CO2 and SO2 emissions also increase; the latter increases in the uncommon cases where high sulphur fuel operating with EGR is supported. Moreover, EGR tends to significantly increase emissions of other pollutants, like CO by 90–160%, HC by 40% and PM by 100–200%, mainly due to lower oxygen availability and combustion temperature that delay the combustion process.
DOC can reduce CO, HC and PM emissions by approximately 30%, 69% and 50%, respectively [98]. DOCs are applicable to both low-sulphur and distillate fuels. However, due to a lack of sufficient data for operation with distillate fuels, the reported reduction rates are considered representative of both fuel types.
DPFs are designed to trap and reduce PM emissions, achieving an efficiency of around 91%. However, DPF operation is associated with a fuel penalty of approximately 1.5%. Residual fuels, which have high ash and sulphur contents, can cause operational issues in DPF systems. Consequently, DPFs are more suitable for cleaner fuels, such as distillates.
The combined use of emission control technologies can enable the simultaneous reduction in multiple pollutants. For instance, SCR systems and scrubbers are often used together to meet the MARPOL Annex VI requirements for NOx and SOx emissions, respectively [98]. Other studies have also examined the pollutant reduction performance of configurations combining DOCs with scrubbers [60,137], as well as systems integrating EGR with scrubbers [39,138]. Nevertheless, it should be emphasized that not all combinations of emission control technologies are technically feasible or operationally relevant in marine applications, as their compatibility depends on engine type, fuel characteristics, exhaust conditions and system integration constraints.

5. Conclusions

This study presents an update on the advancement of EFs for ships, incorporating new emission measurement data and the inclusion of alternative fuels, biofuels and emission control technologies. The findings offer valuable insights into the emission performance of ships, supporting the development of robust, up-to-date emission models and inventories. This work was carried out through a comprehensive review of the most recent published papers, reports and studies, and was complemented by dedicated field measurements conducted by authors. The collected data were consolidated into a unified database and subjected to statistical analysis to derive updated EFs for gaseous and particulate pollutants, as well as for energy consumption.
The principal innovations of this research include the substantial expansion of the EF dataset through the incorporation of new on-board and test-bed measurement data from two-stroke MEs and four-stroke AEs, the systematic integration of alternative fuels and biofuels and the explicit representation of emission control technologies. These advancements are complemented by the refinement of BEFs and load-dependent functional relationships, resulting in a more comprehensive, accurate and application-ready EF dataset for the maritime sector. A significant methodological advancement is the refinement of the SFOC load-dependent curve, which corrects the previous overestimation at low engine loads below 50%. This is particularly important under slow steaming conditions, as at 20% load the updated curve predicts approximately 20% lower fuel consumption compared to the earlier function for the same engine type. Additionally, SFOC BEFs are now distinguished in four categories, namely SSD, MSD and HSD for MEs and a dedicated category for AEs.
Another important innovation is the integration of alternative fuel options into the EF dataset. Load-dependent functions and BEFs are now available for LNG, methanol, ammonia and biofuels. LNG low-pressure engines demonstrate around 95% lower NOx emissions than conventional fuels, enabling compliance with IMO Tier III limits without additional aftertreatment, although methane slip remains a concern. Methanol achieves roughly 40% lower NOx emissions, but at the expense of higher CO and HC levels, suggesting the need for further combustion optimization or the application of DOC systems. Ammonia results in about 24% lower NOx emissions compared to conventional fuels, yet SCR is still required for Tier III compliance, due to the formation of N2O. Biofuels, while increasing NOx by about 10%, reduce PM emissions by over 70% compared to residuals, owing to their low sulphur content. The use of biofuels contributes to a significant reduction in well-to-wake (WtW) CO2 emissions, supporting compliance with carbon reduction regulations. These findings highlight the necessity for a balanced policy and technological approach in the maritime sector that simultaneously addresses decarbonization objectives and the control of harmful air pollutant emissions.
This work also advances knowledge on the performance of emission control technologies and their secondary effects. Scrubbers achieve SO2 reduction of up to 99% but impose an energy penalty of 2.15% on fuel consumption. Similarly, SCR systems reduce NOx emissions by 85–89%, accompanied by a 1.5% energy penalty. EGR reduces NOx by 65–80% but significantly increases CO, HC and PM emissions, in some cases by up to 200%. The energy penalty for EGR utilization is higher than SCR, estimated at 3.5%. These results highlight the need to evaluate emission control not only in terms of the targeted pollutants but also with respect to their broader environmental trade-offs.
Overall, this research delivers the most up-to-date and complete load-dependent emission factor dataset for the maritime sector. By combining field measurements, literature data and advanced statistical processing, the study provides a robust basis for emission inventories and air quality models. The developed EF dataset enables the detailed representation of all operational phases of a ship’s voyage, cruising, maneuvering, at berth and at anchor, through the explicit linkage of specific engine load points to each operating phase, thereby allowing for a more precise estimation of emissions throughout a vessel’s activity cycle. The updated EF database can be integrated into emission models, such as the STEAM model, and inventory guidebooks, like the IMO GHG studies and the EMEP/EEA air pollutant emission inventory guidebook. Although the results of this study focus exclusively on tailpipe emissions, the proposed EFs can be directly applied and adapted in WtW analyses, which are increasingly required to assess compliance with regulatory frameworks and long-term decarbonization targets. This work supports policymakers and industry stakeholders in the design of effective strategies for sustainable and climate-neutral maritime transport.
The principal limitation of this study is the scarcity of available air and particulate emission measurements for emerging alternative fuels, particularly methanol and ammonia. Future research should therefore prioritize the implementation of new emission measurement campaigns on modern vessels, particularly new buildings equipped with emerging alternative fuels and advanced powertrain configurations that integrate emission control technologies. Such measurements are essential for characterizing and understanding the combined effects of novel fuel–engine–aftertreatment systems on gaseous and particulate emissions, an area where data availability remains limited. Continued scientific effort in this direction will enable the continuous development of updated EFs that reflect the rapidly evolving landscape of marine fuels, propulsion concepts and control systems. High-quality, up-to-date EFs are critical for improving the accuracy of environmental impact assessments of shipping emissions, especially when comparing diverse propulsion architectures and novel low- and zero-carbon fuels. Advancing EF quality will also enhance evidence-based decision-making in policy and industry, thereby supporting the design of more effective strategies to reduce emissions and mitigate the environmental impacts of maritime transport.

Supplementary Materials

The following supporting information can be downloaded at https://www.mdpi.com/article/10.3390/atmos17020122/s1, Figure S1: Indicative engine load levels for main and auxiliary engines during different ship operational phases, based on typical operational practice; Table S1: Summary of emission factors for gaseous and particulate pollutants in g/kWh and specific fuel oil consumption (SFOC) in MJ/kWh for residual and distillate fuels; Table S2: Summary of emission factors for gaseous and particulate pollutants in g/kWh and specific fuel oil consumption (SFOC) in MJ/kWh for biofuels; Table S3: Summary of emission factors for gaseous and particulate pollutants in g/kWh and specific fuel oil consumption (SFOC) in MJ/kWh for LNG Low- and High-pressure, Methanol High-pressure and Ammonia High-pressure dual fuel engines; Table S4: Base Emission Factor 95% Confidence Interval, load-dependent function regression R2 per each engine and fuel type.

Author Contributions

Conceptualization, A.G. and L.N.; methodology, A.G. and T.C.; software, T.C.; validation, A.G., T.C., E.F., D.H. and L.N.; formal analysis, A.G.; investigation, A.G. and T.C.; resources, L.N.; data curation, A.G.; writing—original draft preparation, A.G., T.C. and E.F.; writing—review and editing, D.H. and L.N.; visualization, A.G. and T.C.; supervision, L.N.; project administration, L.N.; funding acquisition, L.N. All authors have read and agreed to the published version of the manuscript.

Funding

This research has been funded by the European Union—Next Generation EU—National Recovery and Resilience Plan (NRRP)—Greece 2.0. Project “NAVGREEN—Green Shipping of Zero Carbon Footprint” (Project Code: TAEDR-0534767).

Institutional Review Board Statement

Not applicable.

Informed Consent Statement

Not applicable.

Data Availability Statement

The data presented in this study are available upon request from the corresponding author due to privacy reasons.

Acknowledgments

New emission data were obtained through measurements conducted by the team of D. Hountalas and T. Chountalas of the Laboratory of Internal Combustion Engines in the National Technical University of Athens (NTUA).

Conflicts of Interest

The authors declare no conflicts of interest.

Abbreviations

The following abbreviations are used in this manuscript:
AEAuxiliary engine
BEFBase emission factor
CBVCylinder bypass valve
CCSCarbon Capture and Storage
COCarbon monoxide
CO2Carbon dioxide
DFDual fuel
DOCDiesel oxidation catalyst
DPFDiesel particulate filter
ECAEmission control area
EFEmission factor
EGBExhaust gas bypass
EGCSExhaust gas cleaning system
EGRExhaust gas recirculation
EMEP/EEAEuropean Monitoring and Evaluation Programme/European Environment Agency
EMERGEEvaluation, control and Mitigation of the EnviRonmental impacts of shippinG Emissions
ETSEmission trading system
EUEuropean Union
FAMEFatty Acid Methyl Ester
FCFuel cell
FSCFuel sulphur content
GHGGreenhouse gas
HCHydrocarbon
HFOHeavy fuel oil
HPHigh pressure
HPGIHigh-pressure gas injection
HSDHigh-speed diesel
ICEInternal combustion engine
IMOInternational Maritime Organization
LHVLower heating value
LNGLiquified natural gas
LPLow pressure
LPGILow-pressure gas injection
MEMain engine
MEPCMarine Environment Protection Committee
MGOMarine gas oil
MSDMedium-speed diesel
NECANitrogen emission control area
NGNatural gas
NOxNitrogen oxides
NTCNOx technical code
OPSOnshore power supply
PMParticulate matter
PNParticulate number
SCRSelective catalytic reduction
SDGSustainable Development Goal
SECASulphur emission control area
SFOCSpecific fuel oil consumption
SNGSynthetic natural gas
SO2Sulphur dioxide
SSDSlow-speed diesel
TDCTop dead center
USDUnited States dollar
VLSFOVery low sulphur fuel oil
WtWWell-to-Wake

References

  1. United Nations Conference on Trade and Development. Review of Maritime Transport 2022; United Nations: New York, NY, USA, 2023. [Google Scholar]
  2. Zis, T.P.V.; Psaraftis, H.N.; Tillig, F.; Ringsberg, J.W. Decarbonizing Maritime Transport: A Ro-Pax Case Study. Res. Transp. Bus. Manag. 2020, 37, 100565. [Google Scholar] [CrossRef]
  3. Salo, K.; Zetterdahl, M.; Johnson, H.; Svensson, E.; Magnusson, M.; Gabrielii, C.; Brynolf, S. Emissions to the Air. In Shipping and the Environment: Improving Environmental Performance in Marine Transportation; Andersson, K., Brynolf, S., Lindgren, J.F., Wilewska-Bien, M., Eds.; Springer: Berlin/Heidelberg, Germany, 2016; pp. 169–227. [Google Scholar]
  4. European Environment Agency. European Maritime Safety Agency European Maritime Transport Environmental Report 2025; European Environment Agency: Copenhagen, Denmark, 2025. [Google Scholar] [CrossRef]
  5. IMO. Fourth IMO GHG Study 2020 Full Report; International Maritime Organization: London, UK, 2020. [Google Scholar]
  6. Aakko-Saksa, P.T.; Lehtoranta, K.; Kuittinen, N.; Järvinen, A.; Jalkanen, J.-P.; Johnson, K.; Jung, H.; Ntziachristos, L.; Gagne, S.; Karjalainen, P.; et al. Reduction in Greenhouse Gas and Other Emissions from Ship Engines: Current Trends and Future Options. Prog. Energy Combust. Sci. 2023, 94, 101055. [Google Scholar] [CrossRef]
  7. Matthias, V.; Bewersdorff, I.; Aulinger, A.; Quante, M. The Contribution of Ship Emissions to Air Pollution in the North Sea Regions. Environ. Pollut. 2010, 158, 2241–2250. [Google Scholar] [CrossRef] [PubMed]
  8. Yi, W.; Wang, X.; He, T.; Liu, H.; Luo, Z.; Lv, Z.; He, K. The High-Resolution Global Shipping Emission Inventory by the Shipping Emission Inventory Model (SEIM). Earth Syst. Sci. Data 2025, 17, 277–292. [Google Scholar] [CrossRef]
  9. Zhang, Y.; Eastham, S.D.; Lau, A.K.H.; Fung, J.C.H.; Selin, N.E. Global Air Quality and Health Impacts of Domestic and International Shipping. Environ. Res. Lett. 2021, 16, 084055. [Google Scholar] [CrossRef]
  10. Vallabani, N.V.S.; Gruzieva, O.; Elihn, K.; Juárez-Facio, A.T.; Steimer, S.S.; Kuhn, J.; Silvergren, S.; Portugal, J.; Piña, B.; Olofsson, U.; et al. Toxicity and Health Effects of Ultrafine Particles: Towards an Understanding of the Relative Impacts of Different Transport Modes. Environ. Res. 2023, 231, 116186. [Google Scholar] [CrossRef]
  11. Vouitsis, I.; Portugal, J.; Kontses, A.; Karlsson, H.L.; Faria, M.; Elihn, K.; Juárez-Facio, A.T.; Amato, F.; Piña, B.; Samaras, Z. Transport-Related Airborne Nanoparticles: Sources, Different Aerosol Modes, and Their Toxicity. Atmos. Environ. 2023, 301, 119698. [Google Scholar] [CrossRef]
  12. World Health Organization. WHO Global Air Quality Guidelines; World Health Organization: Geneva, Switzerland, 2021. [Google Scholar]
  13. IMO. IMO Strategy on Reduction of ghg Emissions from Ships; MEPC.377(80); International Maritime Organization: London, UK, 2023. [Google Scholar]
  14. Gundersen, O.; Longva, S.T.; Sekkesaeter, Ø.; Gill Hallesen, A. Fueleu Maritime—Requirements, Compliance Strategies, and Commercial Impacts. 2024. Available online: https://globalmaritimehub.com/report-presentation/fueleu-maritime-requirements-compliance-strategies-and-commercial-impacts (accessed on 8 January 2026).
  15. Bettles, J.; Perez, A.; Björk, S.; Barcarolo, D.; Hintze, M. Assessing Impacts of EU and US Policies on Accelerated Deployment of Alternative Maritime Fuels Transatlantic Testing Ground. 2024. Available online: https://www.zerocarbonshipping.com/publications/assessing-impacts-of-eu-and-us-policies-on-accelerated-deployment-of-alternative-maritime-fuels (accessed on 20 November 2025).
  16. Xu, L.; Zhang, M.; Xiao, G. Opportunities and Challenges of EU ETS to the Global Marine Industry. Front. Mar. Sci. 2024, 11, 1382498. [Google Scholar] [CrossRef]
  17. European Commission. Inclusion of Maritime Transport Activities in the EU Emissions Trading System and for the Monitoring, Reporting and Verification of Emissions of Additional Greenhouse Gases and Emissions from Additional Ship Types; REGULATION (EU) 2023/957; European Commission: Brussels, Belgium, 2023. [Google Scholar]
  18. IMO. Effective Date of Implementation of the Fuel Oil Standard in Regulatio 14.1.3 of MARPOL VI; International Maritime Organization: London, UK, 2016. [Google Scholar]
  19. IMO. Report of the Marine Environment Protection Committee on Its Seventy Ninth Session; MEPC 79/15; International Maritime Organization: London, UK, 2023. [Google Scholar]
  20. International Maritime Organization. NOx Technical Code on Control of Emission of Nitrogen Oxides from Marine Diesel Engines; International Maritime Organization: London, UK, 2008. [Google Scholar]
  21. Di Natale, F.; Carotenuto, C. Particulate Matter in Marine Diesel Engines Exhausts: Emissions and Control Strategies. Transp. Res. Part D Transp. Environ. 2015, 40, 166–191. [Google Scholar] [CrossRef]
  22. Bouman, E.A.; Lindstad, E.; Rialland, A.I.; Strømman, A.H. State-of-the-Art Technologies, Measures, and Potential for Reducing GHG Emissions from Shipping—A Review. Transp. Res. Part D Transp. Environ. 2017, 52, 408–421. [Google Scholar] [CrossRef]
  23. ABS. LNG as Marine Fuel; ABS: Spring, TX, USA, 2022. [Google Scholar]
  24. Sea-LNG. LNG—A Fuel in Transition. A View from the Bridge; Sea-LNG: Oxford, UK, 2022. [Google Scholar]
  25. International Maritime Organization. Methanol as Marine Fuel: Environmental Benefits, Technology Readiness, and Economic Feasibility; Micropress Printers: Suffolk, UK, 2016. [Google Scholar]
  26. Svanberg, M.; Ellis, J.; Lundgren, J.; Landälv, I. Renewable Methanol as a Fuel for the Shipping Industry. Renew. Sustain. Energy Rev. 2018, 94, 1217–1228. [Google Scholar] [CrossRef]
  27. Methanol Institute. Marine Methanol: Future-Proof Shipping Fuel; Methanol Institute: Alexandria, VA, USA, 2023. [Google Scholar]
  28. Zincir, B. A Short Review of Ammonia as an Alternative Marine Fuel for Decarbonised Maritime Transportation. In Proceedings of the ICEESEN2020, Kayseri, Turkey, 19–21 November 2020. [Google Scholar]
  29. Al-Aboosi, F.Y.; El-Halwagi, M.M.; Moore, M.; Nielsen, R.B. Renewable Ammonia as an Alternative Fuel for the Shipping Industry. Curr. Opin. Chem. Eng. 2021, 31, 100670. [Google Scholar] [CrossRef]
  30. Cames, M.; Wissner, N.; Sutter, J. Ammonia as a Marine Fuel: Risks and Perspectives; Oko-Institut eV: Berlin, Germany, 2021. [Google Scholar]
  31. McKinlay, C.J.; Turnock, S.R.; Hudson, D.A. Route to Zero Emission Shipping: Hydrogen, Ammonia or Methanol? Int. J. Hydrogen Energy 2021, 46, 28282–28297. [Google Scholar] [CrossRef]
  32. Chountalas, T.D.; Founti, M.; Hountalas, D.T. Review of Biofuel Effect on Emissions of Various Types of Marine Propulsion and Auxiliary Engines. Energies 2023, 16, 4647. [Google Scholar] [CrossRef]
  33. Yang, J.; Tang, T.; Jiang, Y.; Karavalakis, G.; Durbin, T.D.; Wayne Miller, J.; Cocker, D.R.; Johnson, K.C. Controlling Emissions from an Ocean-Going Container Vessel with a Wet Scrubber System. Fuel 2021, 304, 121323. [Google Scholar] [CrossRef]
  34. Grigoriadis, A.; Kousias, N.; Raptopoulos-Chatzistefanou, A.; Salberg, H.; Moldanová, J.; Hermansson, A.-L.; Cha, Y.; Kontses, A.; Toumasatos, Z.; Mamarikas, S.; et al. Particulate and Gaseous Emissions from a Large Two-Stroke Slow-Speed Marine Engine Equipped with Open-Loop Scrubber under Real Sailing Conditions. Atmosphere 2024, 15, 845. [Google Scholar] [CrossRef]
  35. Stathatou, P.M.; Petrunia, I.; Barenthin, T.; Gotsis, G.; Jeffrey, P.; Fee, C.; Bergeron, S.; Tsezos, M.; Triantafyllou, M.; Gershenfeld, N. Marine Scrubbers vs Low-Sulfur Fuels: A Comprehensive Well-To-Wake Life Cycle Assessment Supported by Measurements Aboard an Ocean-Going Vessel. Environ. Sci. Technol. 2025, 59, 7066–7080. [Google Scholar] [CrossRef]
  36. Nuszkowski, J.; Clark, N.N.; Spencer, T.K.; Carder, D.K.; Gautam, M.; Balon, T.H.; Moynihan, P.J. Atmospheric Emissions from a Passenger Ferry with Selective Catalytic Reduction. J. Air Waste Manag. Assoc. 2009, 59, 18–30. [Google Scholar] [CrossRef][Green Version]
  37. Zhang, G.; Yan, H.; Li, T.; Zhu, Y.; Zhou, S.; Feng, Y.; Zhou, W. Relation Analysis on Emission Control and Economic Cost of SCR System for Marine Diesels. Sci. Total Environ. 2021, 788, 147856. [Google Scholar] [CrossRef]
  38. Raptotasios, S.I.; Sakellaridis, N.F.; Papagiannakis, R.G.; Hountalas, D.T. Application of a Multi-Zone Combustion Model to Investigate the NOx Reduction Potential of Two-Stroke Marine Diesel Engines Using EGR. Appl. Energy 2015, 157, 814–823. [Google Scholar] [CrossRef]
  39. Ushakov, S.; Stenersen, D.; Einang, P.M.; Ask, T.Ø. Meeting Future Emission Regulation at Sea by Combining Low-Pressure EGR and Seawater Scrubbing. J. Mar. Sci. Technol. 2020, 25, 482–497. [Google Scholar] [CrossRef]
  40. Lee, S.; Yoo, S.; Park, H.; Ahn, J.; Chang, D. Novel Methodology for EEDI Calculation Considering Onboard Carbon Capture and Storage System. Int. J. Greenh. Gas Control 2021, 105, 103241. [Google Scholar] [CrossRef]
  41. Long, N.V.D.; Lee, D.Y.; Kwag, C.; Lee, Y.M.; Lee, S.W.; Hessel, V.; Lee, M. Improvement of Marine Carbon Capture Onboard Diesel Fueled Ships. Chem. Eng. Process.-Process Intensif. 2021, 168, 108535. [Google Scholar] [CrossRef]
  42. Ros, J.A.; Doedée, V.; van den Akker, J.T.; Vredeveldt, A.W.; Linders, M.J.; Goetheer, E.L.; Monteiro, J.G.M.-S. Update on Post-Combustion Carbon Capture and Storage on LNG Fuelled Vessels. In Proceedings of the 15th International Conference on Greenhouse Gas Control Technologies, GHGT-15, Abu Dhabi, United Arab Emirates, 15–18 March 2021. [Google Scholar]
  43. Mc-Kinney Møller Center for Zero Carbon Shipping. A Case Study of the Largest Shipping Segments, Main Carbon-Based Fuels, and Full and Partial Application as Part of a Newbuild or Retrofit. In The Role of Onboard Carbon Capture in Maritime Decarbonization; Mc-Kinney Møller Center for Zero Carbon Shipping: København, Denmark, 2022. [Google Scholar]
  44. Yau, P.S.; Lee, S.C.; Corbett, J.J.; Wang, C.; Cheng, Y.; Ho, K.F. Estimation of Exhaust Emission from Ocean-Going Vessels in Hong Kong. Sci. Total Environ. 2012, 431, 299–306. [Google Scholar] [CrossRef]
  45. Grigoriadis, A.; Mamarikas, S.; Ioannidis, I.; Majamäki, E.; Jalkanen, J.P.; Ntziachristos, L. Development of Exhaust Emission Factors for Vessels: A Review and Meta-Analysis of Available Data. Atmos. Environ. X 2021, 12, 100142. [Google Scholar] [CrossRef]
  46. GloMEEP Project Coordination Unit. Ship Emissions Toolkit. Guide No.1: Rapid Assessment of Ship Emissions in the National Context; GloMEEP Project Coordination Unit, International Maritime Organization: London, UK, 2018. [Google Scholar]
  47. De Lauretis, R.; Ntziachristos, L.; Trozzi, C.; Fontelle, J.-P.; Fridell, E.; Grigoriadis, A.; Hill, N.; Kilde, N.; Lavender, K.; Mamarikas, S.; et al. EMEP/EEA Air Pollutant Emission Inventory Guidebook 2023; European Environment Agency: Copenhagen, Denmark, 2023. [Google Scholar]
  48. Jalkanen, J.-P.; Johansson, L.; Kukkonen, J.; Brink, A.; Kalli, J.; Stipa, T. Extension of an Assessment Model of Ship Traffic Exhaust for Particulate Matter and Carbon Monoxide. Artic. Atmos. Chem. Phys. 2011, 12, 2641–2659. [Google Scholar] [CrossRef]
  49. Jalkanen, J.P.; Johansson, L.; Kukkonen, J. A Comprehensive Inventory of Ship Traffic Exhaust Emissions in the European Sea Areas in 2011. Atmos. Chem. Phys. 2016, 16, 71–84. [Google Scholar] [CrossRef]
  50. Agrawal, H.; Welch, W.A.; Miller, J.W.; Cocker, D.R. Emission Measurements from a Crude Oil Tanker at Sea. Environ. Sci. Technol. 2008, 42, 7098–7103. [Google Scholar] [CrossRef]
  51. Jahangiri, S.; Nikolova, N.; Tenekedjiev, K. Emission Inventories for Shipping Operations: Comparison with on-Board Measurements; International Association of Maritime Universities: Tokyo, Japan, 2018. [Google Scholar]
  52. Huang, C.; Hu, Q.; Wang, H.; Qiao, L.; Jing, S.; Wang, H.; Zhou, M.; Zhu, S.; Ma, Y.; Lou, S.; et al. Emission Factors of Particulate and Gaseous Compounds from a Large Cargo Vessel Operated under Real-World Conditions. Environ. Pollut. 2018, 242, 667–674. [Google Scholar] [CrossRef]
  53. Kuittinen, N.; Koponen, P.; Vesala, H.; Lehtoranta, K. Methane Slip and Other Emissions from Newbuild LNG Engine under Real-World Operation of a State-of-the Art Cruise Ship. Atmos. Environ. X 2024, 23, 100285. [Google Scholar] [CrossRef]
  54. Bai, C.; Li, Y.; Liu, B.; Zhang, Z.; Wu, P. Gaseous Emissions from a Seagoing Ship under Different Operating Conditions in the Coastal Region of China. Atmosphere 2020, 11, 305. [Google Scholar] [CrossRef]
  55. Ntziachristos, L.; Saukko, E.; Lehtoranta, K.; Rönkkö, T.; Timonen, H.; Simonen, P.; Karjalainen, P.; Keskinen, J. Particle Emissions Characterization from a Medium-Speed Marine Diesel Engine with Two Fuels at Different Sampling Conditions. Fuel 2016, 186, 456–465. [Google Scholar] [CrossRef]
  56. Santos, L.F.E.d.; Salo, K.; Thomson, E.S. Quantification and Physical Analysis of Nanoparticle Emissions from a Marine Engine Using Different Fuels and a Laboratory Wet Scrubber. Environ. Sci. Process. Impacts 2022, 24, 1769–1781. [Google Scholar] [CrossRef] [PubMed]
  57. Cappa, C.D.; Williams, E.J.; Lack, D.A.; Buffaloe, G.M.; Coffman, D.; Hayden, K.L.; Herndon, S.C.; Lerner, B.M.; Li, S.M.; Massoli, P.; et al. A Case Study into the Measurement of Ship Emissions from Plume Intercepts of the NOAA Ship Miller Freeman. Atmos. Chem. Phys. 2014, 14, 1337–1352. [Google Scholar] [CrossRef]
  58. Winnes, H.; Moldanová, J.; Anderson, M.; Fridell, E. On-Board Measurements of Particle Emissions from Marine Engines Using Fuels with Different Sulphur Content. Proc. Inst. Mech. Eng. Part M J. Eng. Marit. Environ. 2016, 230, 45–54. [Google Scholar] [CrossRef]
  59. Chu-Van, T.; Ristovski, Z.; Pourkhesalian, A.M.; Rainey, T.; Garaniya, V.; Abbassi, R.; Jahangiri, S.; Enshaei, H.; Kam, U.S.; Kimball, R.; et al. On-Board Measurements of Particle and Gaseous Emissions from a Large Cargo Vessel at Different Operating Conditions. Environ. Pollut. 2018, 237, 832–841. [Google Scholar] [CrossRef]
  60. Lehtoranta, K.; Aakko-Saksa, P.; Murtonen, T.; Vesala, H.; Ntziachristos, L.; Rönkkö, T.; Karjalainen, P.; Kuittinen, N.; Timonen, H. Particulate Mass and Nonvolatile Particle Number Emissions from Marine Engines Using Low-Sulfur Fuels, Natural Gas, or Scrubbers. Environ. Sci. Technol. 2019, 53, 3315–3322. [Google Scholar] [CrossRef]
  61. Lehtoranta, K.; Vesala, H.; Koponen, P.; Korhonen, S. Selective Catalytic Reduction Operation with Heavy Fuel Oil: NOx, NH3, and Particle Emissions. Environ. Sci. Technol. 2015, 49, 4735–4741. [Google Scholar] [CrossRef]
  62. Murphy, S.; Agrawal, H.; Sorooshian, A.; Padró, L.T.; Gates, H.; Hersey, S.; Welch, W.A.; Jung, H.; Miller, J.W.; Cocker, D.R.; et al. Comprehensive Simultaneous Shipboard and Airborne Characterization of Exhaust from a Modern Container Ship at Sea. Environ. Sci. Technol. 2009, 43, 4626–4640. [Google Scholar] [CrossRef]
  63. Pirjola, L.; Pajunoja, A.; Walden, J.; Jalkanen, J.P.; Rönkkö, T.; Kousa, A.; Koskentalo, T. Mobile Measurements of Ship Emissions in Two Harbour Areas in Finland. Atmos. Meas. Tech. 2014, 7, 149–161. [Google Scholar] [CrossRef]
  64. Ekmekçioğlu, A.; Kuzu, S.L.; Ünlügençoğlu, K.; Çelebi, U.B. Assessment of Shipping Emission Factors through Monitoring and Modelling Studies. Sci. Total. Environ. 2020, 743, 140742. [Google Scholar] [CrossRef] [PubMed]
  65. Anderson, M.; Salo, K.; Fridell, E. Particle- and Gaseous Emissions from an LNG Powered Ship. Environ. Sci. Technol. 2015, 49, 12568–12575. [Google Scholar] [CrossRef] [PubMed]
  66. MAN. ME-GI Dual Fuel MAN B&W Engines: A Technical, Operational and Cost-Effective Solution for Ships Fuelled by Gas; MAN: Augsburg, Germany, 2016. [Google Scholar]
  67. Lehtoranta, K.; Kuittinen, N.; Vesala, H.; Koponen, P. Methane Emissions from a State-of-the-Art LNG-Powered Vessel. Atmosphere 2023, 14, 825. [Google Scholar] [CrossRef]
  68. Mallouppas, G.; Yfantis, E.A. Decarbonization in Shipping Industry: A Review of Research, Technology Development, and Innovation Proposals. J. Mar. Sci. Eng. 2021, 9, 415. [Google Scholar] [CrossRef]
  69. Brynolf, S.; Fridell, E.; Andersson, K. Environmental Assessment of Marine Fuels: Liquefied Natural Gas, Liquefied Biogas, Methanol and Bio-Methanol. J. Clean. Prod. 2014, 74, 86–95. [Google Scholar] [CrossRef]
  70. Fridell, E.; Salberg, H.; Salo, K. Measurements of Emissions to Air from a Marine Engine Fueled by Methanol. J. Mar. Sci. Appl. 2021, 20, 138–143. [Google Scholar] [CrossRef]
  71. Andersson, K.; Márquez, C. Methanol as a Marine Fuel; Naturschutzbund Deutschland: Stuttgart, Germany, 2016. [Google Scholar]
  72. Schwarzkopf, D.A.; Petrik, R.; Hahn, J.; Ntziachristos, L.; Matthias, V.; Quante, M. Future Ship Emission Scenarios with a Focus on Ammonia Fuel. Atmosphere 2023, 14, 879. [Google Scholar] [CrossRef]
  73. Westlye, F.R.; Ivarsson, A.; Schramm, J. Experimental Investigation of Nitrogen Based Emissions from an Ammonia Fueled SI-Engine. Fuel 2013, 111, 239–247. [Google Scholar] [CrossRef]
  74. Boyland, J.; Annisa, A.; Kirketerp-Møller, T.; Cremer, T. From Pilots to Practice: Methanol and Ammonia as Shipping Fuels; Global Maritime Forum: Copenhagen, Denmark, 2025. [Google Scholar]
  75. Voniati, G.; Dimaratos, A.; Koltsakis, G.; Ntziachristos, L. Ammonia as a Marine Fuel towards Decarbonization: Emission Control Challenges. Sustainability 2023, 15, 15565. [Google Scholar] [CrossRef]
  76. Hansson, J.; Fridell, E.; Brynolf, S. On the Potential of Ammonia as Fuel for Shipping A Synthesis of Knowledge; Swedish National Road and Transport Research Institute: Linköping, Sweden, 2020. [Google Scholar]
  77. CIMAC. Fuel Quality Guide-Ignition and Combustion; CIMAC: Frankfurt, Germany, 2011. [Google Scholar]
  78. Graboski, M.S.; Mccormick, R.L.; Alleman, T.L.; Herring, A.M. The Effect of Biodiesel Composition on Engine Emissions from a DDC Series 60 Diesel Engine: Final Report; Report 2 in a Series of 6; National Renewable Energy Laboratory: Golden, CO, USA, 2003.
  79. Pandey, R.K.; Rehman, A.; Sarviya, R.M. Impact of Alternative Fuel Properties on Fuel Spray Behavior and Atomization. Renew. Sustain. Energy Rev. 2012, 16, 1762–1778. [Google Scholar] [CrossRef]
  80. Kalligeros, S.; Zannikos, F.; Stournas, S.; Lois, E.; Anastopoulos, G.; Teas, C.; Sakellaropoulos, F. An Investigation of Using Biodiesel/Marine Diesel Blends on the Performance of a Stationary Diesel Engine. Biomass-Bioenergy 2003, 24, 141–149. [Google Scholar] [CrossRef]
  81. Chountalas, T.; Founti, M. Effect of Low-Sulfur Fuel on Auxiliary Engine Combustion and Performance. In Proceedings of the SNAME 7th International Symposium on Ship Operations, Management and Economics, SOME 2021, Virtual, 6–7 April 2021. [Google Scholar]
  82. Mueller, C.J.; Boehman, A.L.; Martin, G.C. An Experimental Investigation of the Origin of Increased NO Emissions When Fueling a Heavy-Duty Compression-Ignition Engine with Soy Biodiesel. SAE Int. J. Fuels Lubr. 2009, 2, 789–816. [Google Scholar] [CrossRef]
  83. Lin, C.Y. Effects of Biodiesel Blend on Marine Fuel Characteristics for Marine Vessels. Energies 2013, 6, 4945–4955. [Google Scholar] [CrossRef]
  84. Sun, J.; Caton, J.A.; Jacobs, T.J. Oxides of Nitrogen Emissions from Biodiesel-Fuelled Diesel Engines. Prog. Energy Combust. Sci. 2010, 36, 677–695. [Google Scholar] [CrossRef]
  85. Lloyd’s Register. NOx from Marine Diesel Engines Using Biofuels NOx from Marine Diesel Engines Using Biofuels; Lloyd’s Register: London, UK, 2022. [Google Scholar]
  86. Varatharajan, K.; Cheralathan, M. Influence of Fuel Properties and Composition on NOx Emissions from Biodiesel Powered Diesel Engines: A Review. Renew. Sustain. Energy Rev. 2012, 16, 3702–3710. [Google Scholar] [CrossRef]
  87. Varuvel, E.G.; Mrad, N.; Tazerout, M.; Aloui, F. Experimental Analysis of Biofuel as an Alternative Fuel for Diesel Engines. Appl. Energy 2012, 94, 224–231. [Google Scholar] [CrossRef]
  88. Chountalas, T.D.; Founti, M.; Tsalavoutas, I. Evaluation of Biofuel Effect on Performance & Emissions of a 2-Stroke Marine Diesel Engine Using on-Board Measurements. Energy 2023, 278, 127845. [Google Scholar] [CrossRef]
  89. IMO. Interim Guidance on the Use of Biofuels under Regulation 26, 27 and 28 of MARPOL ANNEX VI (DCS AND CII); MEPC.1/Circ.905; IMO: London, UK, 2023. [Google Scholar]
  90. Naik, S.N.; Goud, V.V.; Rout, P.K.; Dalai, A.K. Production of First and Second Generation Biofuels: A Comprehensive Review. Renew. Sustain. Energy Rev. 2010, 14, 578–597. [Google Scholar] [CrossRef]
  91. Stathatou, P.M.; Bergeron, S.; Fee, C.; Jeffrey, P.; Triantafyllou, M.; Gershenfeld, N. Towards Decarbonization of Shipping: Direct Emissions & Life Cycle Impacts from a Biofuel Trial Aboard an Ocean-Going Dry Bulk Vessel. Sustain. Energy Fuels 2022, 6, 1687–1697. [Google Scholar] [CrossRef]
  92. MAN Energy Solutions. SNG-Synthetic Natural Gas. Available online: https://www.man-es.com/discover/decarbonization-glossary---man-energy-solutions/synthetic-natural-gas (accessed on 27 July 2024).
  93. Faisal, S.; Zaky, A.; Wang, Q.; Huang, J.; Abomohra, A. Integrated Marine Biogas: A Promising Approach towards Sustainability. Fermentation 2022, 8, 520. [Google Scholar] [CrossRef]
  94. MAN Energy Solutions. SNG Biogas I Future Fuels. Available online: https://www.man-es.com/marine/strategic-expertise/future-fuels/sng-biogas (accessed on 27 July 2024).
  95. MAN Energy Solutions. A New Milestone Towards Sustainable Shipping. Available online: https://www.man-es.com/discover/a-new-milestone-towards-sustainable-shipping (accessed on 27 July 2024).
  96. Weng, J.; Han, T.; Shi, K.; Li, G. Impact Analysis of ECA Policies on Ship Trajectories and Emissions. Mar. Pollut. Bull. 2022, 179, 113687. [Google Scholar] [CrossRef]
  97. Zannis, T.C.; Katsanis, J.S.; Christopoulos, G.P.; Yfantis, E.A.; Papagiannakis, R.G.; Pariotis, E.G.; Rakopoulos, D.C.; Rakopoulos, C.D.; Vallis, A.G. Marine Exhaust Gas Treatment Systems for Compliance with the IMO 2020 Global Sulfur Cap and Tier III NOx Limits: A Review. Energies 2022, 15, 3638. [Google Scholar] [CrossRef]
  98. Lehtoranta, K.; Aakko-Saksa, P.; Murtonen, T.; Vesala, H.; Kuittinen, N.; Rönkkö, T.; Ntziachristos, L.; Karjalainen, P.; Timonen, H.; Teinilä, K. Particle and Gaseous Emissions from Marine Engines Utilizing Various Fuels and Aftertreatment Systems. In Proceedings of the 29th CIMAC World Congress on Combustion Engine, Vancouver, BC, Canada, 10–14 June 2019; p. 399. [Google Scholar]
  99. Tran, T.A. Research of the Scrubber Systems to Clean Marine Diesel Engine Exhaust Gases on Ships. J. Mar. Sci. Res. Dev. 2017, 7, 243. [Google Scholar] [CrossRef]
  100. Picone, M.; Russo, M.; Distefano, G.G.; Baccichet, M.; Marchetto, D.; Volpi Ghirardini, A.; Lunde Hermansson, A.; Petrovic, M.; Gros, M.; Garcia, E.; et al. Impacts of Exhaust Gas Cleaning Systems (EGCS) Discharge Waters on Planktonic Biological Indicators. Mar. Pollut. Bull. 2023, 190, 114846. [Google Scholar] [CrossRef]
  101. Grigoriadis, A.; Mamarikas, S.; Ntziachristos, L. Quantitative Impact of Decarbonization Options on Air Pollutants from Different Ship Types. Transp. Res. Part D Transp. Environ. 2024, 133, 104316. [Google Scholar] [CrossRef]
  102. MAN Energy Solutions. Emission Project Guide; MAN Energy Solutions: Copenhagen, Denmark, 2019. [Google Scholar]
  103. Zhu, Y.; Zhang, R.; Zhou, S.; Huang, C.; Feng, Y.; Shreka, M.; Zhang, C. Performance Optimization of High-Pressure SCR System in a Marine Diesel Engine. Part I: Flow optimization and analysis. Top. Catal. 2019, 62, 27–39. [Google Scholar] [CrossRef]
  104. Zhang, Y.; Xia, C.; Liu, D.; Zhu, Y.; Feng, Y. Experimental Investigation of the High-Pressure SCR Reactor Impact on a Marine Two-Stroke Diesel Engine. Fuel 2023, 335, 127064. [Google Scholar] [CrossRef]
  105. WinGD. Selective Catalytic Reduction FAQ; WinGD: Winterthur, Switzerland, 2018. [Google Scholar]
  106. Chountalas, T. Investigation of Novel Emission Reduction Technologies and Use of Liquid or Gaseous Fuels for Curbing Marine Engines Environmental Impact. Ph.D. Thesis, National Technical University of Athens, Athens, Greece, 2023. [Google Scholar]
  107. Zheng, M.; Reader, G.T.; Hawley, J.G. Diesel Engine Exhaust Gas Recirculation-A Review on Advanced and Novel Concepts. Energy Convers. Manag. 2004, 45, 883–900. [Google Scholar] [CrossRef]
  108. Mollenhauer, K.; Tschoeke, H. Handbook of Diesel Engines; Springer Nature: Berlin/Heidelberg, Germany, 2010. [Google Scholar]
  109. MAN Energy Solutions. The Latest Dual-Fuel MAN B&W Two-Stroke Engine; MAN Energy Solutions: Copenhagen, Denmark, 2022. [Google Scholar]
  110. MAN Energy Solutions. Emission Project Guide MAN B&W Two-Stroke Marine Engines; MAN Diesel & Turbo: Augsburg, Germany, 2022. [Google Scholar]
  111. Kim, S.W.; Brorsen, B.W. Forecasting Urea Prices. Appl. Econ. 2017, 49, 4970–4981. [Google Scholar] [CrossRef]
  112. IACCSEA. Marine SCR-Cost Benefit Analysis; IACCSEA: London, UK, 2013. [Google Scholar]
  113. Azzara, A.; Rutherford, D.; Wang, H. Feasibility of IMO Annex VI Tier III Implementation Using Selective Catalytic Reduction; Springer: Berlin/Heidelberg, Germany, 2014. [Google Scholar]
  114. DNV GL. DNV GL NOX TIER III Update-Choices and Challenges for on-Time Compliance; DNV GL: Høvik, Norway, 2023. [Google Scholar]
  115. Yue, G.; Qiu, T.; Lei, Y. Experimental Demonstration of NOx Reduction and Ammonia Slip for Diesel Engine SCR System. Environ. Sci. Pollut. Res. 2022, 29, 1118–1133. [Google Scholar] [CrossRef]
  116. Guo, M.; Fu, Z.; Ma, D.; Ji, N.; Song, C.; Liu, Q. A Short Review of Treatment Methods of Marine Diesel Engine Exhaust Gases. In Proceedings of the Procedia Engineering; Elsevier Ltd.: Amsterdam, The Netherlands, 2015; Volume 121, pp. 938–943. [Google Scholar]
  117. Grigoriadis, A.; Mamarikas, S.; Ntziachristos, L.; Moldanová, J.; Hermansson, A.L. EMERGE Deliverable D3.2-Improved Emission Factors and Emission Profiles for Use in the STEAM Model. 2022. Available online: https://emerge-h2020.eu/publications/ (accessed on 20 November 2025).
  118. Kontses, A.; Dimaratos, A.; Keramidas, C.; Williams, R.; Hamje, H.; Ntziachristos, L.; Samaras, Z. Effects of Fuel Properties on Particulate Emissions of Diesel Cars Equipped with Diesel Particulate Filters. Fuel 2019, 255, 115879. [Google Scholar] [CrossRef]
  119. Valverde, V.; Giechaskiel, B. Assessment of Gaseous and Particulate Emissions of a Euro 6d-Temp Diesel Vehicle Driven >1300 Km Including Six Diesel Particulate Filter Regenerations. Atmosphere 2020, 11, 645. [Google Scholar] [CrossRef]
  120. Wang, H.; Yao, A.; Yao, C.; Wang, B.; Wu, T.; Chen, C. Investigation to Meet China II Emission Legislation for Marine Diesel Engine with Diesel Methanol Compound Combustion Technology. J. Environ. Sci. 2020, 96, 99–108. [Google Scholar] [CrossRef] [PubMed]
  121. Hountalas, D.T.; Kouremenos, A.D. Development and Application of a Fully Automatic Troubleshooting Method for Large Marine Diesel Engines. Appl. Therm. Eng. 1999, 19, 299–324. [Google Scholar] [CrossRef]
  122. Comer, B.; Olmer, N.; Mao, X.; Roy, B.; Rutherford, D. Black Carbon Emissions and Fuel Use in Global Shipping 2015 Acknowledgments; International Council on Clean Transportation: Washington, DC, USA, 2017. [Google Scholar]
  123. Aletras, N.; Karvountzis-Kontakiotis, A.; Kefalas, N.; Grigoriadis, A.; Samaras, Z.; Ntziachristos, L. Optimization-Based Energy Management Algorithm for 2-Stroke Hybrid Ship with Controllable Pitch Propeller. J. Mar. Sci. Eng. 2024, 12, 2331. [Google Scholar] [CrossRef]
  124. Woodyard, D. Pounder’s Marine Diesel Engines and Gas Turbines; Elsevier: Oxford, UK, 2004. [Google Scholar]
  125. Jalkanen, J.-P.; Brink, A.; Kalli, J.; Pettersson, H.; Kukkonen, J.; Stipa, T. A Modelling System for the Exhaust Emissions of Marine Traffic and its Application in the Baltic Sea Area. Artic. Atmos. Chem. Phys. 2009, 9, 9209–9223. [Google Scholar] [CrossRef]
  126. Aakko-Saksa, P.; Murtonen, T.; Vesala, H.; Koponen, P.; Nyyssönen, S.; Puustinen, H.; Lehtoranta, K.; Timonen, H.; Teinilä, K.; Hillamo, R.; et al. Black Carbon Measurements Using Different Marine Fuels. In Proceedings of the 28th CIMAC World Congress, Helsinki, Finland, 6–9 June 2016. [Google Scholar]
  127. Bendl, J.; Saraji-Bozorgzad, M.R.; Käfer, U.; Padoan, S.; Mudan, A.; Etzien, U.; Giocastro, B.; Schade, J.; Jeong, S.; Kuhn, E.; et al. How Do Different Marine Engine Fuels and Wet Scrubbing Affect Gaseous Air Pollutants and Ozone Formation Potential from Ship Emissions? Environ. Res. 2024, 260, 119609. [Google Scholar] [CrossRef]
  128. Fischer, D.; Vith, W.; Unger, J.L. Assessing Particulate Emissions of Novel Synthetic Fuels and Fossil Fuels under Different Operating Conditions of a Marine Engine and the Impact of a Closed-Loop Scrubber. J. Mar. Sci. Eng. 2024, 12, 1144. [Google Scholar] [CrossRef]
  129. Gysel, N.R.; Russell, R.L.; Welch, W.A.; Cocker, D.R.; Ghosh, S. Impact of Sugarcane Renewable Fuel on In-Use Gaseous and Particulate Matter Emissions from a Marine Vessel. Energy Fuels 2014, 28, 4177–4182. [Google Scholar] [CrossRef]
  130. Khan, M.Y.; Russell, R.L.; Welch, W.A.; Cocker, D.R.; Ghosh, S. Impact of Algae Biofuel on In-Use Gaseous and Particulate Emissions from a Marine Vessel. Energy Fuels 2012, 26, 6137–6143. [Google Scholar] [CrossRef]
  131. Kuittinen, N.; Jalkanen, J.P.; Alanen, J.; Ntziachristos, L.; Hannuniemi, H.; Johansson, L.; Karjalainen, P.; Saukko, E.; Isotalo, M.; Aakko-Saksa, P.; et al. Shipping Remains a Globally Significant Source of Anthropogenic PN Emissions Even after 2020 Sulfur Regulation. Environ. Sci. Technol. 2021, 55, 129–138. [Google Scholar] [CrossRef]
  132. Petzold, A.; Lauer, P.; Fritsche, U.; Hasselbach, J.; Lichtenstern, M.; Schlager, H.; Fleischer, F. Operation of Marine Diesel Engines on Biogenic Fuels: Modification of Emissions and Resulting Climate Effects. Environ. Sci. Technol. 2011, 45, 10394–10400. [Google Scholar] [CrossRef]
  133. Nylund, I.; Alder, R.; Hirose, T.; Umemoto, Y.; Yamada, T. The 2-Stroke Low-Pressure Dual-Fuel Technology: From Concept to Reality. In Proceedings of the CIMAC, Helsinki, Finland, 6–10 June 2016; pp. 46–50. [Google Scholar]
  134. Ushakov, S.; Stenersen, D.; Einang, P.M. Methane Slip from Gas Fuelled Ships: A Comprehensive Summary Based on Measurement Data. J. Mar. Sci. Technol. 2019, 24, 1308–1325. [Google Scholar] [CrossRef]
  135. Fridell, E.; Salo, K. Measurements of Abatement of Particles and Exhaust Gases in a Marine Gas Scrubber. Proc. Inst. Mech. Eng. Part M J. Eng. Marit. Environ. 2016, 230, 154–162. [Google Scholar] [CrossRef]
  136. Winnes, H.; Fridell, E.; Moldanová, J. Effects of Marine Exhaust Gas Scrubbers on Gas and Particle Emissions. J. Mar. Sci. Eng. 2020, 8, 299. [Google Scholar] [CrossRef]
  137. Karjalainen, P.; Teinilä, K.; Kuittinen, N.; Aakko-Saksa, P.; Bloss, M.; Vesala, H.; Pettinen, R.; Saarikoski, S.; Jalkanen, J.P.; Timonen, H. Real-World Particle Emissions and Secondary Aerosol Formation from a Diesel Oxidation Catalyst and Scrubber Equipped Ship Operating with Two Fuels in a SECA Area. Environ. Pollut. 2022, 292, 118278. [Google Scholar] [CrossRef]
  138. Wang, Z.; Zhang, X.; Guo, J.; Hao, C.; Feng, Y. Particle Emissions from a Marine Diesel Engine Burning Two Kinds of Sulphur Diesel Oils with an EGR & Scrubber System: Size, Number & Mass. Process Saf. Environ. Prot. 2022, 163, 94–104. [Google Scholar] [CrossRef]
Figure 1. Schematic illustration of the measurement setup.
Atmosphere 17 00122 g001
Figure 2. Normalized dependence of specific fuel oil consumption (SFOC) with engine load for the existing (Grigoriadis et al., 2021) [45] and the updated (new SFOC equation) curve.
Atmosphere 17 00122 g002
Figure 3. Normalized CO (top left), HC (top right) and PM (bottom) emissions as a function of engine load using biofuels at a reference load of 25%.
Atmosphere 17 00122 g003
Figure 4. Effect of engine load on NOx emissions for a high-pressure dual fuel LNG engine at 50% reference load.
Atmosphere 17 00122 g004
Figure 5. Effect of engine load on NOx & CO emissions for LNG Low-pressure dual-fuel engine (top) and methanol high-pressure dual-fuel engine (bottom). The reference load was set at 40% for the LNG engine and 50% for the methanol engine.
Atmosphere 17 00122 g005
Figure 6. Effect of engine load on HC emissions for a low-pressure LNG engine (left), and a high-pressure dual-fuel methanol engine (right).
Atmosphere 17 00122 g006
Table 1. Test Cycle E3 for 2-stroke main engines and D2 for 4-stroke generators.
Test cycle type E3Speed, %100%91%80%63%
Power, %100%75%50%25%
Weighting factor0.20.50.150.15
Test cycle type D2Speed, %100%100%100%100%100%
Power, %100%75%50%25%10%
Weighting factor0.050.250.30.30.1
Table 2. Flue gas analyzer specifications.
InstrumentMeasured ParameterRangeAccuracy
Testo 350 Maritime 1CO20–25% vol±0.3% vol
O20–25% vol±0.3% vol
NOx<100–1999 ppm±5%
CO0–10,000 ppm±5%
SO20–5000 ppm±5%
Ambient pressure, absolute600–1150 hPa±10 hPa
Humidity meterAmbient humidity0–100% RH±2%
1 Testo SE & Co., KGaA, Titisee-Neustadt, DE, USA.
Table 3. Measuring instruments specifications.
InstrumentMeasured ParameterRangeAccuracy
TorquemeterTorque0–250 rpm<0.5%
Speed0.1 rpm
Power MeterElectrical power-0.1 kW
Coriolis Mass FlowmeterFuel consumption0–10,000 kg/h0.30%
Volumetric FlowmeterFuel consumption0–2500 L/min1.50%
Cylinder Pressure SensorCylinder pressure0–250 Bar0.50%
Scavenge Pressure SensorScavenging air pressure0–10 Bar0.10%
Scavenge Temperature SensorScavenging air temperature−10–80 °C0.2 °C
Exhaust Temperature SensorExhaust gas temperature−10–600 °C0.5 °C
Table 4. Base specific fuel oil consumption factors per engine type at 50% engine load distinguished by engine type.
Engine TypeBase Specific Fuel Oil Consumption Factors (MJ/kWh) at 50% Engine Load
Main engine SSD7.57
Main engine MSD8.40
Main engine HSD9.35
Auxiliary engine9.58
Table 5. NOx base emission factors for biofuels distinguished by engine type and NOx Tier standards at 50% engine load.
Biofuels NOx BEF (g/kWh)TIER 0 1TIER ITIER II
SSD19.515.912.4
MSD11.911.69.1
HSD9.48.16.5
1 Tier 0 refers to engines constructed before 2000.
Table 6. CO, HC and PM base emission factors for biofuels along with standard deviation and number of individual values in brackets per engine type at 25% engine load.
PollutantBiofuels BEF (g/kWh)
CO0.979 ± 0.617 (8)
HC0.141 ± 0.134 (5)
PM0.220 ± 0.0741 (8)
Table 7. Base emission factors for NOx, CO, HC, CH4 and N2O for two LNG dual-fuel engine technologies, low- and high- pressure, one methanol high-pressure dual fuel engine, and one ammonia high-pressure dual fuel engine. The reference load was set at 40% for the LNG low-pressure dual fuel engine NOx and CO and 50% for the LNG low-pressure HC and CH4, LNG, methanol and ammonia high-pressure dual fuel engines.
PollutantBase Emission Factor (BEF) (g/kWh)
LNG Low-Pressure DFLNG High-Pressure DFMethanol High-Pressure DFAmmonia High-Pressure DF
NOx0.70015.17.9910
CO3.80Not available5.200.0954–0.147
HC3.73Not available1.510.0478–0.0885
CH43.540.200.01620.00134
N2O0.020.030.0030.778
Table 8. Overview of percentage reductions in fuel consumption and gaseous and particulate pollutants from various emission control technologies. Positive/Negative values indicate decrease/increase in pollutants, respectively.
Control TechnologyFuel TypePercentage Reduction in Emission Control Technologies 1 (%)
SFOCCONOxSO2HCPM
ScrubberResidual−2.1522.75.84Variable (max 99%)36.335.8
SCRResidual−1.50−59.389.09.5568.515.1
SCRDistillate−1.50−66.585.16.5778.313.0
EGRResidual−3.50−90–16065–80−3.50−40.0−100–200
EGRDistillate−3.50−90–16065–80−3.50−40.0−100–200
DOCLow-sulphur fuel/Distillate1.0930.7−0.814−0.89969.050.0
DPFDistillate−1.500.000.000.000.0091.7
1 Positive values indicate decrease in pollutants and negative values indicate increase in pollutants.
Disclaimer/Publisher’s Note: The statements, opinions and data contained in all publications are solely those of the individual author(s) and contributor(s) and not of MDPI and/or the editor(s). MDPI and/or the editor(s) disclaim responsibility for any injury to people or property resulting from any ideas, methods, instructions or products referred to in the content.