


Abstract
Sustainable development goals link policies addressing air quality and energy efficiency to synergistic benefits for climate mitigation. However, the coal-dominated energy system poses major challenges for Henan Province in mitigating air pollution and climate change. While the government has issued a series of clean air policies and low-carbon energy targets, the simultaneous achievements of low-carbon transition and air quality goals at the sub-national level remain unclear. This study evaluates the effectiveness of policy implementation in Henan’s energy system using an integrated assessment framework that combines emission scenarios, air quality simulations, and health impact assessments. The results indicated that, by 2030, without system-wide energy transformation driven by carbon mitigation policies, air quality improvements in Henan Province will be limited, even under stringent end-of-pipe emission control measures. In contrast, low-carbon policies would yield significant co-benefits for both air quality improvement and climate mitigation. Beyond stringent end-of-pipe controls, the implementation of carbon mitigation policies aligned with China’s enhanced climate targets could further reduce Henan’s average PM2.5 concentration by up to 4.1 µg/m3. The monetized health co-benefits in Henan Province would reach 4.57 billion RMB under the stringent carbon mitigation scenario. These results highlight the critical role of effectively implementing existing air pollution and energy policies in simultaneously achieving air quality, public health, and carbon mitigation goals in Henan.
1. Introduction
1.1. Motivation
China is the world’s largest emitter of carbon dioxide and one of the countries facing the most severe challenges related to energy consumption and air pollution [1,2,3]. According to the IPCC Sixth Assessment Report (AR6, 2022), human-induced climate change has led to more frequent and intense extreme events, such as river overflows, heavy rainfall, glacier outbursts, and urban flooding [4]. Climate change and air pollution are two pressing challenges for global sustainability, particularly in developing countries [5]. China has implemented a series of policies and action plans to address these issues, aiming to identify better coordinated solutions [6]. Sustainable development remains a global priority of the times. This approach not only meets the needs of contemporary people but also does not compromise the long-term interests of future generations. As emphasized by the Intergovernmental Panel on Climate Change (IPCC) [7], a comprehensive analysis of co-benefits and adverse effects is essential for estimating the actual costs of mitigation policies. With the introduction of a series of policies and action plans, emissions of primary pollutants and the severity of PM2.5 pollution have both decreased substantially [8,9,10,11,12]. Building on these achievements, China has set more ambitious targets to pursue deep climate mitigation and improved air quality [13]. In 2018, and more recently, the country has updated its Nationally Determined Contribution (NDC) target, stressing the need to reach a carbon emission peak before 2030 and aiming for carbon neutrality before 2060 [14,15].
Since 1991, the overall carbon emissions in Henan Province have been on the rise [16]. In 2018, Henan’s CO2 emissions reached 484 Mt, accounting for 5.62% of China’s total CO2 emissions [17]. Additionally, located in east-central China, Henan has long suffered from severe air pollution, which results from the combined effects of high air pollutant emissions and its unique geographical conditions [18,19,20,21]. To understand the local air pollutant emissions reductions and the co-benefits of China’s energy policies, this study conducts a case study on Henan using a newly developed evaluation framework that couples integrated assessment and air quality models. The framework is designed to explore the policies’ effects on emissions reductions in SO2, PM2.5, PM10, and other air pollutants as well as their co-benefit in curbing the growth of CO2 emissions.
1.2. Literature Review
Early studies on the co-benefits and ancillary effects of greenhouse gas (GHG) mitigation policies were mostly conducted in developed countries, particularly the United States and Europe [22,23]. However, pursuing co-benefits is probably more significant in developing countries, as many of them are experiencing rapid development often associated with high fossil fuel consumption [24,25]. The relevant literature has revealed the potential pathways, opportunities, and challenges in China’s transition toward green development. For example, Jiang et al. [26] used the IPAC-AIM technology model, a sub-model of IPAC, to analyze the 1.5 °C scenario in China. They found that, to achieve the deep mitigation target, China’s fossil fuel-based energy system needs to undergo a rapid transition to zero-emission energy, and Carbon Capture and Storage (CCS) technology needs to play an important role. Zhou et al. [27], in their research on an assessment model based on global change, found that China’s CO2 emissions should peak as early as 2020 or 2025 to meet the 1.5 °C or 2 °C targets, respectively. Tong et al. [28] developed different scenarios based on the global development models and social conditions of the Coupled Model Intercomparison Project Phase 6 (CMIP6). They identified effective sectoral emission control policies to mitigate anthropogenic pollutant emissions in China under different socioeconomic and climate change scenarios, pointing out that proactive air pollution control policies are critical for achieving short-term pollution reductions. Thompson et al.’s [29] systematic approach to evaluating the air quality co-benefits of US carbon policies has provided valuable insights for our research direction.
The homology of air pollutants and GHGs indicates that air pollutants and GHGs should be addressed synergistically rather than in isolation. He et al. [30] developed an integrated approach to assess the co-benefits of two distinct sets of China’s energy policies by combining an energy projection model, an emission estimation model, an air quality simulation model, and a health benefit evaluation model. Cheng et al. [31] investigated pathways for air quality improvement in China under current and future mitigation efforts towards carbon neutrality, highlighting the significance of ambitious climate mitigation strategies for China’s post-2030 air quality enhancement. These combined positive effects are referred to as co-benefits. Mao et al. [32] examined CO2 emission reduction and the associated local air pollutant co-benefits in China’s transportation sector by focusing on policy instruments such as carbon taxes, energy taxes, fuel taxes, clean energy vehicle subsidies, and fare reductions. Geng et al. [33] evaluated the co-benefits in Shenyang’s public transportation sector resulting from the introduction of vehicles meeting new emission standards and alternative fuel vehicles in bus and taxi fleets. Li et al. [34] revealed that the industrial and power sectors will be the key focus areas for air pollution control and that the increased air pollution control costs arising from stricter control strategies can be alleviate by low-carbon policies in the long term. In addition, studies [35,36,37,38,39,40,41] have evaluated the co-benefits of climate change mitigation for air quality and human health at the provincial or municipal level, particularly in developed eastern regions (e.g., Beijing, Shanghai, Tianjin, and Shandong). Air pollutant emissions also exert a negative impact on industries such as tourism and construction. Previous literature [42,43] has analyzed the influence of air pollution on urban tourism development, finding that the PM2.5 index has a negative effect on domestic and international tourists’ choice of urban tourism destinations and has become one of the key reference factors for tourists when selecting travel locations.
For China, many existing studies focus either on the national level, specific industries, or economically developed regions, providing valuable insights for the country’s mitigation strategies. However, research on relatively underdeveloped regions remains relatively scarce and superficial. Furthermore, while most studies emphasize co-benefits related to emission reduction or health improvement, few have explored those associated with economic effects. Consequently, this study aims to address this research gap by forecasting Henan’s future CO2 and air pollutant emissions. Using an integrated modeling framework, it evaluates both the emissions reduction co-benefits and the economic cost co-benefits of CO2 mitigation policies on air pollutants.
The core source of carbon dioxide emissions in Henan Province is coal combustion, which contributes approximately 80% of the province’s total emissions. Industrial coal combustion is the primary source of sulfur dioxide emissions [44], while motor vehicles are the main source of nitrogen oxide emissions. The sources of PM2.5 exhibit diverse characteristics and significant seasonal variations. From a provincial perspective, the primary sources include coal combustion, motor vehicles, industrial processes, and dust. Henan Province has formed a power energy structure characterized by ‘renewable energy and thermal power receiving equal emphasis’: renewable energy accounts for 51.4% of the total installed capacity, with thermal power (predominantly coal-fired power generation) accounting for 48.6%. In terms of power generation volume, however, renewable energy contributes 31.0% of the total, whereas coal-fired power generation remains the core pillar, accounting for approximately 68–69% [45].
1.3. Organization of This Paper
In this study, regarding Greenhouse Gases (GHGs), we focus primarily on carbon dioxide emissions and define the accounting boundary as encompassing Scope-1 emissions (direct emissions occurring within the province) and Scope-2 emissions (indirect emissions from energy imports generated outside the province). For air pollution, we concentrate on PM2.5, as it is widely recognized as the primary culprit behind severe polluted weather in Chinese cities [46]. We began with an emission inventory analysis to examine the contribution of various sources to CO2 emissions and PM2.5 pollution in the baseline year 2017, for which the most recent emissions inventories are available. Specifically, this study proceeds as follows: (1) we assess the impacts of the immediate implementation of measures in seven distinct sectors (industry, agriculture, construction, transportation, services, residential life, electricity, and heating) in Henan Province on energy consumption, carbon emissions, and air quality as well as the impacts when all measures are implemented simultaneously across these seven sectors; (2) on this basis, we identify the critical areas for synergistic governance in Henan and develop a Long-range Energy Alternatives Planning (LEAP) model to predict energy demand, CO2 emissions, and air pollutant emissions by 2030 under different governance scenarios; (3) we quantitatively evaluate the emissions reduction effects of different policies through a synergistic emissions reduction benefit analysis; (4) we apply the WRF-CMAQ (Weather Research and Forecast-Community Multiscale Air Quality) modeling system to examine the impacts of two-tier synergistic governance on urban air quality; (5) we assess residents’ health benefits under different scenarios using PRM models, and furthermore, we propose several priority areas and measures for implementing synergistic governance, along with important policy implications for Henan.
2. Materials and Methods
2.1. Study Domain
Henan Province is located in east-central China between longitudes 110°21′ E and 116°39′ E and latitudes 31°23′ N and 36°22′ N. In 2020, it achieved a Gross Domestic Product (GDP) of 5.5 trillion RMB, ranking fifth nationwide [47]. The province comprises 18 prefecture-level cities, covering 155 districts and counties. Its permanent resident population stands at 99 million, an increase of 5.3 million compared with 2010, representing a growth rate of 5.68% [48]. Figure 1 provides a brief overview of the region.
Figure 1.
A brief introduction of Henan. (a) Geographical location of Henan in China, in the middle and lower reaches of the Yellow River. (b) Basic socioeconomic development situation of Henan. (c) Annual (CO2) emissions and air quality, measured by annual average PM2.5 concentrations, of Henan.
2.2. Overview of the Integrated Modeling Framework
Here, we project future air quality attainment in Henan through 2030, assess the CO2 reduction co-benefits associated with meeting ambient PM2.5 standards, and evaluate the health and climate impacts of air attainment-oriented energy policies. We integrate a comprehensive evaluation model framework that employs the Low Emissions Analysis Platform (LEAP) model to simulate energy consumption as well as CO2 and pollutant emissions under different future scenarios, based on baseline year data, thereby generating target year datasets. Subsequently, we apply the WRF-CMAQ (Weather Research and Forecasting-Community Multiscale Air Quality) model to assess air quality and CO2 concentrations in the target year. Additionally, we utilize an Elastic Carbon Emissions Reduction (ECER) model to analyze the synergistic reduction benefits of CO2 and air pollutants and employ a Poisson Regression Model (PRM) for health impact analysis to evaluate the effects of ambient and household PM2.5 exposure on public health in Henan Province. This integrated approach captures the nonlinear relationships between energy, emissions, concentrations, and health, enabling us to assess the co-benefits of air quality attainment for protecting public health and mitigating CO2 within an internally consistent framework. The overall framework is shown in Figure 2.
Figure 2.
Integrated modeling framework for studying mitigation co-benefits.
The comprehensive assessment model framework comprises the Low Emissions Analysis Platform (LEAP) model, the WRF-CMAQ (Weather Research and Forecasting-Community Multiscale Air Quality) air quality model, the Elastic Carbon Emissions Reduction (ECER) model, and the Poisson Regression Model (PRM). The LEAP model projects energy consumption, CO2 emissions, and other atmospheric pollutant emissions for the target year. The WRF-CMAQ air quality model primarily simulates the atmospheric environmental quality in the target year: initially, the model’s credibility is verified by comparing observed and simulated PM2.5 concentrations in the baseline year; subsequently, PM2.5 concentration projections for the target year are generated. Afterwards, we use the ECER model to analyze the synergistic reduction benefits of CO2 and air pollutants under different policy scenarios. Finally, the PRM is applied for health impact analysis to assess the effects of ambient and household PM2.5 exposure on public health in Henan Province as well as to quantify the associated economic benefits.
2.3. LEAP Model (CO2 and Air Pollutant Emissions Prediction and Emissions Reduction Analysis)
The Low Emissions Analysis Platform (LEAP) (2020.1.40 version) is an integrated, scenario-based modelling tool that allows the development of economic, energy, and environmental analysis [49]. Developed by the Stockholm Environmental Institute and the University of Boston, it aims to contribute to climate change mitigation [50]. For the construction of a model, at least one baseline year and one or more future years must be considered. According to this information, the projection of the emissions can be determined by means of a growth rate of the activity to be analyzed [51].
Energy-related activities account for over 95% of Henan Province’s CO2 emissions and represent the largest source of air pollutant emissions in the province. The LEAP model has been widely applied to simulate future energy production and consumption as well as the associated CO2 emissions. However, due to inconsistencies in accounting systems and the unavailability of pollutant emissions factors, this model is rarely used in air pollutant emissions research. In this study, based on a comparative analysis of CO2 and air pollutant inventory compilation guidelines and the localized emissions factors, we developed a customized LEAP model to track energy-related emissions of both CO2 and major air pollutants (SO2, NOX, VOCS, CO, NH3, PM2.5, and PM10) and examine the synergic effect between their emissions reductions under alternative policy scenarios.
Under the bottom-up framework, energy demand was calculated based on Equation (1):
where EC refers to the final total energy consumption, AC is the activity level (for example, product output, value added, etc.), EI is the final energy intensity, and subscript j,k,l represents departments, energy consumption terminal equipment, and energy varieties, respectively.
The CO2 emissions were calculated using Equation (2):
where ECO2 refers to the carbon dioxide emissions from the j sector, l refers to energy varieties, and EFj,l refers to the carbon dioxide emissions factor generated by l energy consumption in sector j.
Air pollutant emissions factors are closely related to usage and fuel activity data. The air pollutant emissions and emissions factors were calculated using the Equations in Table 1.
Table 1.
Calculation formula for air pollutant emissions.
In this study, seven air pollutants, SO2, NOX, PM2.5, PM10, VOCS, NH3, and CO, are selected for analysis, and the emissions are calculated by the formulas in Table 1. In this study, PM2.5, PM10, and SO2 are calculated by a material balance algorithm, and other pollutants are calculated by an emissions factor method.
Using 2017 as the baseline year, we compared the CO2 and air pollutant emissions results calculated by our developed LEAP model with the official emissions inventory of Henan Province, as shown in Supplementary Table S1. The deviations between the LEAP-calculated results and the official inventory data for PM2.5 and PM10 were all less than 4%, while those for CO2 were less than 8%. These results verify the accuracy and reliability of our developed model in emissions accounting.
2.4. Analysis of Synergistic Effect of Emissions Reduction
Assuming p represents a climate policy, the formulas presented [55] in Table 2 quantify three key impacts of policy p: its effect on carbon dioxide (CO2) emissions reduction, its effect on PM2.5 emissions reduction, and the synergistic effect between CO2 and PM2.5 emissions reductions.
Table 2.
The synergistic effect between carbon dioxide and PM2.5 emissions.
To more intuitively assess the degree of emissions reduction synergy among various measures, this study further employs the synergistic control effect coordinate system method to analyze the synergistic control effects of different measures on carbon dioxide and air pollutants of in Henan Province, as shown in Figure 3 [55].
Figure 3.
Schematic diagram of benefit coordinate system of co-control of carbon dioxide and air pollutants.
Each point in the two-dimensional coordinate system corresponds to a specific end-of-pipe governance and carbon reduction measure. The vertical and horizontal coordinates of the point intuitively reflect the emissions reduction effect of the measure on CO2 and other air pollutants, respectively. For example, the first quadrant indicates that this measure can reduce CO2 and air pollutants at the same time. Conversely, the negative synergistic effect (reducing PM2.5 emission but increasing CO2, or reducing PM2.5 emission but increasing CO2, or increasing both PM2.5 and CO2 emission) is shown in the other quadrants.
2.5. Air Quality Simulation
The WRF-CMAQ simulation platform is used to predict PM2.5 concentrations under different governance scenarios. We adopt a three-layer nested region to represent the simulated region of the WRF-CMAQ platform, where the resolution of the inner region is higher than that of the outer region. The simulated area adopts a three-layer nested grid scheme: the first layer is 36 km in China and the surrounding area, the second layer is 12 km in the central and eastern regions of China, and the third layer is in Henan Province and the surrounding area, with a grid spacing of 4 km. Vertically, 43 air pressure layers are set vertically. The input meteorological data is derived from the National Centers for Environmental Prediction (NCEP), with a temporal resolution of 6 h and a spatial resolution of 1° × 1° FNL global analysis data. The terrain data adopts 30″ spatial resolution data from MODIS (Moderate Resolution Imaging Spectroradiometer)-equipped satellites. Detailed parameters are shown in Table 3.
Table 3.
Specific parameter settings for WRF simulation.
The chemical mechanism of the Community Multiscale Air Quality (CMAQ) is the saprc99 (statewide air pollution research center mechanism 99) gas phase chemical reaction mechanism and Aero6 aerosol reaction mechanism. In order to reflect the changes in meteorological conditions in different seasons of the year, we selected four representative months (this study adopts the meteorological division standard for seasonal categorization: specifically, March to May is defined as spring, June to August is defined as summer, September to November is defined as autumn, and December to February of the subsequent year is defined as winter). Correspondingly, January was chosen as the representative month for winter, April was chosen for spring, July was chosen for summer, and October was chosen for autumn [21]. Based on these meteorological and emission input data, the CMAQ model was employed to simulate the physical and chemical processes of various pollutants in the atmosphere. The configuration of model parameters refers to previous relevant studies [56].
In this study, we selected the 2017 annual average daily observation data of PM2.5 from 100 national-controlled automatic air quality monitoring stations distributed across 18 cities in Henan Province. We then compared these data with the daily average PM2.5 concentration from the simulation results to evaluate the correlation between the two and verify the reliability of the simulation outcomes. The key indicators used for comparison and verification in this study include Normalized Mean Bias (NMB), Normalized Mean Error (NME), Mean Fractional Bias (MFB), Mean Fractional Error (MFE), and correlation coefficient (R) [57].
The annual average concentration of PM2.5 in Henan Province in 2017 simulated by the CMAQ model in this study is 47.46 µg/m3, while the observed average annual average concentration is 64.15 µg/m3. The Normalized Mean Bias (NMB), Normalized Mean Error (NME), normalized Mean Fractional Bias (MFB), and normalized Mean Fractional Error (MFE) were calculated according to the method provided by the U.S. Environmental Protection Agency [58,59,60,61]. Each index meets the accuracy evaluation standard of PM2.5 simulation given in the literature, indicating that the simulation results are in good agreement with the observation results and the model is highly reliable.
This confirms that the emissions factors selected in this study and the corresponding base-year emissions can accurately reflect the actual situation in Henan Province, and the emissions inventory estimation results are reliable. The scatter plot of simulated values versus monitored values is shown in Figure 4.
Figure 4.
Scatter chart of annual PM2.5 analog and observed values in Henan Province in 2017.
The spatial distribution of the simulated annual average PM2.5 concentration in Henan Province in 2017 is shown in Figure 5. Owing to the dense distribution of industrial cities in central and northern Henan Province, the region exhibits higher energy consumption and emissions intensity compared to other prefecture-level cities in the province, leading to relatively higher PM2.5 concentrations in these areas.
Figure 5.
Annual mean concentration distribution of simulated PM2.5 in 2017.
2.6. Health Risk and Economic Benefit Assessment
According to the relevant research on air pollutants and health risks, Huang et al. conducted an analysis of the health benefits of PM2.5 pollution control in the Beijing–Tianjin–Hebei region, and it was found that the health benefits are equivalent to 4.68% of the regional GDP [60,62,63]. In this study, the Poisson Regression Model (PRM) was used to evaluate the impact of air pollutants and improvement of treatment measures on residents’ health. The health risk assessment is calculated using Equation (3):
where β is the PM2.5 exposure response relationship coefficient with a health endpoint, C is the actual concentration of PM2.5 per mesh, C0 is the baseline reference concentration of PM2.5, and E and E0, respectively, correspond to the baseline mortality and incidence rate of the population health terminal under the level of C and C0. In this study, C0 is the standard concentration value of PM2.5 recommended by the World Health Organization (WHO) in 2006 (10 µg m−3) [64].
Population exposure to health hazards caused by PM2.5 is calculated using Equation (4):
where ΔE is the PM2.5 health risk value of population exposure, and P is the number of people exposed in each grid; the population of Henan Province in the target year 2030 refers to the population development plan of Henan Province.
Based on the research findings of scholars at home and abroad regarding the health risks of air pollution on human populations as well as data from China’s Health and Family Planning Statistical Yearbook, six health endpoints were selected for analysis: all-cause mortality, respiratory diseases, cardiovascular diseases, acute bronchitis, chronic bronchitis, and asthma. Baseline mortality or morbidity and exposure response relationship coefficients for six health endpoints β values are shown in Supplementary Table S2.
The Willingness-To-Pay (WTP) method was employed to assess the total economic loss of health in the population caused by PM2.5 exposure due to the lack of localized Value of a Statistical Life (VSL) results (refer to the results of the study of Beijing by Huang et al. [65]). Unit health economic losses caused by hospitalization and onset health endpoints refer to the results of the study by Huang Desheng et al. [60] in the Beijing–Tianjin–Hebei region, considering the per capita disposable income and GDP growth rate of residents in Henan Province; the value of life and the unit health economic loss of each health point are revised.
The economic benefit assessment is calculated using Equation (5):
where HC (yuan/case) is the unit health economic value of each health endpoint in Henan Province, G is the per capita disposable income of Henan Province, and t is the study year.
2.7. Key Parameters and Scenario Settings
According to the forecast results of domestic and foreign economic development trends, after the impact of the COVID-19 has gradually declined, the economic development of Henan Province will still maintain a rapid growth rate during the 14th five-year plan period. GDP is calculated at constant prices in 2017. Detailed information about the scenario settings is summarized in Table 4. The main parameters of urban socioeconomic development are listed in Supplementary Table S3.
Table 4.
Setting of key parameters of social and economic development in Henan Province.
Based on three main emissions reduction pathways (Figure 6), we establish a two-dimensional scenario framework consisting of four scenarios to comprehensively investigate the impacts of carbon mitigation policies and air pollution policies in Henan Province, with a focus on energy-related and industrial process-related air pollutant emissions and induced disease burden. This scenario framework is used to analyze the whole-system costs, benefits, and co-benefits of mitigation policies, with the aim of identifying cost-effective green transition pathways at the provincial level. The first dimension is carbon mitigation scenarios, including three scenarios: a Business-As-Usual (BAU) scenario, an Energy-Saving and Low-Carbon (ESLC) scenario, and a Reinforcement Scenario (RS). The BAU scenario describes China’s current climate governance path. The ESLC scenario describes the full achievement of China’s initial nationally determined contribution target, which aims to reduce CO2 emissions intensity by 60–65% by 2030 compared to 2005 and to reduce total coal consumption in Henan Province to less than 60% by 2025 [66]. The RS mainly describes that the penetration rate of clean energy, such as electricity, heat, and natural gas, is further improved compared with the energy-saving and low-carbon scenarios. A more detailed introduction on sectoral emissions reduction can be found in Supplementary Table S4.
Figure 6.
Three main emissions reduction paths.
The second dimension is the levels of end-of-pipe air pollution control measures. We consider two different scenarios, i.e., a reference case with emissions control levels fixed at the 2017 level (REF) and level of controls that realize Maximum Feasible Reduction (MFR). Based on these two dimensions, we draw up a total of four scenarios to investigate the effects of end-of-pipe control and the air quality co-benefits of carbon mitigation (Table 5).
Table 5.
Scenario settings.
2.8. Data Resources
The parameters used to build the LEAP model are adjusted according to the input–output table of China and Henan in 2017, which is taken from the China Statistical Yearbook [67] and Henan Statistical Yearbook [68]. The energy balance table of Henan Province comes from China’s Energy Statistical Yearbook [69]. The emissions of carbon dioxide and air pollutants in the emissions inventory or revised base year are calculated based on the data of the second pollution census and research data.
3. Results and Discussion
3.1. Evolution of Energy Consumption Under Climate Change Mitigation Scenarios
The implementation of stronger carbon emissions reduction policies will largely reshape Henan Province’s energy system after 2020 (Figure 7a). To achieve the strategic goal of low-carbon development, it is necessary to integrate and promote the development of energy conservation and efficiency improvement and “Re-electrification” in the terminal sector. Enhancing the electrification rate can facilitate energy conservation and efficiency improvement in the terminal sector (Figure 7b) while generating carbon reduction effects and an amplification effect. According to the prediction results of the LEAP model, under the RS, Henan Province’s total social energy consumption will peak in 2025 at 233 Mtce and then drop to 209 Mtce in 2030, representing a 28.9% decrease compared to the BAU scenario (Figure 8a). Under the BAU scenario (Figure 8b), terminal energy consumption will increase from 169 Mtce in 2017 to 236 Mtce in 2030. Under the ESLC scenario, growth will be moderate, with terminal energy consumption rising from 169 Mtce in 2017 to 209 Mtce in 2030. Under the RS, coal consumption in 2030 will be 49.6% lower than in 2017, while the demand for natural gas and renewable energy will increase significantly. These two energy sources will dominate terminal energy demand (accounting for approximately 62.8%), with their consumption rising from 11.9 Mtce and 55.7 Mtce in 2017 to 16.1 Mtce and 99.6 Mtce in 2030, respectively.
Figure 7.
Energy consumption in Henan Province under three different scenarios from 2017 to 2030: (a) overall energy consumption in Henan Province; (b) electrification rate of key energy consuming sectors for 2030.
Figure 8.
Energy structure in Henan Province from 2017 to 2030: (a) primary energy consumption; (b) terminal energy consumption; (c) energy consumption by sector.
From the sectoral perspective (Figure 8c), the low-carbon transition toward carbon neutrality in the power sector will significantly reduce the share of fossil fuels in Henan’s primary energy mix, which is consistent with previous studies focusing on China [70,71]. Under the BAU scenario, the energy consumption of Henan Province’s power sector will increase to 96.8 Mtce in 2025 before decreasing to 84.7 Mtce in 2030. Under the ESLC scenario, the power sector’s energy consumption will peak at 91.5 Mtce in 2025, with coal, oil, and natural gas accounting for 90.5%, 0.15%, and 1.87% of the total, respectively. Under the RS, the power sector’s energy consumption will peak earlier, in 2021, at 91.4 Mtce; among this, coal accounts for 90.9%, while oil and natural gas account for 0.15% and 2.63%, respectively.
3.2. Carbon Dioxide and Air Pollutant Emissions
Due to the complex interaction between the energy structure and regional air pollution in Henan Province, we employed emissions inventory analysis to detect the contribution of electricity imports and local sources to Henan CO2 emissions. In the 2017 base year, Henan Province emitted 575.2 Mt CO2, and the average PM2.5 concentration was 67.6 µg m−3. Anthropogenic emissions of primary PM2.5, PM10, SO2, NOX, NH3, CO, and VOCS in Henan Province reached 268.6 kt, 433.7 kt, 381.1 kt, 889.1 kt, 32.7 kt, 3417.7 kt, and 425.3 kt, respectively. To ensure consistency, the emissions estimated in this study were compared with those from other studies focusing on the Beijing–Tianjin–Hebei (BTH) region and its surrounding areas (Table S5). Emissions of primary PM2.5, PM10, SO2, and NOX (agricultural emissions and solvent use are not considered in this paper, except for NH3 and VOCS) are reasonably consistent with those in the MEIC database but higher than those in the MEE inventory. The end-of-pipe treatment efficiency of industrial enterprises in this study was determined based on corporate pollution control technologies and operational hours. Compared with the MEE results, this approach may be less conducive to emissions reduction.
Figure 9 shows the prefectural emissions in 2017. As expected, the total emissions of air pollutants and CO2 vary widely across the cities due to differences in demographic status and economic development level, in addition to urban and industrial structures. The cities with the most serious emissions are mainly Anyang, Jiaozuo, and Zhengzhou.
Figure 9.
Prefectural emissions in baseline 2017 scenario. (a) Geographical location of the cities, (b) CO2, (c) NH3, (d) primary PM2.5, (e) primary PM10, (f) SO2, (g) NOX, (h) CO, (i) VOCS.
Combined with the analysis of carbon dioxide and air pollutant emissions inventories, indirect emissions from imported electricity account for 8.4% of the total carbon dioxide emissions in Henan Province. Additionally, the contribution of interregional air pollutant transport to PM2.5 concentration in Henan Province varies by season [72], with an average contribution rate of 36.2% (Figure 10). It can be seen that the transmission outside the province has a significant impact on the air pollution in Henan Province.
Figure 10.
Contribution of local and external sources of carbon dioxide emissions and PM2.5 pollution in Henan Province in 2017.
Under the RS, strict carbon emissions controls will lead to a large and earlier reduction in carbon dioxide emissions (Figure 11a). Under the BAU scenario, Henan’s carbon emissions will peak in 2028, while under the ESLC scenario, they will peak earlier, around 2025. Under the BAU scenario, compared with 2017, carbon emissions in 2025 and 2030 will increase by about 71.66 Mt (+12.51%) and 72.02 Mt (+12.53%), respectively. Under the ESLC scenario, Henan’s carbon emissions will peak around 2025, and carbon dioxide emissions will reach 593 Mt. Under the RS, in 2025, carbon emissions will be significantly reduced by about 33.71 Mt (−5.89%) from 2017 levels and by 198.11 Mt (−34.80%) in 2030. As shown in (Figure 11b), the main air pollutants come from industrial sectors. The implementation of deep carbon emissions reduction policies and end-of-pipe control measures can reduce pollutant emissions by varying degrees (Figure 11c). In 2030, under the MFR_ESLC scenario, emissions of SO2, PM10, PM2.5, and NOX will decrease by 147.46 kt (−54.13%), 164.03 kt (−48.64%), 100.37 kt (−46.48%), and 158.23 kt (−16.13%) compared with the REF_ESLC scenario. Compared with efficient end-of-pipe control, the reinforcement scenario achieves more significant reductions in NOX, CO, VOCS, and NH3 emissions, mainly due to the substitution of coal with fuel oil and biomass. In road traffic, increasing the proportion of electric vehicles and clean energy vehicles can reduce NOX emissions more than strengthening end-of-pipe control measures. Under the scenario’s carbon constraints, the REF_RS scenario would help reduce emissions of all air pollutants in the next 10 years. Meanwhile, the emissions of SO2, PM10, PM2.5, NOX, CO, VOCS, and NH3 would be reduced by 163.82 kt (−42.66%), 163.14 kt (−35.47%), 93.52 kt (−32.70%), 322.15 kt (−31.68%), 944.62 kt (−24.96%), 124.10 kt (−26.40%), and 12.26 kt (−31.63%) in 2030 compared with the 2020 level.
Figure 11.
Prediction of carbon dioxide and air pollutant emissions under three different scenarios in Henan Province: (a) carbon dioxide emissions; (b) emissions of air pollutants from major energy consuming sectors in 2017; (c) sector air pollutant emissions under different scenarios; (d) carbon dioxide and air pollutant emissions in 2025 and 2030.
Different driving forces of air pollutant emissions and intensive policies lead to differences in future emissions reduction rates. Enhanced end-of-pipe control measures could significantly reduce PM2.5, PM10, SO2, and VOCS emissions from the industrial sector by 30–80% by 2030. However, according to the emissions inventory of Henan Province (Figure 11c), the significant increase in NOx emissions mainly stems from vehicle exhaust emissions. From 2017 to 2030, the growth in power demand driven by economic development in Henan Province will result in a slight increase in SO2 emissions: under the REF_BAU scenario, emissions will increase by 80.23 kt (21.11%).
Under the reinforcement scenario, the application of efficient end-of-pipe control measures (Table 6) achieves a more significant effect on the emissions reduction in air pollutants (Figure 11d). In 2025, under the MFR_RS scenario, the emissions of SO2, NOX, CO, PM10, PM2.5, VOCS, and NH3 would be reduced by 172.99 kt (−57.86%), 134.02 kt (−15.33%), 634.58 kt (−16.76%), 238.71 kt (−56.92%), 152.15 kt (−57.07%), 96.16 kt (−21.06%), and 8.84 kt (−24.66%). Meanwhile, in 2030, the emissions of SO2, NOX, CO, PM10, PM2.5, VOCS, and NH3 would be reduced by 204.67 kt (−68.46%), 289.77 kt (−33.15%), 1062.60 kt (−28.07%), 273.42 kt (−65.19%), 168.84 kt (−63.33%), 138.02 kt (−30.23%), and 11.05 kt (−30.83%) compared with the 2020 level. The emerging clean air measures can bring significant common benefits of carbon dioxide and air pollutant emissions reduction by affecting the local energy system.
Table 6.
End-of-pipe control measures.
3.3. Co-Benefit Between CO2 and Air Pollutant Emissions Reduction
Figure 12 shows that carbon dioxide emissions reduction will have a significant synergistic effect on reducing local energy-related air pollutant emissions. In 2030, under the REF_ESLC scenario, the elasticity of CO2 emissions reductions to PM2.5, PM10, VOCS, SO2, NOX, CO, and NH3 emissions reductions (which is used to measure the synergic effect between their emissions reductions) is 0.60, 0.53, 0.92, 0.41, −1.13, 1.58, and 1.92, respectively. Under this energy-saving and low-carbon scenario, there is no synergy between CO2 and NOX. This synergistic effect on VOCS and CO will be very strong, while the emissions reduction effect on SO2 and NH3 is not obvious, but there is basically no emissions reduction effect on NOX at the same time. Under the REF_RS scenario, there is good synergy: the elasticity of CO2 emissions reductions to PM2.5, PM10, VOCS, SO2, NOX, CO, and NH3 emissions reductions is 1.24, 1.12, 1.89, 0.83, 1.61, 2.08, and 1.85. Overall, under the MFR_RS scenario, the emissions reduction rate of carbon dioxide and other air pollutants is the largest: respectively, 70.43%, 63.62%, 66.35%, 25.09%, 75.26%, 34.28%, 20.36%, and 24.27%. By industry, industrial processes have the strongest synergistic effect with CO2 emissions reduction, followed by heat supply. However, CO2 reduction in local power generation may actually increase emissions of certain pollutants; for example, replacing coal with natural gas and fuel oil in this sector increases nitrogen oxide (NOx) emissions (note: natural gas/fuel oil combustion typically reduces CO2 compared to coal; this part may require verification of technical logic). From a policy perspective, developing urban public transport, optimizing freight structures, switching freight vehicles from oil to natural gas or other clean fuels, and decarbonizing boiler fuels yield the most significant synergistic effects for reducing both CO2 and air pollutant emissions.
Figure 12.
Synergic control of emissions reduction benefits.
3.4. Air Quality in Henan Province Under Four Alternative Scenarios
Henan’s future air quality, represented by the concentration of PM2.5 (currently the primary pollutant causing most Chinese cities to fail to meet national ambient air quality standards), was projected under four alternative governance scenarios: a solo energy adjustment scenario considers only efforts to optimize the energy structure; the air–climate synergistic governance scenario accounts for the interactions between carbon dioxide and air pollutant emissions reductions, assuming the province would adopt a synergistic governance strategy to improve air quality and mitigate climate change. The reduction ratio of the primary emissions of major air pollutants in 2030 relative to their 2017 levels under four alternative scenarios is summarized in Table 7 (available technologies or measures used for air pollution and carbon dioxide prevention are summarized in Supplementary Table S6). By comparison, from the solo energy adjustment scenario to the air–climate synergistic governance scenario, the emissions reduction ratios of major air pollutants in Henan would increase due to the co-benefits of synergistic reductions in urban CO2 and air pollutant emissions.
Table 7.
Reduction ratio of the primary emissions of major air pollutants in 2030 relative to their 2017 levels under four different scenarios.
Under the mitigation policy, PM2.5 concentrations in Henan Province will decline significantly from 2017 to 2030, especially in more polluted areas (Figure 13). In these scenarios, REF_BAU is a counterfactual scenario where we assume no strengthened end-of-pipe control measures are implemented after 2017. PM2.5 concentration in the central and northern part would still be above China’s air quality standard (Figure 13). The implementation of pollutant control measures will lead to varying degrees of improvement in PM2.5 concentrations, while strengthened carbon mitigation policies could bring more significant air quality improvements across a wider region (Figure 13). When a deeper carbon mitigation policy (MFR_RS) is implemented, PM2.5 concentrations will be further reduced by 2.35 µg/m3 in 2025 and 4.10 µg/m3 in 2030, reflecting the increasingly limited marginal effects of energy structure adjustment measures. Compared with the baseline scenario, the annual average concentration improvement effect of PM2.5 under the 2030 MFR_RS scenario is shown in Figure 14. PM2.5 concentration in central and northern regions of Henan Province have decreased significantly because atmospheric pollutant sources in this region are mainly influenced by the industrial structure, where industrial emissions play a dominant role. The implementation of pollution reduction measures under the low-carbon scenario can, therefore, effectively reduce PM2.5 concentrations.
Figure 13.
PM2.5 concentration: annual PM2.5 concentration and differences between mitigation scenarios and REF_BAU scenarios in 2025 and 2030.
Figure 14.
Compared with the REF_BAU, improvement effect of PM2.5 concentration under MFR_RS.
3.5. Assessment of the Health Impact of PM2.5 Emissions Reductions on Residents
Air pollution is associated with numerous health impacts, including Chronic Obstructive Pulmonary Disease (COPD) linked to enhanced ozone (O3) and Acute Lower Respiratory Illness (ALRI), stroke, Ischemic Heart Disease (IHD), COPD, and Lung Cancer (LC) linked to PM2.5. With the aging of China’s population structure, the impact of air pollution on the elderly will be further amplified. Given the significant co-benefits of improved air quality, after China achieves the 2030 carbon peaking target, Henan’s low-carbon transition can substantially reduce the disease burden caused by air pollution. Based on the PRM model, we estimated the premature death toll of PM2.5 exposure in Henan Province under different scenarios. The results show that a large number of premature deaths related to PM2.5 can be avoided by implementing stricter end control and long-term deep carbon emissions reduction (Figure 15). In the baseline scenario (REF_BAU), premature deaths related to PM2.5 would be approximately 10.56 (95% confidence interval, CI95: 8.60–12.53) thousand in 2025 and would be reduced to 10.22 (CI95: 8.32–12.12) thousand in 2030. Under the MFR_ESLC scenarios, 1972 premature deaths could be avoided in 2030; when deep climate change mitigation is achieved (MFR_RS), the avoided excess mortality could be as many as 2093 in 2030, accounting for 20.48% of the total mortality in the baseline scenario. This indicates that efforts to reduce air pollution are indispensable and crucial to protect public health, particularly in the context of the future rapidly aging population and increased population vulnerabilities to air pollution.
Figure 15.
PM2.5-related disease burden and premature deaths.
3.6. Evaluate the Economic Benefits of PM2.5 Emissions Reduction
The monetized health benefits of both mitigation policies could be substantial. The avoided outpatient and hospitalization expenditure from PM2.5-related disease will increase over time under mitigation scenarios (Figure 16). From 2017 to 2030, the expenditure on diseases caused by PM2.5 will generally rise first and then decline, which is consistent with the results of major pollutant emissions and PM2.5 concentrations. Under the MFR_ES scenarios, compared with the REF_BAU scenario, avoided disease expenditure would amount to 4.35 billion RMB in 2025 and 4.57 billion RMB in 2030, respectively. This indicates that carbon mitigation policies would avoid substantial disease-related costs and reduce the household expenditure burden.
Figure 16.
The co-benefits on population health compared to the REF_BAU scenario.
4. Conclusions
4.1. Comparison with Other Studies
In addition to scenario design and policy assumptions, differences may also be attributed to modeling mechanisms, parameter settings, and end-of-pipe control measures. Among these factors, the uncertainty of health impact assessment, especially due to the selection of constantly updated end governance, will be crucial and has been widely discussed in previous studies [1,82,83]. Therefore, more detailed uncertainty analysis and reporting will be necessary for future research for a better comparison among studies. Previously, most provincial-level studies focused on NDC, 1.5, and 2 degree scenarios instead of the carbon peak carbon neutralization background. Still, we try to compare the physical and monetized health co-benefits of carbon mitigation with other studies (Table 8).
Table 8.
Comparison of the health benefits of carbon mitigation in 2030 with other studies.
4.2. Limitations
It should be noted that our research has certain limitations in terms of data, models, and other aspects. For instance, when formulating carbon mitigation policies for Henan Province, we assumed that Henan would adopt the same carbon intensity or per capita emissions reduction rates as the national average in China, without considering potential individualized carbon reduction pathways. Given that current policies generally only cover a 5-year horizon, our study involves a certain degree of uncertainty in policy extrapolation. Additionally, the emissions reduction elasticity analysis does not provide a detailed assessment of energy-saving technologies, which also constitutes an area for improvement.
4.3. Policy Suggestion
Lu et al. [91] used the GAINS-China model, and their results suggest that implementing energy replacement in the industrial and residential sectors in Beijing–Tianjin–Hebei can not only generate large amounts of air pollutant emissions reduction but also can lead to significant CO2 emissions reduction. Yu et al. [92] used an energy system optimization model, and a low-carbon emissions reduction path that can realize the synergistic control of CO2 and traditional air pollutants in China’s power industry was obtained. Compared to other studies, this study reveals the substantial potential of implementing a two-tier synergistic governance framework for CO2 emissions and air pollution in Henan Province. Under the medium-intensity emissions reduction scenario (REF_ESLC), end-of-pipe control measures are maintained at the current technological level and integrated with mature energy-saving and carbon-reduction technologies (e.g., new energy substitution). The required investment falls within the local fiscal capacity, enabling a balance between economic development and environmental governance needs. This scenario can be implemented in phases and features high operability.
Power generation, manufacturing, and road transportation are the main common sources of CO2 emissions and PM2.5 pollution in Henan Province, a pattern also observed in many other megacities in China, such as Beijing, Shanghai, Tianjin, and Chongqing [93,94]. Given this, Henan should prioritize these three sectors in promoting the synergistic governance of CO2 emissions and air pollution locally. Regarding Henan’s large-scale power dispatch, all coal-fired power units have achieved ultra-low emissions: the proportion of units with a capacity of 600,000 kilowatts or above has reached 65%, and the average coal consumption of coal-fired power units in the Province has dropped to 300 g of coal equivalent per kilowatt-hour (gce/kWh), 6 g lower than the national average. Furthermore, industrial manufacturing and road transportation should be regarded as two key areas to advance regional collaborative governance.
The manufacturing industry is a key contributor to Henan’s local CO2 emissions and locally sourced PM2.5 pollution. In the future, the industrial sector should assume primary responsibility for addressing resource and environmental constraints and take the lead in pursuing green and low-carbon transformation. Promoting low-carbon development and deep decarbonization in the industrial sector not only controls carbon dioxide emissions but also delivers more far-reaching multiple values and synergistic benefits. According to existing plans, the general trend of Henan Province’s industrial development in the future is that high-tech industries and light industries, represented by equipment manufacturing; transportation vehicle manufacturing; and electronic information, food, clothing, and furniture manufacturing, will gradually replace heavy industries such as steelmaking to become the pillars of industrial and economic development. This study found that Henan’s future industrial development trend is basically consistent with the national development trend and also similar to the current structure of Japan’s industrial sector across most industries. Therefore, the future GDP share of various industrial sub-sectors in Henan Province has been established (see Supplementary Table S7).
Road traffic is another key factor contributing to local greenhouse gas emissions and PM2.5 pollution in Henan Province. For road passenger transport, the development of public transport and travel demand that management hold the greatest potential for the collaborative reduction in greenhouse gas and air pollutant emissions. Therefore, this study suggests that Henan Province should accelerate the construction of its public transport system, particularly rail transit and bus rapid transit [95,96]. It is recommended to establish an energy-saving comprehensive transportation system centered on railways and lay the foundation for an urban layout dominated by public transport and non-motorized travel. Electric vehicles should account for 45% of road passenger transport. For road freight transport, efforts should be made to optimize the freight structure and promote the transition of freight vehicles from oil-fired to gas-fired and electric-powered models. Pure electric trucks are expected to account for 25% of road freight transport by 2030, which will make significant contributions to reducing local greenhouse gas and air pollutant emissions in Henan Province. This provides policy insights for Henan Province to continuously optimize its cargo distribution system and vigorously develop railway transport as a replacement for heavy-haul road transport, with 30% of road freight shifted to railways. Additionally, trucks using Liquefied Natural Gas (LNG) or other new fuels as viable alternatives to diesel trucks should be promoted through financial subsidies and market incentives [97,98].
Overall, there are still some uncertainties and limitations in this study. For example, emissions of carbon dioxide and air pollutants may deviate from actual conditions due to unexpected changes in emissions factors and coefficients; additionally, this study focuses on the synergistic governance of CO2 and air pollutant emissions in the energy sector and does not conduct a cost–benefit analysis. Hence, the extension of the research to non-energy sectors and the cost-effectiveness of the two-tier synergistic governance model compared with traditional governance strategies require further exploration.
Supplementary Materials
The following supporting information can be downloaded at: https://www.mdpi.com/article/10.3390/atmos17010004/s1, Table S1. Comparison of carbon dioxide and air pollutant emissions calculated by LEAP model with Henan official inventory; Table S2. Exposure response relationship coefficient of each health endpoint β and baseline mortality or incidence rate; Table S3. The setting of key socioeconomic development parameters for Henan Province; Table S4. The basic characteristics and sectoral emission reduction efforts of three different scenarios in this study; Table S5. Comparison of estimated emissions in this study, MEE database and MEIC in 2017 (kg/capita, CO2: t/capita); Table S6. Available technologies or measures used to mitigate CO2 and air pollution emissions of Henan in this study; Table S7. Setting of industrial structure in Henan Province [99,100,101,102,103,104].
Author Contributions
Conceptualization, Y.H. (Youjiang He); Software, Y.H. (Yulong Hu); Validation, Y.H. (Yulong Hu) and Y.H. (Youjiang He); Formal analysis, C.Z.; Resources, M.W.; Writing—original draft, C.Z.; Writing—review & editing, Y.H. (Youjiang He); Visualization, C.Z.; Project administration, M.W.; Funding acquisition, M.W. All authors have read and agreed to the published version of the manuscript.
Funding
This work was supported by the Major Science and Technology Special Project of Xinjiang Uygur Autonomous Region (Grant Number: 2024A03012).
Institutional Review Board Statement
Not applicable.
Informed Consent Statement
Not applicable.
Data Availability Statement
The original contributions presented in this study are included in the article/Supplementary Material. Further inquiries can be directed to the corresponding authors.
Conflicts of Interest
The authors declare no conflict of interest.
References
- Lelieveld, J.; Evans, J.S.; Fnais, M.; Giannadaki, D.; Pozzer, A. The contribution of outdoor air pollution sources to premature mortality on a global scale. Nature 2015, 525, 367–371. [Google Scholar] [CrossRef] [Scilit]
- Cohen, A.J.; Brauer, M.; Burnett, R.; Anderson, H.H.R.; Frostad, J.; Estep, K.; Balakrishnan, K.; Brunekreef, B.; Dandona, L.; Feigin, V.L.; et al. Estimates and 25-year trends of the global burden of disease attributable to ambient air pollution: An analysis of data from the Global Burden of Diseases Study 2015. Lancet 2017, 389, 1907–1918. [Google Scholar] [CrossRef] [Scilit]
- Dong, H.; Dai, H.; Dong, L.; Fujita, T.; Geng, Y.; Klimont, Z.; Inoue, T.; Bunya, S.; Fujii, M.; Masui, T. Pursuing air pollutant co-benefits of CO2 mitigation in China: A provincial leveled analysis. Appl. Energy 2015, 144, 165–174. [Google Scholar] [CrossRef] [Scilit]
- Pörtner, H.-O.; Roberts, D.C.; Poloczanska, E.S.; Mintenbeck, K.; Tignor, M.; Alegría, A.; Craig, M.; Langsdorf, S.; Löschke, S.; Möller, V.; et al. (Eds.) IPCC Climate Change 2022: Impacts, Adaptation and Vulnerability. Working Group II Contribution to the Sixth Assessment Report of the Intergovernmental Panel on Climate Change. In Summary for Policymakers; IPCC: Geneva, Switzerland, 2022; p. 15. [Google Scholar]
- Jiang, J.; Ye, B.; Shao, S.; Zhou, N.; Wang, D.; Zeng, Z.; Liu, J. Two-Tier Synergic Governance of Greenhouse Gas Emissions and Air Pollution in China’s Megacity, Shenzhen: Impact Evaluation and Policy Implication. Environ. Sci. Technol. 2021, 55, 7225–7236. [Google Scholar] [CrossRef] [Scilit]
- Xing, J.; Lu, X.; Wang, S.; Wang, T.; Ding, D.; Yu, S.; Shindell, D.; Ou, Y.; Morawska, L.; Li, S.; et al. The quest for improved air quality may push China to continue its CO2 reduction beyond the Paris Commitment. Proc. Natl. Acad. Sci. USA 2020, 117, 29535–29542. [Google Scholar] [CrossRef] [Scilit]
- Blanco, G.E.A. Drivers, trends and mitigation. In Climate Change 2014: Mitigation of Climate Change. Contribution of Working Group III to the Fifth Assessment Report of the Intergovernmental Panel on Climate Change; Cambridge University Press: New York, NY, USA; Cambridge, UK, 2014. [Google Scholar]
- Barrington-Leigh, C.; Baumgartner, J.; Carter, E.; Robinson, B.E.; Tao, S.; Zhang, Y.X. An evaluation of air quality, home heating and well-being under Beijing’s programme to eliminate household coal use. Nat. Energy 2019, 4, 416–423. [Google Scholar] [CrossRef] [Scilit]
- Zhang, Q.; Zheng, Y.; Tong, D.; Shao, M.; Hao, J. Drivers of improved PM2.5 air quality in China from 2013 to 2017. Proc. Natl. Acad. Sci. USA 2019, 116, 24463–24469. [Google Scholar] [CrossRef] [Scilit]
- Hammer, M.S.; van Donkelaar, A.; Li, C.; Lyapustin, A.; Sayer, A.; Hsu, N.; Levy, R.; Garay, M.; Kalashnikova, O.; Kahn, R.; et al. Global Estimates and long-term trends of fine particulate matter concentrations. Environ. Sci. Technol. 2020, 54, 7879–7890. [Google Scholar] [CrossRef] [Scilit]
- Shaddick, G.; Thomas, M.L.; Mudu, P.; Ruggeri, G.; Gumy, S. Half the world’s population are exposed to increasing air polllution. npj Clim. Atmos. Sci. 2020, 3, 23. [Google Scholar] [CrossRef] [Scilit]
- Zhang, Q.; Geng, G. Impact of clean air action on PM2.5 pollution in China. Sci. China Earth Sci. 2019, 62, 1845–1846. [Google Scholar] [CrossRef] [Scilit]
- Cheng, J.; Tong, D.; Liu, Y.; Bo, Y.; Zheng, B.; Geng, G.; He, K.; Zhang, Q. Air quality and health benefits from China’s current and upcoming clean air policies. Faraday Discuss. 2021, 226, 566–584. [Google Scholar] [CrossRef] [Scilit] [PubMed]
- The State Council Information Office (People’s Republic of China). 2020 Xi Calls for Enhancing Biodiversity Conservation, Global Environmental Governance. Available online: http://english.www.gov.cn/news/topnews/202010/01/content_WS5f752bffc6d0f7257693cf97.html (accessed on 1 March 2022).
- The State Council Information Office (People’s Republic of China). 2020 Xi’s Statements at UN Meetings Demonstrate China’s Global Vision, Firm Commitment. Available online: http://english.www.gov.cn/statecouncil/wangyi/202010/02/content_WS5f771a17c6d0f7257693d023.html (accessed on 2 March 2022).
- Gou, G. SVR-based prediction of carbon emissions from energy consumption in Henan Province. Earth Environ. Sci. 2018, 113, 12052. [Google Scholar] [CrossRef] [Scilit]
- Henan Metallurgical Research Institute Co., Ltd. 2018 Energy Activities in Henan Province; Henan Metallurgical Research Institute Co., Ltd.: Zhengzhou, China, 2020. [Google Scholar]
- Chen, Y.; Zhou, Y.; Zhao, X. PM2.5 over North China based on MODIS AOD and effect of meteorological elements during 2003–2015. Front. Environ. Sci. Eng. 2019, 14, 23. [Google Scholar] [CrossRef] [Scilit]
- Chang, X.; Wang, S.; Zhao, B.; Xing, J.; Liu, X. Contributions of inter-city and regional transport to PM2.5 concentrations in the Beijing-Tianjin-Heibei region and its implications on regional joint air pollution control. Sci. Total Environ. 2019, 660, 1191–1200. [Google Scholar] [CrossRef] [Scilit]
- Meng, K.; Xu, X.; Wang, H.; Xu, X.; Liu, X.; Jiao, Y. The Causes of “Vulnerable Regions” to Air Pollution in Winter in the Beijing-Tianjin-Hebei Region: A Topographic–Meteorological Impact Model Based on Adaptive Emission Constraint Technique. Atmosphere 2019, 10, 719. [Google Scholar] [CrossRef] [Scilit]
- Liu, S.; Hua, S.; Wang, K.; Qiu, P.; Liu, H.; Wu, B.; Shao, P.; Liu, X.; Wu, Y.; Xue, Y.; et al. Spatial-temporal variation characteristics of air pollution in Henan of China: Localized emission inventory, WRF/Chem simulations and potential source contribution analysis. Sci. Total Environ. 2018, 624, 396–406. [Google Scholar] [CrossRef] [Scilit]
- Shrestha, R.M.; Pradhan, S. Co-benefits of CO2 emission reduction in a developing country. Energy Policy 2010, 38, 2586–2597. [Google Scholar] [CrossRef] [Scilit]
- Rafaj, P.; Schöpp, W.; Russ, P.; Heyes, C.; Amann, M. Co-benefits of post-2012 global climate mitigation policies. Mitig. Adapt. Strateg. Glob. Change 2013, 18, 801–824. [Google Scholar] [CrossRef] [Scilit]
- Takeshita, T. Assessing the co-benefits of CO2 mitigation on air pollutants emissions from road vehicles. Appl. Energy 2012, 97, 225–237. [Google Scholar] [CrossRef] [Scilit]
- Zusman, E.; Miyatsuka, A.; Evarts, D.; Oanh, N.; Klimont, Z.; Amann, M.; Suzuki, K.; Mohammad, A.; Akimoto, H.; Romero, J.; et al. Co-benefits: Taking a multidisciplinary approach. Carbon Manag. 2013, 4, 135–137. [Google Scholar] [CrossRef] [Scilit]
- Jiang, K.; He, C.; Dai, H.; Liu, J.; Xu, X. Emission scenario analysis for China under the global 1.5 °C target. Carbon Manag. 2018, 9, 481–491. [Google Scholar] [CrossRef] [Scilit]
- Zhou, S.; Tong, Q.; Pan, X.; Cao, M.; Wang, H.; Gao, J.; Ou, X. Research on low-carbon energy transformation of China necessary to achieve the Paris agreement goals: A global perspective. Energy Econ. 2021, 95, 105137. [Google Scholar] [CrossRef] [Scilit]
- Tong, D.; Cheng, J.; Liu, Y.; Yu, S.; Zhang, Q.; Yan, L.; Hong, C.P.; Qin, Y.; Zhao, H.; Zheng, Y.; et al. Dynamic projection of anthropogenic emissions in China:methodology and 2015–2050 emission pathways under a range of socio-economic, climate policy, and pollution control scenarios. Atmos. Chem. Phys. 2020, 20, 5729–5757. [Google Scholar] [CrossRef] [Scilit]
- Thompson, T.M.; Rausch, S.; Saari, R.K.; Selin, N.E. A systems approach to evaluating the air quality co-benefits of US carbon policies. Natl. Clim. Change 2014, 4, 917–923. [Google Scholar] [CrossRef] [Scilit]
- He, K.; Lei, Y.; Pan, X.; Zhang, Y.; Zhang, Q.; Chen, D. Co-benefits from energy policies in China. Energy 2010, 35, 4265–4272. [Google Scholar] [CrossRef] [Scilit]
- Cheng, J.; Tong, D.; Zhang, Q.; Liu, Y.; Lei, Y.; Yan, G.; Yu, S.; Clarke, L.; Geng, G.; Zheng, B.; et al. Pathways of China’s PM2.5 air quality 2015–2060 in the context of carbon neutrality. Natl. Sci. Rev. 2021, 8, nwab078. [Google Scholar] [CrossRef] [Scilit] [PubMed]
- Mao, X.; Yang, S.; Liu, Q.; Tu, J.; Jaccard, M. Achieving CO2 emission reduction and the co-benefits of local air pollution abatement in the transportation sector of China. Environ. Sci. Policy 2012, 21, 1–13. [Google Scholar] [CrossRef] [Scilit]
- Geng, Y.; Ma, Z.; Xue, B.; Ren, W.; Liu, Z.; Fujita, T. Co-benefit evaluation for urban public transportation sector–a case of Shenyang, China. J. Clean. Prod. 2013, 58, 82–91. [Google Scholar] [CrossRef] [Scilit]
- Li, N.; Chen, W.; Rafaj, P.; Kiesewetter, G.; Schöpp, W.; Wang, H.; Zhang, H.; Krey, V.; Riahi, K. Air Quality Improvement Co-benefits of Low-Carbon Pathways toward Well Below the 2 degrees C Climate Target in China. Environ. Sci. Technol. 2019, 53, 5576–5584. [Google Scholar] [CrossRef] [Scilit]
- Ramaswami, A.; Tong, K.; Fang, A.; Lal, R.; Nagpure, A.; Li, Y.; Yu, H.; Jiang, D.; Russell, A.; Shi, L.; et al. Urban cross-sector actions for carbon mitigation with local health co-benefits in China. Nat. Clim. Change 2017, 7, 736–742. [Google Scholar] [CrossRef] [Scilit]
- Zhang, X.; Wang, X.; Bai, Z.; Han, B. Co-Benefits of Integrating PM10 and CO2 Reduction in an Electricity Industry in Tianjin, China. Aerosol Air Qual. Res. 2013, 13, 756–770. [Google Scholar] [CrossRef] [Scilit]
- Chen, C.; Wang, B.; Fu, Q.; Collin, G.; David, G. Reductions in emissions of local air pollutants and co-benefits of Chinese energy policy: A Shanghai case study. Energy Policy 2004, 34, 754–762. [Google Scholar]
- Cheng, B.; Dai, H.; Wang, P.; Zhao, D.; Masui, T. Impacts of carbon trading scheme on air pollutant emissions in Guangdong Province of China. Energy Sustain. Dev. 2015, 27, 174–185. [Google Scholar] [CrossRef] [Scilit]
- Xie, Y.; Dai, H.; Dong, H. Impacts of SO2 taxations and renewable energy development on CO2, NOx and SO2 emissions in Jing-Jin-Ji region. J. Clean. Prod. 2018, 171, 1386–1395. [Google Scholar] [CrossRef] [Scilit]
- Cui, L.; Zhou, J.; Peng, X.; Ruan, S.; Zhang, Y. Analyses of air pollution control measures and co-benefits in the heavily air-polluted Jinan city of China, 2013–2017. Sci. Rep. 2020, 10, 5423. [Google Scholar] [CrossRef] [Scilit]
- Liu, F.; Klimont, Z.; Zhang, Q.; Cofala, J.; Zhao, L.; Huo, H.; Nguyen, B.; Schöpp, W.; Sander, R.; Zheng, B.; et al. Integrating mitigation of air pollutants and greenhouse gases in Chinese cities: Development of GAINS-City model for Beijing. J. Clean. Prod. 2013, 58, 25–33. [Google Scholar] [CrossRef] [Scilit]
- Sun, G.; Qian, Q. The Impact of Air Pollution on the Development of Urban Tourism in China: Empirical Evidence from 168 Key Monitoring Cities. J. Sichuan Norm. Univ. 2020, 47, 65–73. [Google Scholar]
- Zhan, Y.; Yin, H. Analysis of the Impact of Air Quality on Tourism Cities in China—Based on Panel Data of 135 Tourism Cities in China from 2005 to 2014. J. Southwest Norm. Univ. 2017, 42, 88–94. [Google Scholar]
- Li, H.; Wang, S.; Zhang, W.; Wang, H.; Wang, H.; Wang, S.; Li, H. Characteristics and influencing factors of urban air quality in Beijing-Tianjin-Hebei and its surrounding areas (‘2+26’ cities). Res. Environ. Sci. 2021, 34, 172–184. [Google Scholar]
- Henan Provincial Bureau of Statistics Henan Statistical Yearbook; China Statistical Publishing House: Beijing, China, 1999.
- Huang, J.; Pan, X.; Guo, X.; Li, G. Health impact of China’s Air Pollution Prevention and Control Action Plan: An analysis of national air quality monitoring and mortality data. Lancet Planet. Health 2018, 2, e313–e323. [Google Scholar] [CrossRef] [Scilit]
- Henan Provincial Bureau of Statistics. China Statistics Press. Available online: http://oss.henan.gov.cn/sbgt-wztipt/attachment/hntjj/hntj/lib/tjnj/2021nj/zk/notepyrightc.htm (accessed on 1 April 2022).
- Henan Reference Materials. Available online: https://baike.baidu.com/reference/132980/9755orY1mEeevlddlGyLjgu2AQpDqtlGE8xdBek8pIlwzuX3MdfkaiRTS4pKraIttAkp7FloKLA-7ZUpuDAHVOXxA1Tz4YN_VOutnvNa4w (accessed on 1 April 2022).
- LEAP: Low Emissions Analysis Platform. Available online: https://www.sei.org/projects-and-tools/tools/leap-long-range-energy-alternatives-planning-system/ (accessed on 3 April 2022).
- Wu, Q.; Peng, C. Scenario Analysis of Carbon Emissions of China’s Electric Power Industry Up to 2030. Energies 2016, 9, 988. [Google Scholar] [CrossRef] [Scilit]
- Shabbir, R.; Ahmad, S.S. Monitoring urban transport air pollution and energy demand in Rawalpindi and Islamabad using leap model. Energy 2010, 35, 2323–2332. [Google Scholar] [CrossRef] [Scilit]
- Liu, Y.; Zhang, Y.; Wei, Y.; Dou, H.; Gu, D.; Zeng, L.; Shao, M. Measurement of emission factors of carbonaceous aerosols from residential coal combustion. Acta Sci. Circumstantiae 2007, 9, 1409–1416. [Google Scholar]
- Zhao, B.; Ma, J.Z. Development of an air pollutant emission inventory for Tianjin. Acta Sci. Circumstantiae 2008, 28, 368–375. [Google Scholar]
- Huang, C.; Chen, C.; Li, L.; Cheng, Z.; Wang, H.; Wang, Y.; Huang, H.; Zhang, G.; Chen, Y. Anthropogenic air pollutant emission characteristics in the Yangtze River Delta Region, China. Acta Sci. Circumstantiae 2011, 31, 1858–1871. [Google Scholar]
- Mao, X.; Zeng, A.; Hu, T.; Xing, Y.; Liu, S. Study of coordinate control effect assessment of technological measures for emissions reduction. China Popul. Resour. Environ. 2011, 21, 1–7. [Google Scholar]
- Yu, M.; Ma, Q.; Zhu, M.; Zhang, J.; Wang, K.; Xu, Q.; Zhang, R. Evaluation for improvement of PM2.5 pollution and healthy benefit of rural coal replacement during winter in Henan Province. Chin. Environ. Sci. 2021, 41, 3906–3916. [Google Scholar]
- Boylan, J.W.; Russell, A.G. PM and light extinction model performance metrics, goals, and criteria for three-dimensional air quality models. Atmos. Environ. 2006, 40, 4946–4959. [Google Scholar] [CrossRef] [Scilit]
- Brauer, M.; Amann, M.; Burnett, R.T.; Cohen, A.; Dentener, F.; Ezzati, M.; Henderson, S.; Krzyzanowski, M.; Martin, R.; Dingenen, R.; et al. Exposure Assessment for Estimation of the Global Burden of Disease Attributable to Outdoor Air Pollution. Environ. Sci. Technol. 2012, 46, 652–660. [Google Scholar] [CrossRef] [Scilit]
- Brauer, M.; Freedman, G.; Frostad, J.; Donkelaar, A.; Martin, R.; Dentener, F.; Dingenen, R.; Estep, K.; Amini, H.; Apte, J.; et al. Ambient Air Pollution Exposure Estimation for the Global Burden of Disease 2013. Environ. Sci. Technol. 2016, 50, 79–88. [Google Scholar] [CrossRef] [Scilit]
- Huang, D.; Zhang, S. Health benefit evaluation for PM2.5 pollution control in Beijing-Tianjin-Hebei region of China. China Environ. Sci. 2013, 33, 166–174. [Google Scholar]
- Kan, H.; London, S.; Chen, G.; Zhang, Y.; Song, G.; Zhao, N.; Jiang, L.; Chen, B. Differentiating the effects of fine and coarse particles on daily mortality in Shanghai, China. Environ. Int. 2007, 33, 376–384. [Google Scholar] [CrossRef] [Scilit]
- Peng, X.; Liu, X.; Liu, Z.; Tian, L.; Yu, B. Exposure-response functions for health effects of ambient particulate matter pollution applicable for China. Chin. Environ. Sci. 2009, 29, 1034–1040. [Google Scholar]
- Kan, H.; Chen, B. Analysis of Exposure-Response Relationships of Air Particulate Matter and Adverse Health Outcomes in China. J. Environ. Health 2002, 6, 422–424. [Google Scholar]
- WHO. WHO Air Quality Guidelines for Particulate Matter, Ozone, Nitrogen Dioxide and Sulfur Dioxide: Global Update 2005. Summ. Risk Assess. 2006, 38, E90038. [Google Scholar]
- Huang, D.; Xie, X.; Mu, Q.; Zhang, S. Study on age effect in environmental health value evaluation. Chin. J. Popul. Resour. Environ. 2012, 22, 63–70. [Google Scholar]
- Henan Provincial People’s Government. Modern Energy System and Carbon Peak and Carbon Neutralization Plan in the 14th Five Year Plan of Henan Province. Available online: http://www.henan.gov.cn/2022/02-22/2402738.html (accessed on 5 April 2022).
- National Bureau Statistics of China. 2018 China Statistical Yearbook. Available online: https://www.stats.gov.cn/sj/ndsj/2018/indexch.htm (accessed on 5 April 2022).
- National Bureau Statistics of Henan. 2018 Henan Province Statistical Yearbook. Available online: https://oss.henan.gov.cn/sbgt-wztipt/attachment/hntjj/hntj/lib/tjnj/2018/indexch.htm (accessed on 5 April 2022).
- National Bureau of Statistics and Energy Administration. 2018 China Energy Statistics Yearbook. Available online: https://www.stats.gov.cn/zs/tjwh/tjkw/tjzl/202302/t20230215_1907928.html (accessed on 5 April 2022).
- Pan, X.; Chen, W.; Wang, L.; Lin, L.; Li, N. The role of biomass in China’s long-term mitigation toward the Paris climate goals. Environ. Res. Lett. 2018, 13, 124028. [Google Scholar] [CrossRef] [Scilit]
- Duan, H.; Zhou, S.; Jiang, K.; Bertram, C.; Harmsen, M.; Kriegler, E.; Vuuren, D.; Wang, S.; Fujimori, S.; Tavoni, M.; et al. Assessing China’s efforts to pursue the 1.5 degrees C warming limit. Science 2021, 372, 378. [Google Scholar] [CrossRef] [Scilit]
- Liu, G.J.; Su, F.C.; Xu, Q.X.; Zhang, R.Q.; Wang, K. One-year Simulation of Air Pollutions in Central China, Characteristic, Distribution, Inner Region Cross-transmission, and Path Way Research in 18 Cities. Environ. Sci. 2022, 43, 3953–3965. [Google Scholar]
- Wang, Z.; Li, R.; Zhu, J.; Zheng, Z. Recent progress of sulfur dioxide removal technology in exhaust gas purification plant. Mod. Chem. Ind. 2015, 35, 62–65. [Google Scholar]
- Yan, K.; Liu, W.C.; Kang, Z.S. Application of new double alkali flue gas desulfurization technology in engineering. In Proceedings of the 2018 Annual Meeting of the Chinese Society for Environmental Sciences, Hefei, China, 3–5 August 2018. [Google Scholar]
- Chen, J.; Wang, B.; Yuan, K. Cu-SAPO-34/SiC catalytic membrance was prepared by one-step hydrothermal method for simulataneous removal of nitrogen oxides and particulate pollutants. In Proceedings of the 25th Symposium on Air Pollution Prevention and Control Technology, Xi’an, China, 9–11 April 2021. [Google Scholar]
- Qian, M.; Dumeng, C.; Yan, Z.; Yong, Q.; Guoqi, L.; Fengjuan, C. Synthesis of magnetic Fe3O4-CeO2 NPs/GO for highly efficient nitrogen oxide removal. Chem. Res. Appl. 2019, 31, 147–152. [Google Scholar]
- Jaworek, A.; Marchewicz, A.; Sobczyk, A.; Krupa, A.; Czech, T. Two-stage electrostatic precipitators for the reduction of PM2.5 particle emission. Prog. Energy Combust. Sci. 2018, 67, 206–233. [Google Scholar] [CrossRef] [Scilit]
- Zhao, Y.; Ye, K.; Zhuang, Y.; Zheng, J. Progress of manganese catalysts for non-thermal plasma catalysis on VOCs degradation. Chem. Ind. Eng. Prog. 2020, 39, 175–184. [Google Scholar]
- Ma, S.; Lv, Y.; Lu, T.; Zang, B. Experimental Research on CO2 Capture from Simulated Flues Gas Using Ammonia Solution in Packed Towers. Proc. CSEE 2013, 33, 27–32. [Google Scholar]
- Zheng, C.; Li, X.; Li, J.; Duan, J.; Wu, H.; Zhu, F. Investigation on the ammonia emission characteristics in coal-fired power plants of China. Fuel 2022, 314, 123046. [Google Scholar] [CrossRef] [Scilit]
- Li, H.; Li, X.; Lv, X.; Zi, X.; Liu, S.; Li, F.; He, H. Synthesis of CeO2 with different methods and application of Pd/CeO2 in automotive exhaust gas treatment. Environ. Eng. 2018, 36, 218–221. [Google Scholar]
- Apte, J.S.; Marshall, J.D.; Cohen, A.J.; Brauer, M. Addressing Global Mortality from Ambient PM2.5. Environ. Sci. Technol. 2015, 49, 8057–8066. [Google Scholar] [CrossRef] [Scilit]
- Dedoussi, I.C.; Eastham, S.D.; Monier, E.; Barrett, S. Premature mortality related to United States cross-state air pollution. Nature 2020, 578, 261–265. [Google Scholar] [CrossRef] [Scilit]
- Chang, S.; Yang, X.; Zheng, H.; Wang, S.; Zhang, X. Air quality and health co-benefits of China’s national emission trading system. Appl. Energy 2020, 261, 114226. [Google Scholar] [CrossRef] [Scilit]
- Wu, R.; Dai, H.; Geng, Y.; Xie, Y.; Masui, T.; Liu, Z.; Qian, Y. Economic Impacts from PM2.5 Pollution-Related Health Effects: A Case Study in Shanghai. Environ. Sci. Technol. 2017, 51, 5035–5042. [Google Scholar] [CrossRef] [Scilit]
- Cai, W.; Hui, J.; Wang, C.; Zheng, Y.; Zhang, X.; Zhang, Q.; Gong, P. The lancet countdown on PM2.5 pollution-related health impacts of China’s projected carbon dioxide mitigation in the electric power generation sector under the paris agreement: A modelling study. Lancet Planet. Health 2018, 2, e151–e161. [Google Scholar] [CrossRef] [Scilit]
- Li, M.; Zhang, D.; Li, C.T.; Mulvaney, K.M.; Selin, N.E.; Karplus, V.J. Air quality co-benefits of carbon pricing in China. Nat. Clim. Change 2018, 8, 398–403. [Google Scholar] [CrossRef] [Scilit]
- Qu, C.; Yang, X.; Zhang, D.; Zhang, X. Estimating health co-benefits of climate policies in China: An application of the Regional Emissions. Clim. Change Econ. 2020, 11, 2041004. [Google Scholar] [CrossRef] [Scilit]
- Zhang, S.; Wu, Y.; Liu, X.; Qian, J.; Chen, J.; Han, L.; Dai, H. Co-benefits of deep carbon reduction on air quality and health improvement in Sichuan Province of China. Environ. Res. 2021, 16, 095011. [Google Scholar] [CrossRef] [Scilit]
- Xie, Y.; Wu, Y.; Xie, M.; Zhang, H.; Zhang, Y. Health and economic benefit of China’s greenhouse gas mitigation by 2050. Environ. Res. 2020, 15, 104042. [Google Scholar] [CrossRef] [Scilit]
- Lu, Z.; Huang, L.; Liu, J.; Zhou, Y.; Chen, M.; Hu, J. Carbon dioxide mitigation co-benefit analysis of energy-related measures in the Air Pollution Prevention and Control Action Plan in the Jing-Jin-Ji region of China. Resour. Conserv. Recycl. X 2019, 1, 100006. [Google Scholar] [CrossRef] [Scilit]
- Yu, Y.; Jin, Z.; Li, J.; Jia, L. Low-carbon development path research on China’s power industry based on synergistic emission reduction between CO2 and air pollutants. J. Clean. Prod. 2020, 275, 123097. [Google Scholar] [CrossRef] [Scilit]
- Zhu, Y.; Huang, L.; Li, J.; Ying, Q.; Zhang, H.; Liu, X.; Liao, H.; Li, N.; Liu, Z.; Mao, Y.; et al. Sources of particulate matter in China: Insights from source apportionment studies published in 1987–2017. Environ. Int. 2018, 115, 343–357. [Google Scholar] [CrossRef] [Scilit]
- Shi, L.; Sun, J.; Lin, J.; Zhao, Y. Factor decomposition of carbon emissions in Chinese megacities. J. Environ. Sci. 2019, 75, 209–215. [Google Scholar] [CrossRef] [Scilit]
- Carroll, P.; Caulfield, B.; Ahern, A. Measuring the potential emission reductions from a shift towards public transport. Transp. Res. Part D Transp. Environ. 2019, 73, 338–351. [Google Scholar] [CrossRef] [Scilit]
- Alam, M.S.; Hyde, B.; Duffy, P.; Mcnabola, A. Analysing the Co-Benefits of transport fleet and fuel policies in reducing PM2.5 and CO2 emissions. J. Clean. Prod. 2018, 172, 623–634. [Google Scholar] [CrossRef] [Scilit]
- Hao, H.; Liu, Z.; Zhao, F.; Li, V. Natural gas as vehicle fuel in China: A review. Renew. Sustain. Energy Rev. 2016, 62, 521–533. [Google Scholar] [CrossRef] [Scilit]
- Osorio-Tejada, J.L.; Llera-Sastresa, E.; Scarpellini, S. Liquefied natural gas: Could it be a reliable option for road freight transport in the EU? Renew. Sustain. Energy Rev. 2017, 71, 785–795. [Google Scholar] [CrossRef] [Scilit]
- Shang, Y.; Sun, Z.; Cao, J.; Wang, X.; Zhong, L.; Bi, X.; Li, H.; Liu, W.; Zhu, T.; Huang, W. Systematic review of Chinese studies of short-term exposure to air pollution and daily mortality. Environ. Int. 2013, 54, 100–111. [Google Scholar] [CrossRef] [Scilit] [PubMed]
- National Health and Family Planning Commission. China Health Statistical Yearbook 2018. Available online: https://www.yearbookchina.com/navibooklist-n3018112802-1.html (accessed on 1 June 2022).
- Chen, J.; Li, W.; Cheng, H.G.; Xie, Y. Evaluation of emission reduction potentials of key air pollutants and health benefits for residents of Beijing. Res. Environ. Sci. 2015, 28, 1114–1121. [Google Scholar]
- Tong, M.K.; Xi, G.J.; Tian, M.R.; Ping, J.I. Subduction of PM2.5 by road green space in Beijing and its health benefit evaluation. China Environ. Sci. 2015, 35, 2861–2867. [Google Scholar]
- The People’s Government of Henan Province. Notice of the General Office of Henan Provincial People’s Government on Printing and Distributing the Implementation Plan of Air Pollution Prevention and Control in 2018 in Henan Province. Available online: http://www.henan.gov.cn/2018/02-23/249520.html (accessed on 1 June 2022).
- The People’s Government of Henan Province. Notice of the General Office of Henan Provincial People’s Government on Printing and Distributing the Implementation Plan of Controlling Greenhouse Gas Emission in the 13th Five Year Plan of Henan Province. Available online: http://www.henan.gov.cn/2017/04-20/248915.html (accessed on 1 June 2022).
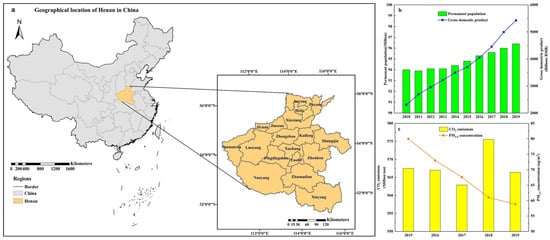
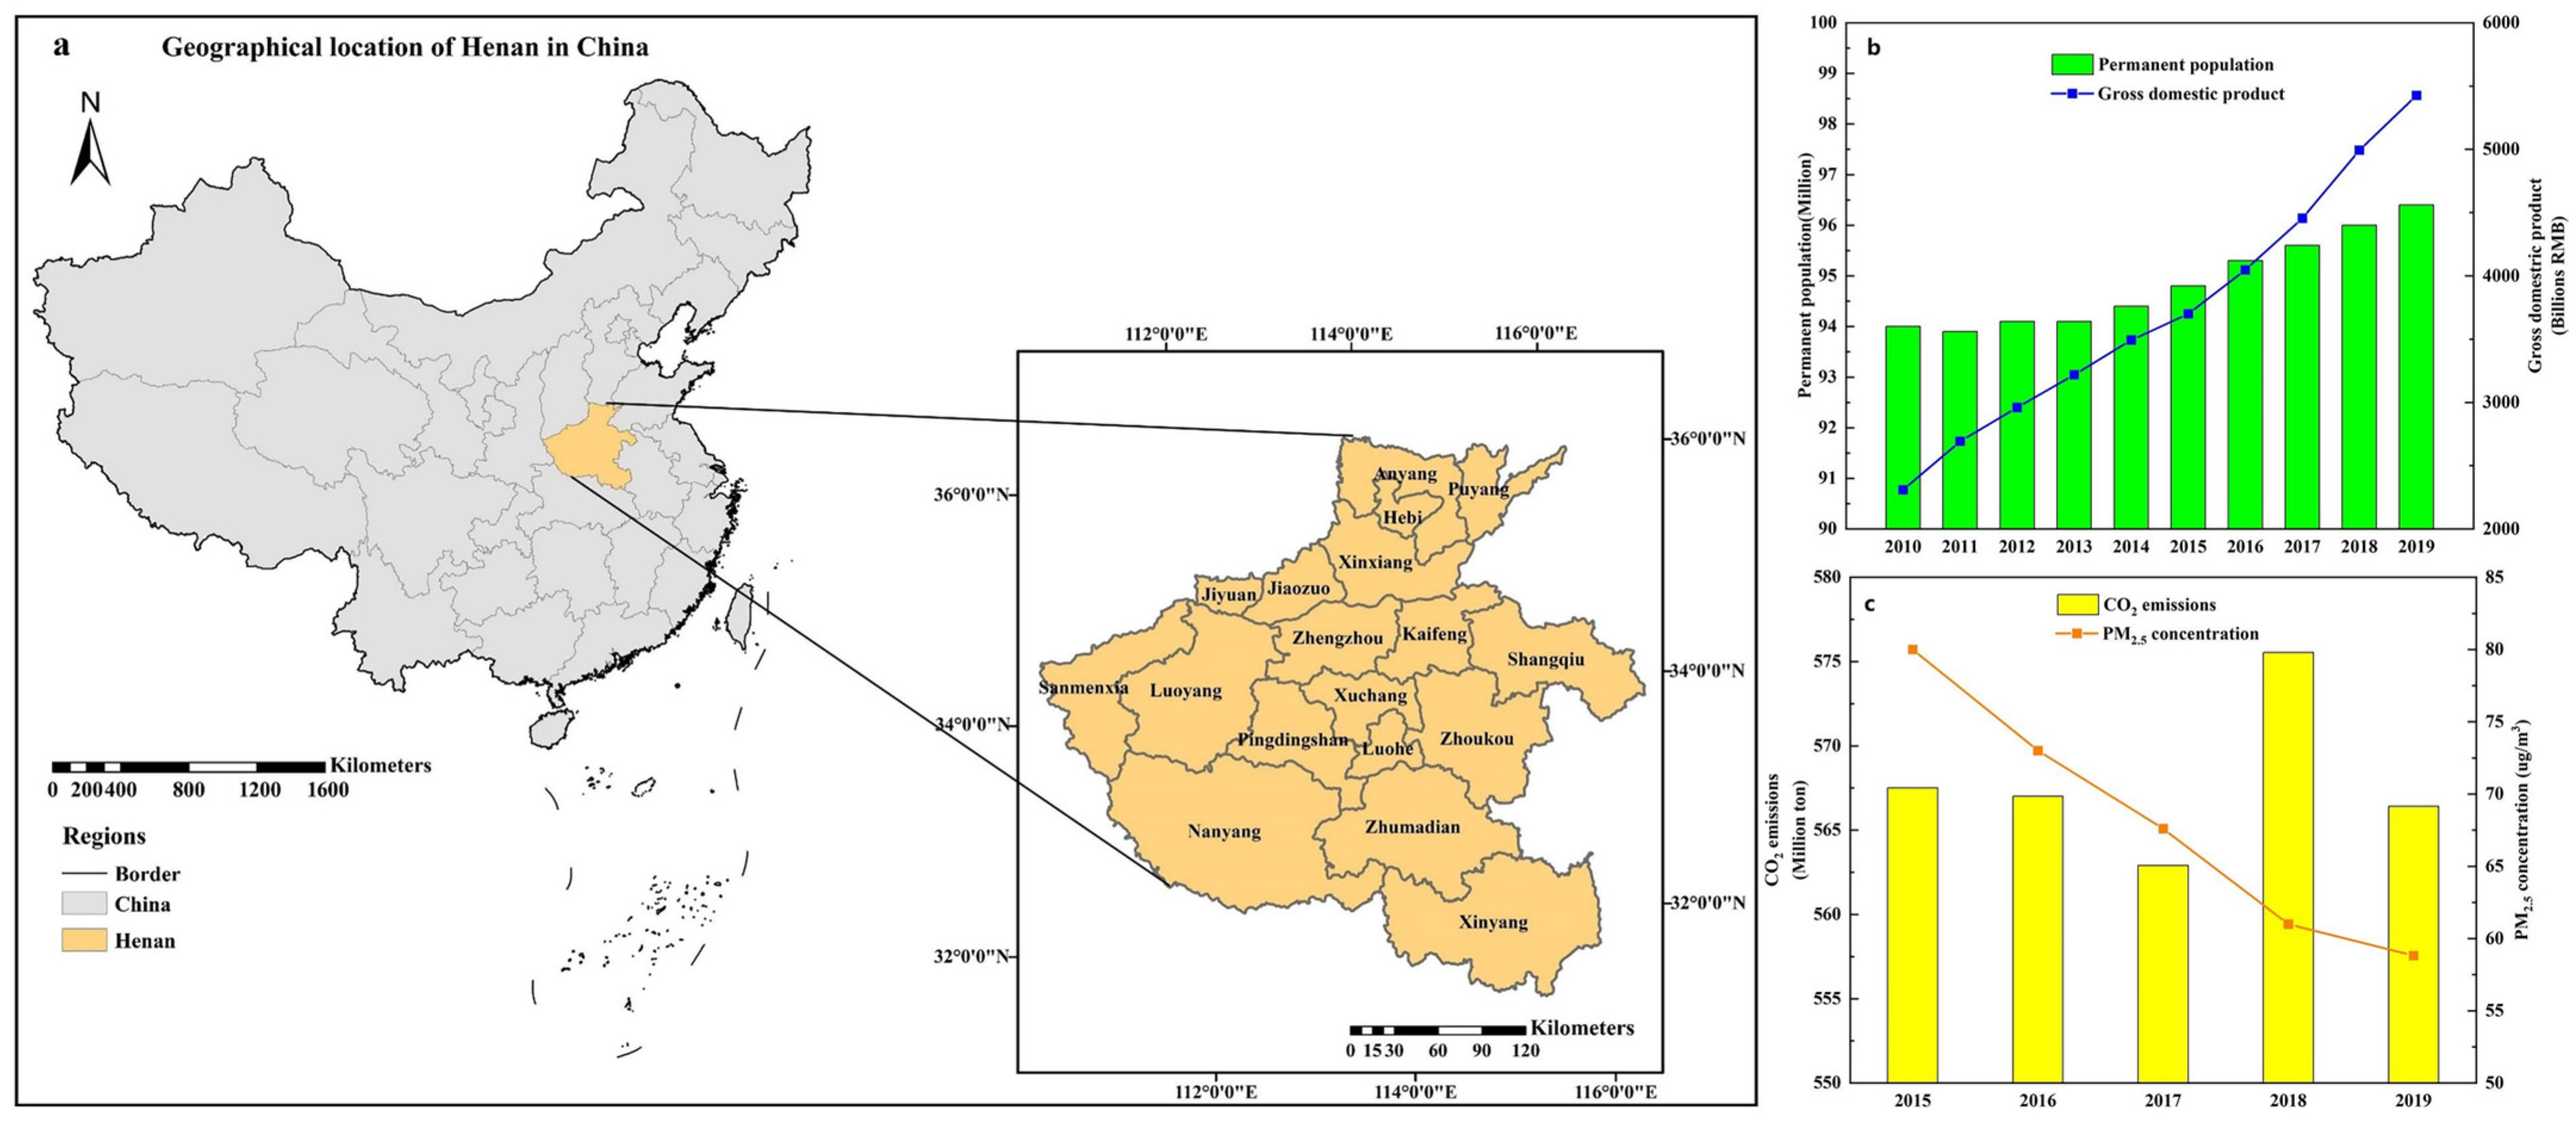
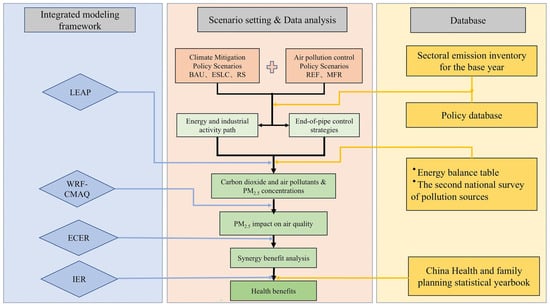
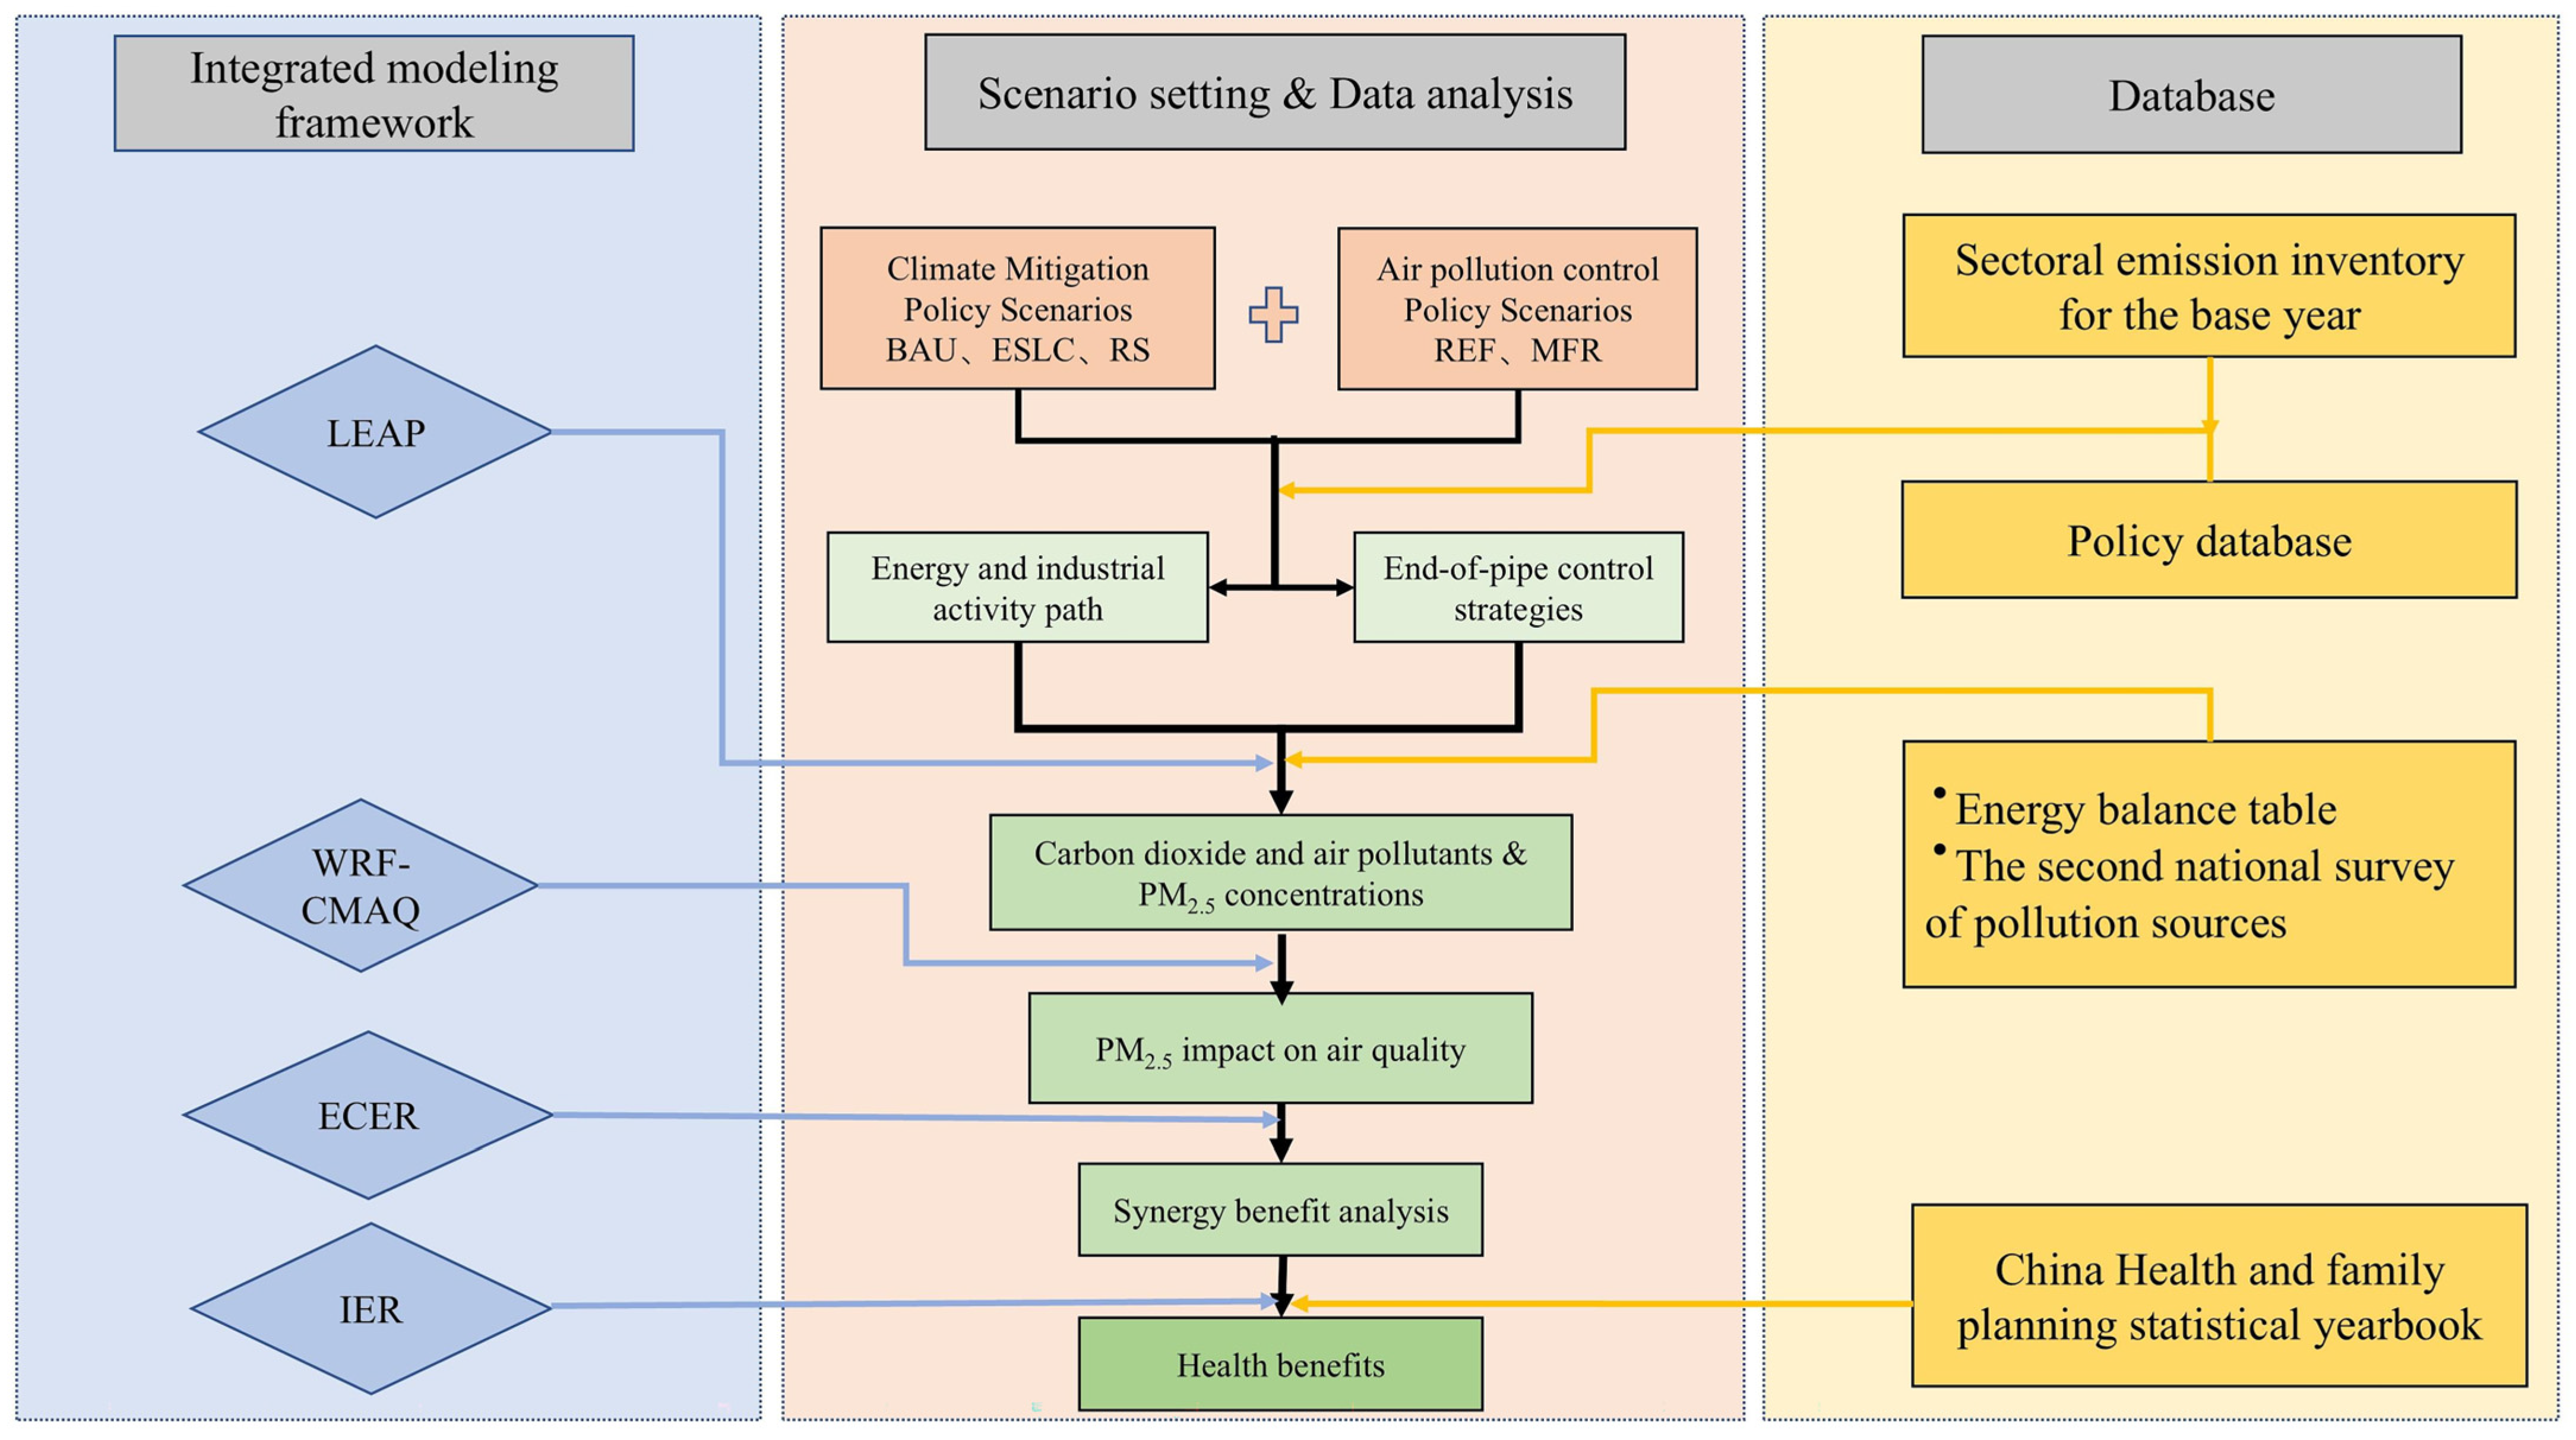
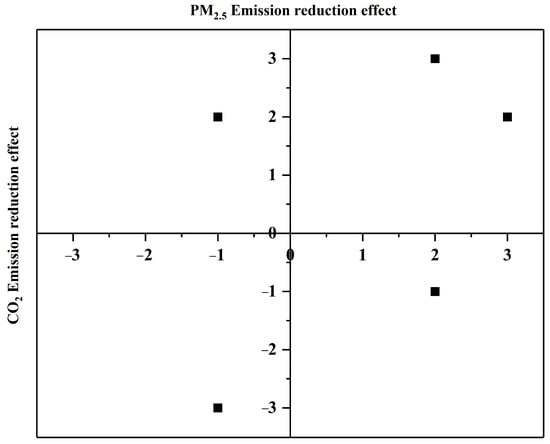
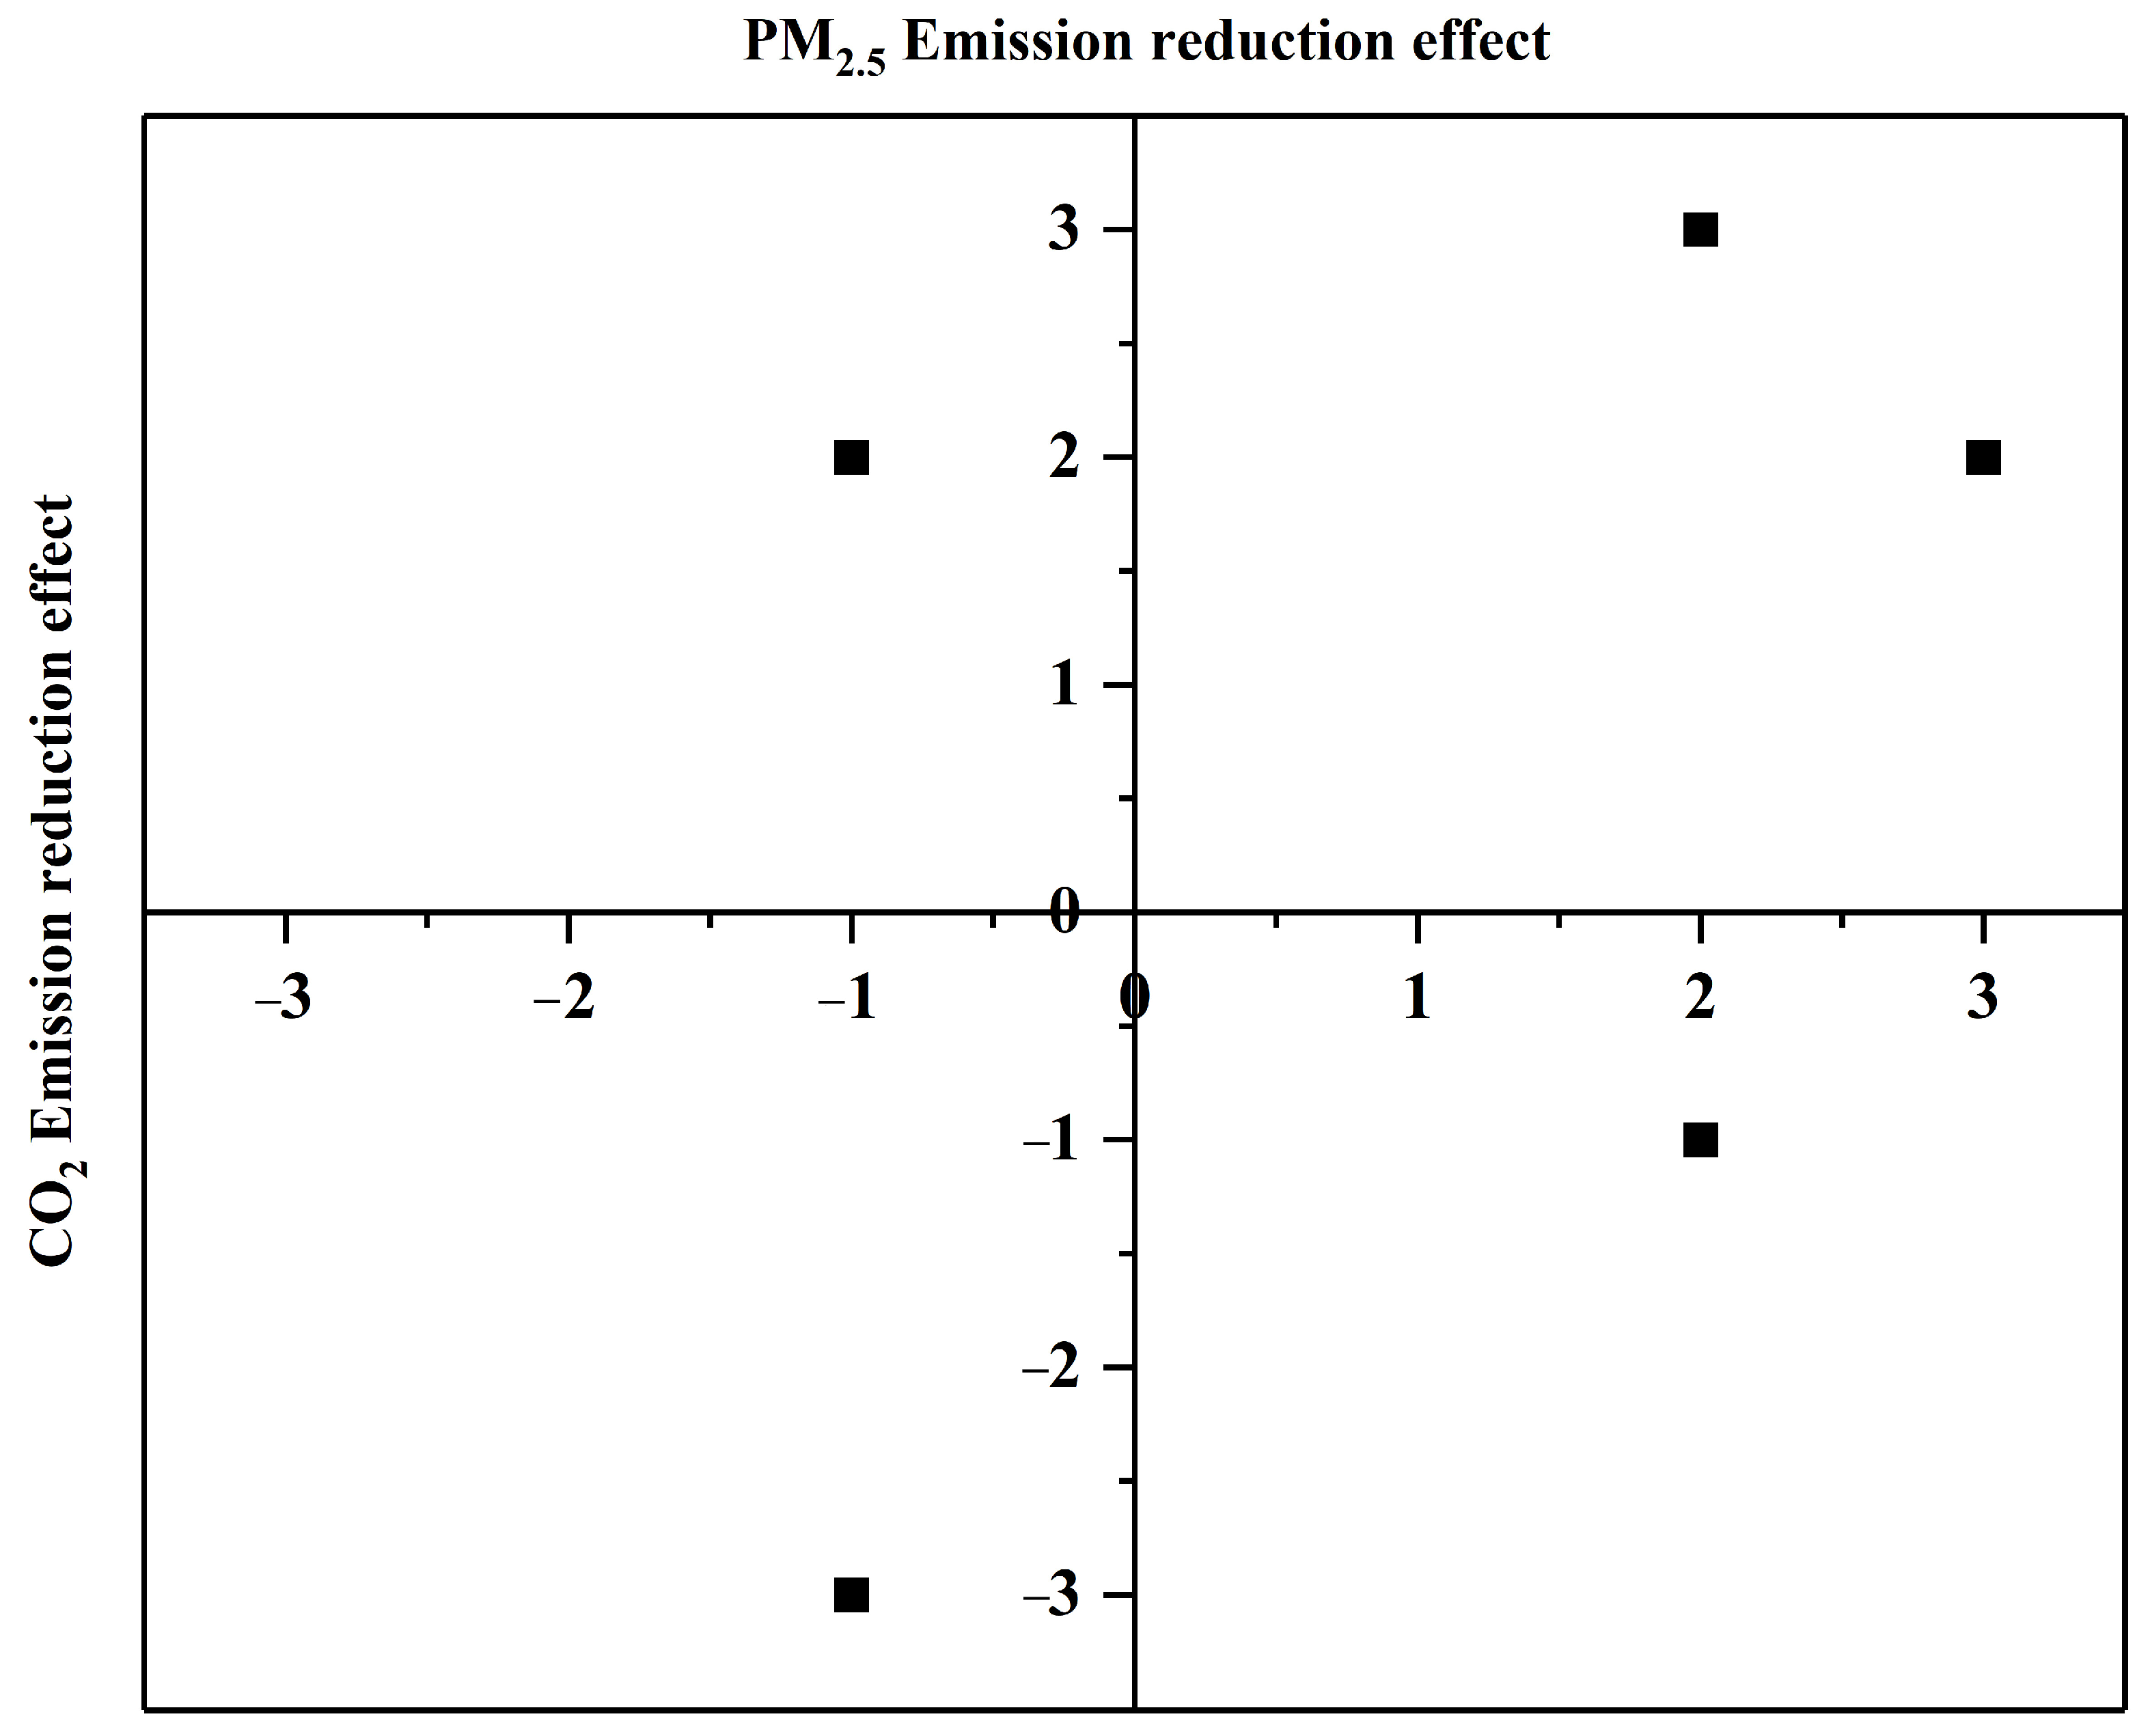
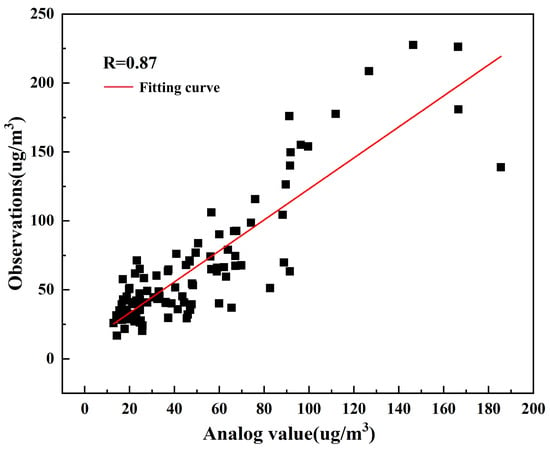
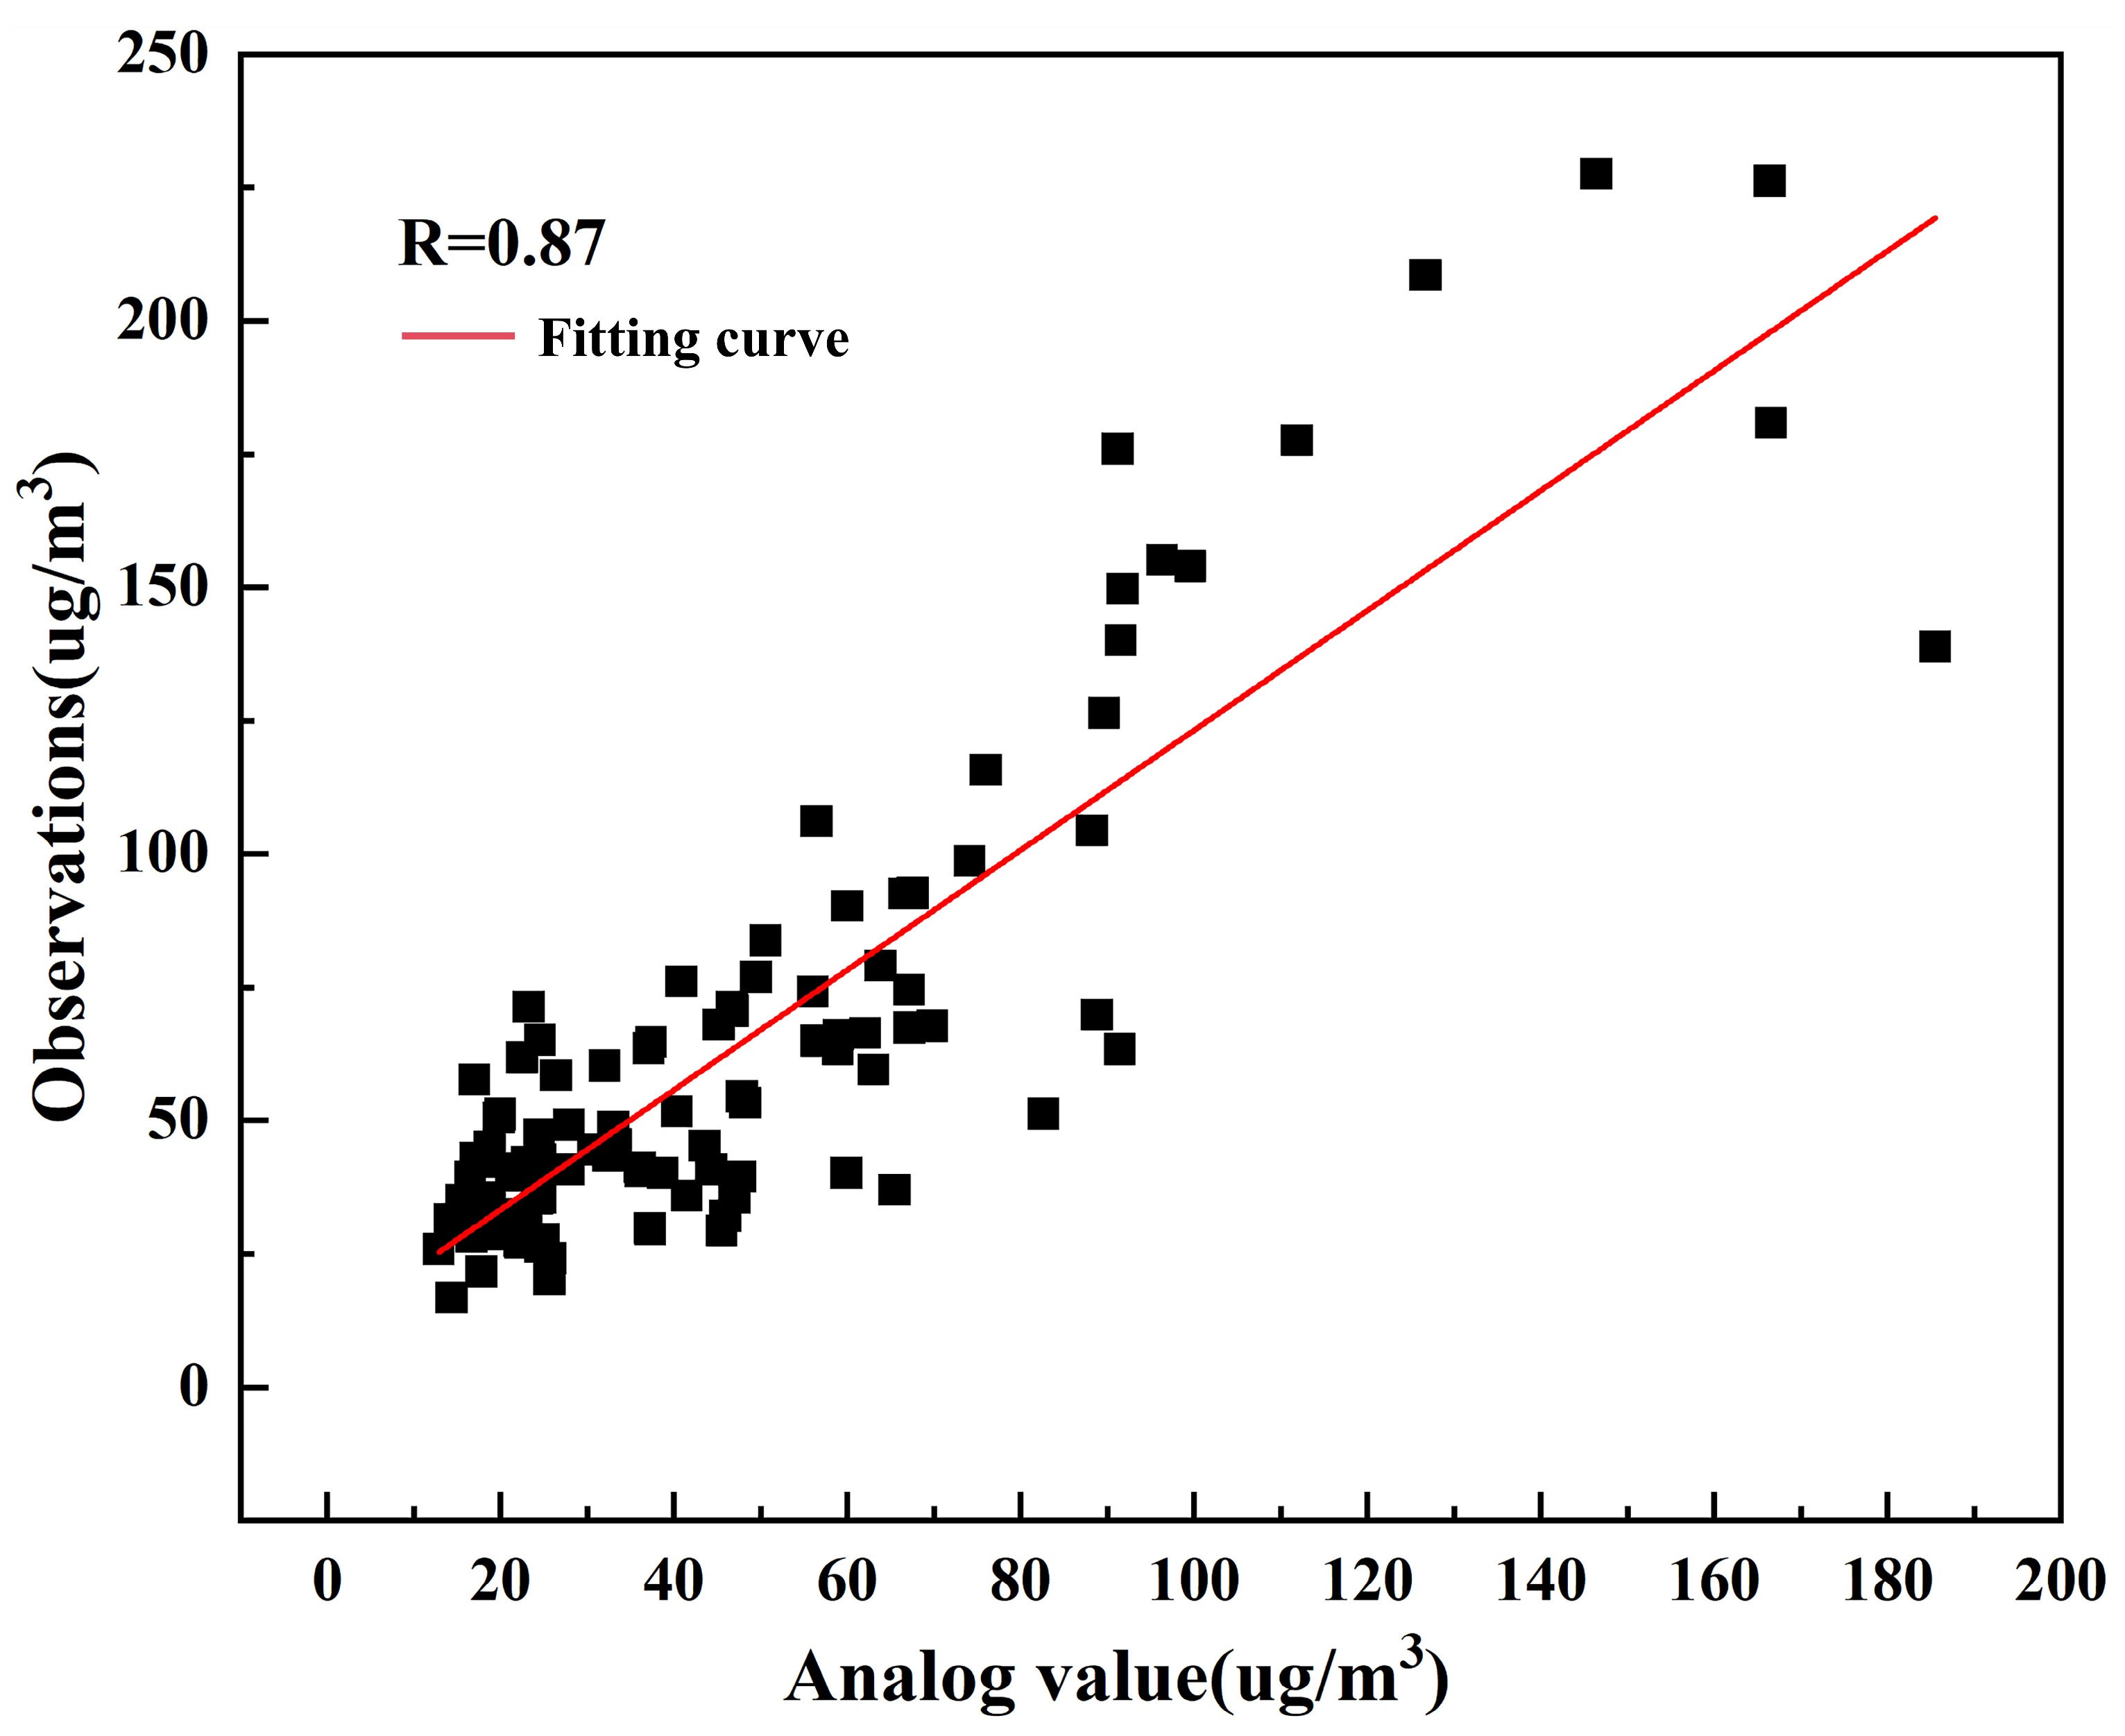
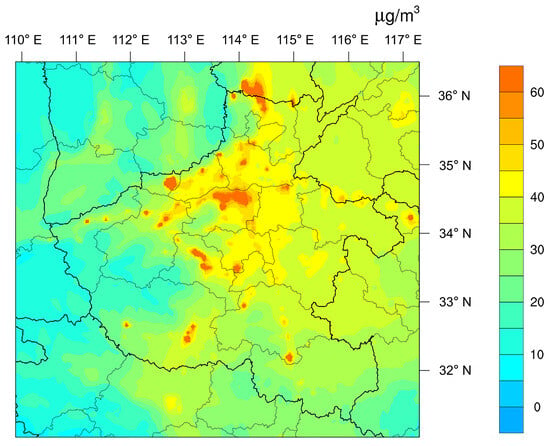
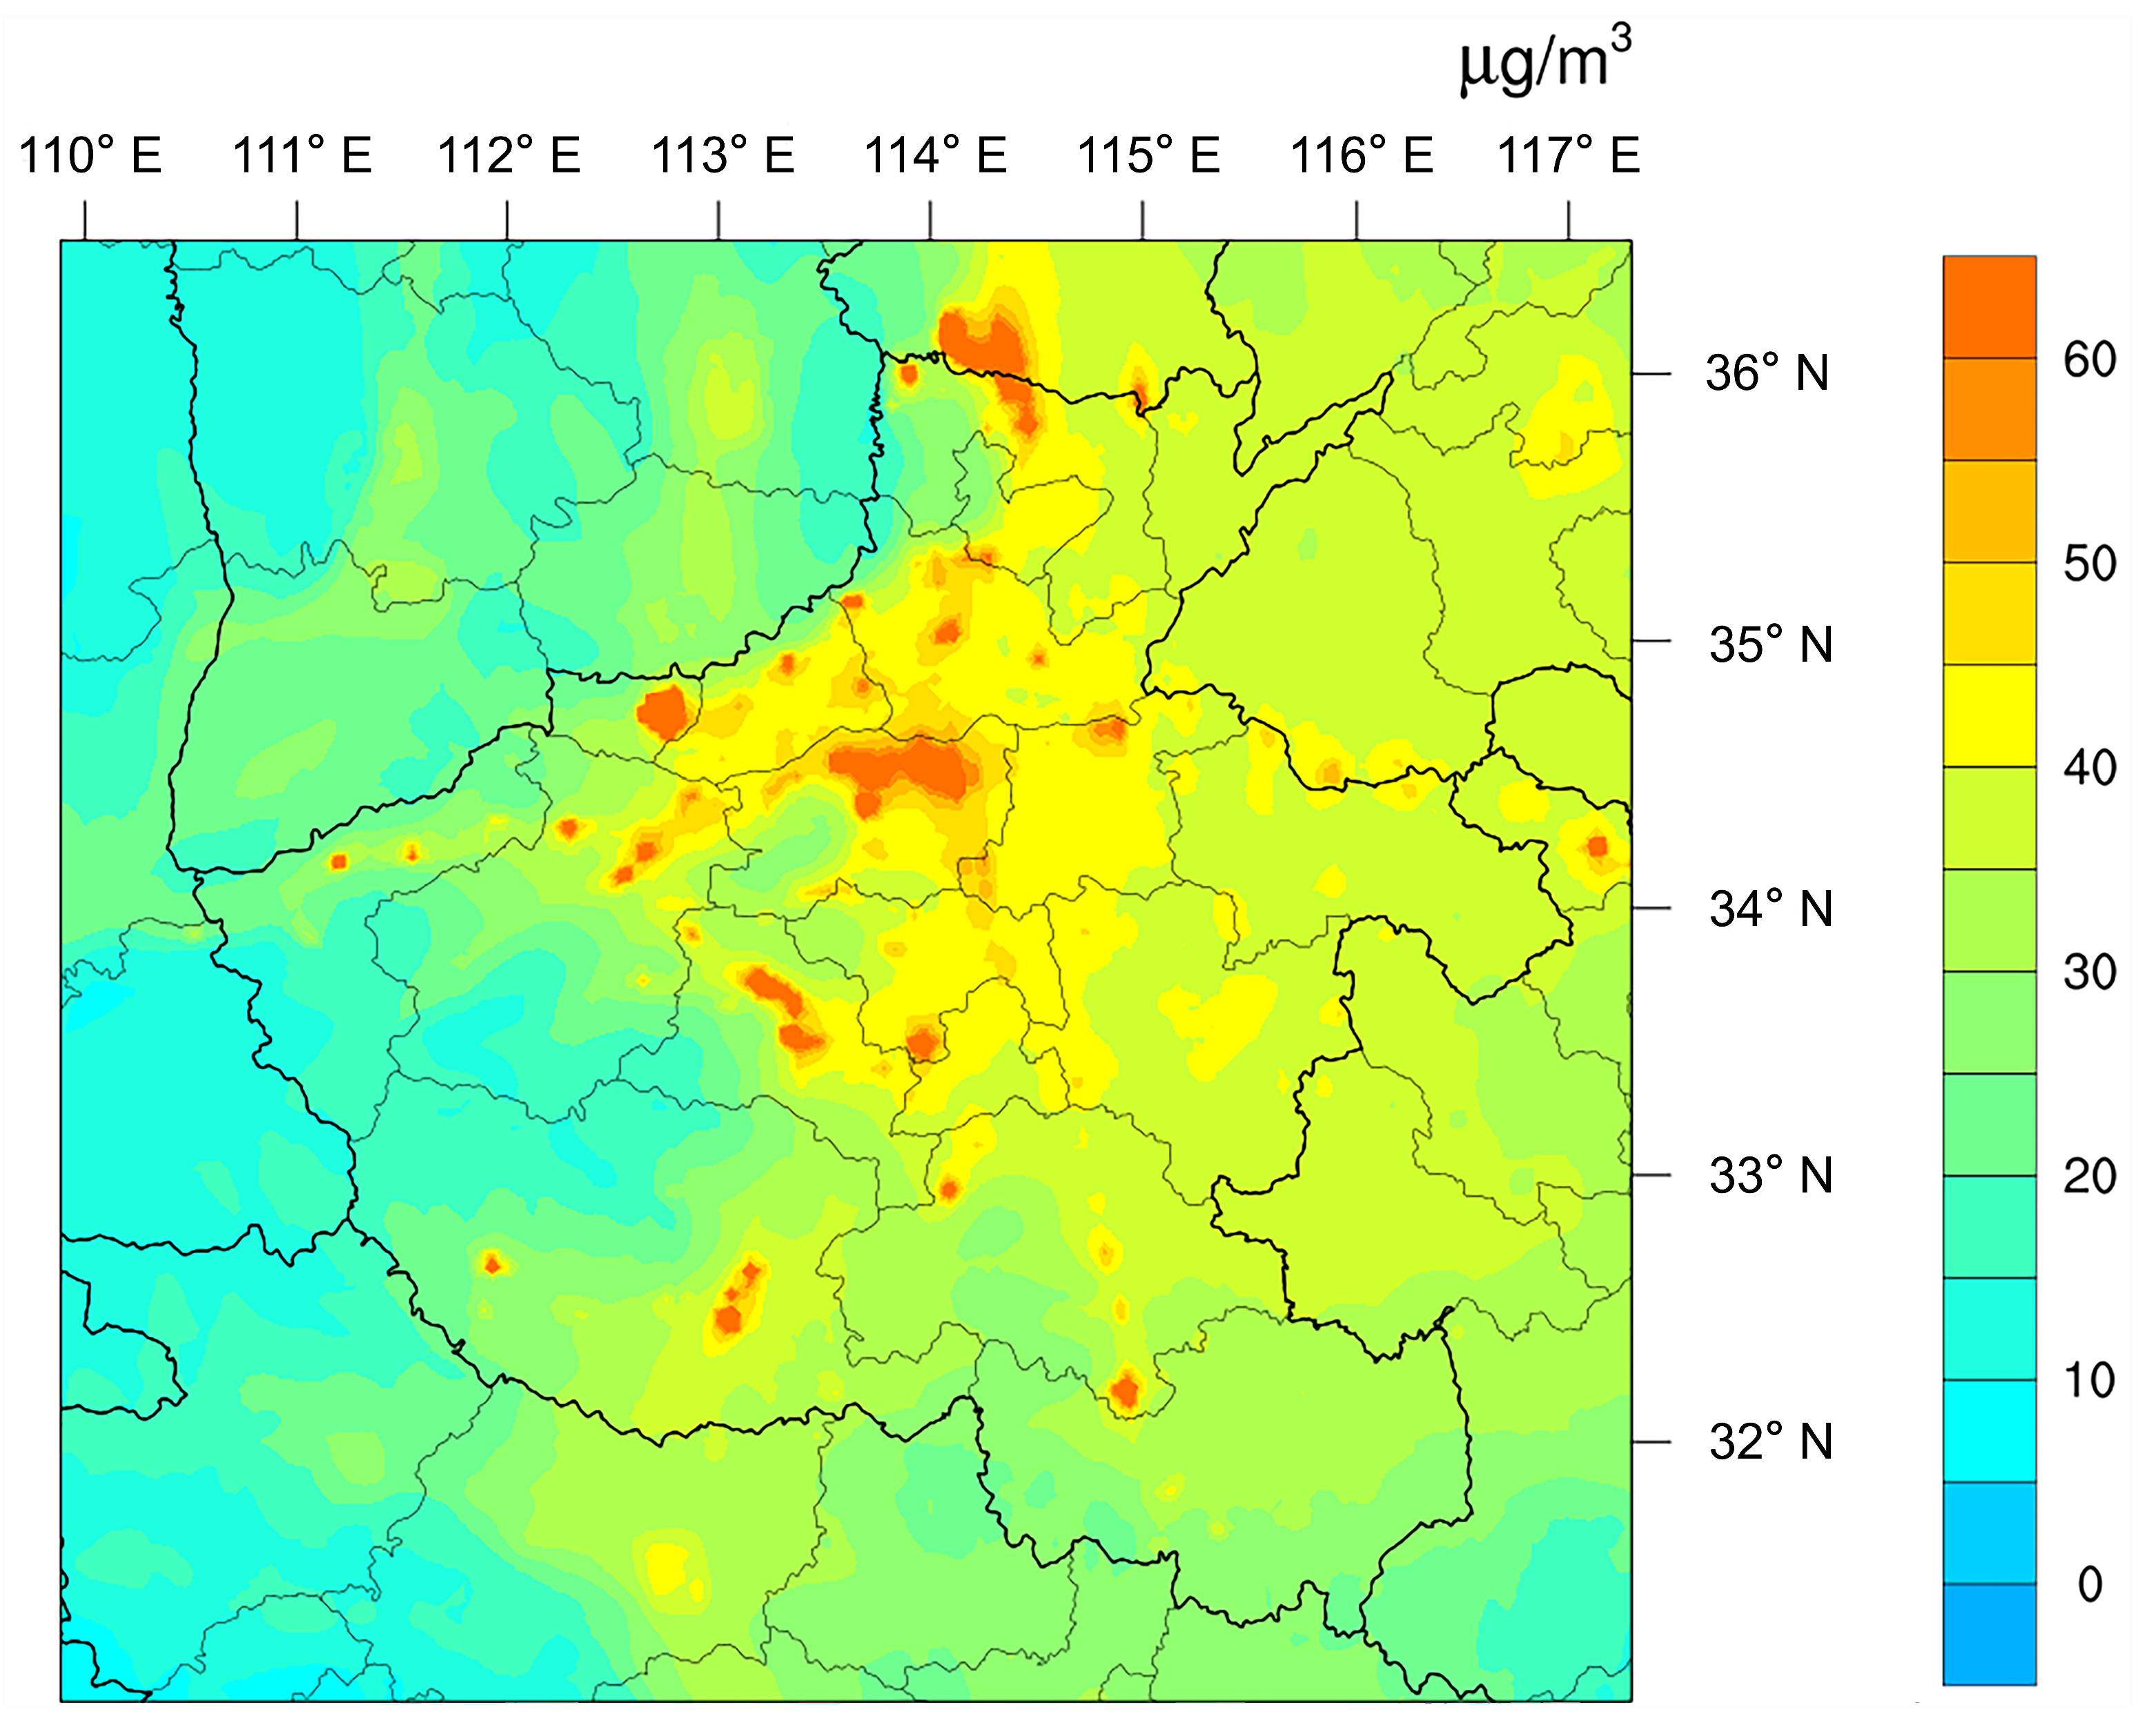
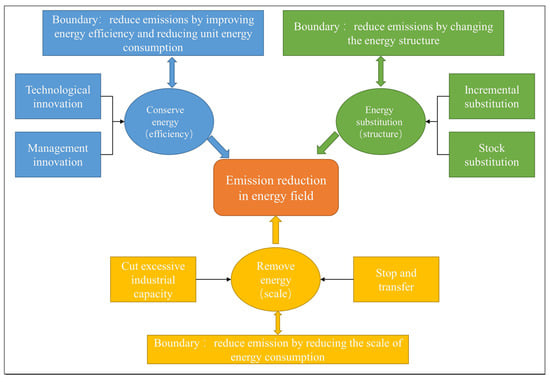
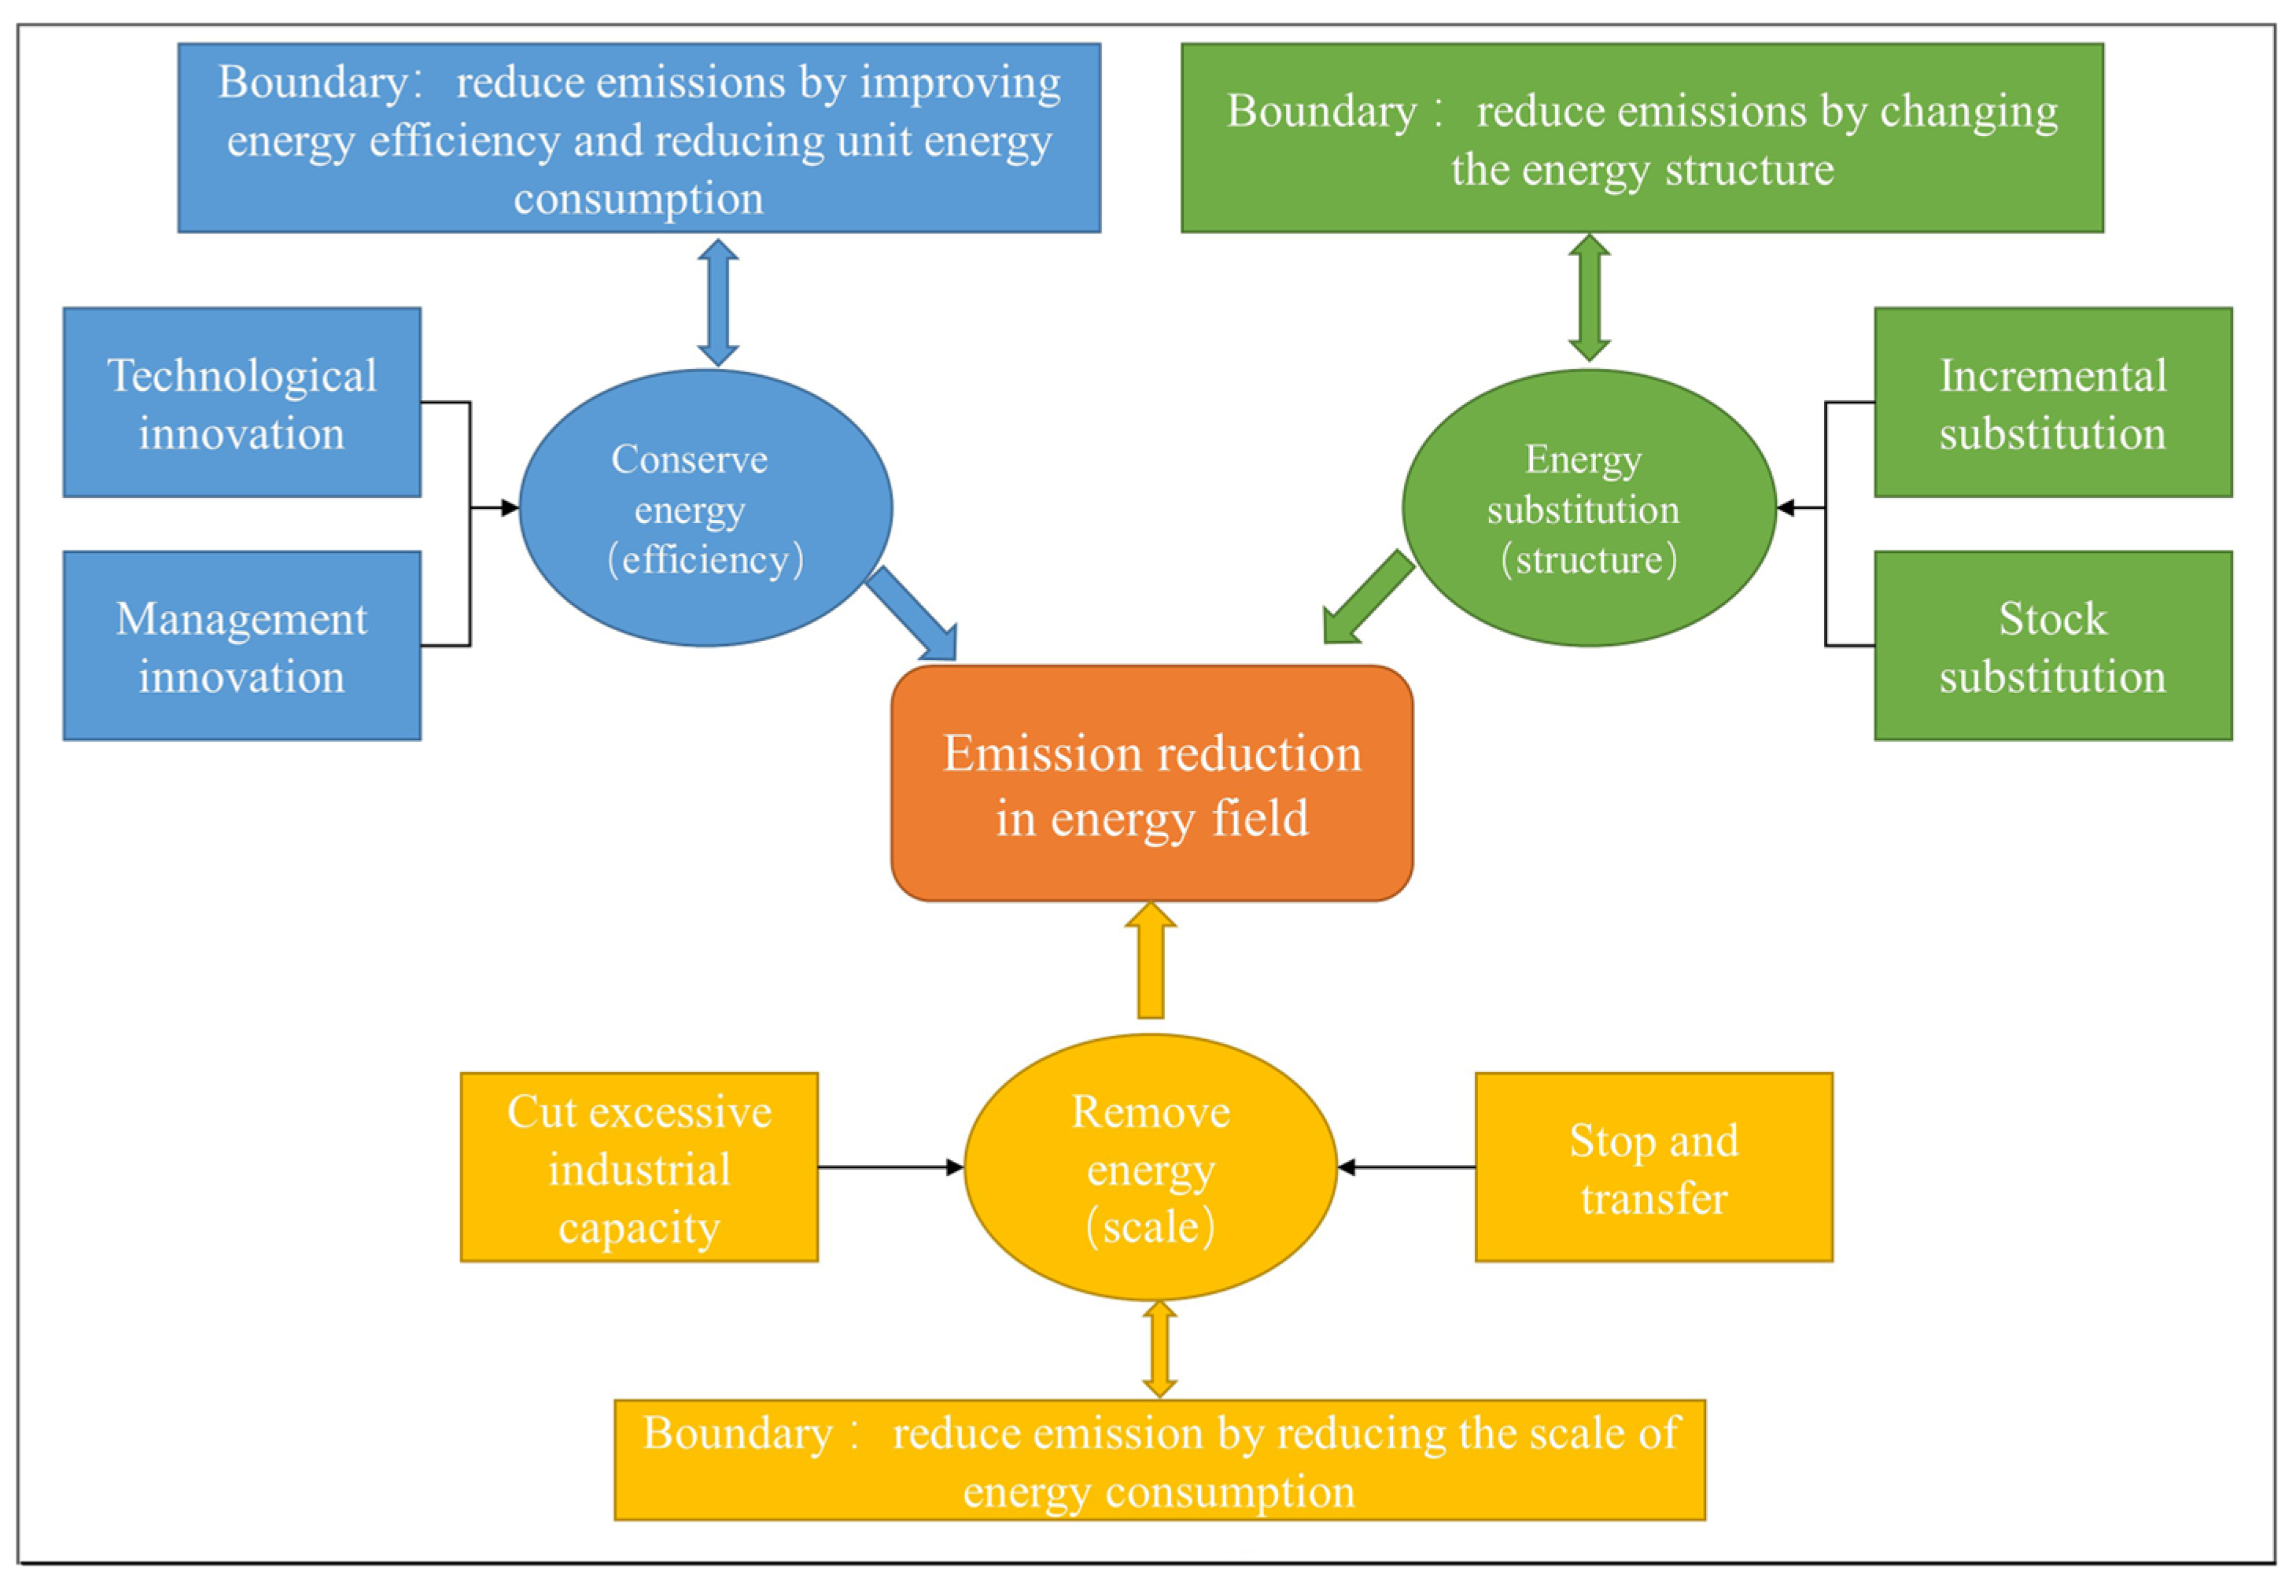
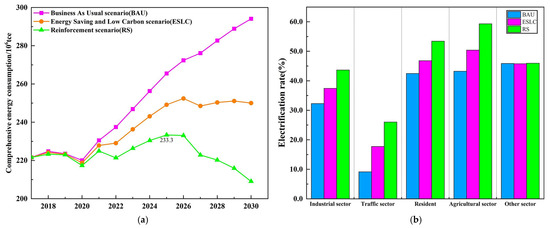
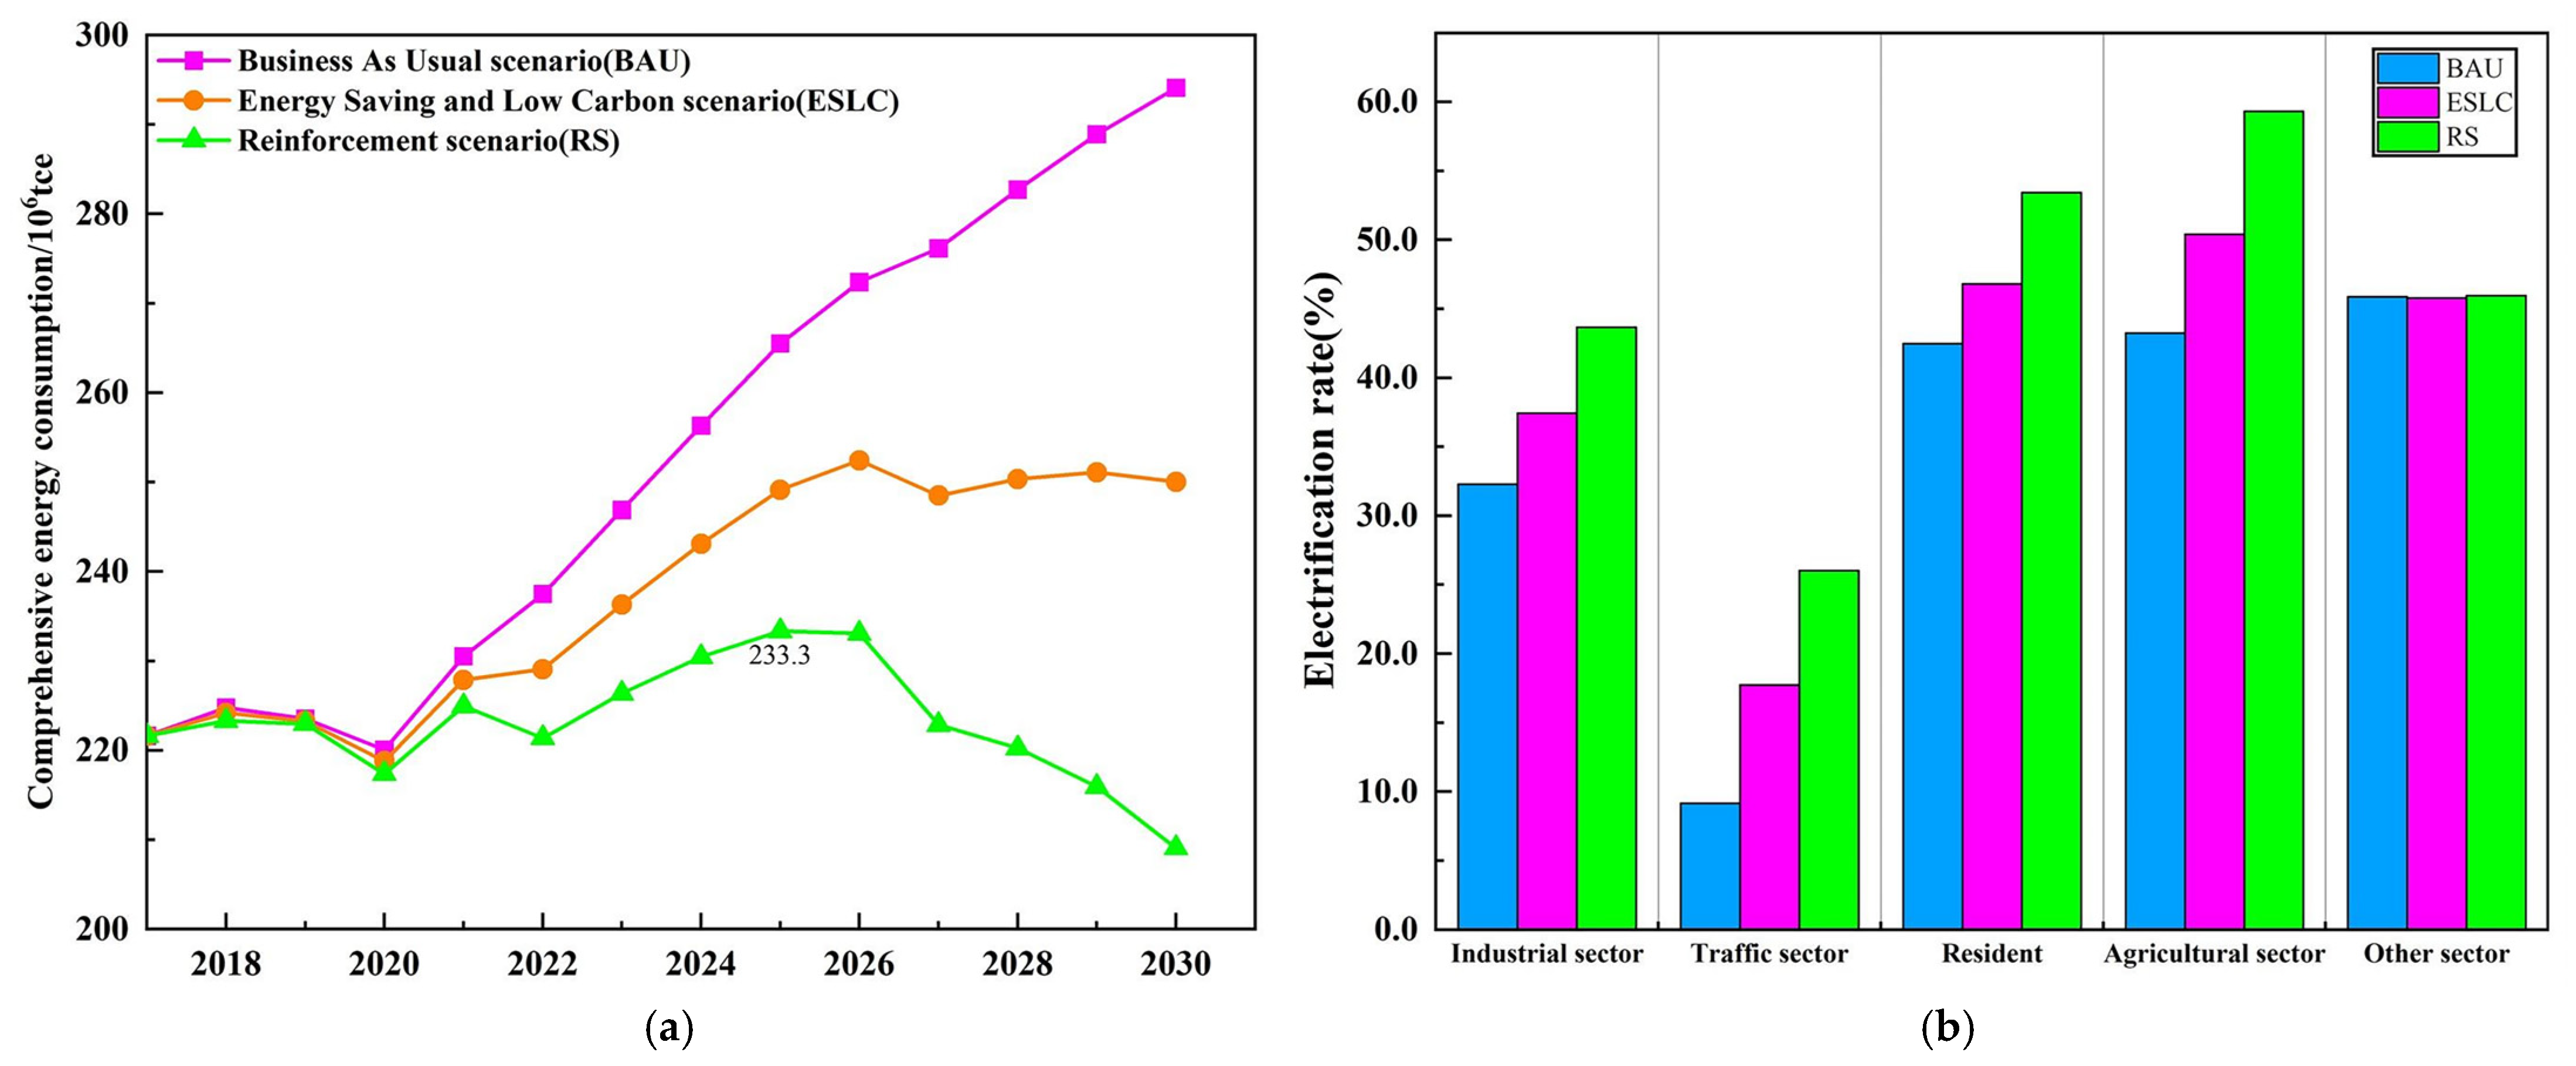
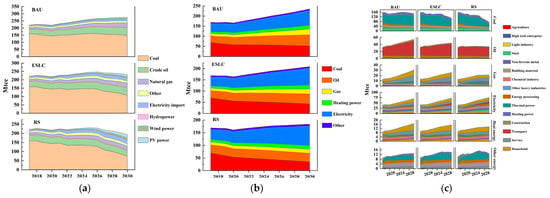
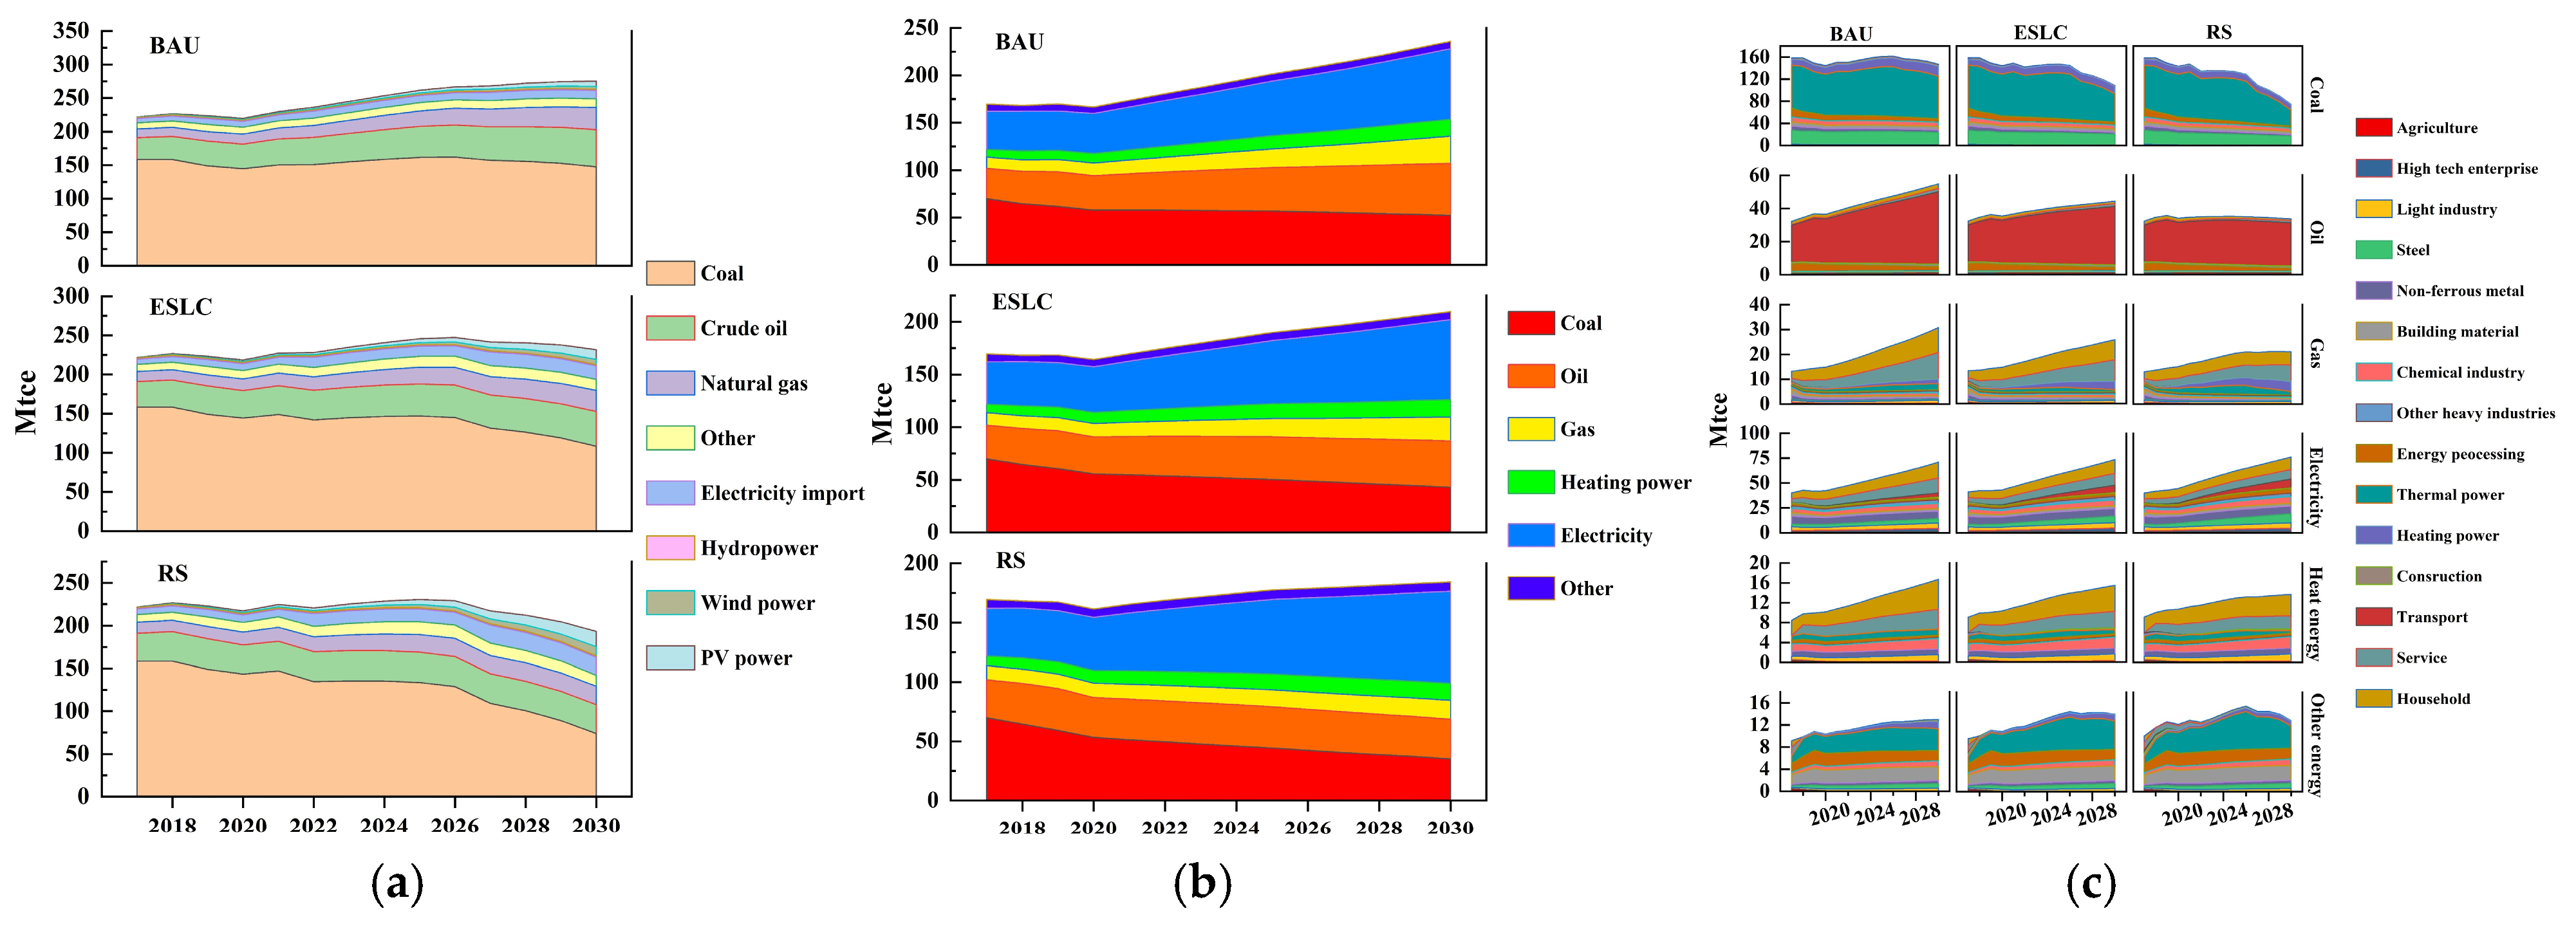
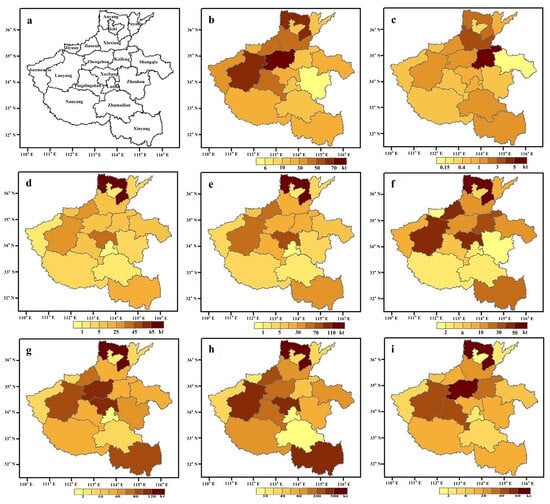
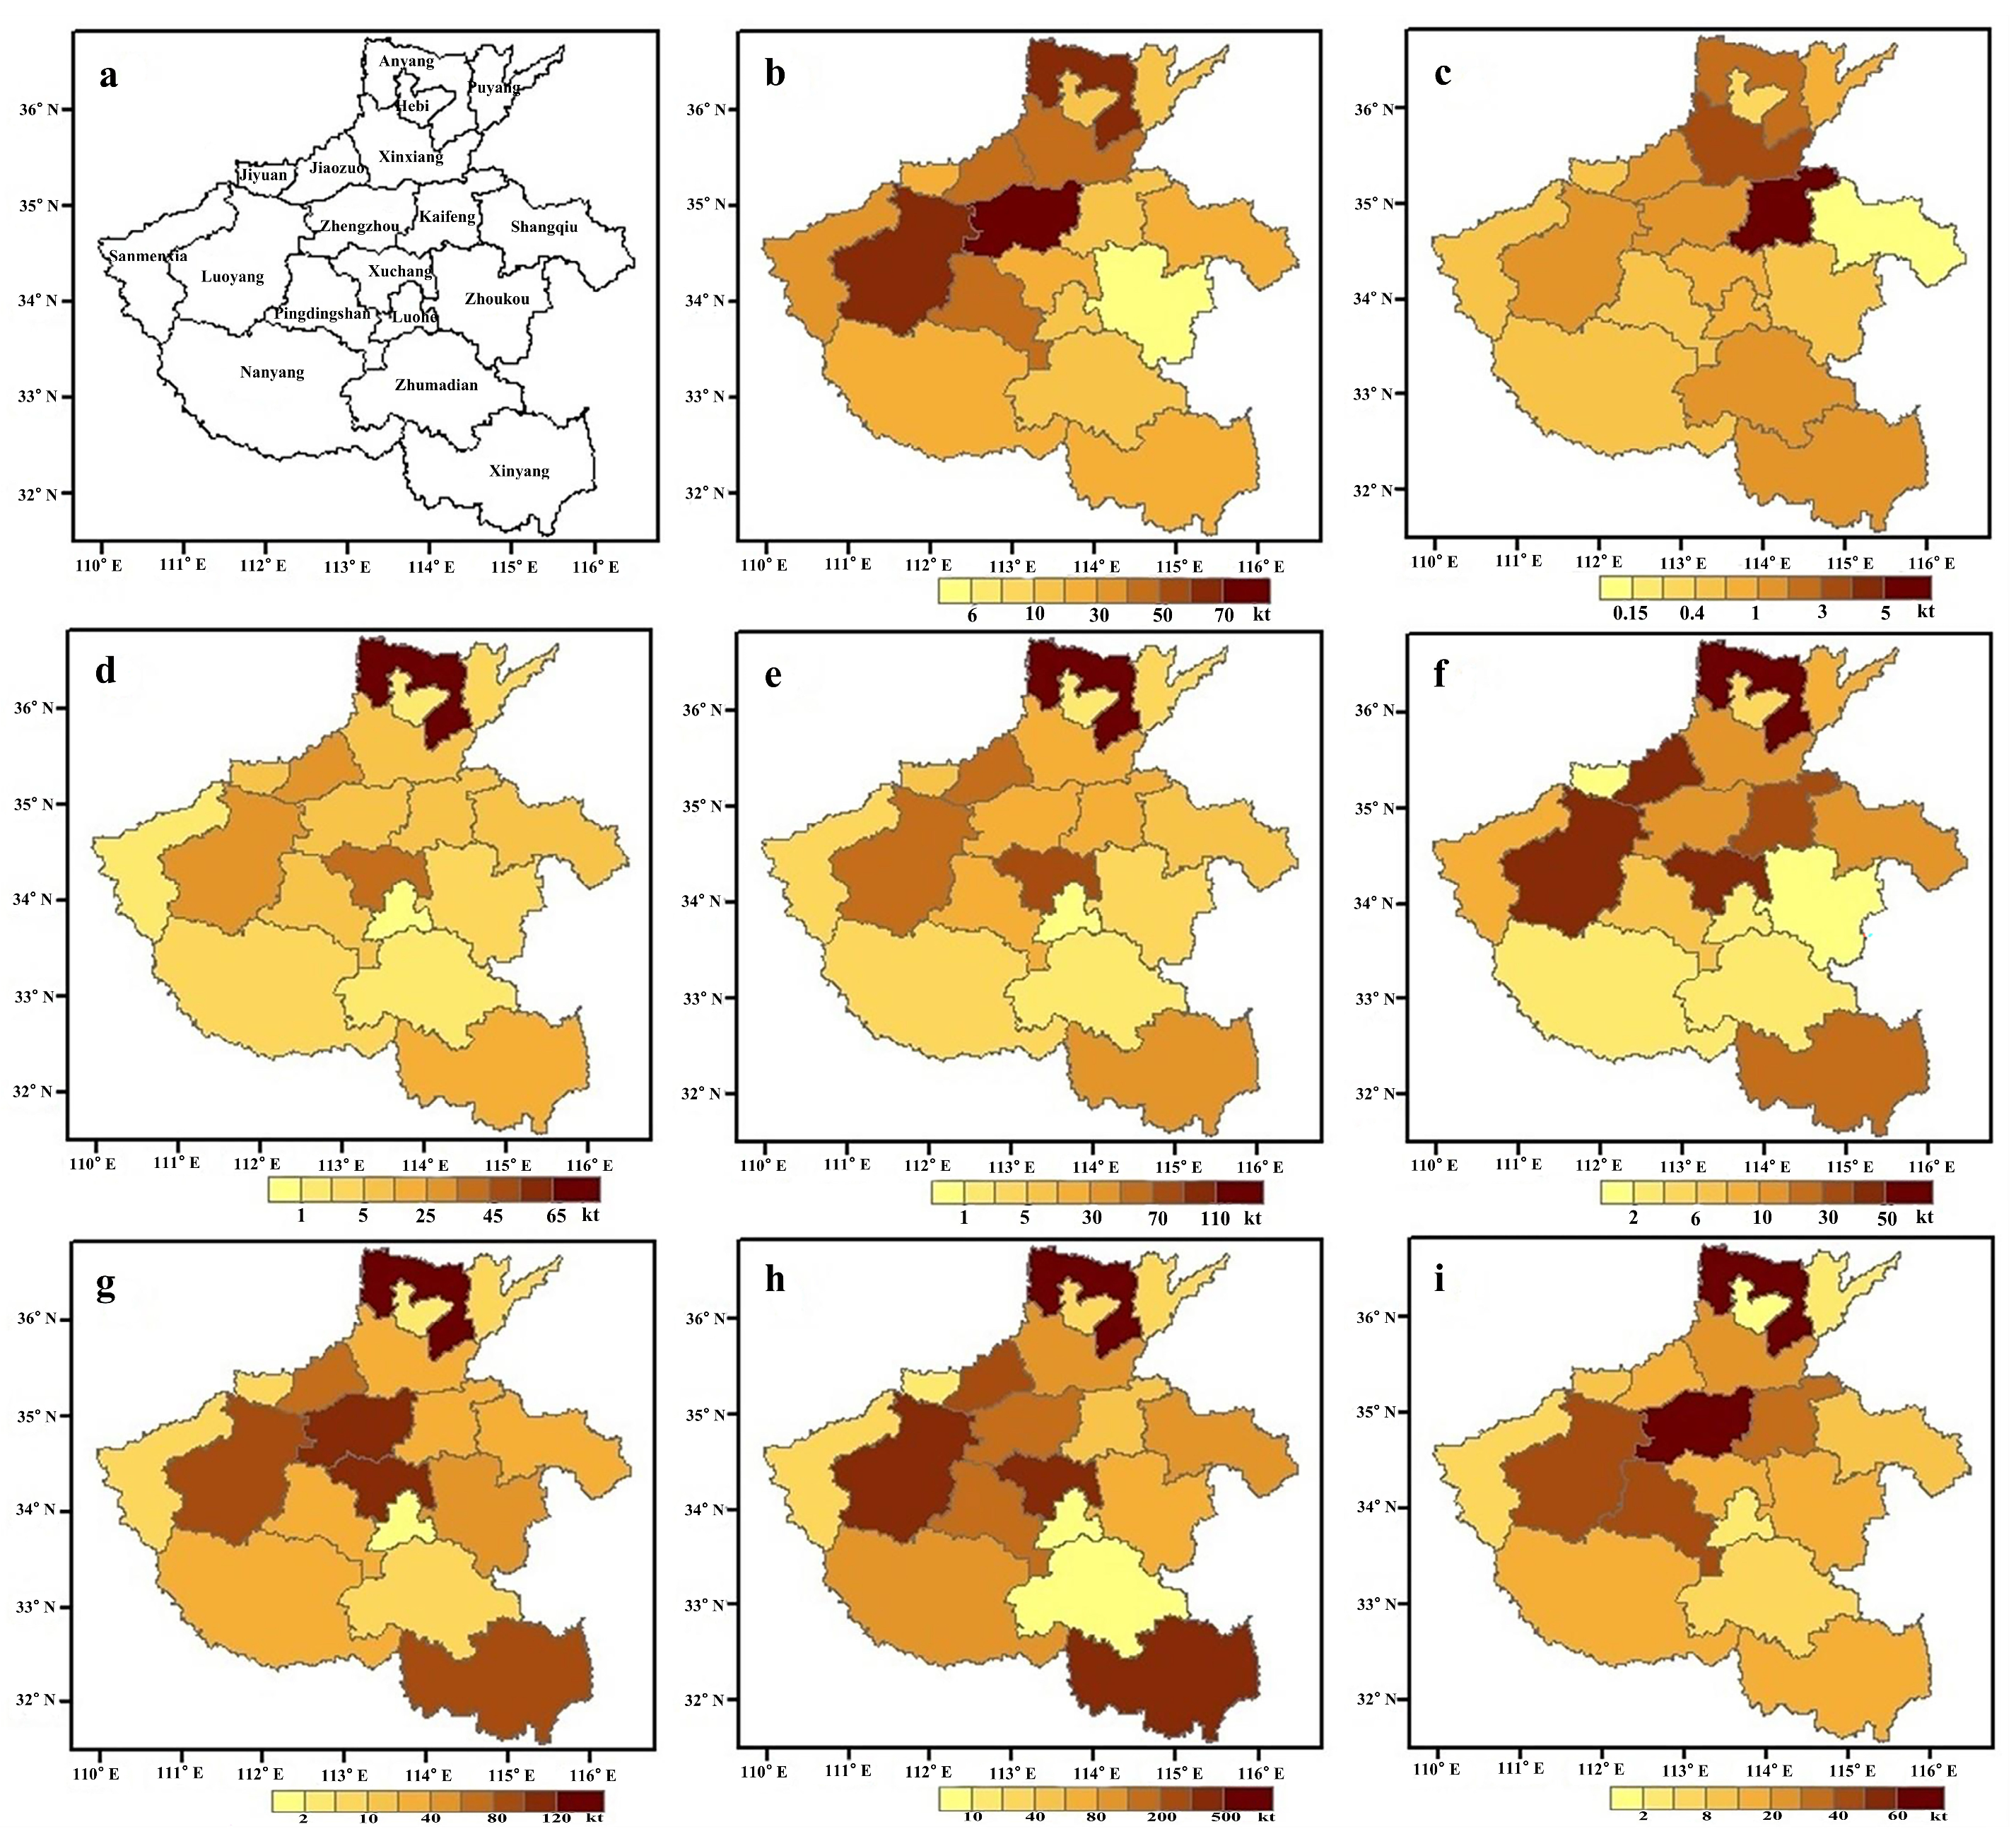
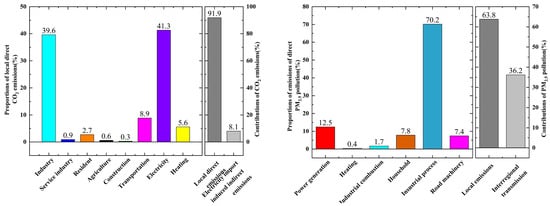
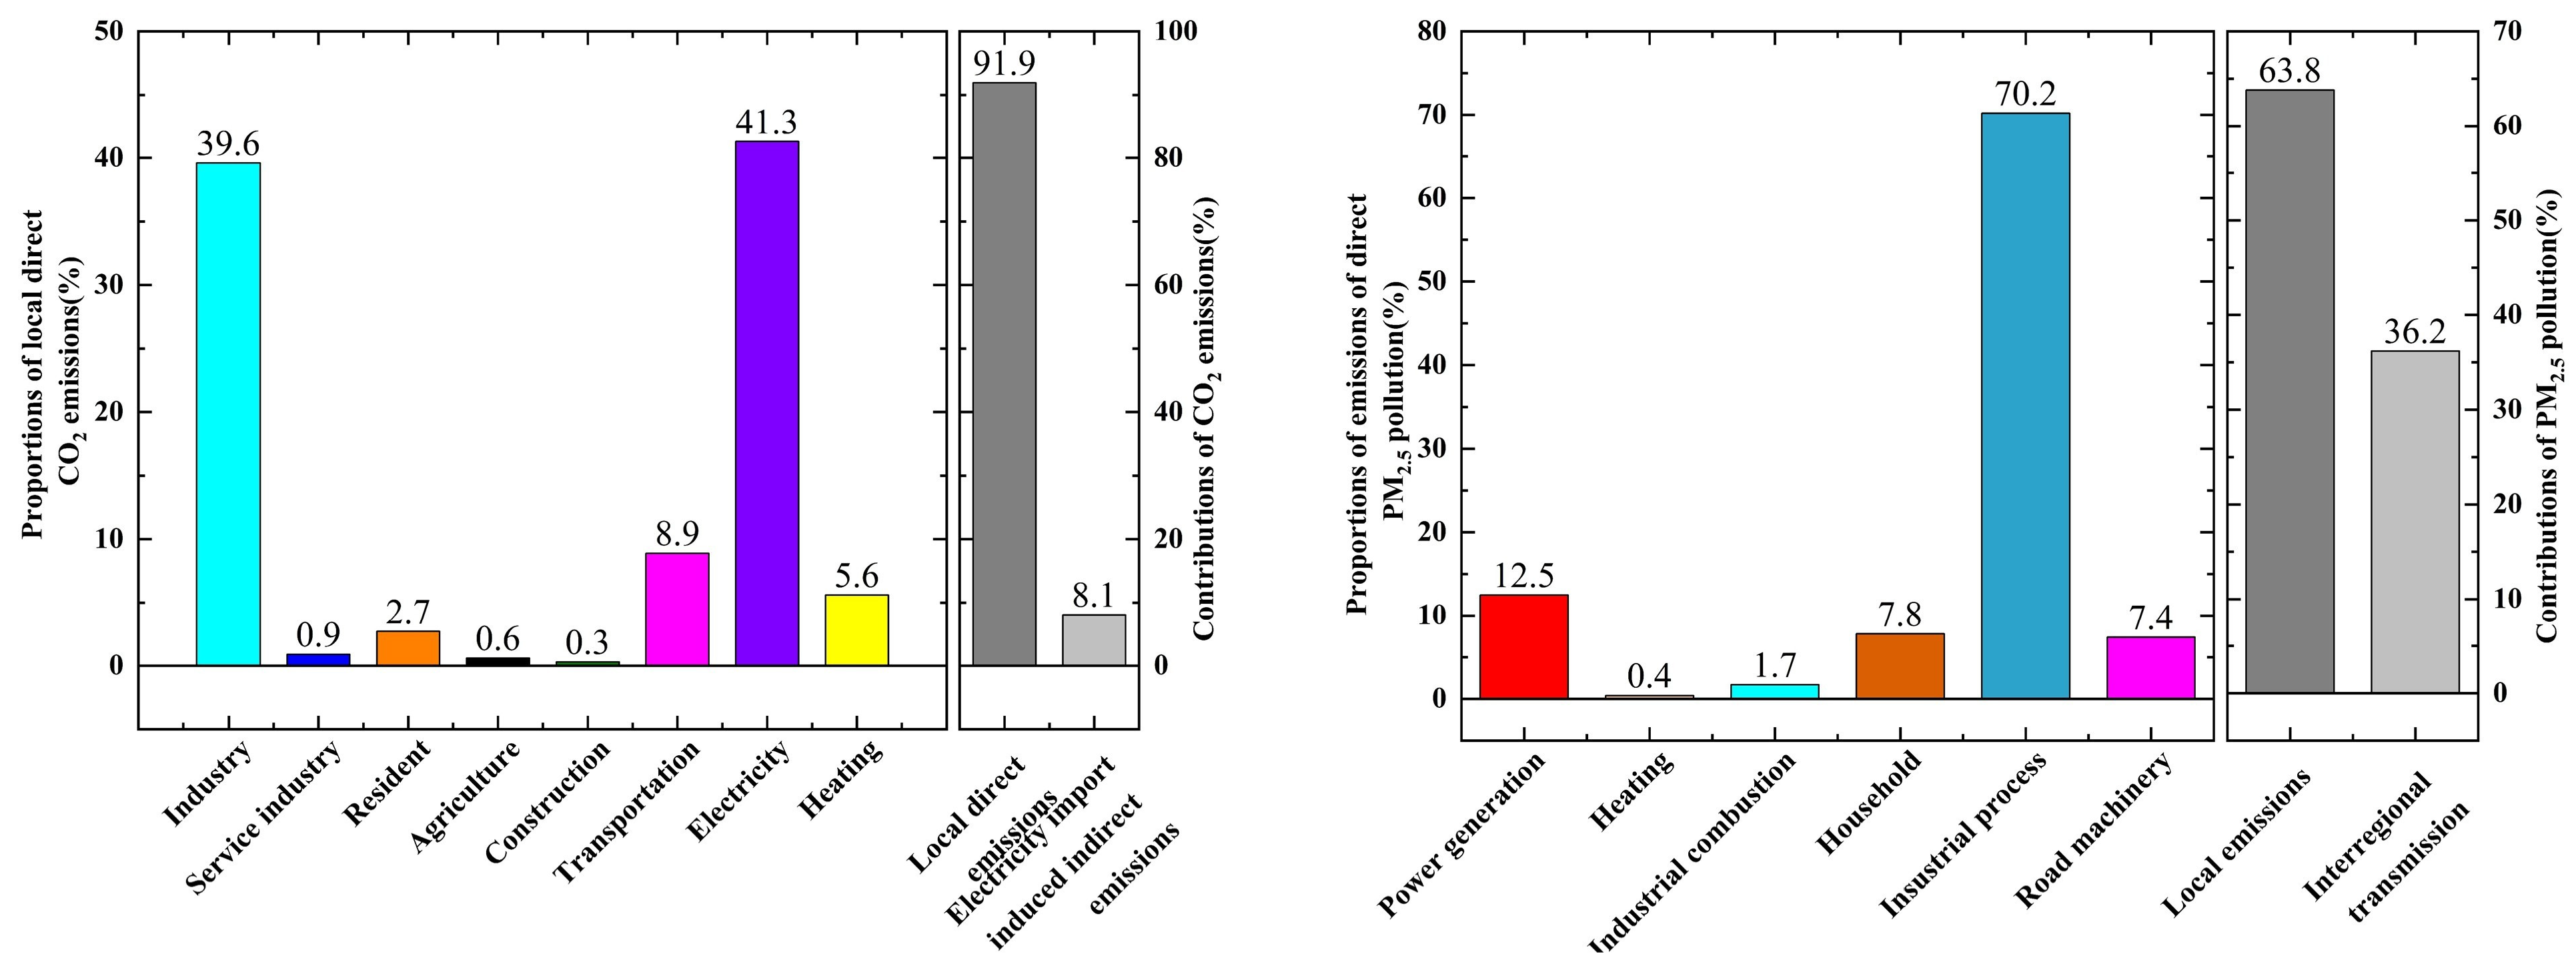
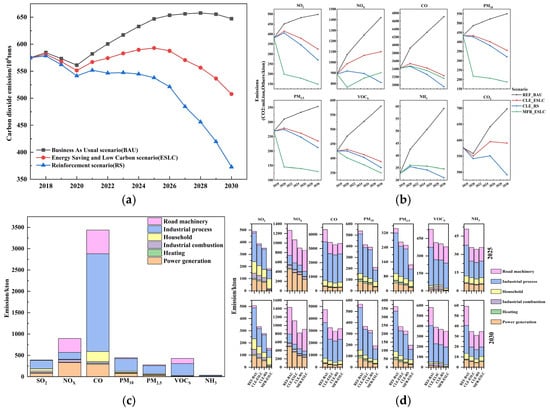
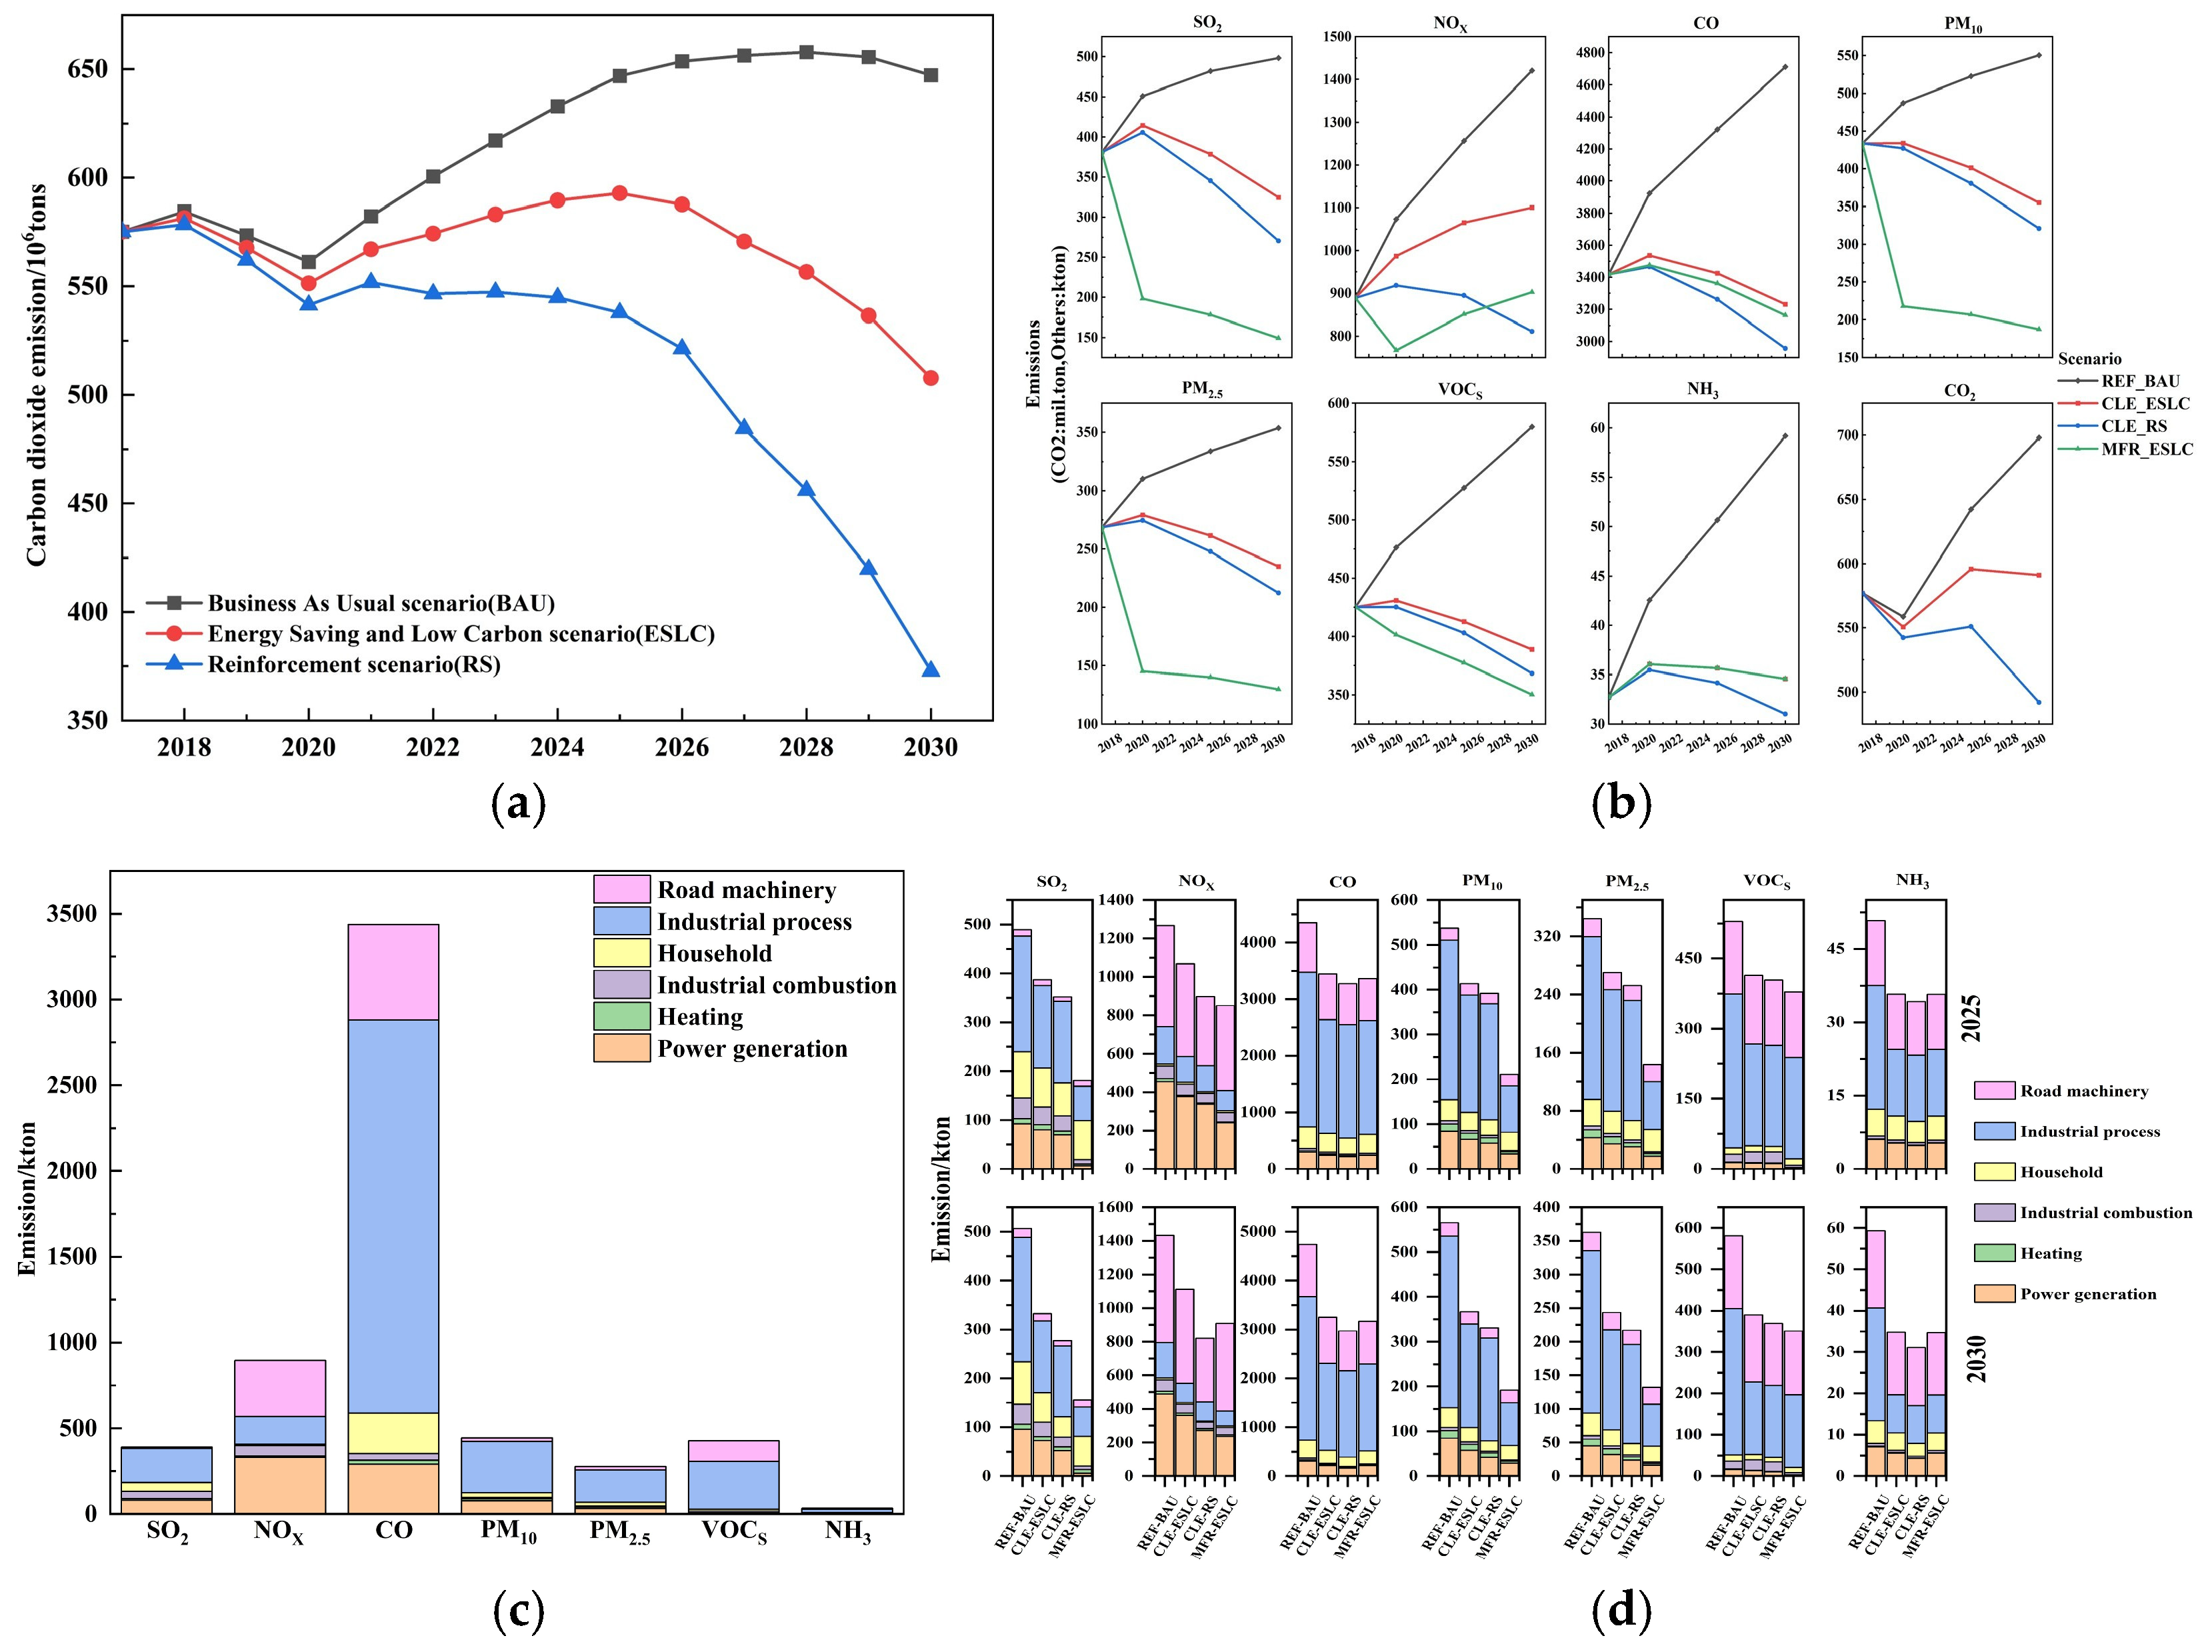
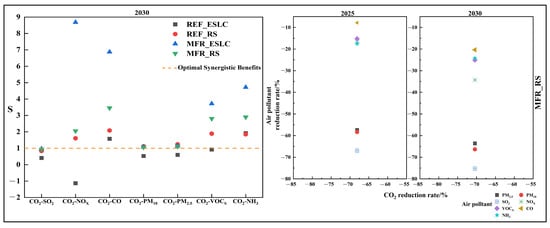
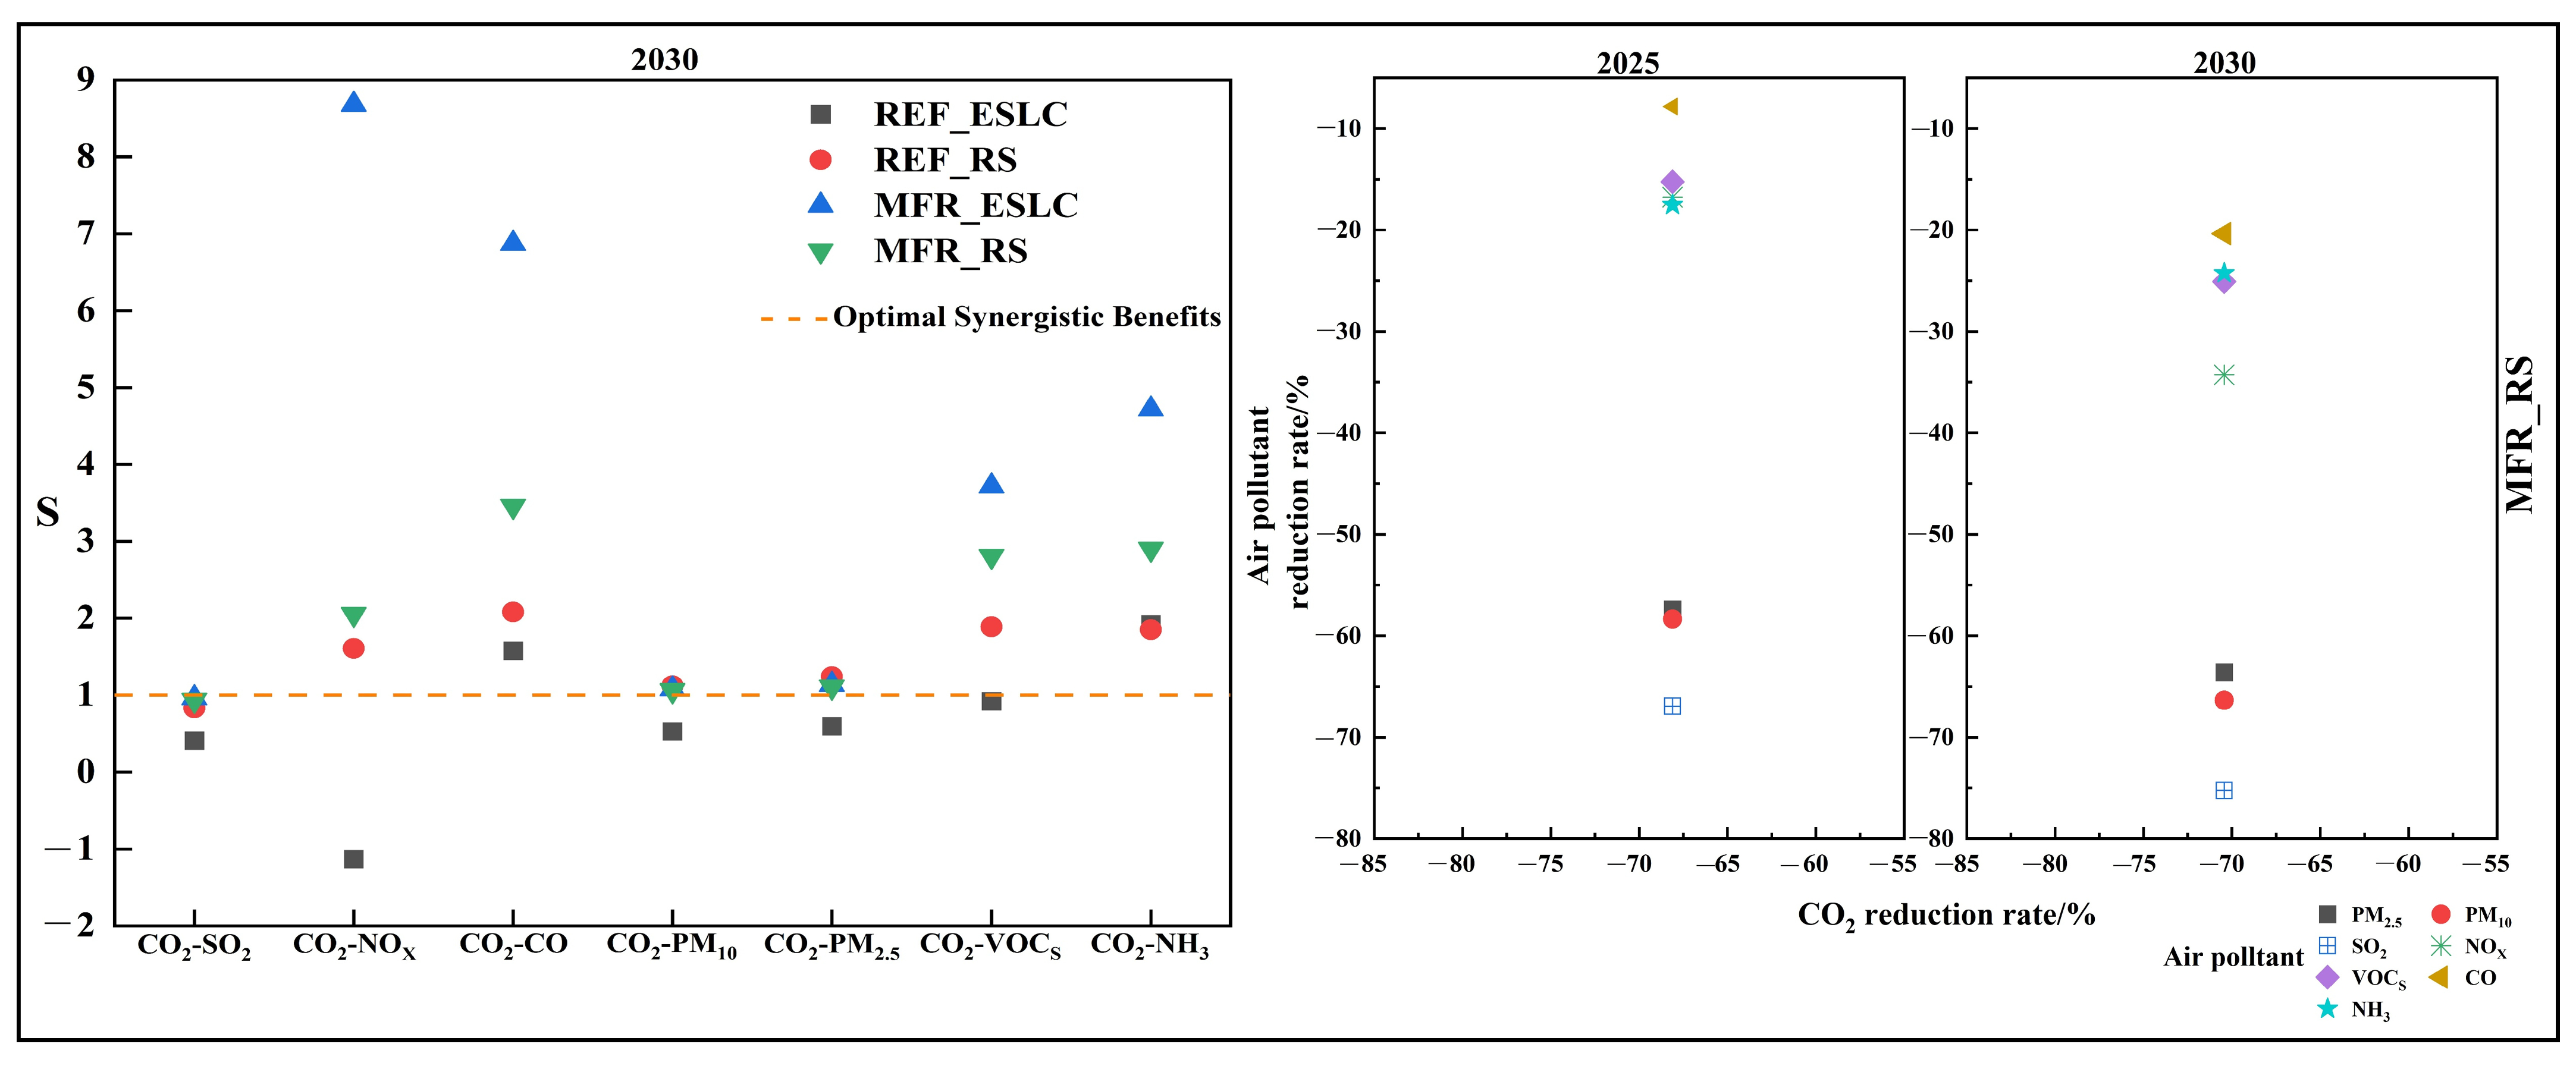
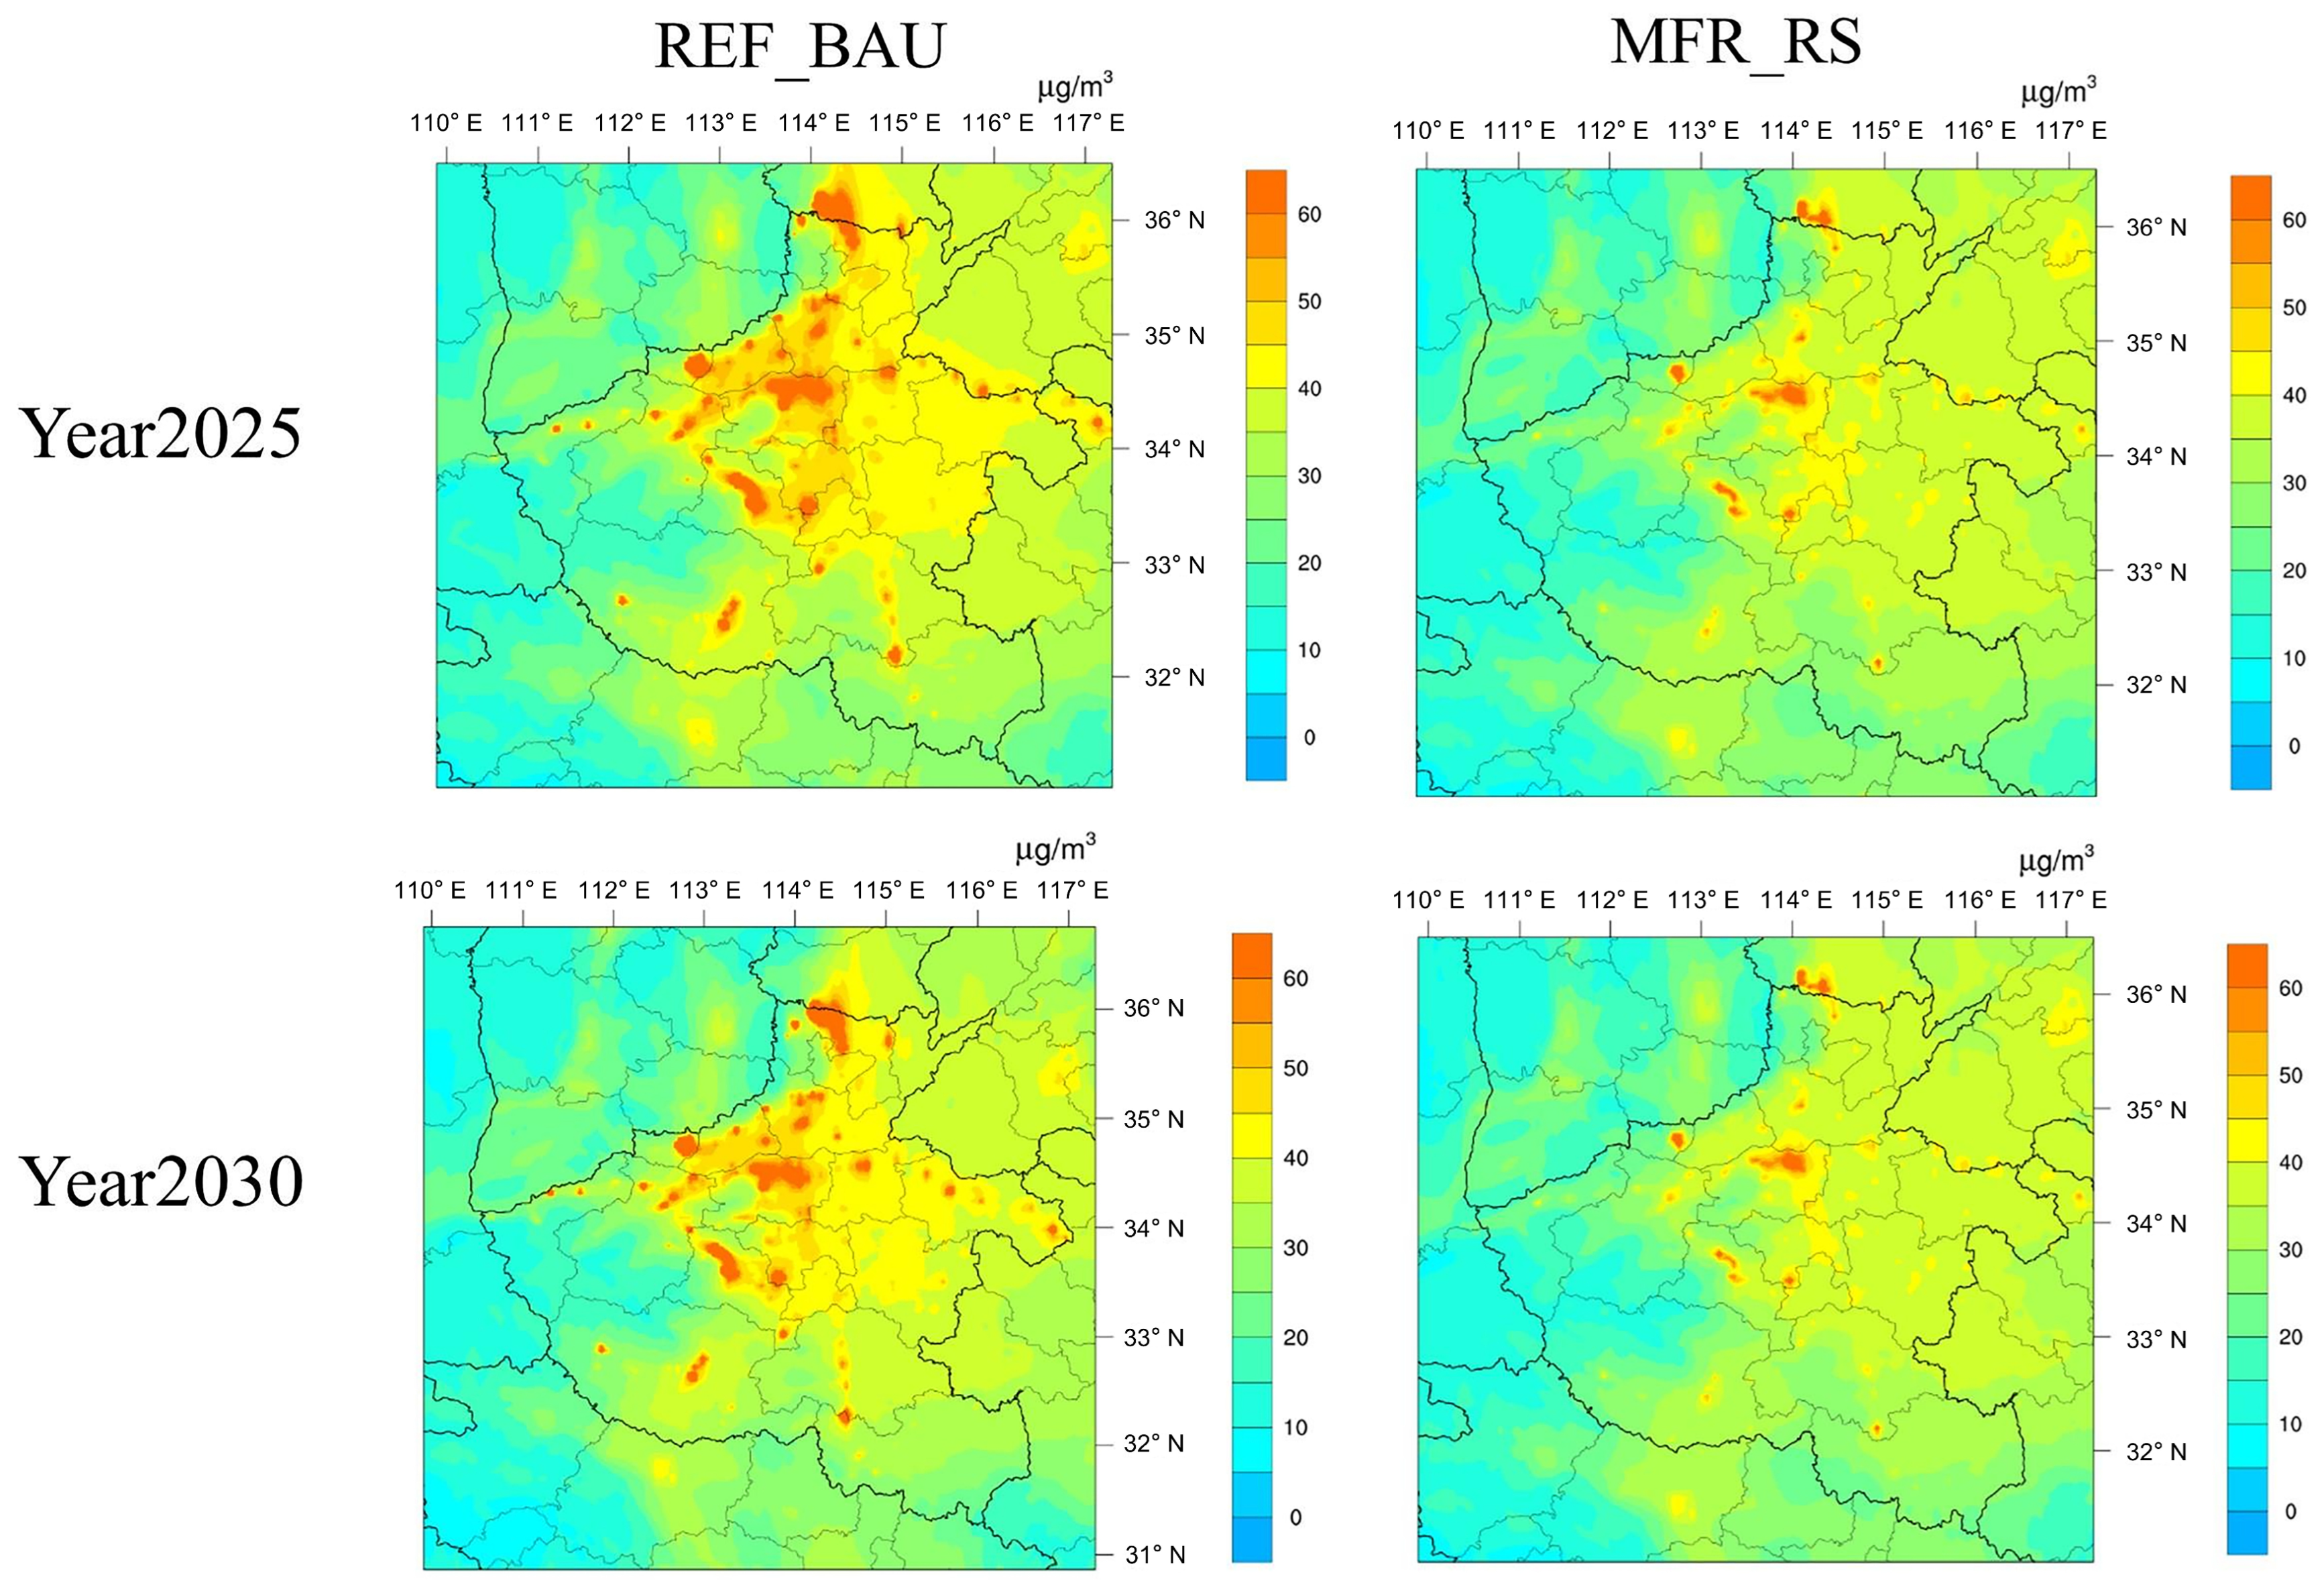
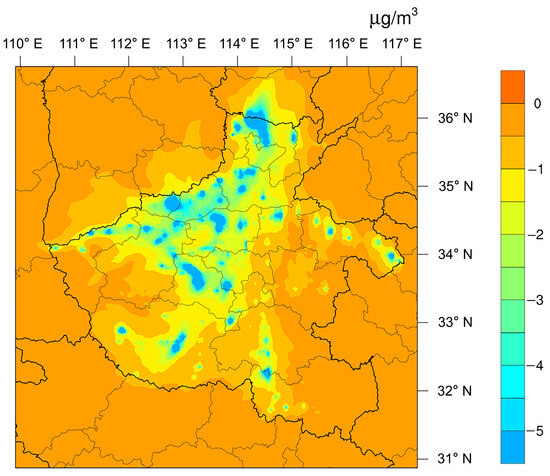
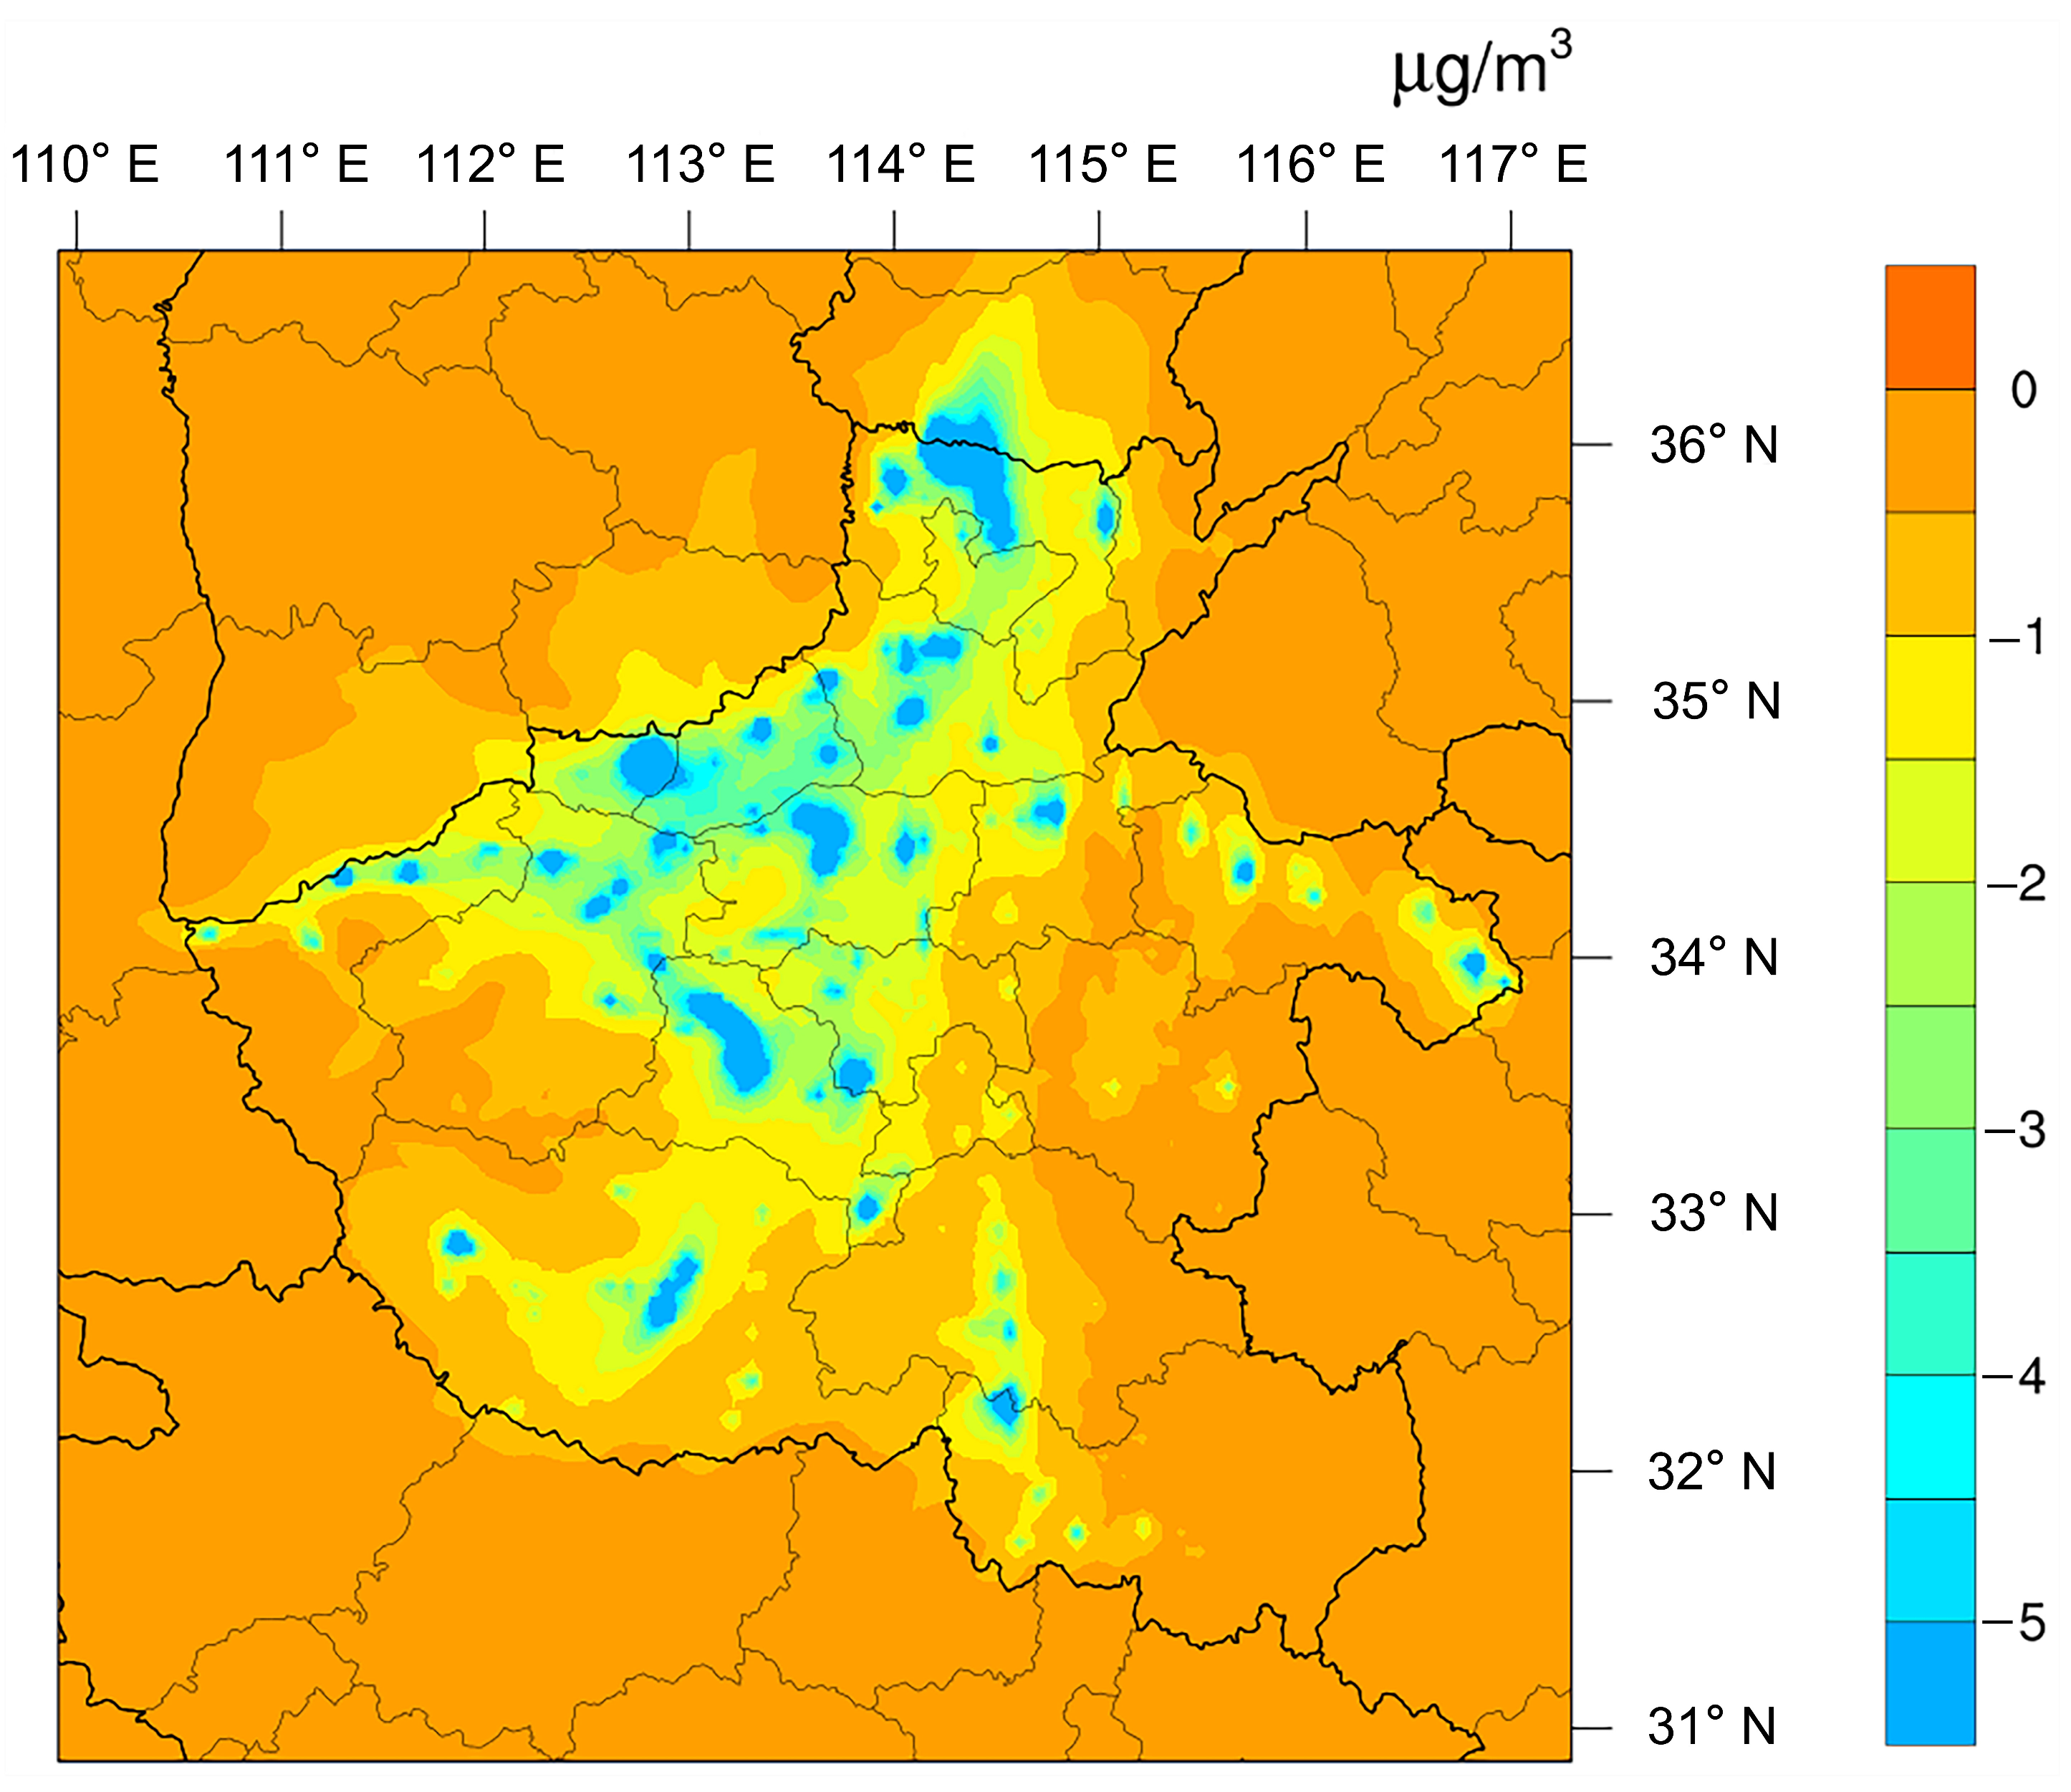
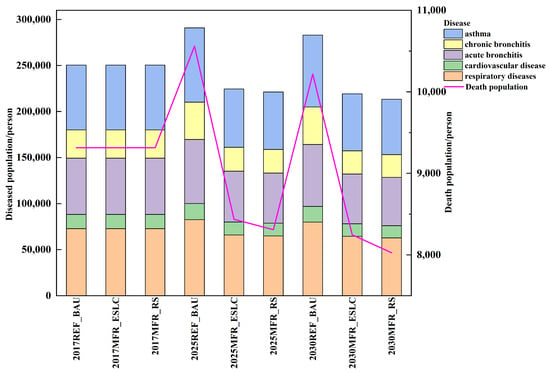
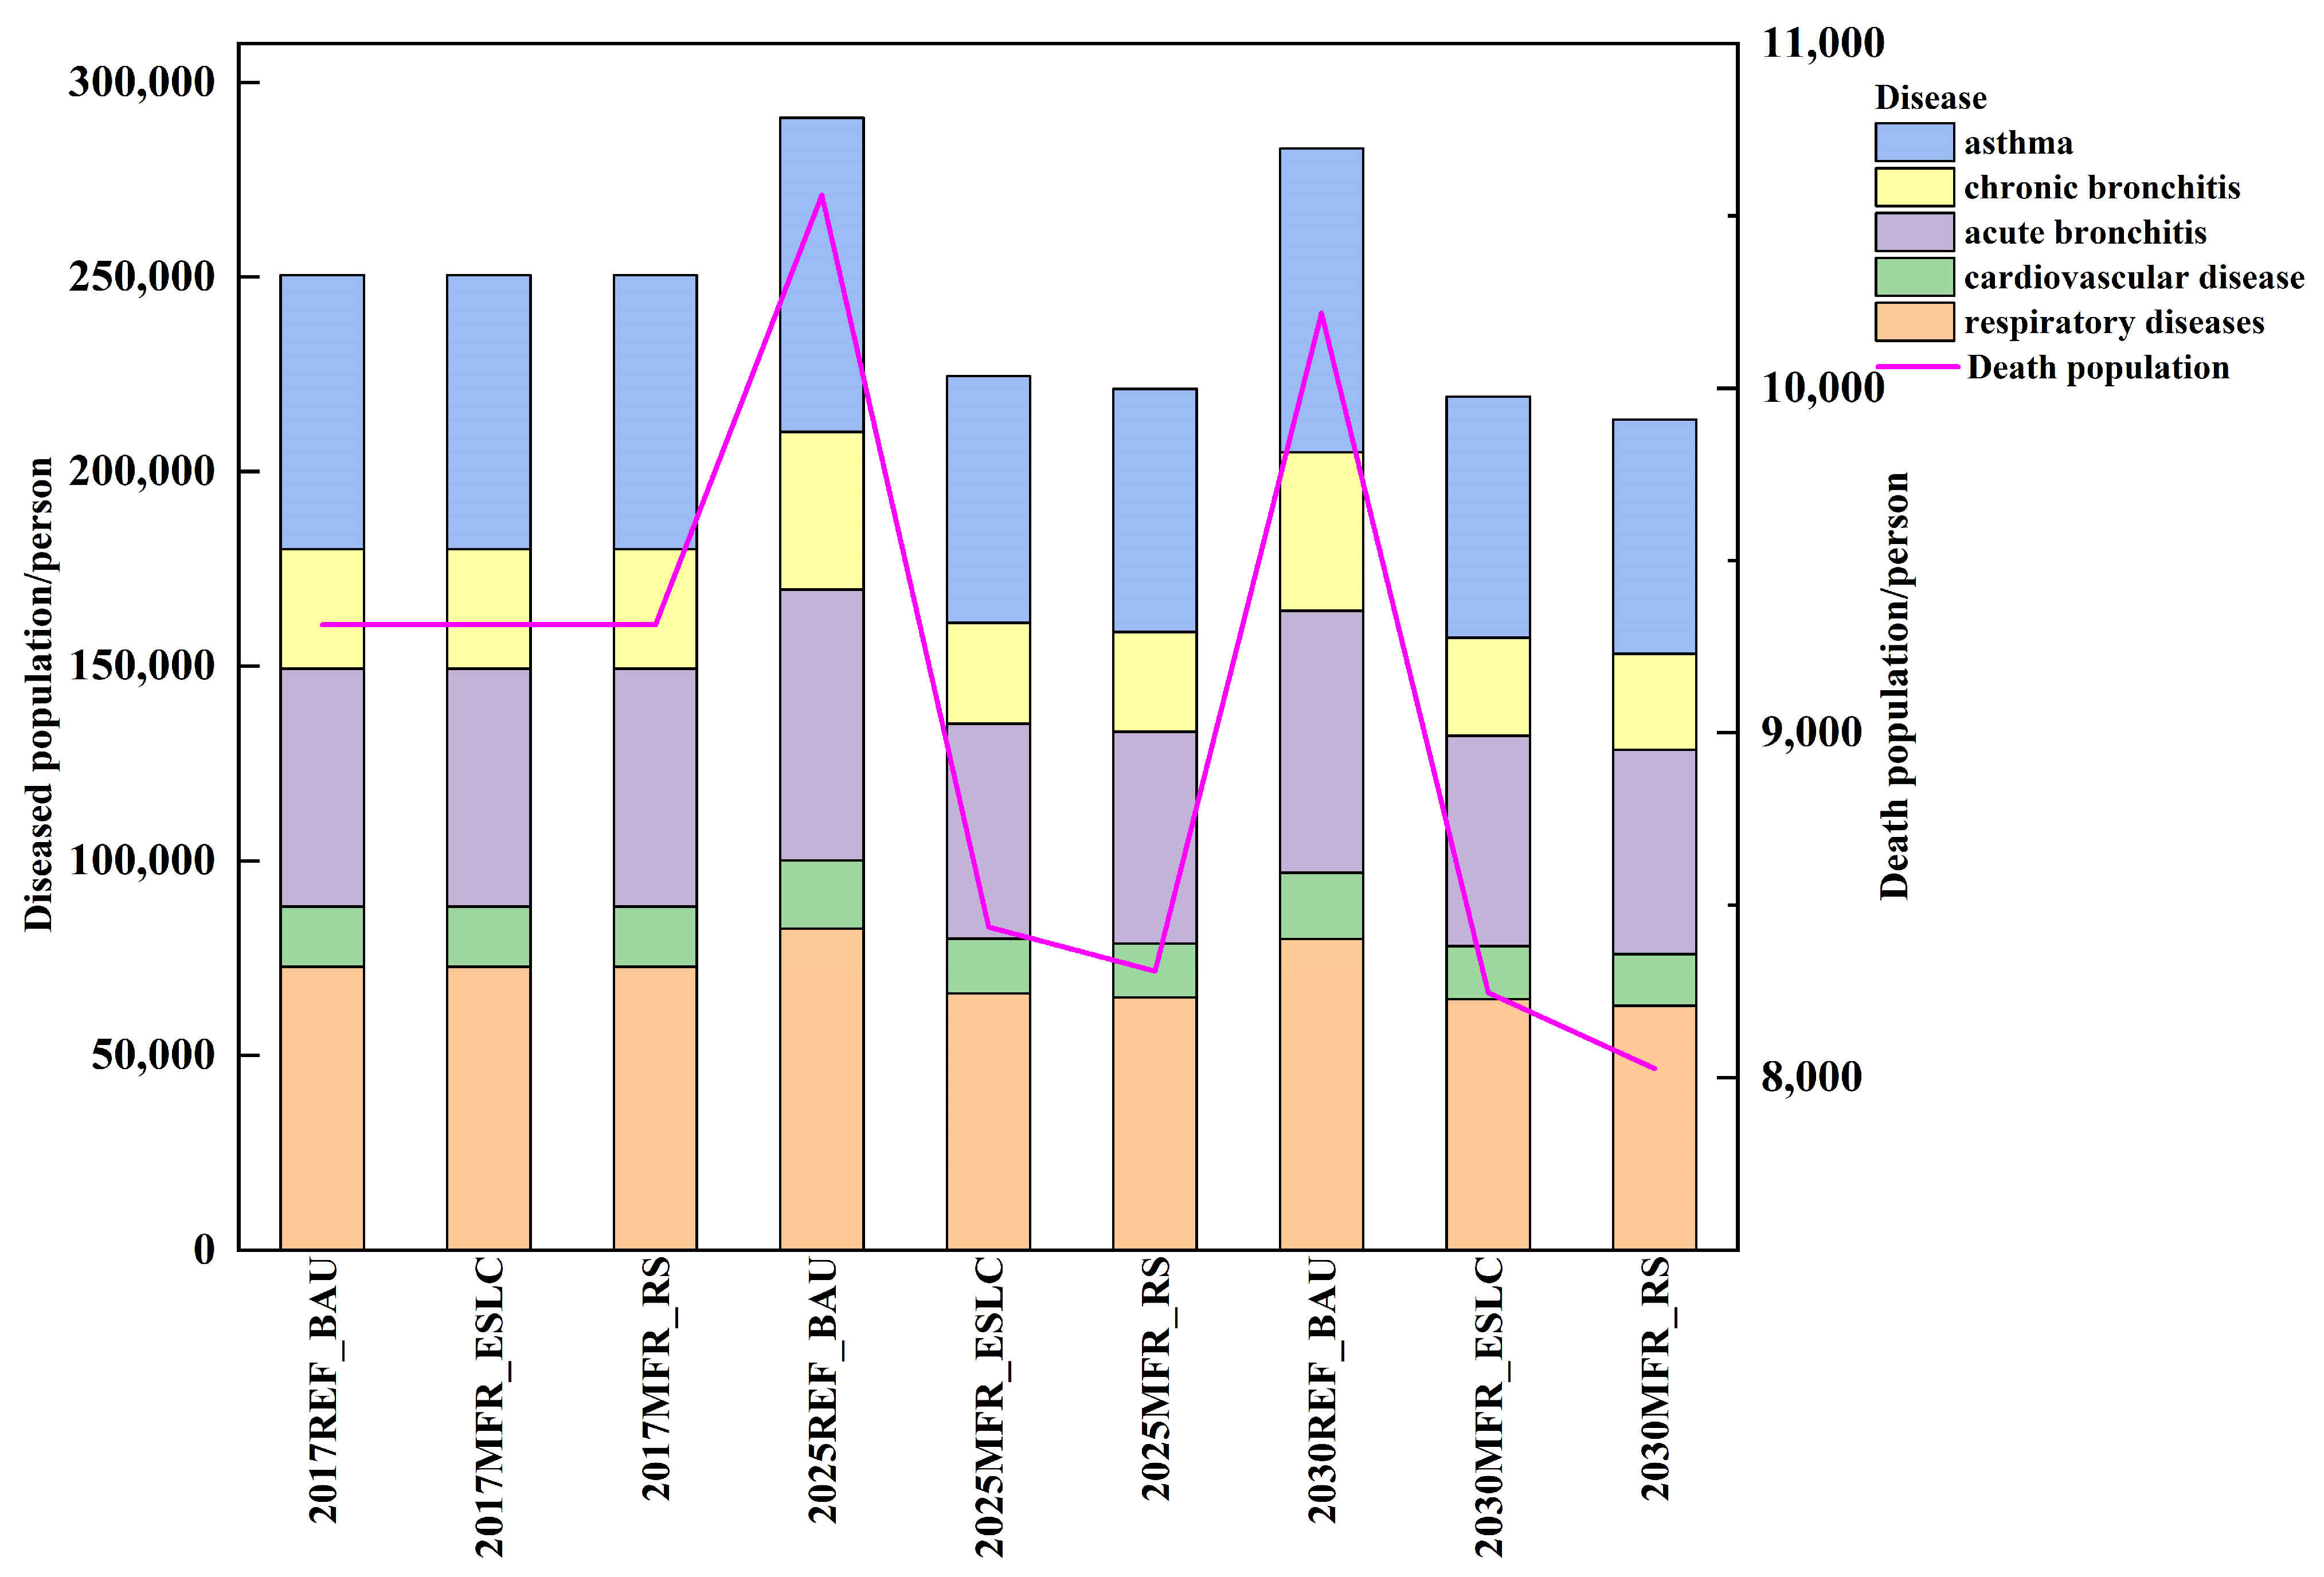
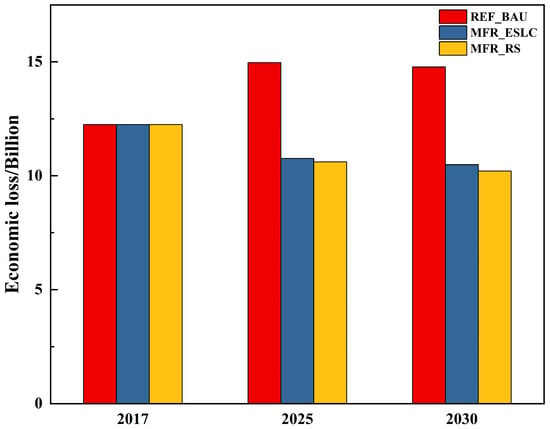
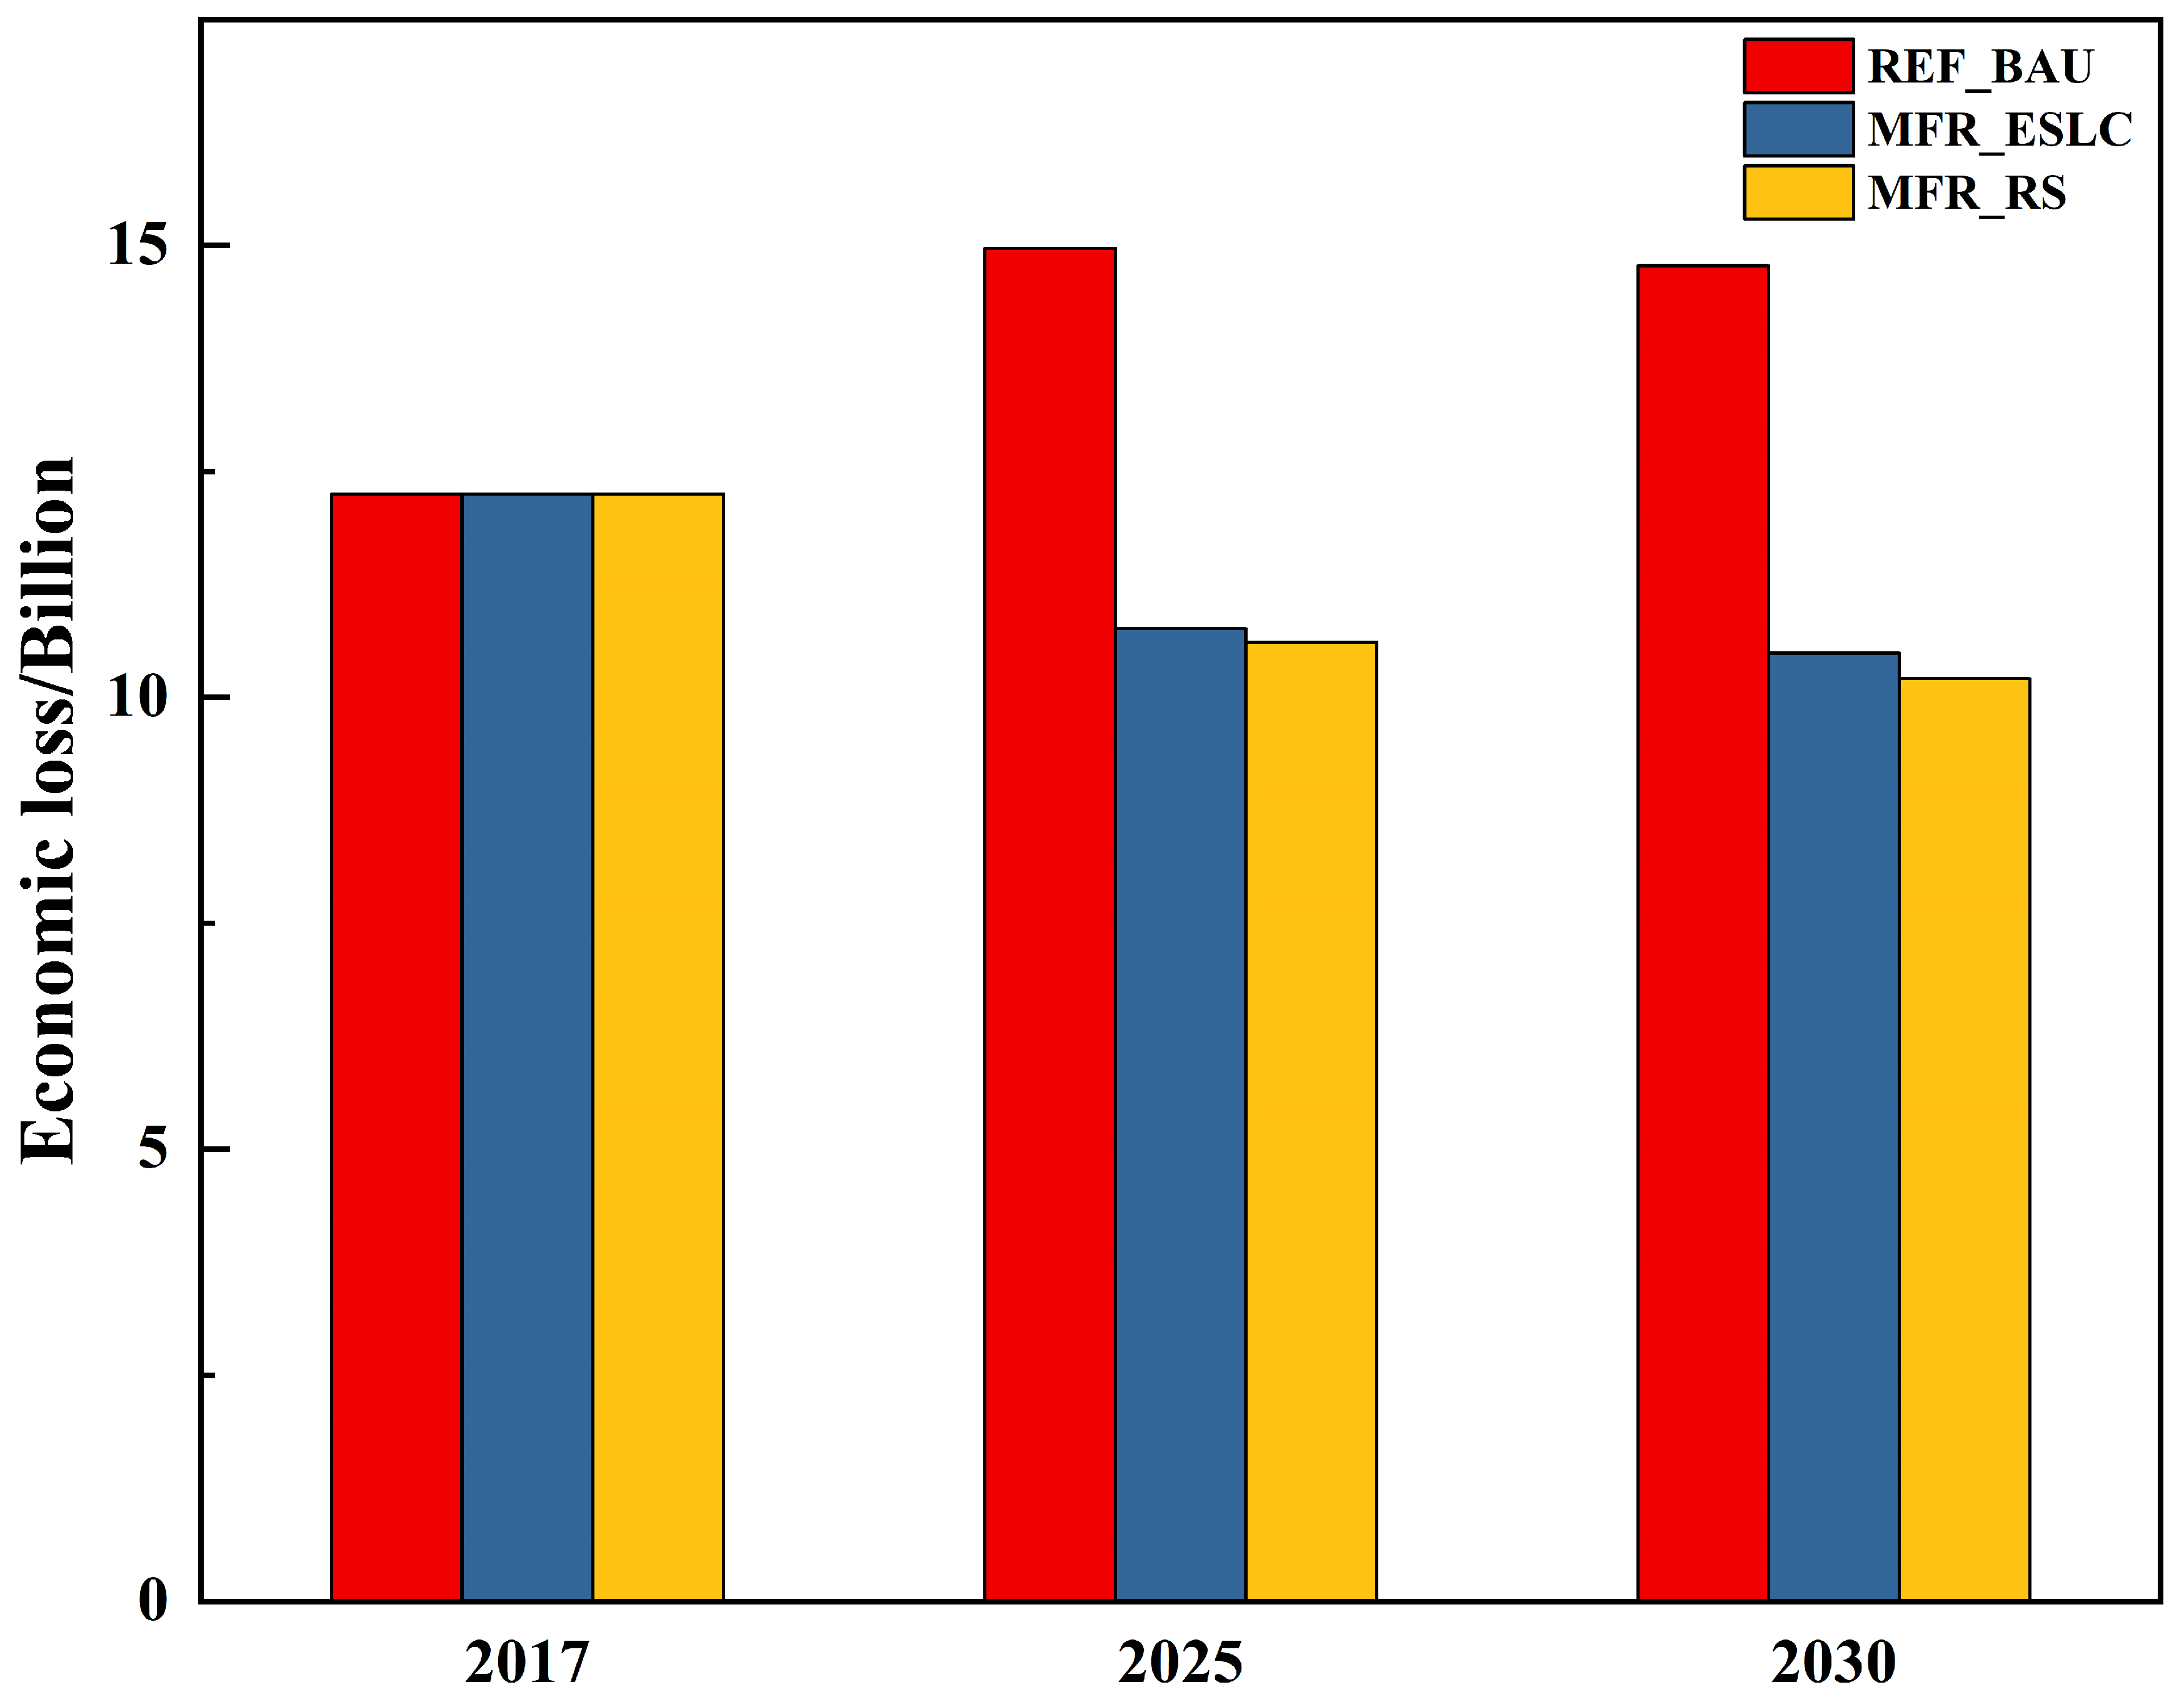

Disclaimer/Publisher’s Note: The statements, opinions and data contained in all publications are solely those of the individual author(s) and contributor(s) and not of MDPI and/or the editor(s). MDPI and/or the editor(s) disclaim responsibility for any injury to people or property resulting from any ideas, methods, instructions or products referred to in the content. |
© 2025 by the authors. Licensee MDPI, Basel, Switzerland. This article is an open access article distributed under the terms and conditions of the Creative Commons Attribution (CC BY) license.