1. Introduction
Extreme heat and the urban heat island (UHI) effect are increasingly recognized as critical public health threats, particularly in rapidly urbanizing areas [
1,
2]. Urbanization intensifies local warming by reducing natural land cover, increasing impervious surfaces, and concentrating anthropogenic heat sources. These changes exacerbate the frequency, intensity, and duration of heat waves, leading to elevated risks of cardiovascular, respiratory, and all-cause mortality, especially among older adults and other vulnerable populations [
3,
4,
5,
6,
7]. Global urban populations—projected to exceed 70% by 2050—are especially at risk, underscoring the urgency for climate-resilient planning in dense metropolitan areas [
8].
Numerous epidemiological studies have demonstrated that exposure to high ambient temperatures and heat waves significantly increases the risk of morbidity and mortality. Cardiovascular events are the most well-documented outcomes, with excess mortality and hospitalizations resulting from thermal strain on the body [
4,
9]. Lag effects have also been observed, with delayed impacts peaking days after heat wave onset [
3]. Respiratory and cerebrovascular illnesses also increase due to reduced pulmonary and cerebral function during extreme heat [
10]. Older adults, individuals with pre-existing conditions, and urban residents in heat-vulnerable zones experience compounded risks [
11,
12,
13,
14].
Nature-based solutions, particularly green infrastructure (GI), have emerged as effective tools for mitigating urban heat exposure and promoting health. Vegetated areas such as parks, tree-lined streets, and green roofs can lower surface and ambient temperatures through shading and evapotranspiration [
15,
16,
17,
18]. The cooling benefits of GI can reduce physiological stress and heat-related mortality while also lowering energy demand and greenhouse gas emissions [
19,
20].
Numerous global studies support the protective role of green infrastructure. Increased vegetation, quantified using indices like NDVI or EVI, has been correlated with lower land surface temperatures and reduced mortality rates [
21,
22]. For instance, a 20% increase in green space was associated with a 9% reduction in heat-attributable mortality [
21]. However, this relationship is not universally beneficial. Vegetation can contribute to pollen-related allergies and may trap heat in dense configurations or during nighttime [
23,
24,
25]. Effectiveness also varies depending on local climatic conditions, vegetation type, and spatial distribution [
26,
27].
Despite growing international attention, most research on green infrastructure, heat exposure, and health has been concentrated in developed regions such as Europe, North America, and East Asia. Urban areas in developing countries—particularly in arid and semi-arid regions like the Middle East and North Africa (MENA)—have received comparatively little attention [
28,
29]. These areas face mounting exposure to extreme heat due to climate change, urbanization, and inadequate adaptation infrastructure.
Iran, in particular, has experienced dramatic climatic shifts. The average national temperature has increased by approximately 2 °C in recent decades and is projected to rise further under high-emission scenarios [
30]. The number of hot days and nights is increasing, while cold events are declining. National studies project a 6.4 °C temperature rise by 2100 and a 35% decline in precipitation [
13,
28]. These climatic shifts are especially concerning for urban centers with poor green infrastructure coverage and limited adaptive capacity.
Tabriz, one of Iran’s major cities, is illustrative of these risks. Once characterized by a cold, semi-arid climate, the city is now experiencing frequent and prolonged heat waves, erratic precipitation, and shrinking green space [
31,
32,
33]. The average annual precipitation fell from 316 mm to 261 mm between 1951 and 2022, while average temperatures continue to rise [
32]. Satellite analysis has shown increasing nocturnal surface heat islands, with nighttime SUHI intensity projected to reach 6.6 °C by 2030 [
34]. Health data from Tabriz links elevated heat exposure—measured through PET and diurnal temperature range—to higher cardiovascular and respiratory mortality [
35,
36].
Despite these alarming trends, research in Iran remains limited in scope and scale. Most studies address temperature-health or vegetation–heat relationships in isolation and lack integration across domains; even fewer focus on the neighborhood scale, where intra-urban disparities in greenness and exposure are most pronounced. The absence of spatially granular health data—compounded by the recent digitization of medical records—hampers local-scale analysis and evidence-based planning. To date, no published studies have explored the combined effects of vegetation, temperature, and health at the neighborhood level in any Iranian city, including Tabriz.
Although many international studies have examined temperature–health relationships, very few have simultaneously evaluated heat waves, neighborhood-level greenness, and cardiovascular emergency visits using a DLNM framework. This integrated approach has not yet been applied in Iran, where rapid urban expansion and uneven vegetation distribution may intensify heat-related health vulnerabilities.
This study aims to address this gap by investigating how neighborhood-level green infrastructure—measured through NDVI—modifies the relative risk of heat-related hospital admissions for cardiovascular, respiratory, and all-cause illnesses in Tabriz. It adopts a spatially explicit framework to assess how vegetation patterns interact with extreme heat to affect human health. The research question is: How does green infrastructure influence the relative risk of heat-related health complications during heat waves in urban neighborhoods?
We hypothesize that neighborhoods with less green space experience higher risks of heat-related illnesses during heat waves. By integrating environmental, climatic, and health data, this study provides one of the first fine-scale assessments of heat-health vulnerability in an Iranian context. The findings can inform equitable, localized adaptation strategies and support broader efforts to improve urban sustainability and resilience under intensifying climate pressures.
2. Materials and Methods
2.1. Study Area
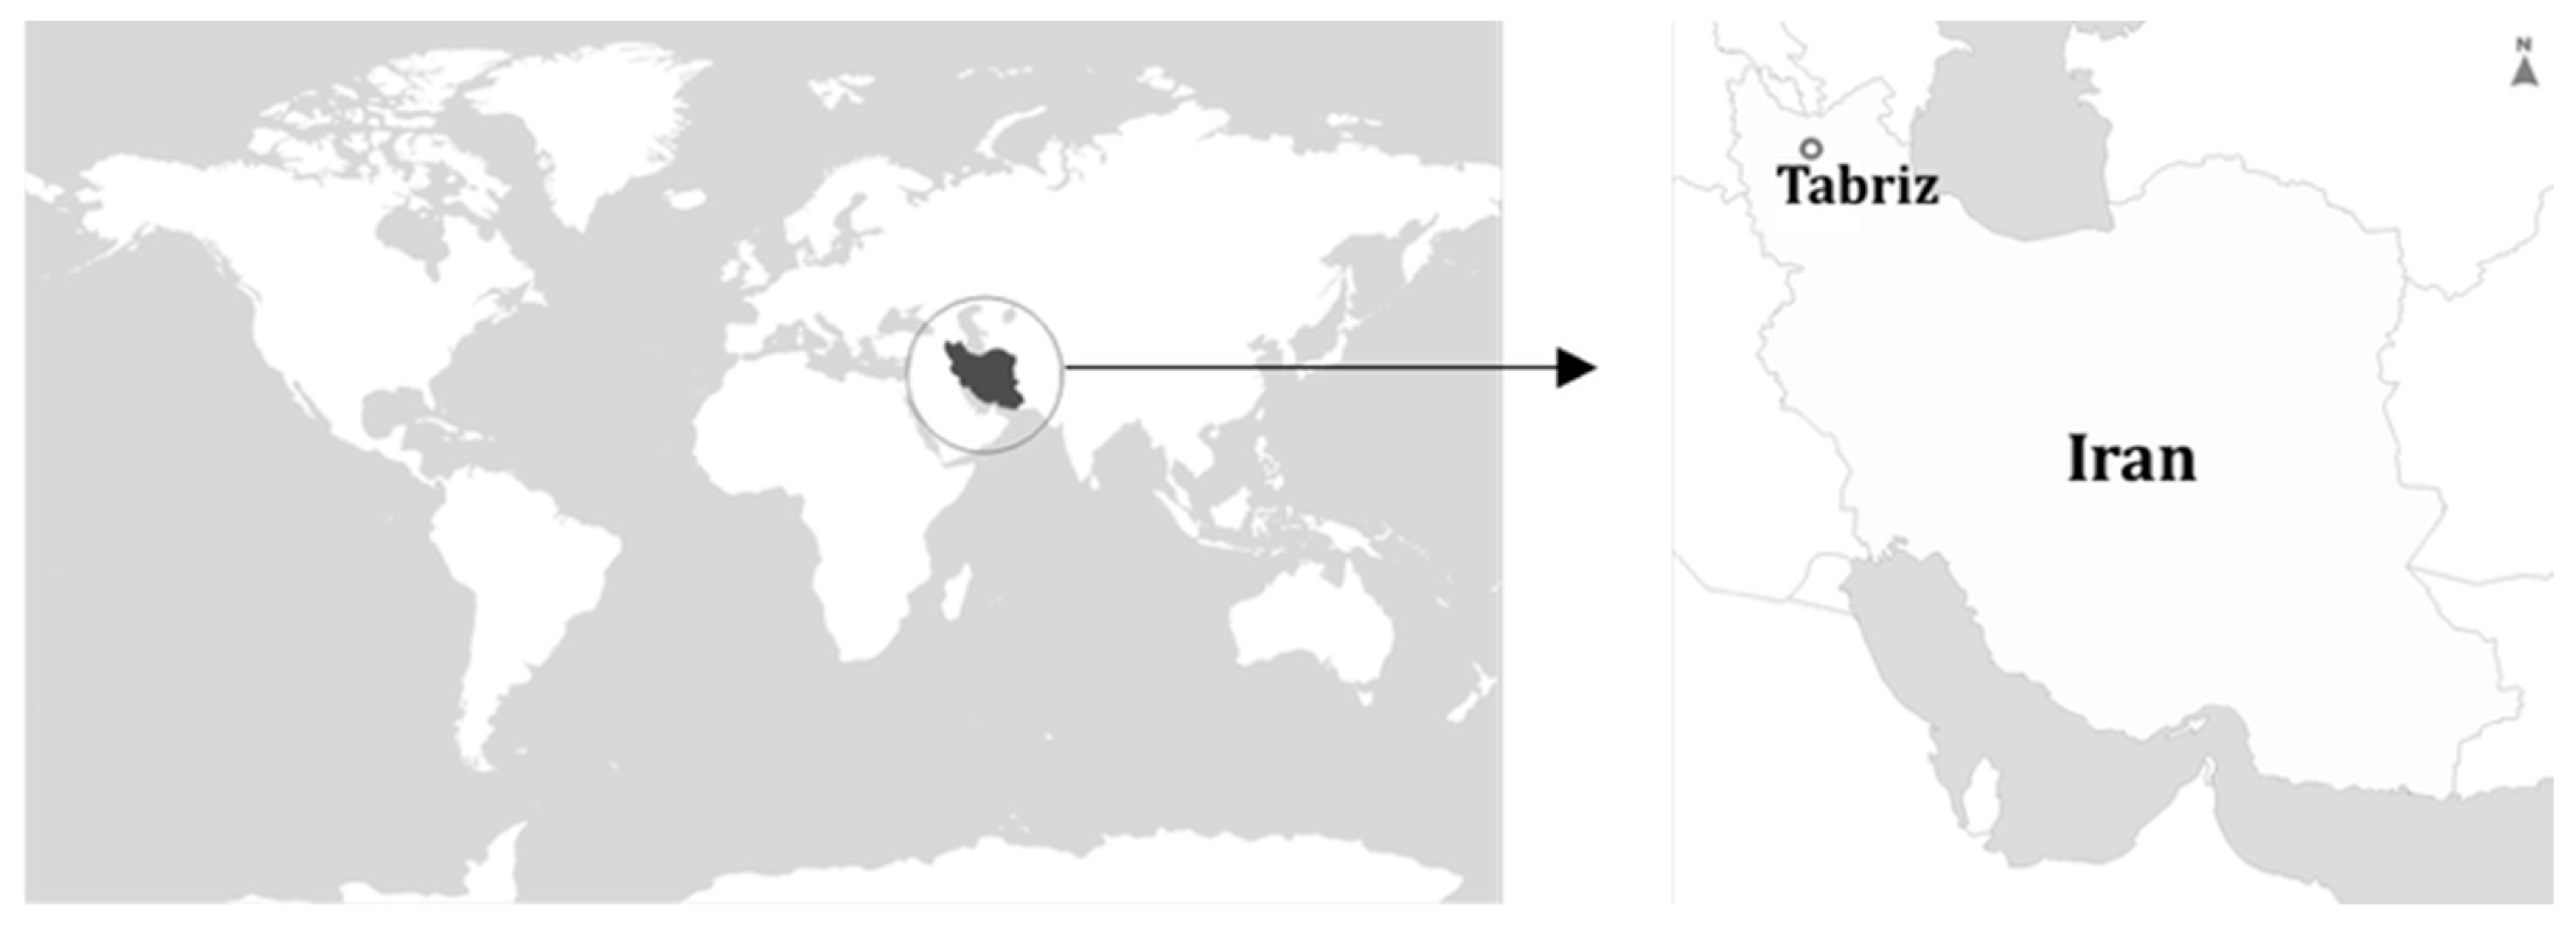
This study was conducted in Tabriz, Iran, focusing on the warm season (April–September) across the years 2018–2020, when heat exposure is most significant. Tabriz is the fifth-largest city in Iran and serves as the capital of East Azerbaijan Province. The city is situated at an altitude of 1361 m above sea level (38°5′ N, 46°16′ E) and spans an area of 244.5 square kilometers (
Figure 1). According to the 2016 national census, Tabriz had a population of 1,593,000 residents, making it the third-largest city in Iran by land area and the fifth most populous metropolis. Tabriz is historically known for its cold climate, but in recent years, climate change has introduced significant shifts in temperature trends. Studies indicate that climate change impacts in Tabriz are becoming more pronounced, particularly in terms of rising temperatures and decreased precipitation [
37]. The city has also experienced extreme weather events such as heat waves and floods, making it an appropriate case study for investigating the relationship between green infrastructure and heat-related health risks. The importance of studying the effects of extreme heat in Iranian cities has grown due to the rapid pace of urbanization and greenhouse gas emissions. According to the latest census, 74% of Iran’s population resides in urban areas, and cities are responsible for nearly half of the country’s total greenhouse gas emissions. This highlights the indirect role of urban expansion in climate change, as well as its direct impact on the urban heat island effect. The health consequences of extreme heat are expected to be particularly severe in cities that lack adaptation and resilience strategies to mitigate high temperatures [
38]. As a historically cold-region city, Tabriz has not previously required extensive heat mitigation strategies, unlike cities in warmer climates that have long adapted to extreme temperatures. However, as temperature increases continue, cities like Tabriz are more vulnerable to heat-related health risks due to their lack of preparedness for sustained high temperatures. This study aims to address this gap by assessing the role of green infrastructure in mitigating heat-related health risks in a city that has traditionally experienced colder climatic conditions but is now facing increasing heat stress. The large population of Tabriz makes it a particularly relevant case study for exploring the effects of heat waves in densely populated urban areas. Given that heat exposure is linked to increased mortality and hospital admissions, the study of heat–health interactions in Tabriz provides valuable insights into the necessity of urban greening strategies for reducing the risks associated with heat waves and climate change [
35,
36]. This research, therefore, contributes to a growing body of literature on climate adaptation in cities that were historically considered cold regions but are now experiencing new vulnerabilities due to rising temperatures. By examining the role of green infrastructure in mitigating these risks, this study offers critical evidence for future urban planning and policy interventions aimed at enhancing resilience against extreme heat in historically colder urban environments.
2.2. Data Sources
This study examines how green infrastructure, measured using NDVI values, influences the relationship between heat exposure and health outcomes. Temperature metrics and heat wave exposure are analyzed alongside health outcomes, including emergency department (ED) visits and relative risk (RR) estimates, across quartiles of vegetation coverage to assess whether green space reduces the risk of heat-related illnesses. To ensure the robustness of the findings, control variables such as humidity, wind speed, air pollution levels, and seasonal factors are incorporated to minimize potential confounding effects and isolate the impact of heat exposure and green infrastructure on health outcomes.
All datasets were acquired prior to statistical analysis. Daily emergency department (ED) records were extracted from the electronic surveillance systems of three major hospitals, geocoded using patient residential addresses, and aggregated at the neighborhood level. Heat exposure data were obtained from the Tabriz Airport Synoptic Weather Station, which provides a continuous 30-year temperature record suitable for percentile-based heat wave definition. NDVI values were calculated from Landsat 8 satellite imagery using ArcGIS software (version 10.7.1; Esri, Redlands, CA, USA). with cloud-masked monthly scenes selected for April–September of each study year and summarized at the neighborhood scale. Air pollutant concentrations (NO2, SO2, PM10) and meteorological variables (temperature, humidity, wind speed) were available at the city level and applied uniformly across neighborhoods. The integration of these datasets enabled us to combine neighborhood-level health outcomes and green infrastructure metrics with city-level environmental exposures within the DLNM framework for estimating heat-related health risks.
2.2.1. Health Data
Data on hospital admissions due to heat-related illnesses were obtained from three major hospitals in Tabriz, covering the period from April to September between 2018 and 2020, when heat exposure is most significant. A total of 9477 emergency department (ED) visits were recorded during this period. The study categorized emergency department (ED) visits using the International Classification of Diseases (ICD-10) into three groups: cardiovascular diseases (I20–I21.6, I21.9–I25.9, Z82.4–Z82.49), stroke (G45–G46.8, I60–I62, I62.9–I64, I64.1, I65–I69.998, Z82.3), and respiratory diseases (J45–J46.0, Z82.5, J41–J42.4, J43–J44.9, J18.9). To ensure a focus on urban heat exposure within Tabriz, patient records from surrounding cities and rural areas were excluded. Following data extraction, several preprocessing steps were conducted. Daily ED visit counts were aggregated for each disease category and stratified by age group (0–64 and ≥65 years) and gender. Temporal completeness was assessed to identify missing dates or duplicate entries. All remaining records were geocoded using residential address information and assigned to one of the 190 neighborhood units through GIS mapping. This procedure allowed the dataset to capture the spatial distribution of admissions across the city.
2.2.2. Heat Exposure Data
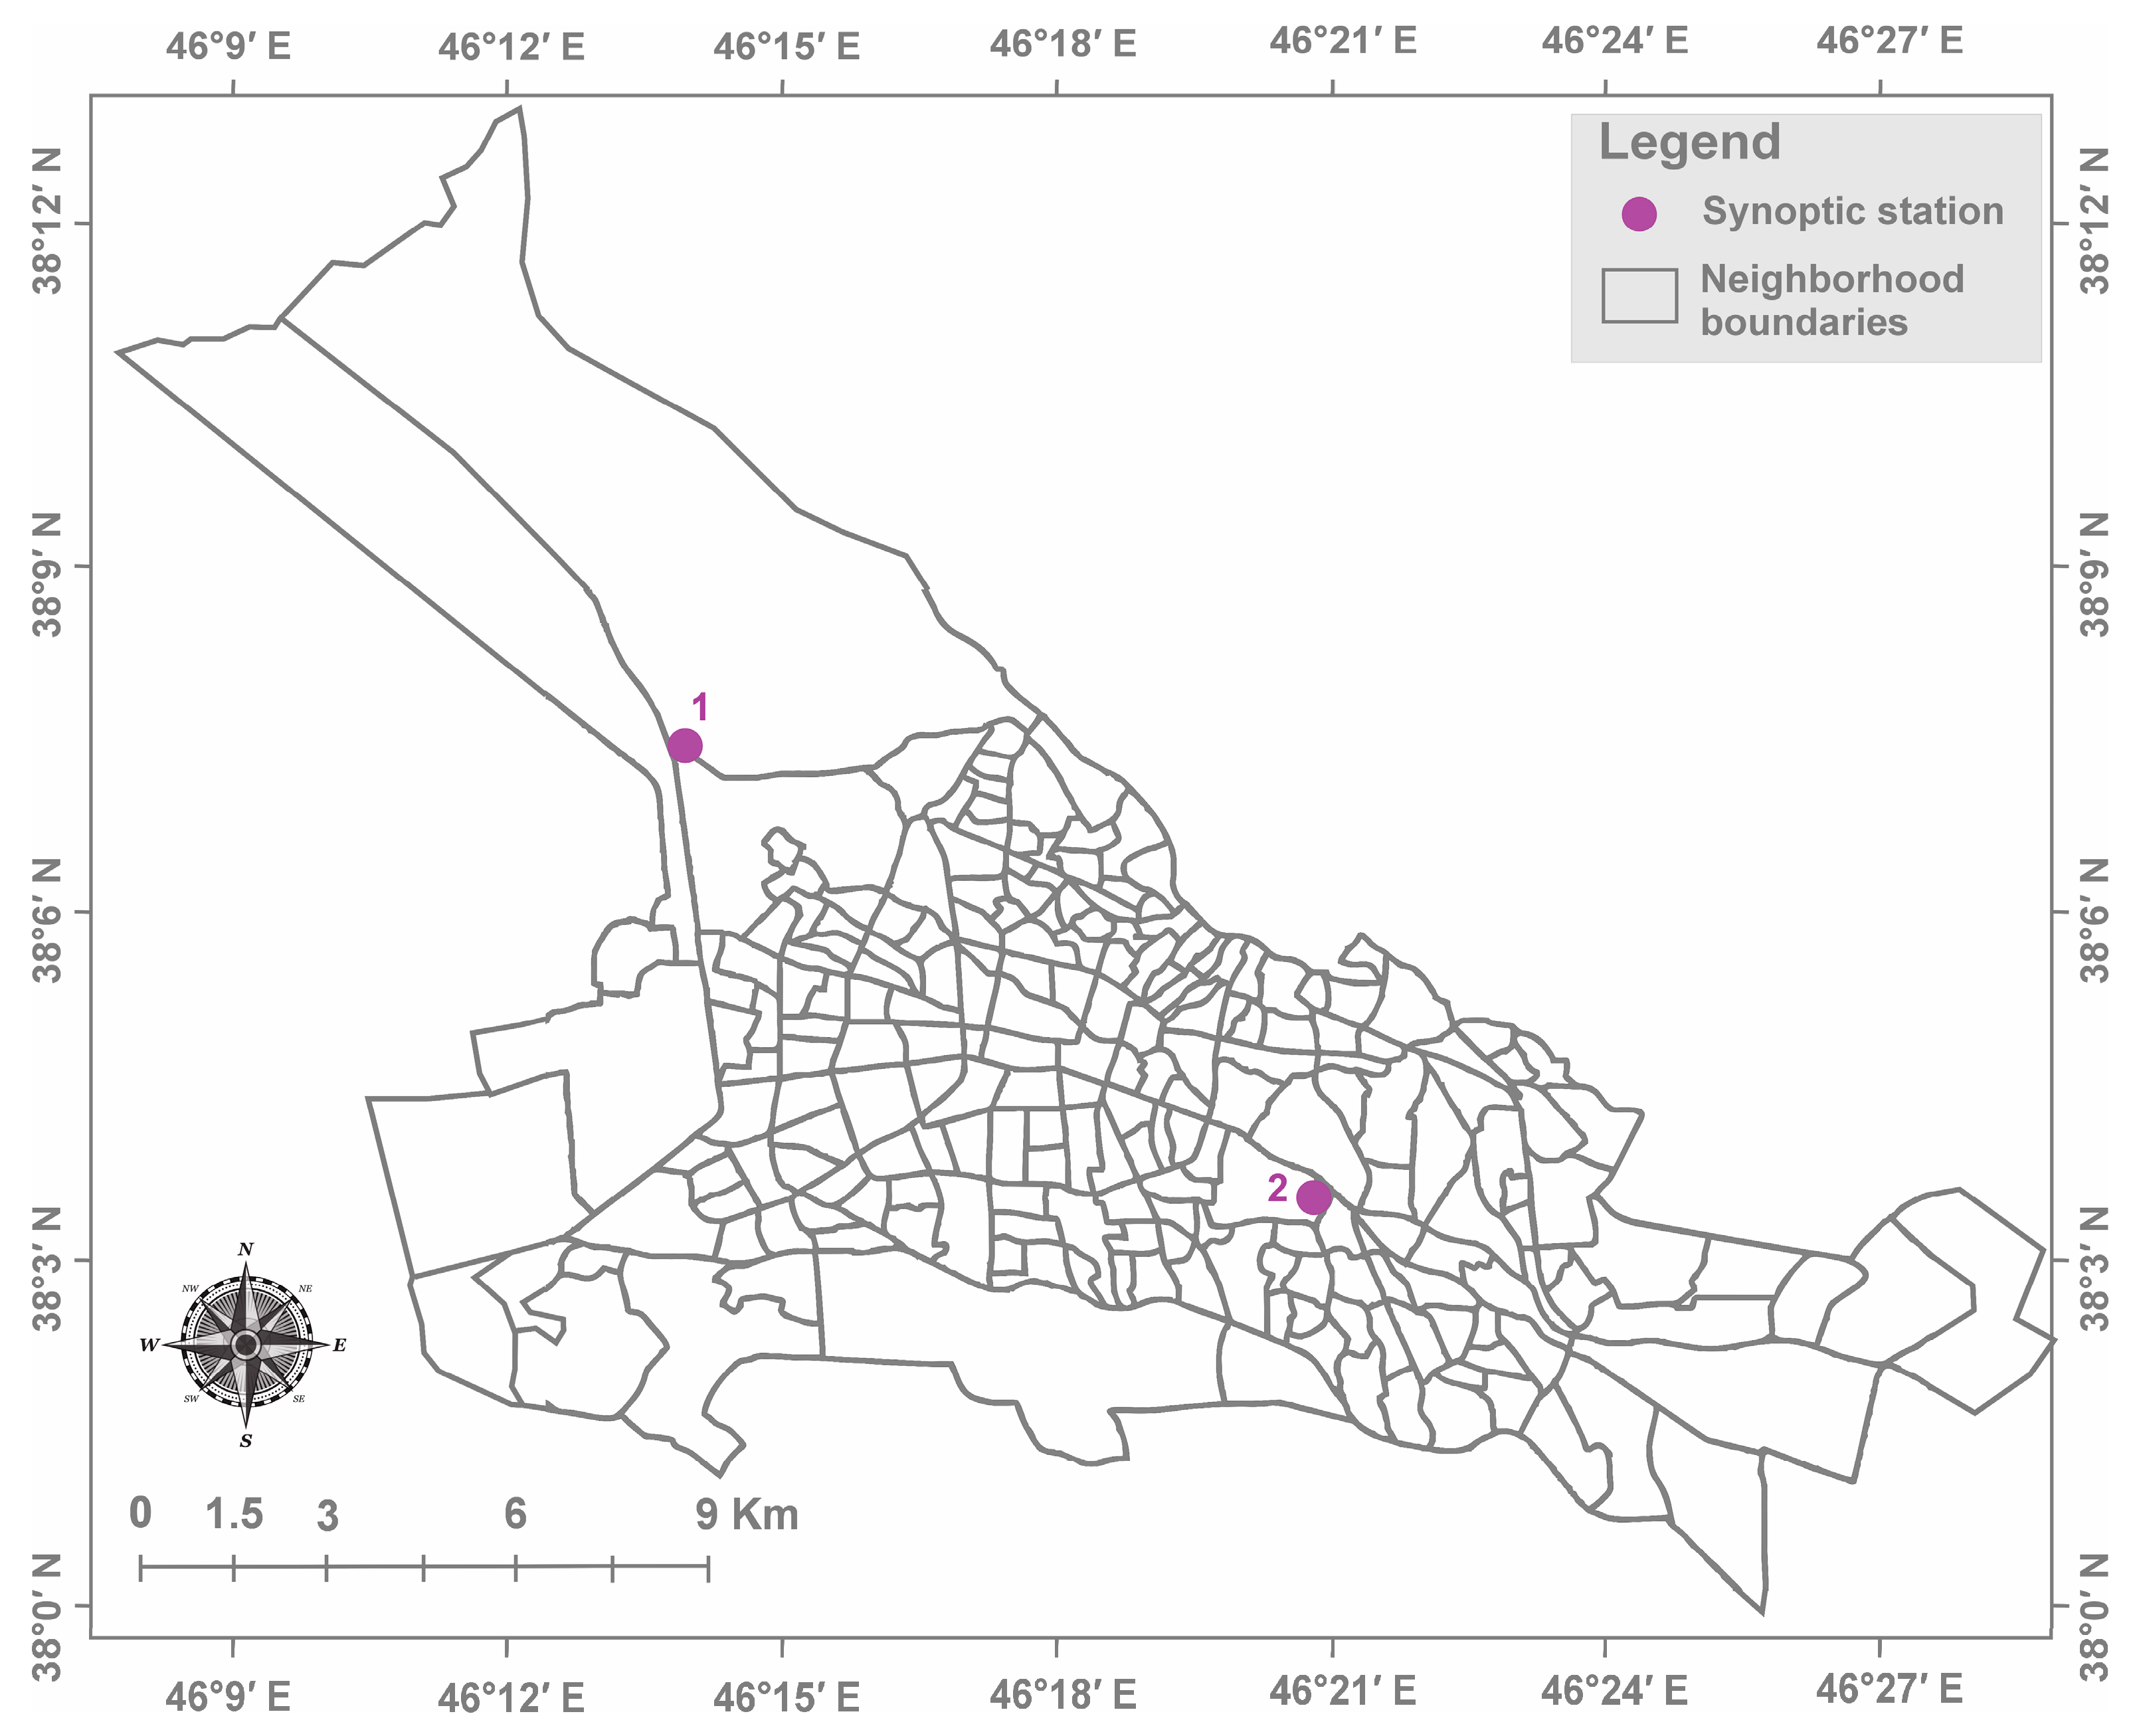
Meteorological variables were obtained from the Tabriz Airport Synoptic Station (1) (station code OITT, station number 40706), located at 46°14′01.8″ E and 38°07′20.6″ N. The station uses standard WMO-certified sensors, recording temperature and humidity hourly (
Figure 2). Daily mean, minimum, and maximum temperature values were produced by the Iranian Meteorological Organization through automated aggregation of hourly measurements. Daily climate data, including mean, minimum, and maximum temperatures, were obtained from the General Meteorological Department of East Azerbaijan Province and recorded at the same synoptic station. We used this long-term synoptic station to define heat waves, as it provides a continuous 30-year record suitable for calculating stable percentiles. Heat waves were identified as days where the mean daily temperature was at or above the 95th percentile for at least two consecutive days.
To assess the impact of heat waves independently from general high-temperature effects, two exposure metrics were used: the main effect, which captures the direct impact of heat waves on ED visits, and the added effect, which represents the additional risk from prolonged heat exposure beyond typical summer temperatures. The main effect reflects how ED visits change on heat wave days compared with normal summer days, while the added effect represents the extra risk that builds up when high temperatures persist for several consecutive days, beyond the impact of a single hot day. A binary variable was created to differentiate between heat wave days (coded as 1) and non-heat wave days (coded as 0). Heat wave days derived from the synoptic station were assigned uniformly to all neighborhoods in the city. The underlying assumption is that all neighborhoods experience heat waves at approximately the same time, while differences in health outcomes reflect variations in vulnerability or modifying factors such as green infrastructure.
Daily emergency department visits were analyzed at the neighborhood level to identify these spatial differences in heat-related health responses. Although an initial 14-day lag period (Lag0–14) was considered to assess delayed health effects, the primary analysis focused on Lag0, Lag0–2, Lag0–4, and Lag0–7 due to high variability in risk estimates at longer lags. Lag0–14 was excluded to reduce potential confounding from weather fluctuations, air pollution changes, and behavioral adaptations over time. Lag0–14 estimates also showed substantial statistical instability, including very wide confidence intervals and occasional reversals in effect direction; therefore, we restricted the primary analysis to Lag0–7, where estimates were more stable and interpretable. By limiting the analysis to shorter lags, the study provides a more precise assessment of the direct impact of heat waves on health outcomes.
2.2.3. Green Infrastructure
Green infrastructure was quantified using the Normalized Difference Vegetation Index (NDVI), a widely recognized metric for measuring vegetation health and density. Landsat 8 OLI/TIRS Collection 1 Level-1 scenes (e.g., LC08_L1TP_168034_YYYYMMDD) covering Tabriz were downloaded from the USGS EarthExplorer platform. For each month of the warm season (April–September) during 2018–2020, the scene with the lowest cloud cover (<5%) was selected. All images had a spatial resolution of 30 m. NDVI was calculated using the standard reflectance-based formula NDVI = (Band 5 − Band 4)/(Band 5 + Band 4). The values were extracted for each neighborhood unit in GIS software, and the average NDVI over the study period was assigned to each unit. Using a seasonal average rather than a single peak summer NDVI allowed us to capture sustained vegetation exposure throughout the warm season, accounting for short-term fluctuations in vegetation cover and providing a more robust measure of green infrastructure relevant to prolonged heat exposure. While NDVI provides a widely used measure of overall vegetation density, it does not distinguish between vegetation types (e.g., trees versus grasses), which may differ in their cooling effectiveness. Based on NDVI values, the 190 neighborhoods were classified into four quartiles: the first quartile included neighborhoods with negligible green space (27.78% of the population); the second quartile, with low green space, included 23.73%; the third quartile, with moderate green space, covered 25.12%; and the fourth quartile, with high green space, comprised 23.37%, resulting in approximately balanced population sizes across NDVI quartiles.
2.2.4. Environmental and Temporal Controls
In this study, air pollutants, meteorological factors, time trends, holidays, and day-of-week (DOW) effects were controlled as intervening variables to minimize confounding. Data on NO
2, SO
2, and PM
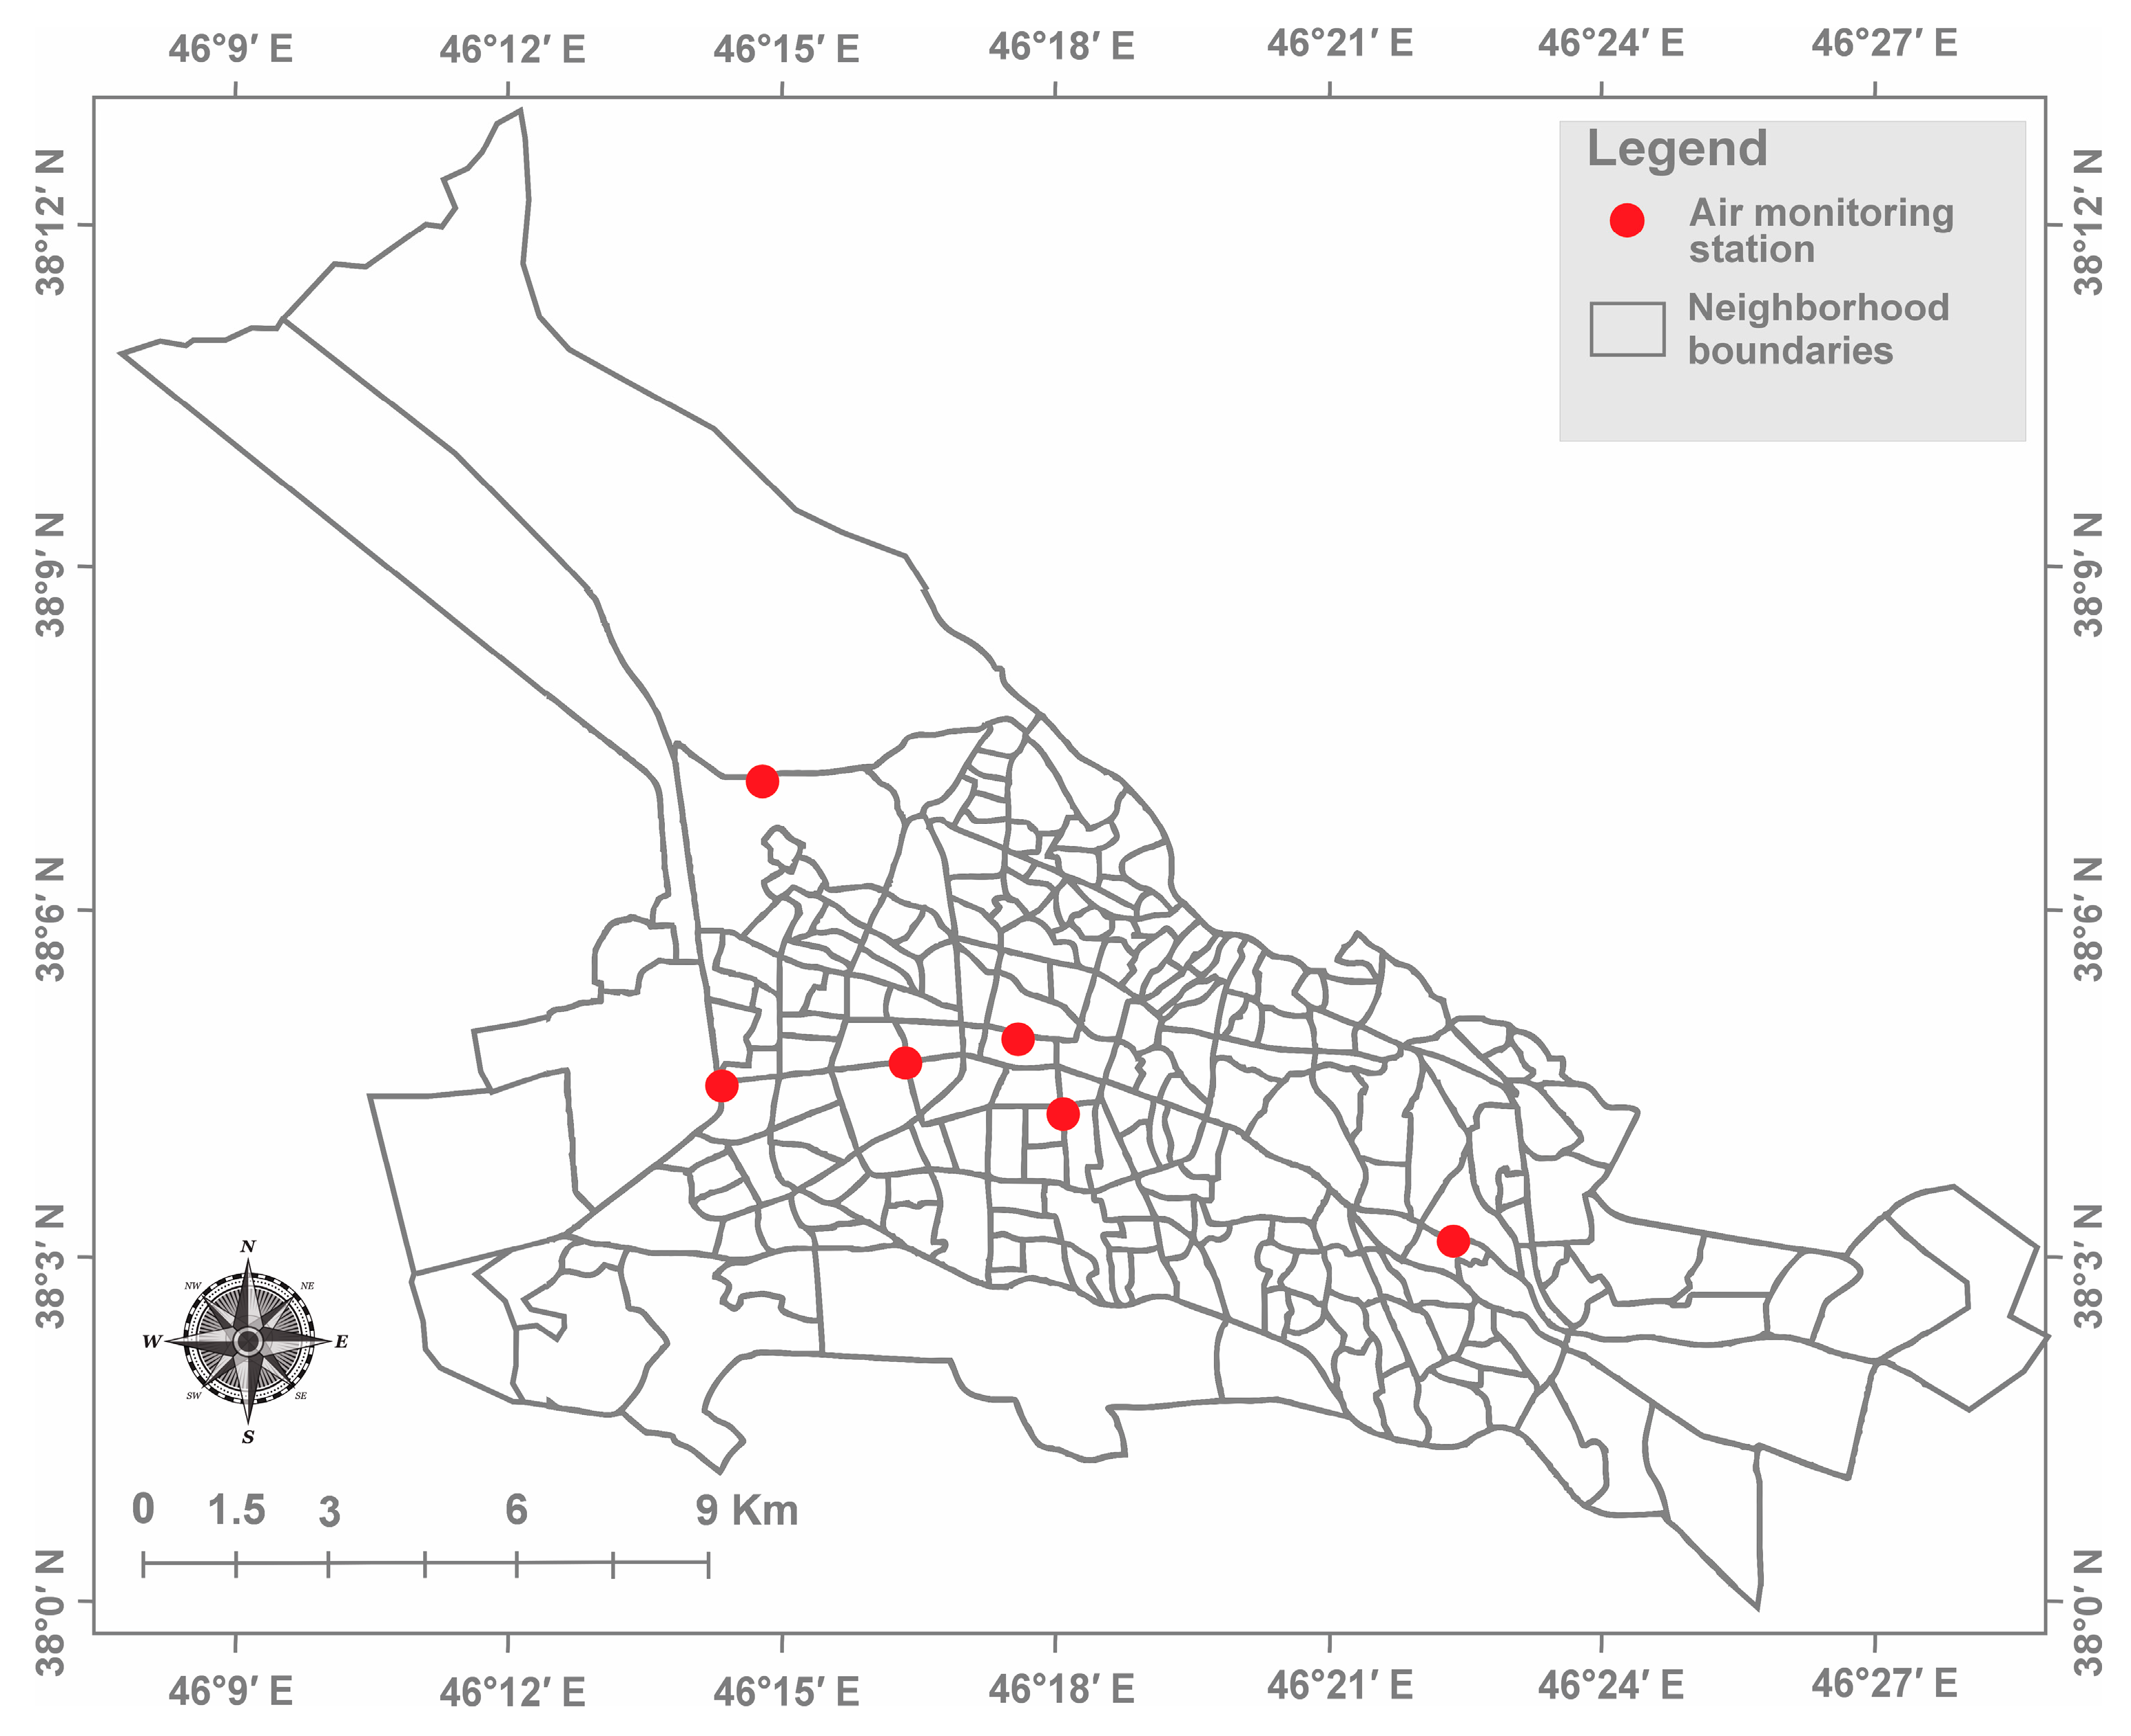
10 were collected from six air monitoring stations in Tabriz, using 24 h mean values to adjust for air pollution effects (
Figure 3). Additionally, daily meteorological data, including relative humidity, wind speed, and precipitation, were obtained from the General Meteorological Department of East Azerbaijan Province and recorded at the Synoptic Weather Station at Tabriz Airport. These controls ensured that the observed relationships between heat waves, green infrastructure, and health outcomes were not confounded by environmental variations.
2.3. Statistical Analysis
To evaluate the impact of heat waves on health outcomes, this study employed a Distributed Lag Non-Linear Model (DLNM) combined with a quasi-Poisson regression model. Data processing and statistical analyses were conducted using R software (version 4.3), with the DLNM package (version 2.3.5) used for model implementation. The DLNM framework is widely recognized for its ability to capture both non-linear and delayed associations between environmental exposures and health effects. This approach has been extensively applied in epidemiological research to assess the temporal patterns of health risks associated with environmental factors, making it well-suited for studying heat-related health impacts.
The quasi-Poisson regression model was used to estimate relative risks (RR) for cardiovascular, respiratory, and all-cause hospitalizations, accounting for overdispersion in count data, which is common in health studies involving emergency department (ED) visits. This method has been widely applied in previous research to assess the health effects of concurrent environmental exposures, ensuring robust statistical inference.
The final regression model used in this study was:
where Yt represents the number of ED visits per day, T1 and T2 represent the main and added effects of heat waves, respectively. The cross-basis function cb() was used to estimate temperature–health relationships, while ns() functions were applied to adjust for confounding variables, including air pollutants (NO
2, PM
10, SO
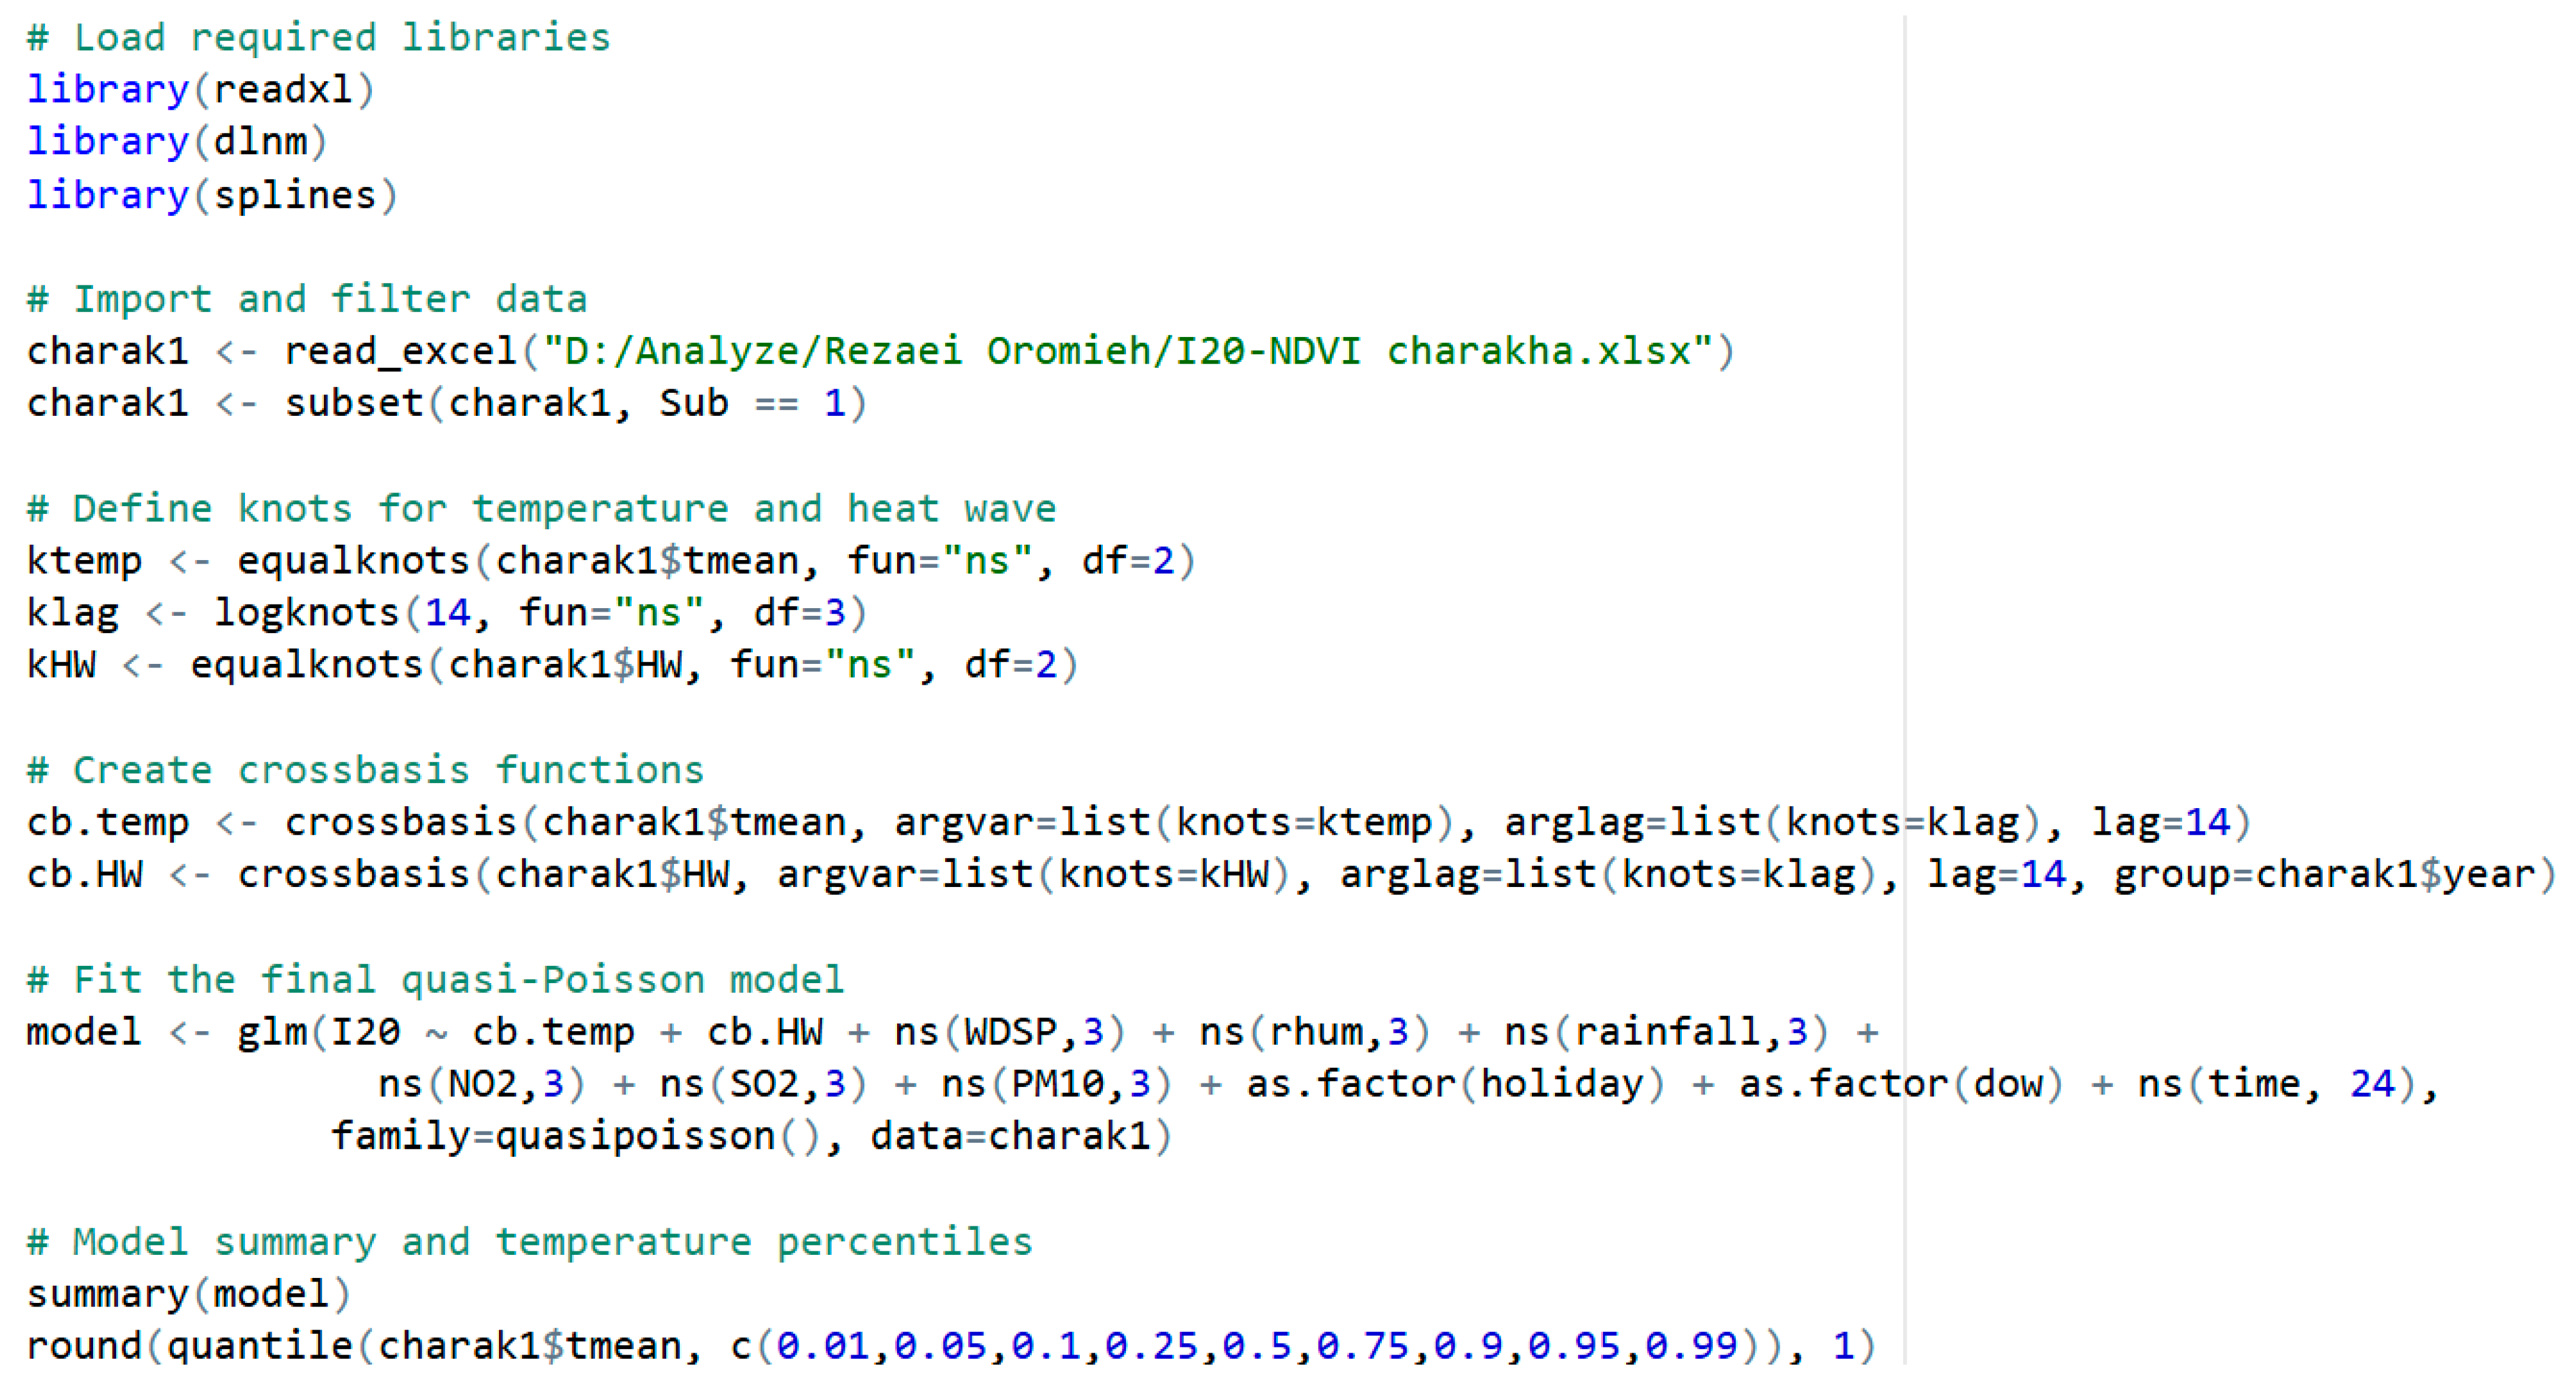
2), relative humidity (RH), seasonality, and time trends. The degrees of freedom (df) were optimized based on the lowest Quasi-Akaike Information Criterion (QAIC) value, ensuring the best model fit. For transparency and reproducibility, excerpts of the source dataset and analysis code are provided in
Table 1 and
Figure 4, respectively.
By integrating these statistical methods, the study provides a robust framework to analyze the delayed and non-linear relationships between heat waves, green infrastructure, and health outcomes, accounting for potential confounders and effect modifiers.
We employed a quasi-Poisson time-series regression combined with a Distributed Lag Non-linear Model (DLNM) cross-basis to characterize the non-linear and delayed effects of mean temperature on daily emergency department (ED) visits. The crosspred() function, which computes temperature- and lag-specific relative risks (RR) by integrating the exposure–response and lag–response dimensions of the cross-basis, was used to estimate RR and their 95% confidence intervals. This function exponentiates the model’s linear predictor to compare the risk of ED visits at a specified temperature (e.g., 31.75 °C, approximately the 95th percentile) with the risk at a reference temperature. For the main effect, the reference temperature was 17 °C (25th percentile), representing cooler baseline conditions, while for the added effect, the reference was 22.70 °C (50th percentile), representing typical median temperature conditions. In DLNM analyses, the RR surface illustrates how risk varies simultaneously across temperature values and lag days. RR is interpreted as the ratio of the risk at a specific temperature and lag to the risk at the selected reference temperature. An RR greater than 1 indicates an increased risk during heat wave conditions, an RR less than 1 indicates a reduced risk, and an RR equal to 1 reflects no difference in risk.
To assess both immediate and delayed health effects of heat exposure, multiple lag periods were analyzed. Although an initial maximum lag of 14 days (Lag0–14) was considered to capture potential delayed effects of heat waves on health outcomes, high variability in risk estimates led to a focus on shorter lag periods: Lag0, Lag0–2, Lag0–4, and Lag0–7. These lag periods were chosen as they provide a more stable and reliable assessment of short-term health impacts, aligning with previous studies that have identified stronger and more consistent associations within shorter lag periods.
For each quartile of green infrastructure, Relative Risk (RR) estimates and 95% confidence intervals (CI) were calculated and compared to evaluate how vegetation coverage modifies heat-related health risks. Accordingly, differences across NDVI quartiles are interpreted as reflecting differential vulnerability or modifying effects of green infrastructure, rather than spatial variation in temperature or air pollution exposure. By restricting the analysis to Lag0–7, this study ensures a more precise estimation of the direct effects of heat waves on health outcomes, minimizing potential confounding from weather fluctuations, air pollution changes, and behavioral adaptations over extended time frames.
Model adequacy was evaluated using the Quasi-Akaike Information Criterion (QAIC) to guide the selection of degrees of freedom and lag structure. Sensitivity analyses were conducted by comparing effect estimates across alternative lag periods (Lag0–14), with longer lag estimates showing substantial statistical instability and wide confidence intervals. The consistency of results across NDVI quartiles and demographic subgroups further supports the robustness of the modeling approach.
2.3.1. Stratified Analysis
We conducted stratified analyses to explore potential effect modification by gender (male vs. female) and age groups (≤65 years vs. >65 years). This stratification helps identify subpopulations that may be more susceptible to heat-related health risks, facilitating targeted public health interventions. Such demographic-specific analyses are crucial for understanding vulnerabilities within populations.
2.3.2. Statistical Significance Testing
To assess differences in relative risks across varying levels of green infrastructure, we applied the Kruskal–Wallis test. This non-parametric method is suitable for comparing multiple independent groups, especially when the data do not follow a normal distribution. All analyses were conducted in R version 4.X (R Foundation for Statistical Computing), using the stats package for non-parametric testing. A p-value of less than 0.05 was considered statistically significant, indicating meaningful differences in heat-related health risks across different levels of green infrastructure.
By employing these statistical methods, our analysis offers a comprehensive evaluation of how green infrastructure modifies the relationship between heat exposure and health outcomes, while accounting for potential confounders and effect modifiers. This study integrates climate data, air quality monitoring, green infrastructure assessment, and health records to assess the impact of heat waves on urban health. The findings provide valuable insights into the role of green infrastructure in mitigating heat-related illnesses and contribute to evidence-based urban planning strategies aimed at enhancing climate resilience.
3. Results
This section presents the empirical findings on the relationship between green infrastructure, extreme heat, and heat-related health risks in Tabriz in the study period. The results are organized to reflect descriptive statistics, spatial patterns of vegetation and heat exposure, and relative health risks across quartiles of green infrastructure. Key indicators include the Normalized Difference Vegetation Index (NDVI), temperature trends, and heat wave definitions. Health outcomes are evaluated using emergency department (ED) visits for cardiovascular, respiratory, and all-cause diseases. Each analysis integrates multiple lag periods (Lag0 to Lag7) to account for both immediate and delayed health effects with lag non-linear distribution model (DLNM). Kruskal–Wallis tests were applied to assess statistical significance across quartiles. These results offer a detailed examination of how varying levels of green space modify the relative risk of heat-related illness during extreme temperature events, highlighting both protective and unexpected patterns.
3.1. Descriptive Statistics
3.1.1. NDVI
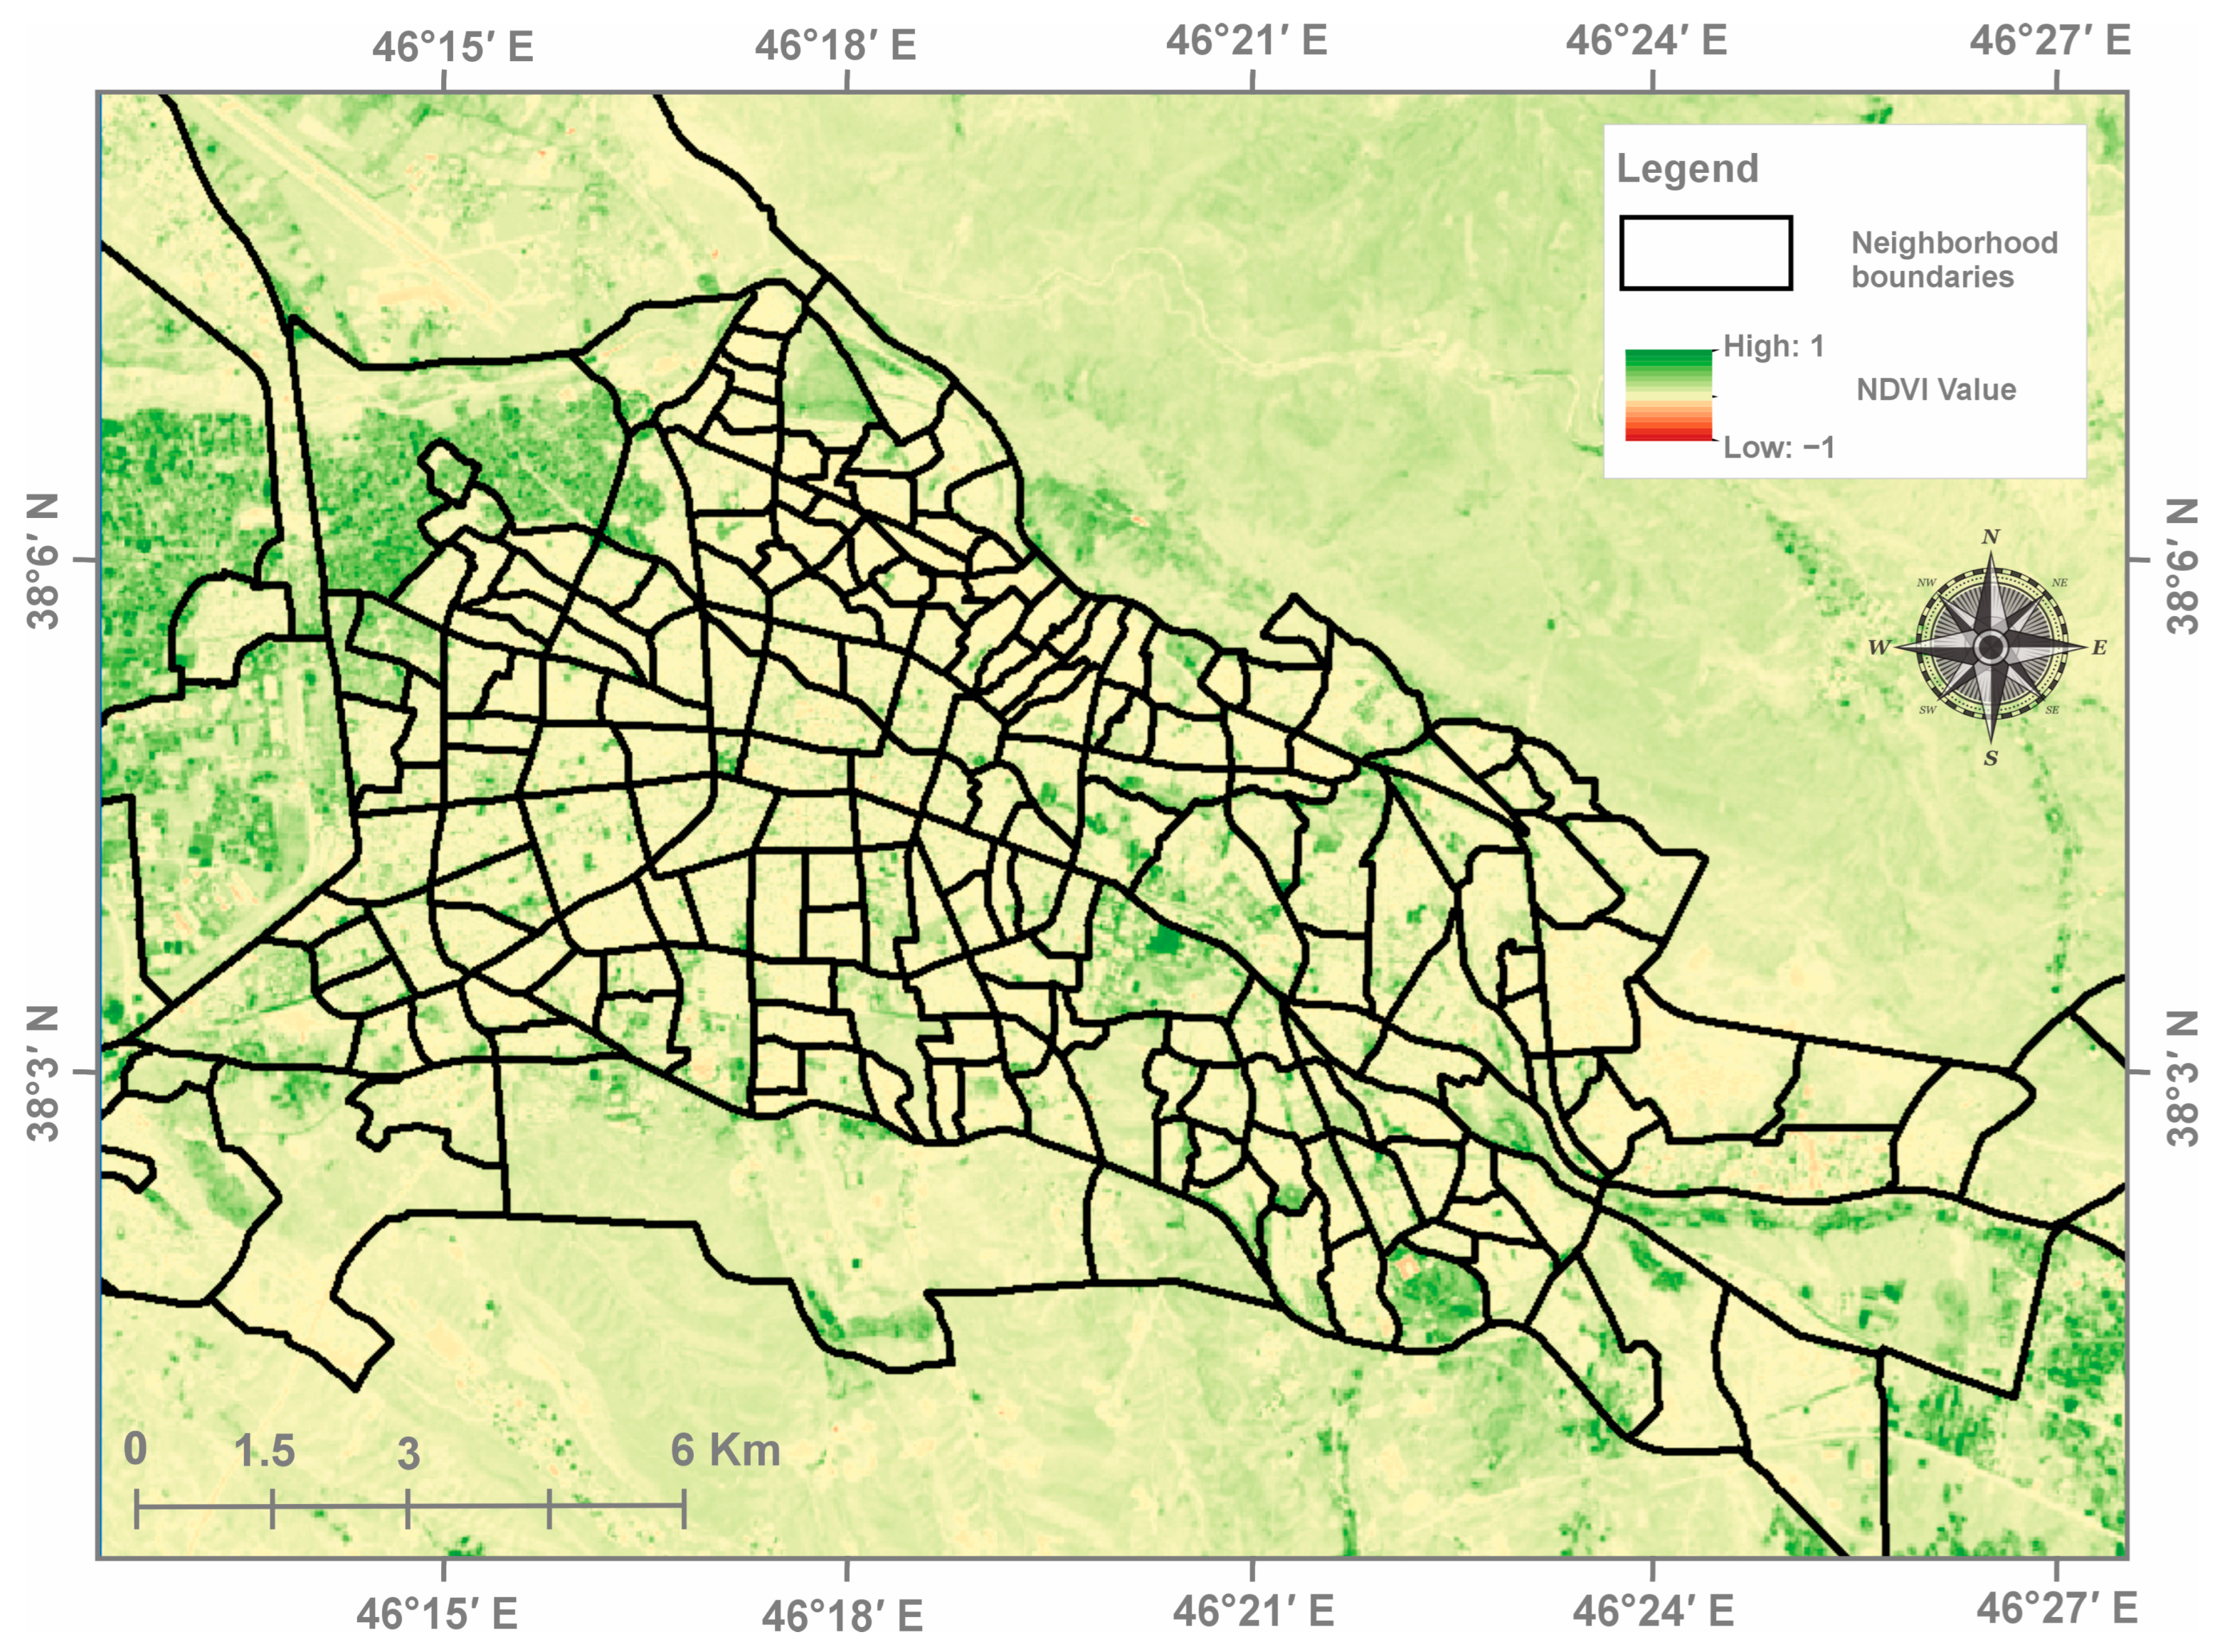
To quantify green infrastructure, the Normalized Difference Vegetation Index (NDVI) was derived from Landsat 8 images for the months of April through September during the analysis period. For each month, we selected the Landsat 8 scene with the lowest cloud cover (less than 5%). This procedure resulted in a total of 18 images (6 months × 3 years), which minimized the influence of cloud contamination. NDVI was calculated in GIS software using the standard Landsat 8 bands (Band 5 and Band 4). Each NDVI raster was clipped to the boundaries of the 190 neighborhood units using the Extract by Mask tool (
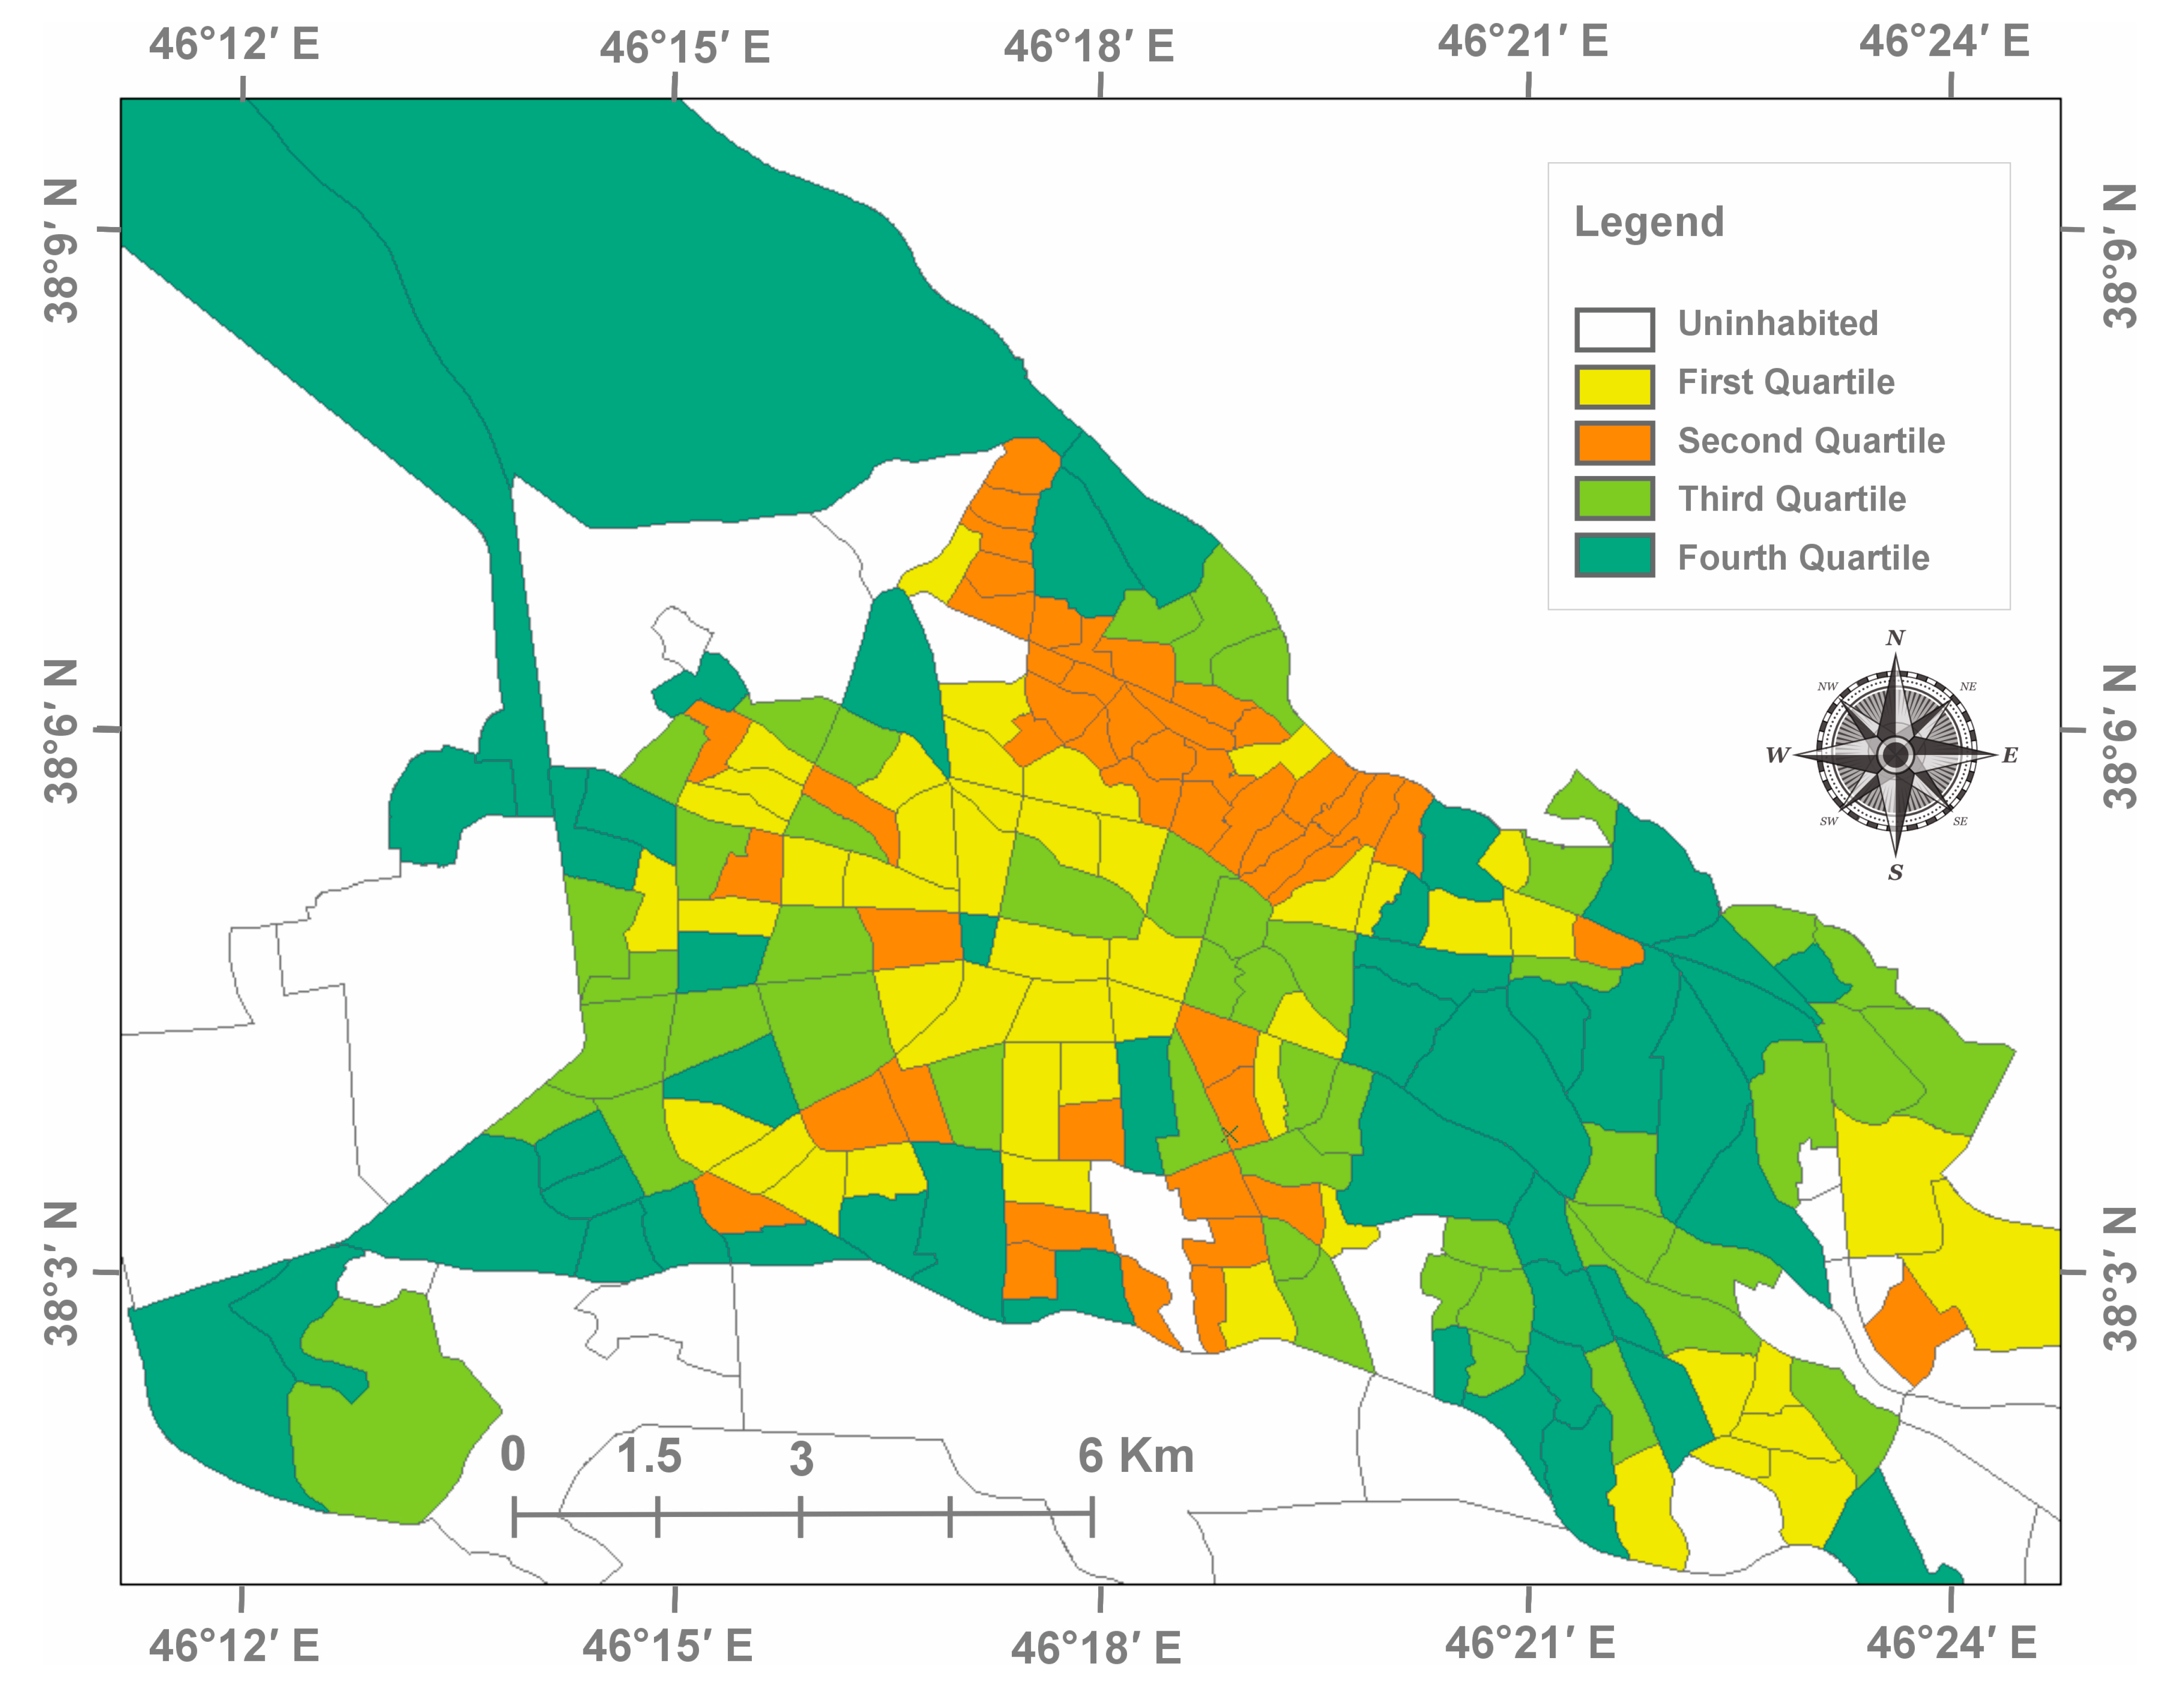
Figure 5). For every neighborhood, the software produced descriptive statistics including the number of NDVI pixels, median, standard deviation, minimum, and maximum values. The median NDVI value for each neighborhood was used for the analysis. Neighborhoods were classified into four NDVI-based categories using quartile classification (
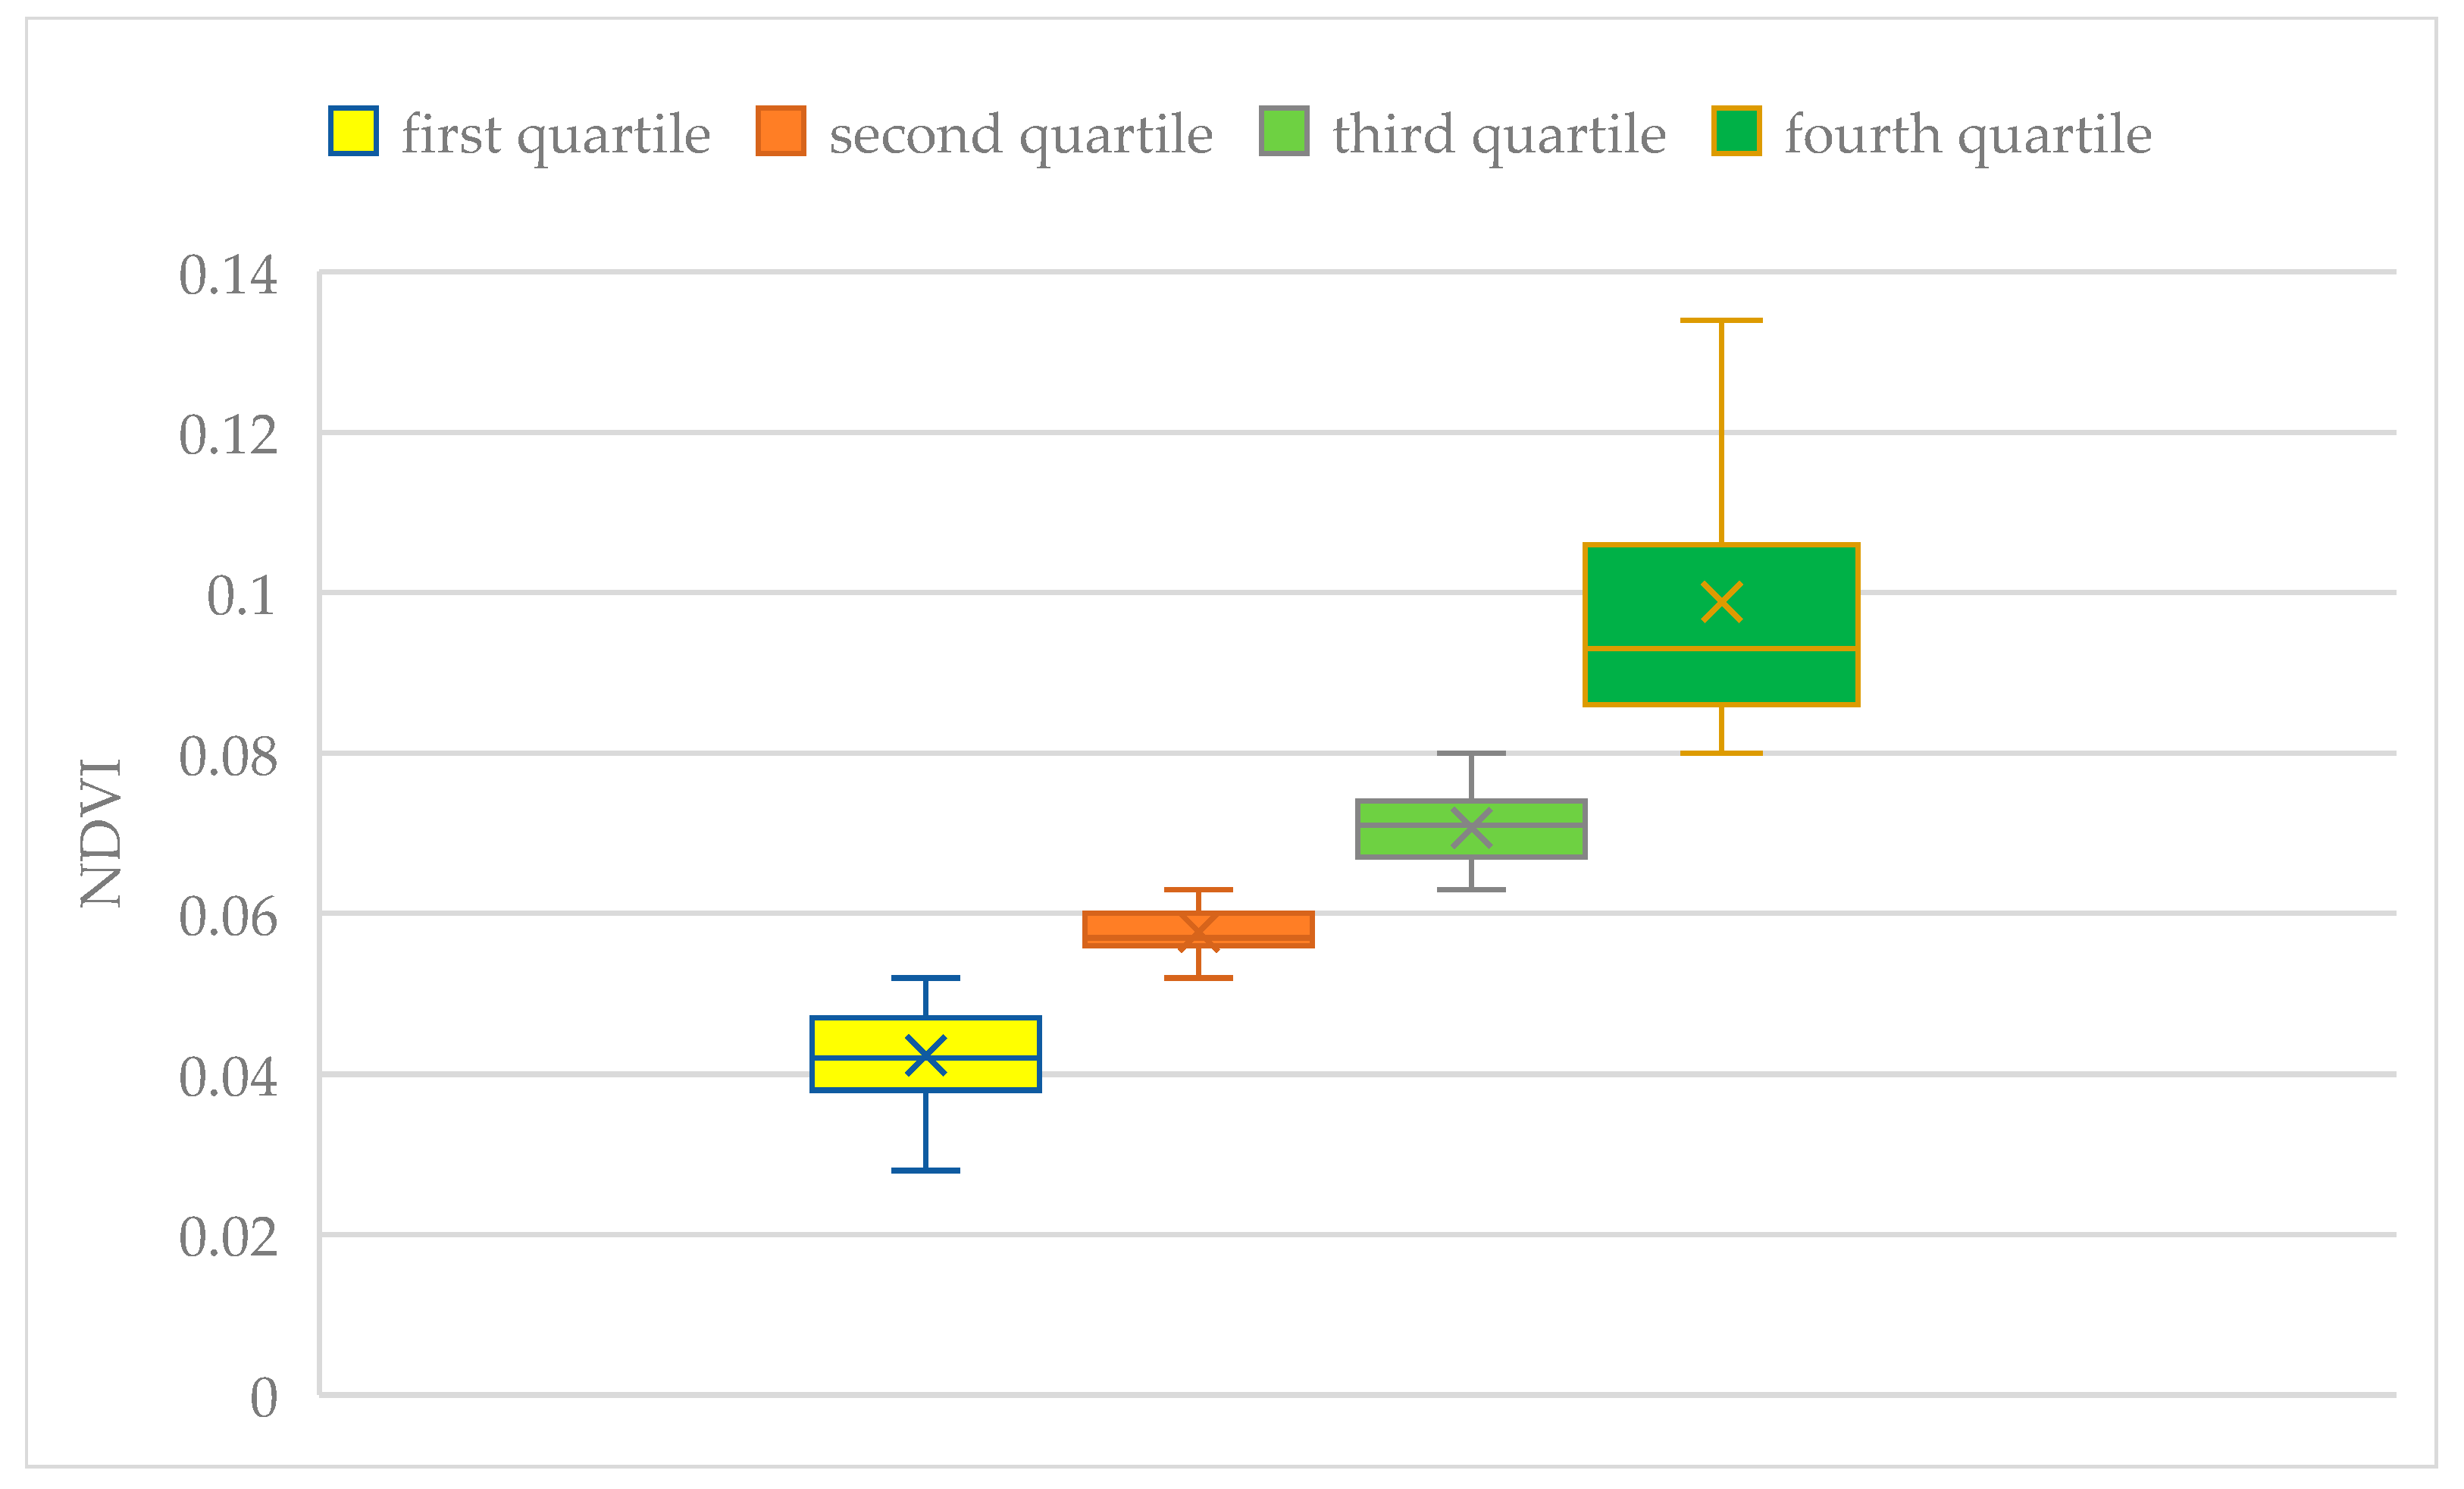
Figure 6). All NDVI values were sorted from lowest to highest and divided into four equal-sized groups (25% each), with Quartile 1 representing the lowest vegetation levels and Quartile 4 the highest (
Figure 7).
The mean NDVI values for the quartiles were as follows. First Quartile (Lowest Green Space): Mean NDVI = 0.042, with values ranging from 0.028 to 0.052. Second Quartile (Low Green Space): Mean NDVI = 0.057, with values ranging from 0.053 to 0.063. Third Quartile (Moderate Green Space): Mean NDVI = 0.070, with values ranging from 0.064 to 0.080. Fourth Quartile (Highest Green Space): Mean NDVI = 0.098, with values ranging from 0.081 to 0.144. For the entire city, the average NDVI was 0.066, with a maximum value of 0.093. Also, the average and maximum NDVI values for each of the 190 neighborhoods are presented in
Table A1 in
Appendix A. Although the NDVI values appear low, these levels are characteristic of arid and semi-arid urban regions like Tabriz, where vegetation cover is limited and often fragmented.
These findings highlight significant variations in vegetation coverage across urban neighborhoods in Tabriz. The NDVI quartile classification was used to examine the modifying effect of green infrastructure on heat-related health risks.
3.1.2. Temperature
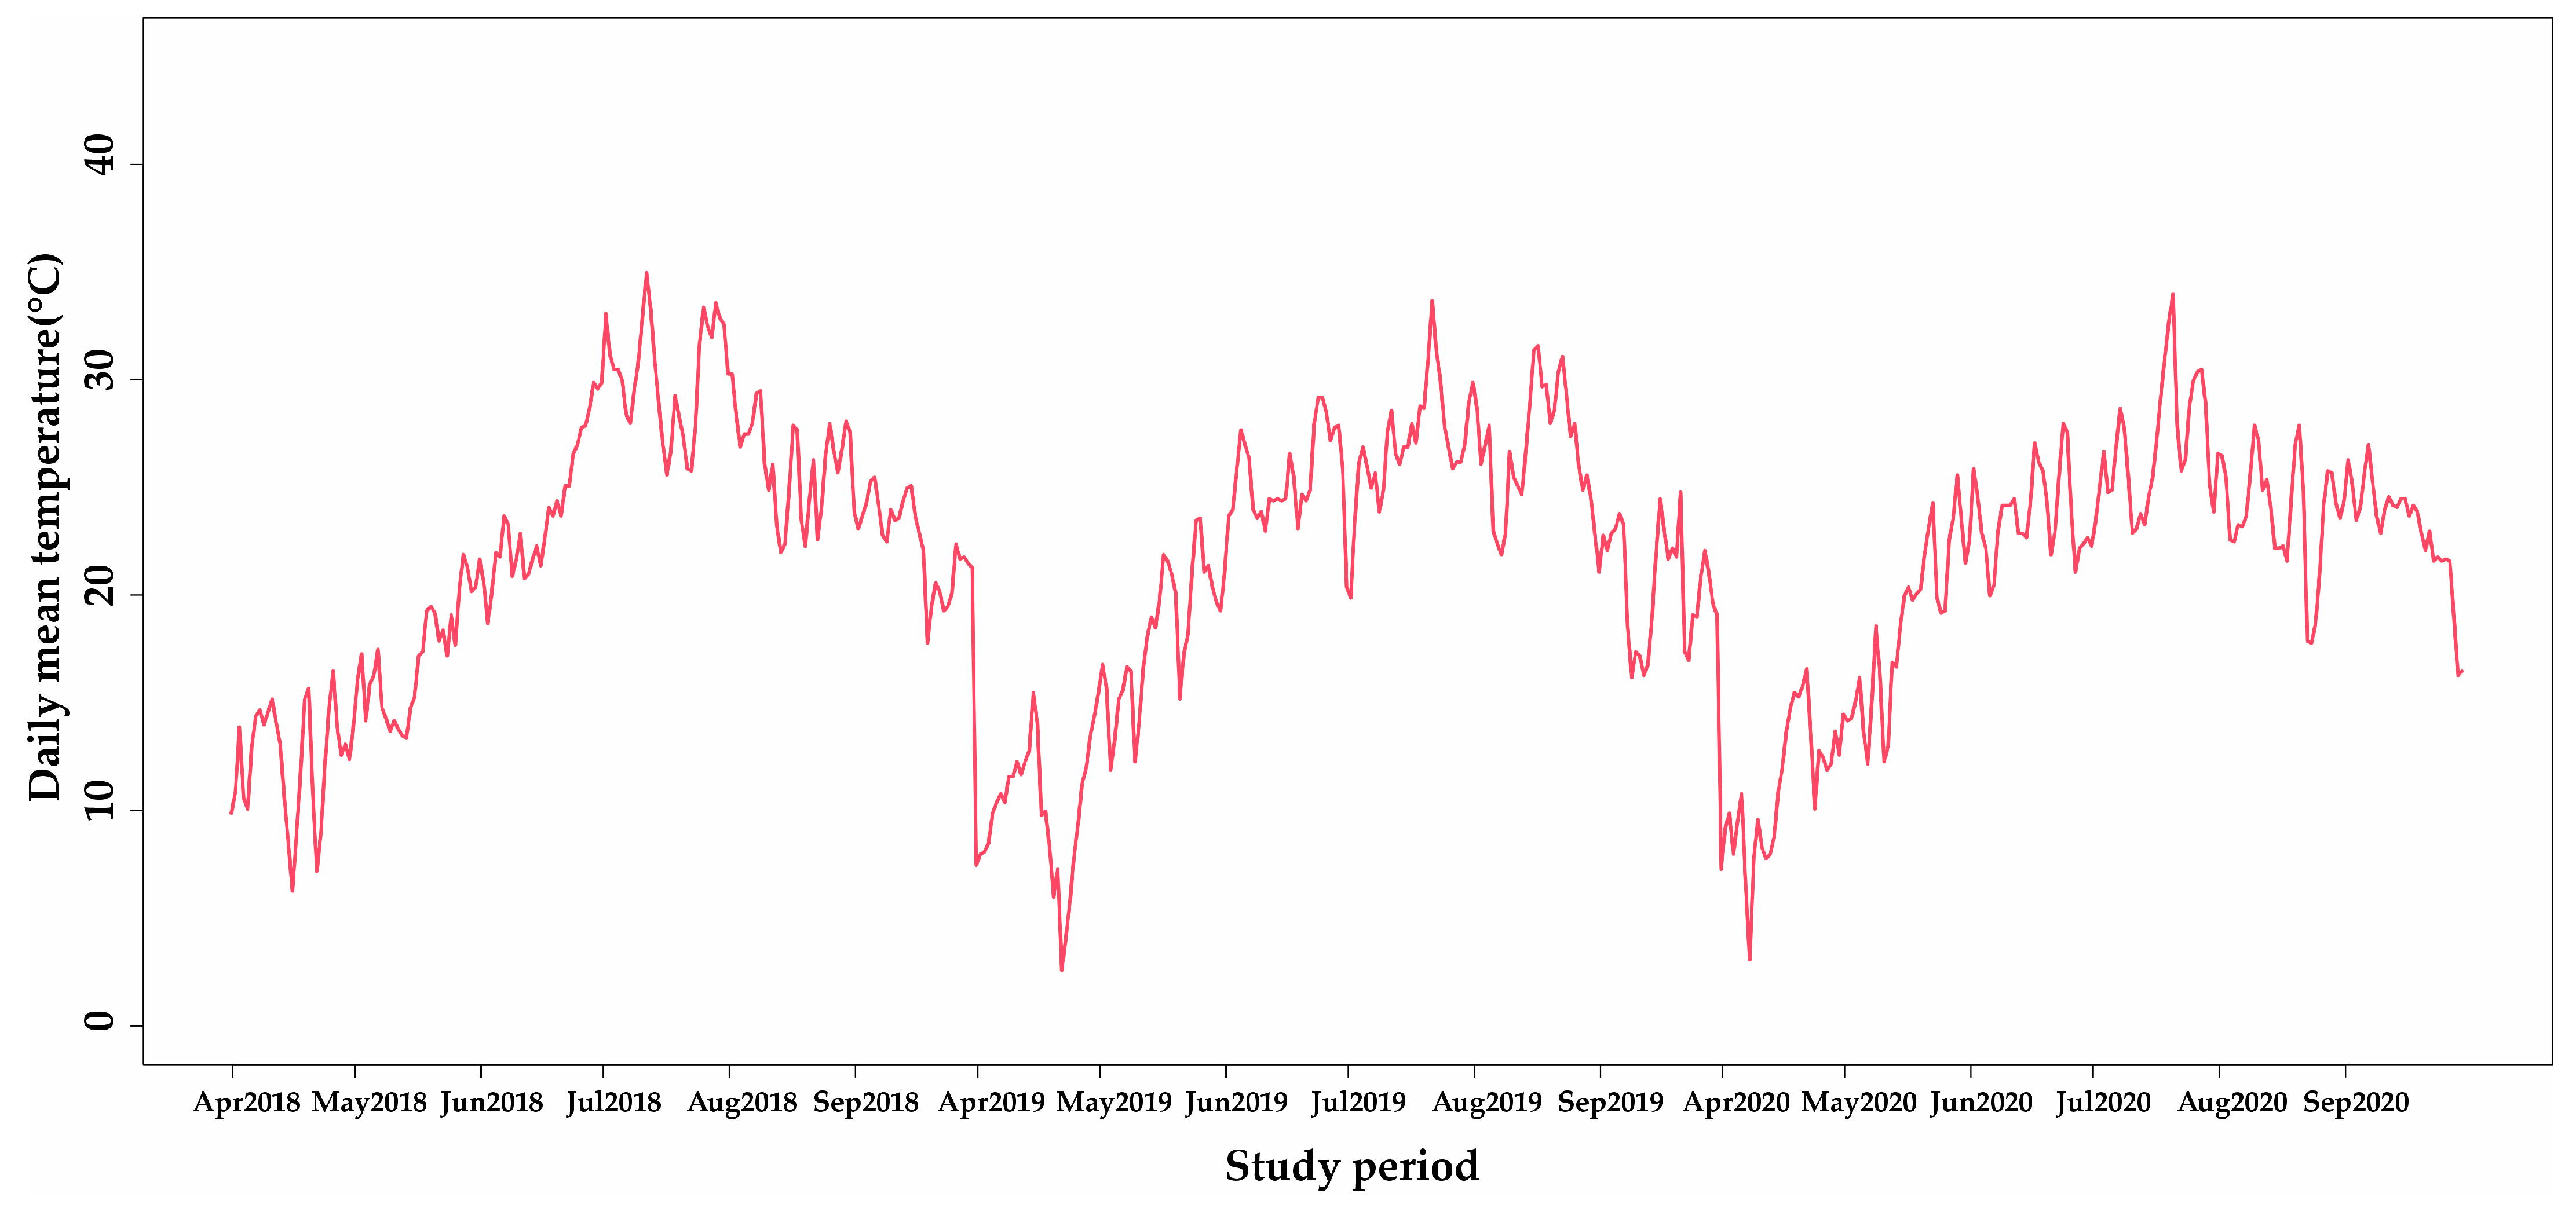
Mean Temperature: Average: 21.6 °C, Range: 2.7–35.1 °C, Seasonal Variation: Warmer months (June–August) exhibited higher temperatures, with extreme heat waves recorded in July and August. Minimum Temperature: Average: 15.5 °C, Range: −0.2–30 °C, Coldest months: Early April and late September had the lowest recorded minimum temperatures. Maximum Temperature: Average: 28.2 °C, Range: 6.6–41 °C, Hottest Days: June–August had extreme high temperatures, exceeding 38 °C during peak heat wave events (
Figure 8).
These data help assess the intensity of heat waves and their impact on urban populations. By integrating temperature fluctuations with NDVI classifications, this study examines whether green infrastructure mitigates heat stress and related health risks.
3.1.3. Heat Wave Occurrence and Trends in Tabriz (2018–2020)
In this study, one definition of heat waves (H1) was applied to analyze the frequency and duration of extreme heat events in Tabriz in the study period. This definition was selected based on previous research to capture both short-term and prolonged temperature extremes.
H1. A heat wave was defined as two or more consecutive days where the average daily temperature was at or above the 95th percentile.
The total number of heat wave days captured 60 days over the three-year period. Heat waves occurred primarily between late June and late August, with July being the peak month across all definitions. 2019 had the highest number of prolonged heat waves, especially in July and August, while 2020 exhibited shorter but more frequent heat waves in late June and July.
Annual Variations in Heat Waves: In 2018, heat waves began earlier, with notable events starting in late June and continuing through early August. In 2019, The most extreme and prolonged heat waves occurred, with consecutive events spanning July and August. In 2020, heat waves were shorter but more frequent, with multiple events occurring in June and July, followed by a decline in August (
Table 2).
These findings confirm that heat waves in Tabriz are intensifying, particularly in mid-to-late summer. The variability across definitions underscores the importance of using multiple criteria to assess the true impact of extreme heat events on urban populations. This analysis provides a critical foundation for evaluating the health effects of heat waves and determining whether green infrastructure plays a mitigating role in reducing heat-related health risks.
3.1.4. Air Pollutants
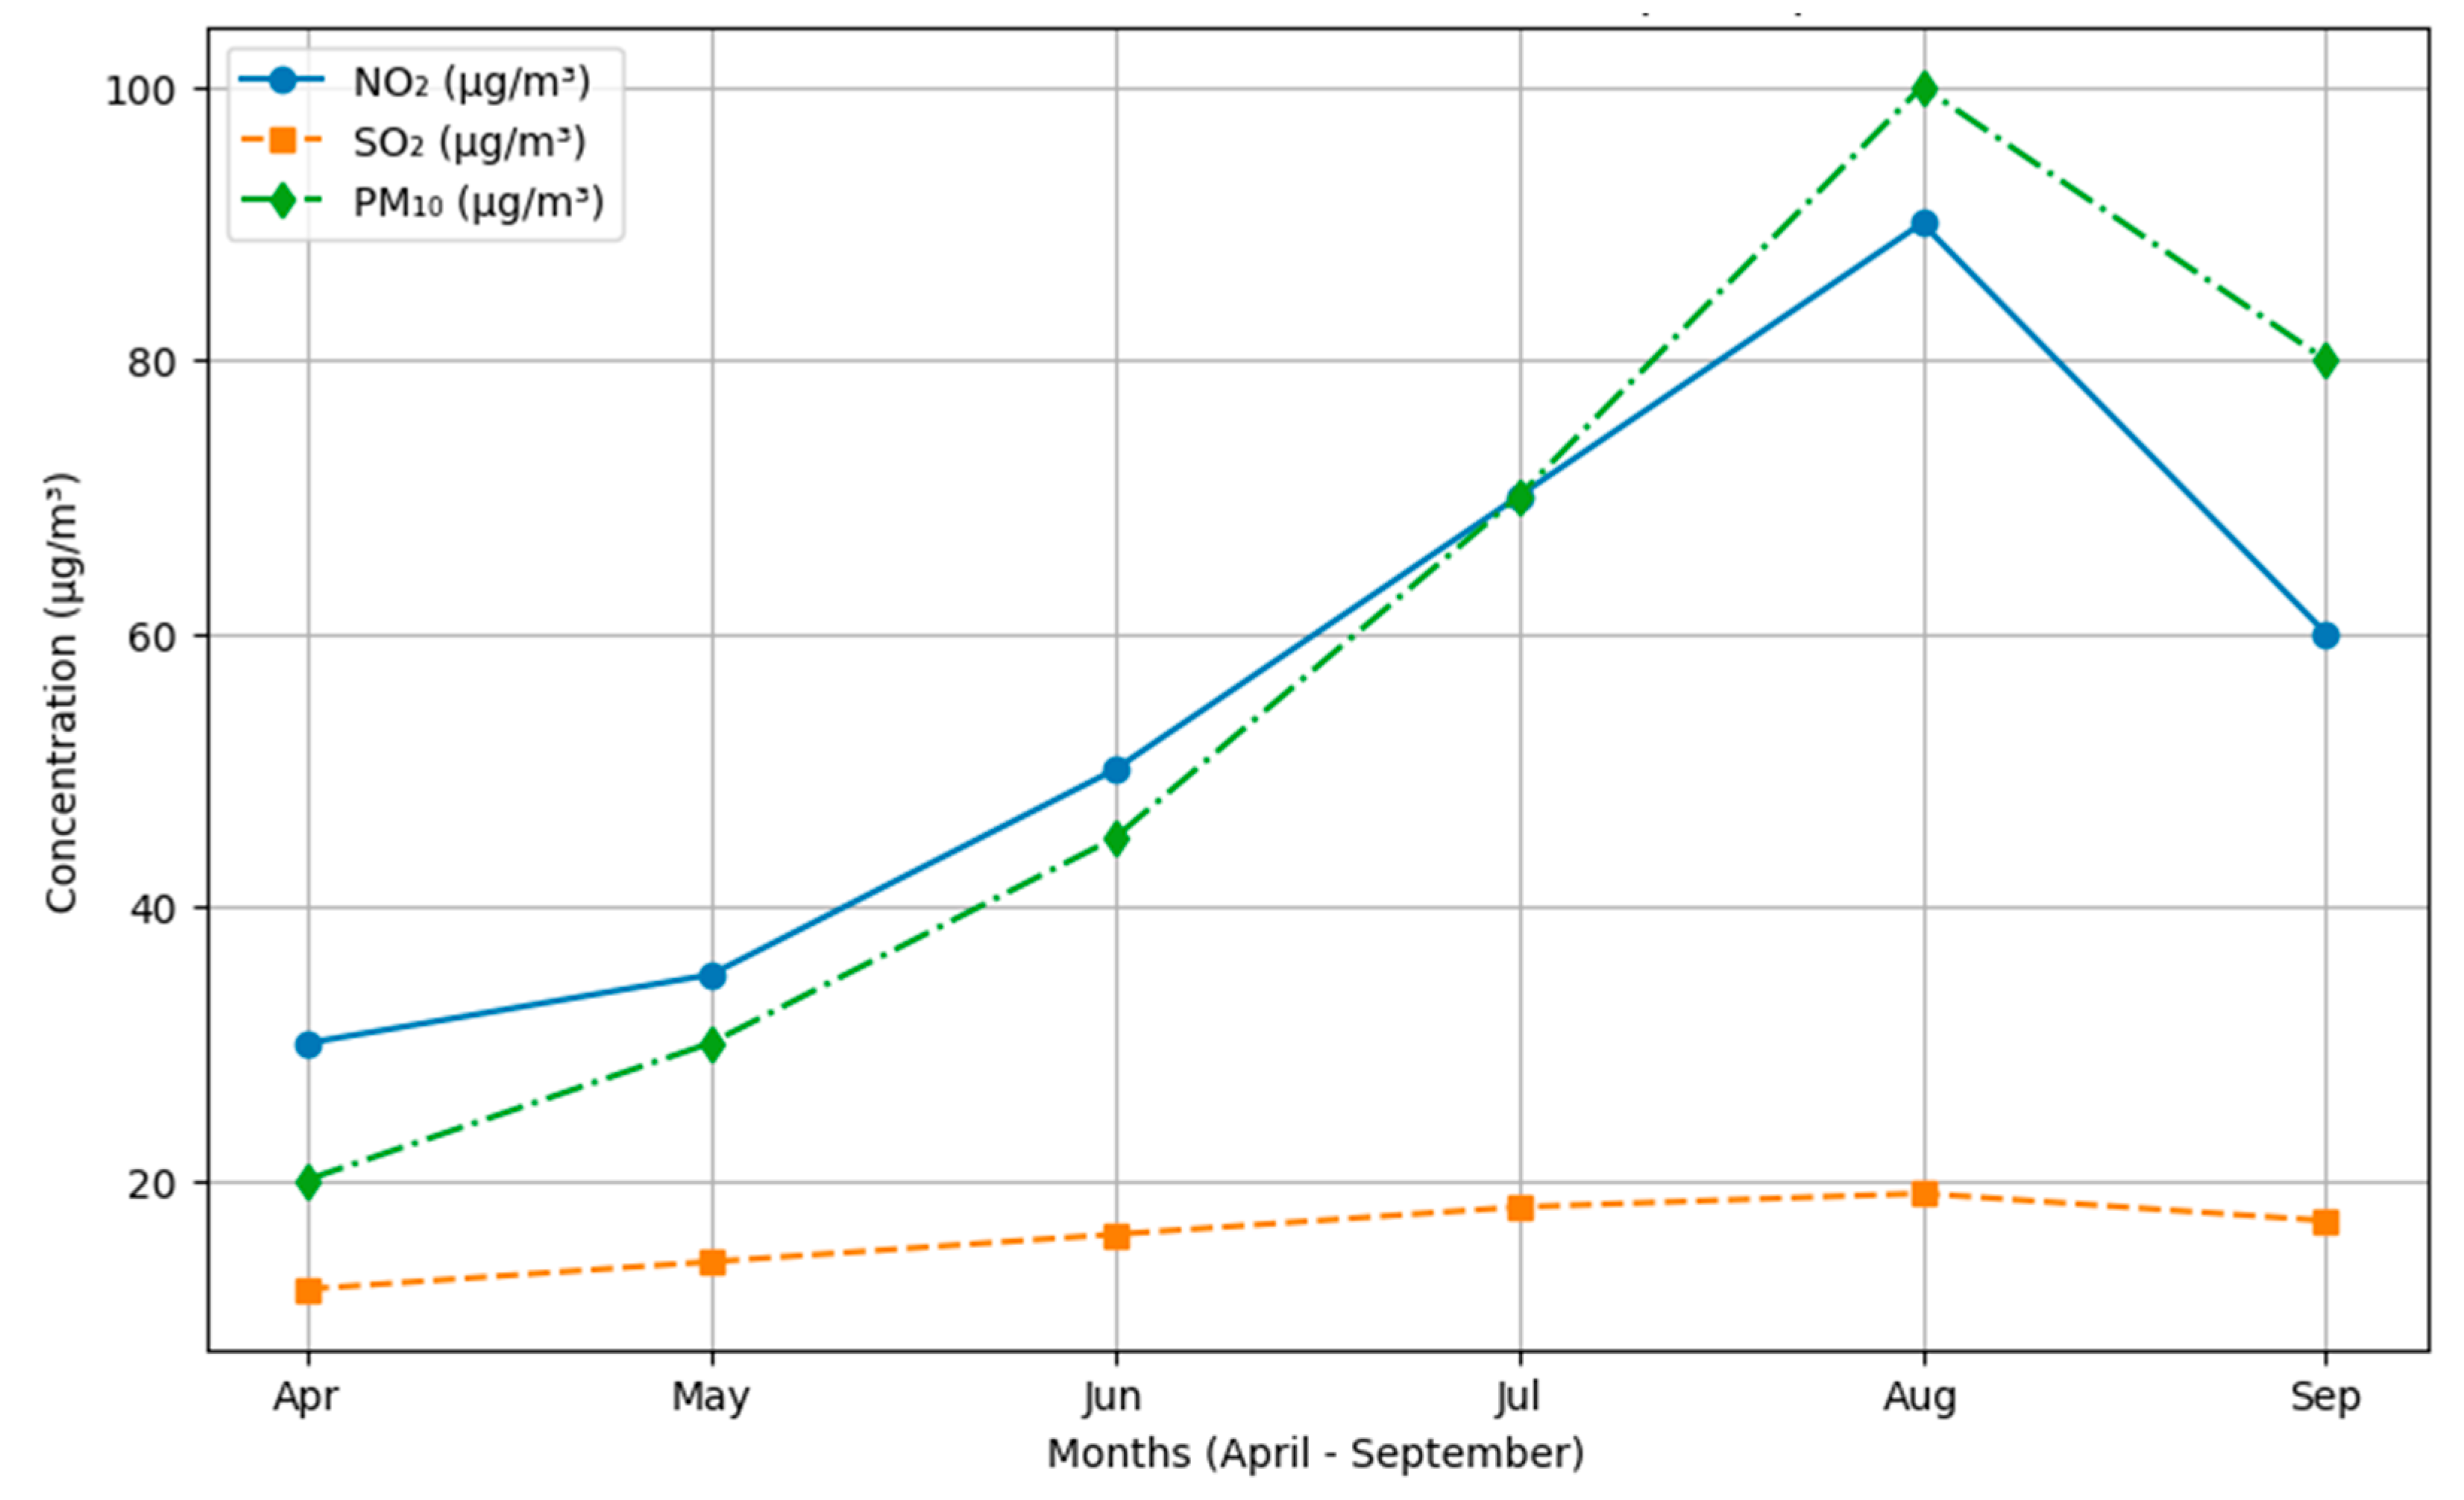
This study analyzed air pollution levels in Tabriz during the spring and summer months (April–September) in the study period. Data on nitrogen dioxide (NO
2), sulfur dioxide (SO
2), and particulate matter (PM
10) were collected from six air monitoring stations to assess their potential role as confounding factors in heat-related health risks (
Figure 9).
NO2 Levels: Mean concentrations were moderate to high, with peaks exceeding 90 µg/m3 on extreme days. Higher values were observed in June, July, and August, coinciding with the highest temperatures and urban activity levels.
SO2 Levels: Relatively stable, with values mostly between 10–20 µg/m3. A few short-term spikes were recorded, but overall concentrations remained within expected seasonal variations.
PM10 Levels: Highly variable, with concentrations ranging from 10 µg/m3 to over 100 µg/m3. The highest levels were recorded in July and August, suggesting a potential link to increased atmospheric stagnation, dust storms, and reduced air circulation during peak heat events.
These pollution metrics were integrated into the study as control variables, ensuring that observed health effects were primarily due to heat waves rather than air quality fluctuations. The findings help isolate the impact of heat exposure and green infrastructure on emergency department (ED) visits while adjusting for environmental factors that may influence respiratory and cardiovascular health outcomes.
3.2. Health Outcomes
Data were based on daily counts of hospital-admitted emergency department (ED) visits in the study period, and were analyzed by subgroups of age and gender. In 2018 and 2019, the daily ED visits typically ranged roughly between 10 and 30 per day. In contrast, 2020 showed a clear decline in ED admissions, which we hypothesize may be related to changes in healthcare-seeking behavior, reduced service use, or avoidance of hospitals during the COVID-19 pandemic. Accordingly, estimates for the aggregated 2018–2020 period should be interpreted with consideration of potential pandemic-related behavioral effects.
Older adults (65+) consistently represent the majority of admissions, frequently comprising 70–80% of daily visits. Gender distribution fluctuates from day to day, with no persistent imbalance between males and females. Throughout the following analyses, elevated relative risk (RR) estimates are interpreted as indicative of potential health risk, even when statistical precision is limited, consistent with epidemiological practice in environmental health research.
3.2.1. Relative Risk of Cardiovascular Disease Across Quartiles
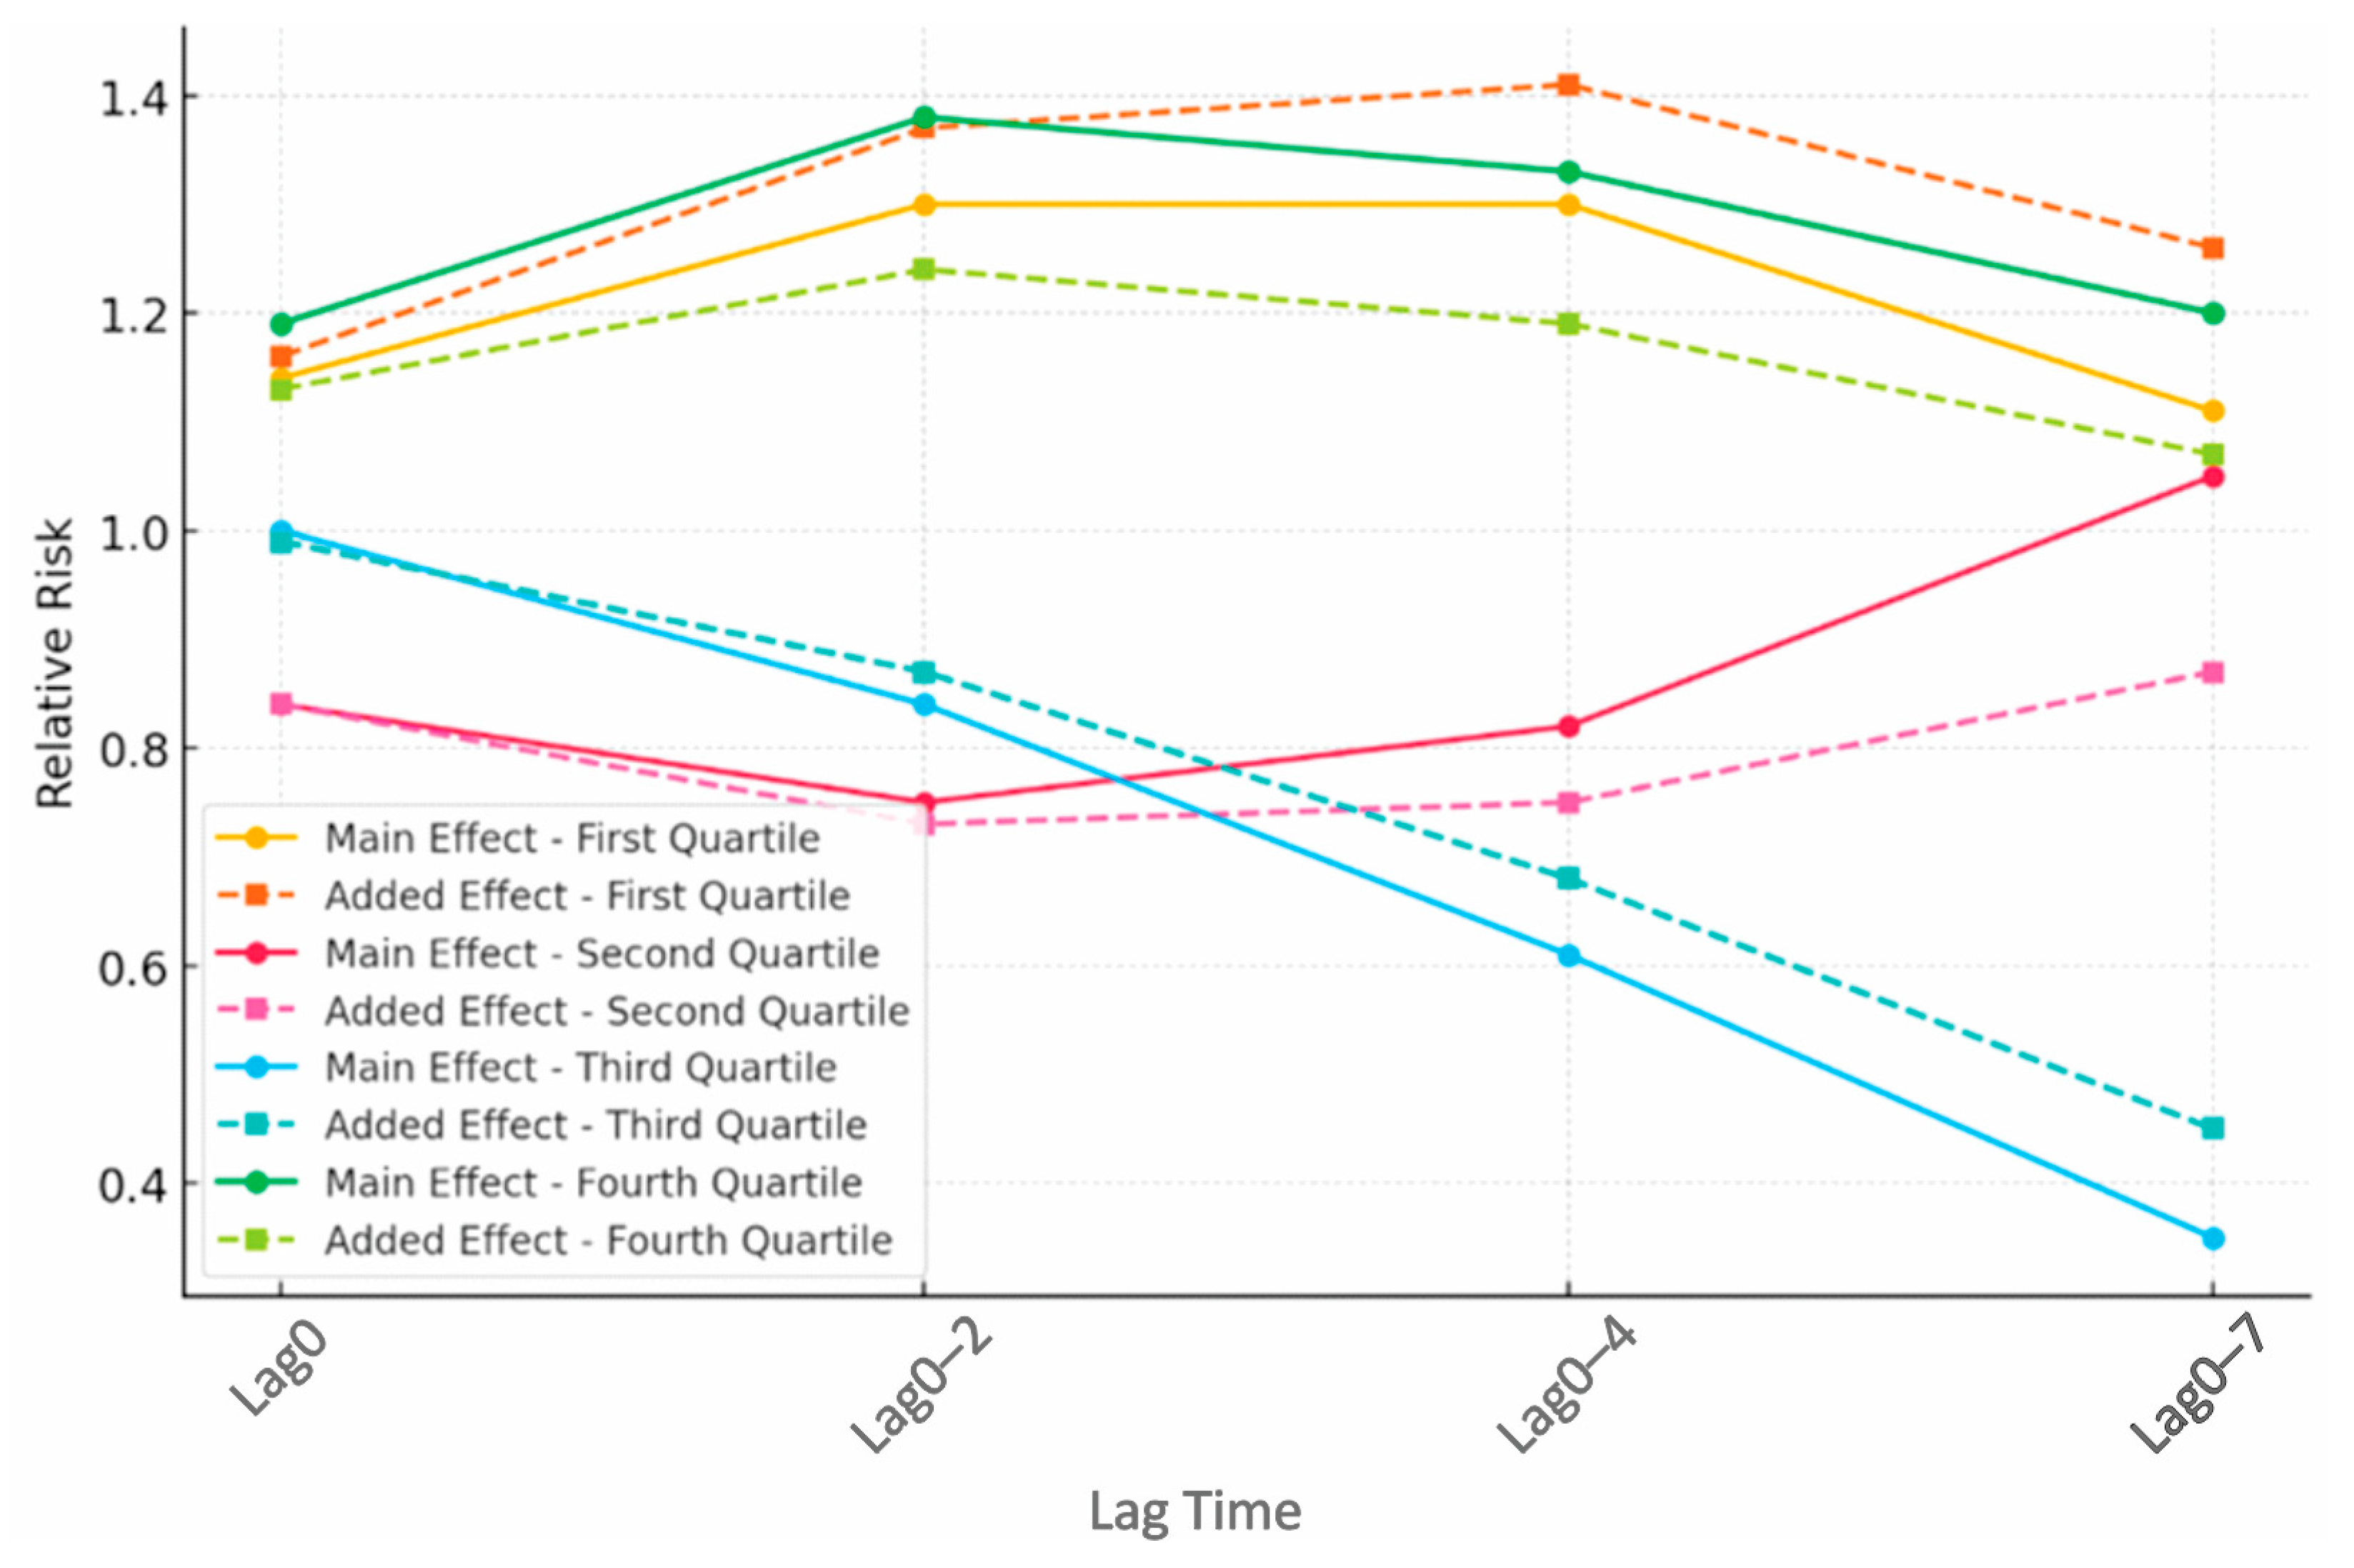
The analysis of cardiovascular disease (CVD) risk across green infrastructure quartiles revealed clear and consistent differences in relative risk patterns during heat waves (
Table 3;
Figure 10). The first quartile, which represents neighborhoods with negligible green space, exhibited the highest relative risk estimates across multiple lag periods. The Main Effect RR peaked at Lag0–2 (1.30, 95% CI: 0.55–3.10) and remained above 1.0 across Lag0–Lag7, indicating a sustained elevation in cardiovascular risk. The Added Effect RR followed a similar pattern, reaching its highest value at Lag0–4 (1.41, 95% CI: 0.60–3.32). When stratified by age, individuals aged 65 years or younger showed particularly elevated point estimates at Lag0–4 (RR = 3.57, 95% CI: 0.71–17.87), whereas those older than 65 years exhibited a lower risk at the same lag period (RR = 0.46, 95% CI: 0.08–2.44).
In the second quartile, consisting of neighborhoods with low green space, cardiovascular risk estimates were lower than in the first quartile but remained elevated compared to the third quartile. The Main Effect RR was 0.84 at Lag0 (95% CI: 0.58–1.21), with further declines at later lags, including Lag0–4 (0.82, 95% CI: 0.26–2.56). The Added Effect RR remained below 1.0, reinforcing the protective effect of moderate greenery. Gender differences were observed, with females exhibiting higher point estimates at later lags, peaking at Lag0–7 (RR = 1.66, 95% CI: 0.13–21.10), while males consistently showed lower values across all lag periods, although these subgroup estimates were imprecise.
The third quartile, characterized by moderate green space, demonstrated the lowest relative risk of cardiovascular disease among all groups. The Main Effect RR was near 1.0 at Lag0 (1.00, 95% CI: 0.70–1.41) and decreased below 1.0 at Lag0–2, Lag0–4, and Lag0–7, supporting a mitigating role of moderate vegetation coverage. Among different age groups, individuals aged 65 years or younger had moderate relative risk at Lag0–4 (RR = 1.06, 95% CI: 0.25–4.40), while those older than 65 years exhibited a lower relative risk (RR = 0.32, 95% CI: 0.06–1.61).
In the fourth quartile, representing neighborhoods with the highest levels of green infrastructure, elevated relative risk estimates were observed at several lag periods, including Lag0–2 (RR = 1.38, 95% CI: 0.56–3.42) and Lag0–7 (RR = 1.20, 95% CI: 0.26–5.66). The Added Effect RR showed a modest increase at Lag0–4 (RR = 1.19, 95% CI: 0.48–2.91). These estimates were accompanied by wide confidence intervals, indicating limited statistical precision. As such, the following explanations should be interpreted as hypothesis-generating rather than confirmatory. Potential contributing factors may include increased humidity, reduced airflow in densely vegetated areas, or greater outdoor exposure during extreme heat events. A gender difference was observed, with males showing higher point estimates at Lag0–2 (RR = 2.04, 95% CI: 0.71–5.89), although this estimate was also imprecise.
While quartile-level patterns were statistically supported at the overall distribution level, several stratified estimates—particularly by age and gender—were characterized by wide confidence intervals. These subgroup results should therefore be interpreted cautiously, reflecting limited statistical power rather than absence of risk.
The plotted trends illustrate the relative risk patterns for cardiovascular disease across NDVI quartiles and lag periods (Lag0 to Lag7). The first and fourth quartiles exhibited higher relative risk estimates compared with the second and third quartiles, suggesting greater potential vulnerability in these areas. In contrast, the second and third quartiles demonstrated lower and more stable RR patterns, supporting a mitigating role of moderate green infrastructure in heat-related cardiovascular risks. In the fourth quartile, peaks at Lag0–2 and Lag0–4 were observed; however, these estimates were accompanied by wide confidence intervals and should be interpreted cautiously, with potential explanations—including microclimatic effects or prolonged outdoor exposure—considered hypothesis-generating.
Differences in cardiovascular risk distributions across quartiles were assessed using the Kruskal–Wallis test. The p-values for both the Main Effect (p = 0.0080) and Added Effect (p = 0.0070) were statistically significant, indicating meaningful differences across green infrastructure levels despite imprecision in individual lag-specific estimates.
3.2.2. Relative Risk of Respiratory Disease Across Quartiles
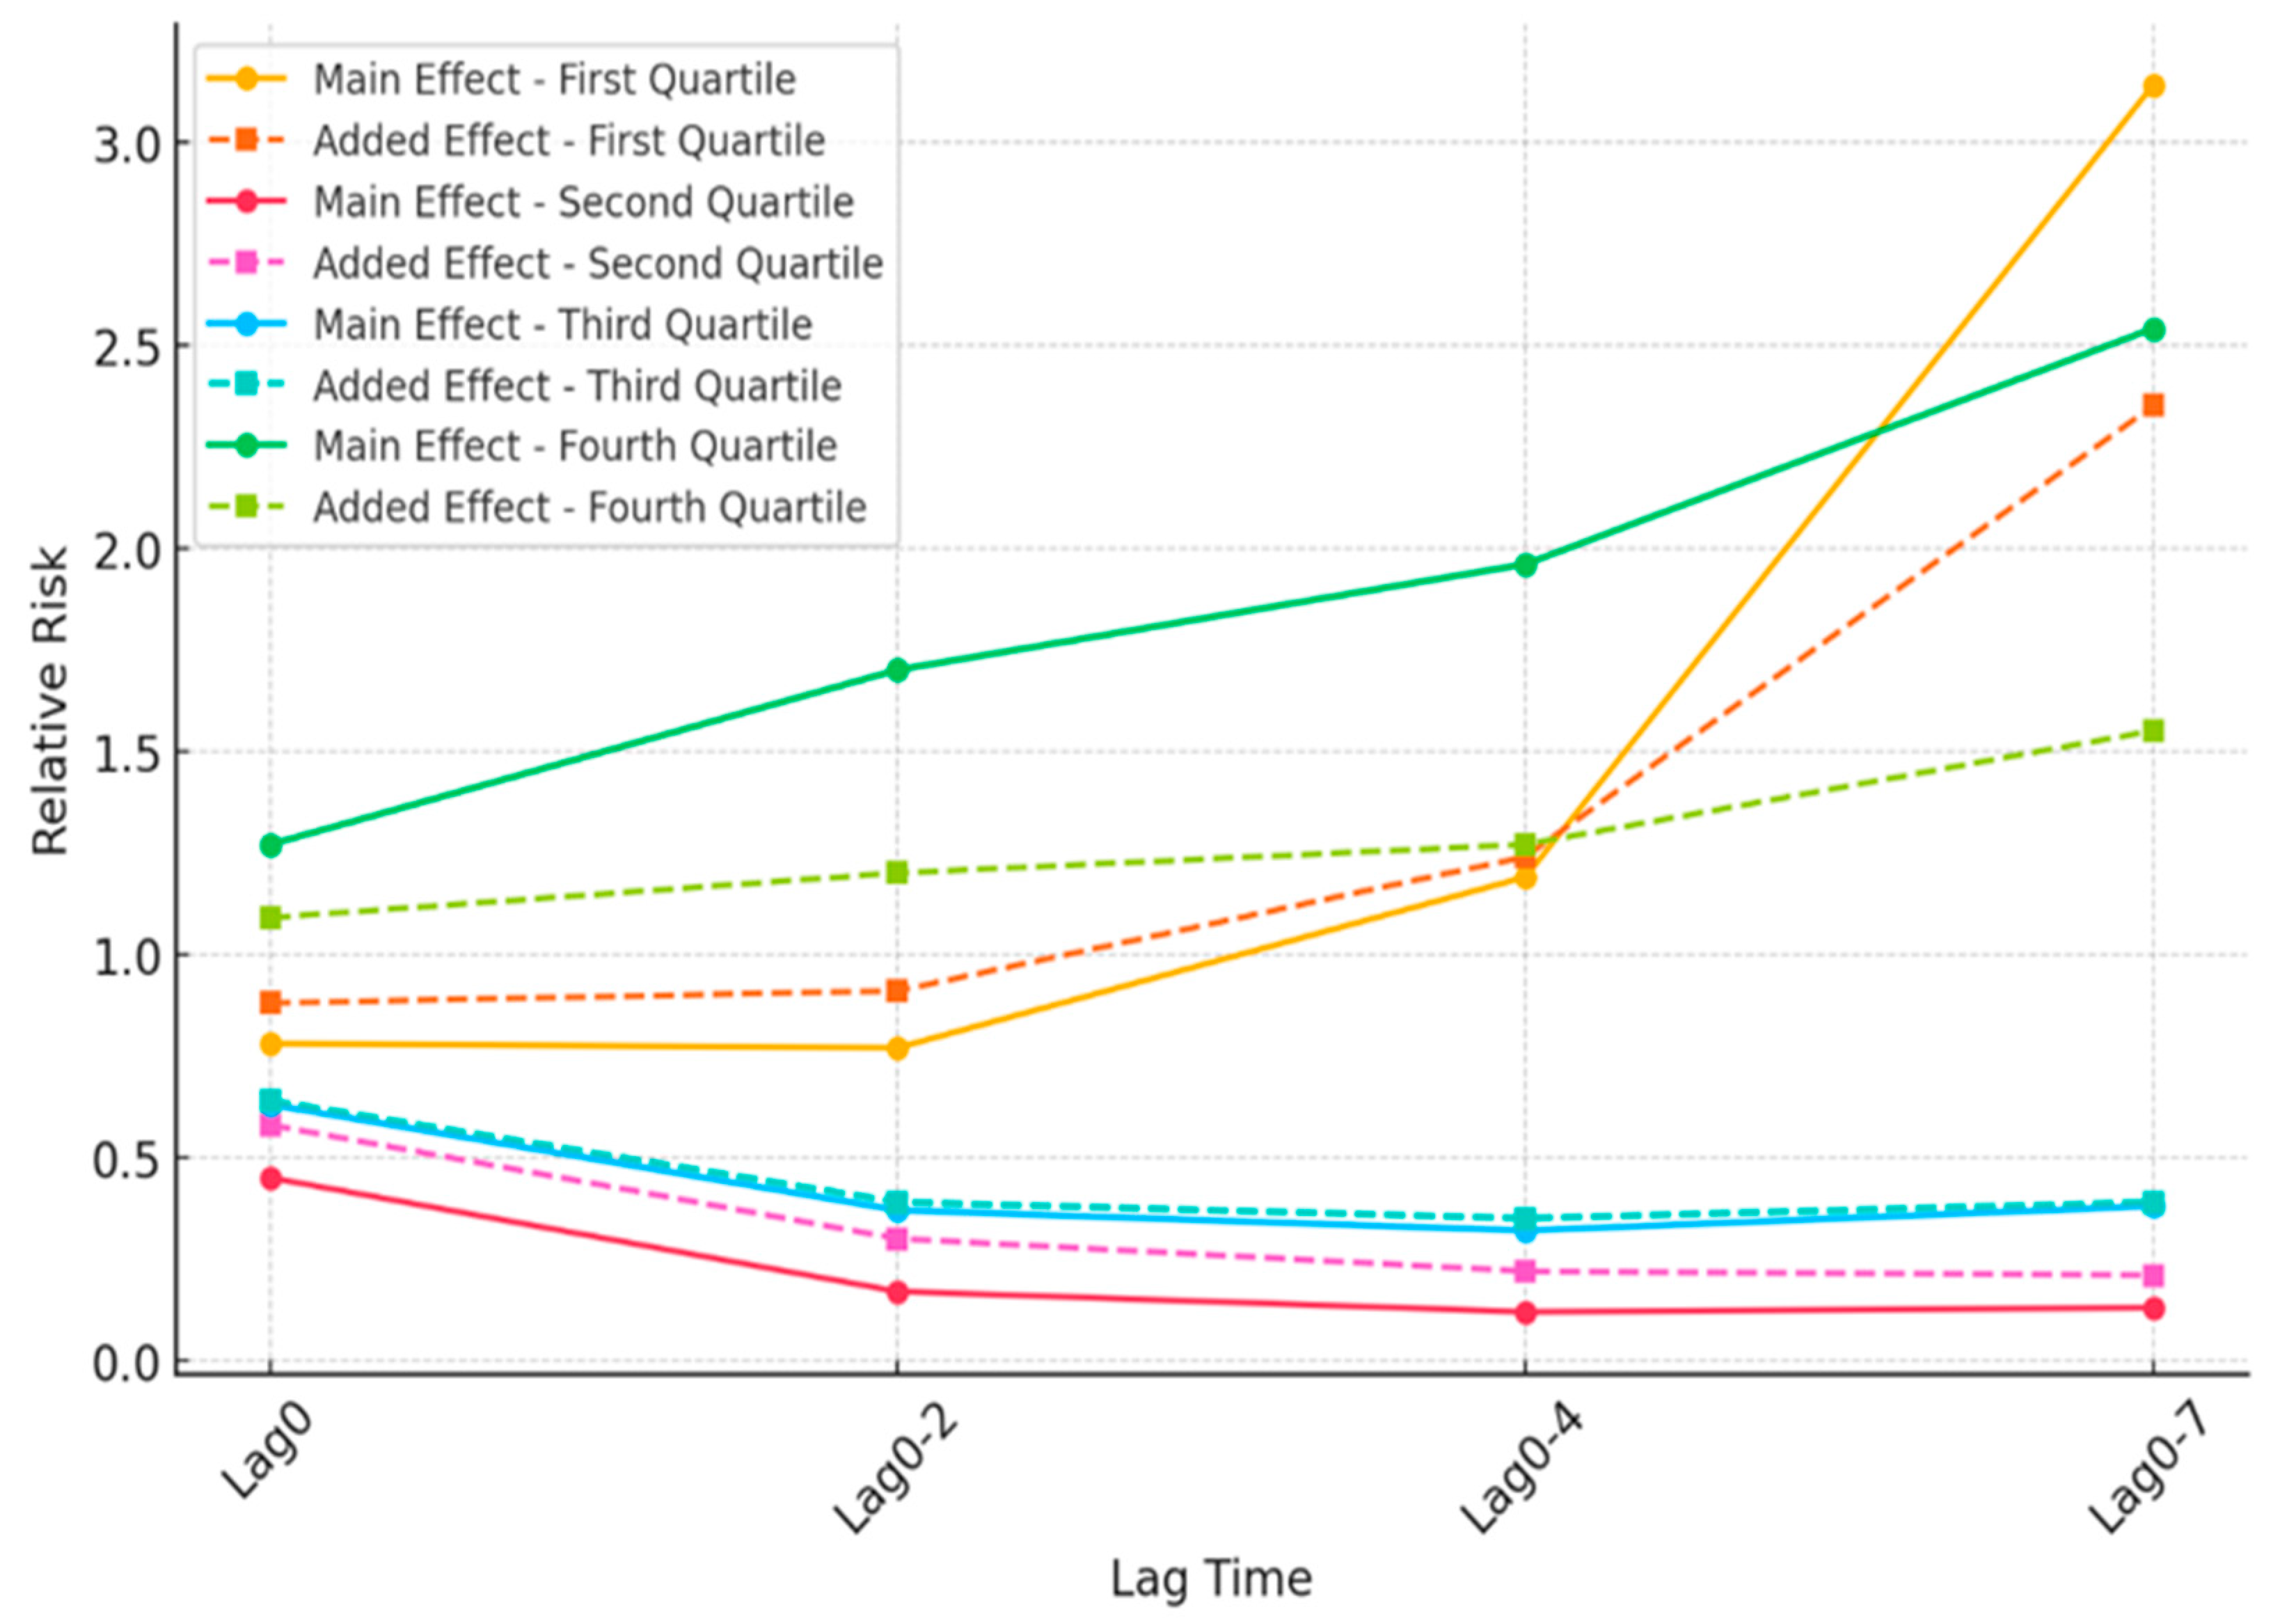
Respiratory disease risk exhibited a pattern broadly consistent with cardiovascular outcomes (
Table 4;
Figure 11). The first quartile showed the highest relative risk estimates, peaking at Lag0–7 (RR = 3.14, 95% CI: 0.23–42.61), indicating substantial vulnerability in neighborhoods with minimal green infrastructure. In contrast, the second and third quartiles demonstrated consistently lower RR estimates across lag periods, suggesting a protective role of moderate vegetation coverage.
In the fourth quartile, elevated respiratory risk estimates were observed at Lag0–7 (RR = 2.54, 95% CI: 0.10–67.37). Although these estimates suggest a potential increase in risk, their interpretation is constrained by wide confidence intervals. Possible explanations—including increased humidity and prolonged outdoor exposure—should therefore be regarded as speculative and exploratory.
Kruskal–Wallis testing confirmed statistically significant differences in respiratory disease risk distributions across quartiles for both the Main Effect (p = 0.0067) and Added Effect (p = 0.0075), supporting the relevance of green infrastructure as a modifier of heat-related respiratory outcomes at the population level. These findings suggest that green infrastructure levels are associated with differences in respiratory health risk during heat waves. The Main Effect results indicate that baseline temperature exposure contributes to variations in respiratory disease risk, while the Added Effect results suggest that prolonged heat exposure may further exacerbate respiratory-related hospitalizations. Overall, the patterns support the hypothesis that neighborhoods with limited green infrastructure may be more vulnerable to heat-related respiratory illnesses, while areas with extensive vegetation coverage may exhibit different risk patterns, potentially influenced by microclimatic factors such as increased humidity or prolonged outdoor exposure.
3.2.3. Relative Risk of All Causes (Cardiovascular, Respiratory, and Stroke)
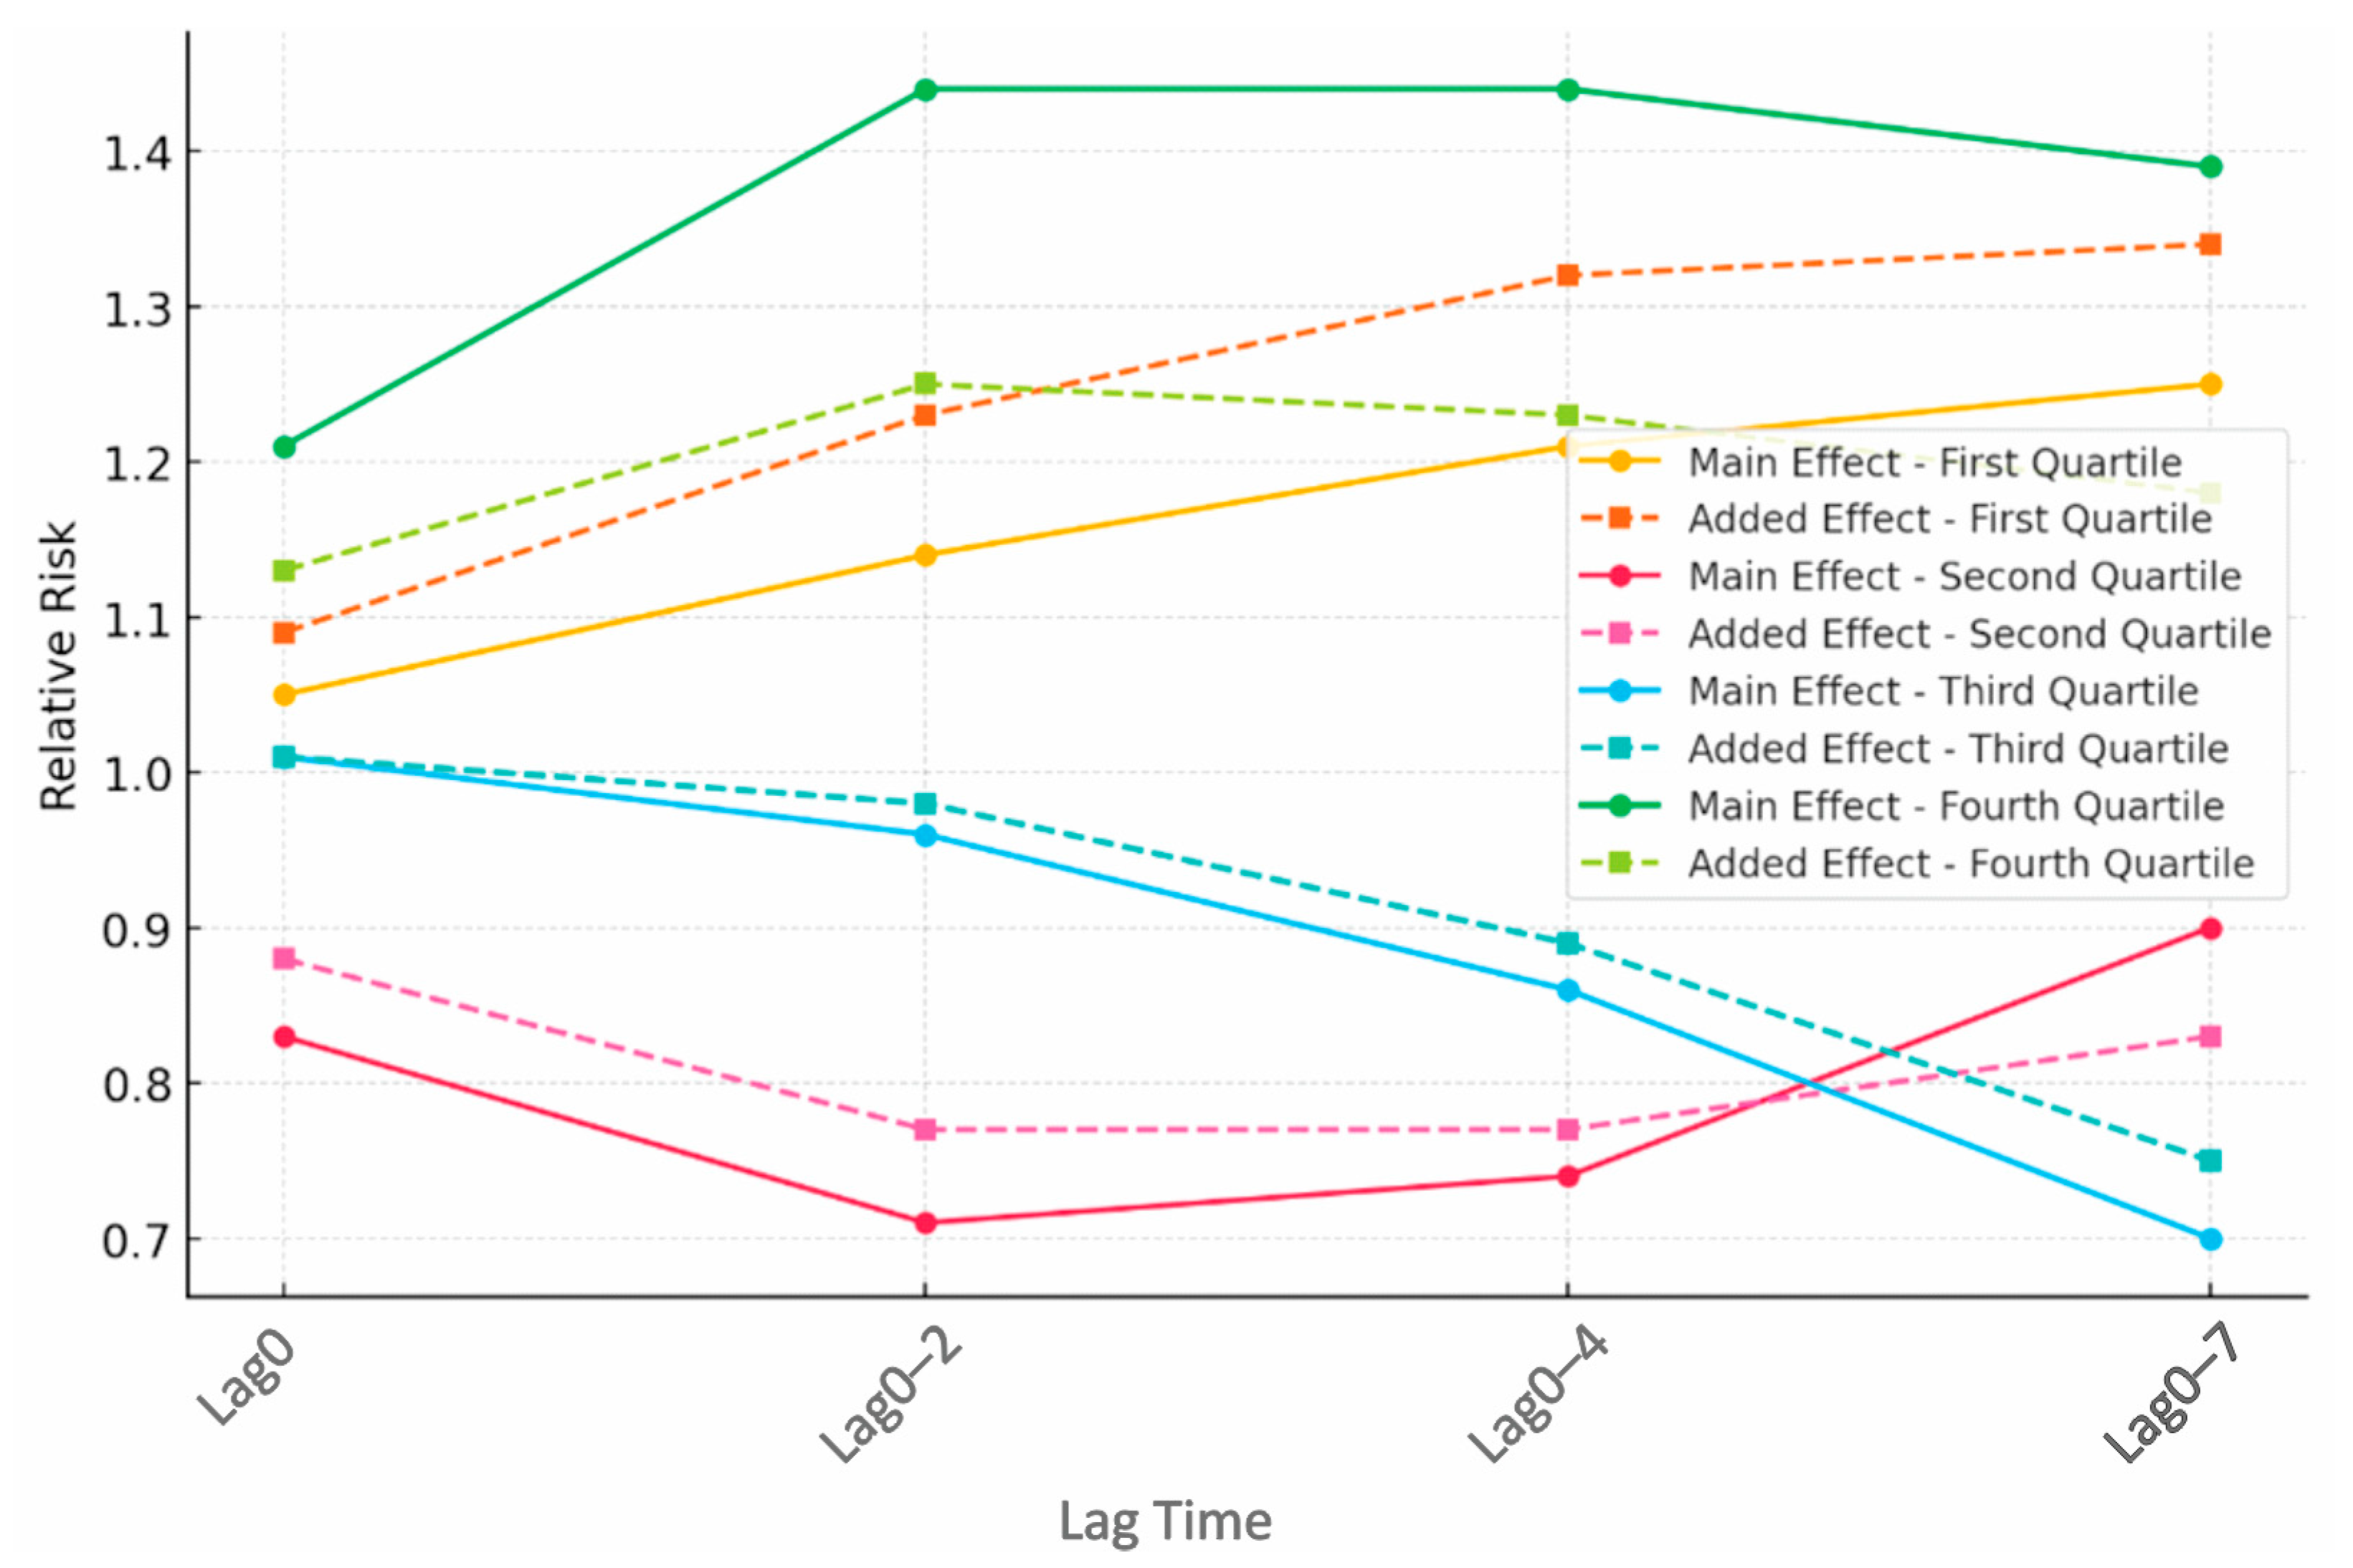
For all-cause emergency visits, the first quartile consistently exhibited the highest relative risk estimates (
Table 5;
Figure 12), with the Main Effect peaking at Lag0–7 (RR = 1.25, 95% CI: 0.40–3.90), reinforcing the heightened vulnerability of neighborhoods with minimal green infrastructure. The second and third quartiles showed lower and more stable RR estimates across lag periods, supporting a protective association of low to moderate vegetation coverage.
In the fourth quartile, elevated relative risk estimates were observed at Lag0–2 (RR = 1.44, 95% CI: 0.69–2.99) and Lag0–7 (RR = 1.39, 95% CI: 0.40–4.84). These findings indicate a potential increase in risk under extreme heat but are accompanied by substantial uncertainty, and proposed mechanisms should therefore be interpreted cautiously.
Kruskal–Wallis tests confirmed statistically significant differences in all-cause risk distributions across quartiles for both the Main Effect (p = 0.0059) and Added Effect (p = 0.0080), highlighting the modifying role of green infrastructure in shaping population-level health responses to heat waves. Overall, the Main Effect findings indicate that higher temperatures are associated with elevated emergency department visits across multiple health outcomes, while the Added Effect results suggest that persistent heat exposure may further exacerbate health risks over time. These patterns are broadly consistent with previous studies showing increased cardiovascular and respiratory vulnerability during heat waves, particularly in areas with limited green space coverage. Although the magnitude and precision of risk estimates varied across quartiles, the results underscore the potential importance of urban green infrastructure as a heat-mitigation strategy and support urban planning interventions aimed at optimizing green space distribution to reduce heat-related health burdens.
3.3. Comparing Quartile Distributions for Green Space Coverage
To evaluate spatial disparities in green infrastructure, NDVI values were calculated using Landsat 8 satellite imagery over an 18-month period for 190 neighborhoods in Tabriz. The mean NDVI for each neighborhood was determined and neighborhoods were subsequently classified into four quartiles, representing ascending levels of vegetation coverage.
First Quartile (Lowest Green Space): NDVI values ranged from 0.028 to 0.052, with a mean of 0.042. Neighborhoods in this quartile exhibit minimal vegetation coverage and correspond to the most densely urbanized areas, particularly in the central and northern parts of the city.
Second Quartile (Low Green Space): NDVI values ranged from 0.053 to 0.063, with a mean of 0.057. These areas have limited green infrastructure, though slightly better than Quartile 1, and are mostly located adjacent to the urban core.
Third Quartile (Moderate Green Space): NDVI values ranged from 0.064 to 0.080, with a mean of 0.070. These neighborhoods feature moderate vegetation coverage and are generally located in the transitional zones between urban and peripheral areas.
Fourth Quartile (Highest Green Space): NDVI values ranged from 0.081 to 0.144, with a mean of 0.098. These neighborhoods are situated primarily in the southern and outer edges of the city, where natural vegetation, parks, and open spaces are more prevalent.
The quartile classification provides a clear gradient of green space distribution across the city. When overlaid with the green infrastructure classification map, there was strong spatial correspondence: neighborhoods categorized as having high or very high green infrastructure (dark and light green areas) in the green infrastructure map generally fell within the third and fourth NDVI quartiles. Conversely, areas identified as having low or very low green infrastructure (yellow and orange zones) predominantly fell into the first and second NDVI quartiles.
3.3.1. Comparing the Relative Risk of Cardiovascular Disease Across Quartiles
The relative risk (RR) of cardiovascular disease (CVD) was analyzed across quartiles of green infrastructure, categorized by NDVI values. Across all lag periods, a consistent trend was observed: neighborhoods in the first quartile (lowest green coverage) had the highest relative risk, while those in the second and third quartiles (low to moderate green coverage) exhibited lower risks. The fourth quartile (highest green space) showed slightly elevated risk at shorter lags but not consistently across all periods.
Main and Added Effects: In Quartile 1, the main effect RR peaked at Lag0–2 (1.30, 95% CI: 0.55–3.10) and remained above 1.0 through Lag0–7. Quartiles 2 and 3 consistently had RR values below 1.0, with Quartile 3 showing the lowest risks (e.g., Lag0–7 Added Effect RR = 0.45). Quartile 4 demonstrated elevated RRs at Lag0 and Lag0–2 (Main: 1.19 and 1.38), but these effects diminished by Lag0–7, suggesting possible short-term microclimatic effects rather than long-term vulnerability.
Age and Gender: Younger individuals (≤65) showed higher RR values, especially in Quartile 1 and Quartile 4, suggesting increased heat sensitivity. Males in Quartile 4 had notably elevated RR at Lag0–2 (Main: 2.04), whereas females had relatively lower values.
Statistical Significance: Kruskal–Wallis tests confirmed statistically significant RR differences across quartiles (Main Effect p = 0.0080; Added Effect p = 0.0070), indicating the modifying role of green space in heat-related CVD risk.
3.3.2. Comparing the Relative Risk of Respiratory Disease Across Quartiles (Supplementary)
Although initially included in the study, the results for respiratory disease risk across quartiles were highly variable and did not exhibit a clear or consistent dose–response relationship with green infrastructure levels. While Quartile 2 consistently showed lower RR values, Quartiles 1 and 4 exhibited unexpectedly high risks at longer lags. These inconsistencies, particularly the anomalous increase in RR in Quartile 4, may be influenced by confounding microclimatic factors such as humidity, pollen, and behavioral exposure patterns. Given the instability and lower number of cases, these results are presented for reference but are not the focus of policy interpretation.
3.3.3. Comparing the Relative Risk of All Causes (Cardiovascular, Respiratory, and Stroke)
To improve statistical power and confidence in the findings, a combined analysis was performed for all cause-related emergency visits (cardiovascular, respiratory, and stroke). This composite metric reinforces patterns observed in the CVD-only analysis.
Key Trends: Quartile 1 again showed the highest overall risk across all lags (e.g., Lag0–7 Added Effect RR = 1.34), consistent with minimal vegetation and high vulnerability. Quartile 2 had the lowest risks (e.g., Lag0–2 Added Effect RR = 0.77), supporting the hypothesis that moderate green coverage offers optimal protection. Quartile 4 exhibited modestly elevated risk at longer lags (Lag0–7 Main Effect RR = 1.39), though not as extreme as Quartile 1.
Subgroup Differences: Younger individuals (≤65) and males in Quartile 4 showed higher risks, with male RR reaching 3.26 at Lag0–7. In contrast, older adults and females generally experienced lower RR values, especially in Quartile 2.
Statistical Significance: The Kruskal–Wallis test confirmed significant RR differences across quartiles (Main Effect p = 0.0059; Added Effect p = 0.0080), strengthening the evidence that green space levels modulate heat-related health risks at the population level.
5. Conclusions
This study provides one of the first empirical evaluations of the relationship between green infrastructure and heat-related health risks in an Iranian city, using spatially detailed data and rigorous epidemiological modeling. Our results reveal a non-linear relationship between neighborhood-level vegetation coverage and health outcomes during extreme heat events. Specifically, moderate levels of green infrastructure—represented by the second and third NDVI quartiles—were consistently associated with reduced relative risks of cardiovascular and all-cause hospital admissions. These findings highlight the potential of urban greening to act as a localized climate adaptation strategy, particularly in semi-arid cities like Tabriz that are increasingly exposed to heat stress.
In contrast, both the lowest and highest NDVI quartiles showed elevated health risks, underscoring that the presence of vegetation alone does not guarantee heat resilience. The increased risk observed in the most vegetated neighborhoods may be attributed to several factors, including higher humidity levels, decreased wind circulation, and increased outdoor exposure. This complexity suggests that while green infrastructure is essential, its design, distribution, and maintenance must be carefully planned to maximize its protective benefits and avoid unintended consequences.
Importantly, this study demonstrates significant disparities in green infrastructure coverage across Tabriz. The most urbanized and densely populated neighborhoods had the least vegetation and the highest heat-related health risks. These inequities align with global findings that disadvantaged populations often reside in areas with inadequate environmental protections. Targeted investments in greening low-NDVI areas can thus serve dual roles: reducing exposure to extreme heat and promoting environmental justice.
The study also emphasizes the importance of adopting a composite measure of health outcomes, combining cardiovascular, respiratory, and stroke data to enhance statistical power. While the strongest and most consistent findings were observed for cardiovascular outcomes, the inclusion of all-cause metrics reinforces the broader relevance of green infrastructure for public health.
Given the rapid pace of urbanization and climate change in Iran, these insights are timely and urgent. Cities like Tabriz, which have not historically needed heat adaptation strategies, must now prioritize climate-responsive planning. Urban greening should be integrated into municipal climate adaptation frameworks alongside early warning systems, public education, and healthcare infrastructure improvements.
In conclusion, green infrastructure plays a vital role in reducing the health impacts of extreme heat, but its effectiveness depends on equitable distribution, thoughtful design, and sensitivity to local climatic and demographic contexts. This study contributes critical evidence to the growing field of climate-health research and offers actionable guidance for policymakers, urban planners, and public health professionals working to build resilient cities in the face of rising temperatures.