Article

Study on the Influence of Topography on Dew Amount—A Case Study of Hilly and Gully Regions in the Loess Plateau, China

1
School of Water and Environment, Chang’an University, Xi’an 710054, China
2
Key Laboratory of Subsurface Hydrology and Ecological Effects in Arid Region (Ministry of Education), Chang’an University, Xi’an 710054, China
3
Key Laboratory of Eco-Hydrology and Water Security in Arid and Semi-Arid Regions of the Ministry of Water Resources, Chang’an University, Xi’an 710054, China
4
Xi’an Water Supply Management Center, Xi’an 710016, China
*
Author to whom correspondence should be addressed.
Atmosphere 2025, 16(9), 1098; https://doi.org/10.3390/atmos16091098
Submission received: 27 July 2025 / Revised: 12 September 2025 / Accepted: 17 September 2025 / Published: 18 September 2025
(This article belongs to the Special Issue Analysis of Dew under Different Climate Changes)

Abstract

Dew is an important water source for vegetation growth in arid regions and plays a significant role in maintaining ecosystem balance. The characteristics of dew formation vary under different topographic conditions. In response to the challenges posed by climate change to the sustainability of water resources and ecosystems, this study explored the impact of topography on dew formation, and leaf wetness sensors (LWSs) were employed to conduct field observations from April 2023 to April 2025 in typical hilly and gully regions of China’s Loess Plateau. We analyzed the characteristics, influencing factors, and ecological significance of near-surface water vapor condensation. The main conclusions are as follows: (1) During the observation period, dew primarily occurred between 19:00 and 07:00 the next day, peaking between 05:30 and 07:00 in the early morning. The monthly average dew amounts for the hilly region and gully region were 2.15 mm and 3.38 mm, respectively, and the monthly maximum dew amounts were 8.57 mm and 11.88 mm, respectively, both peaking in autumn, with the gully region exhibiting higher dew amounts. (2) Dew formation at a 0.2 m height was favored when relative humidity at 0.2 m exceeded 70%, the air temperature–dew point difference was less than 8 °C, the wind direction was between 150 and 210° and 240 and 270° for the hilly region and gully region, respectively, and the standardized wind speed at a 10 m height was less than 0.5 m/s and 1.5 m/s for the hilly region and gully region, respectively. (3) Moderate rainfall facilitates dew condensation. The monthly average dew-to-precipitation (dew and rain) ratio reached its maximum in November for both the Loess hilly region and gully region, at 12.88% and 18.91%, respectively. (4) The gully region experienced larger dew events more frequently than the hilly region, resulting in a higher overall dew amount in the gully region during the observation period. The dew formation characteristics observed in this study can provide a scientific basis for assessing the future supply potential of non-precipitation water sources in the Loess Plateau under climate change and their supporting role in the ecological environment.

Graphical Abstract

1. Introduction

Against the backdrop of intensifying global climate change and concurrent global water crises, the development of non-traditional water resources has become a critical issue for sustainable development [1]. Dew, a natural freshwater source generated through phase change, holds unique ecological value in maintaining arid ecosystems, conserving agricultural water, and regulating urban microclimates due to its wide distribution, low mineralization, and renewable nature [2,3]. Research indicated dew supplements at 10–15% of agricultural water in Mediterranean arid regions, with an annual potential yield of 50–100 L/m2 at a cost lower than desalination [3]. Observations in China’s northwestern desert regions showed that dew can annually replenish soil moisture by 20–30 mm [4]. This “hidden precipitation” plays an irreplaceable role in sustaining biodiversity and alleviating crop water stress in arid areas, making systematic research on dew formation mechanisms and utilization technologies of great significance [5].
As a ubiquitous form of atmospheric condensation in nature, dew is a microscale hydrological process that cannot be overlooked in the water cycle system. It is defined as liquid water formed by the condensation of water vapor onto a surface when the surface temperature falls below the dew point [6,7,8]. This hidden water resource fulfills three key ecological functions: directly supplying moisture to surface vegetation, influencing plant germination by altering surface soil moisture distribution, and regulating near-ground microclimates [9,10]. Particularly in arid and semi-arid regions with scarce precipitation, dew can contribute 10–30% of the average annual rainfall [6], serving as a vital water source for fragile ecosystems [11,12,13]. The formation of dew is essentially a phase transition process involving non-homogeneous condensation of water vapor in the atmosphere on a cooling surface. The critical conditions for this process were governed by the Clausius–Clapeyron equation. This equation established the core kinetic relationship between saturated vapor pressure and temperature: saturated vapor pressure increased exponentially with rising temperature, and its rate of change was determined by the latent heat of vaporization of water and the specific vapor pressure constant of water vapor [14]. This relationship indicated that, even if the ambient absolute humidity remains constant, a slight decrease in surface or vegetation canopy temperature (such as nocturnal radiative cooling) was sufficient to cause a sharp drop in saturated vapor pressure [15,16]. When the surface temperature dropped below the dew point, the vapor pressure exceeded the saturation value, thereby triggering condensation [6,7,8]. This study observed and analyzed dew condensation characteristics based on this classical thermodynamic framework.
The previous studies encompass dew collection methods [17,18,19], formation conditions [8,20], measurement techniques [21,22], influencing factors [23], characteristics of condensation volume [24,25], and ecohydrological effects [26]. The international academic community has established a multi-dimensional research framework for dew. Scholars have developed quantitative models for dew formation based on meteorological elements [27]. Research in Africa’s Sahel region confirmed that dew increases crop survival rates by 22% [28]. Studies in the Loess Plateau, China, show that plant canopies can intercept 0.1–0.3 mm/d of dew [7]. In terms of research on the influence of terrain on dew condensation, Kidron (2000), Temina and Kidron (2011), Kidron et al. (2011), and Kidron et al. (2014) studied desert ecosystems in Sede Boqer and found that the amount of dew decreased in the following order: hilltop > footslope > wadi bed; duration of dew decreased in the following order: footslope > hilltop > wadi bed, suggesting that the slight turbulence caused by early sunbeams contributed to continuous condensation [29,30,31,32,33]. The study with three different environments (dune tops, dune slopes, and inter-dune depressions) in fixed sand dunes in northwest China showed that inter-dune depressions had higher average maximum dewfall and longer average dewfall duration, while dune tops had lower average dewfall and shorter average dewfall duration [34]. Studies comparing dew events in arid artificial oasis farmlands and subhumid farmlands found that dew amounts were lower in arid artificial oasis farmlands than in subhumid farmlands, but the proportion of dew to precipitation was higher in arid artificial oasis farmlands [5]. As for dew events spanning two consecutive hydrological years across low mountainous regions and high-altitude grasslands, dew amounts were higher in low mountainous regions than in high-altitude grasslands [35].
The aforementioned studies have demonstrated the influence of topography on dew formation. However, research on dew condensation characteristics under varying topographic conditions in the hilly and gully regions of China’s Loess Plateau is limited. The definition of “hilly region” refers to undulating, positive topography formed by wind deposition, manifesting as hill-like elevations. In contrast, “gully region” denotes valley floor landforms exhibiting a significant elevation difference (approximately 200 m) relative to the surrounding peaks [36,37]. As the area most severely affected by soil erosion in China, the Loess Plateau is facing a severe water scarcity crisis under climate change [38]. Annual precipitation is low, but evaporation is high, with 75% of rainfall lost as storm runoff. Per capita water resources are only one-sixth of the national average value [38,39]. Studies in China’s Loess hilly region identified condensation water as a significant, non-negligible water resource for rain-fed jujube trees [40]. Furthermore, dew increased humidity in the plant micro-environment, improving water use efficiency [21]; it effectively promoted growth in the above-ground parts of plants and the accumulation of photosynthetic products in leaves, storing sufficient nutrients [41]. With conventional water resource development nearing its limits, dew, as a non-rainfall water source, holds particular significance for maintaining the effectiveness of the Grain-for-Green Project [2,42]. Based on prior research and practical requirements, we propose the following hypothesis that valley floor (gully region) areas within China’s Loess Plateau hilly and gully regions will exhibit higher dew amounts than mountaintop (hilly region) areas due to stronger nocturnal cooling, higher humidity, and the accumulation effect of cold air.
Typical hilly and gully landforms were selected in the Loess hilly and gully regions of China to conduct long-term field observations of near-surface water vapor. The aim is to investigate the characteristics of dew formation under different terrain conditions and their influencing factors, providing a basis for dew collection and utilization as well as the protection and development of ecosystems under conditions of climate change in arid regions.

2. Materials and Methods

2.1. Experimental Site

The study area has a mid-temperate continental semi-arid monsoon climate. The annual average temperature is 8.8 °C, with extreme highs of 36.8 °C and extreme lows of −23.6 °C, and the altitude is 388–2766 m. Winters and springs are dry and cold, summers experience mid-summer droughts, and autumns are cool with frost. The mean annual precipitation is 500 mm, annual evaporation is 1100–1400 mm [43], the frost-free period is 157 days [44], and annual sunshine hours are approximately 2375.5 h [43]. The main soils are developed from Loess parent material and are classified as Calcic Cambisols, which are characterized by a yellow color, absence of bedding, silty texture, looseness, macroporousness, and wetness-induced collapsibility [45]. The soil is mainly composed of sand, silt, and clay; the contents are 65%, 24%, and 11% [46]. The lichen crust cover is less than 10% [47]. The dominant vegetation types are herbaceous communities and shrubs. Common shrubs include Caragana korshinskii, sea buckthorn (Hippophae rhamnoides), Rosa xanthina, and Sophora davidii [48]. The study area belongs to the forest steppe ecotone, with woodlands and grasslands beyond 70% of the area [49].
The hills are primarily formed by the accumulation of sand and dust (Loess) carried by northwest winds, resembling a massive earthen mound meticulously piled up. This is an eolian landform characterized by undulating positive topography, manifesting as hill-like elevations with relatively gentle and intact contours [36]. Gullies, on the other hand, are entirely the result of water erosion (dissolution) of these mounds, forming negative topography through water erosion and cutting. When heavy rains concentrate on eroding the loose Loess hill slopes, they first create small “texture gullies,” which then develop into “cutting gullies” and “erosion gullies,” ultimately forming a gully system with depths of tens of meters or even hundreds of meters, resulting in a fragmented terrain [37]. In simple terms, hills are “convex” elevations, while gullies are “concave” deep channels; the former are dominated by wind-driven accumulation, while the latter are dominated by water erosion. Together, they form the unique “thousand gullies and ten thousand ravines” landscape of the Loess Plateau. The location of the study area and the cross-sectional diagram of the region are shown in the figure below. The A station in this study was a hilly area observation station, while the B station was a gully area observation station. The cross-section of the line connecting A and B stations, as shown in Figure 1, reveals that A station is situated on a hilltop, while B station is located in a valley. There is a significant elevation difference between the two stations, with a vertical separation of nearly 200 m. Both sites shared similar vegetation types and soil textures.

2.2. Experimental Design

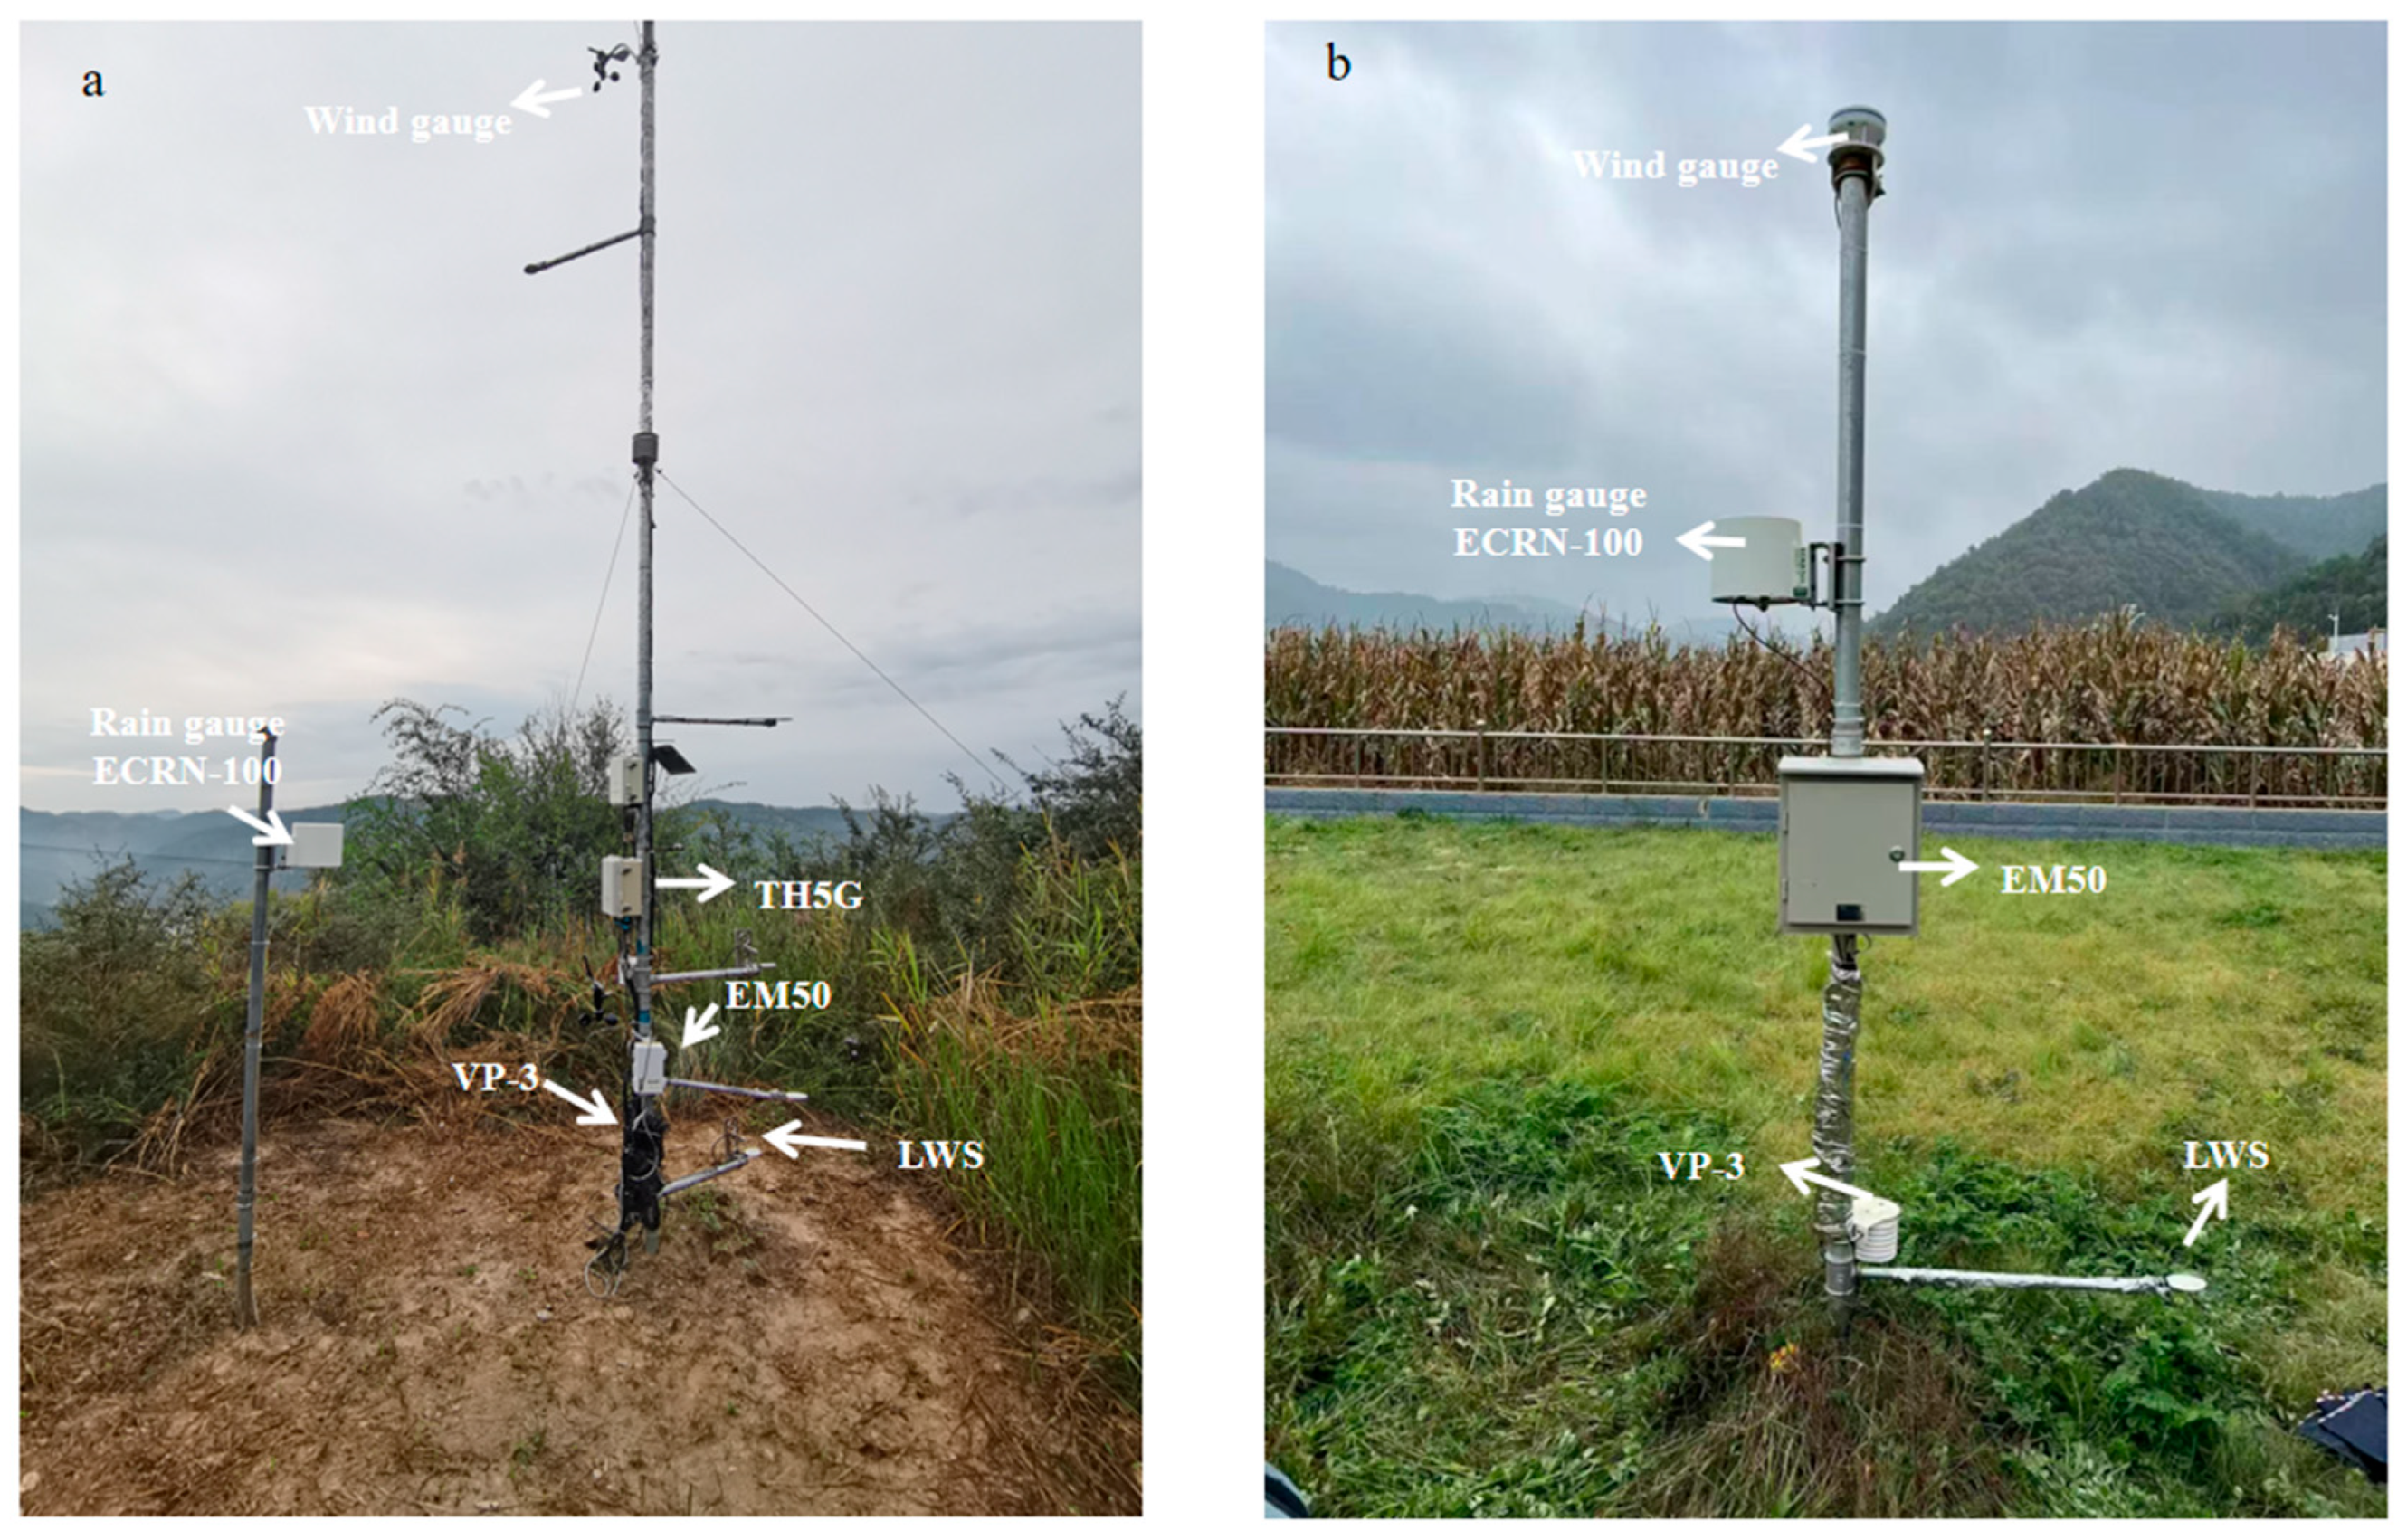
The design of the dew observation sites and field instrumentation setup is shown in Figure 2. This study used dielectric leaf wetness sensors (LWSs, Decagon Devices, Pullman, WA, USA) to measure dew amount, installed at 0.2 m above the ground surface. Atmospheric temperature and relative humidity were measured using a humidity probe (VP-3, Decagon Devices, USA), also installed at 0.2 m height. Wind speed and direction were monitored using WSD01 anemometers (Decagon Devices, USA). At A station (hilly region), anemometers were installed at 5 m above ground; at the B station (gully region), they were installed at 2 m height. Precipitation was measured using an ECRN-100 rain gauge (Decagon Devices, USA), installed at 1.6 m above ground. Meteorological and dew observation data at A station were collected using a TH5G data logger (Beijing Tanghua Technology Co., Ltd., Beijing, China), while rainfall data were collected using an EM50 (Decagon Devices, USA). At B station, all meteorological and dew data were collected using an EM50 (Decagon Devices, USA).
Field observations were conducted from April 2023 to April 2025, with a collection interval of 30 min. The accuracy and installation height of the observation instruments are shown in Table 1.

2.3. Data Processing

2.3.1. LWS Calibration

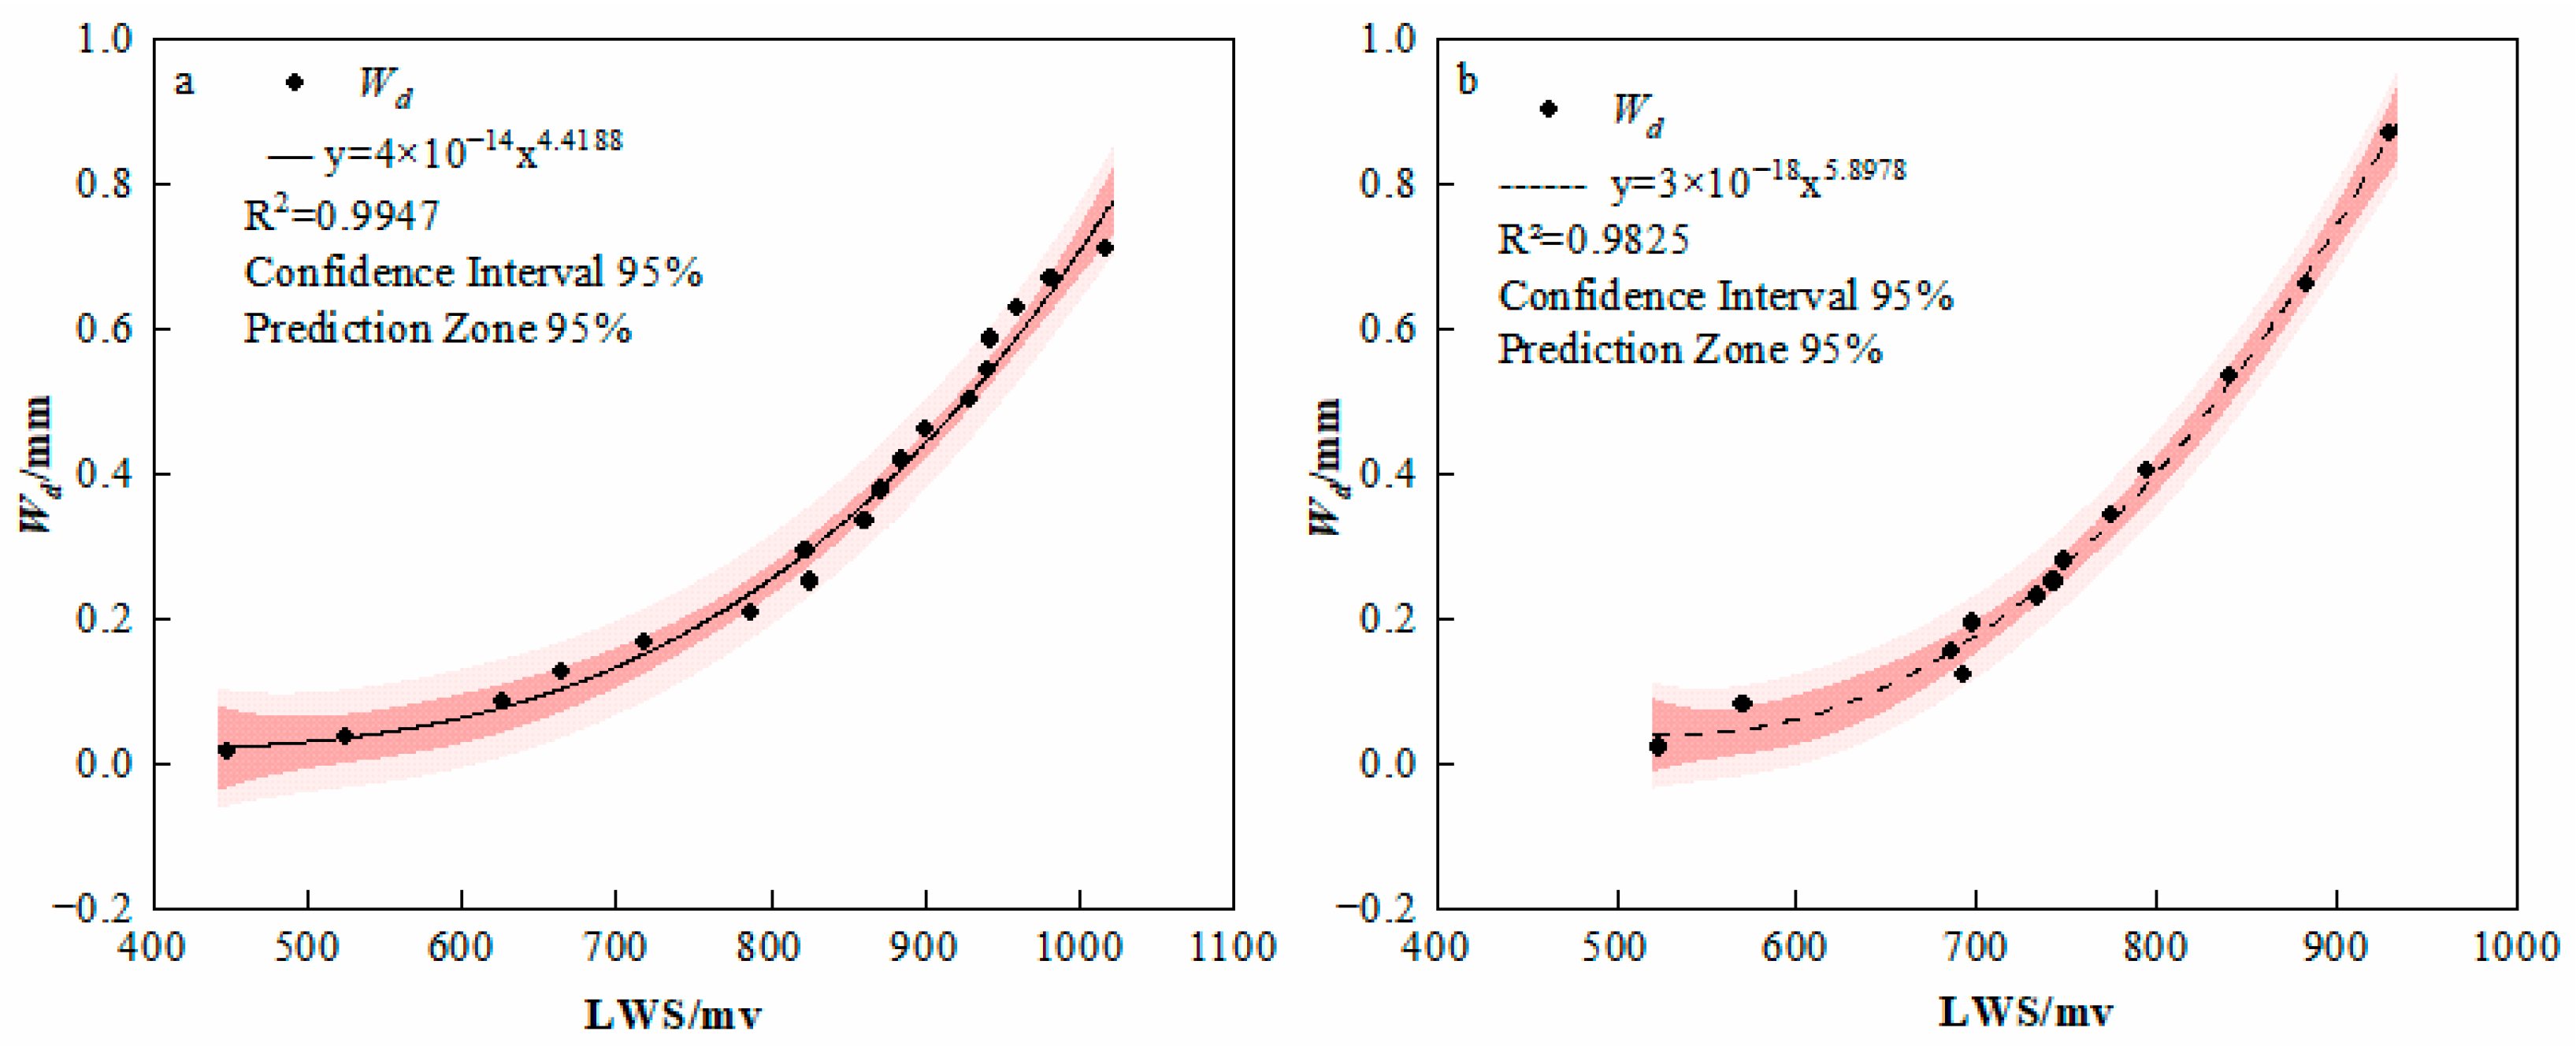
LWSs were used to observe dew [50]. The relationship between the micro-voltage of LWS (Ui) using an Em50 logger and the thickness of the water layer (Hi) on the sensor surface was established by Jia et al. (2019), as shown in Figure 3a and Equation (1) [51]. Since dew data at B station were collected using an EM50 logger and at A station using a TH5G logger, the output voltages differed, leading to deviations from the calibration parameters given by Jia et al. (2019) [51].
The specific calibration process was as follows: During calibration, the LWS was placed horizontally and connected to the TH5G data logger. A small “sprayer” was selected indoors that could control the amount of water sprayed each time. Water was sprayed in a mist form onto the surface of the LWS sensor, and the cumulative water spray volume (g) was measured. By measuring the area of the LWS (mm2) and converting the water spray volume (g) to a per-unit-area quantity, the dew point per unit area (mm) was calculated. Furthermore, the data logger recorded the sensor’s raw voltage values. By fitting the raw voltage values and the corresponding dew point data per unit area, a calibration curve was obtained. This study derived the TH5G calibration curve through laboratory experiments, as shown in Figure 3b.
H i = a U i b
where Hi is the instantaneous condensation amount on the humidity sensor surface, mm; Ui is the sensor output voltage (EM50 minimum threshold: 460 mV; TH5G minimum threshold: 523 mV), mV; a and b are fitting parameters. For B station, a = 4 × 10⁻¹⁴, and b = 4.4188 (r = 0.9937, p < 0.01); for A station, a = 3 × 10⁻¹⁸, and b = 5.8978 (r = 0.9825, p < 0.01).

2.3.2. Dew Point Temperature Calculation

Dew point temperature was calculated using the Lawrence equation, which was based on the Magnus equation and enables a high-precision conversion from RH to Td [40,52].
T d = B 1 ln H R 100 + A 1 T a B 1 + T a A 1 ln H R 100 + A 1 T a B 1 + T a
where Ta and Td represent air temperature and dew point temperature, respectively, °C; HR is air relative humidity (RH), %; A1 and B1 are coefficients recommended by Alduchov and Eskridge (1996), with A1 = 17.625 and B1 = 243.04 °C [53].

2.3.3. Wind Speed Conversion Calculation

Due to different anemometer installation heights in the hilly and gully regions, wind speed data were standardized to a height of 10 m above ground to ensure comparability and eliminate the influence of elevation differences. Wind speeds were adjusted to a standard height of 10 m using the classical logarithmic wind profile [54]:
V Z 1 V Z i = l n ( Z 1 Z c ) l n ( Z i Z c )
where Zc (m) corresponds to the ground roughness length and is taken to be 0.1 m (the subsoil beneath both A station and B station eventually evolved into grassland). VZ1 (m/s) and VZ2 (m/s) are wind speeds at different heights of Z1 (m) and Z2 (m), respectively.

2.3.4. Definitions

1. Daily Dew Amount (Wd): As dew primarily occurs at night, the period from 16:00 on the current day to 16:00 the next day was defined as a hydrological day. The condensation amount within this period was defined as the daily dew volume.
2. Mean Daily Dew Amount: The ratio of the total condensation amount during the observation period to the number of days without rainfall in that period.
3. Dew-to-Rain Ratio: The ratio of dew volume to rainfall volume during a specific observation period.
4. Monthly Dew Frequency: The ratio of the number of days with dew occurrence to the total number of days in a month.
5. Daily Dew Condensation Duration: Within periods of dew presence, the cumulative time intervals where the dew observation value at the end of the interval was greater than that at the beginning.
6. Daily Dew Evaporation Duration: Within periods of dew presence, the cumulative time intervals where the dew observation value at the end of the interval was less than that at the beginning.

3. Results

3.1. Daily Variation in Dew

Daily variation in dew was obtained by averaging the dew amounts at each time point for each season (Spring: March–May, Summer: June–August, Autumn: September–November, and Winter: December–February next year) in the hilly region (A station) and gully region (B station), as shown in Figure 4.
The diurnal process of dew in both the hilly and gully regions generally exhibited an initial increase followed by a decrease (Figure 4a,c). Although the dew variation trend was similar across seasons, the dew amounts varied significantly. As shown in Figure 4a,c, dew amounts in both regions reached their maximum in autumn, followed by summer, spring, and winter. This pattern was attributed to the larger diurnal temperature range and higher relative humidity in autumn, which facilitated greater dew formation. In autumn and summer, dew condensation began between 19:00 and 20:30, while in spring and winter, it began after 20:30. Dew condensation peaked between 05:30 and 07:00. The average sunrise time in autumn was 6:55, with the hourly average dewfall peaks in the hilly and gully areas both reaching their maximum at 7:00. The average sunrise time in summer was 5:49, with hourly average dewfall in the hilly and gully areas peaking at 7:00 and 6:00, respectively. The average sunrise time in spring was 6:19, with hourly average dew formation peaks occurring at 6:30 in the hilly area and 7:00 in the gully area. The cessation of dew formation and the onset of evaporation were both closely related to solar radiation heating after sunrise. Consequently, the condensation duration was longer in autumn and summer, leading to larger dew amounts. After sunrise, temperature rose rapidly, and relative humidity decreased sharply, causing dew to evaporate rapidly after reaching its peak and disappearing before 10:00. Comparing the dew variation process, the condensation duration at both A station and B station was longer than the evaporation duration in all seasons, and the condensation phase accounted for over 70% of the total dew duration (Figure 4b,d).
Comparing dew variations between the hilly and gully regions (Figure 4a,c) showed that, except in winter when the maximum hourly dew amounts were similar, the maximum hourly dew amounts in the hilly region were lower than those in the gully region for other seasons. In autumn, the average maximum hourly dew amounts were 0.014 mm (hilly) and 0.026 mm (gully); in summer, 0.013 mm (hilly) and 0.020 mm (gully); in spring, 0.010 mm (hilly) and 0.019 mm (gully). The average maximum hourly dew amount in the gully region was approximately twice that of the hilly region across all seasons. Comparing dew condensation and evaporation durations (Figure 4b,d) revealed that, during spring, summer, and autumn, the condensation duration in the hilly region was longer than that in the gully region, yet the average hourly dew amount was smaller. This indicated that, under similar condensation durations, the gully region was more prone to producing larger dew amounts than the hilly region.

3.2. Monthly Variation in Dew

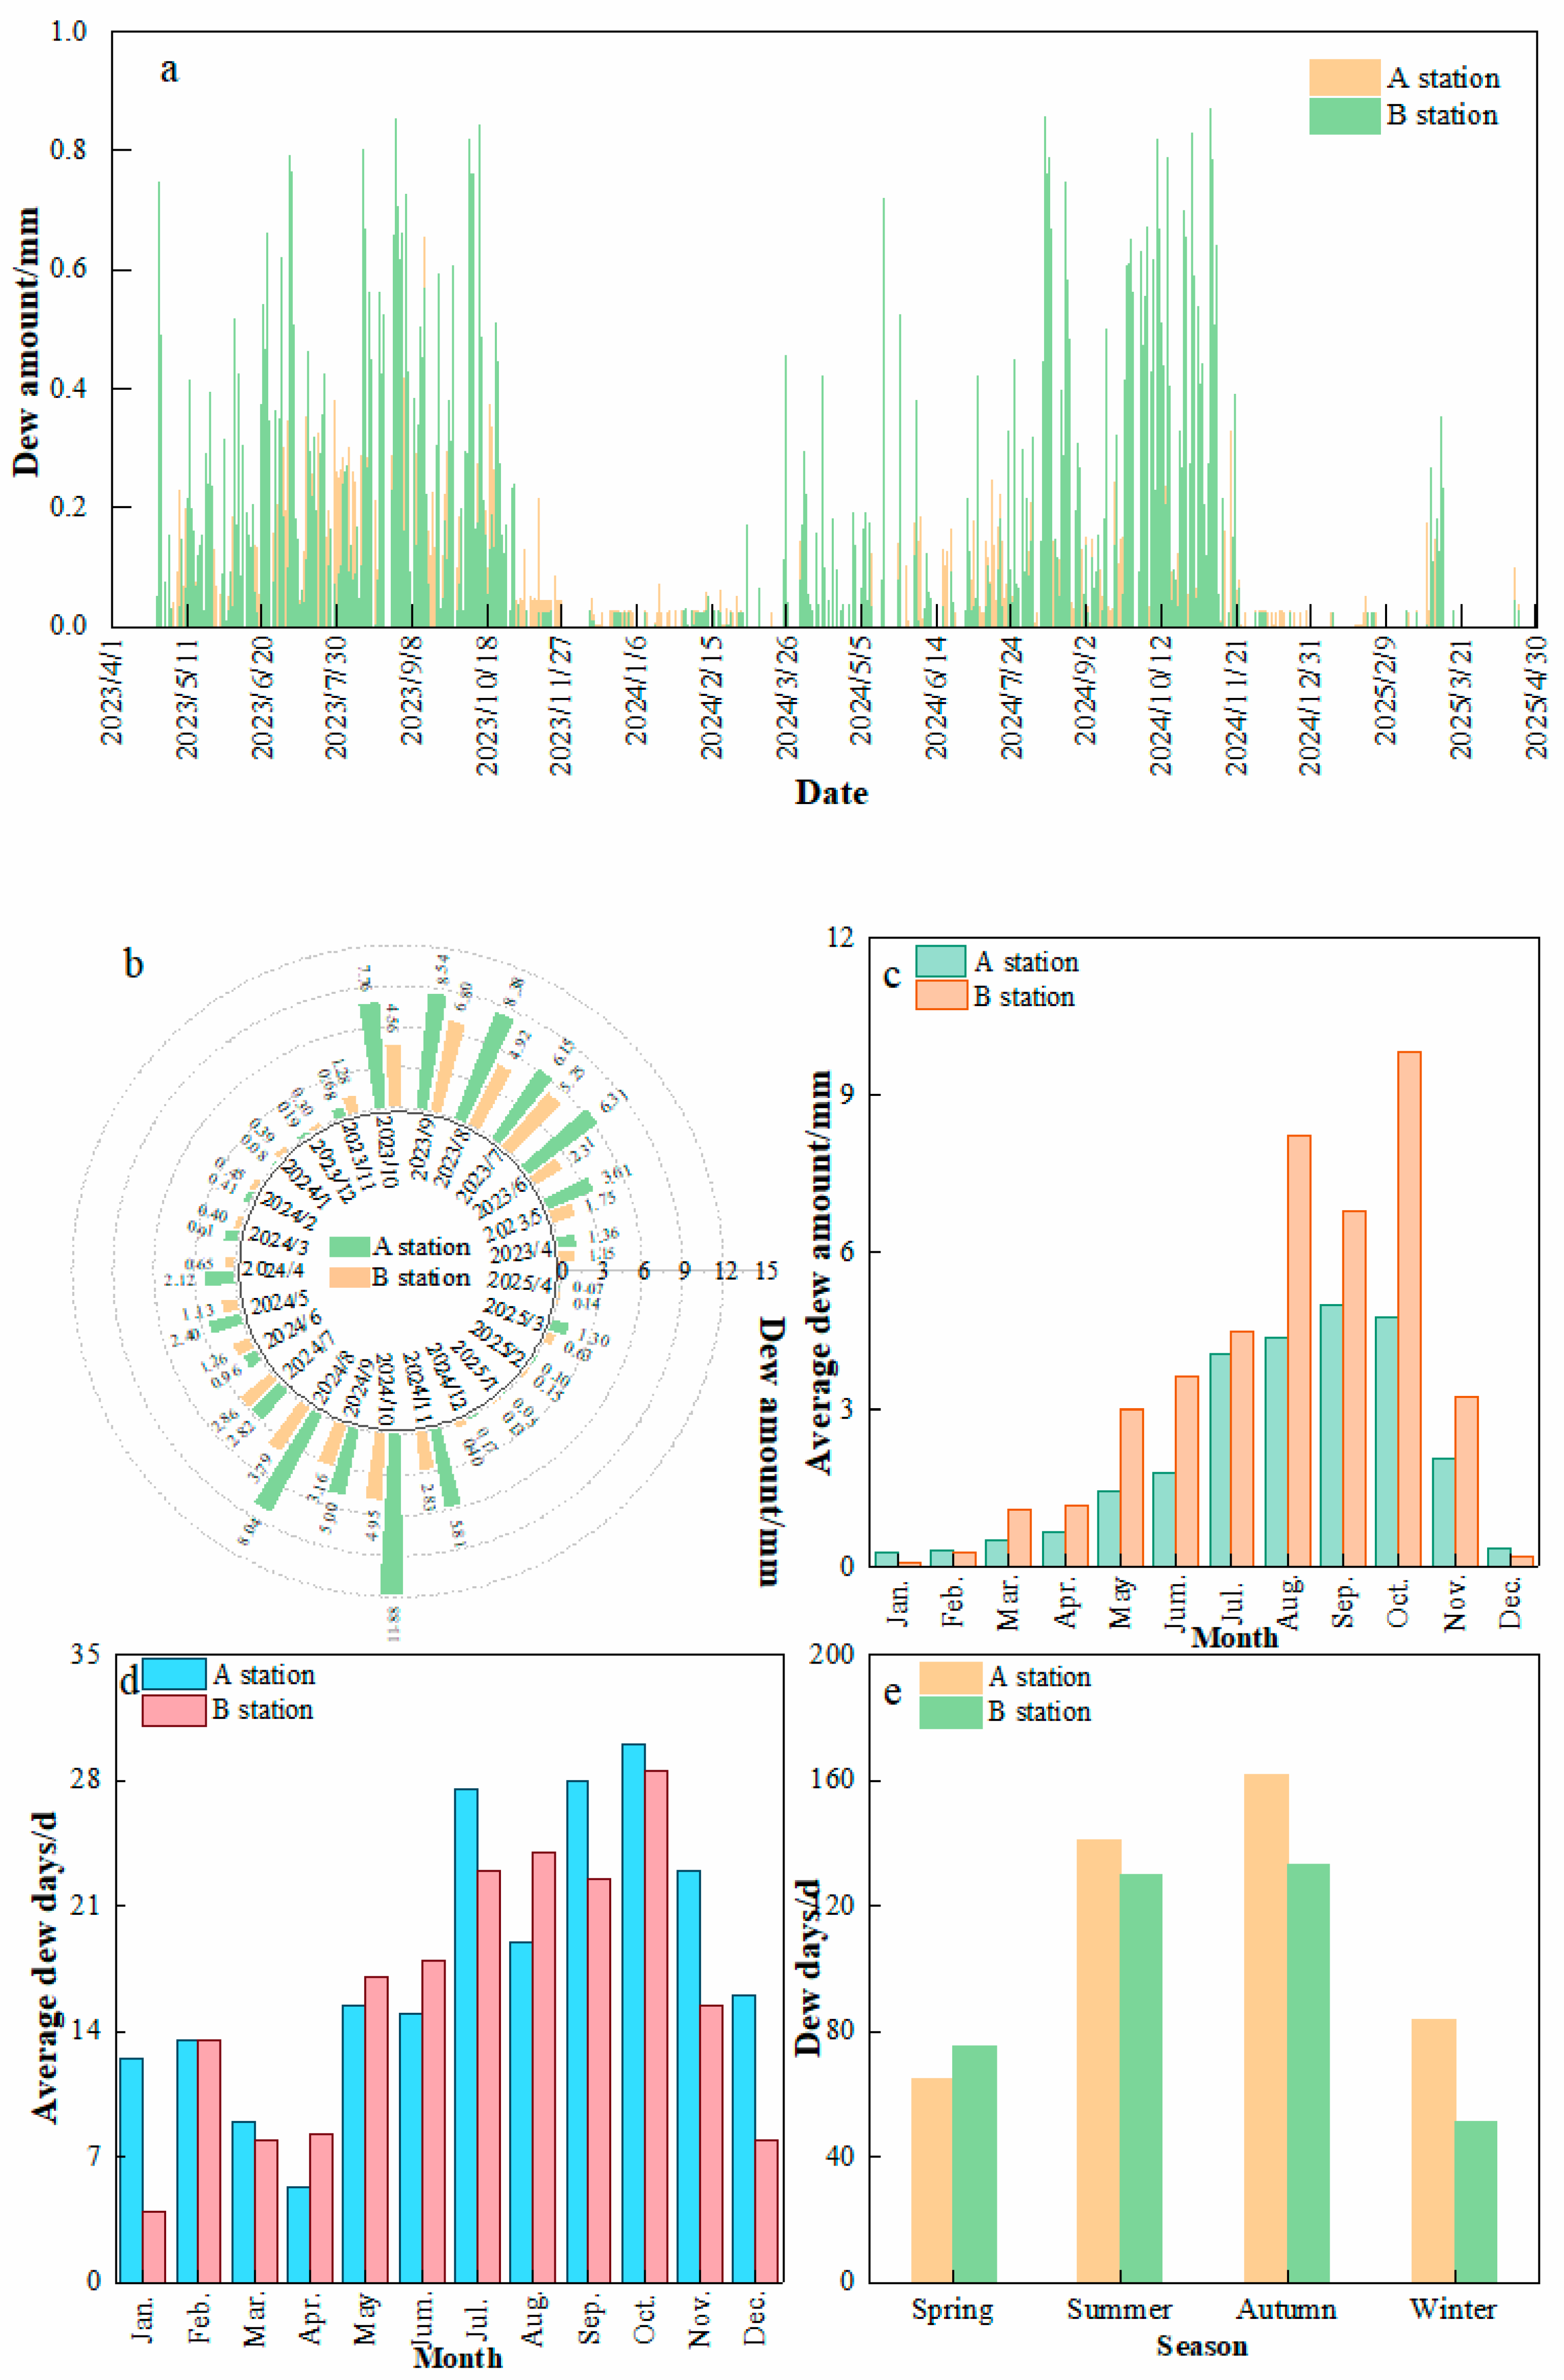
Monthly variations in dew amount for the two landforms during the monitoring period are shown in Figure 5. The daily dew amounts in the gully area were generally higher than those in the hilly area (Figure 5a). On 15 September 2023, the daily dew amounts in the hilly area reached a maximum of 0.66 mm/d, while the dew amount in the gully area on the same day was 0.57 mm/d. Although lower than the hilly area, the dew amounts in the two regions were similar. On 7 November 2024, the daily dew amounts in the gully area reached a maximum of 0.87 mm/d, while the daily dew amount in the hilly area on the same day was 0.27 mm/d, which was only one-third of that in the gully area. Dew occurred primarily in autumn and summer. Overall, the number of dew days decreased in the following order: autumn > summer > spring > winter. Except that, in winter, the average monthly dew amount in the gully region was greater than that in the hilly region (Figure 5c,e). Dew mainly occurred in autumn and summer in both regions, but the peak months differed. The peak monthly dew amount was 8.57 mm (September 2023) in the hilly region, while it was 11.88 mm (October 2024) in the gully region (Figure 5b,c). During the observation period, dewfall was relatively high between August and October, with a high value of dew days. The maximum monthly dew average amounts were 4.98 mm (hilly, September) and 9.82 mm (gully, October), with the gully region’s maximum being approximately twice that of the hilly region.
From August to October, the number of dew days per month in the hilly region could exceed 25, with a monthly dew frequency exceeding 80%. In the gully region, dew days per month could exceed 20 days, with a frequency exceeding 60% (Figure 5d).

3.3. Influence Factors

3.3.1. Relative Humidity

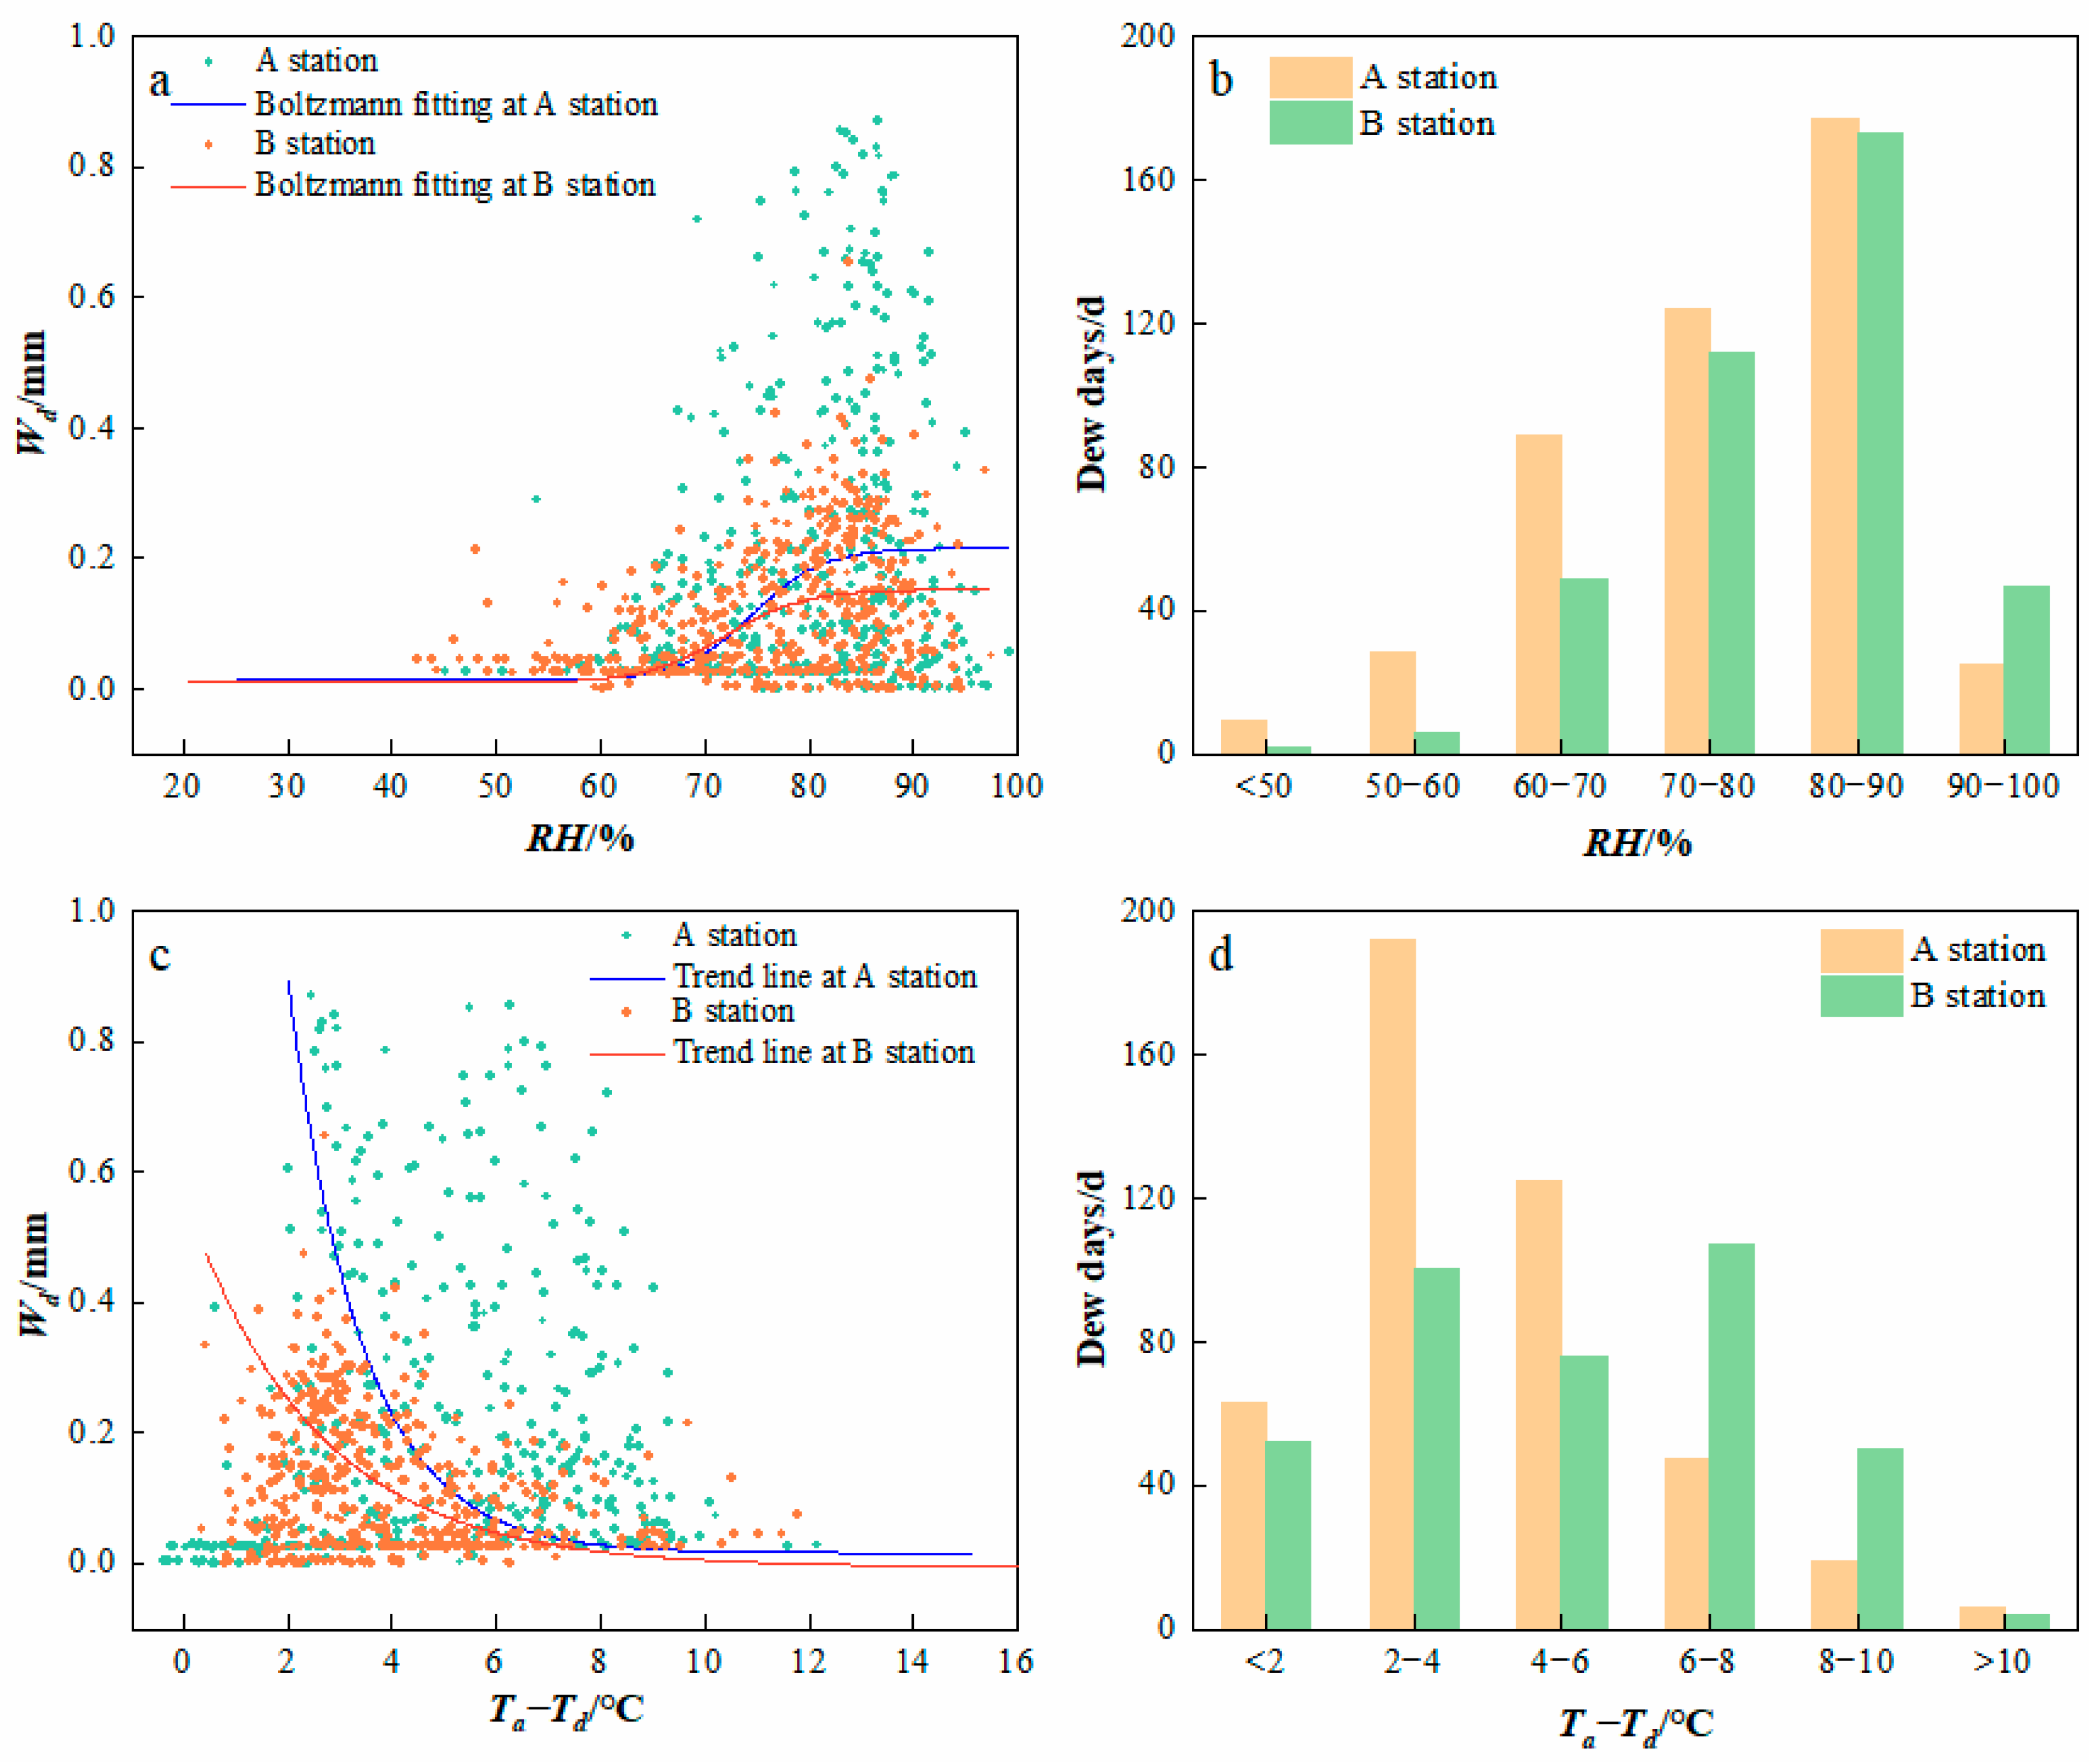
The relationship between dew amount, dew days, and relative humidity is shown in Figure 6a,b. Overall, the dew amount increased with increasing relative humidity. The dew amount increased significantly when the relative humidity exceeded 60% in both regions. When relative humidity was between 60 and 90%, dew occurrence days were more frequent in the hilly region. However, at relative humidity exceeding 90%, dew occurred more frequently in the gully region. Overall, dew formation primarily occurred at relative humidity levels above 70%. Within this range, the maximum daily dew condensation amounts were 0.66 mm/d (hilly) and 0.87 mm/d (gully). Therefore, we concluded that the optimal relative humidity range for dew formation is 70–100%, and larger dew events were more likely to occur in the gully region when the relative humidity is higher.

3.3.2. The Difference Between Air Temperature and Dewpoint Temperature

The relationship between dew condensation and the air temperature–dew point temperature difference (TaTd) is shown in Figure 6c,d. The daily condensation amount increased as the temperature difference decreased. The amount of dew was noticeably affected by this difference; larger differences led to less dew. When TaTd ≤ 8 °C, dew occurred more frequently in both regions, particularly in the hilly region, but the daily dew amounts were smaller there. When TaTd > 8 °C, the number of condensation days decreased significantly, and the dew amount also decreased markedly. This indicates that dew condensation occurs only within a specific range of temperature–dew point difference. In this study, dew primarily occurred within the range where the difference was less than 8 °C, and larger dew events were more likely in the gully region when this difference was smaller.

3.3.3. Wind Speed and Direction

The relationship between wind direction and dew amount (Figure 7a,b) showed that the prevailing wind directions for dew occurrence in the hilly region were southerly (150–210°), southwesterly (210–240°), and west-northwesterly (270–300°), with occurrence frequencies of 32.52%, 18.81%, and 13.05%, respectively. The daily dew amount peaked under southerly winds at 0.66 mm/d. In the gully region, the prevailing wind directions for dew occurrence were north-northeasterly (0–30°), southwesterly (210–240°), and west-northwesterly (240–270°), with frequencies of 16.97%, 16.97%, and 38.05%, respectively. The daily dew amount peaked under west-northwesterly winds at 0.87 mm/d. It was evident that dew condensation occurred predominantly in these main directions and reached its peak amount there.
The relationship between dew and condensation days is shown in Figure 7c. As wind speed increased, the dew days at both stations first increased and then decreased. In the hilly region, dew frequency was highest (64.38%) within the wind speed range of 0.01–0.5 m/s. When wind speed exceeded 0.5 m/s, dew frequency was very low (4.42%). Therefore, the critical wind speed for the hilly region was 0.5 m/s. In the gully region, dew frequency peaked at the value of 48.07% within the wind speed range of 1–1.5 m/s. Dew frequency was high at the value of 83.29% within the range of 0–1.5 m/s. Thus, the critical wind speed for the gully region was 1.5 m/s.

3.3.4. Rainfall

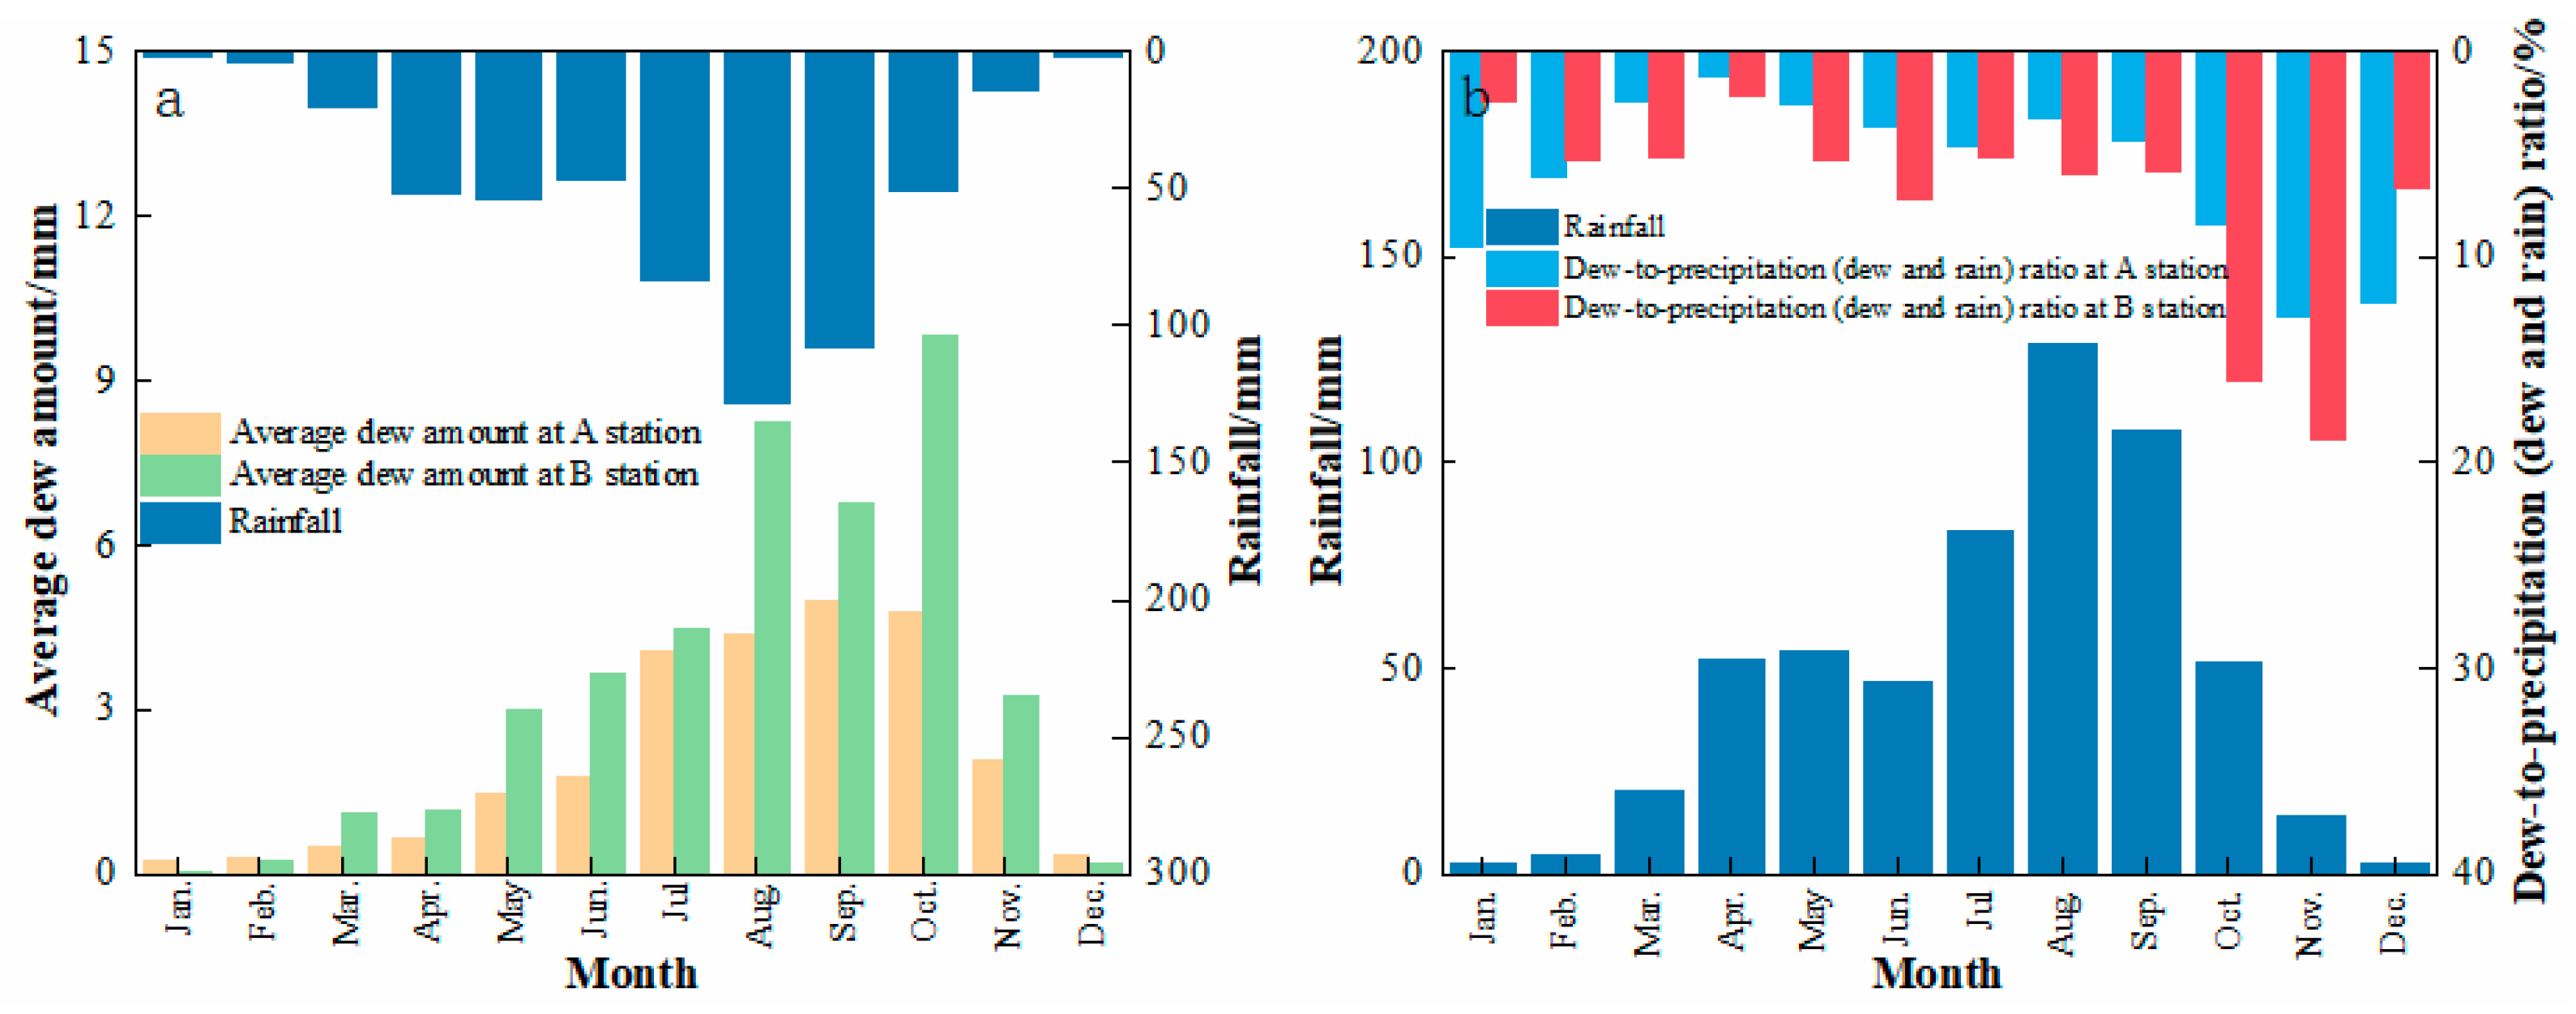
Figure 8 shows the monthly average dew amount, monthly average rainfall amount, and monthly dew-to-rain ratio for both stations during the monitoring period. The monthly average dew amount and rainfall amount at both stations generally exhibited an initial increase followed by a decrease, while the monthly dew-to-precipitation (dew and rain) ratio generally exhibited an initial decrease followed by an increase.
In the hilly region, the highest monthly rainfall occurred in August (128.45 mm), concurrent with a monthly dew amount of 4.35 mm and a dew-to-precipitation (dew and rain) of 3.27%. In January, the minimum monthly rainfall was 2.5 mm, with a dew amount of 0.26 mm and a dew-to-precipitation (dew and rain) ratio of 9.53%. In November, the maximum monthly dew-to-precipitation (dew and rain) ratio was 12.88%, with a dew amount of 2.06 mm. In the gully region, during the wettest month (August), the dew amount was 8.21 mm, the dew-to-precipitation (dew and rain) ratio was 6.01%—nearly double that of the hilly region. In January (lowest rainfall), the gully region also had a low dew amount (0.06 mm) and a dew-to-precipitation (dew and rain) ratio of 2.40%. In November (maximum dew-to-precipitation (dew and rain) ratio of 18.91%), the average rainfall was 13.9 mm, and the dew amount was 3.24 mm—both the ratio and dew amount were still higher than in the hilly region.
During months with high or low rainfall, both the monthly dew amount and dew-to-rain ratio were generally lower in both regions, but the dew-to-precipitation (dew and rain) ratio could reach its maximum when the rainfall is low. During months with moderate rainfall, the monthly dew amount peaked, and the dew-to-precipitation (dew and rain) ratio was also relatively high. However, under equivalent rainfall conditions, the gully region was more prone to larger dew events, resulting in a higher dew-to-precipitation (dew and rain) ratio than the hilly region.

4. Discussion

4.1. Dew Characteristics

We found that, during April 2023 to April 2025, the monthly average dew amounts at 0.2 m height were 2.15 mm and 3.38 mm for the hilly and gully regions, respectively. Dew primarily occurred from August to October each year, concentrated in autumn and summer, with the peak value in autumn. The maximum values were 8.57 mm (hilly region, September 2023) and 11.88 mm (gully region, October 2024). This difference was attributed to the steep topography of the gully region, accelerating cold air descent, creating a “cold air lake effect”, resulting in lower valley bottom temperatures compared to the hilly region. Furthermore, the vertical elevation difference exceeding 200 m facilitated the accumulation of cold air at the valley bottom at night, forming a stable inversion layer. In contrast, the gentle topography of the hilly region promoted faster cold air dispersion and resulted in an unstable inversion layer, further weakening the dew condensation capacity, ultimately leading to significantly higher monthly average dew amounts in the gully region [34]. Although the hilly region had more dew days per month, the total and monthly dew amounts were smaller than those in the gully region. The main reason was that the gully region, with its lower elevation and proximity to rivers, benefited from ample water vapor supply, whereas the hilly region, characterized by relatively higher elevation and lower air humidity compared to the gully region, experienced weaker water vapor supply [55].
The typical diurnal variation pattern of dew also differed seasonally. The duration of dew was longest in autumn and summer, followed by spring and winter, consistent with findings reported by other scholars [56]. Furthermore, diurnal results indicated that dew primarily occurred between 19:00 and 07:00 the next day, peaking between 05:30 and 07:00 in the early morning. Dew evaporated rapidly and disappeared before 10:00, exhibiting the typical characteristic of “hiding during the day and emerging at night”. This aligned with the dew observation studies in China’s Loess Plateau [2] and studies at the Yanchi Research Station of Beijing Forestry University in Ningxia, Northwest China [57].
Since frost was difficult to observe on the LWS using variable voltage values, this paper only considered dew and excluded the formation of frost (excluding typical days in winter when the temperature is below 0 °C). In the future, further research can be conducted on the condensation characteristics of frost.
This study provides the first precise quantification of dew differences between hilly and gully areas (with a vertical drop of approximately 200 m), contrasting these severely eroded regions with well-studied desert or dune environments. It further reveals a more pronounced “cold air pooling effect” than previously reported in gently sloping dune landscapes. The findings offer valuable guidance for vegetation restoration and dew collection in arid regions.

4.2. Driving Factors of Dew Formation

Dew formation is influenced by meteorological conditions, with temperature, relative humidity, and wind speed being the primary drivers [27,28]. Appropriate temperature was key; declining temperatures lower the saturation vapor pressure, and dew forms when the air temperature fell below the dew point [58]. However, Dew forms when the surface temperature is lower than or equal to the dew point temperature as a result of radiative cooling [27,59]. We found that, when TaTd ≤ 8 °C, dew days accounted for 94% (hilly) and 86% (gully) of total days, and maximum daily dew volumes occurred within this range. This finding confirms that dew occurs only within a specific temperature difference range, primarily less than 8 °C in this study. This observation aligned with those made at the Shapotou Desert Experimental Research Station in China [60].
Dew amount is positively correlated with relative humidity; the higher the near-surface relative humidity, the more dew that occurs [2,61]. We observed that dew volume increased when relative humidity exceeded 60% in both regions. When relative humidity exceeded 70%, dew condensation days accounted for 72.12% and 85.35% of the total condensation days in the hilly and gully regions, respectively. This aligned with the findings of Zhuang et al. (2021) [26] and Guo et al. (2016) [61]. Despite lower average relative humidity in the hilly region, they exhibit higher dew frequency. This is primarily because the open terrain facilitates rapid radiative cooling, frequently reaching the temperature threshold for dew formation, resulting in more frequent dew occurrence. However, the lower humidity and limited available water vapor constrain condensation efficiency and duration, leading to lower nighttime yields. Conversely, the sheltered environment of the gully region promotes the accumulation of cold air and higher humidity retention. On nights when the temperature threshold is met (even if such nights are slightly less frequent), favorable conditions are established, enabling significantly greater dew accumulation compared to the hilly region [33,34]. The formation of dew is influenced by temperature and relative humidity. Moderate cooling helps to approach the dew point temperature, promoting dew condensation on the condensation surface, while high relative humidity indicates abundant water vapor in the air, which facilitates condensation. When relative humidity exceeds 60%, it indicates that relative humidity can promote dew condensation to a certain extent, thereby increasing the likelihood of dew formation. When combined with an atmospheric temperature suitable for approaching the dew point temperature, and under the appropriate influence of other factors (such as wind speed and direction or after moderate rainfall events), it was possible for significant dew to form [51,62].
Wind speed affects dew formation. Excessively high winds (enhancing convective heat transfer) or calm conditions (limiting vapor transport) both suppress condensation. Moderate winds are most conducive to vapor replenishment and temperature maintenance, thereby favoring dew formation [2]. We found that, in the hilly region, condensation frequency peaked at the value of 64.38% within the wind speed range of 0.01–0.5 m/s, and the daily dew amount also reached its maximum within this range. Condensation frequency became negligible above 0.5 m/s. In the gully region, condensation frequency peaked at the value of 48.07% within the 1–1.5 m/s range, where daily dew volume was also highest. Dew frequency decreased significantly above 1.5 m/s. This is consistent with findings from other scholars [2]. Other scholars have also come up with pretty different research results: Muselli et al. (2002) concluded that a wind speed of <1.0 m/s can provide sufficient moisture for the formation of dew [63]. It has also been concluded that the critical line for wind speeds favorable to dew was 4.5 m/s [64]. These differences may be due to the fact that the role of wind on dew varies depending on the regional geographic location, the main regional wind direction, and the source of water vapor, so the frequency distribution of dew with the wind direction in the present study is only applicable to the study region.
Appropriate rainfall facilitates dew formation. Rainfall events are often accompanied by changes in temperature and relative humidity. Increased vapor content before rainfall raises relative humidity, favoring condensation [65]. After rainfall, cooling from plant and soil evapotranspiration lowers air temperature toward the dew point, promoting dew formation [7]. Rainfall significantly promotes dew formation in arid regions [50]. We observed that, although average rainfall was high and prolonged from July to September, dew volumes were lower and did not reach the maximum. The amount of dew peaked in months with moderate rainfall, such as October. This aligned with the findings of Salau et al. (1986) [66]. Existing research showed that rainfall increased atmospheric vapor content, and post-rainfall condensation volume was significantly positively correlated with the rainfall amount [65,66]. Rainfall is particularly important for dew formation in arid regions [51].
As climate change leads to more erratic rainfall and prolonged droughts in semi-arid regions like the Loess Plateau, dew will become increasingly vital. Research indicates that topography is a key factor in the distribution of this dew, with gully areas potentially demonstrating greater resilience to climate change due to their enhanced dew condensation capacity.

4.3. Influence of Topography on Dew

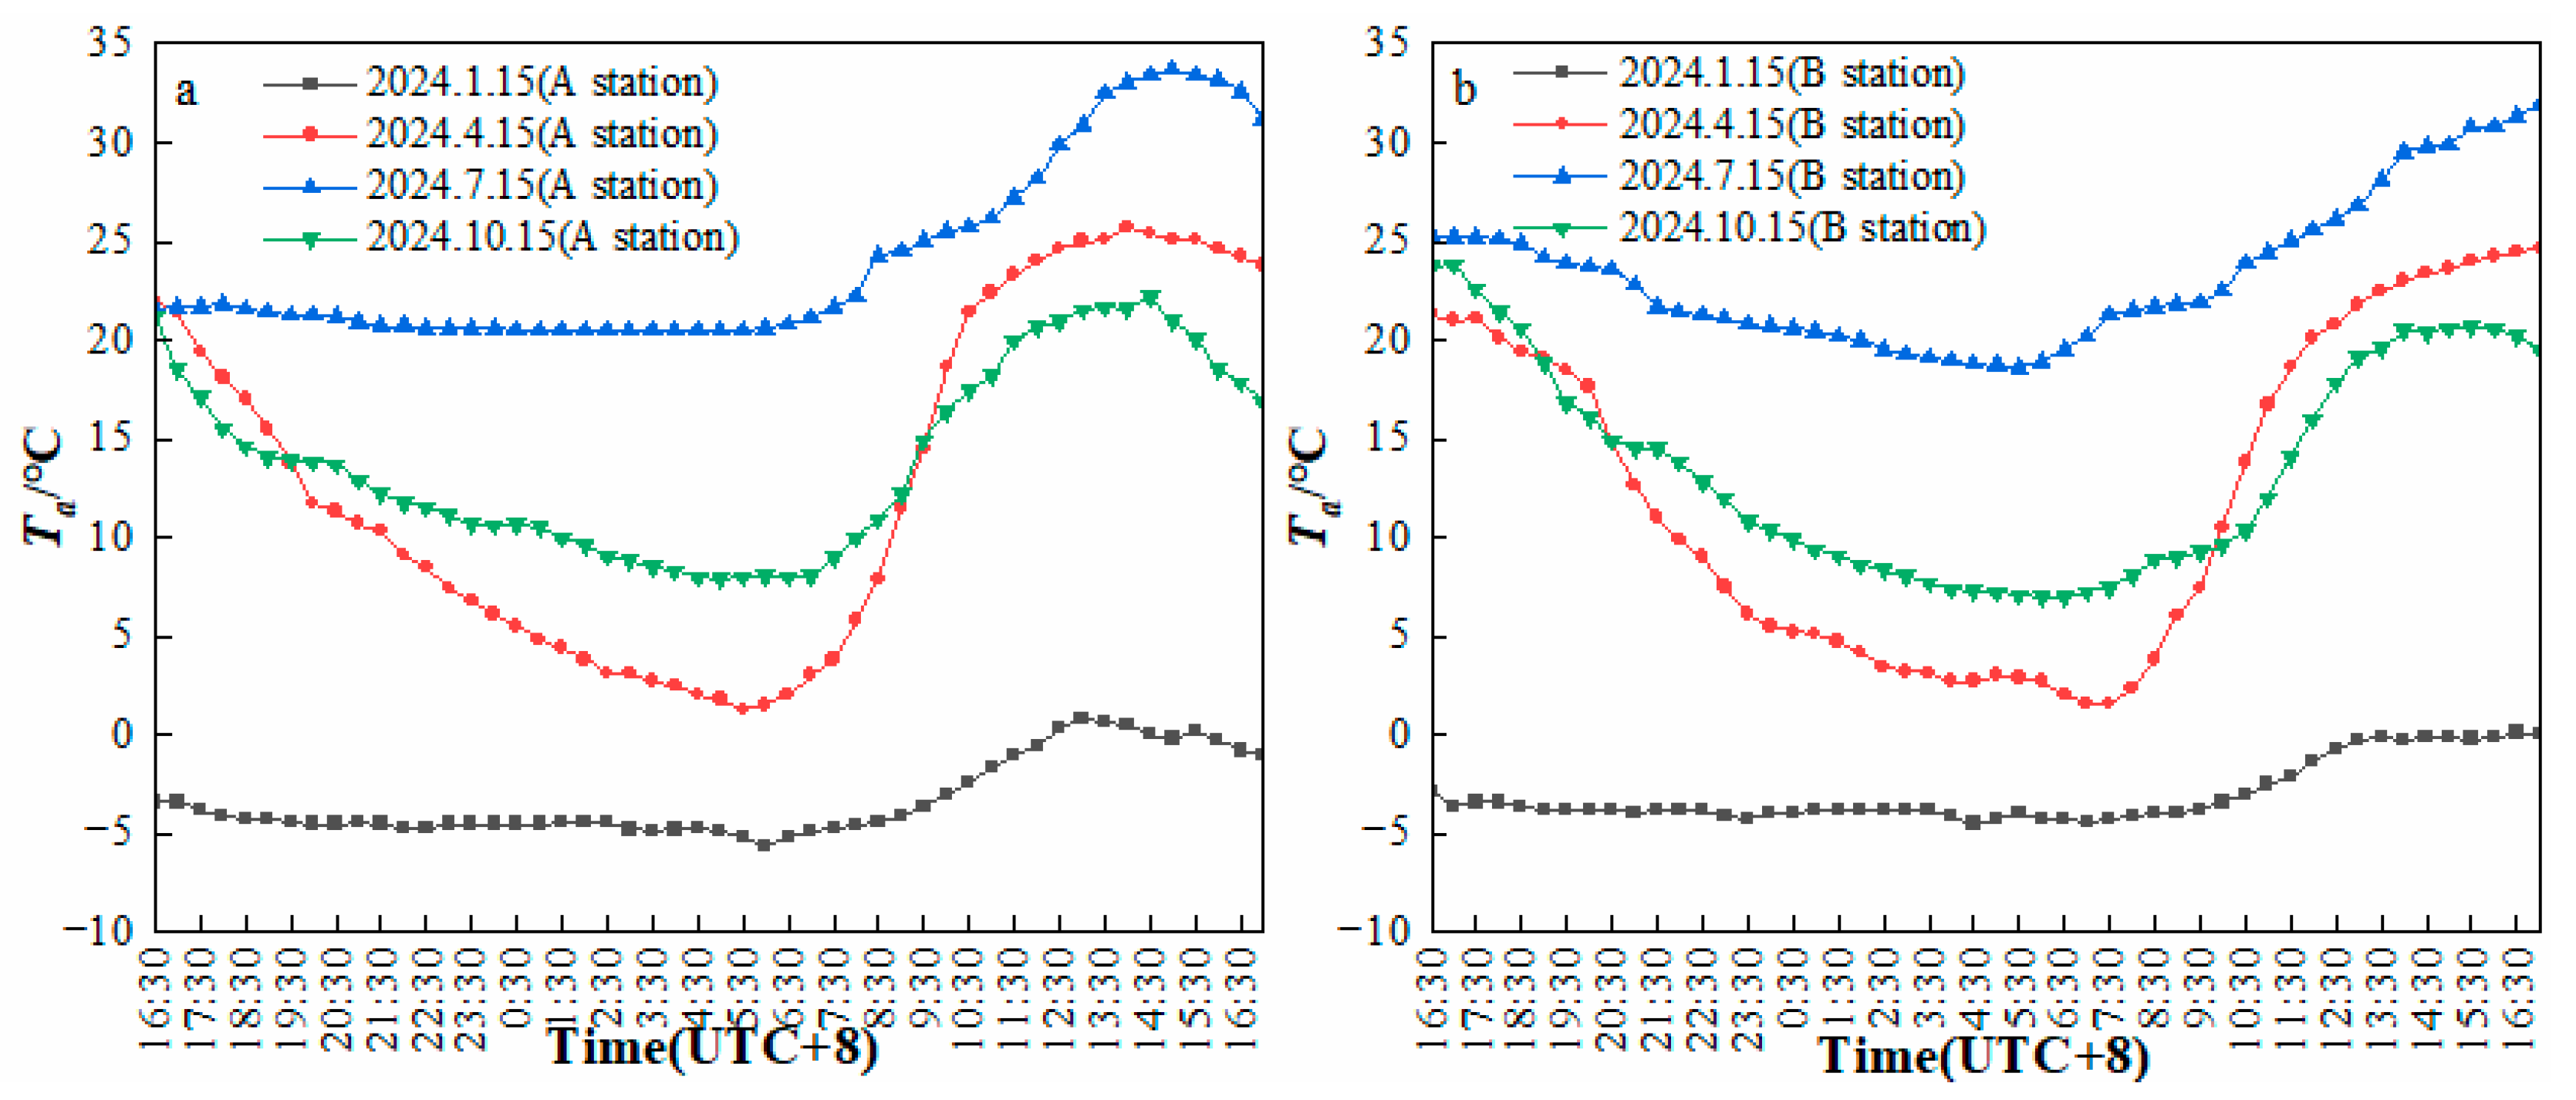
Topography significantly influences the efficiency and amount of dew formation by altering local micro-meteorological conditions, such as radiative cooling intensity, air circulation, water vapor transport pathways, and cold air drainage. A study in desert-oasis transition zones found that dew amounts in inter-dune lowlands were higher than in adjacent slopes and dune tops [34]. The reason is that cold air formed by nocturnal longwave radiation cooling is denser, sinks along slopes, and accumulates in depressions, forming a stable inversion layer that significantly prolongs surface cooling time and suppresses turbulent heat exchange. This promotes sustained water vapor condensation, creating a “cold air lake effect,” making valleys and depressions dew-enrichment zones. This was similar to what we have seen, where on the middle days of each season, the temperature drop at night was bigger in the gully area (B station) than in the hilly area (A station), which meant there was more cold air gathering in the gully area (Figure 9). Conversely, strong turbulence and low humidity on ridges significantly inhibit condensation. Slope aspect and gradient also affect dew condensation by regulating the surface energy balance. North-facing slopes and gentle slopes, receiving less daytime solar radiation, experience faster nighttime surface cooling, resulting in higher dew condensation amounts compared to south-facing slopes and steep slopes [67]. We observed that, although the dynamic trends of dew were similar between the hilly and gully regions, the dew amount was noticeably affected by topography: the gully region was more prone to larger dew events than the hilly region, consistent with findings from other scholars [34]. Therefore, when utilizing dew resources (e.g., for agricultural irrigation in arid regions) or selecting sites for ecological restoration projects, valley bottoms or low-lying areas near water bodies, where cold air readily accumulates, should be prioritized. Furthermore, dew condensation was also influenced by altitude, which exerted a nonlinear effect by altering temperature and humidity. Dew peaks often occur at low to medium altitudes (e.g., 200–800 m) due to the optimal combination of vapor pressure deficit and radiative cooling. Although low temperatures at high altitudes favor condensation, dew amounts were lower than at low altitudes due to water vapor scarcity [68].

4.4. Ecological Effects of Dew

In arid regions with scarce rainfall, the proportion of annual dew amount to annual rainfall varied under different regional and climatic conditions. Studies in China’s Shapotou Tengger Desert showed condensation accounts for 11.46–17.67% of rainfall [69]. This study found the maximum monthly dew-to-rain ratios were 14.79% (hilly) and 23.32% (gully). Although the volume of dew was small compared to rainfall, as a persistent water source, its quantity and quality significantly impacted the living environments of flora and fauna, holding great importance for regional water cycles and ecological effects [13,21,42,70].

5. Conclusions

Field dew observation experiments were conducted from April 2023 to April 2025 in typical hilly and gully regions of China’s Loess Plateau to investigate the influence of topography on dew formation. The main conclusions are as follows:
1. During the observation period, dew primarily occurred between 19:00 and 07:00 the next day, peaking between 05:30 and 07:00 in the early morning. The monthly average dew amounts for the hilly region and gully region were 2.15 mm and 3.38 mm, respectively. The maximum monthly dew amounts were 8.57 mm and 11.88 mm, respectively, both occurring in autumn, with higher amounts in the gully region.
2. Dew formation at a 0.2 m height was favored when relative humidity at 0.2 m exceeded 70%, the air temperature–dew point difference was less than 8 °C, wind direction was between 150 and 210° and 240 and 270° for the hilly region and gully region, respectively, and the standardized wind speed at 10 m height was less than 0.5 m/s and 1.5 m/s for the hilly region and gully region, respectively.
3. Moderate rainfall facilitates dew condensation. The monthly average dew-to-precipitation (dew and rain) ratio reached its maximum in November for both the hilly region and gully region, at 12.88% and 18.91%, respectively, with the gully region having a larger ratio.
4. During the observation period, the gully region experienced larger dew events more frequently than the hilly region, resulting in higher dew amounts.

Author Contributions

Conceptualization, Z.J.; methodology, Z.J. and H.L.; software, H.L.; validation, Z.J. and H.L.; formal analysis, Z.J., H.L. and Y.M.; investigation, H.L. and Y.M.; resources, Z.J., and H.L.; data curation, H.L.; writing—original draft preparation, H.L.; writing—review and editing, Z.J. and H.L.; supervision, Z.J.; project administration, Z.J. All authors have read and agreed to the published version of the manuscript.

Funding

This work was supported by the Fundamental Research Funds for the Central Universities, CHD (300102293209).

Institutional Review Board Statement

Not applicable.

Informed Consent Statement

Not applicable.

Data Availability Statement

The data presented in this study are available on request from the corresponding author. The data are not publicly available due to the privacy policy of the organization.

Acknowledgments

The authors would like to thank the anonymous reviewers for their critical comments and suggestions for improving the manuscript.

Conflicts of Interest

The authors declare that they have no known competing financial interests or personal relationships.

References

  1. Muselli, M.; Lekouch, I.; Beysens, D. Physical and Chemical Characteristics of Dew and Rain in North-West Africa with Focus on Morocco: Mapping Past and Future Evolution (2005–2100). Atmosphere 2022, 13, 1974. [Google Scholar] [CrossRef]
  2. Zhang, Q.; Wang, S.; Yang, F.-L.; Yue, P.; Yao, T.; Wang, W.Y. Characteristics of Dew Formation and Distribution, and Its Contribution to the Surface Water Budget in a Semi-arid Region in China. Bound. Layer Meteorol. 2015, 154, 317–331. [Google Scholar] [CrossRef]
  3. Tomaszkiewicz, M.; Najm, M.A.; Zurayk, R.; El-Fadel, M. Dew as an adaptation measure to meet water demand in agriculture and reforestation. Agric. For. Meteorol. 2017, 232, 411–421. [Google Scholar] [CrossRef]
  4. Wang, L.N.; Zhu, Q.K.; Zhao, W.J.; Zhao, X.K. The drought trend and its relationship with rainfall intensity in the Loess Plateau of China. Nat. Hazards 2015, 77, 479–495. [Google Scholar] [CrossRef]
  5. Meng, Y.; Wen, X. Characteristics of dew events in an arid artificial oasis cropland and a sub-humid cropland in China. J. Arid Land 2016, 8, 399–408. [Google Scholar] [CrossRef]
  6. Agam, N.; Berliner, P.R. Dew formation and water vapor adsorption in semi-arid environments—A review. J. Arid Environ. 2006, 65, 572–590. [Google Scholar] [CrossRef]
  7. Wang, X.; Gao, Z.Y.; Wang, Y.K.; Wang, Z.; Jin, S.S. Dew measurement and estimation of rain-fed jujube (Zizyphus jujube Mill) in a semi-arid loess hilly region of China. J. Arid Land 2017, 9, 547–557. [Google Scholar] [CrossRef]
  8. Feng, T.; Zhang, L.; Chen, Q.; Ma, Z.; Wang, H.; Shangguan, Z.; Wang, L.; He, J.-S. Dew formation reduction in global warming experiments and the potential consequences. J. Hydrol. 2021, 593, 125819. [Google Scholar] [CrossRef]
  9. Jorgenson, M.T.; Racine, C.H.; Walters, J.C.; Osterkamp, T.E. Permafrost Degradation and Ecological Changes Associated with a Warming Climate in Central Alaska. Clim. Chang. 2001, 48, 551–579. [Google Scholar] [CrossRef]
  10. McGuire, A.D.; Wirth, C.; Apps, M.; Beringer, J.; Clein, J.; Epstein, H.; Kicklighter, D.W.; Bhatti, J.; Chapin, F.S.; de Groot, B.; et al. Environmental variation, vegetation distribution, carbon dynamics and water/energy exchange at high latitudes. J. Veg. Sci. 2002, 13, 301–314. [Google Scholar] [CrossRef]
  11. Ucles, O.; Villagarcia, L.; Canton, Y.; Domingo, F. Microlysimeter station for long term non-rainfall water input and evaporation studies. Agric. For. Meteorol. 2013, 182, 13–20. [Google Scholar] [CrossRef]
  12. Kidron, G.J.; Temina, M. Non-rainfall water input determines lichen and cyanobacteria zonation on limestone bedrock in the Negev Highlands. Flora 2017, 229, 71–79. [Google Scholar] [CrossRef]
  13. Kaseke, K.F.; Wang, L. Fog and Dew as Potable Water Resources: Maximizing Harvesting Potential and Water Quality Concerns. Geohealth 2018, 2, 327–332. [Google Scholar] [CrossRef]
  14. Westra, S.; Fowler, H.J.; Evans, J.P.; Alexander, L.V.; Berg, P.; Johnson, F.; Kendon, E.J.; Lenderink, G.; Roberts, N.M. Future changes to the intensity and frequency of short-duration extreme rainfall. Rev. Geophys. 2014, 52, 522–555. [Google Scholar] [CrossRef]
  15. Koutsoyiannis, D. Revisiting the global hydrological cycle: Is it intensifying? Hydrol. Earth Syst. Sci. 2020, 24, 3899–3932. [Google Scholar] [CrossRef]
  16. Pumo, D.; Noto, L.V. Exploring the linkage between dew point temperature and precipitation extremes: A multi-time-scale analysis on a semi-arid Mediterranean region. Atmos. Res. 2021, 254, 105508. [Google Scholar] [CrossRef]
  17. Zheng, Y.; Bai, H.; Huang, Z.; Tian, X.; Nie, F.-Q.; Zhao, Y.; Zhai, J.; Jiang, L. Directional water collection on wetted spider silk. Nature 2010, 463, 640–643. [Google Scholar] [CrossRef] [PubMed]
  18. Pan, Z.; Pitt, W.G.; Zhang, Y.; Wu, N.; Tao, Y.; Truscott, T.T. The upside-down water collection system of Syntrichia caninervis. Nat. Plants 2016, 2, 16076. [Google Scholar] [CrossRef]
  19. Tuure, J.; Korpela, A.; Hautala, M.; Rautkoski, H.; Hakojärvi, M.; Mikkola, H.; Duplissy, J.; Pellikka, P.; Petäjä, T.; Kulmala, M.; et al. Comparing plastic foils for dew collection: Preparatory laboratory-scale method and field experiment in Kenya. Biosyst. Eng. 2020, 196, 145–158. [Google Scholar] [CrossRef]
  20. Kool, D.; Agra, E.; Drabkin, A.; Duncan, A.; Fendinat, P.P.; Leduc, S.; Lupovitch, G.; Nambwandja, A.N.; Ndilenga, N.S.; Nguyễn Thị, T.; et al. The overlooked non-rainfall water input sibling of fog and dew: Daily water vapor adsorption on a !Nara hummock in the Namib Sand Sea. J. Hydrol. 2021, 598, 126420. [Google Scholar] [CrossRef]
  21. Gerlein-Safdi, C.; Koohafkan, M.C.; Chung, M.; Rockwell, F.E.; Thompson, S.; Caylor, K.K. Dew deposition suppresses transpiration and carbon uptake in leaves. Agric. For. Meteorol. 2018, 259, 305–316. [Google Scholar] [CrossRef]
  22. Riedl, A.; Li, Y.; Eugster, J.; Buchmann, N.; Eugster, W. Technical note: High-accuracy weighing micro-lysimeter system for long-term measurements of non-rainfall water inputs to grasslands. Hydrol. Earth Syst. Sci. 2022, 26, 91–116. [Google Scholar] [CrossRef]
  23. Juřička, D.; Pecina, V.; Kusbach, A.; Vlček, V.; Novotná, J.; Pařílková, J.; Otgonsuren, B.; Brtnický, M.; Kynický, J. Thermal regime of semi-natural dew collector’s perspective for afforestation of semi-arid landscapes. Environ. Technol. Innov. 2020, 20, 101125. [Google Scholar] [CrossRef]
  24. Scherm, H.; Bruggen, A.H.C.v. Sensitivity of simulated dew duration to meteorological variations in different climatic regions of California. Agric. For. Meteorol. 1993, 66, 229–245. [Google Scholar] [CrossRef]
  25. Hao, X.; Li, C.; Guo, B.; Ma, J.X.; Ayup, M.; Chen, Z.S. Dew formation and its long-term trend in a desert riparian forest ecosystem on the eastern edge of the Taklimakan Desert in China. J. Hydrol. 2012, 472–473, 90–98. [Google Scholar] [CrossRef]
  26. Zhuang, Y.; Zhao, W.; Luo, L.; Wang, L. Dew formation characteristics in the gravel desert ecosystem and its ecological roles on Reaumuria soongorica. J. Hydrol. 2021, 603, 126932. [Google Scholar] [CrossRef]
  27. Beysens, D. Estimating dew yield worldwide from a few meteo data. Atmos. Res. 2016, 167, 146–155. [Google Scholar] [CrossRef]
  28. Kaseke, K.F.; Wang, L.X.; Seely, M.K. Nonrainfall water origins and formation mechanisms. Sci. Adv. 2017, 3, e1603131. [Google Scholar] [CrossRef] [PubMed]
  29. Kidron, G.J. Analysis of dew precipitation in three habitats within a small arid drainage basin, Negev Highlands, Israel. Atmos. Res. 2000, 55, 257–270. [Google Scholar] [CrossRef]
  30. Kidron, G.J. The effect of substrate properties, size, position, sheltering and shading on dew: An experimental approach in the Negev Desert. Atmos. Res. 2010, 98, 378–386. [Google Scholar] [CrossRef]
  31. Kidron, G.J.; Temina, M.; Starinsky, A. An Investigation of the Role of Water (Rain and Dew) in Controlling the Growth Form of Lichens on Cobbles in the Negev Desert. Geomicrobiol. J. 2011, 28, 335–346. [Google Scholar] [CrossRef]
  32. Kidron, G.J.; Starinsky, A.; Yaalon, D.H. Cyanobacteria are confined to dewless habitats within a dew desert: Implications for past and future climate change for lithic microorganisms. J. Hydrol. 2014, 519, 3606–3614. [Google Scholar] [CrossRef]
  33. Yu, R.; Zhang, Z.; Lu, X.; Chang, I.S.; Liu, T. Variations in dew moisture regimes in desert ecosystems and their influencing factors. Wiley Interdiscip. Rev. Water 2020, 7, e1482. [Google Scholar] [CrossRef]
  34. Zhuang, Y.; Zhao, W. Dew variability in three habitats of a sand dune transect in a desert oasis ecotone, Northwestern China. Hydrol. Process. 2014, 28, 1399–1408. [Google Scholar] [CrossRef]
  35. Groh, J.; Slawitsch, V.; Herndl, M.; Graf, A.; Vereecken, H.; Pütz, T. Determining dew and hoar frost formation for a low mountain range and alpine grassland site by weighable lysimeter. J. Hydrol. 2018, 563, 372–381. [Google Scholar] [CrossRef]
  36. Li, M.; Yang, E.; Li, P.; Shen, Z.; Bao, H.; Ni, Y. Identifying sediment sources from the inter-gully area and gully area in a small watershed in the Loess Hilly Region of China. Environ. Earth Sci. 2017, 76, 776. [Google Scholar] [CrossRef]
  37. Li, C.; Li, F.; Dai, Z.; Yang, X.; Cui, X.; Luo, L. Spatial variation of gully development in the loess plateau of China based on the morphological perspective. Earth Sci. Inform. 2020, 13, 1–15. [Google Scholar] [CrossRef]
  38. Xiao, B.; Ma, S.; Hu, K. Moss biocrusts regulate surface soil thermal properties and generate buffering effects on soil temperature dynamics in dryland ecosystem. Geoderma 2019, 351, 9–24. [Google Scholar] [CrossRef]
  39. Gao, L.; Bowker, M.A.; Xu, M.; Sun, H.; Tuo, D.; Zhao, Y. Biological soil crusts decrease erodibility by modifying inherent soil properties on the Loess Plateau, China. Soil Biol. Biochem. 2017, 105, 49–58. [Google Scholar] [CrossRef]
  40. Wang, L.; Kaseke, K.F.; Seely, M.K. Effects of non-rainfall water inputs on ecosystem functions. Wiley Interdiscip. Rev. Water 2017, 4, 1179. [Google Scholar] [CrossRef]
  41. Zhuang, Y.; Ratcliffe, S. Relationship between dew presence and Bassia dasyphylla plant growth. J. Arid Land 2012, 4, 11–18. [Google Scholar] [CrossRef]
  42. Zhuang, Y.; Zhao, W. Dew formation and its variation in Haloxylon ammodendron plantations at the edge of a desert oasis, northwestern China. Agric. For. Meteorol. 2017, 247, 541–550. [Google Scholar] [CrossRef]
  43. Jia, Z.; Wu, B.; Wei, W.; Chang, Y.; Lei, R.; Hu, W.; Jiang, J. Effect of Plastic Membrane and Geotextile Cloth Mulching on Soil Moisture and Spring Maize Growth in the Loess–Hilly Region of Yan’an, China. Agronomy 2023, 13, 2513. [Google Scholar] [CrossRef]
  44. Zhao, D.; Xu, M.; Liu, G.; Yao, X.; Tuo, D.; Zhang, R.; Xiao, T.; Peng, G. Quantification of soil aggregate microstructure on abandoned cropland during vegetative succession using synchrotron radiation-based micro-computed tomography. Soil Tillage Res. 2017, 165, 239–246. [Google Scholar] [CrossRef]
  45. Xu, M.; Zhang, J.; Liu, G.B.; Yamanaka, N. Soil properties in natural grassland, Caragana korshinskii planted shrubland, and Robinia pseudoacacia planted forest in gullies on the hilly Loess Plateau, China. Catena 2014, 119, 116–124. [Google Scholar] [CrossRef]
  46. Li, M.; Zhang, X.; Pang, G.; Han, F. The estimation of soil organic carbon distribution and storage in a small catchment area of the Loess Plateau. Catena 2013, 101, 11–16. [Google Scholar] [CrossRef]
  47. Wang, Z.J.; Jiao, J.Y.; Rayburg, S.; Wang, Q.L.; Su, Y. Soil erosion resistance of “Grain for Green” vegetation types under extreme rainfall conditions on the Loess Plateau, China. Catena 2016, 141, 109–116. [Google Scholar] [CrossRef]
  48. Fang, X.; Zhao, W.; Wang, L.; Feng, Q.; Ding, J.; Liu, Y.; Zhang, X. Variations of deep soil moisture under different vegetation types and influencing factors in a watershed of the Loess Plateau, China. Hydrol. Earth Syst. Sci. 2016, 20, 3309–3323. [Google Scholar] [CrossRef]
  49. Kou, M.; Garcia-Fayos, P.; Hu, S.; Jiao, J. The effect of Robinia pseudoacacia afforestation on soil and vegetation properties in the Loess Plateau (China): A chronosequence approach. For. Ecol. Manag. 2016, 375, 146–158. [Google Scholar] [CrossRef]
  50. Wang, H.; Jia, Z.; Wang, Z. Dew amount and its inducing factors in the loess hilly region of northern Shaanxi Province, China. Chin. J. Appl. Ecol. 2017, 28, 3703–3710. [Google Scholar] [CrossRef]
  51. Jia, Z.; Wang, Z.; Wang, H. Characteristics of Dew Formation in the Semi-Arid Loess Plateau of Central Shaanxi Province, China. Water 2019, 11, 126. [Google Scholar] [CrossRef]
  52. Lawrence, M.G. The Relationship between Relative Humidity and the Dewpoint Temperature in Moist Air: A Simple Conversion and Applications. Bull. Am. Meteorol. Soc. 2005, 86, 225–234. [Google Scholar] [CrossRef]
  53. Alduchov, O.A.; Eskridge, R.E. Improved Magnus form approximation of saturation vapor pressure. J. Appl. Meteorol. 1996, 35, 601–609. [Google Scholar] [CrossRef]
  54. Sharan, G.; Beysens, D.; Milimouk-Melnytchouk, I. A study of dew water yields on Galvanized iron roofs in Kothara (North-West India). J. Arid Environ. 2007, 69, 259–269. [Google Scholar] [CrossRef]
  55. Feng, T.; Huang, F.; Zhu, S.; Bu, L.; Qi, Z.; Li, L. Dew amount and its long-term variation in the Kunes River Valley, Northwest China. J. Arid Land 2022, 14, 753–770. [Google Scholar] [CrossRef]
  56. Liu, M.; Cen, Y.; Wang, C.; Gu, X.; Bowler, P.; Wu, D.; Zhang, L.; Jiang, G.; Beysens, D. Foliar uptake of dew in the sandy ecosystem of the Mongolia Plateau: A life-sustaining and carbon accumulation strategy shared differently by C3 and C4 grasses. Agric. For. Meteorol. 2020, 287, 107941. [Google Scholar] [CrossRef]
  57. Guo, X.A.; Wang, Y.F.; Yan, H.M.; Liu, P.; Tian, Y.; Shang, G.F.; Jin, C.; Zha, T.S. Dew/hoar frost on the canopies and underlying surfaces of two typical desert shrubs in Northwest China and their relevance to drought. J. Hydrol. 2022, 609, 12. [Google Scholar] [CrossRef]
  58. Tomaszkiewicz, M.; Abou Najm, M.; Beysens, D.; Alameddine, I.; Bou Zeid, E.; El-Fadel, M. Projected climate change impacts upon dew yield in the Mediterranean basin. Sci. Total Environ. 2016, 566–567, 1339–1348. [Google Scholar] [CrossRef]
  59. Li, S.L.; Bowker, M.A.; Xiao, B. Biocrusts enhance non-rainfall water deposition and alter its distribution in dryland soils. J. Hydrol. 2021, 595, 126050. [Google Scholar] [CrossRef]
  60. Wang, X.P.; Pan, Y.X.; Hu, R.; Zhang, Y.F.; Zhang, H. Condensation of water vapour on moss-dominated biological soil crust, NW China. J. Earth Syst. Sci. 2014, 123, 297–305. [Google Scholar] [CrossRef]
  61. Guo, X.; Zha, T.; Jia, X.; Wu, B.; Feng, W.; Xie, J.; Gong, J.; Zhang, Y.; Peltola, H. Dynamics of Dew in a Cold Desert-Shrub Ecosystem and Its Abiotic Controls. Atmosphere 2016, 7, 7030032. [Google Scholar] [CrossRef]
  62. Kabela, E.D. Dew frequency, duration, amount, and distribution in corn and soybean during SMEX05. Agric. For. Meteorol. 2009, 149, 11–24. [Google Scholar] [CrossRef]
  63. Muselli, M.; Beysens, D.; Marcillat, J.; Milimouk, I.; Nilsson, T.; Louche, A. Dew water collector for potable water in Ajaccio (Corsica Island, France). Atmos. Res. 2002, 64, 297–312. [Google Scholar] [CrossRef]
  64. Beysens, D.; Muselli, M.; Nikolayev, V.; Narhe, R.; Milimouk, I. Measurement and modelling of dew in island, coastal and alpine areas. Atmos. Res. 2004, 73, 1–22. [Google Scholar] [CrossRef]
  65. Fang, J. Variability in condensation water and its determinants in arid regions of north-western China. Ecohydrology 2020, 13, 2226. [Google Scholar] [CrossRef]
  66. Salau, O.A.; Lawson, T.L. Dewfall features of a tropical station: The case of Onne (Port Hartcourt), Nigeria. Theor. Appl. Climatol. 1986, 37, 233–240. [Google Scholar] [CrossRef]
  67. Uclés, O.; Villagarcía, L.; Cantón, Y.; Lázaro, R.; Domingo, F. Non-rainfall water inputs are controlled by aspect in a semiarid ecosystem. J. Arid Environ. 2015, 113, 43–50. [Google Scholar] [CrossRef]
  68. Shen, S.; Xiao, H.; Yang, H.; Fu, D.; Shu, W. Variations of water vapor transport and water vapor-hydrometeor-precipitation conversions during a heavy rainfall event in the Three-River-Headwater region of the Tibetan Plateau. Atmos. Res. 2021, 264, 105874. [Google Scholar] [CrossRef]
  69. Jia, R.L.; Li, X.R.; Liu, L.C.; Pan, Y.X.; Gao, Y.H.; Wei, Y.P. Effects of sand burial on dew deposition on moss soil crust in a revegetated area of the Tennger Desert, Northern China. J. Hydrol. 2014, 519, 2341–2349. [Google Scholar] [CrossRef]
  70. Dawson, T.E.; Goldsmith, G.R. The value of wet leaves. New Phytol. 2018, 219, 1156–1169. [Google Scholar] [CrossRef]
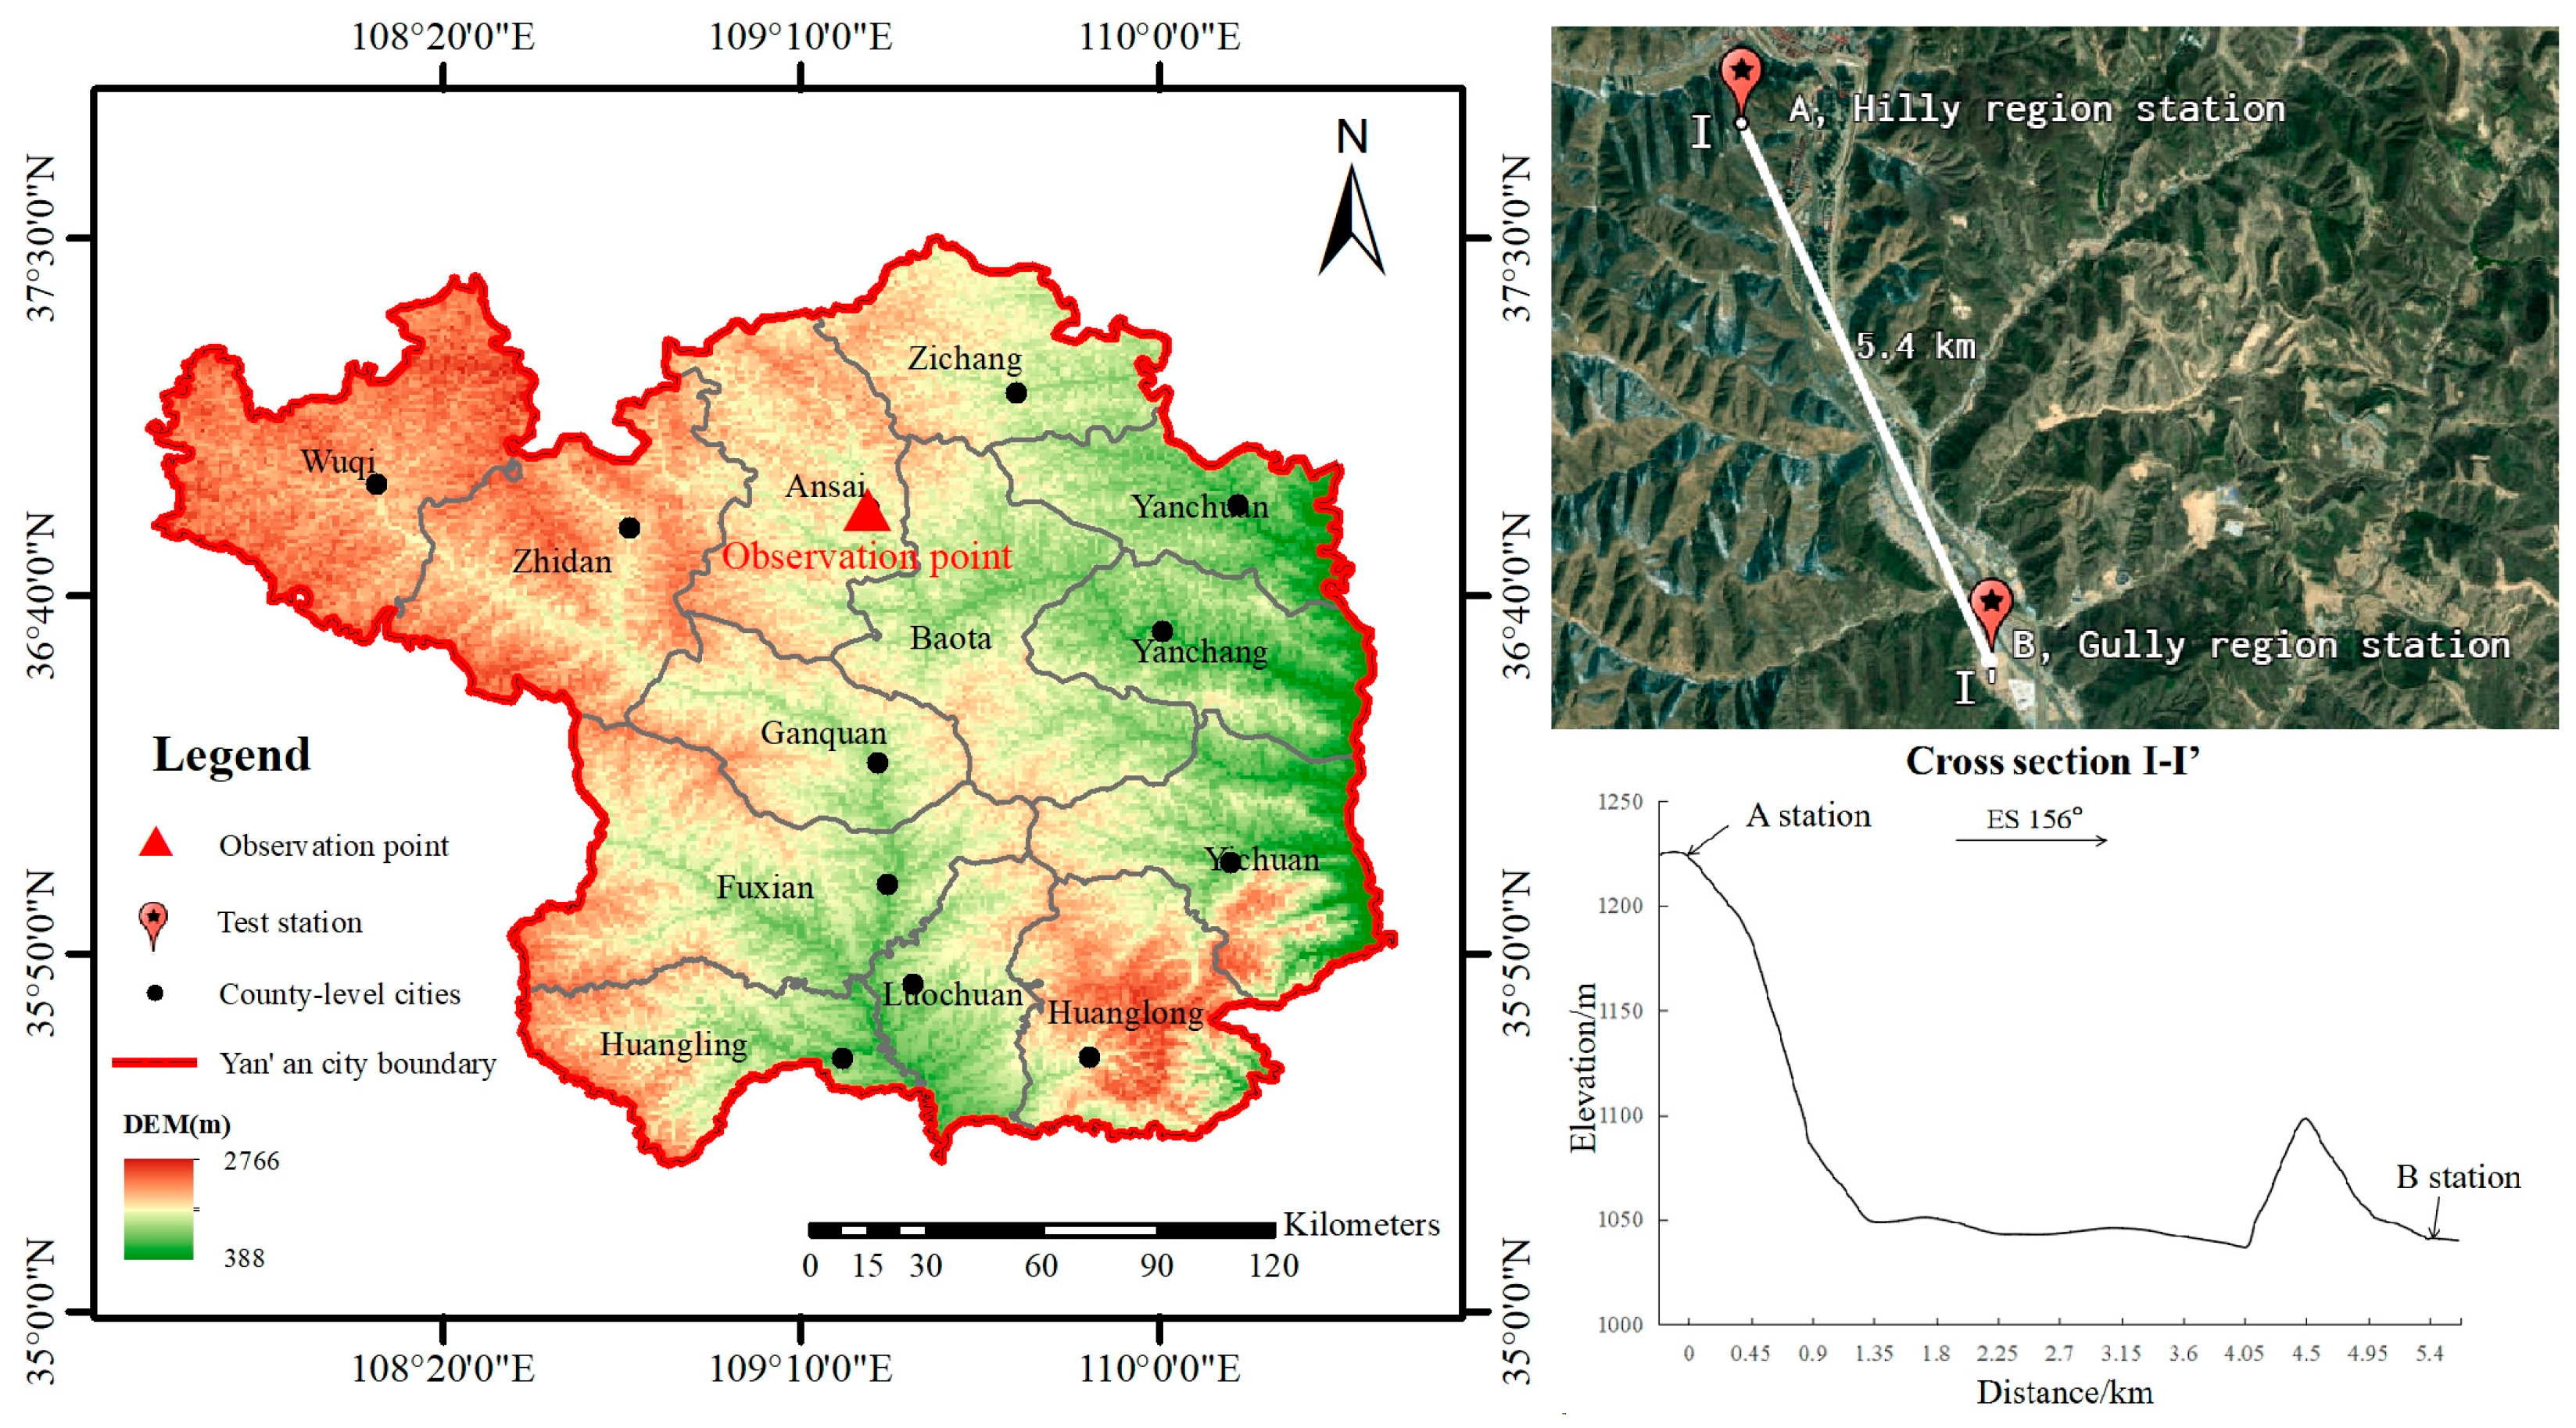
Figure 1. Geographical location map of the experimental site: A station, hilly region station; B station, gully region station.
Atmosphere 16 01098 g001
Figure 2. Field instrument observation design diagram for the Loess hilly and gully areas: (a) actual installation diagram of the device at A station; (b) actual installation diagram of the device at B station.
Atmosphere 16 01098 g002
Figure 3. Dew calculation simulation calibration curve: (a) EM50 calibration curve diagram; (b) TH5G calibration curve diagram.
Atmosphere 16 01098 g003
Figure 4. Daily variation in dew: (a,c) mean different seasons in the Loess hilly area and the Loess gully area, respectively; (b,d) mean daily dew evaporation duration, condensation duration, and condensation duration ratio in the Loess hilly area and the Loess gully area, respectively.
Atmosphere 16 01098 g004
Figure 5. Monthly variations in dew in the Loess hilly and gully areas: (a) comparison of daily dew amount; (b) monthly dew amount; (c) monthly averaged dew amount; (d) monthly averaged dew days; (e) dew days in each season.
Atmosphere 16 01098 g005
Figure 6. Effect of relative humidity and air temperature–dew point difference on dew condensation: (a) effect of relative humidity on dew amount; (b) dew days in different relative humidity intervals; (c) effect of air temperature dew point difference on dew amount; (d) dew days in different air temperature dew point difference intervals.
Atmosphere 16 01098 g006
Figure 7. Effect of wind speed and direction on dew: (a,b) mean effect of wind direction on dew amount in the Loess hill area and the Loess gully area, respectively; (c,d) mean distribution of dew days in different wind speed ranges and different wind direction ranges, respectively.
Atmosphere 16 01098 g007
Figure 8. Effect of precipitation on dew: (a) monthly average dew amount and rainfall; (b) monthly average rainfall and dew-to-precipitation (dew and rain) ratio.
Atmosphere 16 01098 g008
Figure 9. Temperature change curves at each station on the middle day of each season: (a) A station temperature change curve; (b) B station temperature change curve.
Atmosphere 16 01098 g009
Table 1. Accuracy and installation height of observation instruments.
DeviceInstallation HeightParameter (Unit)Accuracy
Anemoscope5 m (A station)
2 m (B station)
vs, m∙s−1
vd, °
vs: ±0.45 m∙s−1
vd: ±1°
Hyetometer1.6 mRainfall, mm±0.2 mm
LWS0.2 mU, mv; DT, minU, ±1 mv; DT, ±1 min
VP-30.2 mTa °C; RH, %T, ±0.2 °C; RH, ±0.1%
Note: vs = wind speed (m/s); vd = wind direction (°); U = leaf wetness sensor output voltage (mv); DT = collection duration (min); Ta = air temperature (°C); RH = relative humidity (%).
Disclaimer/Publisher’s Note: The statements, opinions and data contained in all publications are solely those of the individual author(s) and contributor(s) and not of MDPI and/or the editor(s). MDPI and/or the editor(s) disclaim responsibility for any injury to people or property resulting from any ideas, methods, instructions or products referred to in the content.