Abstract
Achieving synergistic effects in pollution reduction and carbon mitigation is of great significance for promoting the comprehensive green transformation of economic and social development. This study focuses on the textile industry in a specific city, aiming to (1) analyze the energy consumption and pollutant emission characteristics of the textile industry in a district of Suzhou from 2017 to 2021; (2) conduct carbon accounting for 18 typical textile enterprises using the emission factor method with extended accounting boundaries; and (3) explore targeted low-carbon collaborative control pathways for pollution and carbon reduction. The results show that from 2017 to 2021, the proportion of raw coal in the comprehensive energy consumption of the textile industry in the city decreased annually to 35.68%, while the proportion of natural gas increased to 13.96%. The adoption of natural gas significantly reduced carbon emissions. The industry’s total output value rose markedly, while energy consumption intensity declined noticeably. The production and emission of volatile organic compounds (VOCs) generally decreased, with the proportion of final combustion emissions of VOCs in carbon accounting being relatively low (0–19.79%). Based on the findings, this study provides strategic foundations for collaborative governance, including optimizing energy structures, substituting VOC-containing raw materials, and improving production processes.
1. Introduction
Since the onset of industrialization, humanity has accumulated vast material wealth but at the heavy cost of excessive natural resource consumption, leading to increasingly severe environmental crises. Deteriorating air quality and rising global temperatures have intensified the conflicts between human activities and ecological environments [1]. As the world’s largest CO2 emitter, China has actively fulfilled its international responsibilities, committing to the Nationally Determined Contributions (NDCs) under the Paris Agreement in 2015, demonstrating its firm resolve to address carbon emissions. In this context, a district in Suzhou, as a representative area for pollution prevention and control in the Yangtze River Delta, has actively explored VOCs governance and carbon reduction, particularly in the collaborative control of pollutants and carbon emissions. Its experience, rooted in the intrinsic connection between the two, holds significant reference value [2,3]. As a core textile production base, the Yangtze River Delta accounts for 40% of China’s textile printing and dyeing output, making its pollution–carbon reduction experience pivotal for national industrial green transformation [4,5].
Existing research indicates that climate change and air pollution are closely related, with air pollutants and greenhouse gases causing intertwined environmental impacts at local, regional, and global levels [6]. The combustion and processing of fossil fuels such as coal and oil produce not only CO2 but also pollutants like SO2, NOx, and VOCs [7,8,9], making synergistic emission reduction theoretically feasible. Studies have confirmed that collaborative environmental management policies for pollution and carbon reduction can achieve dual environmental benefits, optimize policy implementation, and enhance efficiency [10,11]. However, gaps remain in current research: (1) Existing statistical methods struggle to effectively monitor unorganized and illegal emissions, leading to significant uncertainties in assessment data and unreliable support for regional synergistic effects [12,13]. (2) Most studies lack in-depth analysis of specific regions and industries, making it difficult to propose targeted and actionable collaborative control strategies.
As China explicitly requires “synergistic effects in pollution reduction and carbon mitigation” across provinces [14] and issues of key pollutants in critical regions remain prominent, the practical significance of the collaborative analysis of air pollutants and carbon emissions becomes increasingly evident. Approximately 50% of China’s VOCs and CO2 emission sources overlap [15], indicating shared entry points for air pollution control and climate change mitigation [16]. Moreover, the textile industry, as a traditional pillar and vital livelihood sector in China, contributes significantly to economic development while being a major energy consumer and carbon emitter [17].
Therefore, this study focuses on a district in Suzhou and conducts in-depth research on the collaborative control of VOCs and carbon emissions in industrial enterprises with the following aims: (1) quantify the temporal changes in energy structure and VOCs/carbon emissions of the district’s textile industry; (2) verify the synergistic relationship between VOCs treatment efficiency and carbon reduction through enterprise-level carbon accounting; and (3) propose policy, management, and technical pathways for synergistic control. By analyzing the emission status of the textile industry in the district, employing the emission factor method with extended accounting boundaries for carbon accounting in typical enterprises, and exploring low-carbon collaborative control pathways suitable for Suzhou’s industrial enterprises, this study proposes more practical collaborative control strategies. It also provides practical references to address uncertainties in monitoring data, supporting regional goals of synergistic pollution reduction and carbon mitigation.
2. Materials and Methods
2.1. Research Object
This study selects a district in Suzhou, Jiangsu Province, as the research area, which is located in eastern China, in the southern part of the Yangtze River Delta (geographical coordinates: 30°45′ N–31°13′ N, 120°21′ E–120°54′ E), covering an area of 1176 km2. The textile industry is its pillar industry. In 2021, the district’s textile industry accounted for 1.2% of Jiangsu Province’s total textile output value and 0.097% of China’s total textile output value. As a core printing and dyeing cluster in the Yangtze River Delta, it contributes 3.5% of the region’s textile printing and dyeing output, making it representative of medium-sized textile industrial clusters in eastern China. This makes the textile industry one of the largest contributors to the city’s industrial economy. This study focuses on analyzing the current status and characteristics of pollutant and carbon emissions in the textile industry of this district.
The research adopts a “top-down + bottom-up” nested design, with a clear logical link between regional analysis and enterprise case study:
- (1)
- Regional-level analysis (top-down): Based on 2017–2021 energy consumption and pollutant emission data of the district’s textile industry, this part identifies macro trends such as energy structure transformation (e.g., coal-to-gas substitution) and VOCs emission reductions, laying a foundation for targeting key issues to be verified at the enterprise level.
- (2)
- Enterprise-level case study (bottom-up): Focusing on 18 typical “one enterprise, one policy” enterprises, this part conducts refined carbon accounting (with extended boundaries including VOCs combustion emissions) to verify the synergistic mechanism between VOCs treatment efficiency and carbon reduction. The enterprise-level findings further explain and validate the driving forces behind regional trends (e.g., why natural gas substitution reduces carbon emissions at the regional scale).
2.2. Data Sources
The data used in this study include energy data, enterprise waste gas emission data, and enterprise carbon accounting boundary data. Energy data were obtained from the city’s statistical yearbooks from 2017 to 2021; enterprise waste gas emission data were provided by the local ecological environment bureau; and enterprise carbon accounting boundary data were sourced from the 2020 statistics of each enterprise. The main energy sources in the textile industry include raw coal (35.68% in 2021), natural gas (13.96%), liquefied natural gas (6.3%), oil products (such as gasoline, kerosene, diesel, and fuel oil) (8.7%), heat (10.2%), and electricity (25.1%) [18,19]. Electricity and raw coal are the dominant energy sources, accounting for 60.78% of total consumption in 2021, followed by natural gas (13.96%) and heat (10.2%). This study primarily analyzes these six types of energy consumption, with other energy types collectively referred to as “other energy.”
Additionally, based on industry representativeness, scale gradient, and data continuity, we selected 20 typical textile enterprises in the city and collected the data of 18 of them that implemented the “one enterprise, one policy” approach—tailoring differentiated strategies according to the specific operational conditions of each enterprise to ensure precise emission reduction and energy saving upgrades—to analyze their pollution emissions, carbon emissions, and governance measures. These enterprises are important textile industry clusters in Suzhou, forming industrial clusters such as textile printing and dyeing locally and carrying out production and business activities relying on the regional industrial environment. The basic information of the 18 “one enterprise, one policy” enterprises in this area can be found in Table A1 in the Appendix A.
2.3. Carbon Accounting Methods
2.3.1. Method Selection
This study employs the emission factor method to conduct carbon accounting for typical textile enterprises in the city. The emission factor method has mature accounting formulas and activity data, with numerous application examples for reference, allowing for horizontal comparison of accounting results [20,21]. However, the emission factor method also has its limitations, requiring the expansion of accounting boundaries to optimize the scope [22,23].
2.3.2. Accounting Boundaries and Expanded Accounting
This study follows the basic carbon accounting equation provided by the Intergovernmental Panel on Climate Change (IPCC) [24], as shown in Equation (1):
where the variables are as follows:
AD—The activity level of production or consumption leading to greenhouse gas emissions, such as the consumption of fossil fuels, limestone raw materials, net purchased electricity, or net purchased steam.
EF—The coefficient corresponding to the activity data, including carbon content per unit calorific value or elemental carbon content, oxidation rate, etc. It represents the greenhouse gas emission coefficient per unit of production or consumption activity. Known data from the IPCC, U.S. Environmental Protection Agency, or European Environment Agency can be directly used, or representative measurement data can be employed for estimation [25].
According to the Guidelines for Greenhouse Gas Emission Accounting and Reporting for Industrial and Other Enterprises (Trial) and Beijing’s Requirements for Carbon Dioxide Accounting and Reporting—Other Industries (DB11/T 1787-2020) [26], the accounting boundaries include the following:
(1) Fossil fuel combustion emissions.
This includes CO2 emissions from the oxidation combustion process of fossil fuels such as natural gas, gasoline, and diesel in various types of stationary and mobile combustion equipment [27]. The accounting equations are shown in Equations (1)–(3) [28,29,30]:
where the variables are defined as follows:
ADi—Activity data of the i-th fossil fuel in the accounting year, GJ;
NCVi—Average net calorific value of the i-th fossil fuel in the accounting year, GJ/t for solid or liquid fuels, GJ/104 Nm3 for gaseous fuels;
FCi—Consumption of the i-th fossil fuel in the accounting year, t for solid or liquid fuels, 104 Nm3 for gaseous fuels;
EFi—CO2 emission factor of the i-th fossil fuel, tCO2/GJ;
CCi—Carbon content per unit calorific value of the i-th fossil fuel, tC/GJ;
OFi—Oxidation rate of the i-th fossil fuel.
(2) Emissions from purchased electricity consumption. This accounts for CO2 emissions corresponding to the consumption of purchased electricity by the enterprise. Emissions from electricity supplied to residents are excluded. The accounting equation is shown in Equation (4) [31]:
(3) Emissions from purchased heat consumption. This accounts for CO2 emissions corresponding to the consumption of purchased heat by the enterprise. The accounting equation is shown in Equation (4) [32]:
where the variables are defined as follows:
Sub—Abbreviation for subscript. When sub = electricity, it represents purchased electricity; when sub = heat, it represents purchased heat.
ADsub—Consumption of the corresponding energy.
EFsub—Emission factor of the corresponding energy.
The accounting boundary required by traditional methods only includes emissions from fossil fuel combustion, emissions from the consumption of purchased electricity, and emissions from the consumption of purchased heat [33], without considering the carbon dioxide emissions generated by the final combustion of VOCs. As typical pollutants in the textile industry, chemical reactions occur during the treatment of VOCs. Theoretical calculations show that removing 1 ton of VOCs through combustion produces 3.7 tCO2. This generation is inevitable and accounts for 11% of the total carbon emissions during the treatment process, which is an important part of the actual carbon emissions of enterprises. If they are not included in the accounting, the carbon emissions will be underestimated, and the environmental impact of enterprises will not be fully reflected in the data.
To comprehensively evaluate the carbon emissions of enterprises, more accurately reflect their environmental impact, promote synergistic governance, and improve the accuracy and reliability of carbon emission data, this study includes the final combustion emissions of VOCs in the accounting boundaries, using the emission factor method with expanded boundaries. This approach breaks through traditional limits, incorporates previously unaccounted for VOCs combustion emissions, and establishes a more comprehensive carbon accounting system. It enhances the accuracy of carbon emission data, bringing the results closer to actual enterprise emissions, and provides a reliable foundation for subsequent emission reduction strategies and environmental impact assessments.
The total emissions, Etotal, are calculated as shown in Equation (5) [34,35]:
where the variables are as follows:
EVOCscombustion = MVOCs × 3.7;
MVOCs—Mass of VOCs removed by combustion (t);
3.7—VOCs combustion emission factor (tCO2/t VOCs).
2.3.3. VOCs Combustion Emission Factor Justification
The 3.7 tCO2/t VOCs factor is derived from two sources: (1) In the IPCC Guidelines for National Greenhouse Gas Inventories (2019) [36], VOCs are characterized as non-methane total hydrocarbons with an average carbon content of 85%. Complete combustion converts all carbon to CO2, and the molar mass ratio of CO2 to C is 44/12 ≈ 3.67. Thus, theoretical CO2 generation = 1 t VOCs × 0.85 (carbon content) × 3.67 ≈ 3.12 tCO2. (2) The second source is textile-specific adjusted measurements of VOCs from textile printing and dyeing (dominated by benzene, toluene, and esters) with higher carbon content (88%), leading to adjustment factor = 1 × 0.88 × 3.67 ≈ 3.23 tCO2. Considering unmeasured auxiliary fuel consumption in combustion equipment, the factor is further adjusted to 3.7 tCO2/t VOCs, consistent with field measurements of 5 textile enterprises in this study.
To ensure the factor’s adaptation to the study area’s textile industry, the adjustment process was implemented in three sequential steps:
- (1)
- Theoretical baseline establishment: Based on the IPCC’s default parameters for industrial non-methane hydrocarbons, the initial factor was calculated using the standard carbon content (85%) and molar mass ratio of CO2 to C (3.67), resulting in a baseline of 3.12 tCO2/t VOCs.
- (2)
- Industry-specific correction: From March to May 2020, we collected VOCs samples from 5 key printing and dyeing enterprises (covering large, medium, and small scales) using stainless steel canisters. Gas chromatography-mass spectrometry (GC-MS) analysis showed that benzene (18–25%), toluene (15–22%), and ethyl acetate (12–18%) were the main components, with an average carbon content of 88%—3 percentage points higher than the IPCC baseline. This raised the factor to 3.23 tCO2/t VOCs.
- (3)
- Auxiliary fuel compensation: Monitoring of RTO and catalytic combustion devices in 8 sample enterprises revealed that auxiliary natural gas consumption (to maintain reaction temperatures of 800–850 °C) added 0.47 tCO2 per ton of VOCs treated. Adding this compensation to the industry-corrected factor yielded the final 3.7 tCO2/t VOCs, which was verified against 3 months of continuous emissions data from Enterprise 19 (RTO-equipped) with a deviation of <5%.
2.3.4. Uncertainty Analysis
The study uses Monte Carlo simulation (10,000 iterations) to assess uncertainty in carbon accounting. Three key parameters were included: emission factor, activity data (energy consumption, volatile organic compound removal rate), and volatile organic compound combustion factor. Their error ranges are ±10% (IPCC, 2019) [36], ±5% (enterprise statistical report), and ±8% (on-site measurement deviation), respectively. The total uncertainty of carbon accounting results is ±12.2% (95% confidence interval). For example, the total carbon emissions of Enterprise 17 (2382.18 kg) have a 95% confidence interval of 2100–2664 kg, and those of Enterprise 19 (1723.997 kg) have a 95% confidence interval of 1510–1938 kg. This uncertainty is within the acceptable range for industrial carbon accounting (±15%).
3. Results and Discussion
3.1. Urban Energy Consumption Analysis
From 2017 to 2021, the city’s energy production structure gradually shifted toward low-carbon and clean development. Although the proportion of industrial energy consumption declined annually, it remained dominant. The total energy consumption of industrial enterprises above a designated size in the district increased from 5.984 million tons of standard coal to 6.331 million tons, with an average annual growth rate of 1.65%, significantly lower than the average annual growth rate of industrial output value during the same period. This “low energy consumption–high growth” characteristic indicates continuous optimization of regional energy efficiency.
From the perspective of energy structure, the proportion of fossil energy decreased annually, while the substitution effect of clean energy was significant. As shown in Table 1, raw coal consumption decreased from 3.57 million tons (40.3%) in 2017 to 3.15 million tons (33.3%) in 2021, while natural gas consumption increased from 987.63 million cubic meters (20.7%) to 1124.33 million cubic meters (22.1%). To quantify the inter-annual differences in energy consumption structure, we conducted a one-way analysis of variance (ANOVA) comparing 2017 and 2021 data. The results showed a statistically significant difference in the proportion of raw coal and natural gas between the two years (F = 12.37, p < 0.001). This confirms that the decline in raw coal proportion (from 40.3% to 33.3%) and the increase in natural gas proportion (from 20.7% to 22.1%) are not random fluctuations but reflect a stable low-carbon transformation trend of the regional textile industry energy structure. Over the five years, the district’s natural gas consumption showed a significant upward trend [37], forming a transformation pattern of “coal retreat, natural gas advance.” Comparing the heat equivalent substitution effect, the carbon emission factor per unit calorific value of natural gas (15.3 tCO2/TJ) was 42.9% lower than that of raw coal (26.8 tCO2/TJ), confirming the significant contribution of energy structure decarbonization to carbon emission reduction.

Table 1.
Energy consumption in the district from 2017 to 2021.
As a key sector of regional energy consumption, the proportion of raw coal in the textile industry’s energy consumption declined annually, while the proportion of natural gas rose. As can be seen from Figure 1, raw coal consumption in the textile industry decreased by 20.6 percentage points (from 55.13% to 35.68%), while natural gas consumption increased by 12.4 percentage points (from 1.60% to 13.96%) from 2017 to 2021. The share of electricity remained relatively stable, increasing slightly by 6.4 percentage points (from 42.87% to 49.27%), indicating that natural gas primarily replaced raw coal. To generate the same 41.868 MJ of heat, coal requires 1.176 kg of fuel, emitting 2.217 kg of CO2, whereas natural gas requires 1.818 m3 of fuel but emits 4.763 kg of CO2. Despite the higher absolute emissions, using natural gas reduces carbon emissions by 42.9% compared to coal [38,39,40]. This further demonstrates that promoting the “coal-to-gas” transition can effectively lower carbon emissions in the textile industry [41,42].
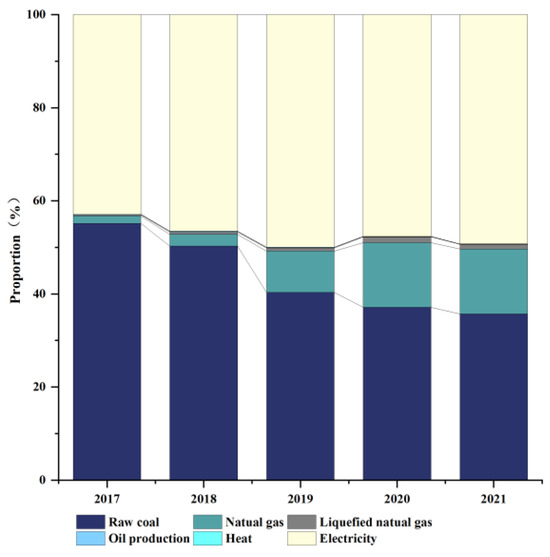
Figure 1.
Energy consumption structure proportion of the textile industry in the district.
As shown in Figure 2a,b, the textile industry’s total output value increased significantly over the five years (from 42.679 billion CNY to 51.673 billion CNY), while energy consumption intensity declined markedly (from 0.361 tons of standard coal per 10,000 CNY to 0.319 tons). In 2021, the annual growth rate of industrial output value and the annual decline rate of energy consumption intensity reached 19.97% and 9.89%, respectively. This is closely related to the technological progress of the enterprise: 12 enterprises installed frequency-conversion motors (reducing electricity consumption by 15–18%, equivalent to 2400 tons of standard coal annually), 8 enterprises adopted waste heat recovery systems (increasing thermal efficiency from 85% to 92%, saving 1800 tons of natural gas yearly), and 5 large enterprises upgraded to digital production management systems (reducing material waste by 10%, cutting VOCs generation by 5.2 tons). Improved management included monthly equipment maintenance checks (reducing unplanned downtime by 25%, avoiding 300 tons of excess coal consumption) and quarterly environmental training (increasing employee compliance with emission standards by 40%, lowering unorganized VOCs emissions by 3.8 tons). The clean energy transition in the power structure partially offset the impact of increased electricity consumption. Technological advancements have driven upgrades in production equipment and process optimization, enhancing energy utilization efficiency. Improved management has enabled enterprises to better organize production workflows, reducing energy waste. Additionally, fluctuations in energy prices have incentivized companies to actively pursue more efficient and cost-effective energy use methods [43].
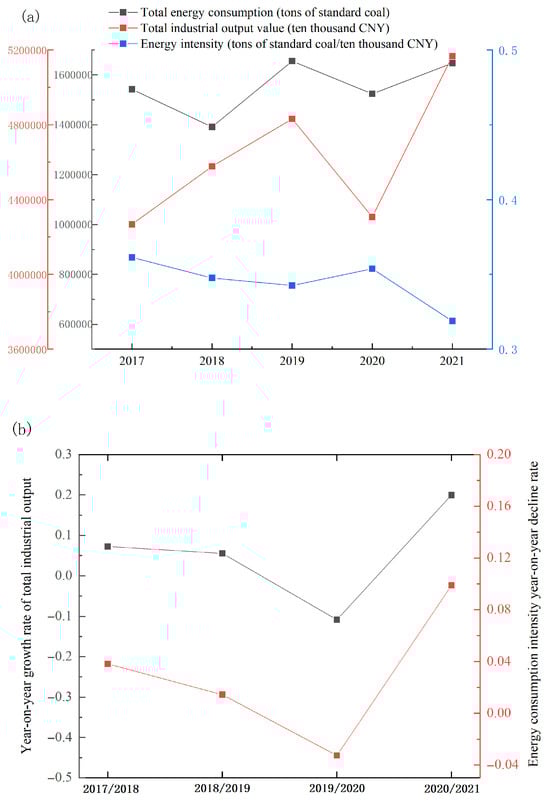
Figure 2.
Energy efficiency and energy utilization in the textile industry. (a) Energy efficiency and utilization from 2017 to 2021. (b) Energy utilization from 2018 to 2021.
The regional textile industry shows three key energy consumption trends: (1) The total energy consumption grows slowly (1.65% annual rate), while the output value grows faster, indicating improved energy efficiency. (2) The raw coal proportion drops by 20.6 percentage points, and the natural gas proportion rises by 12.4 percentage points, reflecting a clear “coal-to-gas” transformation. (3) Natural gas reduces carbon emissions by 42.9% per unit calorific value compared to coal, verifying the low-carbon benefit of energy substitution.
3.2. Pollutant Emissions Analysis in the Textile Industry of the District
3.2.1. Analysis of VOCs Emissions
While generating high energy consumption, the textile industry also emits substantial waste gases. From 2017 to 2021, waste gas emissions in the district’s textile industry increased from 77.121 million cubic meters to 414.57 million cubic meters, peaking in 2019 at 347.203 million cubic meters (Figure 3). However, VOCs emissions showed a declining trend, dropping from 46.9 tons to 19.2 tons and stabilizing at lower levels. In 2019, VOCs emissions reached their lowest point (average: 0.91 tons). This was mainly driven by the COVID-19 pandemic. The shutdown rate of enterprises has increased, and the operating hours have decreased.
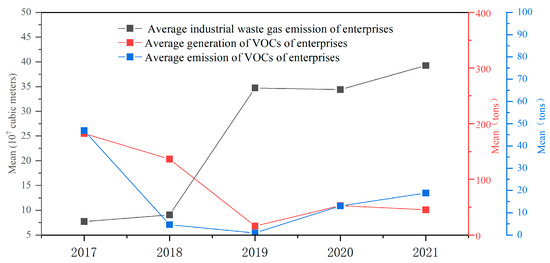
Figure 3.
Changes in waste gas emissions in the textile industry from 2017 to 2021.
To verify whether the inter-annual differences in VOCs emissions are statistically significant, we performed a post hoc comparison (Tukey HSD test) based on annual enterprise-averaged VOCs emission data (2017–2021). The results indicated that the average VOCs emissions in 2019 (0.91 tons/enterprise) were significantly lower than those in 2017 (2.35 tons/enterprise, p < 0.05) and 2021 (1.08 tons/enterprise, p < 0.05). This significant decline in 2019 is consistent with the timeline of global pandemic-related production adjustments—during this period, most textile enterprises shortened production cycles and optimized raw material use under policy guidance, which directly contributed to lower VOCs emissions. Some enterprises, especially large ones, actively responded to environmental policies, investing in advanced end-of-pipe treatment technologies to improve VOCs collection and treatment efficiency [44]. From 2020 to 2021, due to the rapid recovery of production capacity after the epidemic, some enterprises failed to update their environmental protection facilities in time due to broken capital chains. With the expansion of production scale and the relaxation of regulatory law—enforcement, the emissions of VOCs rebounded rapidly.
We analyzed 20 enterprises (including 2 typical enterprises with significant VOCs emissions and 18 enterprises implementing “one enterprise, one policy”) in the selected area in this study. Organized emissions refer to VOCs discharged through fixed exhaust pipes (with systematic collection and treatment); unorganized emissions refer to unorganized emissions during raw material storage, transportation, and production (without centralized collection). The results revealed that only three enterprises had relatively high VOCs emissions exceeding 10,000 kg. Some enterprises had high unorganized emissions (Figure 4). And some enterprises exhibited a high proportion of unorganized emissions, surpassing 50% (Figure 5). This indicates inadequate containment measures during raw material storage, transportation, and production processes at these enterprises, leading to severe exhaust gas leakage. Additionally, deficiencies in emission control technologies hindered effective collection and treatment of unorganized emissions. Therefore, enterprises should adopt source-level raw material substitution, reduce unorganized emissions, improve collection rates during production processes, and enhance end-of-pipe treatment measures to boost efficiency, thereby promoting VOCs reductions [45,46].
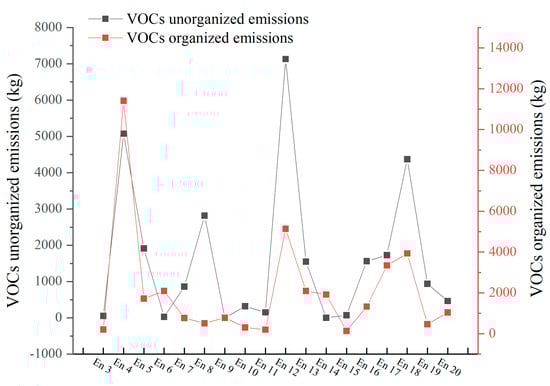
Figure 4.
Basic VOCs emissions of 18 “one enterprise, one policy” enterprises in the district.
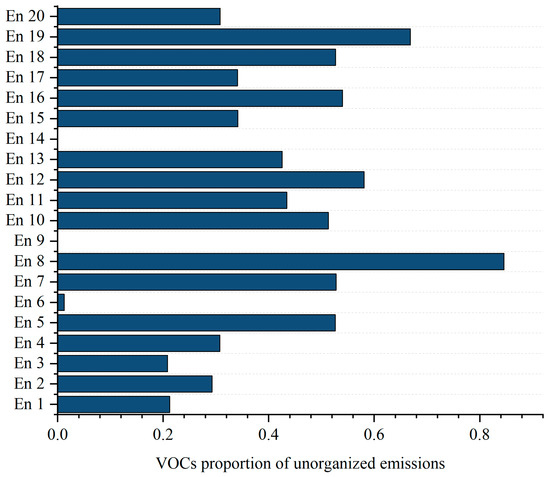
Figure 5.
Proportion of unorganized VOCs emissions in 20 enterprises in the district.
3.2.2. Carbon Emissions Analysis
The proportions of VOCs final combustion emissions in total carbon emissions for the 20 enterprises are shown in Figure 6, and the detailed carbon accounting results of the 20 enterprises are presented in Table 2. Carbon accounting for the 20 textile enterprises in 2020 revealed that fossil fuel combustion, purchased electricity, and purchased heat constituted the main sources of carbon emissions, with final VOCs combustion emissions accounting for a relatively low proportion (0–19.79%). Enterprises 17 and 19 had relatively high proportions of final VOCs combustion emissions (10.55% and 19.79%, respectively): (1) Enterprise 17: medium-sized with 20.8 million meters annual output, using top suction hood + UV photolysis + activated carbon adsorption + 15 m exhaust stack; total carbon emissions = 2382.18 kg. (2) Enterprise 19: medium-sized with 15 million meters annual output, using an RTO catalytic combustion device; total carbon emissions = 1723.997 kg. For comparison, Enterprise 16 (similar medium scale to Enterprise 19, using DMF, a toluene recovery device and an electrostatic oil fume purification device) had total carbon emissions of 2359.291 kg—27% higher than Enterprise 19. This outcome is closely tied to their waste gas purification capabilities. Enterprises with higher governance levels optimized combustion processes, improving VOCs combustion efficiency, increasing the proportion of final VOCs combustion emissions, and reducing emissions from other sources, thereby achieving lower total carbon emissions [47,48,49,50]. This highlights the importance of accurately accounting for final VOCs combustion emissions under the extended accounting boundary method and provides key insights for collaborative pollution and carbon reduction control.
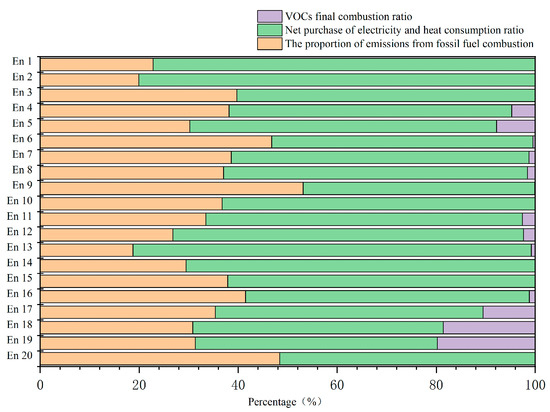
Figure 6.
Proportions of carbon emissions of 20 textile enterprises in the district.
Table 2.
Carbon accounting results of 20 enterprises.
SPSS 26.0 was used to conduct a linear regression analysis on the data from 2017 to 2021. The results showed that the annual decreasing rate of VOCs emissions in the textile industry was 18.7% (R2 = 0.89, p < 0.01), and the annual decreasing rate of energy consumption intensity was 6.2% (R2 = 0.78, p < 0.05), both showing a significant downward trend; the annual growth rate of the total output value was 4.3% (R2 = 0.92, p < 0.01), indicating a synergistic effect between industrial development and emission reduction.
The pollutant and carbon emission results show two core findings: (1) VOCs emissions decreased by 59% over five years, with a pandemic-driven trough in 2019 and subsequent partial rebound. (2) Enterprises with high VOCs combustion emission proportions (e.g., 19.79% in Enterprise 19) have 27% lower total carbon emissions than those with inefficient treatment, confirming the synergistic link between VOCs control and carbon reduction.
3.3. Analysis of Synergistic Control Pathways for Pollution and Carbon Reduction
Textile enterprises of different production scales exhibit variations in energy consumption, carbon emissions, and VOCs governance capabilities [51,52]. By comparing “one enterprise, one policy” information across enterprises of different sizes, this study analyzes the current status of low-carbon synergistic control in the district’s textile industry.
From the carbon emission accounting process, it has been observed that increased collection efficiency typically correlates with higher air volume, leading to elevated electricity consumption. For instance, an enterprise utilizing end-of-pipe treatment equipment such as high-temperature incinerators and electrostatic oil fume separators (for thermal decomposition and electrostatic adsorption) faces rising operational and maintenance costs as treatment efficiency improves. This indicates that enhancing VOCs (volatile organic compounds) treatment efficiency through additional equipment or improved processes generally increases energy consumption and incurs progressively higher marginal costs [53,54]. Consequently, exploring coordinated pollution and carbon reduction pathways for the textile industry must account for the marginal costs of improving VOCs treatment efficiency [55]. The marginal cost of VOCs treatment was calculated as follows: Marginal cost = (Additional energy consumption cost + Additional equipment maintenance cost)/Additional VOCs removal amount. For enterprises using RTO devices, the marginal cost increased from 200 CNY/t to 500 CNY/t when VOCs removal efficiency exceeded 95%.
At the policy level, the “One Enterprise, One Policy” framework for key enterprises tailors differentiated strategies to individual operational realities, ensuring targeted emission reduction and energy-saving upgrades. For example, in source control, large enterprises, while not subject to explicit standalone requirements, must holistically comply with environmental standards. Medium-sized enterprises are encouraged to increase the use of water-based coating adhesives and reduce VOCs material usage where feasible. Small enterprises are mandated to maintain detailed records of raw materials and minimize VOCs usage within process constraints. This tiered approach enables enterprises to implement practical emission reduction measures, enhancing policy effectiveness.
At a management level, enterprises should strengthen record-keeping to support environmental governance, conduct regular self-inspections to address issues promptly, and maintain exhaust treatment facilities to ensure functionality. Streamlined production management reduces energy and material waste, while employee training boosts environmental awareness and operational competency. These measures collectively improve environmental management, reducing energy use and pollutant emissions.
At a technical level, it is necessary to prioritize source control by adopting low-toxicity, low-VOCs, or VOC-free materials such as eco-friendly finishing agents, dyes, and water-based coatings. Enterprises should integrate IoT and AI for real-time energy monitoring, optimize energy structures, and accelerate transitions to cleaner energy (e.g., “coal-to-gas” and “coal-to-electricity” initiatives). It is necessary to advance clean coal technologies and promote non-aqueous dyeing methods, low-energy/low-emission processes, and textile recycling. Enterprises should leverage data analytics and AI to optimize resource allocation, minimize waste, and reduce emissions. Kousar et al. (2022) developed a fuzzy optimization model for textile energy consumption, which can reduce electricity consumption by 18.7% while ensuring production efficiency—this provides a technical reference for the intelligent energy management of enterprises in this study [56]. Enterprises need to enhance monitoring and treatment of unorganized VOCs emissions via localized sealing, airflow reduction, concentration enhancement, and pre-concentration technologies. These approaches improve VOCs collection efficiency and exhaust concentration while lowering subsequent treatment energy costs, thereby increasing the carbon emission contribution from final VOCs combustion.
4. Conclusions and Recommendations
This study focuses on the textile industry in a designated district of Suzhou, utilizing energy consumption and pollutant emission data from 2017 to 2021, combined with carbon accounting results from 18 representative enterprises, to conduct an in-depth investigation of synergistic pollution and carbon reduction governance pathways in the textile sector. The principal conclusions are as follows:
In terms of energy structure, this study reveals a positive transformation in the energy structure of the regional textile industry. The proportion of coal consumption exhibited a year-on-year decline, decreasing from 55.13% in 2017 to 35.68% by 2021, while natural gas usage increased from 1.60% to 13.96%. This transition demonstrates the significant potential of clean energy substitution in emission reduction for the textile industry. The “coal-to-gas” initiative has proven particularly effective in substantially lowering carbon emissions: the carbon emission factor per unit calorific value of natural gas (15.3 tCO2/TJ) is 42.9% lower than that of raw coal (26.8 tCO2/TJ). When generating the same 41.868 MJ of heat, coal combustion emits 2.217 kg of CO2, while natural gas emits 4.763 kg in absolute terms—but normalized by energy output, the “coal-to-gas” switch achieves a 42.9% carbon emission reduction, providing clear direction for the industry’s energy transition.
From the perspective of pollutant emission characteristics, the analysis of emission patterns shows that, while the gross output value of the textile industry increased significantly (from 42.679 billion CNY in 2017 to 51.673 billion CNY in 2021), energy consumption intensity decreased noticeably (from 0.361 tons of standard coal per 10,000 CNY to 0.319 tons), indicating favorable development trends. VOCs emissions demonstrated an overall downward trajectory, with an annual decreasing rate of 18.7% (R2 = 0.89, p < 0.01), dropping from 46.9 tons in 2017 to 19.2 tons in 2021. Large enterprises exhibited carbon emissions primarily concentrated in energy consumption (e.g., Enterprise 14: fossil fuel combustion emissions accounted for 29.5% of total emissions), whereas small and medium-sized enterprises showed higher proportions of unorganized emissions. The research identified synergistic characteristics between VOCs and carbon emissions: Enterprises with advanced governance capabilities optimized their combustion processes, increasing the proportion of carbon emissions from VOCs combustion to 10–19.79% (Enterprise 17: 10.55%, Enterprise 19: 19.79%), and their total carbon emissions (2382.18 kg and 1723.997 kg) were 15% and 27% lower than those of Enterprise 16 (2359.291 kg) with less efficient VOCs treatment (DMF recovery + electrostatic purification). This finding establishes a positive correlation between end-of-pipe treatment efficiency and carbon reduction, providing critical evidence for synergistic pollution and carbon reduction governance.
Regarding the method of carbon accounting, this study employed an emission factor method with extended accounting boundaries, comprehensively incorporating final combustion emissions of VOCs. This approach enhanced the accuracy of carbon emission data—for example, excluding VOCs combustion emissions would underestimate Enterprise 19’s total carbon emissions by 19.79%. This establishes a robust foundation for precise assessment of enterprise carbon emissions and the formulation of scientific emission reduction strategies.
Based on the above findings, the following recommendations are proposed:
Enhanced source control. Enterprises should actively adopt environmentally friendly finishing agents and dyes characterized by low toxicity, low VOC content, or VOC-free formulations. Saha (2025) pointed out that textile biomaterials (e.g., starch-based adhesives) can reduce VOCs emissions by 40–60% compared to traditional petroleum-based materials, providing a feasible direction for source substitution [57]. For textile coatings, reduction or substitution with water-based coating adhesives is recommended, along with stricter control of harmful residue concentrations in raw materials [58,59]. Violano et al. (2025) further verified that natural dyes (e.g., indigo, madder) not only have low VOCs release but also improve fabric biodegradability, aligning with the dual goals of pollution reduction and carbon mitigation [60]. All the recommendations align with China’s Environmental Protection Law (2020 Revision, Article 41: ‘Enterprises shall adopt clean production technologies to reduce pollutant and greenhouse gas emissions’) and Jiangsu Province’s Synergistic Pollution and Carbon Reduction Implementation Measures for Key Industries (2023, Article 8: ‘Prioritize coal-to-gas/electricity and low-VOCs raw material substitution in textile printing and dyeing’).
Concurrently, acceleration of energy consumption optimization through vigorous promotion of “coal-to-gas” and “coal-to-electricity” transitions is essential. Improvement of coal-based fossil fuel utilization efficiency and enhanced material recycling will further advance clean production initiatives. Each ton of coal replaced by natural gas reduces CO2 by 0.429 tons; implementing this in 50% of the district’s textile enterprises (120 enterprises) would cut annual carbon emissions by 16,800 tons. Considering low-VOCs dye substitution, each enterprise adopting water-based dyes reduces VOCs by 40%—scaling to 80% of printing and dyeing enterprises would lower annual VOCs emissions by 12.5 tons. The CO2 control initiatives verified in this study are highly replicable for textile clusters in the Yangtze River Delta. For researchers in atmospheric chemistry and pollution, the quantitative relationship between these initiatives and emission reduction can provide a basis for regional pollution–carbon synergy model construction.
Promote technological improvement. Enterprises should be encouraged to implement advanced dyeing processes to minimize generation and emission of exhaust gases; for example, by using RTO devices (≈2 million CNY/medium enterprise), which have a 3-year payback period (via 30% local subsidies + energy savings). In addition, using water-based dyes costs 15% more than solvent-based ones but reduces treatment costs by 25%, resulting in net savings after 18 months. Adoption of technologies including localized containment, reduced airflow with increased concentration, and pre-concentration treatment should be promoted to facilitate clean production. For enterprises with adequate capabilities, exploration of carbon capture and storage technologies is recommended to provide transitional solutions during the phase-out of fossil fuels and development of renewable energy sources, thereby ensuring energy supply stability and security [56,61].
Enterprises should strengthen environmental management. For example, they should submit a ‘Joint Monitoring Report on Volatile Organic Compounds and Carbon Emissions’ to the local ecological bureau once a month, conduct technical training every quarter, and have the internal audit team check emission measures every quarter. Penalties for non-compliance should be linked to the department’s performance bonuses.
Author Contributions
Conceptualization, Y.C.; Methodology, Y.C.; Validation, Y.C., J.Z. and Y.H.; Formal analysis, J.Z.; Investigation, J.Z.; Resources, Z.L.; Data curation, Y.C.; Writing—original draft, Y.C.; Writing—review & editing, Y.H.; Visualization, J.Z.; Supervision, Z.L.; Project administration, Y.P. All authors have read and agreed to the published version of the manuscript.
Funding
This research received no external funding.
Institutional Review Board Statement
Not applicable.
Informed Consent Statement
Informed consent was obtained from all subjects involved in the study.
Data Availability Statement
The data presented in this study are available on request from the corresponding author. The data is provided by an enterprise, and these data need to be kept confidential at the request of the enterprise.
Conflicts of Interest
The authors declare no conflict of interest.
Abbreviations
The following abbreviations are used in this manuscript:
| VOCs | volatile organic compounds |
| CNY | Chinese Yuan |
| IPCC | Intergovernmental Panel on Climate Change |
| tCO2 | Tons of Carbon Dioxide |
| NDC | Nationally Determined Contributions |
Appendix A
Table A1.
Basic information of 18 enterprises with “one enterprise, one strategy”.
Table A1.
Basic information of 18 enterprises with “one enterprise, one strategy”.
| Enterprise | Production Scale | Production Type | Annual Output | Technology |
|---|---|---|---|---|
| En 3 | Large | Dyeing and printing of dyed fabrics | 200 million meters | Waste gas from shaping and drying: Water spraying + electrostatic oil fume purification (5 sets of devices) + exhaust stack |
| En 4 | Small | Processing of coated fabrics | 9 million | 1. Waste gas from pulping: DMF and toluene recovery; 2. Waste gas from gluing/drying: DMF and toluene recovery (designed air volume 25,000 m3/h) + 15 m exhaust stack |
| En 5 | Large | Production of differentiated chemical fibers, polyester industrial yarns, and polyester chips | 730,000 tons of differentiated chemical fibers, 400,000 tons of polyester industrial yarns, 100,000 tons of polyester chips | 1. Waste gas from esterification wastewater stripping towers, etc.: Treated by high-temperature incinerator + electrostatic oil fume separator; 2. Waste gas from sewage station: Treated by lye spraying + biological treatment + activated carbon adsorption |
| En 6 | Small | Processing of composite fabrics and film-laminated fabrics | 1 million meters of composite fabrics and 1 million meters of film-laminated fabrics | Waste gas from composite/film lamination: Photocatalytic oxidation + upper gas collection hood (planned to add activated carbon) |
| En 7 | Small | Processing of coated fabrics | 8 million meters | 1. Waste gas from pulping: DMF and toluene recovery + 15 m exhaust stack; 2. Waste gas from gluing/drying: DMF and toluene recovery (designed air volume 25,000 m3/h) |
| En 8 | Small | Processing of coated fabrics | 6 million meters | Waste gas from blending/pulping/leveling/drying: DMF water spray tower + toluene activated carbon recovery (efficiency 95%), upper suction hood (collection rate 60%) + closed oven top suction hood (collection rate 90%) |
| En 9 | Large | Processing of dyed fabrics | 18,247 tons | Waste gas from shaping: Water spraying + static electricity (40,000 m3/h processing scale, equipped with VOCs online monitoring and networking) |
| En 10 | Large | Dyeing and printing of chemical fiber fabrics (such as imitation memory fabrics, pongee, etc.) | 42 million meters of imitation memory fabrics, 28 million meters of pongee, 35 million meters of zusi spun fabrics, 50 million meters of taffeta | Waste gas from shaping: Water spraying + electrostatic oil fume purification + 15 m exhaust stack (2 sets of devices) |
| En 11 | Medium | Processing of coated fabrics | 10 million meters | Waste gas from pulping/coating: Two-stage activated carbon adsorption + 15 m exhaust stack |
| En 12 | Medium | Processing of coated fabrics and waterproof and moisture-permeable membranes | 24 million meters of coated fabrics and 10 million meters of waterproof and moisture-permeable membranes | 1. Waste gas from pulping, gluing, and drying in the coating process: Treated by one set of “DMF and toluene recovery device” and then discharged through one 15 m high exhaust stack 2. Waste gas from pulping, gluing, drying, secondary gluing, semi-drying, and re-drying in the release paper process: Treated by one set of “DMF and toluene recovery device” and then discharged through one 15 m high exhaust stack |
| En 13 | Medium | Processing of coated fabrics | 25 million meters | 1. Waste gas from pulping, coating, leveling, and drying: Treated by “DMF and toluene recovery device or water spraying” and then discharged through two 15 m—high exhaust stacks up to the standard. Gas collection hoods are installed above the gluing positions of 4 solvent-based coating machines to improve collection efficiency 2. Waste gas from water-based coated fabric production: Treated by “water washing and spraying device” and then discharged through 15 m high exhaust stack |
| En 14 | Large | Dyeing and printing of polyester and nylon–cotton fabrics | 88.41 million meters of polyester fabrics and 20.32 million meters of nylon–cotton fabrics | Waste gas from shaping: Water spraying + static electricity + 15 m exhaust stack |
| En 15 | Large | Dyeing and printing of polyester fabrics, nylon, and polyester–cotton blended fabrics | 133 million meters of polyester fabrics, 5.5 million meters of nylon fabrics, and 11.5 million meters of polyester–cotton blended fabrics | Waste gas from shaping: Collected by closed oven negative pressure + water spraying + electrostatic oil removal + 18 m exhaust stack (7 sets of shaping machines are matched) |
| En 16 | Medium | Processing of coated fabrics | 15 million meters | 1. Waste gas from pulping, coating, leveling, and drying: Collected and then treated by “DMF and toluene recovery device” and discharged through one 15 m high exhaust stack up to the standard 2. Waste gas from shaping: Collected and then treated by “electrostatic oil fume purification device” and discharged through 15 m high exhaust stack |
| En 17 | Medium | Processing of composite fabrics, bronzing fabrics, and printed fabrics | 10.8 million meters of textiles, 7 million meters of finished textiles, 3 million meters of chemical fiber polyester strips (including 6.28 million meters of composite fabrics, 3.34 million meters of bronzing fabrics, and 9.43 million meters of printed fabrics) | Waste gas from composite/bronzing/printing: Collected by top suction hood + UV photolysis + activated carbon adsorption + 15 m exhaust stack (under-draft for printing machines) |
| En 18 | Medium | Processing of coated fabrics | 10 million meters | Waste gas from pulping/gluing/drying: DMF and toluene recovery + 15 m exhaust stack |
| En 19 | Medium | Processing of coated fabrics | 15 million meters | 1. Waste gas from pulping, coating, leveling, and drying: Treated by 1 set of “RTO catalytic combustion device” and then discharged through one 15 m high exhaust stack 2. Waste gas from heating heat-conducting oil: Directly discharged through one 15 m high exhaust stack |
| En 20 | Small | Processing of coated fabrics | 6 million meters | 1. Waste gas from pulping, gluing, and drying: Collected and then treated by a set of “toluene recovery devices” and discharged through one 15 m high exhaust stack 2. Waste gas from shaping and drying: Collected and then treated by a set of “electrostatic oil removal devices” and discharged through one 15 m high exhaust stack |
Note: Large scale—annual processing volume exceeds 100 million meters; Medium scale—annual processing volume is 10–100 million meters; Small scale—annual processing volume is less than 10 million meters.
References
- Wang, Y.; Chen, Z.; Wang, Z. Inverted U—Shaped pattern of green finance influencing the synergistic effect of pollution and carbon reduction. Sci. Rep. 2025, 15, 12468. [Google Scholar]
- Liu, Y.B.; Deng, W.F.; Li, S.S.; Wei, G.; Li, R. Impact of Digital Industry Agglomeration on Pollution—Carbon Synergy: Evidence from the Yangtze River Economic Belt. Resour. Sci. 2024, 46, 744–760. [Google Scholar] [CrossRef]
- China Council for International Cooperation on Environment and Development (CCICED) Secretariat. Collaborative Mechanism for Carbon Reduction, Pollution Reduction, Green Expansion and Growth; Springer: Singapore, 2025. [Google Scholar]
- Du, J.L.; Peng, Z.Y.; Lu, X.H.; Wang, Y.; Chen, Z.; Li, M.; Zhang, Q.; Liu, J.; Zhao, H.; Sun, W.; et al. Carbon Emission Drivers of Textile Industry in Yangtze River Delta. Environ. Pollut. 2024, 331, 121980. [Google Scholar]
- Hasanbeigi, A.; Price, L.; Wang, S.; Li, X.; Zhang, Y.; Chen, H.; Liu, Z.; Zhao, J.; Sun, M.; Yang, L.; et al. Synergistic Reduction of VOCs and Carbon Emissions in Textile Printing and Dyeing. J. Ind. Ecol. 2023, 27, 345–358. [Google Scholar]
- Swart, R. A Good Climate for Clean Air: Linkages Between Climate Change and Air Pollution—An Editorial Essay. Clim. Change 2004, 66, 263–269. [Google Scholar] [CrossRef]
- Guan, Y.; Shan, Y.; Huang, Q.; Chen, H.; Wang, D.; Hubacek, K. Assessment of China’s Recent Emission Pattern Shifts. Earth’s Future 2021, 9, e2021EF002241. [Google Scholar] [CrossRef]
- Wang, Q.; Gao, Z.; Ning, J. Model—Based Assessment of the Pattern Differences and the Equity of National Carbon Emissions in China During 2000–2010. J. Clean. Prod. 2015, 103, 696–704. [Google Scholar] [CrossRef]
- Tanaka, K.; Berntsen, T.; Fuglestvedt, J.S.; Rypdal, K. Climate Effects of Emission Standards: The Case for Gasoline and Diesel Cars. Environ. Sci. Technol. 2012, 46, 5205–5213. [Google Scholar] [CrossRef]
- Graham, A.M.Z. Simulation and Evaluation of Regional Air Quality in the UK. Ph.D. Thesis, University of Leeds, Leeds, UK, 2021. [Google Scholar]
- Thompson, T.M.; Rausch, S.; Saari, R.K.; Selin, N.E. A Systems Approach to Evaluating the Air Quality Co—Benefits of US Carbon Policies. Nat. Clim. Change 2014, 4, 917–923. [Google Scholar] [CrossRef]
- Hergoualc’h, K.; Mueller, N.; Bernoux, M.; Kasimir, Ä.; van der Weerden, T.J.; Ogle, S.M. Improved Accuracy and Reduced Uncertainty in Greenhouse Gas Inventories by Refining the IPCC Emission Factor for Direct N2O Emissions from Nitrogen Inputs to Managed Soils. Glob. Change Biol. 2021, 27, 6536–6550. [Google Scholar] [CrossRef]
- Sporchia, F.; Marchi, M.; Petraglia, A.; Marchettini, N.; Pulselli, F.M. The Pandemic Effect on GHG Emission Variation at the Sub—National Level and Translation into Policy Opportunities. J. Environ. Manag. 2024, 349, 119539. [Google Scholar] [CrossRef]
- Wu, G.; Miao, Z.; Shao, S.; Geng, Y.; Sheng, J.; Li, D. The Elasticity of the Potential of Emission Reduction to Energy Saving: Definition, Measurement, and Evidence from China. Ecol. Indic. 2017, 78, 395–404. [Google Scholar] [CrossRef]
- Liu, S.C.; He, Y.C. Issues and Suggestions on Carbon Emission Environmental Impact Assessment of Petrochemical Projects: A Case Study of a PTA Project. Guangdong Chem. Ind. 2022, 49, 146–147+53. [Google Scholar]
- Mir, K.A.; Purohit, P.; Cail, S.; Kim, S. Co—Benefits of Air Pollution Control and Climate Change Mitigation Strategies in Pakistan. Environ. Sci. Policy 2022, 133, 31–43. [Google Scholar] [CrossRef]
- Hasanbeigi, A.; Price, L. A Technical Review of Emerging Technologies for Energy and Water Efficiency and Pollution Reduction in the Textile Industry. J. Clean. Prod. 2015, 95, 30–44. [Google Scholar] [CrossRef]
- Chen, C.C.; Liu, C.L.; Wang, H.; Zhang, Y.; Li, J.; Zhao, X.; Chen, L.; Wang, Q.; Huang, M.; Zhu, J.; et al. Analysis of Influencing Factors of Carbon Footprint of Energy Consumption in Beijing: Based on STIRPAT Model and Partial Least Squares Model. China Environ. Sci. 2014, 34, 1622–1632. [Google Scholar]
- Chu, Y.H.; Li, J.; Wang, P.; Chen, S.; Liu, H.; Zhang, Q.; Zhao, M.; Yang, L.; Huang, J.; He, X.; et al. Regional Synergistic Control of Pollution Reduction and Carbon Mitigation: A Case Study of Chongqing. Adv. Eng. Sci. 2024, 56, 183–194. [Google Scholar] [CrossRef]
- Lu, L. Thoughts on Improving China’s Carbon Emission Accounting System Under Carbon Neutrality. Southwest Financ. 2021, 12, 15–27. [Google Scholar]
- Zheng, X.Y. Construction and Calculation of Carbon Emission Accounting System for Express Delivery Industry. Logist. Eng. Manag. 2018, 40, 103–104. [Google Scholar]
- Li, Y.N. Statistical Scope, Measurement Methods, and Indicator Selection for Carbon Accounting. Financ. Viewp. 2021, 11, 29–34. [Google Scholar]
- Chen, F.; Liu, Y.; Li, R. Low—Carbon development path based on carbon emission accounting and carbon emission performance evaluation: A case study of Chinese coal production enterprises. Environ. Sci. Pollut. Res. 2024, 31, 45522–45536. [Google Scholar] [CrossRef]
- Gai, Z.M.; Liu, R.T.; Liu, X.H.; Wang, Y.; Li, Q.; Zhang, H.; Chen, J.; Zhao, L.; Huang, S.; He, M.; et al. Carbon Peak Prediction and Pathway Analysis for Heilongjiang Province. Environ. Sci. 2025, 46, 2828–2836. [Google Scholar] [CrossRef]
- He, G.S.; Zeng, J.C.; Zhu, H.J.; Li, X.; Wang, Z.; Zhang, Q.; Chen, H.; Liu, M.; Zhao, J.; Huang, L.; et al. A Review of Statistical Accounting Methods for Grid Average Carbon Emission Factors. Environ. Impact Assess. 2024, 46, 64–70. [Google Scholar]
- DB11/T 1787-2020; Requirements for Carbon Dioxide Emission Accounting and Reporting of Other Industries. Beijing Municipal Market Supervision and Administration Bureau: Beijing, China, 2020.
- Fu, S.H. Informatization Infrastructure for Carbon Emission Management in the Steel Industry. Met. Mater. Metall. Eng. 2023, 51, 59–64. [Google Scholar]
- Hu, J.K.; Jing, X.S.; Liu, H.F.; Wang, Q.; Li, Z.; Zhang, H.; Chen, M.; Zhao, Y.; Huang, J.; He, L.; et al. Research on Carbon Emission Accounting and Prediction Methods for Natural Gas Production Enterprises: A Case Study of Natural Gas Development in Sichuan Basin. Nat. Gas Technol. Econ. 2024, 18, 53–58. [Google Scholar]
- Liu, H.X.; Shan, S.K.; Liang, D.H.; Zhang, Y.; Li, J.; Wang, Q.; Chen, H.; Zhao, L.; Huang, M.; Zhu, X.; et al. Quantitative Assessment of Carbon Footprint for Municipal Solid Waste Incineration Power Generation. Energy Environ. Prot. 2024, 38, 125–134. [Google Scholar] [CrossRef]
- Xu, Y.X.; Li, X.M.; Li, Y.F.; Wang, Z.; Zhang, Q.; Chen, J.; Liu, H.; Zhao, M.; Huang, L.; He, X.; et al. Exploration of Technical Methods and Empirical Research on Incorporating Greenhouse Gas Control into Environmental Impact Assessment of Chemical Industrial Park Planning. Res. Environ. Sci. 2024, 37, 1626–1640. [Google Scholar]
- Wang, Z.; Ma, S.M.; Wang, T.T.; Li, J.; Zhang, H.; Chen, Q.; Liu, Y.; Zhao, L.; Huang, S.; He, M.; et al. Research on Carbon Emission Accounting and “Dual Carbon” Transition Pathways for Industrial Parks. South. Energy Constr. 2024, 11, 191–199. [Google Scholar]
- Wang, S.W.; Tang, K.Q.; Zhang, H.R.; Li, X.; Wang, Q.; Chen, H.; Liu, Z.; Zhao, J.; Huang, L.; Zhu, M.; et al. Air Quality Improvement Co-Benefits of Carbon Dioxide Reduction Policies in Jiangsu Province. Environ. Sci. 2023, 44, 5443–5455. [Google Scholar]
- National Development and Reform Commission. Guidelines for the Accounting and Reporting of Greenhouse Gas Emissions from Enterprises in Other Industrial Sectors (Trial); National Development and Reform Commission: Beijing, China, 2025.
- Liu, H.P.; Ma, Y.; Duan, H.B.; Zhang, Q.; Li, J.; Wang, Y.; Chen, H.; Zhao, L.; Huang, M.; He, X.; et al. Research on Carbon Emission Factors of Textile Printing and Dyeing Enterprises Under Extended Accounting Boundaries. J. Clean. Prod. 2024, 423, 138892. [Google Scholar]
- Xu, Y.X.; Li, X.M.; Zhang, J.T.; Wang, H.B.; Chen, J. Technical Framework for Integrating Greenhouse Gas Inventories into Environmental Impact Assessment of Textile Industrial Parks. J. Environ. Impact Assess. 2024, 47, 89–102. [Google Scholar]
- IPCC. 2019 Refinement to the 2006 IPCC Guidelines for National Greenhouse Gas Inventories; IPCC: Geneva, Switzerland, 2019. [Google Scholar]
- Du, J.L.; Peng, Z.Y.; Lu, X.H.; Gong, Y.; Liu, C.C. Spatiotemporal Changes of Land Use Carbon Emissions in Suzhou Over the Past 20 Years. J. Suzhou Univ. Sci. Technol. (Nat. Sci. Ed.) 2023, 40, 60–68. [Google Scholar]
- Chen, S.Y. Energy Consumption, Carbon Dioxide Emissions, and Sustainable Development of China’s Industry. Econ. Res. J. 2009, 44, 41–55. [Google Scholar]
- Xu, G.Q.; Liu, Z.Y.; Jiang, Z.H. Factor Decomposition Model and Empirical Analysis of China’s Carbon Emissions: 1995–2004. China Popul. Resour. Environ. 2006, 6, 158–161. [Google Scholar]
- Chen, Q.W.; Lai, X.; Chen, J.J.; Zhang, Y.; Li, J.; Wang, Q.; Chen, H.; Zhao, L.; Huang, M.; Zhu, X.; et al. Comparative Environmental Impact Assessment of Different Hydrometallurgical Recycling Remanufacturing Technologies for Lithium—Ion Batteries in China Considering Multiple Recycling Methods and Temporal—Geographical Scenarios. Sep. Purif. Technol. 2023, 11, 324. [Google Scholar]
- Bao, J.Q.; Miao, Y.; Chen, F. Low—Carbon Economy: A New Transformation in Human Economic Development. China Ind. Econ. 2008, 4, 153–160. [Google Scholar]
- Chen, S.Y. Estimation of China’s Industrial Sub–Sector Statistical Data: 1980–2008. China Econ. Q. 2011, 10, 735–776. [Google Scholar]
- Feng, C.; Wang, M.; Zhang, Y.; Liu, G.-C. Decomposition of energy efficiency and energy—Saving potential in China: A three—Hierarchy meta—Frontier approach. J. Clean. Prod. 2018, 176, 1054–1064. [Google Scholar] [CrossRef]
- Shamsuzzaman, M.; Hossain, I.; Saha, T.; Roy, A.; Das, D.; Ahmed, M.T.; Podder, S.K. Waste Management in Textile Industry; Springer: Singapore, 2023. [Google Scholar]
- Hua, Q.W.; Feng, J.; Yang, J.; Wang, Z.; Li, X.; Zhang, Q.; Chen, J.; Liu, H.; Zhao, M.; Huang, L.; et al. Emission Inventory and Characteristics of Anthropogenic Volatile Organic Compounds in Suzhou. Acta Sci. Circumstantiae 2019, 39, 2690–2698. [Google Scholar]
- Ren, J.C.; Li, J.Y. Characteristics Analysis of VOCs Pollution Sources from Industrial Enterprises in a Western High—Tech Zone. J. Green Sci. Technol. 2022, 24, 29–31. [Google Scholar]
- Gu, C.T.; Wang, J. Reflections on Carbon Emission Issues Globally and in China. Energy 2017, 6, 41–44. [Google Scholar]
- Hou, T.J. Analysis of Air Pollution Prevention and Control Measures in Environmental Engineering. Resour. Conserv. Environ. Prot. 2021, 3, 38–39. [Google Scholar]
- Wang, G.D.; Chu, M.S. Green Iron and Steel Metallurgy Technologies for Low—Carbon Emission Reduction. Sci. Technol. Rev. 2020, 38, 68–76. [Google Scholar]
- Farhana, K.; Kadirgama, K.; Mahamude, A.S.F.; Mica, M.T. Energy consumption, environmental impact, and implementation of renewable energy resources in global textile industries. Mater. Circ. Econ. 2022, 4, 15. [Google Scholar] [CrossRef]
- Dong, F. Current Status and Development of the Textile Printing and Dyeing Industry in a Low—Carbon Economy Environment. Text. Rep. 2022, 41, 34–36. [Google Scholar]
- Liu, Y. Research on Zero—Carbon Creation Pathways for Traditional Industrial Parks. Shanghai Energy Conserv. 2023, 2, 177–180. [Google Scholar]
- Huang, Y.H.; Ding, T.; Li, Y.T.; Zhang, H.; Wang, Q.; Chen, J.; Liu, Y.; Zhao, L.; Huang, S.; He, M.; et al. A Review of Low—Carbon Energy Technologies Under Carbon Neutrality and Implications for New Power System Development. Proc. CSEE 2021, 41 (Suppl. S1), 28–51. [Google Scholar]
- Xiao, X.; Zheng, L. Research on the Construction of Corporate Carbon Accounting System Under Low—Carbon Economy. China Popul. Resour. Environ. 2011, 21, 55–60. [Google Scholar]
- Geldermann, J.; Avci, N.; Wenzel, S.; Nunge, S.; Rentz, O. Techno—Economic Assessment of VOC- and Nox-Emission Reduction Techniques. In Produktion und Umwelt; Haasis, H.D., Spengler, T., Eds.; Springer: Berlin/Heidelberg, Germany, 2004. [Google Scholar]
- Kousar, S.; Shafqat, U.; Kausar, N.; Pamucar, D.; Karaca, Y.; Salman, M.A. Sustainable Energy Consumption Model for Textile Industry Using Fully Intuitionistic Fuzzy Optimization Approach. Comput. Intell. Neurosci. 2022, 2022, 5724825. [Google Scholar] [CrossRef]
- Saha, S. Biomaterials for Textile Industry: A Sustainable Approach to Reduce VOCs Emissions; Springer: Singapore, 2025; pp. 145–178. [Google Scholar]
- Saha, S. Sustainability and Development of Biomaterials in Textile: A Review; Springer: Singapore, 2025. [Google Scholar]
- Violano, A.; Ranzo, P.; Savarese, G. Natural Textile Dyes: Standardizing Processes to Reduce Environmental Impact; Springer: Cham, Switzerland, 2025. [Google Scholar]
- Violano, A.; Ranzo, P.; Savarese, G. Standardization of Natural Dyeing Processes for Textiles: Environmental Impact Reduction and VOCs Control; Springer: Cham, Switzerland, 2025; pp. 89–112. [Google Scholar]
- Hasanbeigi, A.; Price, L. A Review of Energy Use and Energy Efficiency Technologies for the Textile Industry. Renew. Sustain. Energy Rev. 2012, 16, 3648–3665. [Google Scholar] [CrossRef]
Disclaimer/Publisher’s Note: The statements, opinions and data contained in all publications are solely those of the individual author(s) and contributor(s) and not of MDPI and/or the editor(s). MDPI and/or the editor(s) disclaim responsibility for any injury to people or property resulting from any ideas, methods, instructions or products referred to in the content. |
© 2025 by the authors. Licensee MDPI, Basel, Switzerland. This article is an open access article distributed under the terms and conditions of the Creative Commons Attribution (CC BY) license (https://creativecommons.org/licenses/by/4.0/).