Article

Impacts of Climate Change on Streamflow to Ban Chat Reservoir

1
Department of Academic Affairs, Thuyloi University, 175 Tay Son, Kim Lien, Hanoi 100000, Vietnam
2
Department of Hydrology and Climate change, Thuyloi University, 175 Tay Son, Kim Lien, Hanoi 100000, Vietnam
*
Author to whom correspondence should be addressed.
Atmosphere 2025, 16(9), 1054; https://doi.org/10.3390/atmos16091054
Submission received: 10 August 2025 / Revised: 3 September 2025 / Accepted: 4 September 2025 / Published: 5 September 2025
(This article belongs to the Special Issue Hydrometeorological Extremes: Mechanisms, Impacts and Future Risks)

Abstract

Climate change is increasingly altering rainfall regimes and hydrological processes, posing major challenges to reservoir operation, flood control, and hydropower production. Understanding its impacts on the Ban Chat reservoir in Northwest Vietnam is therefore crucial for ensuring reliable water resource management under future uncertainties. This study aims to assess potential changes in streamflow to the Ban Chat reservoir under different climate change scenarios. The study employed nine Global Climate Models (GCMs) from the Coupled Model Intercomparison Project Phase 6 (CMIP6) under three Shared Socioeconomic Pathways (SSP1-2.6, SSP2-4.5, and SSP5-8.5). Future climate projections were bias-corrected using the Quantile Delta Mapping (QDM) method and used as input for the Hydrological Engineering Center–Hydrological Modeling System (HEC-HMS) to simulate future inflows. Streamflow changes were evaluated for near- (2021–2040), mid- (2041–2060), and late-century (2061–2080) periods relative to the baseline (1995–2014). Results show that under SSP1-2.6, mean annual discharge and flood-season flows steadily increase (up to +6.9% by 2061–2080), while storage deficits persist (−27.7% to −13.1%). Under SSP2-4.5, changes remain small, with flood peaks limited to +4.5% mid-century, but severe dry-season deficits continue (−29.5% to −24.4%). In contrast, SSP5-8.5 projects strong late-century increases in mean flows (+7.5%) and flood peaks (+8.2%), though early-century flood flows decline (−2.1%). These findings provide essential scientific evidence for adaptive reservoir operation, hydropower planning, and flood risk management, underscoring the significance of incorporating climate scenarios into sustainable water resource strategies in mountainous regions.

1. Introduction

According to the Fourth Assessment Report (AR4) of the Intergovernmental Panel on Climate Change (IPCC), there was a notable rise in the global mean surface temperature, averaging +0.074 °C per year between 1906 and 2000 [1]. Subsequently, the Fifth Assessment Report (AR5) estimated the overall increase in global mean temperature during the period 1880–2012 to be approximately 0.85 °C, with an uncertainty range of 0.65 °C to 1.06 °C [2]. In the latest update from the IPCC Sixth Assessment, it was stated that average annual global land precipitation will increase by 0–5% under a very low greenhouse gas (GHG) emissions scenario, Shared Socioeconomic Pathways (SSPs) (SSP1-1.9), by 1.5–8% under an intermediate scenario (SSP2-4.5), and by 1–13% under a very high emissions scenario (SSP5-8.5) for the period 2081–2100 relative to 1995–2014 [3]. There is growing evidence that the global water cycle is very likely to intensify as global temperatures rise. As a result, precipitation and surface runoff are projected to become more variable across most land areas [4]. Furthermore, the intensity of extreme daily rainfall events is expected to increase by approximately 7% for every 1 °C rise in global temperatures. This intensification is projected to be most pronounced in high latitudes, the equatorial Pacific, and parts of monsoon regions, while reductions are anticipated in some subtropical and tropical areas.
Extreme rainfall-related events have drawn considerable attention from scientists, engineers, and policymakers. The quantitative patterns of these events are especially critical, as they significantly affect transportation systems, infrastructure, terminals, and human safety. Numerous studies have shown that the impacts of extreme rainfall events—particularly under changing climate conditions—far exceed those observed under normal climate variability, especially in relation to infrastructure, agriculture, and the natural environment [5,6,7]. Climate change has profound implications for water resources, particularly in regions reliant on rainfall-dependent river basins. Rising temperatures, altered precipitation patterns, and the increased frequency of extreme weather events (such as droughts and floods) directly affect the availability, distribution, and timing of water resources. For hydropower systems, these changes lead to fluctuations in river inflows, reducing the reliability of energy production and posing challenges to long-term planning and operational efficiency [8]. Reservoirs, which serve as critical infrastructure for water storage, flood control, and electricity generation, face increasing pressure from both reduced inflows during dry seasons and heightened risks of overtopping or dam failure during extreme rainfall events. As a result, climate change necessitates adaptive reservoir management strategies, the integration of future climate projections into hydrological models, and the development of flexible operational rules to ensure water and energy security under uncertain future conditions [9,10]. Understanding how climate change may alter inflows to large reservoirs is therefore essential for adaptive water resource management.
Vietnam is increasingly vulnerable to the impacts of climate change, particularly in terms of its water resources and hydropower systems. Nearly 8000 reservoirs across the country play a vital role in water supply, irrigation, flood control, and electricity generation. However, projected changes in rainfall patterns and intensification of extreme weather events under various SSPs pose serious challenges to the sustainable management and operation of these reservoirs. Estimating future climate change impacts on inflows under SSPs is therefore essential to assess potential risks to water availability, energy security, and disaster preparedness, particularly in mountainous regions located in northern Vietnam. Typically, Ngo et al., (2018) [11] assessed the impacts of reservoir operations under RCP scenarios using SWAT and showed the reducing variability in the dry season but increasing variability in the remaining months. Zhaohua et al. (2019) [12] have shown that the operation of the Three Gorges Reservoir in China has a significant impact on the development and variability of the interaction between the Yangtze River and Dongting Lake, especially related to the process of water diversion from the river to the lake—a key factor in water resources management of this large river-lake system. Nguyen et al. (2023) [13] calculated the inflows to the Ta Trach reservoir using a combined HEC-HMS and numerical weather model and indicated a combined effectivity of the hydrometeorological model. Over northern Vietnam, Bui and Le (2020) [14] have used satellite data and rainfall forecasts combined with terrestrial data to simulate and forecast flows for the Thao River.
The Ban Chat reservoir, located in the Nam Mu river basin (NMB) in Northwest Vietnam, plays a vital role in hydropower generation, flood control, and water regulation for downstream communities. The Ban Chat reservoir is one of the largest hydropower projects in the Da River basin, providing substantial electricity to the national grid while also regulating downstream flows for flood mitigation. The catchment is characterized by steep mountainous terrain, highly variable rainfall, and frequent extreme events, which make it particularly sensitive to climate change impacts. At the same time, socio-economic development in the region increasingly depends on the stable operation of Ban Chat and its cascade with the Huoi Quang reservoir. Despite its importance, few studies have comprehensively assessed future climate change impacts on inflows to the Ban Chat reservoir. Previous hydrological assessments in Vietnam have largely focused on major reservoirs such as Hoa Binh or Son La, leaving knowledge gaps for upstream systems like Ban Chat, where hydropower, flood management, and water security are closely interconnected. Besides that, projected changes in rainfall patterns, particularly the increasing frequency and intensity of extreme events, pose serious challenges for reservoir management but not studies in flows to reservoirs under SSPs. Therefore, the study is motivated by both the practical significance of Ban Chat reservoir and the scientific need to understand how projected climate scenarios may reshape its hydrological regime. Nine Global Climate Models from the CMIP6 for SSPs of 1-2.6, 2-4.5, and 5-8.5 are selected and then bias-corrected using the Quantile Delta Mapping (QDM). The outputs are then used as input for HEC-HMS for future streamflow projections. Based on that, the discussions and conclusions are presented to provide robust evidence to support adaptive reservoir operation, long-term planning, and climate-resilient water management strategies in Northwest Vietnam.

2. Materials and Methods

2.1. Study Area

The NMB is a first-class tributary located within the Da River system. The main stream of the Nam Mu River originates in the high mountains, exceeding 3000 m in elevation, which are part of the western Hoang Lien Son range. From its source, the Nam Mu River flows in a northwest-southeast direction before joining the Da River at Khung Mon, situated at 21°31′ North latitude and 103°50′ East longitude, approximately 10 km upstream from the Ta Bu hydrological site. The Ban Chat hydroelectric dam is constructed about 1.5 km upstream of the confluence of the Nam Mu and Nam Kim rivers, with geographical coordinates of 21°51′40″ North latitude and 103°50′59″ East longitude, located in Ban Chat, Muong Kim commune, Than Uyen district, Lai Chau province.
The Nam Mu basin climate is shaped by the interaction of tropical monsoons and high mountain topography, resulting in pronounced seasonality of temperature, humidity, wind, and rainfall. These features create sharp contrasts between wet and dry periods and highlight the basin’s sensitivity to both regional monsoon variability and localized extreme weather events. Mean annual rainfall varies from 1700–2000 mm in the downstream lowlands to 2200–2800 mm in the upstream mountainous sectors, with a long-term basin average of approximately 2360 mm. Rainfall is highly seasonal, with 77–80% of annual totals concentrated between May and September. Peak precipitation occurs in June–August, contributing 57–60% of the annual rainfall, while the dry season (October–April) contributes only 20–23%. The annual mean air temperature ranges from 18.8 °C to 21.0 °C, with values decreasing with elevation. Prevailing winds follow the seasonal monsoon pattern, with northeasterly winds dominant in winter and southwesterly winds prevailing in summer.
The NMB is characterized as long and narrow, with storage elevation gradually decreasing from northwest to southeast. The total basin area is about 3420 km2, the main river length is 165 km, the basin length is 127 km, the average width is 26.8 km, and the average basin elevation is approximately 1085 m. The average storage slope is 37.2%.
The forests in the Da River basin, particularly in the NMB, are primarily composed of water forests and broadleaf forests, interspersed with bamboo forests and thorny bushes. However, these areas have been severely degraded due to nomadic farming practices and unplanned exploitation of floodplain resources. The remaining forest cover is estimated to be around 10% to 20%, with many mountainous areas nearly bare. Currently, some regions within the dense forest area of Hoa Binh Lake have undergone reforestation, but the percentage of planted forest remains low. Figure 1 shows the map of the study area with topography and locations of rain gauges.

2.2. Data Collection

2.2.1. Hydrometeorological Data

A 34-year period (1981–2014) of daily rainfall data recorded at six stations, mostly distributed across the Northwest Mountainous Region of Vietnam, was obtained from the Vietnam Meteorological Data Center under the Ministry of Natural Resources and Environment and is used in this study. The locations of these stations are specified by their longitude and latitude as displayed in Figure 1. It should be noted that although these stations are concentrated in the downstream, the long records and representative role as key stations in this area make them suitable for bias correction and assessing the impacts of climate change. Sub-daily streamflow data at Ban Chat Dam (referred to as BCD) were collected for each flood event that occurred in 2023 and 2024.

2.2.2. CMIP6 Data

Nine Global Climate Models (GCMs) from CMIP6, representing a range of institutions and model structures, were selected for this study to capture diverse future climate projections. These include (1) IPSL-CM6A-LR (France)—low-res, emphasizing atm–biogeochem. interactions with updated ocean/aerosol schemes [15]; (2) MPI-ESM1-2-LR (Germany)—comprehensive ESM with improved clouds and vegetation–atm. coupling [15,16,17]; (3) MRI-ESM2-0 (Japan)—balanced ocean–atm. processes with detailed aerosol treatment [18]; (4) MIROC6 (Japan)—enhanced cloud microphysics, aerosol–cloud interactions, improved tropical rainfall [19]; (5) NorESM2-MM (Norway)—builds on CESM2, enhancing aerosols, clouds, and ocean biogeochem [20]; (6) BCC-CSM2-MR (China)—medium-res, improved monsoon and ocean circulation for East Asia [21]; (7) CMCC-ESM2 (Italy)—fully coupled ESM focusing on land–ocean carbon feedbacks [22]; (8) CNRM-CM6-1-HR (France)—high-res, improved atm. dynamics and extremes [23]; (9) HadGEM3-GC31-MM (UK)—mid-res, realistic variability and coupled ocean–atm. feedbacks [24]. The spatial and temporal resolutions of these GCMs are summarized in Table 1.
The historical and future daily rainfall of these GCMs over northern Vietnam was collected from https://pcmdi.llnl.gov/CMIP6/, accessed on 25 February 2025. The GCMs simulated historical daily rainfall for the period of 1981–2014 and projected daily rainfall for 2015–2100 under three SSPs (i.e., SSP1-2.6, SSP2-4.5, and SSP5-8.5). SSP1-2.6 is aligned with Paris Agreement goals, simulating low-emission pathways, while SSP2-4.5 is considered a baseline or moderate scenario, often used to assess plausible mid-century impacts. SSP5-8.5 represents a high-end warming scenario, useful for worst-case or stress-testing assessments.

2.3. Quantile Delta Mapping

Still now, several methods are widely applied in various studies on climate change, such as local intensity scaling (LOCI) [25], power transformation (POT) [26], and distribution mapping (DISM) [27]. LOCI corrects the daily rainfall based on the wet day threshold and a scaling factor, which ensures the mean of the corrected rainfall is equal to the observed rainfall. POT uses an exponential form to correct the daily rainfall based on the further adjustment of the standard deviation. On the other hand, it is capable of correcting both the mean and variance. DISM is applied to correct the distribution function of the GCM outputs based on matching the distribution function of the raw data to that of the observation. Empirical Quantile Mapping (EQM) and Parametric QM use empirical or fitted parametric distributions (e.g., Gamma, Generalized Extreme Value) for the CDFs. In this study, however, Quantile Delta Mapping (QDM) is a statistical bias correction method designed to preserve the long-term trends in climate model outputs while correcting systematic errors in distribution. Unlike traditional quantile mapping, which directly replaces model quantiles with observed ones, QDM corrects the relative or absolute differences (deltas) between modeled future and historical simulations and applies these deltas to the observed distribution [28,29]. Equation (1) shows how to estimate the bias-corrected future values based on the QDM method.
Let F o 1 q ,   F m 1 q ,   and   F m , f 1 q be the quantile functions of observed historical, modeled historical, and modeled future data, respectively, for a given quantile q. Then, the bias-corrected future value xbc is calculated as
x bc = F o 1 q × F m , f 1 q F m 1 q
QDM is particularly useful for daily precipitation data, where capturing both the distributional characteristics and future trends (e.g., in frequency and intensity) is essential for hydrological impact studies. It has been applied in various climate impact assessments due to its ability to avoid overcorrection and maintain consistency with projected changes.

2.4. HEC-HMS Model Description

The Hydrologic Engineering Center’s Hydrologic Modeling System (HEC-HMS) version 4.13 is the latest release developed by the U.S. Army Corps of Engineers and used in this study (https://www.hec.usace.army.mil/software/hec-hms/, accessed on 20 March 2025). It is a comprehensive software package designed to simulate the complete hydrologic response of a watershed system. HEC-HMS 4.13 builds upon the robust capabilities of its predecessors and introduces a range of enhancements in modeling flexibility, computational performance, and user interface. This version supports the simulation of rainfall-runoff processes, including infiltration, surface runoff, baseflow, and channel routing, making it suitable for both continuous and event-based hydrologic modeling. HEC-HMS 4.13 offers improved integration with Geography Information System through tools (e.g., HEC-GeoHMS) and it supports data exchange with external platforms such as HEC-RAS (v5.x and later) and HEC-DSSVue 2.0.
The performance of HEC-HMS 4.13 when using daily rainfall data is significantly influenced by the sensitivity of several key parameters. Among these, the Curve Number (CN) is particularly sensitive, as it governs surface runoff generation and is affected by land use and soil characteristics. Initial abstraction (Ia) also plays a crucial role, especially in controlling the initial rainfall losses; inaccurate estimation can lead to under- or over-prediction of runoff. Baseflow parameters, including recession constants and initial discharge, are essential for simulating inter-event flow and maintaining continuity in daily time steps. Lag time, or time of concentration, impacts the timing and shape of the hydrograph, even under coarse temporal resolution. Additionally, routing parameters such as the Muskingum K coefficient influence the attenuation of flood waves. Conducting a sensitivity analysis of these parameters is critical prior to model calibration to enhance simulation reliability, particularly in reservoir inflow modeling and water resource planning under daily rainfall inputs.

2.5. Evaluation of Bias Correction Performance

To evaluate the performance of bias correction methods, particularly QDM, when adjusting daily rainfall data from Global Climate Models (GCMs) against observed rainfall, a metric of indices is used based on its strengths and weaknesses, as shown in Table 2.

3. Results and Discussions

3.1. Bias Correction

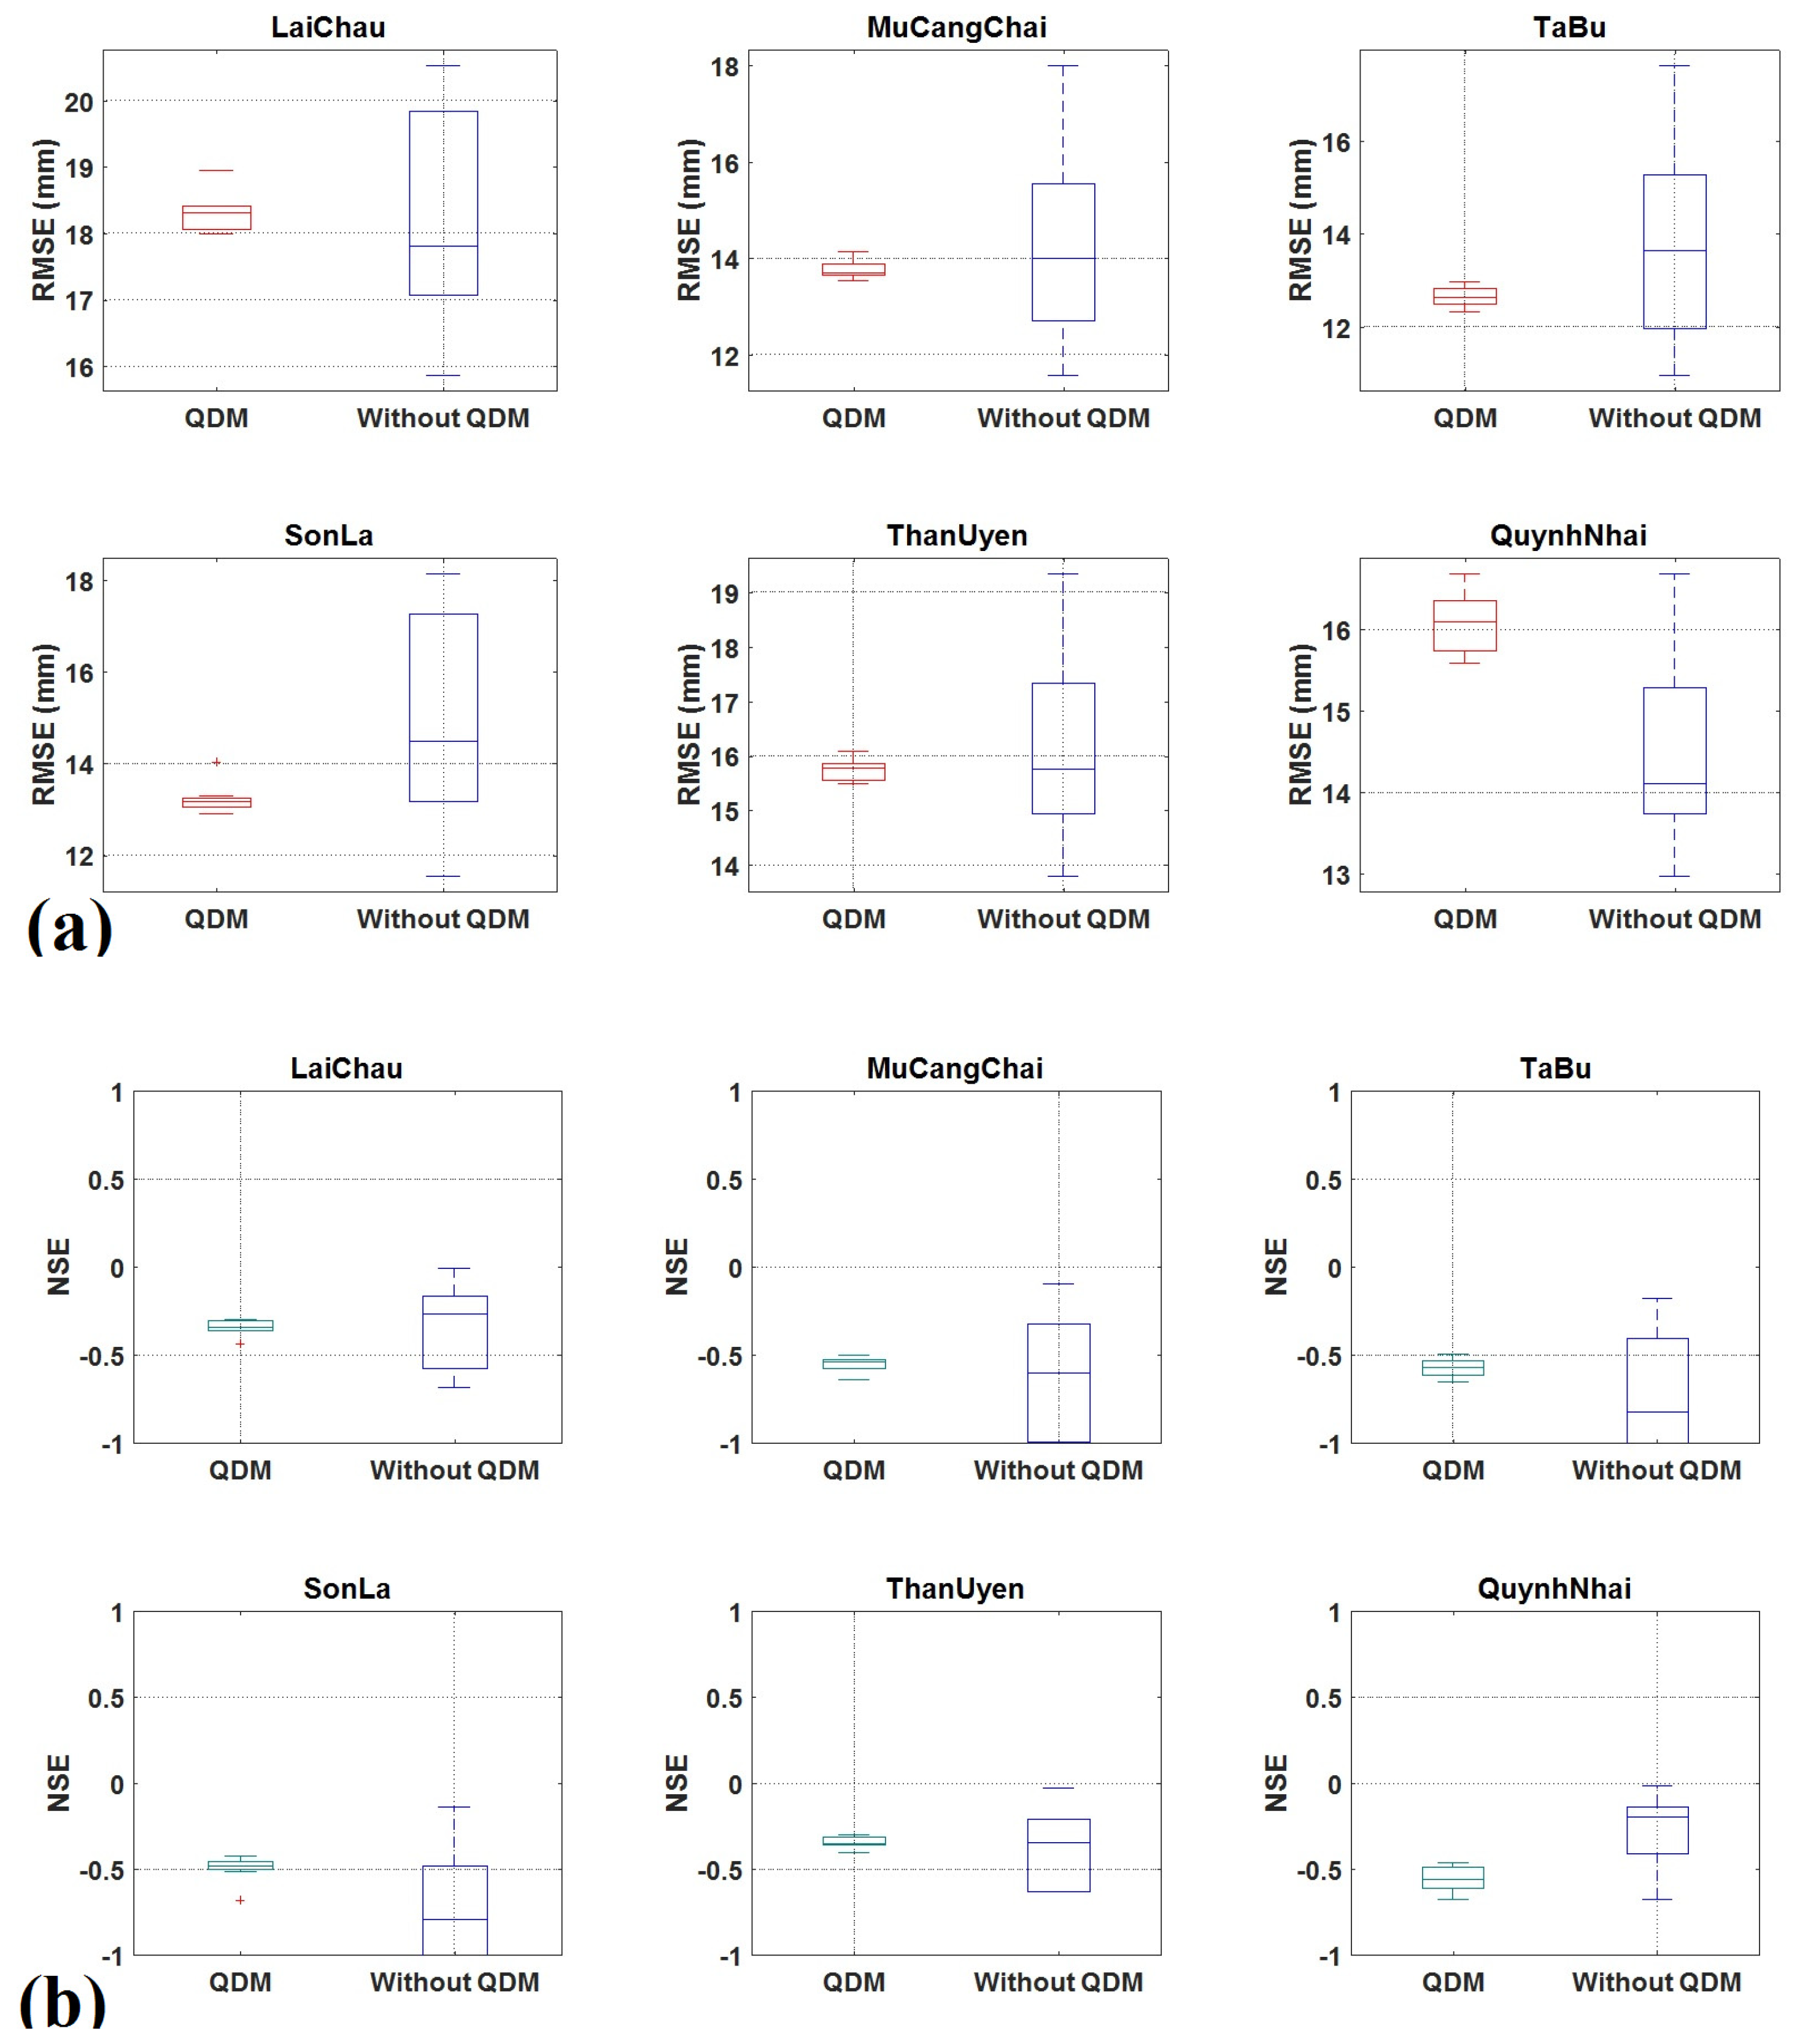
Figure 2a shows that RMSE boxplots with QDM are lower and more stable than without QDM. In other words, the RMSE value has less variability with QDM, whereas without QDM there is more variability, spread, and more outliers. More specifically, at Son La, RMSE with QDM is approximately 13 mm, while this figure is nearly 15 mm without QDM. At TaBu, RMSE is approximately 13 mm; meanwhile, this figure is nearly 14 mm without QDM. At Quynh Nhai it is quite a special case because the median RMSE with QDM is slightly higher, but the dispersion is greatly reduced. This is likely related to the homogeneity in rainfall data for mountainous regions in Northern Vietnam. Generally, although the improvement levels are different from station to station, QDM improves significantly, reducing RMSE variability and reducing the mean.
Figure 2b illustrates the NSE values derived from nine CMIP6 models at six stations (i.e., Lai Chau, Mu Cang Chai, Ta Bu, Son La, Than Uyen, and Quynh Nhai), comparing results before and after bias correction using QDM. The results indicate that the NSE values after applying QDM are significantly improved compared to the uncorrected model outputs. The QDM-corrected simulations consistently show reduced variability and higher median NSE, indicating better agreement with the observed data. In contrast, the uncorrected outputs exhibit lower or even negative NSE values, implying poor performance in reproducing daily rainfall dynamics. Notably, several stations (i.e., Son La) experienced substantial improvements, where the uncorrected NSE values are mostly negative, while QDM correction brought the NSE values closer to zero. This confirms that QDM is effective in enhancing model reliability in representing daily rainfall distributions across multiple climate models. Table 3 shows other statistical indices (i.e., KGE, MAE, PBIAS) for QDM performance at the median. As observed from Table 3, the use of QDM had a clear positive effect on the QDM performance at the stations. The KGE index increased significantly at the majority of stations, indicating that QDM helps improve the accuracy of daily rainfall.
Notably, CMIP6 GCMs represent a major improvement in Earth-system components, but their simulation of daily precipitation still exhibits systematic shortcomings: errors in wet-day frequency, under- or/and overestimation of intensity distributions, misrepresentation of extremes, and an advance or/and shift in the diurnal cycle over land (all of which compromise station-scale daily rainfall realism). These issues are documented across global and regional evaluations and should be expected when using raw GCM daily precipitation for impact studies (IPCC, 2021). Additionally, QDM may not effectively adjust for extreme values, leading to inaccurate representations of extreme rainfall events. Besides that, QDM may fail to capture nonlinear relationships between variables, which can impact the accuracy of predictions, depending on comprehensive and accurate historical data (Xavier et al., 2022) [29].

3.2. Hydrologic Model Performance

Figure 3 shows the diagram of the Ban Chat reservoir sub-basin in the HEC-HMS model. To calculate streamflow to Ban Chat reservoir, the study used daily rainfall data from the CMIP6 models after QDM as input for the HEC-HMS model.
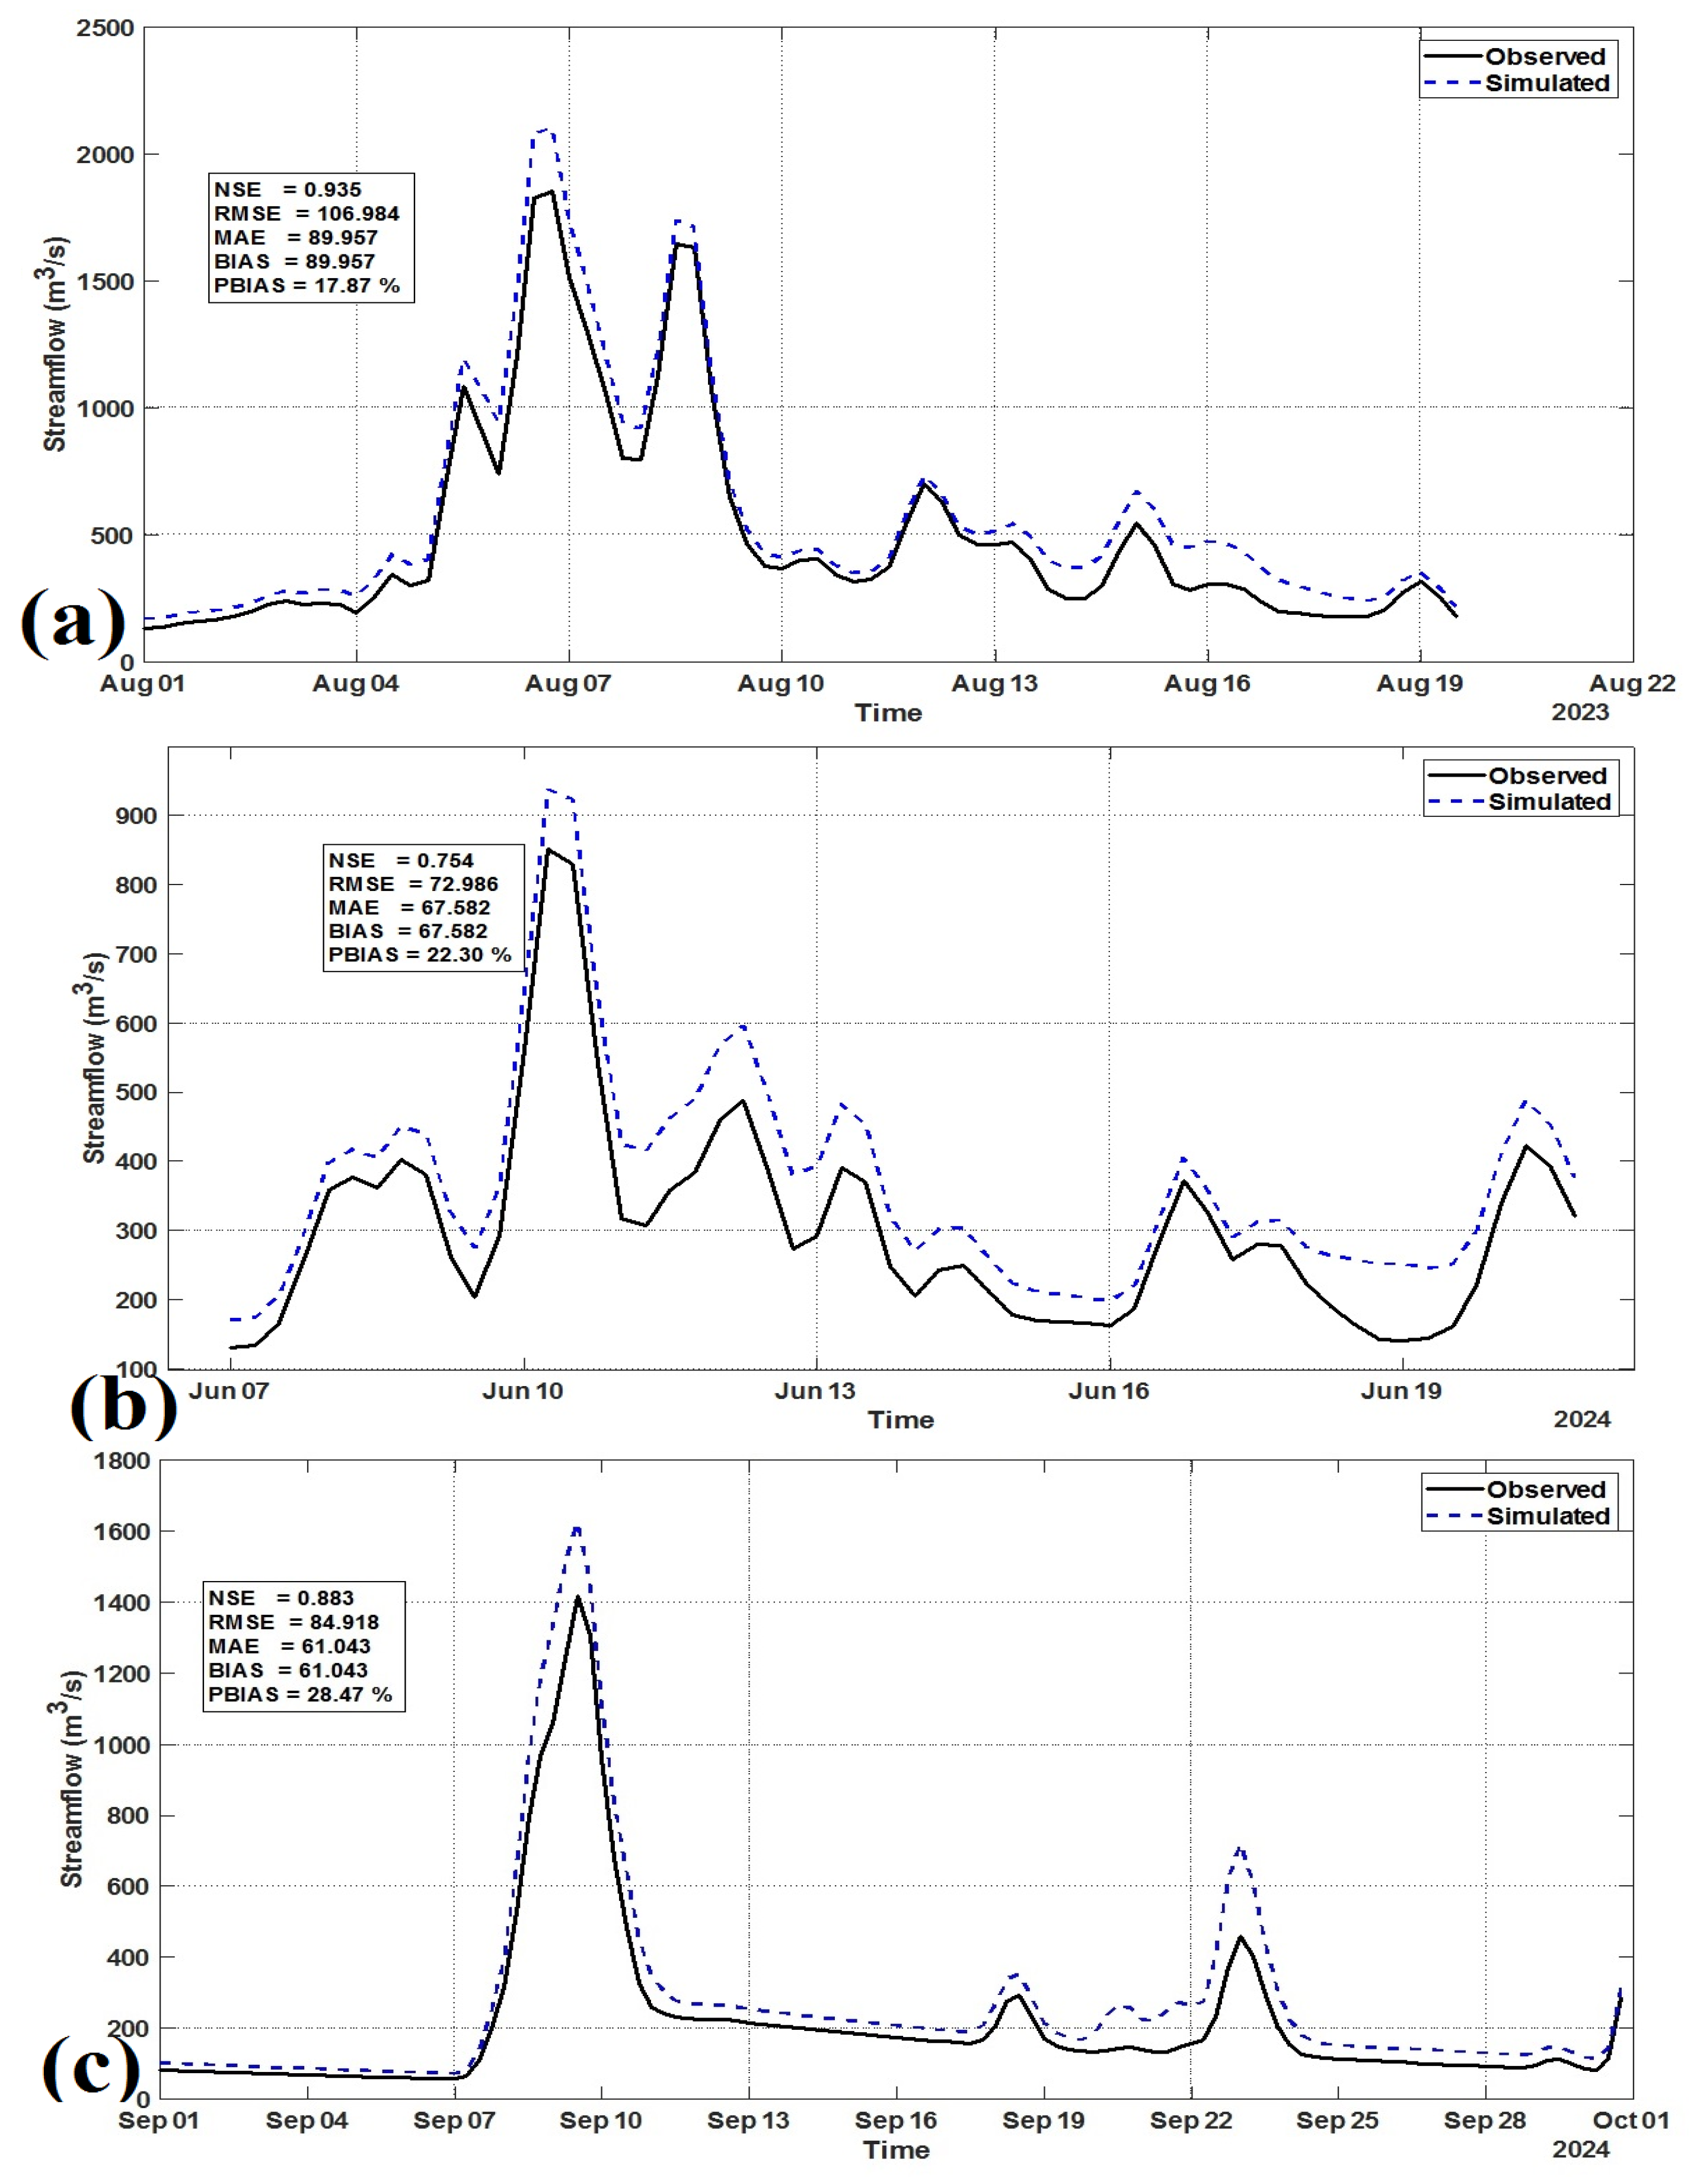
The subdaily hydrographs obtained during calibration and validation at streamflow gauging station BCD are illustrated in Figure 4a–c. Figure 4a presents the calibration results of the HEC-HMS model for the period from 1 August to 20 August 2023, by comparing the observed and simulated streamflow at the watershed outlet. The model demonstrates high accuracy, as indicated by the Nash–Sutcliffe Efficiency (NSE) of 0.935, suggesting excellent agreement between observed and simulated flows. The Root Mean Square Error (RMSE) and Mean Absolute Error (MAE) were 106.98 m3/s and 89.96 m3/s, respectively, reflecting acceptable levels of error during the simulation period. A slight positive bias is evident, with a Percent Bias (PBIAS) of 17.87%, indicating a tendency of the model to slightly overestimate peak flows, particularly during high-intensity events on 6–9 August. Visually, the hydrograph reveals that the model effectively reproduces the timing, magnitude, and shape of the observed flow events, including multiple peaks. Overall, the calibration performance confirms that the HEC-HMS model is well-suited for simulating hydrological responses in the study area and provides a reliable foundation for further validation or scenario-based analyses.
Figure 4b illustrates the validation results of the HEC-HMS model for the period from 7 June to 20 June 2024, comparing simulated and observed streamflow data. The Nash–Sutcliffe Efficiency (NSE) value of 0.754 indicates a good level of model performance, although slightly lower than the calibration phase, suggesting some underperformance in replicating certain flow dynamics. The RMSE and MAE values are 72.90 m3/s and 67.58 m3/s, respectively, reflecting moderate deviation from observed data. A positive bias is present, as indicated by a BIAS and PBIAS of 67.58 m3/s and 22.30%, respectively, implying that the model tends to overpredict flows, especially during peak discharge events such as those occurring around 10 June and 12 June.
Despite these biases, the model successfully captures the timing and general trend of the hydrograph, including both peak and recession flows. The overestimation is particularly notable in high-flow periods, whereas during low-flow periods, the model slightly underestimates or closely follows observed values. Overall, the validation confirms that the HEC-HMS model retains acceptable predictive ability and can be applied with reasonable confidence for hydrological analysis and scenario simulation in the study area.
Figure 4c presents the validation results of the HEC-HMS model for the second flood event during September 2024. The model demonstrates a strong performance with a Nash–Sutcliffe Efficiency (NSE) of 0.883, indicating excellent agreement between observed and simulated streamflow. The Root Mean Square Error (RMSE) and Mean Absolute Error (MAE) are 84.92 m3/s and 61.04 m3/s, respectively, reflecting acceptable levels of deviation in flow magnitude.
Despite the good overall fit, the model shows a positive bias with BIAS = 61.04 m3/s and PBIAS = 28.47%, suggesting a tendency to overestimate streamflow, particularly during the flood peak on September 9, where the simulated discharge reaches nearly 1600 m3/s while the observed value is lower. The timing of the peak flow is accurately captured, and the model reproduces the rising and falling limbs of the hydrograph well.
Additionally, minor overestimations are observed in subsequent small flood pulses around 22–25 September. However, the model still maintains consistent hydrological behavior throughout the simulation period. These results confirm the robustness of the HEC-HMS model in simulating flood events under different hydrological conditions, supporting its applicability for forecasting and reservoir inflow assessment in the study basin.
Overall, the calibration and validation results demonstrate that the HEC-HMS model is capable of reliably simulating flood events in the study area. During the calibration phase for the 2023 flood event, the model achieved a satisfactory performance with an NSE of 0.935, indicating excellent agreement between observed and simulated flows. In the validation period, two flood events in 2024 were assessed. The first event in June yielded an NSE of 0.754 and a PBIAS of 22.30%, suggesting that the model adequately captured the timing and overall dynamics of the flood hydrograph, although a consistent tendency to overestimate discharge magnitudes was observed. The second event in September showed improved performance, with a higher NSE of 0.883 and similar positive bias, reflecting good simulation of both the primary flood peak and subsequent minor flow events. Despite the overestimation of peak flows, the model successfully reproduced the shape, timing, and recession limbs of the observed hydrographs across all events. These results confirm that the calibrated HEC-HMS model maintains robust predictive capacity and can be confidently applied for streamflow forecasting and flood scenario analysis in the basin. Notably, after calibration and validation of HEC-HMS, the parameters of the model are selected and kept to project the changes in streamflow under SSPs.

3.3. Impact of Climate Change on Streamflow

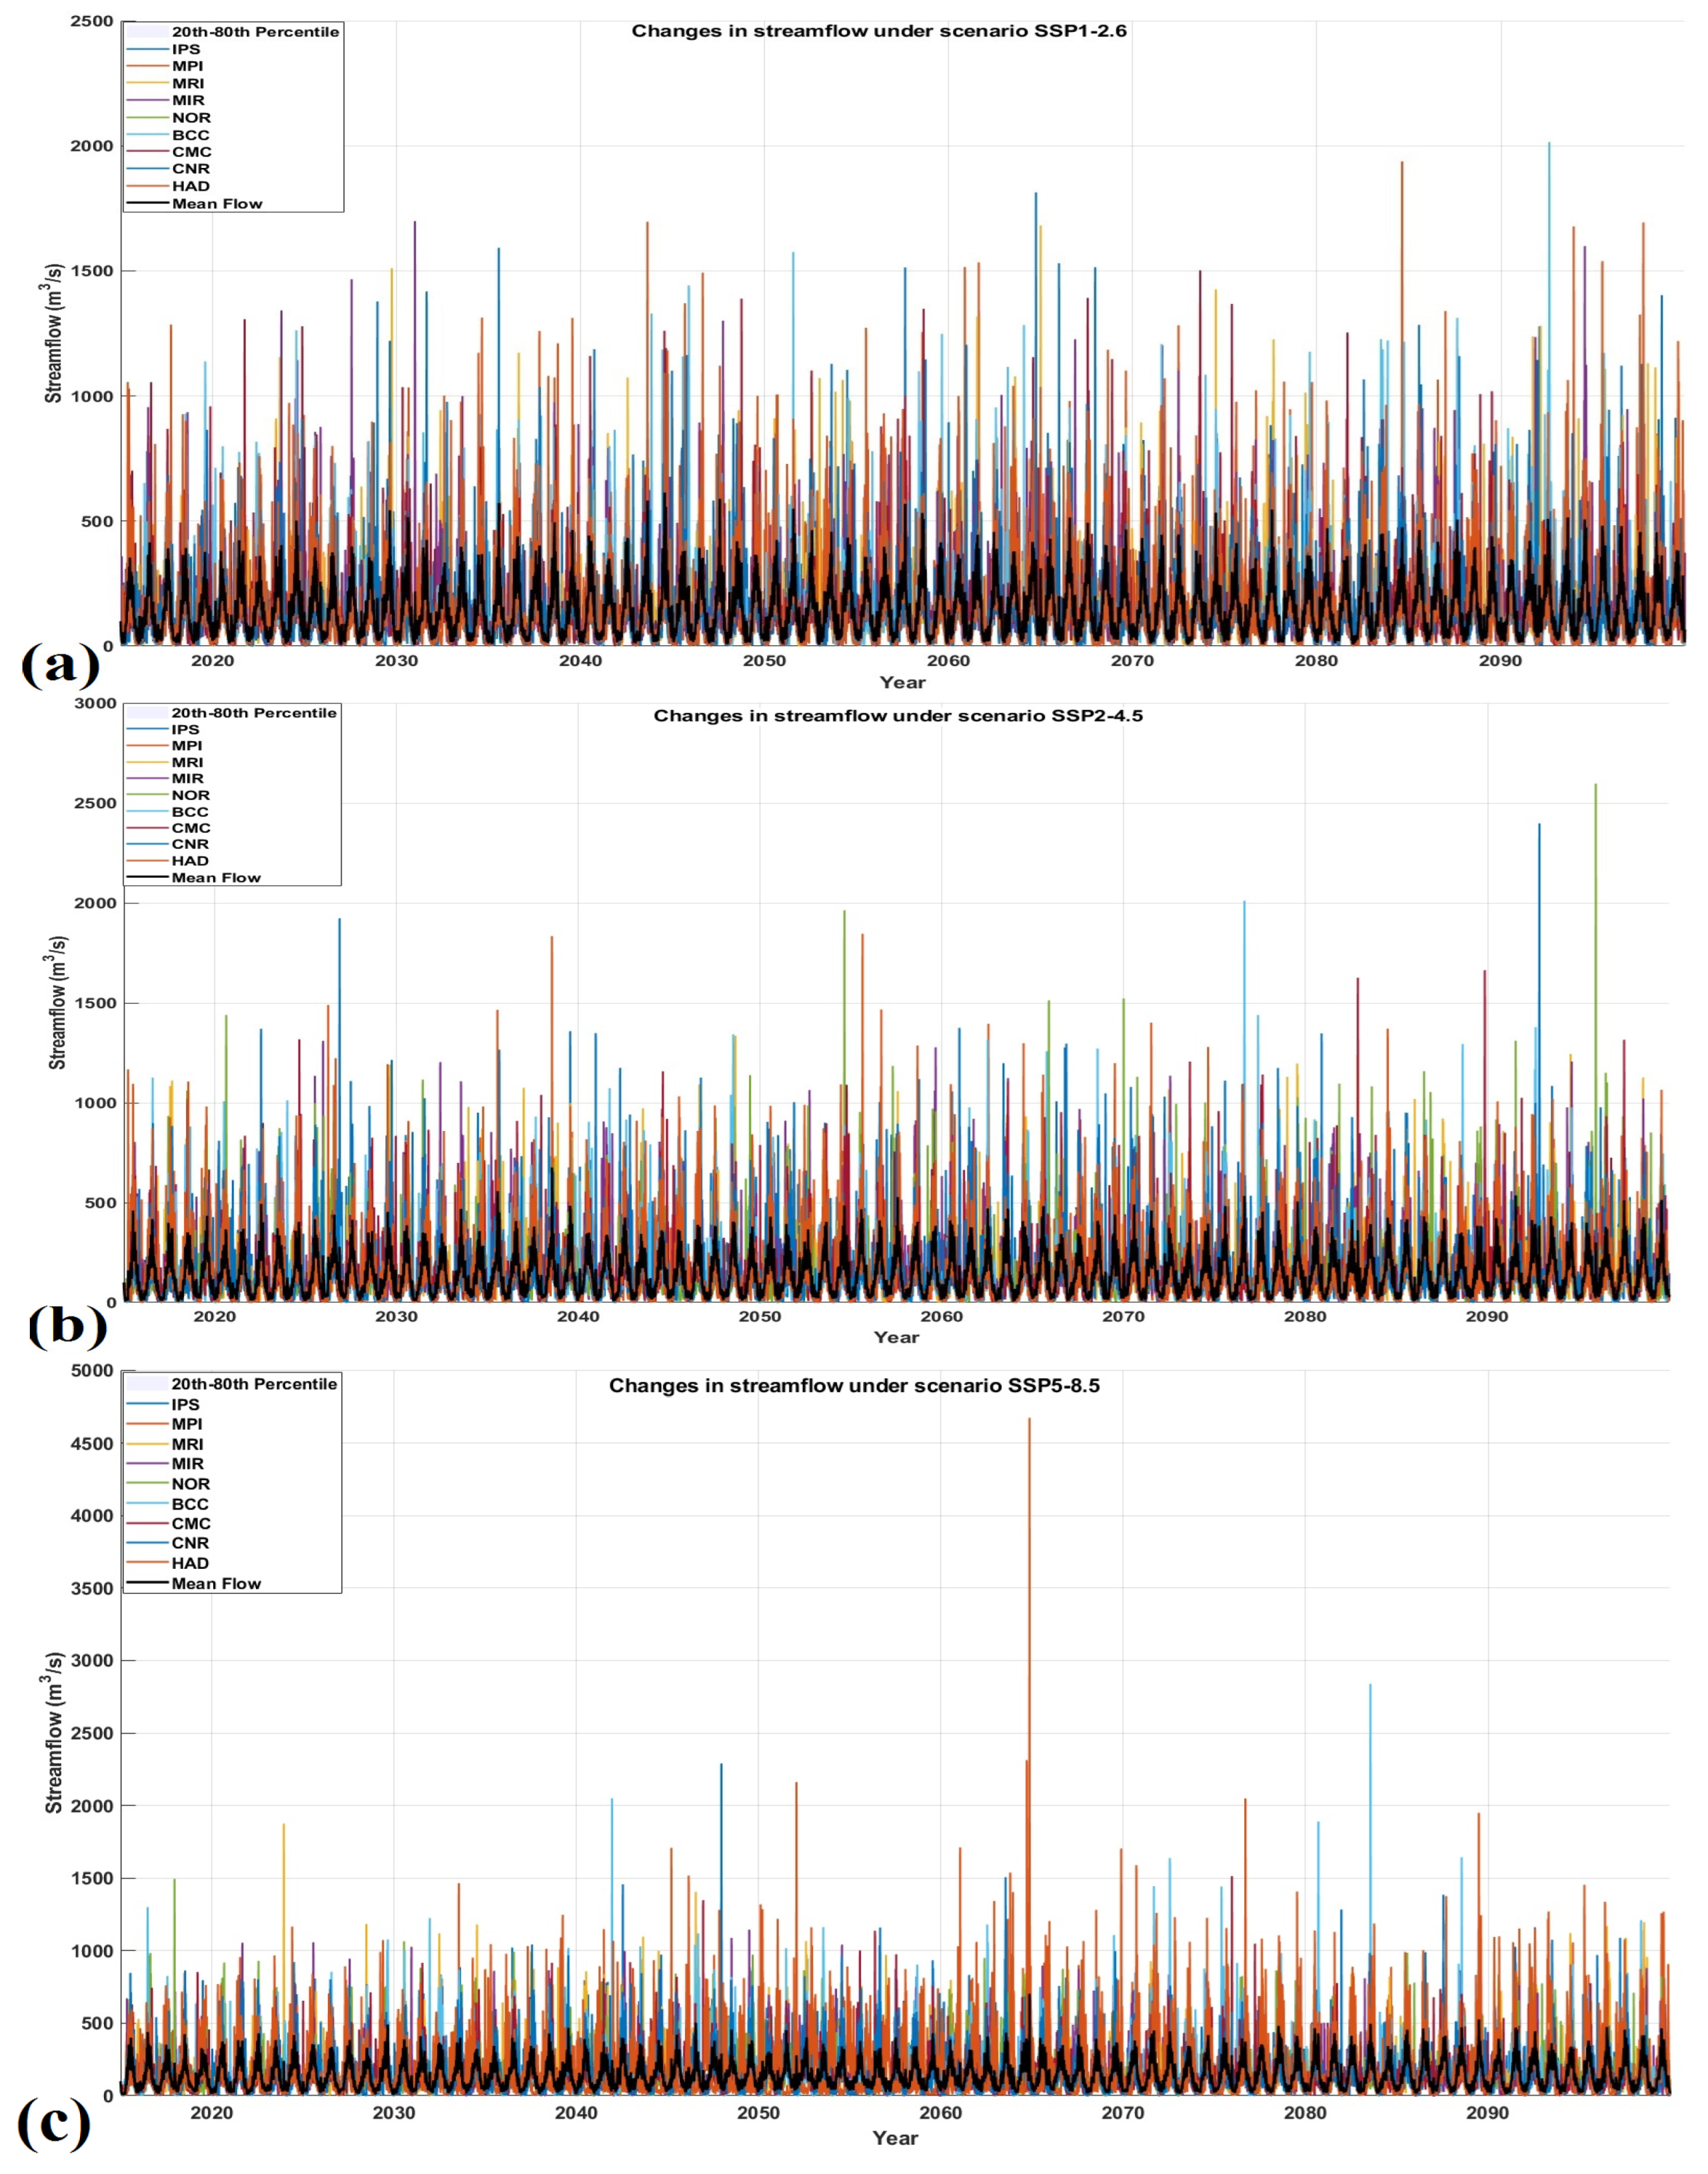
Figure 5 shows the changes in streamflow under scenarios of SSP1-2.6 (a), SSP2-4.5 (b), and SSP5-8.5 (c) at the BCD from CMIP6 Models. Recommended by IPCC AR6, the period 1995–2014 is selected as the baseline reference period for climate change impact assessments using CMIP6 simulations in this study. For this, this period reflects recent historical climate conditions and aligns with modern observational datasets, including satellite and reanalysis products. For CMIP6 scenarios, the study divides into main periods (i.e., near-future (2021–2040), mid-future (2041–2060), and far-future (2061–2080)). Figure 5a shows the projected river flow (m3/s) for 2015–2100 under the SSP1-2.6 scenario from nine CMIP6 GCMs. The shaded band indicates the 20th–80th percentile range, individual colored lines represent each GCM, and the black line shows the multi-model mean. Results reveal strong seasonal variability with consistent mean flow and no clear long-term trend, although peak magnitudes vary substantially among models. This is similar for under SSP2-4.5 (Figure 5b) and SSP5-8.5 (Figure 5c).
As mentioned, the study analyzes the changes in hydrological characteristics within the periods of near-future (2021–2040), mid-future (2041–2060), and far-future (2061–2080) against the baseline period of 1995–2014. Table 4, Table 5 and Table 6 show changes in hydrological characteristics at the BCD under SSPs with the 50% percentile from CMIP6 models. It is observed that under SSP1-2.6, mean annual discharge (Qo/Wo) increases steadily from near-zero change in 2021–2040 to +6.9% by 2061–2080, with flood-season flow (Qflood/Wflood) also rising consistently from +2.0% to +6.9%. Dry-season flow (Qdry) grows moderately, while storage (Wdry) remains negative (−27.7% to −13.1%). SSP2-4.5, despite being a medium-emission scenario, shows smaller changes in both mean and flood-season flows—Qo/Wo stays below +2% until late century and Qflood/Wflood peaks at only +4.5% mid-century—while severe dry-season storage deficits persist (−29.5% to −24.4%). This weaker response may be linked to the spatial–temporal distribution of projected rainfall in the region under SSP2-4.5, where mid-century warming does not significantly enhance wet-season precipitation but prolongs moderate dry-season deficits, limiting runoff gains. In contrast, SSP5-8.5 projects strong late-century increases in mean flows (+7.5%) and flood peaks (+8.2%), though early-century flood-season flows decline (−2.1%). Notably, SSP5-8.5 yields the largest mid-century dry-season recovery, with Qdry up to +25.7% and a brief storage surplus (+1.4%), before moderate deficits return by 2080. Overall, SSP1-2.6 and SSP5-8.5 suggest higher long-term flow and flood potential than SSP2-4.5, which exhibits a muted hydrological response despite higher emissions than SSP1-2.6.
With the 20th percentile from CMIP6 models, the potential changes in hydrological characteristics indicate that under SSP1-2.6, mean annual discharge and flood-season flows steadily increase (up to +3.7% by 2061–2080), while storage deficits persist at around −15.1%. Under SSP2-4.5, changes remain small, with flood peaks limited to +3.7% in mid-century, but severe dry-season deficits continue at about −25.4%. In contrast, SSP5-8.5 projects strong late-century increases in mean flows (+6.8%) and flood peaks (+6.9%).
At the 80th percentile from CMIP6 models, the results show that mean annual discharge steadily increases by nearly 10% by 2061–2080 under SSP1-2.6. However, storage during the dry season shows sharp deficits of up to −27.1% under SSP2-4.5, while flood peaks are limited to nearly +10% under SSP5-8.5 by the end of the century.
It is especially noted that using HEC-HMS with QDM-adjusted daily rainfall data from CMIP6 projections presents several methodological limitations and uncertainties, particularly when applied under future climate scenarios such as those represented by the Shared Socioeconomic Pathways (SSPs). Firstly, although QDM is widely adopted for its ability to preserve the statistical distribution of climate variables, it may not adequately adjust for extreme precipitation values, potentially leading to significant errors in peak flow estimations (Xavier et al., 2022) [29]. Moreover, HEC-HMS often struggles to accurately represent nonlinear rainfall-runoff processes, which can become more pronounced under non-stationary climate conditions (Mendoza et al., 2015) [36]. In addition, missing or incomplete input data, especially in historical discharge records, can compromise model calibration and result in unreliable streamflow projections. Another critical concern is the model’s inherent assumption of stationarity, which assumes that past hydrological relationships remain valid under future climatic regimes—an assumption increasingly challenged by climate change evidence (Milly et al., 2008) [37]. Furthermore, while QDM corrects for distributional biases in climate model outputs, it may also introduce errors dealing with regions with complex topography or land–atmosphere interactions (Li & Li, 2025) [38]. The sensitivity of HEC-HMS to parameterization adds another layer of uncertainty, as parameters calibrated under historical conditions may not perform reliably when extrapolated to future climates. Additionally, limitations in the spatial and temporal resolution of downscaled data can impair the model’s ability to resolve fine-scale hydrological responses, particularly in heterogeneous areas. To solve this, the study attempts application of multiple CMIP6 models and bias correction techniques for projecting changes in hydrological characteristics.
The projected changes in streamflow to the Ban Chat reservoir are broadly consistent with studies conducted in catchments across Southeast Asia to some extent. For example, the upper Red River and Mekong sub-basins have also shown changes in streamflow under the impacts of reservoir operation and climate change. Hoang et al. (2019) [39] showed that annual flow changes (−3% to +15%) are mainly due to irrigation and climate change, while hydropower alters seasonal flows most strongly (+70% dry, −15% wet). Only using five CMIP3 models, Lauri et al. (2012) [40] showed that the projected discharge change at Kratie (Cambodia) from 1982–1992 to 2032–2042 ranges from −11% to +15% in the wet season and −10% to +13% in the dry season. With 8 CMIP5 models, Nepal et al. (2021) [41] showed that future mean discharge and high flows are very likely to rise, mainly due to more frequent precipitation extremes in the Himalayan catchments. Compared with these larger transboundary basins, the Ban Chat catchment presents unique challenges. Its steep terrain and limited storage capacity amplify runoff responses, making even moderate increases in flood-season rainfall translate into disproportionately higher flood peaks. At the same time, the reservoir is a critical component of the Da River cascade, meaning that shifts in its inflow regime have cascading effects on downstream reservoirs such as Huoi Quang and Son La. While Himalayan catchments also face climate-induced flood and drought risks, their larger storage volumes provide greater buffering capacity compared to Ban Chat (Immerzeel et al., 2013) [42].
It is noteworthy that although this study employed nine state-of-the-art CMIP6 models with Quantile Delta Mapping (QDM), certain limitations remain beyond those associated with the bias correction method including (i) the use of nine CMIP6 GCMs, while comprehensive, may still not capture the full uncertainty range of climate projections; (ii) the hydrological simulations were performed using HEC-HMS with lumped/basin-scale parameters, which may not fully represent local hydrological heterogeneity in the steep mountainous terrain of the Ban Chat catchment; (iii) the study did not incorporate land-use change or socio-economic development factors, which may also influence future hydrological regimes; and especially, (iv) the rainfall station employed in this study is from a considerable distance of the Nam Mu basin and may not fully capture the spatial variability of precipitation within the basin, particularly given the complex topography of the region. This limitation could affect the reliability of the results, and the study also acknowledges that the limited density of rainfall stations within the basin remains a key point. Besides that, uncertainty may exist when using a fixed set of calibrated HEC-HMS parameters to project streamflow under SSPs, since parameters derived from historical climate conditions may not fully represent future hydrological processes. Moreover, the equifinality issue and potential non-stationarity of watershed responses under changing climate can further amplify projection errors. So, the study suggests (1) expanding the analysis with regional climate models (RCMs) or high-resolution downscaling to better capture local climate dynamics, (2) integrating land-use/land-cover change and socio-economic development scenarios into hydrological modeling for a more holistic assessment, (3) applying multi-model hydrological ensembles and coupling with reservoir operation models to evaluate adaptive management strategies under uncertainty, (4) extending the assessment to cumulative impacts across the entire Da River cascade to understand system-wide implications for hydropower and water resources, and (5) complementing the station data with multiple gridded rainfall products (e.g., Global Satellite Mapping of Precipitation or Multi-Source Weighted-Ensemble Precipitation) thereby improving spatial representativeness as well as setting up more weather stations.

4. Conclusions

This study assessed the impacts of climate change on streamflow to the Ban Chat reservoir by applying nine CMIP6 Global Climate Models under three Shared Socioeconomic Pathways (SSP1-2.6, SSP2-4.5, and SSP5-8.5). Future climate projections were bias-corrected using the Quantile Delta Mapping (QDM) method and subsequently drove the HEC-HMS hydrological model to simulate inflows during the near-, mid-, and late-21st century compared with the baseline period 1995–2014.
The results reveal that mean annual flows and flood-season discharges generally increase under SSP1-2.6 and SSP5-8.5, with late-century changes reaching +6.9% and +7.5%, respectively. In contrast, SSP2-4.5 shows smaller changes, with flood peaks remaining below +5%. Importantly, persistent reductions in dry-season storage (−27% to −24%) are projected across scenarios, suggesting heightened risks to hydropower generation reliability and water supply. These findings highlight the dual challenge of increasing flood risks during wet periods and water shortages during the dry season.
The reasons behind these changes are linked to the intensification of the regional monsoon system and increased rainfall variability under climate change. Higher summer precipitation amplifies flood peaks, while prolonged dry spells in winter and spring reduce baseflows and reservoir storage. This seasonal imbalance underscores the vulnerability of mountainous catchments like Ban Chat, where steep topography magnifies runoff response and storage capacity is limited.
Based on these findings, the study suggests that (1) reservoir operation rules should be considered to account for extreme flood peaks under high-emission scenarios, with emphasis on enhancing early warning and flood routing capacity; (2) measures to address dry-season shortages such as improving water-use efficiency, promoting demand-side management should be prioritized; (3) climate change projections should be systematically integrated into long-term hydropower planning, ensuring that energy production remains stable under uncertain future inflows; and (4) further research combining hydrological modeling and machine learning technology with socio-economic assessments is needed to support adaptive water governance in the Da River basin.

Author Contributions

Conceptualization, T.K.T., N.T.T., N.H.S. and V.T.M.H.; methodology, T.K.T., N.T.T. and N.H.S.; software, N.T.T. and N.H.S.; validation, T.K.T., N.T.T. and N.H.S.; formal analysis, T.K.T., N.T.T., N.H.S. and V.T.M.H.; investigation, T.K.T., N.T.T., N.H.S. and V.T.M.H.; data curation T.K.T., N.T.T., N.H.S. and V.T.M.H.; writing—original draft preparation, N.T.T.; writing—review and editing, T.K.T., N.T.T., N.H.S. and V.T.M.H.; visualization, T.K.T., N.T.T., N.H.S. and V.T.M.H. All authors have read and agreed to the published version of the manuscript.

Funding

This study is supported by the Vietnam Ministry of Science and Technology (MOST) titled “Development and impact evaluation of probable maximum precipitation and probable maximum flood scenarios on large reservoirs in the Da River basin using integrated hydro-meteorological models and dynamic shifting algorithms of atmospheric conditions”. Code ĐTĐL.CN-51/22.

Institutional Review Board Statement

Not applicable.

Informed Consent Statement

Not applicable.

Data Availability Statement

The authors confirm that the data supporting the findings of this study are from the project with code ĐTĐL.CN-51/22. The observed rainfall data was provided by The National Center for Hydrometeorological Forecasting of Vietnam. The data presented in this study are available upon request from the corresponding author. The data are not publicly available due to privacy considerations.

Conflicts of Interest

The authors declare no conflicts of interest.

References

  1. IPCC AR4 WG1; Solomon, S.; Qin, D.; Manning, M.; Chen, Z.; Marquis, M.; Averyt, K.B.; Tignor, M.; Miller, H.L. (Eds.) Climate Change 2007: The Physical Science Basis, Contribution of Working Group I to the Fourth Assessment Report of the Intergovernmental Panel on Climate Change; Cambridge University Press: Cambridge, UK, 2007; ISBN 978-0-521-88009-1. [Google Scholar]
  2. IPCC AR5. Climate Change 2014: Synthesis Report. Contribution of Working Groups I, II and III to the Fifth Assessment Report of the Intergovernmental Panel on Climate Change; Core Writing Team, Pachauri, R.K., Meyer, L.A., Eds.; IPCC: Geneva, Switzerland, 2013; p. 151. [Google Scholar]
  3. IPCC AR6; Masson-Delmotte, V.; Zhai, P.; Pirani, A.; Connors, S.L.; Péan, C.; Berger, S.; Huang, M.; Yelekçi, O.; Zhou, B.; et al. Climate change 2021: The physical science basis. In Contribution of Working Group I to the Sixth Assessment Report of the Intergovernmental Panel on Climate Change; Cambridge University Press: Cambridge, UK, 2021. [Google Scholar]
  4. Pachauri, R.K.; Allen, M.R.; Barros, V.R.; Broome, J.; Cramer, W.; Christ, R.; Church, J.A.; Clarke, L.; Dahe, Q.; Dasgupta, P.; et al. Climate change 2014: Synthesis report. In Contribution of Working Groups I, II and III to the Fifth Assessment Report of the Intergovernmental Panel on Climate Change; IPCC: Geneva, Switzerland, 2014; p. 151. [Google Scholar]
  5. Arns, S.; Hellmig, M. Effects of Heavy Rainfall on Construction-Related Infrastructure. In Federal Institute for Research on Building; Urban Affairs and Spatial Development (BBSR): Berlin, Germany, 2018. [Google Scholar]
  6. Do, V.Q.; Phung, M.L.; Truong, D.T.; Pham, T.T.T.; Dang, V.T.; Nguyen, T.K. The impact of extreme events and climate change on agricultural and fishery enterprises in Central Vietnam. Sustainability 2021, 13, 7121. [Google Scholar] [CrossRef]
  7. Tahara, R.; Hiraga, Y.; Kazama, S. Climate change effects on the localized heavy rainfall event in northern Japan in 2022: Uncertainties in a pseudo-global warming approach. Atmos. Res. 2025, 314, 107780. [Google Scholar] [CrossRef]
  8. Tayyeh, H.K.; Mohammed, R. Vulnerability and resilience of hydropower generation under climate change scenarios: Haditha dam reservoir case study. Appl. Energy 2024, 366, 123308. [Google Scholar] [CrossRef]
  9. Elgendy, M.; Hassini, S.; Coulibaly, P. Review of climate change adaptation strategies in water management. J. Hydrol. Eng. 2024, 29, 03123001. [Google Scholar] [CrossRef]
  10. Chaves, H.M.L.; da Silva, C.C.; Fonseca, M.R.S. Reservoir reliability as affected by climate change and strategies for adaptation. Water 2023, 15, 2323. [Google Scholar] [CrossRef]
  11. Ngo, L.A.; Masih, I.; Jiang, Y.; Douven, W. Impact of reservoir operation and climate change on the hydrological regime of the Sesan and Srepok Rivers in the Lower Mekong Basin. Clim. Change 2018, 149, 107–119. [Google Scholar] [CrossRef]
  12. Sun, Z.; Xiang, F.; Chu, X. Assessing the impacts of reservoir operation on downstream water diversions using a simplified flow model. Hydrol. Sci. J. 2019, 64, 1488–1503. [Google Scholar] [CrossRef]
  13. Nguyen, T.T.; Nguyen, T.S.; Nguyen, D.M. Performance of Hourly Rainfall Simulations using WRF Meteorological Model for Calculation of Streamflow to Ta Trach Reservoir During 2020 Flood Season. VNU J. Sci. Earth Environ. Sci. 2023, 39, 42–52. [Google Scholar] [CrossRef]
  14. Hai, B.T.; Son, L.V. Research on the application of IFAS model and remote sensing data in simulating transboundary flood flows in the Thao river basin. J. Hydrometeorol. 2020, 24–36. [Google Scholar] [CrossRef]
  15. Boucher, O.; Servonnat, J.; Albright, A.L.; Aumont, O.; Balkanski, Y.; Bastrikov, V.; Bekki, S.; Bonnet, R.; Bony, S.; Bopp, L.; et al. Presentation and evaluation of the IPSL-CM6A-LR climate model. J. Adv. Model. Earth Syst. 2020, 12, e2019MS002010. [Google Scholar] [CrossRef]
  16. Giorgetta, M.A.; Jungclaus, J.; Reick, C.H.; Legutke, S.; Bader, J.; Böttinger, M.; Brovkin, V.; Crueger, T.; Esch, M.; Fieg, K.; et al. Climate and carbon cycle changes from 1850 to 2100 in MPI-ESM simulations for the Coupled Model Intercomparison Project phase 5. J. Adv. Model. Earth Syst. 2013, 5, 572–597. [Google Scholar] [CrossRef]
  17. Mauritsen, T.; Bader, J.; Becker, T.; Behrens, J.; Bittner, M.; Brokopf, R.; Brovkin, V.; Claussen, M.; Crueger, T.; Esch, M.; et al. Developments in the MPI-M Earth System Model version 1.2 (MPI-ESM1. 2) and its response to increasing CO2. J. Adv. Model. Earth Syst. 2019, 11, 998–1038. [Google Scholar] [CrossRef] [PubMed]
  18. Yukimoto, S.; Kawai, H.; Koshiro, T.; Oshima, N.; Yoshida, K.; Urakawa, S.; Tsujino, H.; Deushi, M.; Tanaka, T.; Hosaka, M.; et al. The Meteorological Research Institute Earth System Model version 2.0, MRI-ESM2. 0: Description and basic evaluation of the physical component. J. Meteorol. Soc. Jpn. Ser. II 2019, 97, 931–965. [Google Scholar] [CrossRef]
  19. Tatebe, H.; Ogura, T.; Nitta, T.; Komuro, Y.; Ogochi, K.; Takemura, T.; Sudo, K.; Sekiguchi, M.; Abe, M.; Saito, F.; et al. Description and basic evaluation of simulated mean state, internal variability, and climate sensitivity in MIROC6. Geosci. Model Dev. 2019, 12, 2727–2765. [Google Scholar] [CrossRef]
  20. Seland, Ø.; Bentsen, M.; Seland Graff, L.; Olivié, D.; Toniazzo, T.; Gjermundsen, A.; Debernard, J.B.; Gupta, A.K.; He, Y.-C.; Kirkevåg, A.; et al. The Norwegian Earth system model, NorESM2–evaluation of theCMIP6 DECK and historical simulations. Geosci. Model Dev. Discuss. 2020, 2020, 1–68. [Google Scholar]
  21. Wu, Z.; Shen, C.; Van Den Hengel, A. Wider or deeper: Revisiting the resnet model for visual recognition. Pattern Recog. 2019, 90, 119–133. [Google Scholar] [CrossRef]
  22. Cherchi, A.; Fogli, P.G.; Lovato, T.; Peano, D.; Iovino, D.; Gualdi, S.; Masina, S.; Scoccimarro, E.; Materia, S.; Bellucci, A.; et al. Global mean climate and main patterns of variability in the CMCC-CM2 coupled model. J. Adv. Model. Earth Syst. 2018, 11, 185–209. [Google Scholar] [CrossRef]
  23. Voldoire, A.; Saint-Martin, D.; Sénési, S.; Decharme, B.; Alias, A.; Chevallier, M.; Colin, J.; Guérémy, J.-F.; Michou, M.; Moine, M.-P.; et al. Evaluation of CMIP6 deck experiments with CNRM-CM6-1. J. Adv. Model. Earth Syst. 2019, 11, 2177–2213. [Google Scholar] [CrossRef]
  24. Williams, B.; Mancia, G.; Spiering, W.; Agabiti Rosei, E.; Azizi, M.; Burnier, M.; Clement, D.L.; Coca, A.; de Simone, G.; Dominiczak, A.; et al. 2018 ESC/ESH Guidelines for the management of arterial hypertension: The Task Force for the management of arterial hypertension of the European Society of Cardiology (ESC) and the European Society of Hypertension (ESH). Eur. Heart J. 2018, 39, 3021–3104. [Google Scholar] [CrossRef]
  25. Schmidli, J.; Frei, C.; Vidale, P.L. Downscaling from GCM precipitation: A benchmark for dynamical and statistical downscaling methods. Int. J. Climatol. J. R. Meteorol. Soc. 2006, 26, 679–689. [Google Scholar] [CrossRef]
  26. Teutschbein, C.; Seibert, J. Bias correction of regional climate model simulations for hydrological climate-change impact studies: Review and evaluation of different methods. J. Hydrol. 2012, 456–457, 12–29. [Google Scholar] [CrossRef]
  27. Themeßl, M.J.; Gobiet, A.; Heinrich, G. Empirical-statistical downscaling and error correction of regional climate models and its impact on the climate change signal. Clim. Change 2012, 112, 449–468. [Google Scholar] [CrossRef]
  28. Cannon, A.J.; Sobie, S.R.; Murdock, T.Q. Bias correction of GCM precipitation by quantile mapping: How well do methods preserve changes in quantiles and extremes? J. Clim. 2015, 28, 6938–6959. [Google Scholar] [CrossRef]
  29. Xavier, A.C.F.; Martins, L.L.; Rudke, A.P.; de Morais, M.V.B.; Martins, J.A.; Blain, G.C. Evaluation of Quantile Delta Mapping as a bias-correction method in maximum rainfall dataset from downscaled models in São Paulo state (Brazil). Int. J. Clim. 2022, 42, 175–190. [Google Scholar] [CrossRef]
  30. Moriasi, D.N.; Arnold, J.G.; van Liew, M.W.; Bingner, R.L.; Harmel, R.D.; Veith, T.L. Model evaluation guidelines for systematic quantification of accuracy in watershed simulations. Trans. ASABE 2007, 50, 885–900. [Google Scholar] [CrossRef]
  31. Willmott, C.J. On the evaluation of model performance in physical geography. In Spatial Statistics and Models; Springer: Dordrecht, The Netherlands, 1984; pp. 443–460. [Google Scholar]
  32. Legates, D.R.; McCabe, G.J., Jr. Evaluating the use of “goodness-of-fit” measures in hydrologic and hydroclimatic model validation. Water Resour. Res. 1999, 35, 233–241. [Google Scholar] [CrossRef]
  33. Gupta, H.V.; Sorooshian, S.; Yapo, P.O. Status of automatic calibration for hydrologic models: Comparison with multilevel expert calibration. J. Hydrol. Eng. 1999, 4, 135–143. [Google Scholar] [CrossRef]
  34. Knoben, W.J.; Freer, J.E.; Woods, R.A. Inherent benchmark or not? Comparing Nash–Sutcliffe and Kling–Gupta efficiency scores. Hydrol. Earth Syst. Sci. 2019, 23, 4323–4331. [Google Scholar] [CrossRef]
  35. Nash, J.E.; Sutcliffe, J.V. River flow forecasting through conceptual models part I—A discussion of principles. J. Hydrol. 1970, 10, 282–290. [Google Scholar] [CrossRef]
  36. Mendoza, P.A.; Clark, M.P.; Barlage, M.; Rajagopalan, B.; Samaniego, L.; Abramowitz, G.; Gupta, H. Are we unnecessarily constraining the agility of complex process-based models? Water Resour. Res. 2015, 51, 716–728. [Google Scholar] [CrossRef]
  37. Milly, P.C.; Betancourt, J.; Falkenmark, M.; Hirsch, R.M.; Kundzewicz, Z.W.; Lettenmaier, D.P.; Stouffer, R.J. Stationarity is dead: Whither water management? Science 2008, 319, 573–574. [Google Scholar] [CrossRef] [PubMed]
  38. Li, X.; Li, Z. Assessment of bias correction methods for high resolution daily precipitation projections with CMIP6 models: A Canadian case study. J. Hydrol. Reg. Stud. 2025, 58, 102223. [Google Scholar] [CrossRef]
  39. Hoang, L.P.; Lauri, H.; Kummu, M.; Koponen, J.; van Vliet, M.T.; Supit, I.; Hoanh, C.T. Mekong River flow and hydropower development in the context of climate change. J. Hydrol. Reg. Stud. 2019, 25, 100624. [Google Scholar]
  40. Lauri, H.; De Moel, H.; Ward, P.J.; Räsänen, T.A.; Keskinen, M.; Kummu, M. Future changes in Mekong River hydrology: Impact of climate change and reservoir operation on discharge. Hydrol. Earth Syst. Sci. 2012, 16, 4603–4619. [Google Scholar] [CrossRef]
  41. Nepal, S.; Shrestha, A.B.; Shrestha, M. Future hydrological extremes in the Upper Indus, Ganges, and Brahmaputra River basins. Clim. Change 2021, 165, 1–20. [Google Scholar]
  42. Immerzeel, W.W.; Van Beek, L.P.; Bierkens, M.F. Climate change will affect the Asian water towers. Science 2013, 328, 1382–1385. [Google Scholar] [CrossRef] [PubMed]
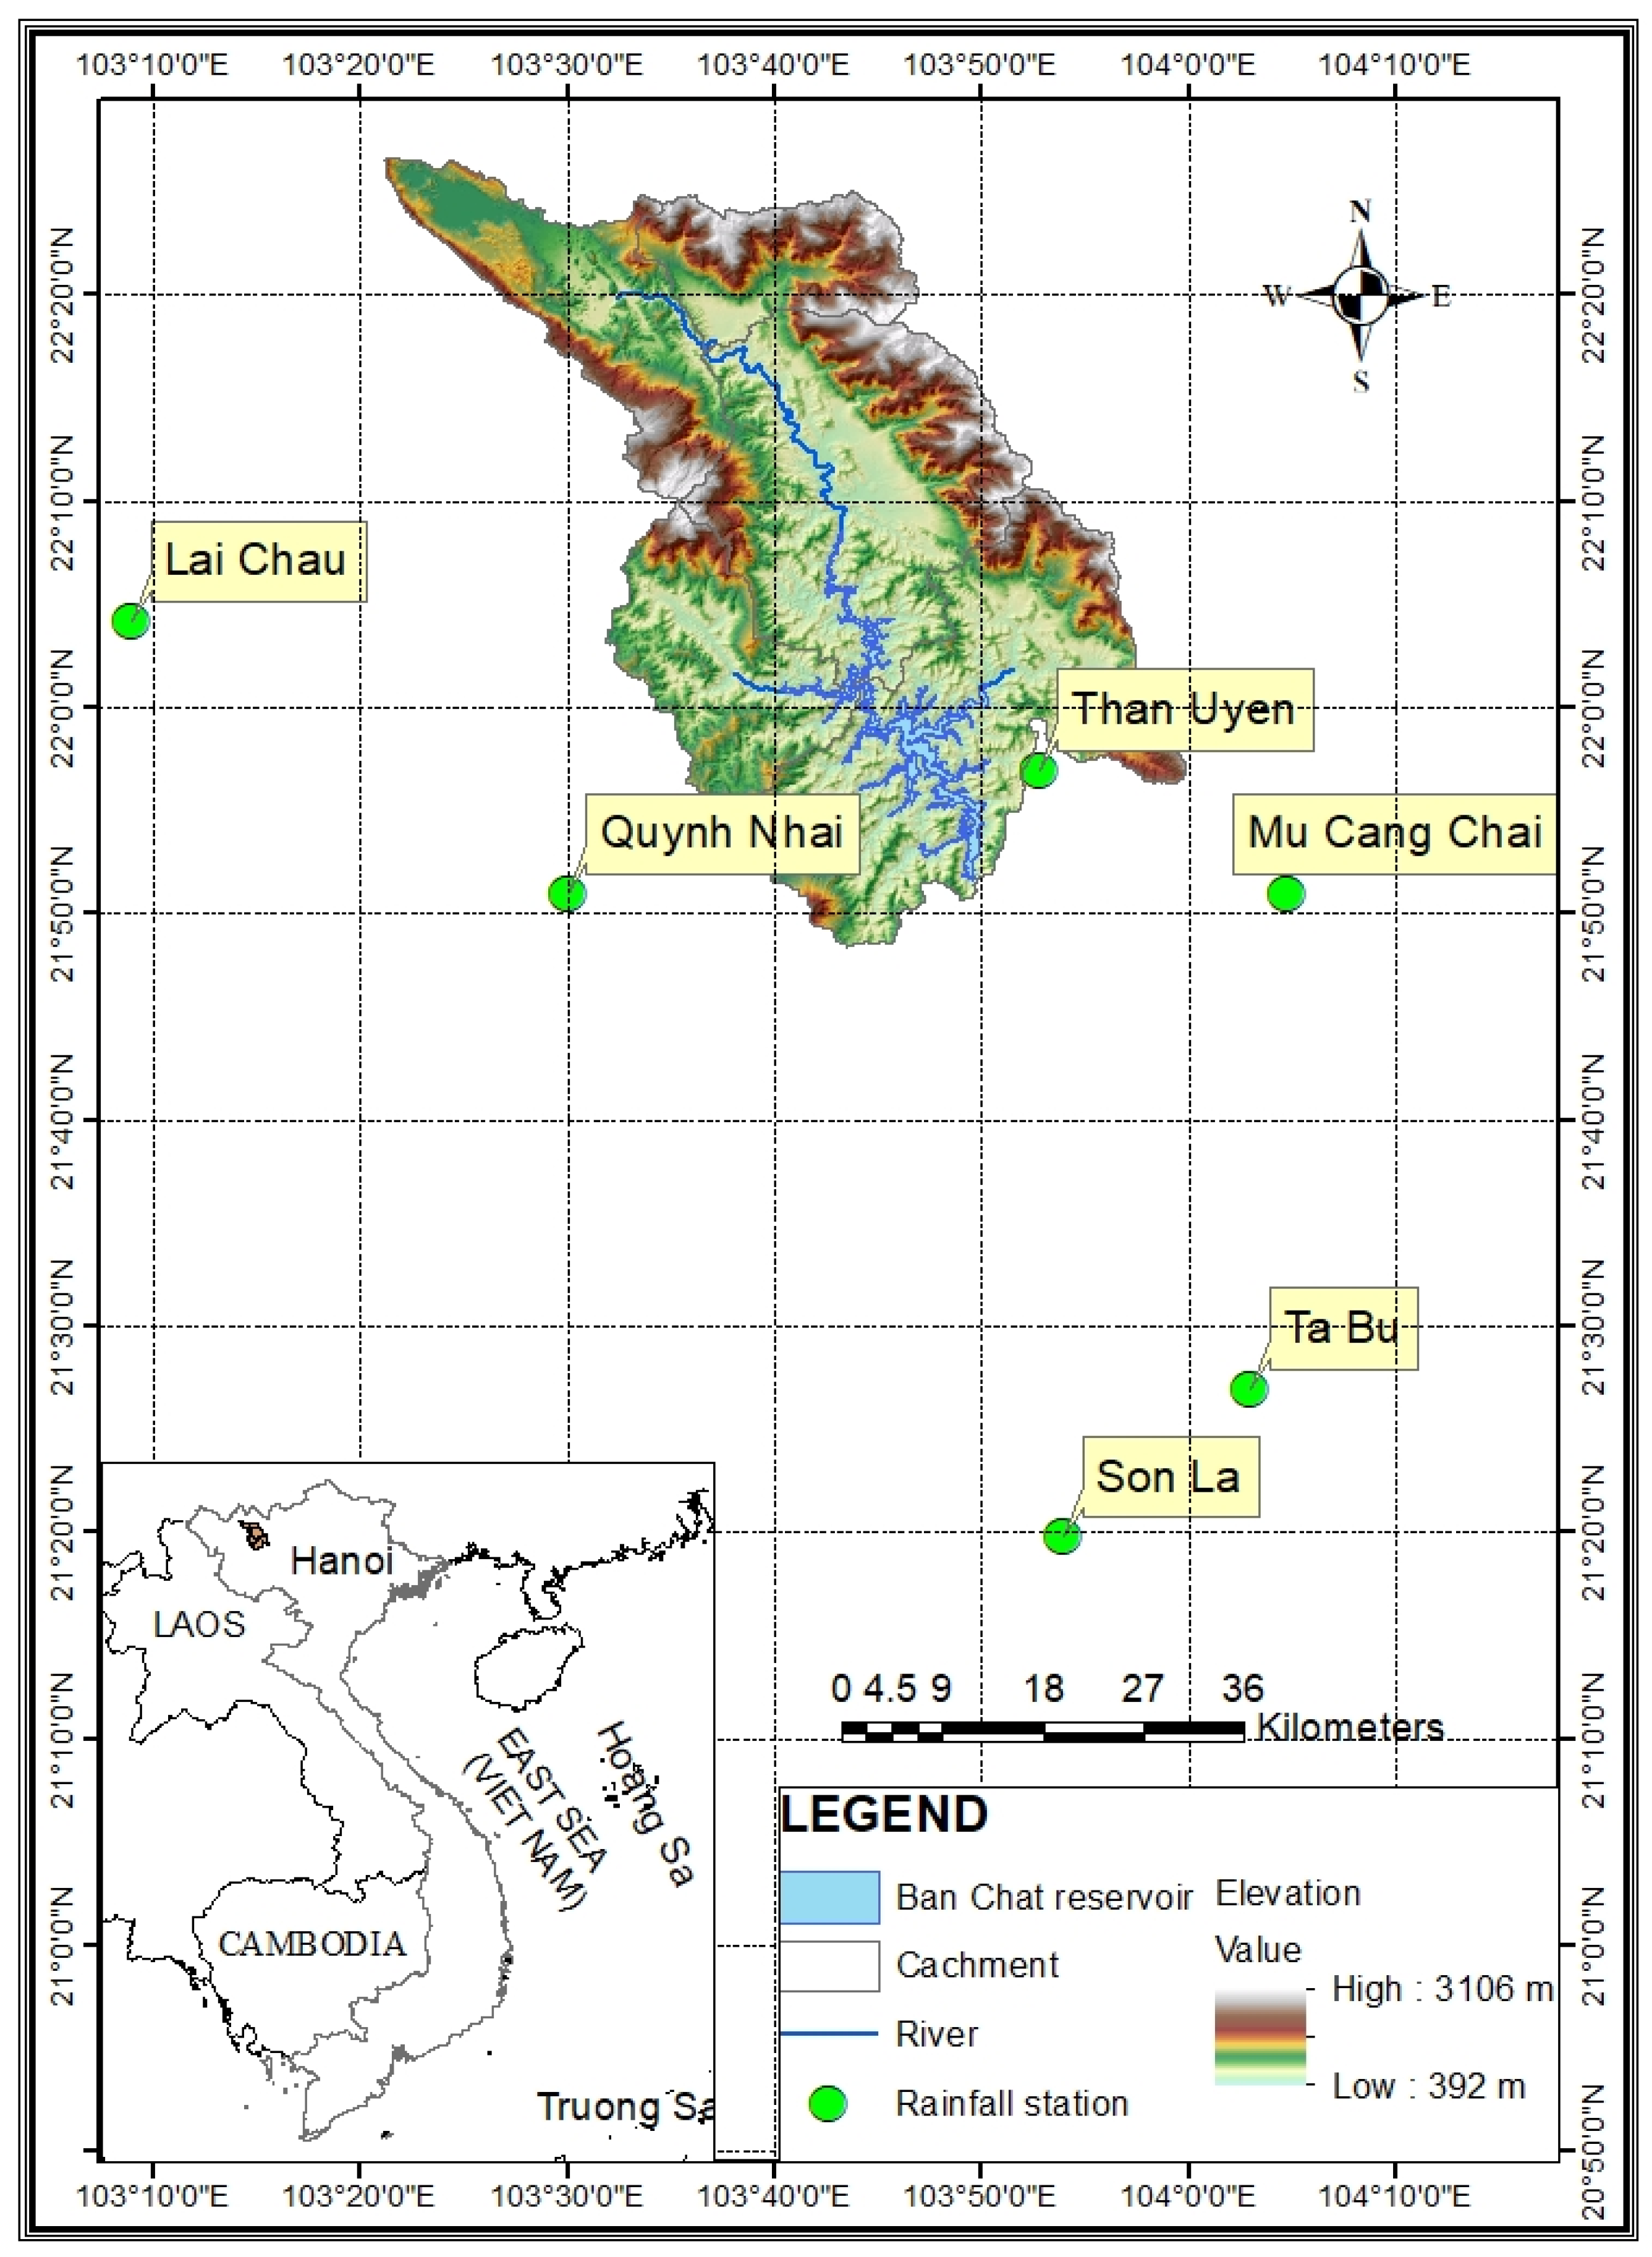
Figure 1. The study area.
Atmosphere 16 01054 g001
Figure 2. RMSE (a) and NSE (b) boxplots before and after QDM correction.
Atmosphere 16 01054 g002
Figure 3. Sub-basin of the Ban Chat reservoir in the HEC-HMS model.
Atmosphere 16 01054 g003
Figure 4. HEC-HMS performance for streamflow simulations at the BCD for the calibration of the flood event (a) in 2023 and the validation of the flood events (b,c) in 2024.
Atmosphere 16 01054 g004
Figure 5. Changes in streamflow under scenarios of SSP1-2.6 (a), SSP2-4.5 (b), and SSP5-8.5 (c) at the BCD from CMIP6 Models.
Atmosphere 16 01054 g005
Table 1. Spatio-temporal resolution of CMIP6 models.
ModelAbbreviationSpatial Resolution (°)Grid Size (km)Temporal Resolution
IPSL-CM6A-LRIPS~2.5° × 1.3°~250 kmDaily
MPI-ESM1-2-LRMPI~1.9° × 1.9°~200 kmDaily
MRI-ESM2-0MRI~1.1° × 1.1°~110 kmDaily
MIROC6MIR~1.4° × 1.4°~140 kmDaily
NorESM2-MMNOR~1.9° × 1.9°~200 kmDaily
BCC-CSM2-MRBCC~1.1° × 1.1°~110 kmDaily
CMCC-ESM2CMC~1.0° × 1.0°~100 kmDaily
CNRM-CM6-1-HRCNR~0.5° × 0.5°~50 kmDaily
HadGEM3-GC31-MMHAD~0.83° × 0.56°~60–90 kmDaily
Table 2. Model performance metric.
MetricRangAdvantagesDisadvantagesReference
R2 (Coefficient of Determination)[0, 1]
(perfect = 1)
Simple interpretation, widely used.Insensitive to systematic bias.[30]
RMSE (Root Mean Square Error)[0, ∞)
(Perfect = 0)
Penalizes large deviations.Sensitive to outliers.[31]
MAE (Mean Absolute Error)[0, ∞)
(Perfect = 0)
Easy to interpret, less sensitive to outliers than RMSE.Does not reflect error direction.[32]
PBIAS (Percent Bias)(–∞, ∞)
(Perfect = 0)
Useful for assessing systematic bias.Sensitive to extreme values and skewed distributions.[33]
KGE (Kling-Gupta Efficiency)[–∞, 1]
(Perfect = 1)
Comprehensive performance evaluation.Requires careful interpretation of components.[34]
NSE (Nash–Sutcliffe Efficiency)(–∞, 1]
(Perfect = 1)
Widely used in hydrology.Sensitive to extreme values.[35]
Table 3. Statistical indices for QDM performance at the median.
IndicesMAEPBIASKGE
Station With QDMWithout QDMWith QDMWithout QDMWith QDMWithout QDM
Lai Chau8.268.18−5.51−14.890.150.07
Mu Cang Chai6.326.53−4.395.130.150.13
Ta Bu5.496.1810.9734.070.120.04
Son La5.656.80−0.9734.070.110.04
Than Uyen7.197.22−7.22−4.170.120.10
Quynh Nhai7.056.277.43−16.560.120.02
Table 4. Changes in hydrological characteristics at the BCD under SSP1-2.6.
SSP1-2.6Qo
(m3/s)
Wo
(106 m3)
Qflood
(m3/s)
Wflood
(106 m3)
Qdry
(m3/s)
Wdry
(106 m3)
Baseline131.74155.8208.92761.869.51628.1
2021–2040131.74156.5213.22818.170.91274.7
2041–2060139.74407.7224.22963.278.71390.5
2061–2080141.54464.6224.32965.080.41439.5
Table 5. Changes in hydrological characteristics at the BCD under SSP2-4.5.
SSP2-4.5Qo
(m3/s)
Wo
(106 m3)
Qflood
(m3/s)
Wflood
(106 m3)
Qdry
(m3/s)
Wdry
(106 m3)
Baseline131.74155.8208.92761.869.51628.1
2021–2040129.84095.2210.72785.370.51257.4
2041–2060133.34207.6218.82891.871.01266.5
2061–2080133.84221.8216.52861.973.71309.2
Table 6. Changes in hydrological characteristics at the BCD under SSP5-8.5.
SSP5-8.5Qo
(m3/s)
Wo
(106 m3)
Qflood
(m3/s)
Wflood
(106 m3)
Qdry
(m3/s)
Wdry
(106 m3)
Baseline131.74155.8208.92761.869.51628.1
2021–2040132.14167.4204.72706.278.41408.2
2041–2060139.04387.4202.12671.993.51651.7
2061–2080142.34491.9227.63008.479.81423.6
Disclaimer/Publisher’s Note: The statements, opinions and data contained in all publications are solely those of the individual author(s) and contributor(s) and not of MDPI and/or the editor(s). MDPI and/or the editor(s) disclaim responsibility for any injury to people or property resulting from any ideas, methods, instructions or products referred to in the content.