Abstract
The Qinghai-Tibet Plateau (QTP) is uniquely characterized by widespread permafrost and desertification due to its distinctive natural environment and geographic setting. The current lack of understanding regarding the mechanisms by which the number of freeze-thaw cycles (N) exacerbates soil erosion poses a significant challenge to accurately assessing regional erosion dynamics. Here, we simulate realistic freeze-thaw conditions using an optimized cryogenic simulator and systematically quantify changes in soil physical properties, surface microstructure, and frost heave deformation. Research shows that as the number of freeze-thaw cycles rises, the surface soil moisture content decreases by 54.3%. Total porosity and bulk density display opposite trends. These changes in soil properties are mainly driven by frost heave forces disrupting soil cohesion. In particular, repeated water-ice phase transitions lead to continuous accumulation of axial frost heave stress, which rearranges soil particles. This significantly raises surface porosity with a growth rate as high as 60.3% and greatly reduces the soil’s resistance to external erosion. At the same time, the aggregate size distribution shifts toward finer particles, accompanied by a continued decrease in the mean weight diameter (MWD), which declines by approximately 8%. Notably, this degradation persists even when external loading partially suppresses frost heave. Therefore, the progressive physical degradation induced by frost heave-manifested through as moisture loss, porosity changes, aggregate breakdown, and compromised stability even under load-establishes the core mechanistic pathway through which freeze-thaw cycles intensify erosion in QTP soils.
1. Introduction
The Tibetan Plateau, renowned as Asia’s ‘Water Tower’ and Earth’s ‘Third Pole’, represents one of our planet’s most exceptional geosystems. Its unique properties establish an unparalleled natural laboratory for investigating Earth–life coevolution and multi-sphere interactions [1,2,3]. Critically, climate-driven permafrost degradation across the Plateau now accelerates extensive freeze–thaw cycling, triggering cascading geomorphic disruptions through soil structural breakdown [4,5]. Central to these impacts is the unquantified mechanistic nexus that although cryogenic processes demonstrably prime soils for accelerated erosion by compromising structural integrity, the fundamental physics governing phase-transition-derived stresses and their erosion-enhancing effects remain unresolved. This knowledge gap obstructs the prediction of the following consequent environmental threats: diminished agricultural resilience, infrastructure destabilization, ecosystem reorganization, and compromised sustainable development critically linked to cryo-erosion synergies documented across Eurasia [6,7,8,9,10]. Our work directly addresses this imperative by deciphering the granular-scale mechanics of freeze–thaw erosion, establishing the missing mechanistic bridge between cryogenic forcing and sediment mobilization under climate change.
While research on freeze–thaw cycle interactions with soil erosion invariably addresses physicochemical property changes, such transformations remain fundamentally constrained by soil texture [11]. Crucially, prevailing studies exhibit the following significant mechanistic disconnect: though freeze–thaw processes predominantly drive surface-layer dynamics through water–heat coupling—where phase transitions, moisture migration, and redistribution induce profound soil moisture reorganization—investigations remain disproportionately focused on isolated structural diagnostics [12,13]. Most researchers have prioritized surface characterization via SEM (scanning electron microscopy), CT (computed tomography), MIP (mercury intrusion porosimetry), and NMR (nuclear magnetic resonance) techniques, neglecting systematic integration with erosion mechanics [14,15,16]. This fragmentation persists despite evidence that elevated soil moisture intensifies freeze–thaw disruption, leading to paradoxical increases in both bulk density and porosity [17].
CT visualizes 3D pore networks for water migration paths, MIP/NMR characterize pore distribution changes, and SEM maps microcrack evolution. These research techniques offer higher resolution, enabling better visualization of internal pore networks. Considering trade-offs in structural insight and balancing analytical depth, selecting simpler imaging techniques ensures sample integrity is preserved, making them valuable complementary tools to more advanced methods. Currently, this study focuses more on changes in the surface structure of frozen and thawed soil, and the direct measurement method is simpler. In soft soils, pore geometry alterations enhance permeability while degrading shear strength. Soil aggregates—key determinants of structural stability—directly modulate erodibility [18,19]. Yet the causal chain linking freeze–thaw microstructural evolution to macroscale erosion susceptibility remains uncharted territory.
At present, alterations in the stability of soil aggregates are predominantly manifested as changes in soil structure, initial water content, and the degree of freezing and thawing [20,21]. The impact of soil structure is evident in enhanced mechanical strength, impermeability, and soil water retention capacity [22,23]. Furthermore, the effects of freezing and thawing on soil aggregates have been demonstrated to vary according to particle size. In loamy and fine sandy loam soils with high aggregate content the quantity of aggregates exceeding 4.75 mm in diameter decreased, while the quantity of aggregates measuring less than 0.5 mm increased from 19% to 70% [24]. A reduction in soil strength has been demonstrated as a consequence of freeze–thaw cycling, as evidenced by studies of soil physical properties [25].
Some studies have shifted their focus from surface structure to the study of soil axial changes, including freeze–thaw volume, freeze–thaw pressure, and freeze–thaw rate [26]. However, existing studies have grossly neglected how these properties regulate erosion pathways. Similarly, studies recognize that freeze–thaw deterioration depends on cycle frequency and initial humidity, but fail to quantify their combined effect on erosion thresholds [24].
While empirical studies confirm that external loading suppresses frost heave magnitude and kinetics during freezing and its stabilizing role extends to slope engineering scenarios, the fundamental mechanisms through which load constraints modulate freeze–thaw erosion processes remain unresolved [27,28,29,30]. Addressing freeze–thaw erosion requires a hierarchical analysis of first identifying key drivers via controlled decoupling experiments and then establishing the mechanistic link between freeze–thaw deformation and erosion susceptibility: a systematic approach essential for accurately predicting desertification risk on the Tibetan Plateau.
This study establishes a systems-level framework integrating key cryogenic drivers (soil properties, microstructure, frost heave dynamics) to decode the coupled impacts of freeze–thaw cycles and initial moisture content on Tibetan Plateau soil erosion. Through simulations under plateau conditions, it quantifies freeze-thaw cycles induced alterations in soil physical properties and microstructures, and probes axial load suppression of frost heave. The following objectives target the cryo-erosion hierarchy: (1) quantify freeze-thaw cycles induced soil property dynamics; (2) establish microstructure–erosion linkages via pore geometry/fractal metrics; (3) determine load regulation of frost heave/erosion; (4) identify frost heave stress as the primary erosion initiator. This mechanistic integration provides the first unified paradigm for understanding granular-scale erosion cascades in permafrost, delivering critical insights applicable to combating plateau desertification.
2. Materials and Methods
As shown in Figure 1, the schematic diagram of the materials and methods used in this study is presented, which mainly includes three research modules.
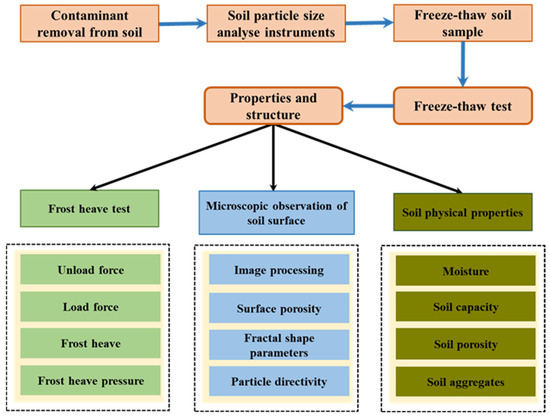
Figure 1.
Organizational chart of methods.
2.1. Materials
The soil samples used in this experiment were collected from a severely desertified, wind-eroded area in the southern part of Namatso Lake. The sampling site is located at 30°30′–30°55′ N and a longitude of 90°16′–91°03′ E, at an altitude of 4718 m [31]. This region’s average air density and pressure are 0.73 m3 and 571.2 hPa, respectively. The highest temperature recorded was 17 °C, while the lowest was approximately −28 °C. The Namatso Lake area of the Tibetan Plateau is a typical transition zone between a subarctic monsoon and arid–semi-humid climate with intense radiation, with an average annual sunshine duration of 2900~3200 h. The average yearly temperature is 1.9 °C, with an annual precipitation of about 500 mm and an annual evaporation rate of approximately 1200 mm. The average rainfall is 410 mm.
Considering that freeze–thaw erosion mainly occurs in shallow soils, the collected soils were primarily situated between the surface and 40 cm below the ground [32]. The study area is located in an area formed by wind erosion following the formation of an alluvial fan, where desertification is occurring. Each soil sample was primarily distributed between the ground surface and 40 cm below ground, with no layering observed, and the properties of each sample were largely consistent. During sampling we employed a multi-point sampling method, selecting square areas and collecting samples at intervals of 6 m in a sequence from left to right and from top to bottom. The study area was selected due to its desertification, low organic matter content, and sparse vegetation. After collection, the soil samples underwent processes such as impurity removal and drying in laboratory experiments to eliminate the influence of organic matter and grass roots.
Following collection, the samples were subjected to a series of tests to ascertain their fundamental physical properties, including the liquid limit, plastic limit, specific gravity, and optimum moisture content. Before starting the freeze–thaw experiments, the soil samples were subjected to the removal of impurities (Figure 2a). Based on the international system and the USDA soil particle size classification standards, the sample type in this study is classified as sandy soil (Figure 2b, Malvern Instruments Ltd., Malvern, UK). The soil samples were left to stand for 24 h (Figure 2c). Finally, they were placed in a freeze–thaw chamber for the freeze–thaw experiments. Based on monitoring data from a meteorological station established in the study area, we found that soil moisture content ranged from 4% to 12% during the freeze–thaw cycle phase [32].
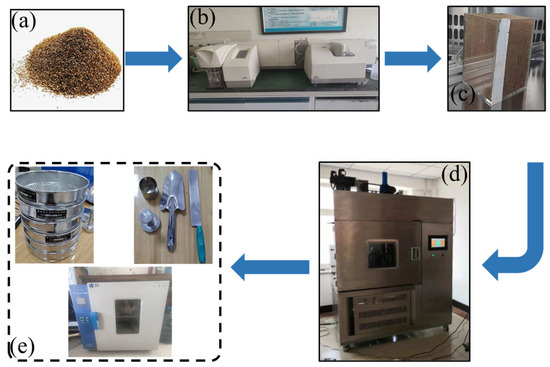
Figure 2.
Freeze–thaw soil experiment procedure: (a) soil particle size analysis instruments; (b) contaminant removal from soil; (c) freeze–thaw soil sample; (e) instruments for measuring the physical properties of freeze–thaw soil; and (d) soil freeze–thaw test chamber.
2.2. Freeze–Thaw Experiment
The freeze–thaw chamber was designed according to a non-contact, fan-cooled principle. This approach avoids mechanical damage to the ground surface and simulates the freeze–thaw temperature change process more accurately. The improved equipment simulates the freeze–thaw process under natural conditions (Figure 2d). First, samples with a diameter of 100 mm and a height of 20 mm were cut from the undisturbed soil layer and placed in sample boxes. The freeze–thaw cycle device used in this study was modified to measure deformation under load during freeze–thaw cycles. The device comprises a temperature control system, a loading system, a displacement monitoring system, sample boxes, and a lighting device.
The temperature control system uses a partially enclosed air-cooling method with a compressor to produce low temperatures efficiently. The minimum controllable temperature is −20 °C, with an error margin of ±0.5 °C. The loading system of the universal testing machine is used for applying loads, with an accuracy of 0.01 N, allowing for continuous force monitoring. A displacement sensor measures deformation, monitoring the deformation of the samples throughout the test. Due to the low groundwater level in the sampling area, a closed system was used for the freeze–thaw cycle tests. The device is divided into software and hardware components. The hardware includes the loading and environmental control systems, while the software handles program control and data acquisition (Tianjin Saiweilang Instrument Equipment Co., Ltd., Tianjin, China). The specific steps of the deformation experiment are as follows:
The sample box is designed to fit with the retainer. The components are placed in the following order: permeable stone, filter paper, soil sample, filter paper, porous stone, and top cover. Subsequently, the specimen box is wrapped in plastic wrap to prevent water loss during the freeze–thaw process.
Before applying the load, the deformation, displacement, and force values are set to zero, and the contact stress is set to 1 kPa. Considering the small load to be applied, a stress-controlled loading method with a loading rate of 0.1 kPa/s is used. When the load reaches the designed value, the system program automatically executes a stress hold command, indicating that the stress on the sample will remain constant. It is important to note that deformation monitoring begins when the external force reaches the contact stress value (displacement before contact with the sample is recorded by the displacement module, while deformation after contact is recorded by the deformation module, with the two modules working separately).
Under a particular load, after the consolidation process is complete (deformation rate less than 0.01 mm/h) the freeze–thaw cycle test is conducted. The thawing temperature is set to 15 °C, and when deformation stabilizes the thawing stage is programmed to stop. It takes 5 min for the freeze–thaw chamber to reach the specified temperature. The next cycle follows the same procedure. Each soil sample undergoes ten freeze–thaw cycles.
All samples were placed in a freeze–thaw cycling chamber and set to freeze at −15 °C for 12 h and to thaw at 15 °C for 12 h as one cycle of the freeze–thaw cycle. The number of freeze–thaw cycles was set as 0, 1, 3, 5, 7, and 10 times; all test samples were set to complete the experiment with three groups of replicates.
2.3. Soil Properties and Structure
2.3.1. Measurement of Soil Properties
Following the completion of the freeze–thaw cycle experiment, the pertinent physical properties of the soil were duly measured, encompassing soil bulk weight, soil porosity, soil water content, and soil aggregate content. The ring knife method was used to measure the volumetric weight of the soil, and the moisture content of the soil was measured by the dry method. In this study, air-dried aggregate particles of soil of different particle sizes were measured by the dry sieve method. The particle sizes were classified as follows: >5 mm, 3~5 mm, 2~3 mm, 1~2 mm, 0.5~1 mm, 0.25~0.5 mm, and <0.25 mm. The particle content of the air-dried aggregates of the soil was calculated (Figure 2e).
After obtaining the soil aggregate content data, the mean weight diameter (MWD) and geometric mean diameter (GMD) were calculated using the following methods outlined in [33,34]:
where Xi is the average diameter of soil aggregates of the i-th grain level (mm) and Wi is the percentage of aggregates of the corresponding grain level in the whole soil sample (%).
In this paper, we investigate the impact of the number of freeze–thaw cycles and the initial water content on MWD and GMD. The average weight diameter is defined as MWD (mm), while the geometric mean diameter is designated as GMD (mm). These parameters are calculated using Equations (1) and (2), respectively. MWD serves as a crucial index for assessing the stability of soil aggregates, as it reflects the average distribution characteristics of soil aggregates. Generally, a larger MWD indicates enhanced soil aggregate stability and an increased resistance to erosion. GMD is an important parameter used to characterize the particle size distribution of agglomerates. GMD and MWD have the same pattern of change for soil resistance to erosion.
2.3.2. Microscopic Experiments and Image Processing
As shown in Figure 3a, the schematic diagram of the microscopic experiment comprises a body-viewing microscope, a computerized display, and a sample stage (Beijing Tiannuoxiang Scientific Instruments Co., Ltd., Beijing, China). The interplay of three main components accomplishes the filming experiment. Once the freeze–thaw experiment samples have been completed, the plastic wrap should be removed and placed in the designated position on the sample stage for photography. The following is a schematic diagram of the image processing procedure. Figure 3b illustrates the original images captured, utilizing a group of soil samples as an exemplar. The original images were imported into Particles (Pores) and Cracks Analysis System software (PCAS), which employs a particle (pore) and fissure image recognition and analysis system for microscopic quantitative analysis [35,36].
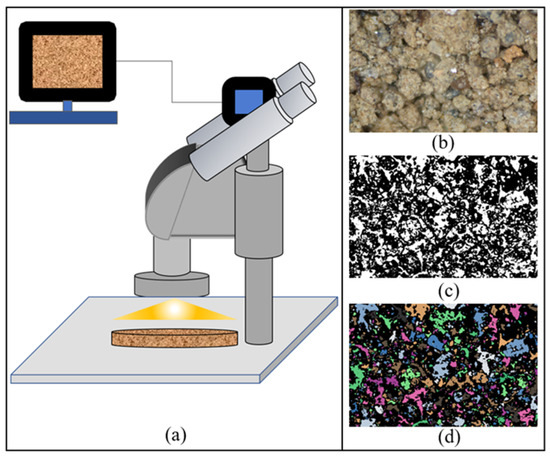
Figure 3.
Microscopic experiments and image processing: (a) microscopic experiment; (b) original image; (c) binarized image; and (d) vectorized processing.
As illustrated in Figure 3c, the software can automatically identify the various pores and fissures present in the image and transform the original image into a binarized image. As illustrated in Figure 3d, this is achieved through binarization followed by vectorization, which results in the vectorized processed image. This process, combined with the related theory of fractal geometry, automatically removes stray points, automatically segments and identifies particles and pores, outputs their geometric and statistical parameters, and displays the resultant vector images and rose diagrams. The geometrical parameters of all particles and pores are shown in the data table, including the number of particles and pores, area, length, width, directionality, shape coefficient, etc. Statistical parameters such as particle and pore content, fractal dimension, and area probability distribution index are obtained through statistical methods. This enables quantitative analysis of pore space during freeze-thaw cycles [35,36].
2.3.3. Freeze–Thaw Deformation Behavior Parameters
To facilitate the analysis, N = 0 was defined as the initial state, indicating the completion of consolidation; N = 0.5 suggests the completion of the first freezing; N = 1 indicates the completion of the first thawing; and so on. For example, the freezing state at the third freeze–thaw cycle is N = 2.5, and the thawing state is N = 3. As deformation in the transverse direction was limited, vertical deformation was measured. The following equations were defined to reflect the soil’s deformation behavior during freeze–thaw cycles:
where h0 represents the initial compression value of the displacement sensor while hi denotes the measured value of the displacement sensor and ∆ai signifies the absolute deformation at N = i (i = 0, 0.5, 1, 1.5, etc.). In Equation (5), H0 represents the initial height of the soil specimen while Hi denotes the height of the specimen after N = i. The term δai signifies the absolute deformation rate after N = i, whereas the symbol ∆ri denotes the relative deformation at N = i. δri represents the relative deformation rate after N = i, with i representing the number of cycles, 5, 1, 1.5, and so forth. H(i−0.5) is the height of the specimen after N = i − 0.5. A positive value indicates volume expansion, whereas a negative value indicates volume contraction. εvi represents the volumetric deformation rate [37].
Defined as the amount of freezing deformation per unit height of the specimen, freezing rate is a basic physical quantity definition of permafrost mechanics, derived from the classical theory of moisture-migration-phase-change expansion. The calculation formula is as follows:
Based on the theory of permafrost mechanics, the frost heave force σf is defined as the normal stress that occurs when frost heave is constrained, and is calculated by the following formula and procedure [38]:
where E is the soil confining modulus (MPa), which is related to soil type, temperature, and freeze–thaw condition, and η denotes the rate of frost heave.
3. Results
3.1. Physical Property of Soil by Freezing and Thawing
In the study of freeze–thaw processes, understanding the changes in soil surface moisture content is fundamental to researching the soil’s physical and chemical properties. The change in moisture content during the freeze–thaw process affects the extent of subsequent freeze–thaw events. Also, it alters the soil’s physical and chemical properties, as it is influenced by soil water potential and ground temperature distribution during these cycles. Based on the observation data from the meteorological stations in the collection area, we selected three typical initial water contents as the study conditions according to the duration and weather effects.
3.1.1. Moisture
As shown in Figure 4, soil moisture content with an initial water content of 12% gradually decreases after freeze–thaw cycles. This could be due to the increasing dryness of the ground surface, intensified by the rising frequency of freeze–thaw cycles under the influence of wind. In cases where the initial moisture content was 8% and 4%, the moisture content demonstrated a gradual increase during a single freeze–thaw cycle. This may be because during the freezing process the surface layer of soil freezes first, causing soil moisture to migrate from the lower layer, where the water potential is high, to the freezing layer, where the water potential is low. This leads to a gradual increase in moisture content in the freezing layer. Conversely, during the thawing process the meltwater in the surface layer evaporates and is transported downward, reducing moisture content [39]. The degree of enhancement is significantly correlated with the initial soil water content and the number of freeze–thaw cycles [40,41]. However, for sandy soil the magnitude of the water content change was more significant, with the stabilized infiltration rate during freeze–thaw reaching up to 10~20 times that of loamy soils. Additionally, the infiltration capacity decreased with the increase in initial soil water content [5]. After different freeze–thaw cycles, Figure 4 demonstrates the water content of the whole soil sample. To better focus on the water transport of the soil during the freeze–thaw process, the changes in soil mass water content at different depths were focused on. During the freeze–thaw process, soil moisture transport causes changes in water content, and the initial water content and the number of freeze–thaw cycles determine the degree of change. The present study was analyzed by one-way ANOVA, which showed that the number of freeze–thaw cycles had a significant effect (p < 0.05) on soil moisture content after freeze–thaw for soils at all three different initial moisture contents. The coefficients of variation for all conditions are less than 3%, which indicates that the data are reliable and the interference of random errors on the results can be excluded.

Figure 4.
Variation in different initial moisture contents with the number of freeze–thaw cycles: (a) initial moisture content 4%; (b) initial moisture content 8%; and (c) initial moisture content 12%; green, purple, and orange correspond to 4%, 8%, and 12%, respectively.
3.1.2. Soil Capacity
As shown in Figure 5, the soil bulk density gradually declined, followed by a relatively flat trajectory. Significant changes in soil moisture content result in an increase in migrating water, which in turn gives rise to enhanced freezing and thawing, severe frost heave, and disruption of soil structure. This leads to a notable intensification in the magnitude of changes in bulk weight and porosity [42]. The final soil bulk density is not correlated with the initial bulk density but is significantly associated with the soil texture. This is not significantly correlated with the three different moisture content categories. Studies have shown that when the moisture content is constant, the change in bulk density varies based on the initial bulk density of the soil. Soil with lower initial bulk density tends to experience an increase in bulk density, while soil with higher initial bulk density becomes looser, resulting in a decrease in bulk density. Soil with moderate bulk density shows minimal change [16].

Figure 5.
Variation in soil capacity with the number of freeze–thaw cycles: (a) initial moisture content 4%; (b) initial moisture content 8%; and (c) initial moisture content 12%; green, purple, and orange correspond to 4%, 8%, and 12%, respectively.
Therefore, this study selected samples with similar bulk densities across three groups of experiments with the same moisture content to avoid differences in results caused by significant differences in initial bulk density. The present study was analyzed by one-way ANOVA, which showed that the number of freeze–thaw cycles had a significant effect (p < 0.05) on soil capacity after freeze–thaw for soils at all three different initial moisture contents.
3.1.3. Soil Porosity
As shown in Figure 6, the variation in total porosity with the number of freeze–thaw cycles is obtained for three different moisture contents. In general, there is a gradual increase in soil porosity with the number of freeze–thaw cycles, whereas the opposite is observed for bulk density. The primary mechanisms by which freeze–thaw action disrupts soil structure are water migration, water–ice phase change, and volume change in particle and pore forces [43]. The freeze–thaw cycle phase of soil structure causes damage due to the growth of ice crystals and the migration of water. Furthermore, the frequent phase-change process alters the porosity, leading to changes in the bulk density. At present, many studies are concentrating on microscopic experimental observations to quantify the pore structure within soil aggregates. These studies have revealed that the porosity displays an increasing trend following the completion of several freeze–thaw cycles [44]. Figure 6 illustrates that the most noticeable change in porosity occurred during the initial freeze–thaw cycle. It has been demonstrated that the impact of the freeze–thaw process on large pores is primarily evident during the initial phase [45].

Figure 6.
Variation in soil porosity with the number of freeze–thaw cycles: (a) initial moisture content 4%; (b) initial moisture content 8%; and (c) initial moisture content 12%; green, purple, and orange correspond to 4%, 8%, and 12%, respectively.
One-way analysis of variance (ANOVA) showed that the number of freeze–thaw cycles significantly (p < 0.05) affected total porosity at all three different initial water contents. The coefficients of variation for all conditions are less than 3%, which indicates that the data are reliable and the interference of random errors on the results can be excluded.
3.1.4. Soil Aggregates
The composition of soil aggregates is of central importance in the structural composition of soils, and their stability is a significant factor in the characterization of soil erodibility. Current research on the impact of freeze–thaw processes on soil aggregates generally agrees that initial moisture content and the number of freeze–thaw cycles have the most significant effect on aggregate stability [46]. Figure 7 shows the percentage content and mean weight diameter (MWD) changes in aggregates of different particle sizes after various freeze–thaw cycles and under different moisture contents. The data demonstrate that the particle size of aggregates with a diameter of less than 0.25 mm decreases with an increase in the initial water content at N = 0. Conversely, the impact of freeze–thaw cycling is not discernible for agglomerates with a diameter greater than 5 mm. The soil aggregate content was observed to be 0.5~1 mm, 0.25~0.5 mm, 1~2 mm, 2~3 mm, and 3~5 mm, respectively. At N = 1, the 3~5 mm soil aggregate content was found to be higher than that of the 2~3 mm aggregates at a higher moisture content of 12%. The remaining patterns exhibited similarities to those observed in the aggregate content without freezing and thawing. The particle sizes of the aggregates at the three water content rates after N = 10 exhibited an increasing trend, with proportions approaching those of 0.5~1 mm soil agglomerates and even exceeding 0.5~1 mm content at high water content.
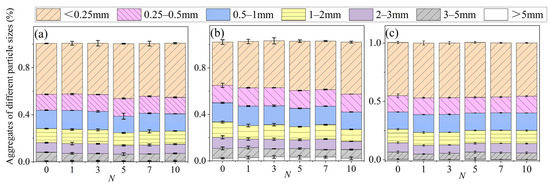
Figure 7.
The variation in the number of freeze–thaw cycles is the content of soil aggregates with different grain sizes: (a) initial moisture content 4%; (b) initial moisture content 8%; and (c) initial moisture content 12%.
Following the application of freeze–thaw cycles, the proportion of large agglomerates decreased, while that of micro agglomerates increased [47]. The alteration in the composition of agglomerates with varying grain sizes once more illustrates the impact of freeze–thaw processes. Statistical methods were used to continue to obtain statistical eigenvalues, as shown above, and finally, the p-value size was obtained after a one-way ANOVA. A one-way analysis of variance (ANOVA) showed that the number of freeze–thaw cycles significantly (p < 0.05) affected both the mean weight diameter MWD and the geometric mean diameter GMD of the soils at the three different initial moisture contents.
Following the soil aggregate content calculation, the mean weight diameter and geometric mean diameter were calculated to assess the stability of the soil aggregates. As shown in Figure 8a,b, the changes ultimately stabilize, consistent with findings from other researchers [48]. Studies of permafrost in high-latitude regions have reported that aggregate stability decreases with the increasing frequency of freeze–thaw cycles [49]. In other loamy soils with high aggregate content, it was observed that after 15 cycles of freeze–thaw the aggregate content of particles greater than 4.75 mm gradually decreased, while the aggregate content of particles less than 0.5 mm increased by a factor of 2.5 [50]. Both MWD and GMD values demonstrated that as soil moisture content decreased, the stability of soil aggregates also reduced. The magnitude of change in the stability of soil aggregates increased with the increase in initial water content during freeze–thaw, with freeze–thaw having the greatest effect on the stability of irrigation and silt soil aggregates.
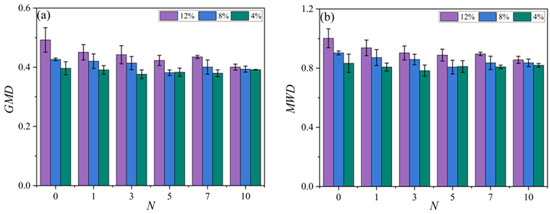
Figure 8.
Patterns of change in MWD and GMD: (a) effect of the number of freeze–thaw cycles and initial moisture content on GMD; and (b) effect of the number of freeze–thaw cycles and initial moisture content on MWD.
Quantitatively describe the above research: when the number of freeze-thaw cycles reaches 10, the moisture content experiences an average loss of approximately 54.3% compared to pre-freeze-thaw levels. Higher initial moisture content correlates with a greater increase in total porosity, averaging approximately 5.1%. Conversely, bulk density decreases by about 8.7%. Furthermore, higher initial moisture content leads to a larger reduction in average weight diameter, with an average decrease of approximately 8%. Some studies suggest that without the addition of water soil aggregate content increases, whereas adding water has the opposite effect [46]. In the migration of soil moisture, it generally tends to concentrate in the upper layers of the soil while the lower layers become dry [13]. The findings of this study indicate that an increase in the number of freeze–thaw cycles is associated with a decrease in soil aggregate stability. It is conceivable that the increase in moisture content in the upper soil layer may have resulted in the formation of ice crystals, which expanded within the soil pores, thereby disrupting the cohesion and reducing the stability of the aggregates. In contrast, shrinkage occurs in the lower soil as it dries, which results in a reduction in the adhesion between grains.
3.2. Soil Surface Microstructural Changes
The changes in soil surface structure and axial deformation help explain the variations in soil aggregate stability. Considering that under loading conditions soil aggregates are more likely to undergo mechanical damage and more pronounced fragmentation, the measurement results of aggregates might be inaccurate. The impact of freeze–thaw processes on soil structure under load is mainly quantified by frost heave deformation, while changes in surface structure are considered only in the absence of load. The pore properties of soils serve as a basis for studying soil water movement, physical behavior, and root infiltration, which determines soil stability, quality, and function [51]. As shown in Figure 9, we selected typical microstructures under different freeze–thaw cycle counts. The images provide a general indication of structural changes in the soil, such as the pores between particles. These images were then processed using the PCAS algorithm.
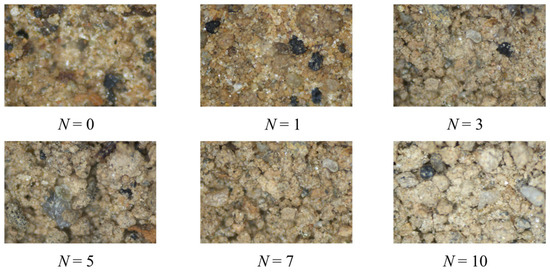
Figure 9.
Plot of changes in loess with freeze–thaw cycles.
3.2.1. Surface Porosity
Figure 10 presents the changes in surface porosity under different moisture content conditions. It was found that the greater the initial moisture content, the higher the soil porosity. As the number of freeze–thaw cycles increases, the porosity rises initially and stabilizes. After five freeze–thaw cycles, the surface porosity changes only slightly across different moisture levels, indicating relative stability. The increase in surface porosity with the number of cycles is attributed to the growth of ice crystals and the formation of cold structures within the soil samples. Initially, compacted soil samples are disrupted by the freeze–thaw process, which breaks the existing equilibrium. During freezing, water within the soil gradually freezes into ice, and an increase in pore area accompanies the growth of ice crystals. The soil particles are compressed, forming new structures, which macroscopically manifest as frost heave deformation, with some surface ice crystals even appearing. During thawing, the melting of internal ice crystals is insufficient to restore the original soil skeleton structure, so frost heave deformation persists. At the microscopic level, surface porosity continues to increase. The freeze–thaw cycle causes the number of small pores within the soil to increase, expanding the relative area of the pores and increasing the porosity. On the surface, this is reflected in increased porosity [52]. After 10 freeze-thaw cycles, the average surface porosity of the three soil types increased by approximately 60.3%. The greater the initial moisture content, the more pronounced the increase, with an increase rate reaching up to 84% in some cases. Eventually, the porosity stabilizes because the effects of the freeze–thaw cycle on the soil’s skeleton, fabric, and particle size diminish, causing the soil porosity to stabilize.
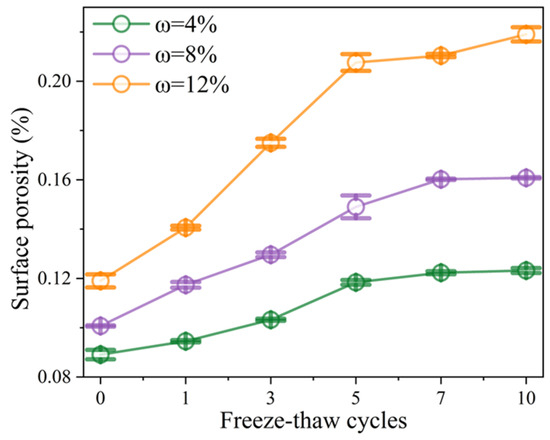
Figure 10.
Changes in surface porosity with changes in the number of freeze–thaw cycles.
The initial porosity differences are insignificant for soil samples with high initial moisture content. Still, the changes in porosity become more pronounced as the number of freeze–thaw cycles increases. The main reason is that the higher the water content freezes into ice, the more severe the evolution and development of internal cracks, and the more developed the internal water channels become. The impact of freeze–thaw action is more severe, leading to more pronounced destruction of the microstructure in these samples. A one-way ANOVA analysis of face porosity revealed that the number of freeze–thaw cycles significantly affected face porosity (p < 0.05).
3.2.2. Fractal Shape Parameters
As shown in Figure 11, the average shape coefficient, probability entropy, soil area-perimeter fractal dimension, and area probability distribution index were analyzed under an 8% moisture content. It was found that the average shape coefficient, soil area-perimeter fractal dimension, and area probability distribution index peaked at the first few freeze–thaw cycles. The average shape coefficient initially decreases and then increases with the number of freeze–thaw cycles, indicating the complexity of the particle edge shapes. Before three freeze–thaw cycles, soil particles exist in an aggregated form with relatively good roundness.
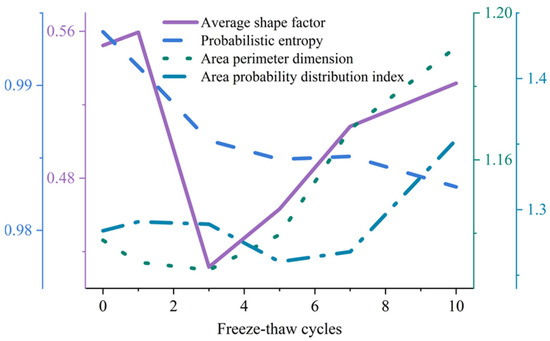
Figure 11.
Changes in shape parameters of loess under different numbers of freeze–thaw cycles.
During freeze–thaw cycles, small particles and debris adhere to the aggregates, the cohesion weakens, and they detach from the larger structures. The shape of the aggregate changes, the edge shapes become more complex, and roundness decreases. After the first few freeze–thaw cycle times, the small particles and debris are entirely detached from the original structure and begin to exist independently. The edges of the particles become relatively more regular, and roundness increases [53]. The further weakening of cohesion is reflected in a higher average shape coefficient. The rounding and aggregation of particles during early freeze-thaw stages contribute to increased resistance against wind-induced detachment and transport. However, the sub-sequent development of more complex and irregular particle shapes may enhance soil erodibility under high wind conditions.
Probability entropy generally shows a decreasing trend with increasing freeze–thaw cycles. Probability entropy describes the structural parameters of particle arrangement and reflects the degree of disorder in particle arrangement. Before freeze–thaw cycles, the arrangement of soil particles is relatively chaotic, with poor orderliness. As the freeze–thaw cycles progress, the phase change in water and ice becomes more complex, exerting compressive forces on the particles and leading to processes such as deflection, separation, fragmentation, and reorganization, which improve the orderliness of particle arrangement. Occasionally, there may be an increase in probability entropy. Overall, as the number of freeze–thaw cycles increases, the orderliness of particle arrangement improves [54]. The enhancement in arrangement orderliness generally strengthens soil structural stabil-ity, which may reduce particle mobility under wind erosion. However, the occasional in-creases in entropy suggest localized rearrangement disorder, which could temporarily el-evate erodibility in those regions.
The area-perimeter fractal dimension, denoted as D, typically ranges between 1 and 2 for particles with fractal characteristics. A smaller D value indicates a more straightforward particle structure, suggesting smoother particle surfaces. As shown in Figure 11, the area-perimeter fractal dimension of soil particles increases with the number of freeze–thaw cycles, indicating that the morphology of the skeletal particles becomes more complex. The area probability distribution index reflects the distribution of particle areas within a specific region. A larger probability distribution index indicates fewer large-area particles and more small-area particles. Before the five freeze–thaw cycles, small particles and debris began to detach from larger objects as cohesion weakened. Still, they had not yet fully separated, making large-area particles more visible and increasing the surface area of larger structures. A higher fractal dimension typically reflects increased boundary complexity, which can signal more irregular shapes and greater fragmentation, ultimately reducing structural cohesion and making particles more susceptible to erosion. As the freeze–thaw action further weakens the cohesion, these particles completely detach into smaller bodies, increasing the number of small-area particles. Additionally, large-area particles either decrease in size or transform into small particles, gradually increasing the area probability distribution index [55].
3.2.3. Particle Directionality
Shown in Figure 12 is a rose distribution diagram, which primarily depicts the distribution of particles in each direction. This is performed to ascertain the directional alteration of the soil particle configuration after the particles are exposed to a varying number of freeze–thaw cycles. The process of freeze–thaw cycles reveals that particles undergo a series of movements, including rotation and slippage, which collectively contribute to a change in particle arrangement. As the number of freeze–thaw cycles increased, the distribution of particle arrangement in all directions became increasingly homogenized, reaching a symmetrical distribution after ten cycles. As the number of freeze–thaw cycles increases, particles in each direction with larger water content undergo complex changes. Furthermore, the direction of the particles shifts more markedly under the influence of each type of freeze–thaw cycle. In contrast, the distribution of particles with a smaller water content exhibited a predominantly unidirectional pattern.
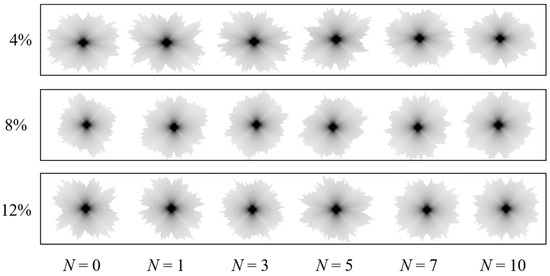
Figure 12.
Rose diagram of changes in particle arrangement of soils undergoing freeze–thaw cycles at different mass water contents.
Perhaps an increased symmetry in particle orientation indicates structural weaken-ing and loss of preferential alignment, which reduces resistance to shear and detachment. The homogenization of particle orientation enhances soil susceptibility to wind erosion by reducing inter-particle cohesion and facilitating particle entrainment. Additionally, the differential response of high- versus low-water-content particles suggests that erosion patterns may vary significantly with initial moisture conditions during freeze-thaw events.
3.3. Effect of Loads in the Freeze–Thaw Cycle Process on the Relative Deformation Behavior
3.3.1. Frost Heave
Negative soil temperatures cause water in the soil to freeze in the pore spaces. The original heat balance is disturbed [36]. Moisture in the unfrozen area moves towards the freezing point and freezes, changing the stresses in the surrounding area. The soil skeleton is pulled apart, and the moisture forms ice lenses. This gradually increases the volume of the soil, and freezing expansion occurs. Further studies have demonstrated that the alterations in the quantity of freezing expansion are predominantly reflected in the initial five freeze–thaw cycles. Figure 13 illustrates the correlation between the frozen deformation and the number of freeze–thaw cycles for three water contents and two distinct loads. The two loads are 0 kPa and 10 kPa. Based on the density and area of cattle and sheep in the collection area, we assumed that 100 cows were uniformly distributed on 1 acre of grass and estimated the load on the grass to be about 10 kPa. This meets the requirements of the load test [36]. As the number of freeze–thaw cycles increases, the freezing expansion volume demonstrates a pattern of initial growth followed by a plateau. Irrespective of whether a load was present or absent, the absolute deformation value of the initial freeze–thaw cycle was the most pronounced, followed by a gradual decline in the magnitude of change in the extent of freezing and swelling with the increase in the number of freeze–thaw cycles. At a water content of 4%, the amount of freeze–thaw was considerable during the initial cycle, followed by a period of almost constant freeze–thaw. The degree of freezing and thawing was slightly greater for a water content of 12% than for a water content of 8%, irrespective of the presence or absence of loads. Freezing or thawing does not occur if the water content is below the value of critical water content. Above this value, the soil is more sensitive to changes in pore structure and the position of soil particles as the water content of the soil increases [55].
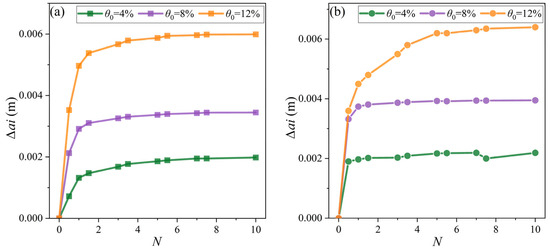
Figure 13.
Frost heaves at different moisture contents: (a) loaded; (b) unloaded.
The degree of freezing expansion was markedly diminished in the loaded case relative to the unloaded case across all three water contents. In the case of soil with loading, the additional load during freezing limited the soil’s freezing deformation. In contrast, the extra load during thawing promoted compressive deformation of the soil. At the same freezing temperature, the specimens loaded during the experiment entered the first freeze–thaw phase at a slower rate of rise and with a longer pre-freezing time. This discrepancy can be attributed to the inhibitory impact of loading on freeze–thaw deformation, as previously observed [37]. Without loading, the soil is subjected to temperatures below 0 °C throughout the freezing process. Upon reaching the freezing point, the water within the pores undergoes a phase transition, becoming ice. This volume expansion, coupled with ice formation, gives rise to a phenomenon known as freeze-up deformation. In the event of loading, it is essential to ensure that the freezing pressure is greater than the external load in order to permit the expression of freezing deformation once the pore water has reached the freezing temperature. This is shown by the findings that specimens subjected to loading are less prone to freeze-up [54]. The activation of the ice lens body, as described in the rigidity theory, is contingent upon the effective stress of the soil in the height direction being equal to zero. This effective stress is calculated from the total stress, the load of unfrozen water in the pore space, and the load of pore ice [55]. The studies above have demonstrated that applying loads constrains the advancement of frost heave, reducing the extent of associated deformation.
3.3.2. Relative Deformation and Deformation Rate
The relative deformation and deformation rate can be used to assess the potential of the soil body’s freezing and thawing or frost heave during the freeze–thaw cycle [37]. As shown in Figure 14, the soil body experiences freeze–thaw deformation primarily during the first cycle. The deformation patterns with and without load are similar. However, the deformation is significantly greater in the absence of load than under load. In general, the relative deformation and relative deformation rate demonstrate an initial increase followed by a subsequent decline. As shown in Figure 14a,b, both loaded and unloaded relative deformations exhibited negative values. As the water content increases, the relative deformation value rises gradually. As shown in Figure 14c,d, the relative deformation rate exhibits a parallel trend to that of the relative deformation value.
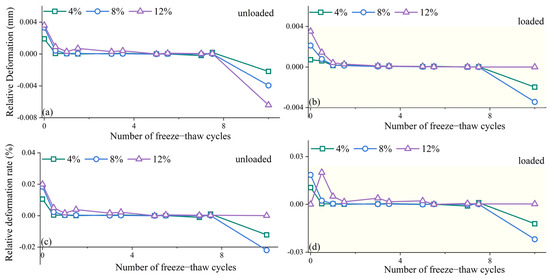
Figure 14.
Relative deformation and deformation rate with the number of freeze−thaw cycles with and without loading.
A brief bulge is observed in the relative deformation value and relative deformation rate with loads at the second freeze-thaw cycle. At 8% and 12% moisture contents, both the relative deformation values and deformation rates exhibited a brief increase followed by a decrease. This phenomenon can be attributed to a transient rise in moisture content within the frozen soil layer due to the higher water content and the subsequent tendency for frost heave to occur. Subsequently, the deformation rate declines due to the sustained drying of the moisture. A load introduces additional complexities to moisture migration within the frozen soil. This appears to result in a phenomenon known as “hysteresis,” which affects the initial observable changes associated with freeze–thaw cycles. The moisture content constrains the low moisture content itself and has minimal potential for being influenced by moisture migration. Accordingly, the actual soil freezing process in the field must consider the discrepancies in loading from monitoring stations, residences, etc.
3.3.3. Rate of Change in Volume
Studies have shown that expansive soils with higher water content increase in volume after freezing. The volume change demonstrates the combined impact of freeze–thaw cycles on soil structure. Figure 15 illustrates the correlation between volume change and the number of freeze–thaw cycles. The load has a restraining effect on the freezing expansion of the soil, which can reduce the volume change in the direction of expansion [37]. During the freezing process, the soil undergoes a significant expansion in volume, which continues during the subsequent thawing phase, although at a markedly reduced rate. It has been demonstrated in both engineering practice and experimental studies that not all soils with a certain water content undergo freezing expansion during freezing. This phenomenon occurs only when the moisture content of the soil is greater than a critical value. The presence of freeze–thaw water content has been suggested [56].
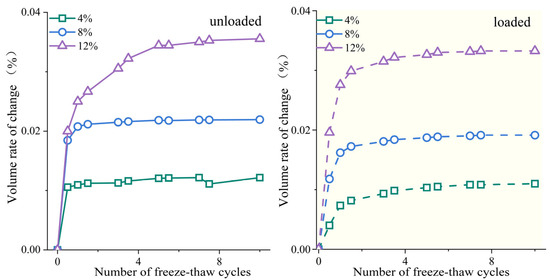
Figure 15.
Rate of change in volume with the number of freeze–thaw cycles with and without loading.
In the absence of any appreciable moisture content, neither frost heave nor thaw settlement occurs. As a result, the critical moisture content is termed as the soil’s initial frost heave moisture content. When the moisture content of the soil is below the critical value, the volume and mass of ice produced during the freezing process are minimal, and there is sufficient space within the soil to accommodate the change in volume of the water that becomes ice. In such circumstances, the soil volume remains constant throughout the freezing process. When the soil water content exceeds a critical value, the volume and mass of ice formed during freezing will increase, resulting in a volume change that the soil pores cannot accommodate. The connections between soil particles will be disrupted, resulting in an expansion of the soil volume. The results presented in Figure 14 demonstrate that an increase in soil water content is associated with a proportional increase in freezing expansion. The volume change is constrained to half the value observed without loading.
3.3.4. Frost Heave Pressure
As shown in Figure 16, the freezing and swelling force varies with the number of freezing and thawing cycles under different water content conditions. At 4% moisture content, the freezing and swelling force remains relatively stable throughout the freeze–thaw cycles with almost no significant change, indicating that the effect of low moisture content on the freezing and swelling force is relatively small. At 8% moisture content, as the freeze–thaw cycle proceeds the freezing and swelling force increases slightly in the first few cycles, but then gradually stabilizes, indicating that the change in freezing and swelling force is relatively smooth under medium moisture content. At 12% moisture content, the freezing and swelling forces increased significantly in the first few cycles, reached a peak, and then stabilized. This suggests that high water content leads to more significant changes in frost heave during the initial period.
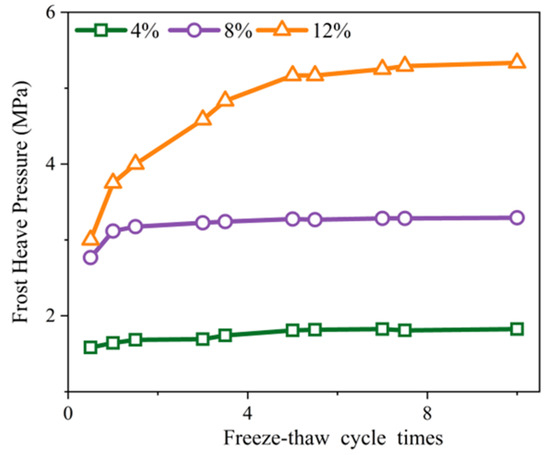
Figure 16.
Comparison of freezing and expansion forces at different water contents in indoor experiments.
The study found that under loading conditions, frost heave was suppressed, with this difference becoming more pronounced at higher moisture contents, reaching a maximum difference of approximately 5 mm. Without loading, higher moisture content resulted in greater frost heave variation, with a maximum heave of approximately 6.4 mm and a volume change rate as high as 3.6%. These frost heave changes were primarily driven by frost heave force. As shown in Figure 16, the initial frost heave force increased by 13.8%. After 10 freeze-thaw cycles, the average frost heave force increased by 37.34% across the three moisture content levels.
In summary, the water content significantly affected the relationship between the freezing and swelling force and the number of cycles. With the increased water content, the freezing swelling force varied more drastically at the initial stage and stabilized after reaching the peak value. This law is important for understanding the behavior of soil during freeze–thaw cycles. Repeated freeze–thaw events can significantly alter the structure of soils, leading to an increase in tiny aggregates and changes in hydraulic conductivity. Soils in highland areas undergo significant changes in their internal physical properties after being subjected to freeze–thaw action. This study investigates the structural changes in the soil, both at the surface and along its longitudinal axis.
4. Discussion
4.1. Mechanisms of Soil Erosion by Freeze–Thaw Action
Figure 17 illustrates the erosion mechanism of plateau soils under freeze–thaw action. These structural changes are essential for soil erosion capacity. Thawing has been found to lead to soil particle instability, which increases the potential for soil erosion [54]. Without freeze–thaw action, the soil structure is more tightly bound into units, with less surface porosity and a stable axial structure. Each structure is relatively intact with no visible cracks or changes in pore structure, providing a stable natural pore structure. Following freeze–thaw cycles, the frost heave effect induces cracking within soil particles and alters cementation between structural units, leading to increased porosity. This phenomenon may also be attributed to moisture migration away from freezing fronts during soil drying. After several freeze and thaw events, the pore space gradually increases and, together with the axial loads of freezing and expansion, the soil structure is disrupted, resulting in the fragmentation of large aggregates and large particles into smaller units. During the freeze–thaw process, the phase change in water expands the soil volume and increases pore space, which in turn affects the soil properties [57].
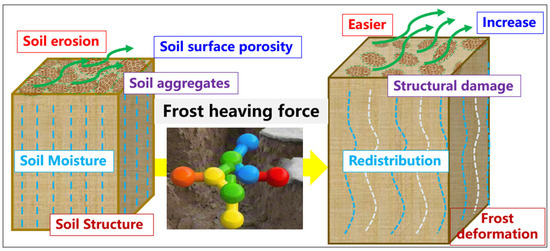
Figure 17.
Mechanisms of soil erosion by freeze–thaw action, the blue lines in the image represent water distribution, while the green lines indicate wind erosion processes.
Figure 17 shows a diagram that shows that the axial structure of the soil becomes larger after freezing and thawing, and the water in the soil is redistributed. Soil surface pores become larger, the surface is looser and easier to initiate, and freeze–thaw soil erosion may be greater. Upon freezing, pore water expands, generating radial frost heave stress that compacts the soil particle skeleton. Repeated freeze–thaw cycles induce the progressive accumulation of axial frost heave forces driven by water–ice phase transitions. These forces drive the rearrangement of surface particles, leading to a significant increase in surface porosity. This enlarged porosity substantially attenuates the soil’s resistance to external erosion. Crucially, the magnitude of the frost heave force—representing the primary conversion of phase-change energy into mechanical energy—dictates the initial damage scale. Concurrently, the resultant surface porosity acts as a conduit for transmitting erosive energy, accelerating the decline in erosion resistance. The initial water content fundamentally governs this initial damage scale. Consequently, the mechanism underlying freeze–thaw soil erosion can be summarized as follows: frost heave forces disrupt soil cohesion; surface porosity increases; soil shear strength progressively diminishes; and erosion resistance weakens. Critically, the magnitude of the frost heave force exhibits a strong positive correlation with the initial water content.
Compared with SEM, CT, MIP, and NMR techniques, this study directly captures the entire surface structure of the sample. Freeze–thaw soil erosion mechanisms typically focus more on changes in the properties and structure of the soil surface, which seems to be a more direct indicator of soil erosion capacity [14,15,16,17]. These established techniques are typically performed after freeze–thaw cycling experiments, involving testing of the treated freeze–thaw samples. This may result in changes to soil structure, thereby affecting the accuracy of research results. The application of these methods often has limitations. This study employs a simpler imaging method to ensure sample integrity and directly obtain soil surface structure. As shown in Figure 9, the sample surface is directly photographed to obtain the surface structure without affecting sample integrity. After image processing, we provide more direct insights into soil erosion mechanisms, including pore volume, shape parameters, and particle orientation. The physical properties of soil, its microscopic surface structure, and the frost heave process under loaded conditions exhibit similar patterns of change with the number of freeze–thaw cycles. This study establishes the relationship between these three factors and frost heave force, and confirms the dominant role of frost heave stress through multi-evidence validation.
This study presents a framework where the three factors driven by low temperatures collectively point to frost heave stress as the core mechanism of erosion. In contrast, previous studies primarily attributed erosion to phase transitions and freeze–thaw frequency, neglecting the critical role of stress. Our framework integrates erosion processes from the microscopic to the macroscopic level by positioning frost heave stress as the triggering factor. This paradigm shift, emphasized in the introduction, provides a more unified understanding of erosion mechanisms and offers enhanced insights for desertification prevention and control.
4.2. Freeze–Thaw Action and Land Use
The interaction between freeze–thaw cycles and land use is a critical factor in soil stability and agricultural sustainability in cold regions. Freeze–thaw cycles exacerbate erosion by disrupting soil structure and hydraulic properties. Investigating the patterns of change between soil physical properties and freeze–thaw cycles is a fundamental basis for studying soil erosion. Consistent with previous studies, these physical property changes are more pronounced in real-world field soils. Previous studies have shown that soil maintains strong erosion resistance during the first 4 freeze–thaw cycles, but after 4–5 cycles the disintegration of large aggregates leads to a significant increase in erosion potential [58]. Soil detachment capacity initially decreases and then increases with rising cycle frequency and moisture content, with 4–5 cycles and 9% moisture content identified as the critical thresholds for this transition [59]. At different moisture content levels maximum stripping capacity occurs after the first cycle, consistent with the frost heave pattern, confirming its role as the primary erosion driver. Agricultural management should prioritize protective measures specifically during initial freeze–thaw events.
After freeze–thaw cycles, large organic molecules bound to solid particles undergo expansion and contraction, which significantly affects soil structure [60]. Although the soil organic matter content in this study was relatively low, under field conditions different soil textures are influenced by organic matter and soil frost heaving may result in more pronounced structural changes, leading to more significant overall alterations in soil structure. Especially in the black soil of Northeast China, where organic matter content is high, the changes in soil pore volume after freeze–thaw cycles are even more marked than those observed in this study. Freeze–thaw cycles alter the original structure of black soil, potentially weakening the cohesive force between soil particles, thereby affecting wind erosion intensity. Wind erosion intensity increases with the number of freeze–thaw cycles [61]. Different soil textures are affected differently by organic matter content. Spatially heterogeneous erosion risks emerge across northeastern China, with residential areas, woodlands, grasslands, and complex terrains displaying the highest vulnerability, while croplands exhibit relatively greater resilience [62].
Concurrently, freeze–thaw processes regulate organic matter transformation through tripartite mechanisms: physically via particle reorganization, chemically through dissolved organic acid release, and biologically by disrupting microbial activity [63]. Phase transitions (water–ice) trigger organic matter detachment from soil particles, while microbial mortality releases soluble carbon sources, collectively enhancing dissolved organic matter release. Straw incorporation effectively mitigates freeze–thaw damage by supplementing soil nutrients and enhancing erosion resistance through organic cementation [64]. In some soils, root systems and humus substances have a significant impact on organic matter content, and the changes in soil properties after freezing and thawing are even more pronounced. Therefore, this study serves as a foundational basis for research considering various factors in natural environments, providing important insights for future studies involving the addition of organic matter, root systems, and humus substances.
5. Conclusions
This study simulated controlled freeze–thaw cycles in an environmental chamber to quantify how freezing processes contribute to soil erosion. The researchers measured changes in soil physical properties, analyzed surface structural evolution linked to deformation patterns, and investigated the mechanistic controls of freeze–thaw cycles on soil deformation to advance fundamental understanding of erosion in cold regions.
- Freeze–thaw cycles gradually reduce soil moisture content while increasing porosity. Soil bulk density shows the opposite trend. Ice crystal expansion disrupts soil cohesion, leading to a continued decline in aggregate stability. Lower initial moisture content is associated with weaker aggregate stability, a conclusion verified by MWD and GMD indicators.
- Cyclic water–ice phase transitions generate axial frost heave stress, which is the primary initiator of soil structural degradation in cold regions. This stress disrupts cohesion, rearranges particles, and increases surface porosity, progressively compromising soil stability. The most pronounced changes in geometric indices occur during the initial freeze–thaw cycles.
- Initial moisture content critically governs damage severity: higher moisture intensifies frost heave stress and accelerates porosity expansion. External loading suppresses cryogenic dynamics, directly attenuating erosion—representing a key intervention strategy.
- External loading exerts an inhibitory effect that mitigates changes in frost heave forces, thereby reducing soil erosion. Our research findings deepen our understanding of the mechanisms of freeze–thaw erosion. Future research can be used to disperse freeze–thaw stresses and reduce soil loss. In highland pastoral areas, houses and weather stations do not necessarily have a negative impact on agricultural development. To a certain extent, they can inhibit freeze–thaw erosion. The suppressive effect of external loads on frost heave dynamics points to a practical method for controlling soil erosion. Land managers could consider utilizing natural or artificial loading techniques to dampen cryo-genic activity and enhance erosion resistance.
Author Contributions
Supervision, N.H. and H.D.; Designed the study, Z.G. and Y.M.; Methodology, Z.G., Y.M. and R.P.; Software, Z.G. and R.P.; Writing—Original Draft, K.G.; Writing—Review and Editing, Z.G., H.D. and R.P. All authors have read and agreed to the published version of the manuscript.
Funding
This work was supported by the National Natural Science Foundation of China (42376245), the Young Scientists Fund of National Natural Science Foundation of China (42106218), and the Key Research and Development Program of Gansu Province (22YF7FA019).
Institutional Review Board Statement
Not applicable.
Informed Consent Statement
Not applicable.
Data Availability Statement
The data presented in this study are available on request from the corresponding author. The data are not publicly available due to privacy.
Conflicts of Interest
Author Kang Gao was employed by the company Yellow River Water Conservancy and Hydropower Development Group Co., Ltd. The remaining authors declare that the research was conducted in the absence of any commercial or financial relationships that could be construed as a potential conflict of interest.
References
- Qiu, J. China: The third pole. Nature 2008, 454, 393–397. [Google Scholar] [CrossRef]
- Yao, T.D.; Wu, F.Y.; Ding, L.; Sun, J.M.; Zhu, L.P.; Piao, S.L.; Deng, T.; Ni, X.J.; Zheng, H.B.; Ouyang, H. Multispherical interactions and their effects on the Tibetan Plateau’s earth system: A review of the recent researches. Natl. Sci. Rev. 2015, 2, 468–488. [Google Scholar] [CrossRef]
- Chen, F.H.; Ding, L.; Piao, S.L.; Zhou, T.J.; Xu, B.Q.; Yao, T.D.; Li, X. The Tibetan Plateau as the engine for Asian environmental change: The Tibetan Plateau Earth system research into a new era. Sci. Bull. 2021, 1566, 1263–1266. [Google Scholar] [CrossRef] [PubMed]
- Yang, M.; Nelson, F.E.; Shiklomanov, N.I.; Guo, D.L.; Wan, G.N. Permafrost degradation and its environmental effects on the Tibetan Plateau: A review of recent research. Earth-Sci. Rev. 2010, 103, 31–44. [Google Scholar] [CrossRef]
- Ala, M.A.; Liu, Y.; Wang, A.Z.; Niu, C.Y. Characteristics of soil freeze-thaw cycles and their effects on water enrichment in the rhizosphere. Soil Sci. 2023, 188, 123–135. [Google Scholar]
- Li, G.Y.; Fan, H.M. Effect of Freeze-Thaw on Water Stability of Aggregates in a Black Soil of Northeast China. Pedosphere 2014, 24, 285–290. [Google Scholar] [CrossRef]
- Foltz, G.R.; McPhaden, M.J. Impact of Saharan dust on tropical North Atlantic SST. J. Clim. 2008, 21, 5048–5060. [Google Scholar] [CrossRef]
- Luca, M.D. Govern our soils. Nature 2015, 528, 32–33. [Google Scholar] [CrossRef]
- Mostaghimi, S.; Young, R.A.; Wilts, A.R.; Kenimer, A.L. Effects of frost action on soil aggregate stability. Trans. ASABE 1987, 30, 435–439. [Google Scholar] [CrossRef]
- Sun, B.Y.; Ren, F.P.; Ding, W.F.; Zhang, G.H.; Huang, J.Q.; Li, J.M.; Zhang, L. Effects of freeze-thaw on soil properties and water erosion. Soil Water Res. 2021, 16, 205–219. [Google Scholar] [CrossRef]
- Ban, Y.; Lei, T.W.; Liu, Z.; Chen, C. Comparison of rill flow velocity over frozen and thawed slopes with electrolyte tracer method. J. Hydrol. 2016, 534, 630–637. [Google Scholar] [CrossRef]
- Zhang, X.; Sun, S.F. The impact of soil freezing/thawing process on water and energy balances. Adv. Atmos. Sci. 2011, 28, 169–177. [Google Scholar] [CrossRef]
- Fu, Q.; Hou, R.J.; Li, T.X.; Ma, Z.; Peng, L. Soil moisture-heat transfer and its action mechanism of freezing and thawing soil. Trans. Chin. Soc. Agric. 2016, 47, 99–110. [Google Scholar]
- Nan, J.J.; Peng, J.B.; Zhu, F.J.; Ma, P.H.; Liu, R.; Leng, Y.Q.; Meng, Z.J. Shear behavior and microstructural variation in loess from the Yan′an area, China. Eng. Geol. 2021, 280, 105964. [Google Scholar] [CrossRef]
- Tian, H.H.; Wei, C.F.; Tan, L. Effect of freezing-thawing cycles on the microstructure of soils: A two-dimensional NMR relaxation analysis. Cold Reg. Sci. Technol. 2019, 158, 106–116. [Google Scholar] [CrossRef]
- Wen, B.P.; Yan, Y.J. Influence of structure on shear characteristics of the unsaturated loess in Lanzhou, China. Eng. Geol. 2014, 168, 46–58. [Google Scholar] [CrossRef]
- Dagesse, D.F. Freezing-induced bulk soil volume changes. Can. J. Soil Sci. 2010, 90, 389–401. [Google Scholar] [CrossRef]
- Karumanchi, M.; Suseela, A.; Habibunnisa, S.; Nerella, R. An analysis of freeze-thaw cycles on geotechnical properties of soft-soil. Mater. Today Proc. 2020, 27, 1304–1309. [Google Scholar]
- Barthes, B.; Roose, E. Aggregate stability as an indicator of soil susceptibility to runoff and erosion, validation at several levels. Catena 2002, 47, 133–149. [Google Scholar] [CrossRef]
- Zádorová, T.; Jakšík, O.; Kodešová, R.; Penížek, V. Influence of terrain attributes and soil properties on soil aggregate stability. Soil Water Res. 2011, 6, 111–119. [Google Scholar] [CrossRef]
- Oztas, T.; Fayetorbay, F. Effect of freezing and thawing processes on soil aggregate stability. Catena 2003, 52, 1–8. [Google Scholar] [CrossRef]
- Blanco-Canqui, H.; Ruis, S.J. No-tillage and soil physical environment. Geoderma 2018, 326, 164–200. [Google Scholar] [CrossRef]
- de Oliveira, J.A.T.; C’assaro, F.A.M.; Pires, L.F. Quantification of the pore size distribution of a Rhodic Hapludox under different management systems with X-ray microtomography and computational simulation. Soil Tillage Res. 2021, 209, 104941. [Google Scholar] [CrossRef]
- Sahin, U.; Angin, I.; Kiziloglu, F.M. Effect of freezing and thawing processes on some physical properties of saline–sodic soils mixed with sewage sludge or fly ash. Soil Tillage Res. 2008, 99, 254–260. [Google Scholar] [CrossRef]
- Tang, L.; Cong, S.Y.; Geng, L.; Ling, X.Z.; Gan, F.D. The effect of freeze-thaw cycling on the mechanical properties of expansive soils. Cold Reg. Sci. Technol. 2018, 145, 197–207. [Google Scholar] [CrossRef]
- Huang, L.; Sheng, Y.; Wu, J.C.; He, B.B.; Huang, X.B.; Zhang, X.Y. Experimental study on frost heaving behavior of soil under different loading paths. Cold Reg. Sci. Technol. 2020, 169, 102905. [Google Scholar] [CrossRef]
- Zhang, X.Y.; Zhang, M.Y.; Lu, J.G.; Pei, W.S.; Yan, Z.R. Effect of hydro-thermal behavior on the frost heave of a saturated silty clay under different applied pressures. Appl. Therm. Eng. 2017, 117, 462–467. [Google Scholar] [CrossRef]
- Lai, Y.M.; Pei, W.S.; Zhang, M.Y.; Zhou, J.Z. Study on theory model of hydro-thermal–mechanical interaction process in saturated freezing silty soil. Int. J. Heat Mass Transf. 2014, 78, 805–819. [Google Scholar] [CrossRef]
- Kaczy’nski, R.; Grabowska-Olszewska, B. Soil mechanics of the potentially expansive clays in Poland. Appl. Clay Sci. 1997, 11, 337–355. [Google Scholar] [CrossRef]
- Beskow, D.G.; Fil, B. Soil Freezing and Frost Heaving with Special Application to Roads and Railroads. Soil Sci. 2013, 65, 355. [Google Scholar]
- Ge, Z.H.; Li, G.; Dun, H.C.; Huang, N. Freeze-thaw characteristics and deformation monitoring of topsoil in highland pastoral areas under the influence of snow accumulation. Heliyon 2024, 10–13, e33652. [Google Scholar] [CrossRef]
- Li, N.; Cuo, L.; Zhang, Y.X. On the freeze–thaw cycles of shallow soil and connections with environmental factors over the Tibetan Plateau. Clim. Dyn. 2021, 57, 3183–3206. [Google Scholar] [CrossRef]
- Tanner, S.; Katra, I.; Haim, A.; Zaady, E. Short-term soil loss by aeolian erosion in response to conventional and organic agricultural practices. Soil Tillage Res. 2016, 155, 149–156. [Google Scholar] [CrossRef]
- Gardner, W.R. Representation of soil aggregate-size distribution by a logarithmic-normal distribution. Soil Sci. Soc. Am. J. 1956, 20, 151–153. [Google Scholar] [CrossRef]
- Liu, C.; Shi, B.; Zhou, J.; Tang, C.S. Quantification and characterization of microporosity by image processing, geometric measurement and statistical methods: Application on SEM images of clay materials. Appl. Clay Sci. 2011, 54, 97–106. [Google Scholar] [CrossRef]
- Liu, C.; Tang, C.S.; Shi, B.; Suo, W.B. Automatic quantification of crack patterns by image processing. Comput. Geosci. 2013, 57, 77–80. [Google Scholar] [CrossRef]
- Li, T.G.; Kong, L.W.; Guo, A.G. The deformation and microstructure characteristics of expansive soil under freeze–thaw cycles with loads. Cold Reg. Sci. Technol. 2021, 192, 103393. [Google Scholar] [CrossRef]
- Konrad, J.M.; Morgenstern, N.R. The segregation potential of a freezing soil. Can. Geotech. J. 1981, 18, 482–491. [Google Scholar] [CrossRef]
- Peng, Z.Y.; Huang, J.S.; Zeng, W.Z.; Guo, H. Water Movement Regularities of Seasonal Freezing-Thawing Soil. Eng. J. Wuhan Univ. 2011, 44, 696–700. [Google Scholar]
- Jing, G.C.; Ren, X.P.; Liu, X.J.; Liu, B.Y.; Zhang, L.H.; Yang, Y.J.; Wang, Y.J. Relationship between freeze-thaw action and soil moisture for northeast black soil region of China. Sci. Soil Water Conserv. 2008, 6, 32–36. [Google Scholar]
- Perfect, E.; van Loon, W.K.P.; Kay, B.D.; Groenevelt, P.H. Influence of Ice Segregation and Solutes on Soil Structural Stability. Can. J. Soil Sci. 1990, 79, 571–581. [Google Scholar] [CrossRef]
- Krumbach, A.W., Jr.; White, D.P. Moisture, pore space, and bulk density changes in frozen soil. Soil Sci. Soc. Am. J. 1964, 28, 422–425. [Google Scholar] [CrossRef]
- Jie, Z.; Tang, Y.Q. Experimental inference on dual-porosity aggravation of soft clay after freeze-thaw by fractal and probability analysis. Cold Reg. Sci. Technol. 2018, 153, 181–196. [Google Scholar]
- Jiang, Y.; Fan, H.M.; Hou, Y.Q.; Liu, B.; Guo, X.Y.; Ma, R.M. Characterization of aggregate microstructure of black soil with different number of freeze-thaw cycles by synchrotron-based micro-computed tomography. Acta Ecol. Sin. 2019, 39, 4080–4087. [Google Scholar]
- Zhao, Y.D.; Hu, X. Influence of Freeze-thaw on CT Measured Soil Pore Structure of Alpine Meadow. J. Soil Water Conserv. 2020, 34, 352–367. [Google Scholar]
- Wang, E.Y.; Zhao, Y.S.; Chen, X.W. Effects of seasonal freeze-thaw cycle on soil aggregate characters in typical phaeozem region of Northeast China. Chin. J. Appl. Ecol. 2010, 21, 889–894. [Google Scholar]
- Henry, H.A. Soil freeze–thaw cycle experiments: Trends, methodological weaknesses and suggested improvements. Soil Biol. Biochem. 2007, 39, 977–986. [Google Scholar] [CrossRef]
- Wang, D.Y.; Ma, W.; Niu, Y.H.; Chang, X.X.; Wen, Z. Effects of cyclic freezing and thawing on mechanical properties of Qinghai-Tibet clay. Cold Reg. Sci. Technol. 2007, 48, 34–43. [Google Scholar] [CrossRef]
- Ma, R.M.; Jiang, Y.; Liu, B.; Fan, H.M. Effects of pore structure characterized by synchrotron-based micro-computed tomography on aggregate stability of black soil under freeze-thaw cycles. Soil Tillage Res. 2021, 207, 104855. [Google Scholar] [CrossRef]
- Edwards, L.M. The Effect of Alternate Freezing and Thawing on Aggregate Stability and Aggregate Size Distribution of Some Prince Edward Island Soils. Eur. J. Soil Sci. 2010, 42, 193–204. [Google Scholar] [CrossRef]
- Voltoini, M.; Tas, N.; Wang, S.; Brodie, E.L.; Ajo-Franklin, J.B. Quantitative Characterization of Soil Micro-aggregates: New Opportunities from Sub-micron Resolution Synchrotron X-ray Microtomography. Geoderma 2017, 305, 382–393. [Google Scholar] [CrossRef]
- Liu, X.J.; Jing, G.C.; Yang, Y.J. Effects of Alternate Freezing and Thawing on the Structure of Black Topsoil. Sci. Soil Water Conserv. 2015, 13, 42–46. [Google Scholar]
- Zhang, Z.; Ma, W.; Qi, J.L. Structure Evolution and Mechanism of Engineering Properties Change of Soils under Effect of Freeze-Thaw Cycle. J. Jilin Univ. Earth Sci. Ed. 2013, 43, 1904–1914. [Google Scholar]
- Liu, H.; Yang, Y.; Zhang, K.; Sun, C. Soil Erosion as Affected by Freeze-Thaw Regime and Initial Soil Moisture Content. Soil Sci. Soc. Am. J. 2017, 81, 459–467. [Google Scholar] [CrossRef]
- Miller, R. Frost Heaving in Non-colloidal Soils. In Proceedings of the Third International Conference on Permafrost, Edmonton, AB, Canada, 10–13 July 1978; Volume 1. [Google Scholar]
- Zhang, Q.; Song, Z.; Li, X.; Wang, J.; Liu, L. Deformation Behaviors and Meso-Structure Characteristics Variation of the Weathered Soil of Pisha Sandstone Caused by Freezing–Thawing Effect. Cold Reg. Sci. Technol. 2019, 167, 102864. [Google Scholar] [CrossRef]
- Shi, F.; Zhang, C.; Zhang, J.; Zhang, X.; Yao, J. The Changing Pore Size Distribution of Swelling and Shrinking Soil Revealed by Nuclear Magnetic Resonance Relaxometry. J. Soils Sediments 2017, 17, 61–69. [Google Scholar] [CrossRef]
- Sun, B.Y.; Xiao, J.; Li, Z.; Ma, B.; Zhang, L.; Huang, Y.; Bai, L. An analysis of soil detachment capacity under freeze-thaw conditions using the Taguchi method. Catena 2018, 162, 100–107. [Google Scholar] [CrossRef]
- Jian, X.; Cheng, Y.L.; Zhang, Q.W.; Jian, W.J.; Jun, Y. Experimental analysis on the mechanism of shear strength deterioration of undisturbed loess during the freeze-thaw process. J. Civ. Archit. Environ. Eng. 2016, 38, 90–98. [Google Scholar]
- Xie, S.B.; Qu, J.J.; Xu, X.T.; Pang, Y.J. Interactions between freeze–thaw actions, wind erosion desertification, and permafrost in the Qinghai–Tibet Plateau. Nat. Hazard. 2017, 85, 829–850. [Google Scholar] [CrossRef]
- Zhai, Y.Y.; Fang, H.Y. Spatiotemporal variations of freeze-thaw erosion risk during 1991–2020 in the black soil region, northeastern China. Ecol. Indic. 2023, 148, 110149. [Google Scholar] [CrossRef]
- Grogan, P.; Michelsen, A.; Ambus, P.; Jonasson, S. Freeze-thaw regime effects on carbon and nitrogen dynamics in sub-arctic health tundra mesocosms. Soil Biol. Biochem. 2004, 36, 641–654. [Google Scholar] [CrossRef]
- Gao, M.; Li, Y.; Zhang, X.; Zhang, F.; Liu, B.; Gao, S.; Chen, X. Influence of freeze-thaw process on soil physical, chemical and biological properties: A review. J. Agroenviron. Sci. 2016, 35, 2269–2274. [Google Scholar]
- Chen, S.Y.; Zhang, X.Y.; Shao, L.W.; Sun, H.Y.; Niu, J.F.; Liu, X.W. Effects of straw and manure management on soil and crop performance in North China Plain. Catena 2020, 187, 104359. [Google Scholar] [CrossRef]
Disclaimer/Publisher’s Note: The statements, opinions and data contained in all publications are solely those of the individual author(s) and contributor(s) and not of MDPI and/or the editor(s). MDPI and/or the editor(s) disclaim responsibility for any injury to people or property resulting from any ideas, methods, instructions or products referred to in the content. |
© 2025 by the authors. Licensee MDPI, Basel, Switzerland. This article is an open access article distributed under the terms and conditions of the Creative Commons Attribution (CC BY) license (https://creativecommons.org/licenses/by/4.0/).