High-Resolution Dynamical Downscaling Reveals Multi-Scale Evolution of the Surface Wind Field over Hainan Island (1961–2022)
Abstract
1. Introduction
2. Materials and Methods
2.1. Study Area and Climatic Zoning
2.2. Data and Methodology
2.2.1. The Hainan Reanalysis (HNR) Dataset
2.2.2. Datasets for Inter-Comparison and Verification
2.2.3. In Situ Observations for Assimilation and Verification
2.2.4. Large-Scale Circulation and Climate Indices
2.3. Methods
2.3.1. Physical Basis for Seasonal Division
2.3.2. Analysis of the Diurnal Cycle
- 14:00 BJT: Maximum land-sea thermal contrast period with strongest sea breeze development;
- 02:00 BJT: Mature nocturnal land breeze phase following sufficient radiative cooling;
- 07:00 BJT: Near sunrise, marking the critical transition from nocturnal land breeze to daytime sea breeze regime;
- 19:00 BJT: Near sunset, when sea breeze circulation rapidly decays due to cessation of solar radiation.
2.3.3. Long-Term Trend Analysis
2.3.4. Definition of Widespread Strong and Weak Wind Events
2.3.5. Return Period Analysis of Extreme Winds
2.3.6. Identification of Sea-Land Breeze Days (SLBDs)
2.3.7. Wind Power Resource Assessment
2.3.8. Teleconnection Analysis
3. Results
3.1. Verification of the HNR Dataset
3.2. Multi-Scale Climatology and Trends
3.2.1. Annual Mean and Long-Term Trends
3.2.2. Seasonal Patterns and Trends
3.2.3. Diurnal Evolution of the Wind Field
Nocturnal and Early Morning Regime (02:00 and 07:00 BJT)
Afternoon Peak and Sea-Breeze Development (14:00 BJT)
Evening Transition (19:00 BJT)
3.3. Frequency and Trends of Extreme Wind Events
3.3.1. Strong Wind Days
3.3.2. Weak Wind Days
3.3.3. Changes in Extreme Wind Speed Return Periods
Baseline Climatology (1991–2020)
Decadal Changes in Return Levels (1991–2020 vs. 1961–1990)
3.4. Climatology and Trends of Sea-Land Breeze Days (SLBDs)
3.5. Spatial Patterns and Stability of Wind Power Resources
3.6. Teleconnection Patterns Analysis
4. Discussion
5. Conclusions
- (1)
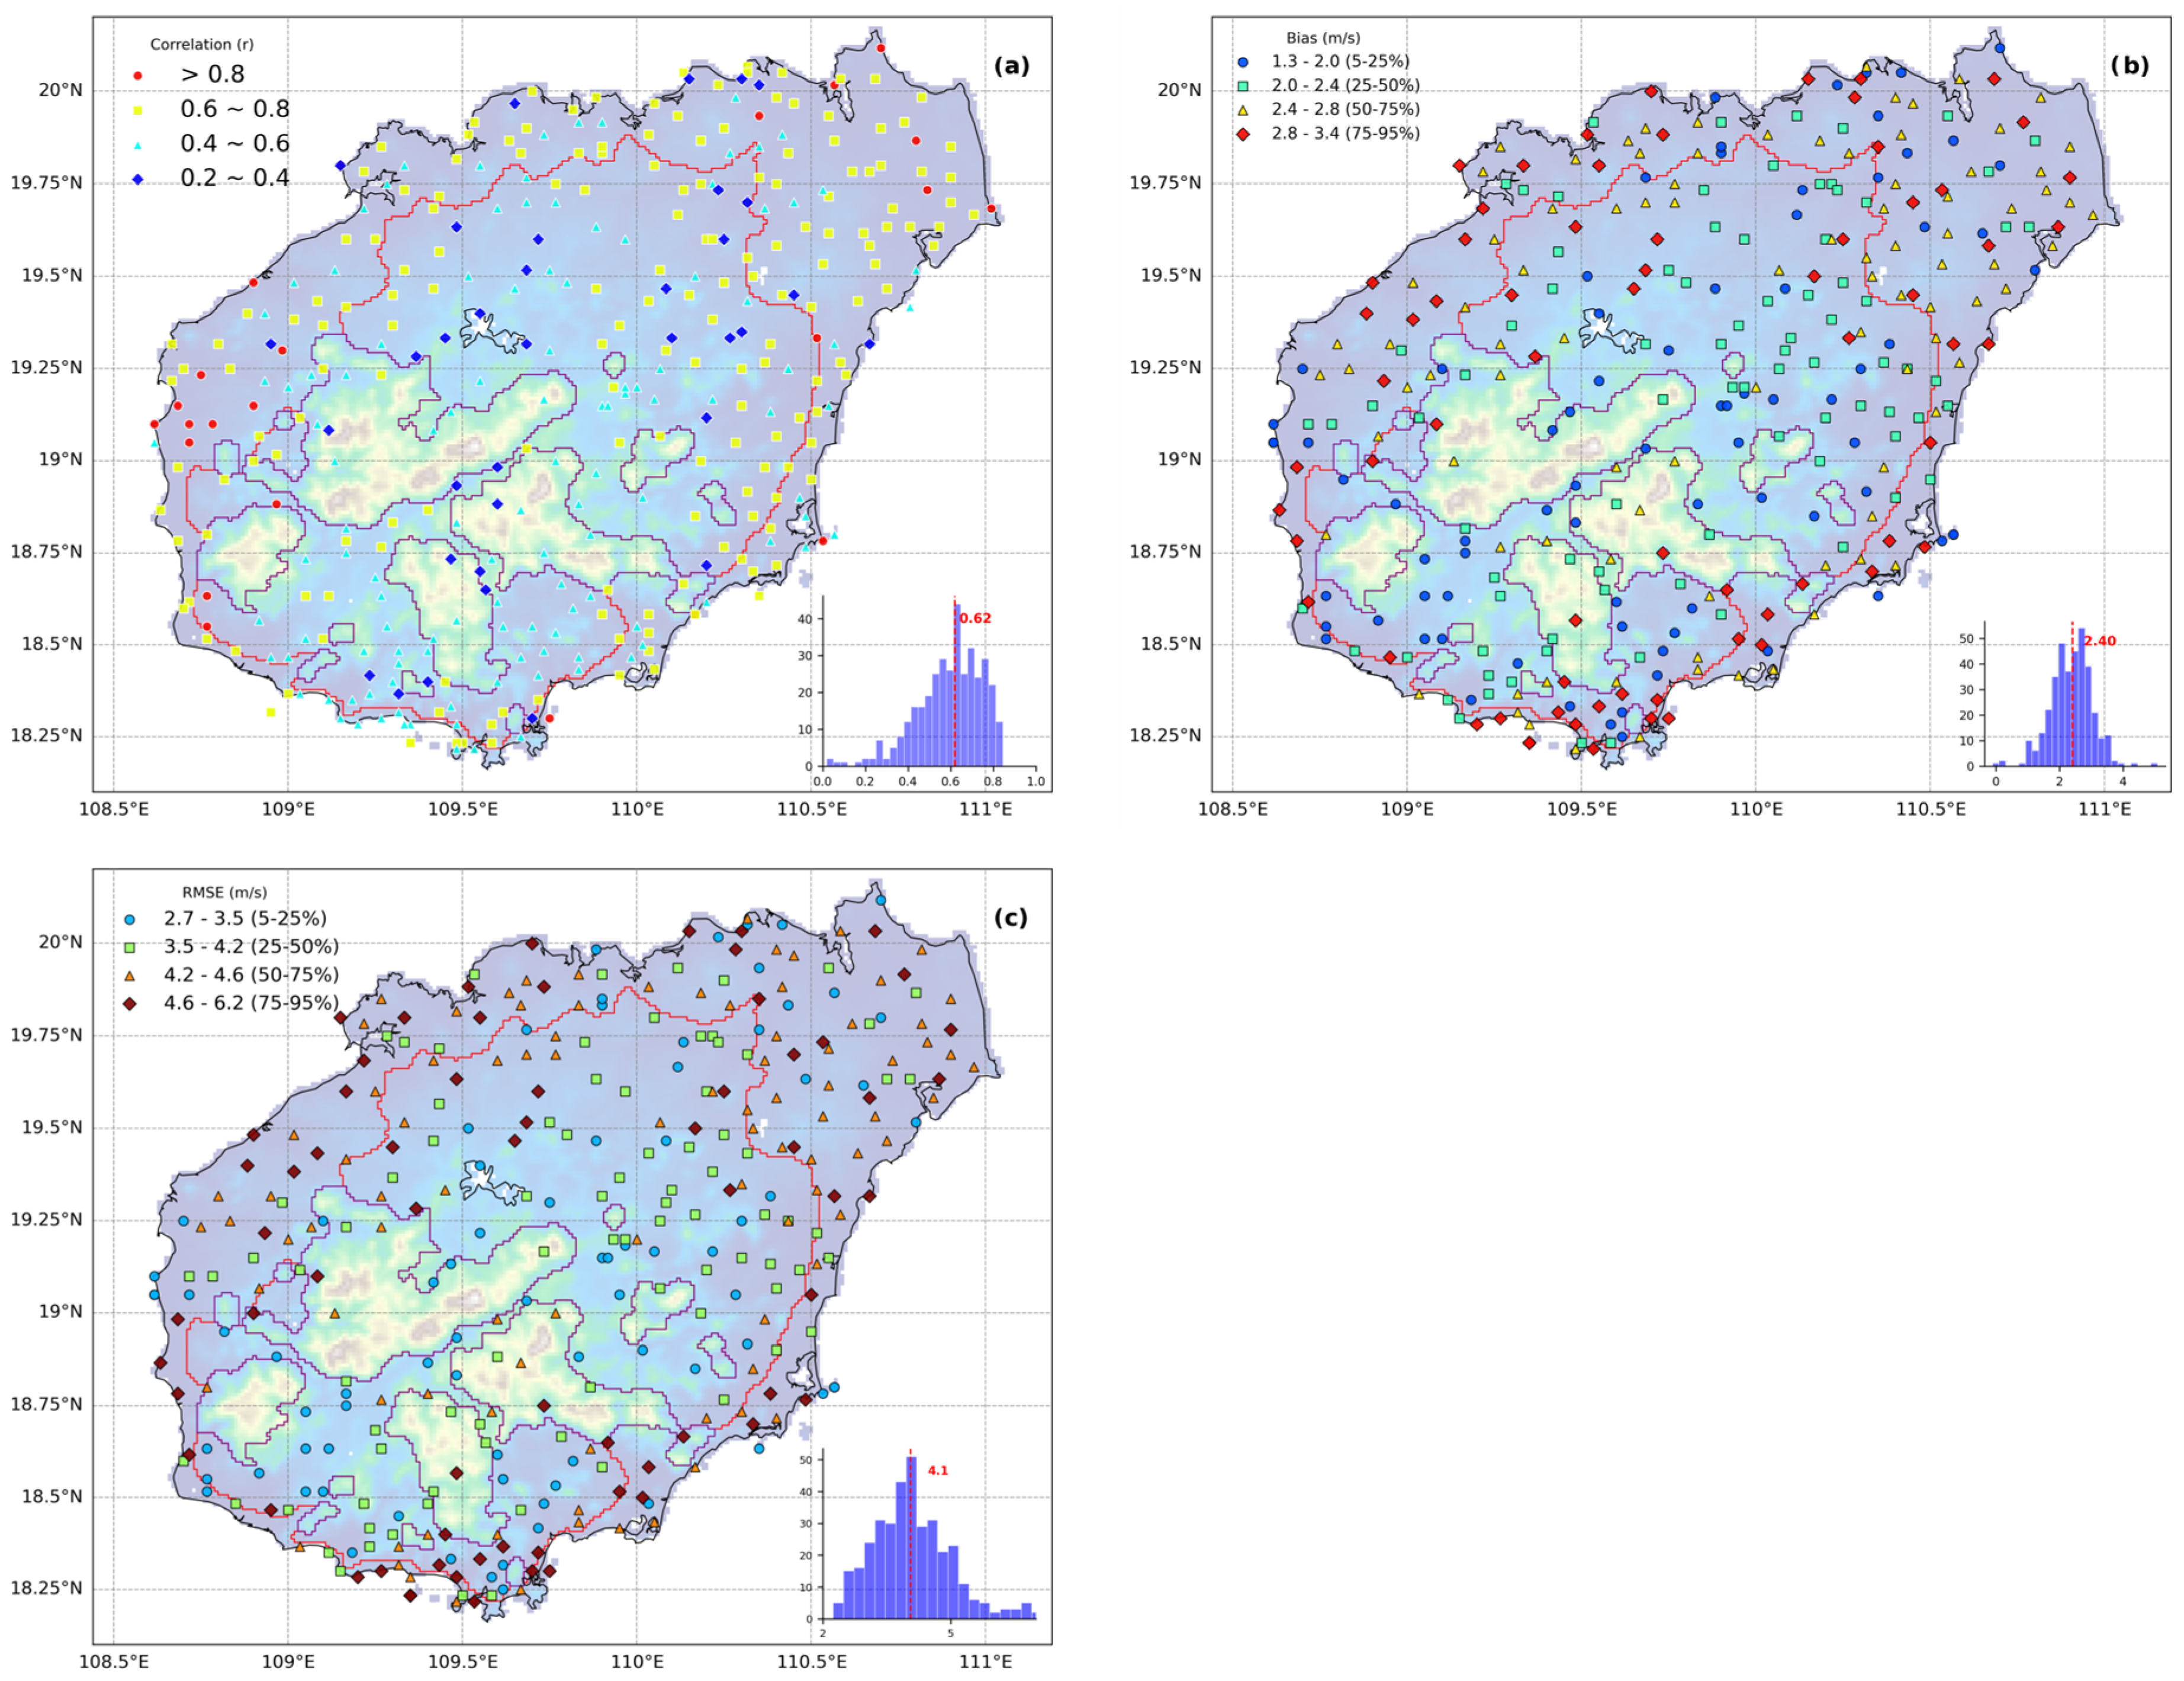
- The HNR dataset provides a robust foundation for regional climate analysis. Comprehensive verification against multi-source datasets and in-situ observations demonstrates that the HNR exhibits superior long-term homogeneity and high-fidelity representation of recent conditions. It successfully overcomes biases present in raw station data and accurately reproduces the topographically governed “strong coastal, weak inland” climatological wind patterns. Furthermore, its high spatiotemporal resolution makes it a valuable asset for future, event-based case studies, such as the detailed hindcasting of specific tropical storms.
- (2)
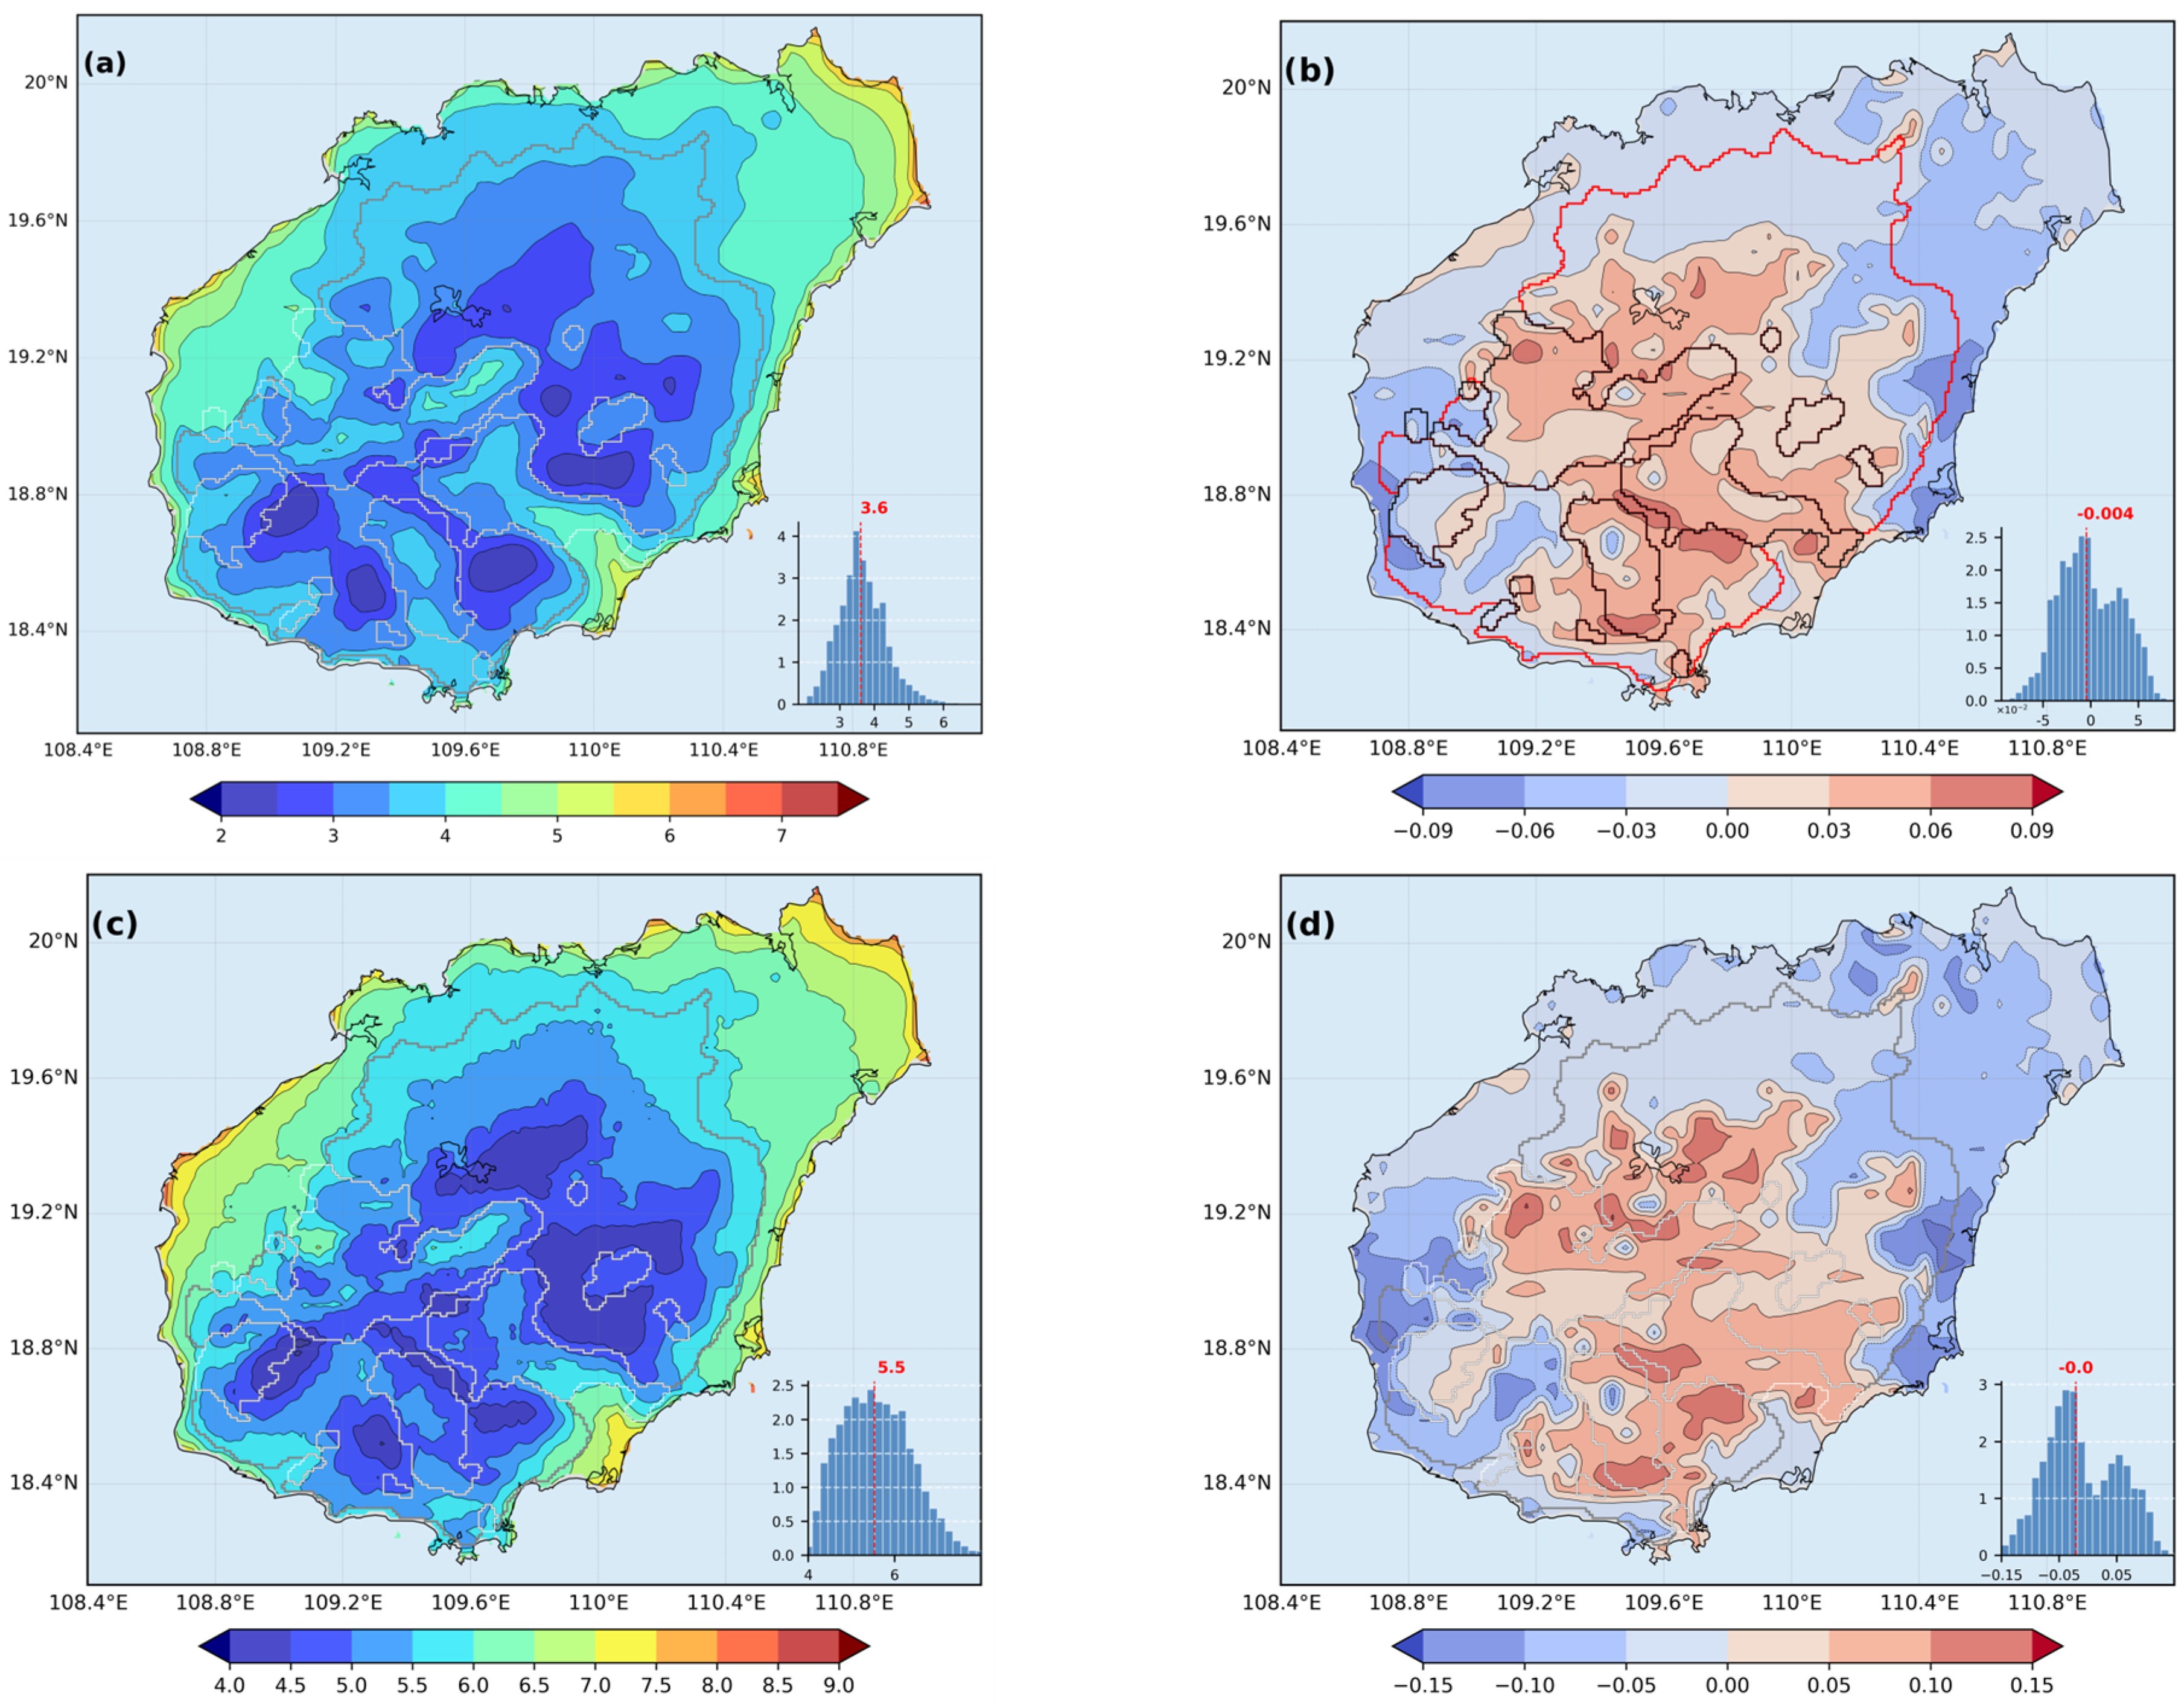
- Hainan’s long-term wind speed trends exhibit significant and spatially heterogeneous dipole patterns of “coastal stilling, inland strengthening.” Over the past six decades, annual mean wind speed in coastal plains has decreased at rates of −0.03 to −0.09 m/s decade−1, while wind speed in mountainous interiors has paradoxically increased, with rates up to +0.06 m/s decade−1. This unique pattern represents a composite result of systematic East Asian Winter Monsoon weakening interacting with local topographically forced dynamics.
- (3)
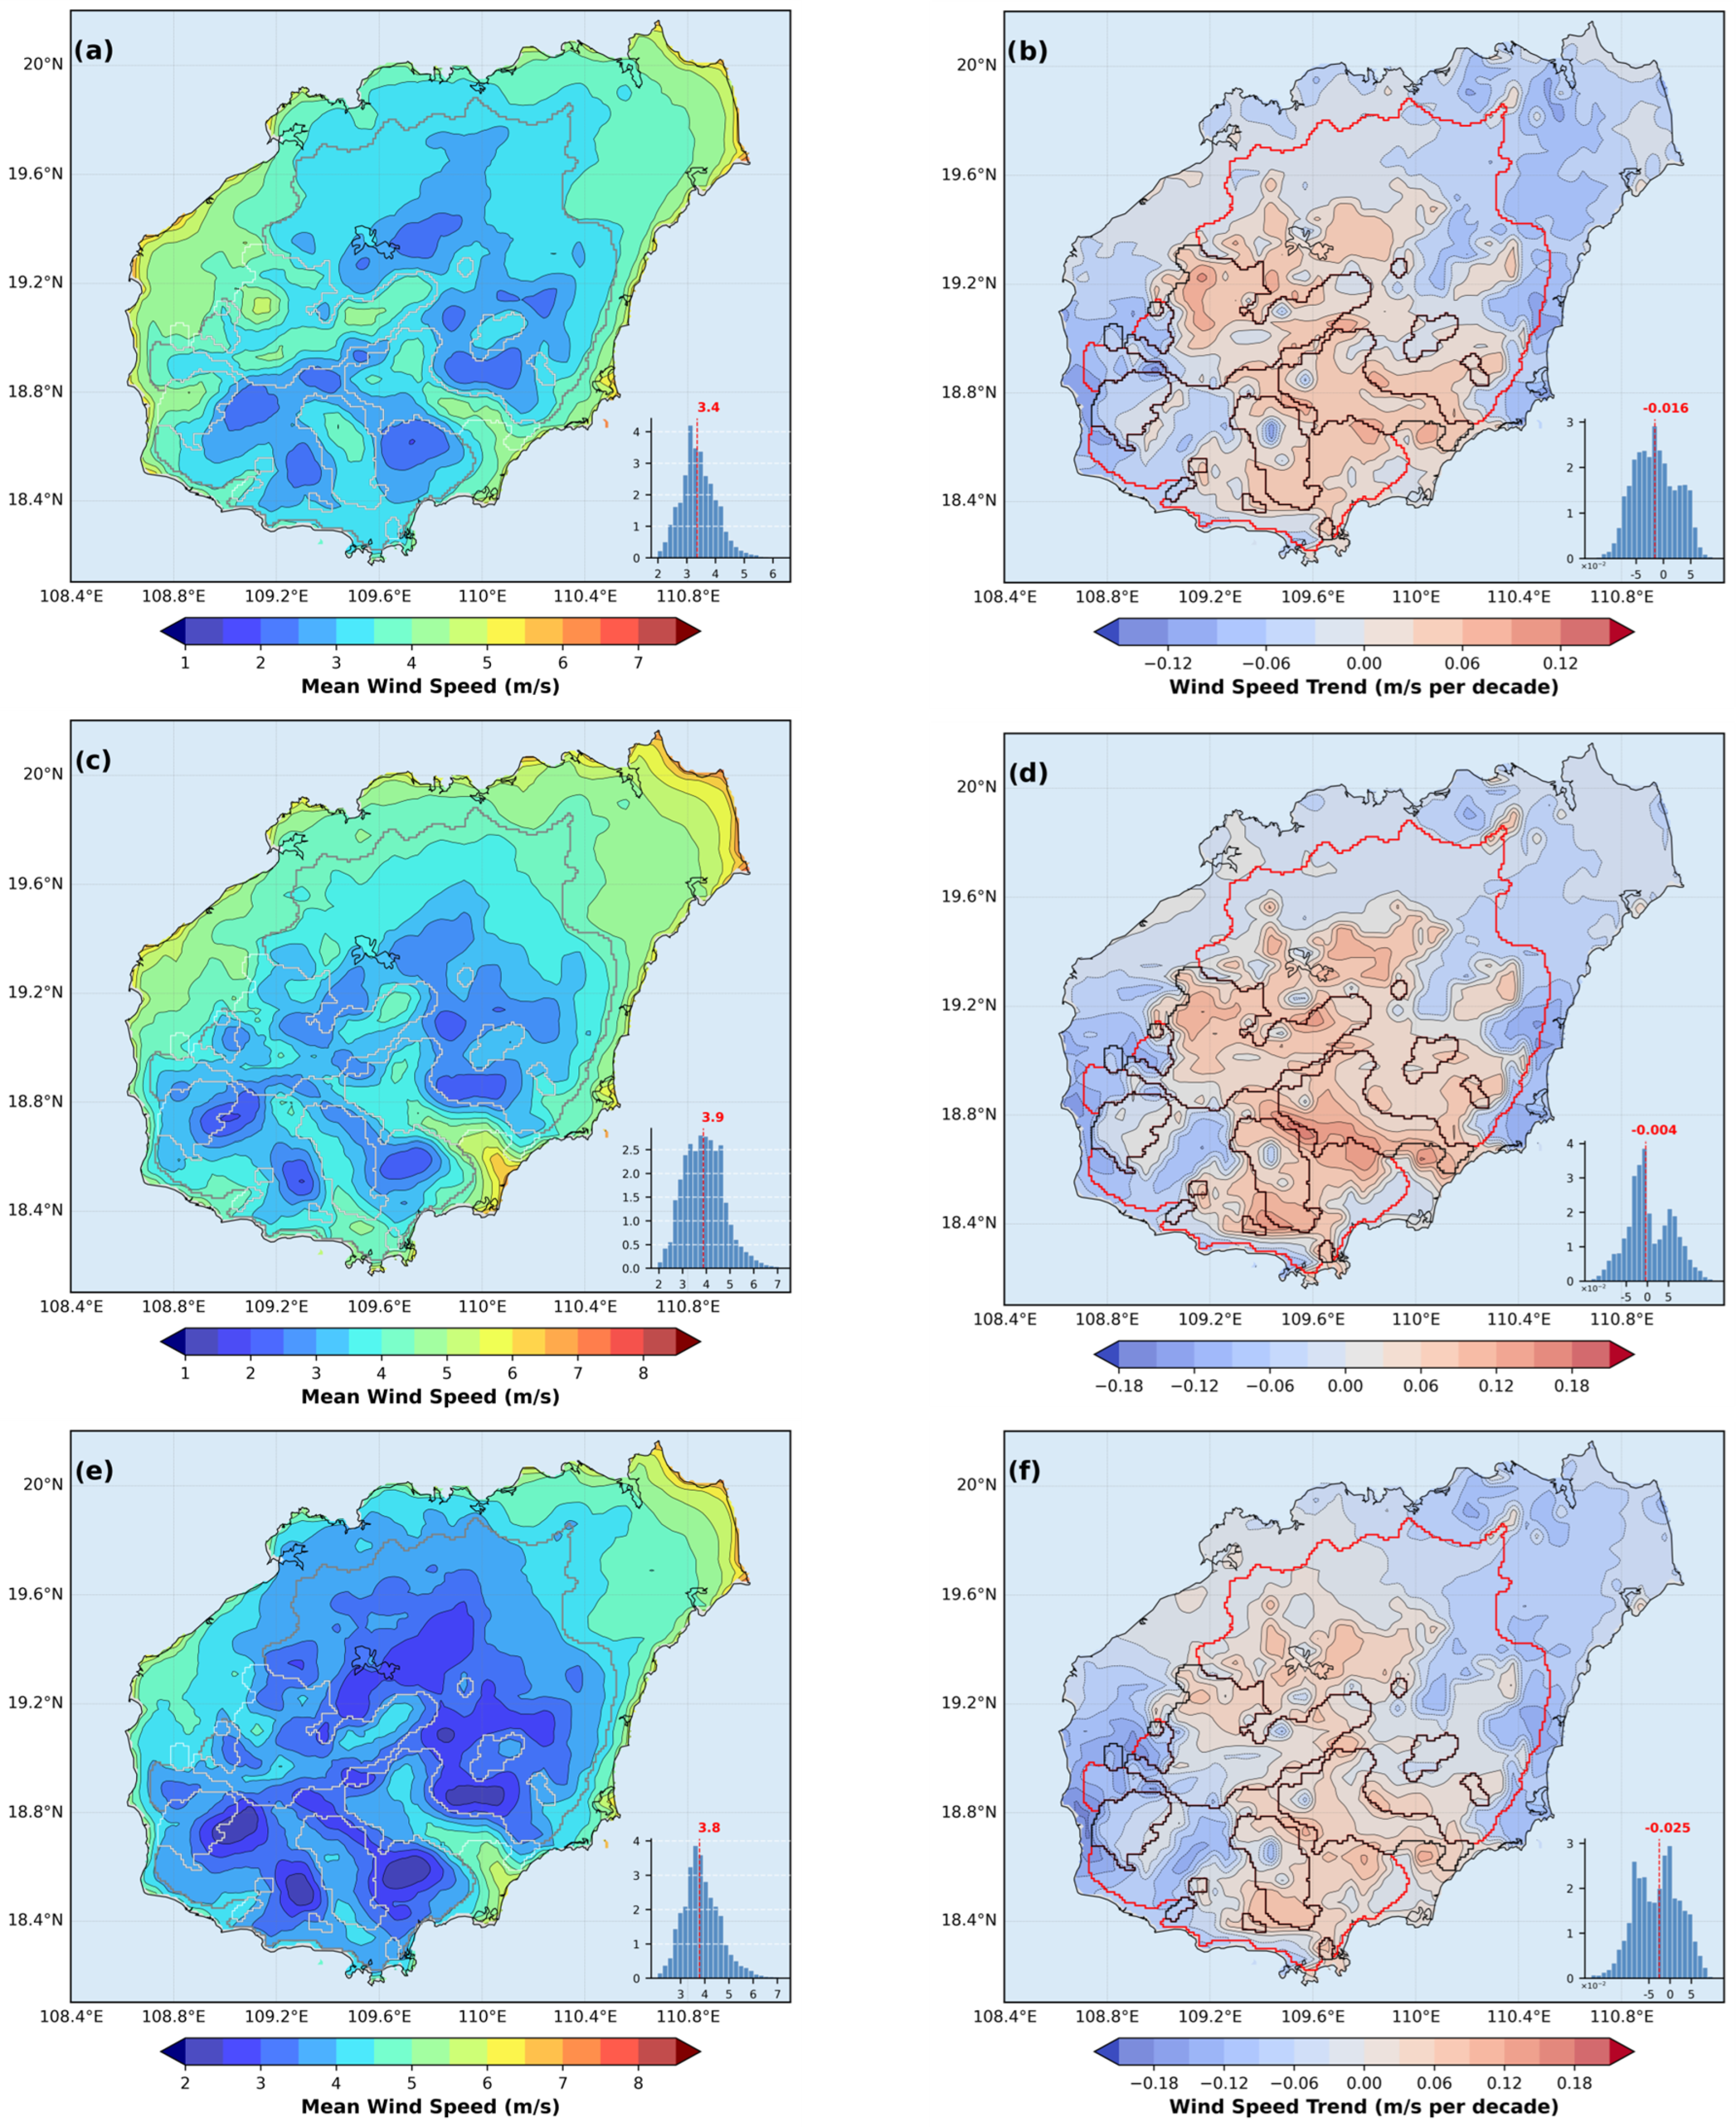
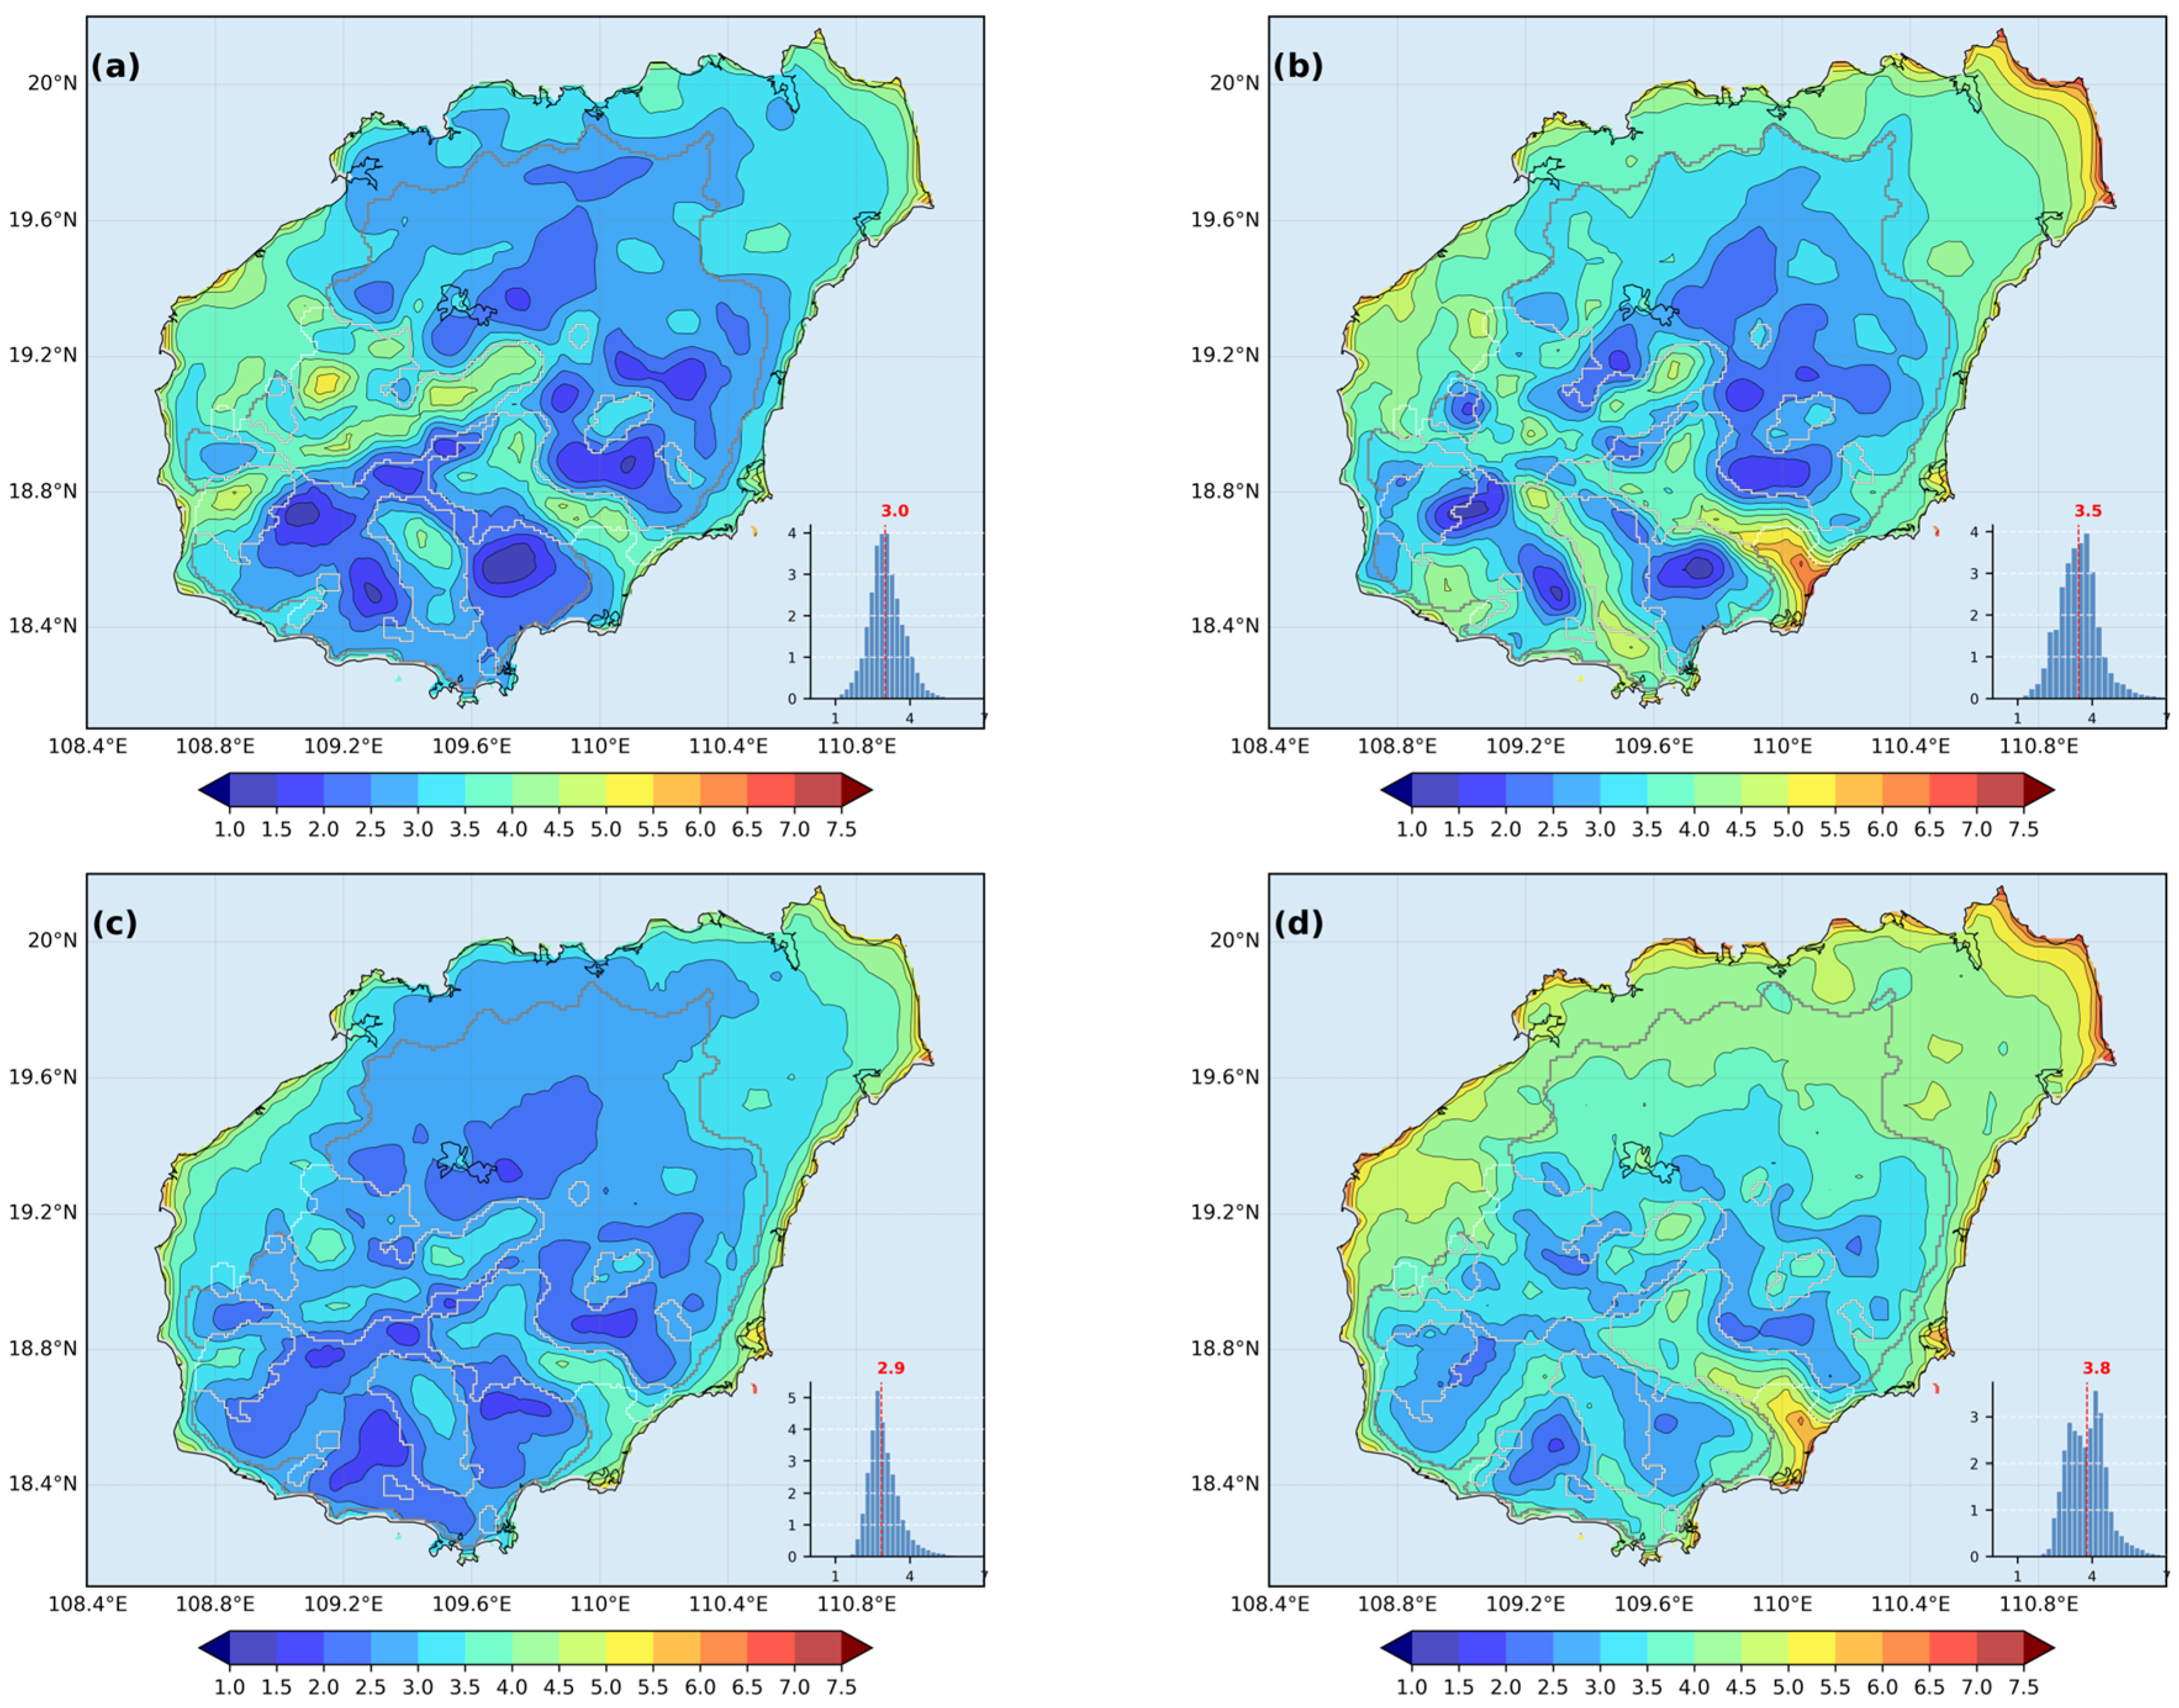
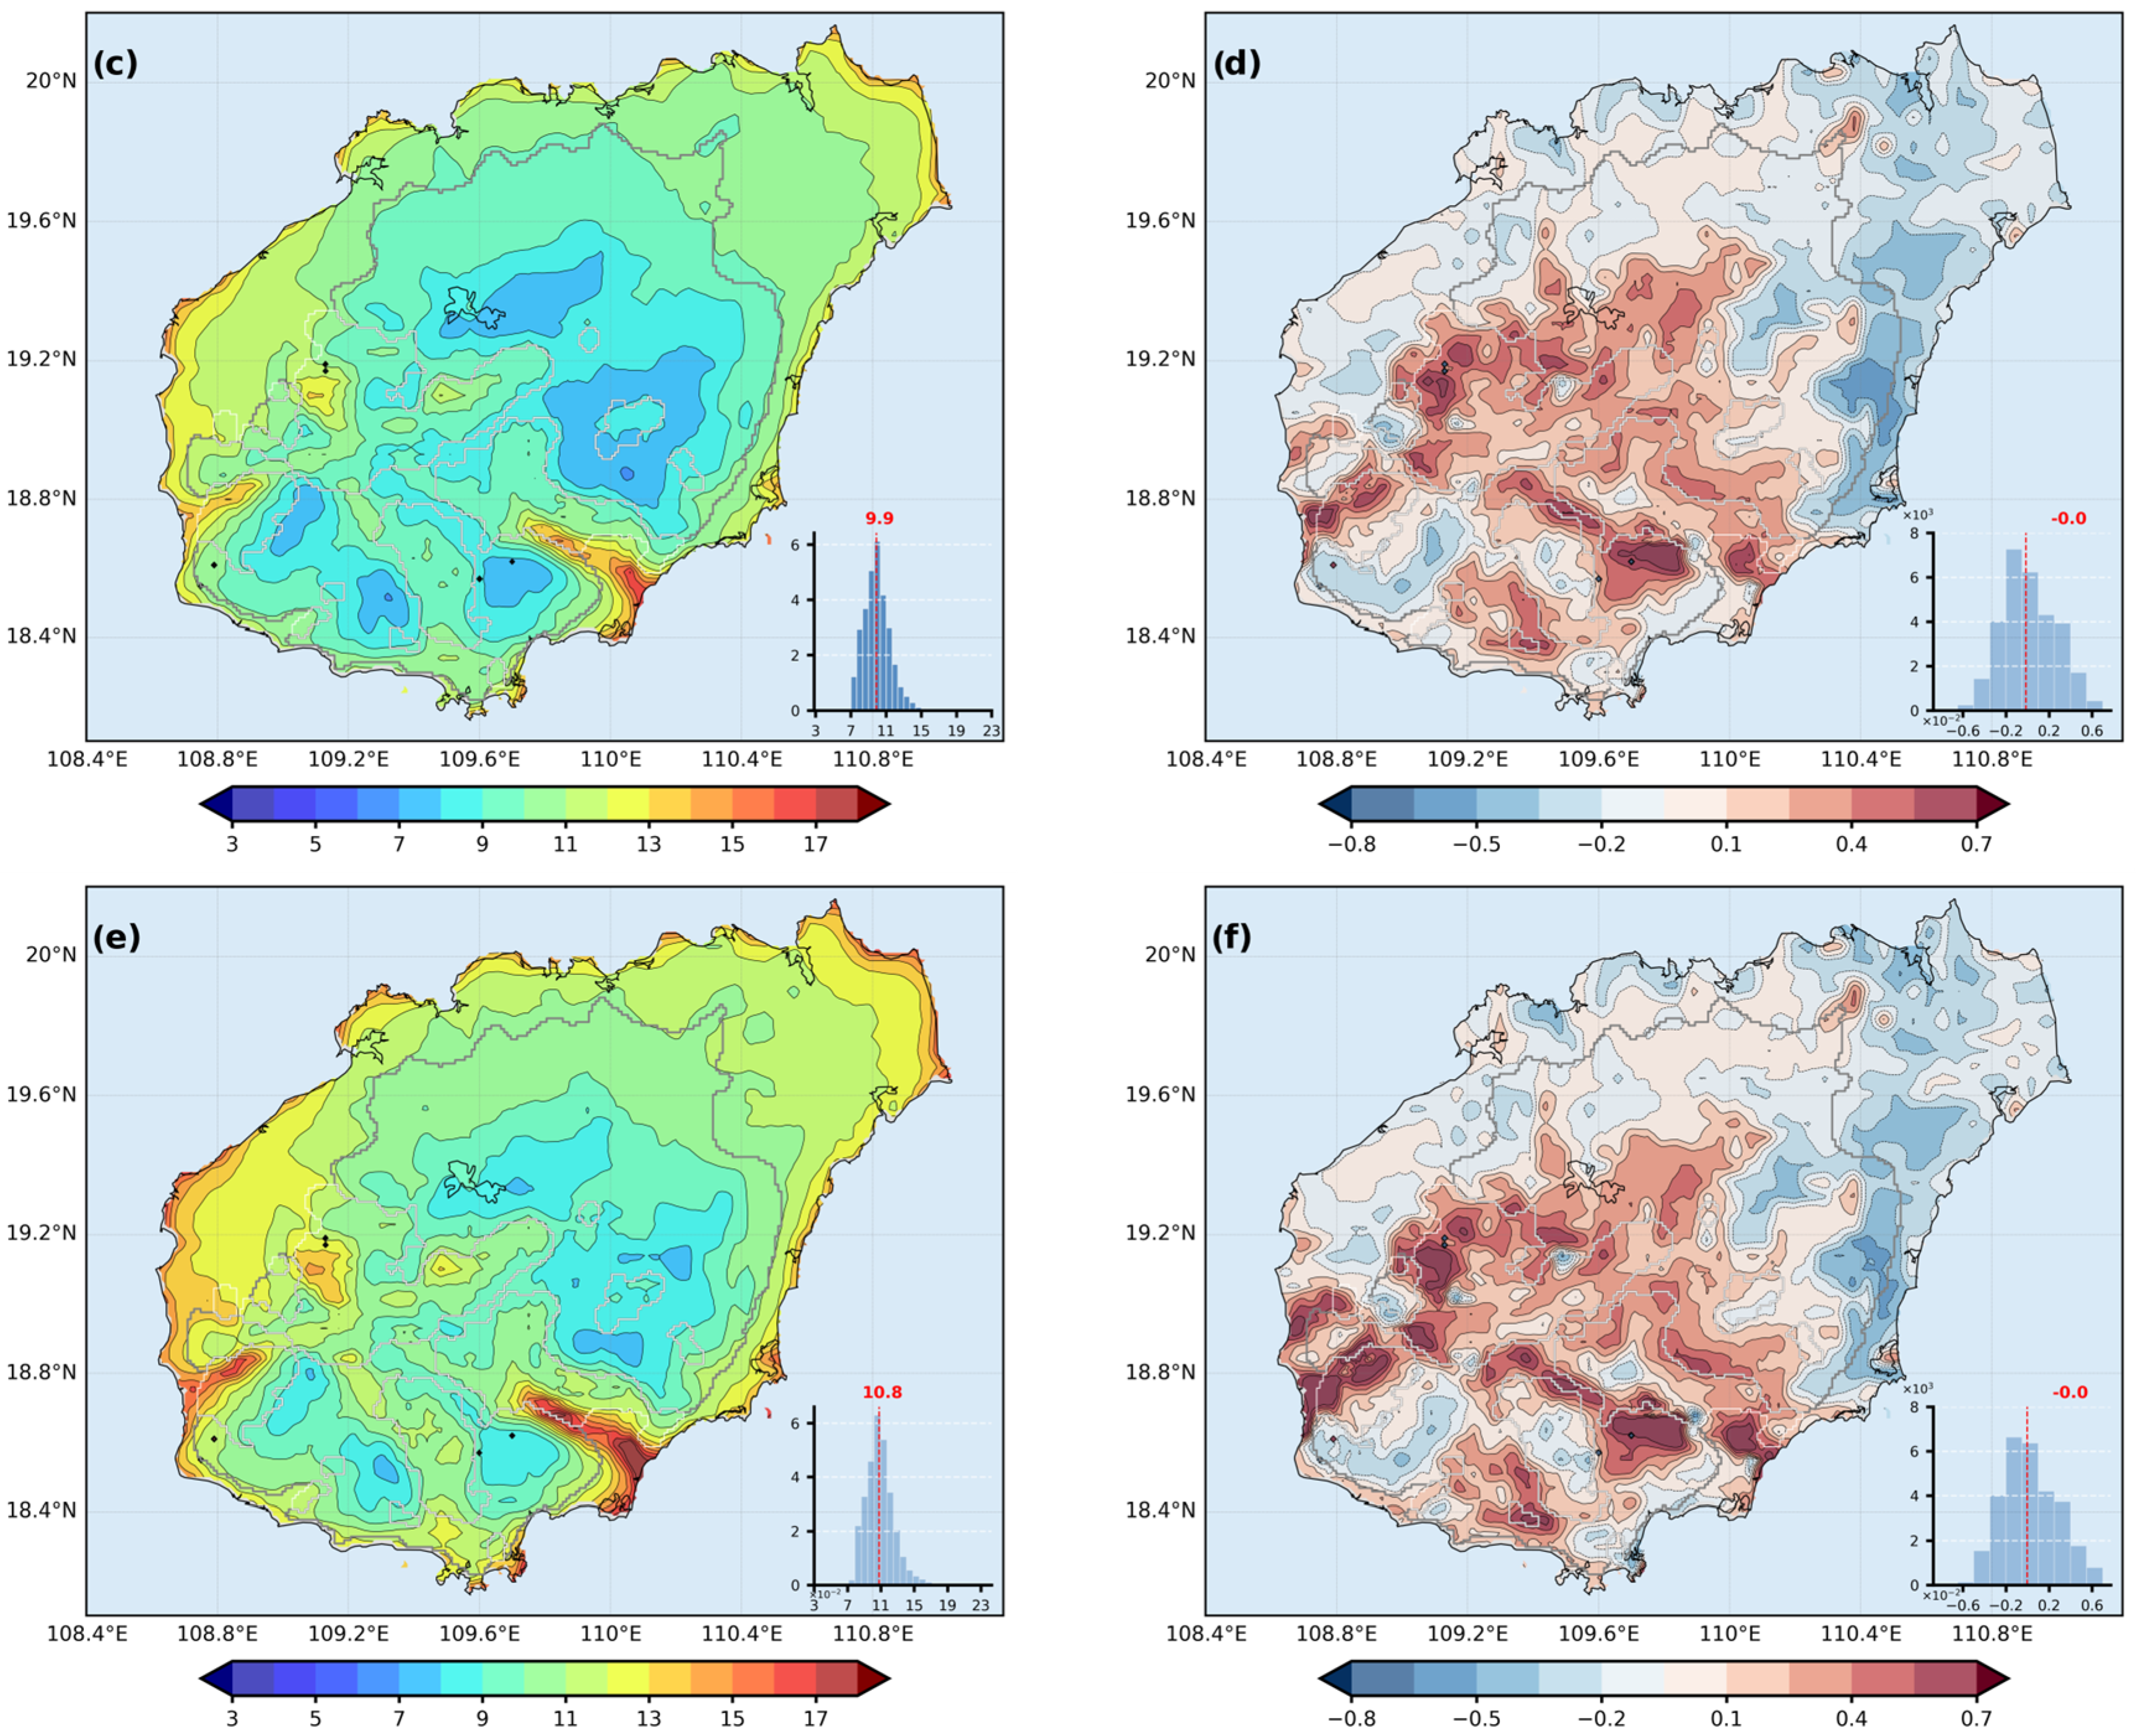
- Long-term wind speed trends are strongly modulated by seasonal and diurnal cycles. On seasonal scales, the stilling trend is most pronounced during the cold season (with coastal rates of −0.06 to −0.12 m/s decade−1) and monsoon transition periods. On diurnal scales, trend signals are clearest during afternoon hours when sea breezes peak and at night when background synoptic flow dominates, revealing a complex interplay between large-scale climate change and local cyclic phenomena.
- (4)
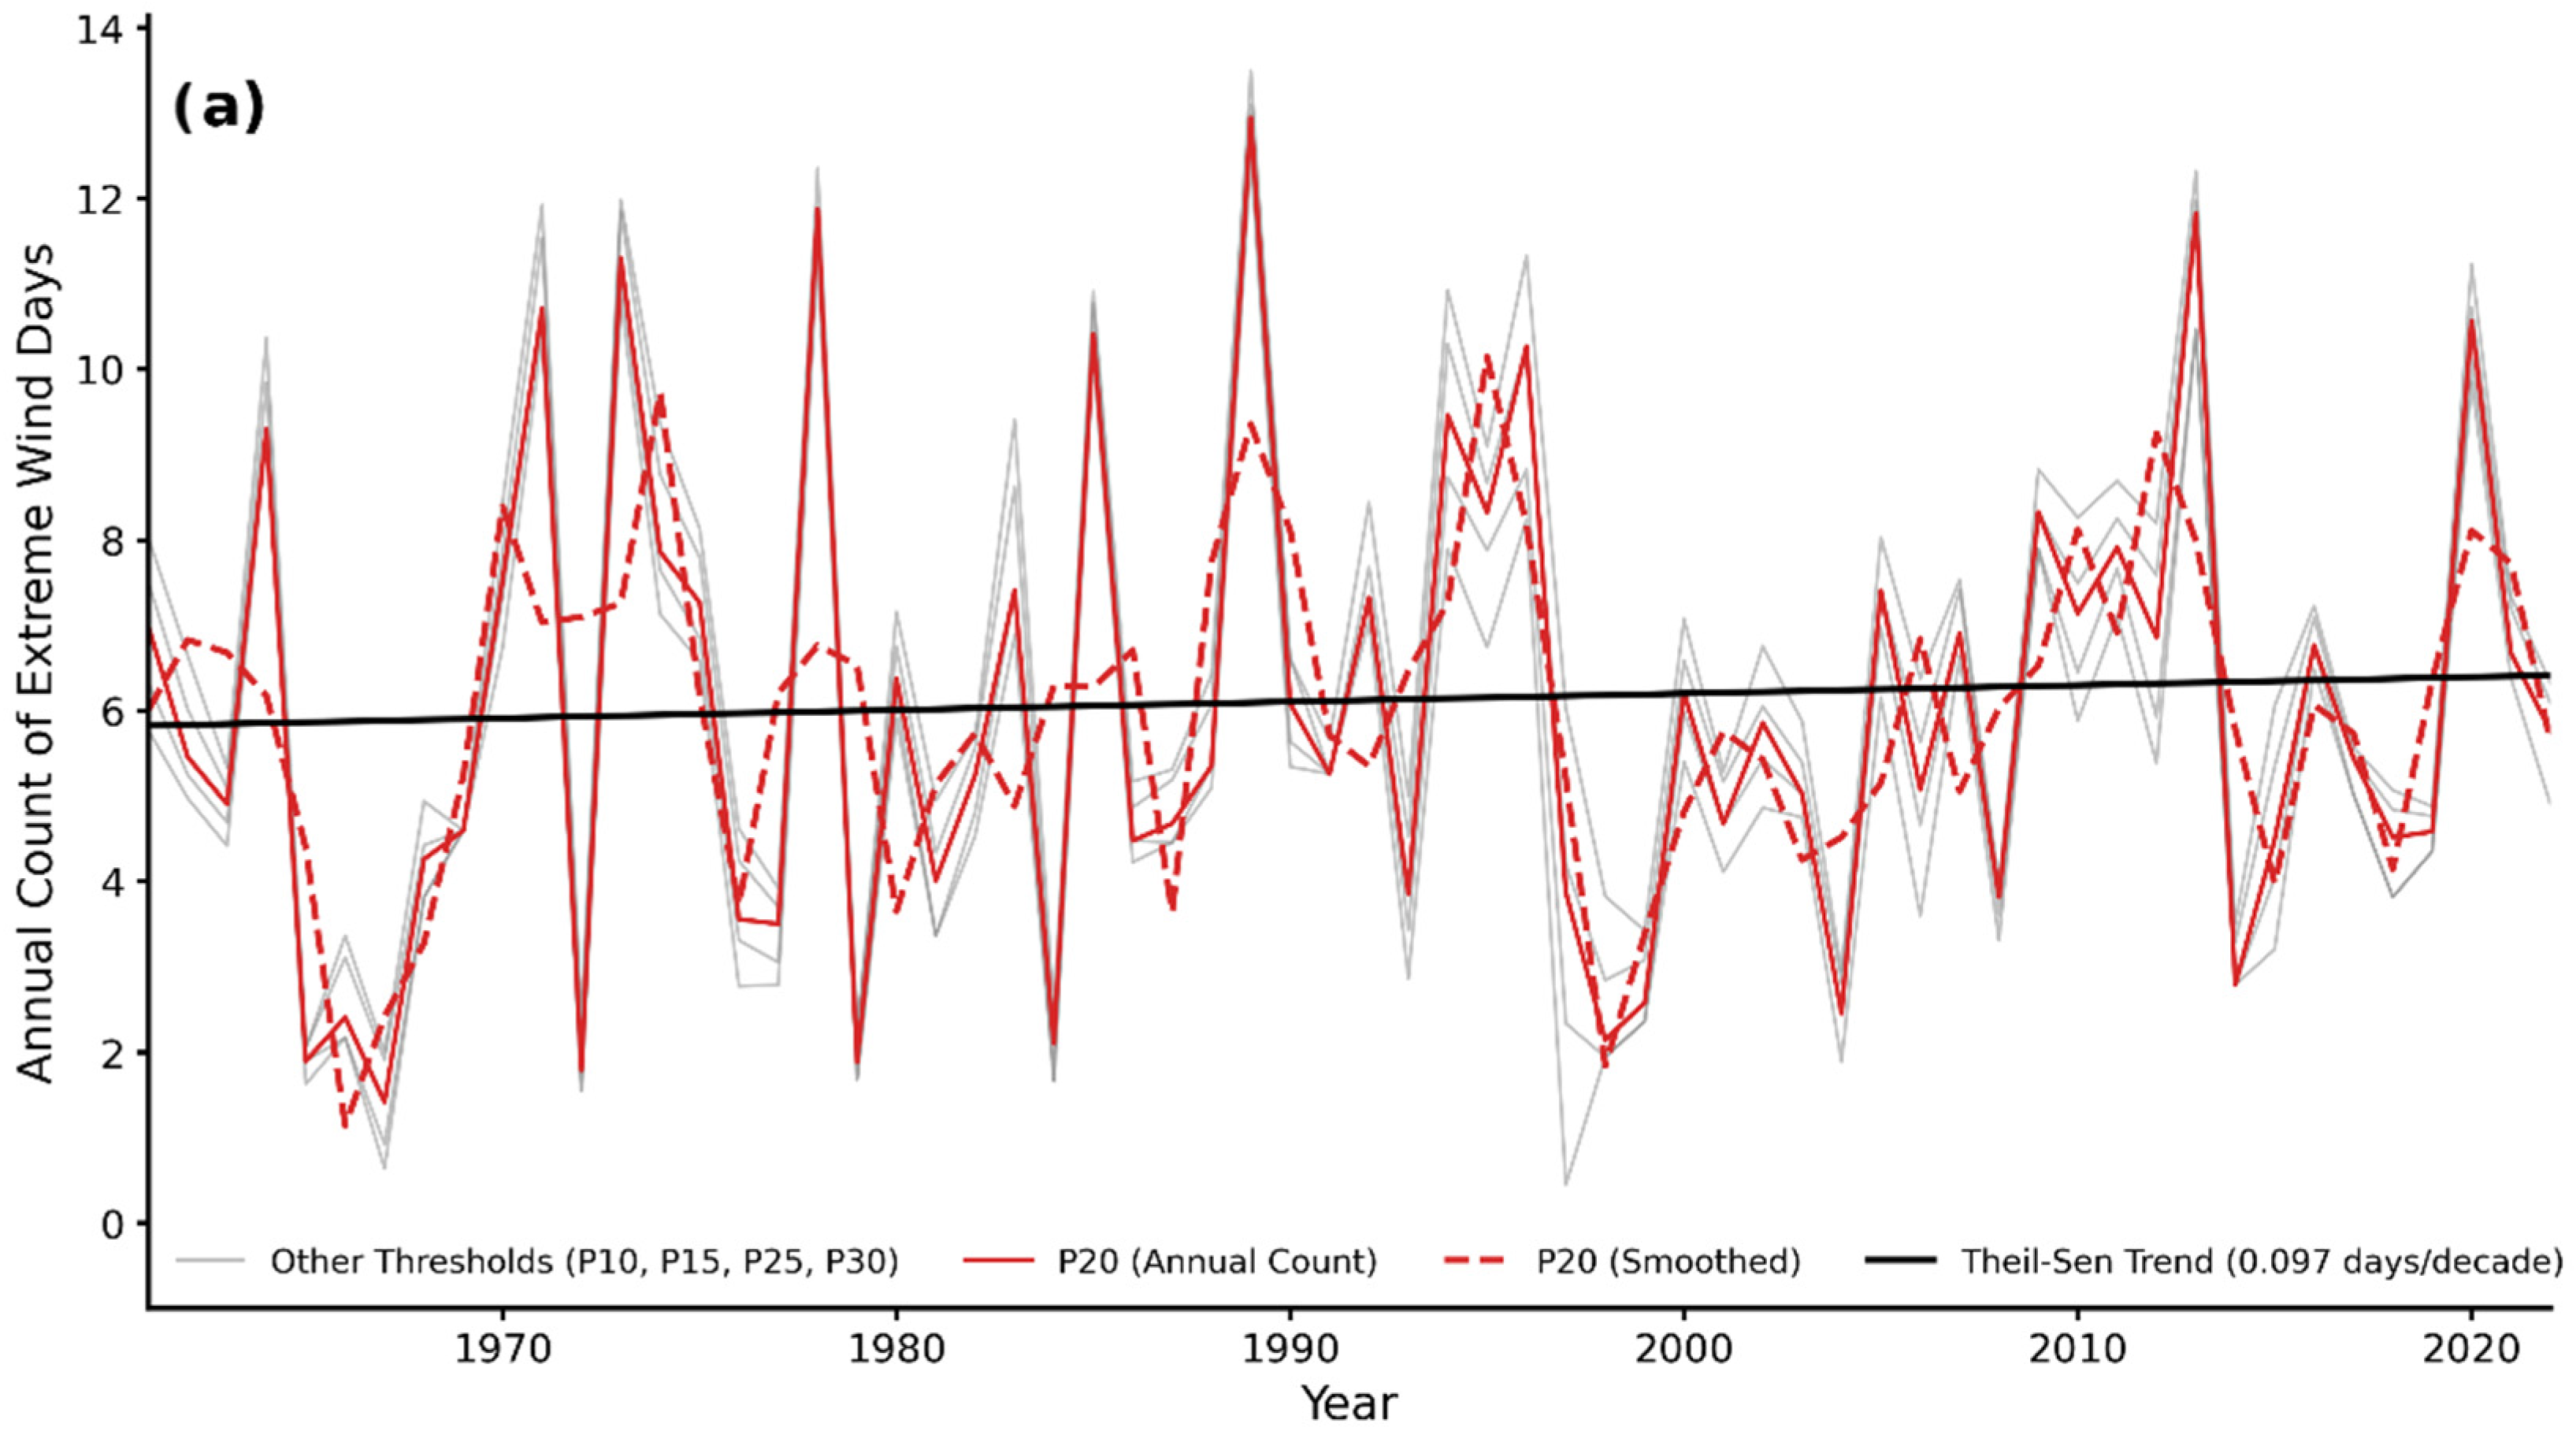
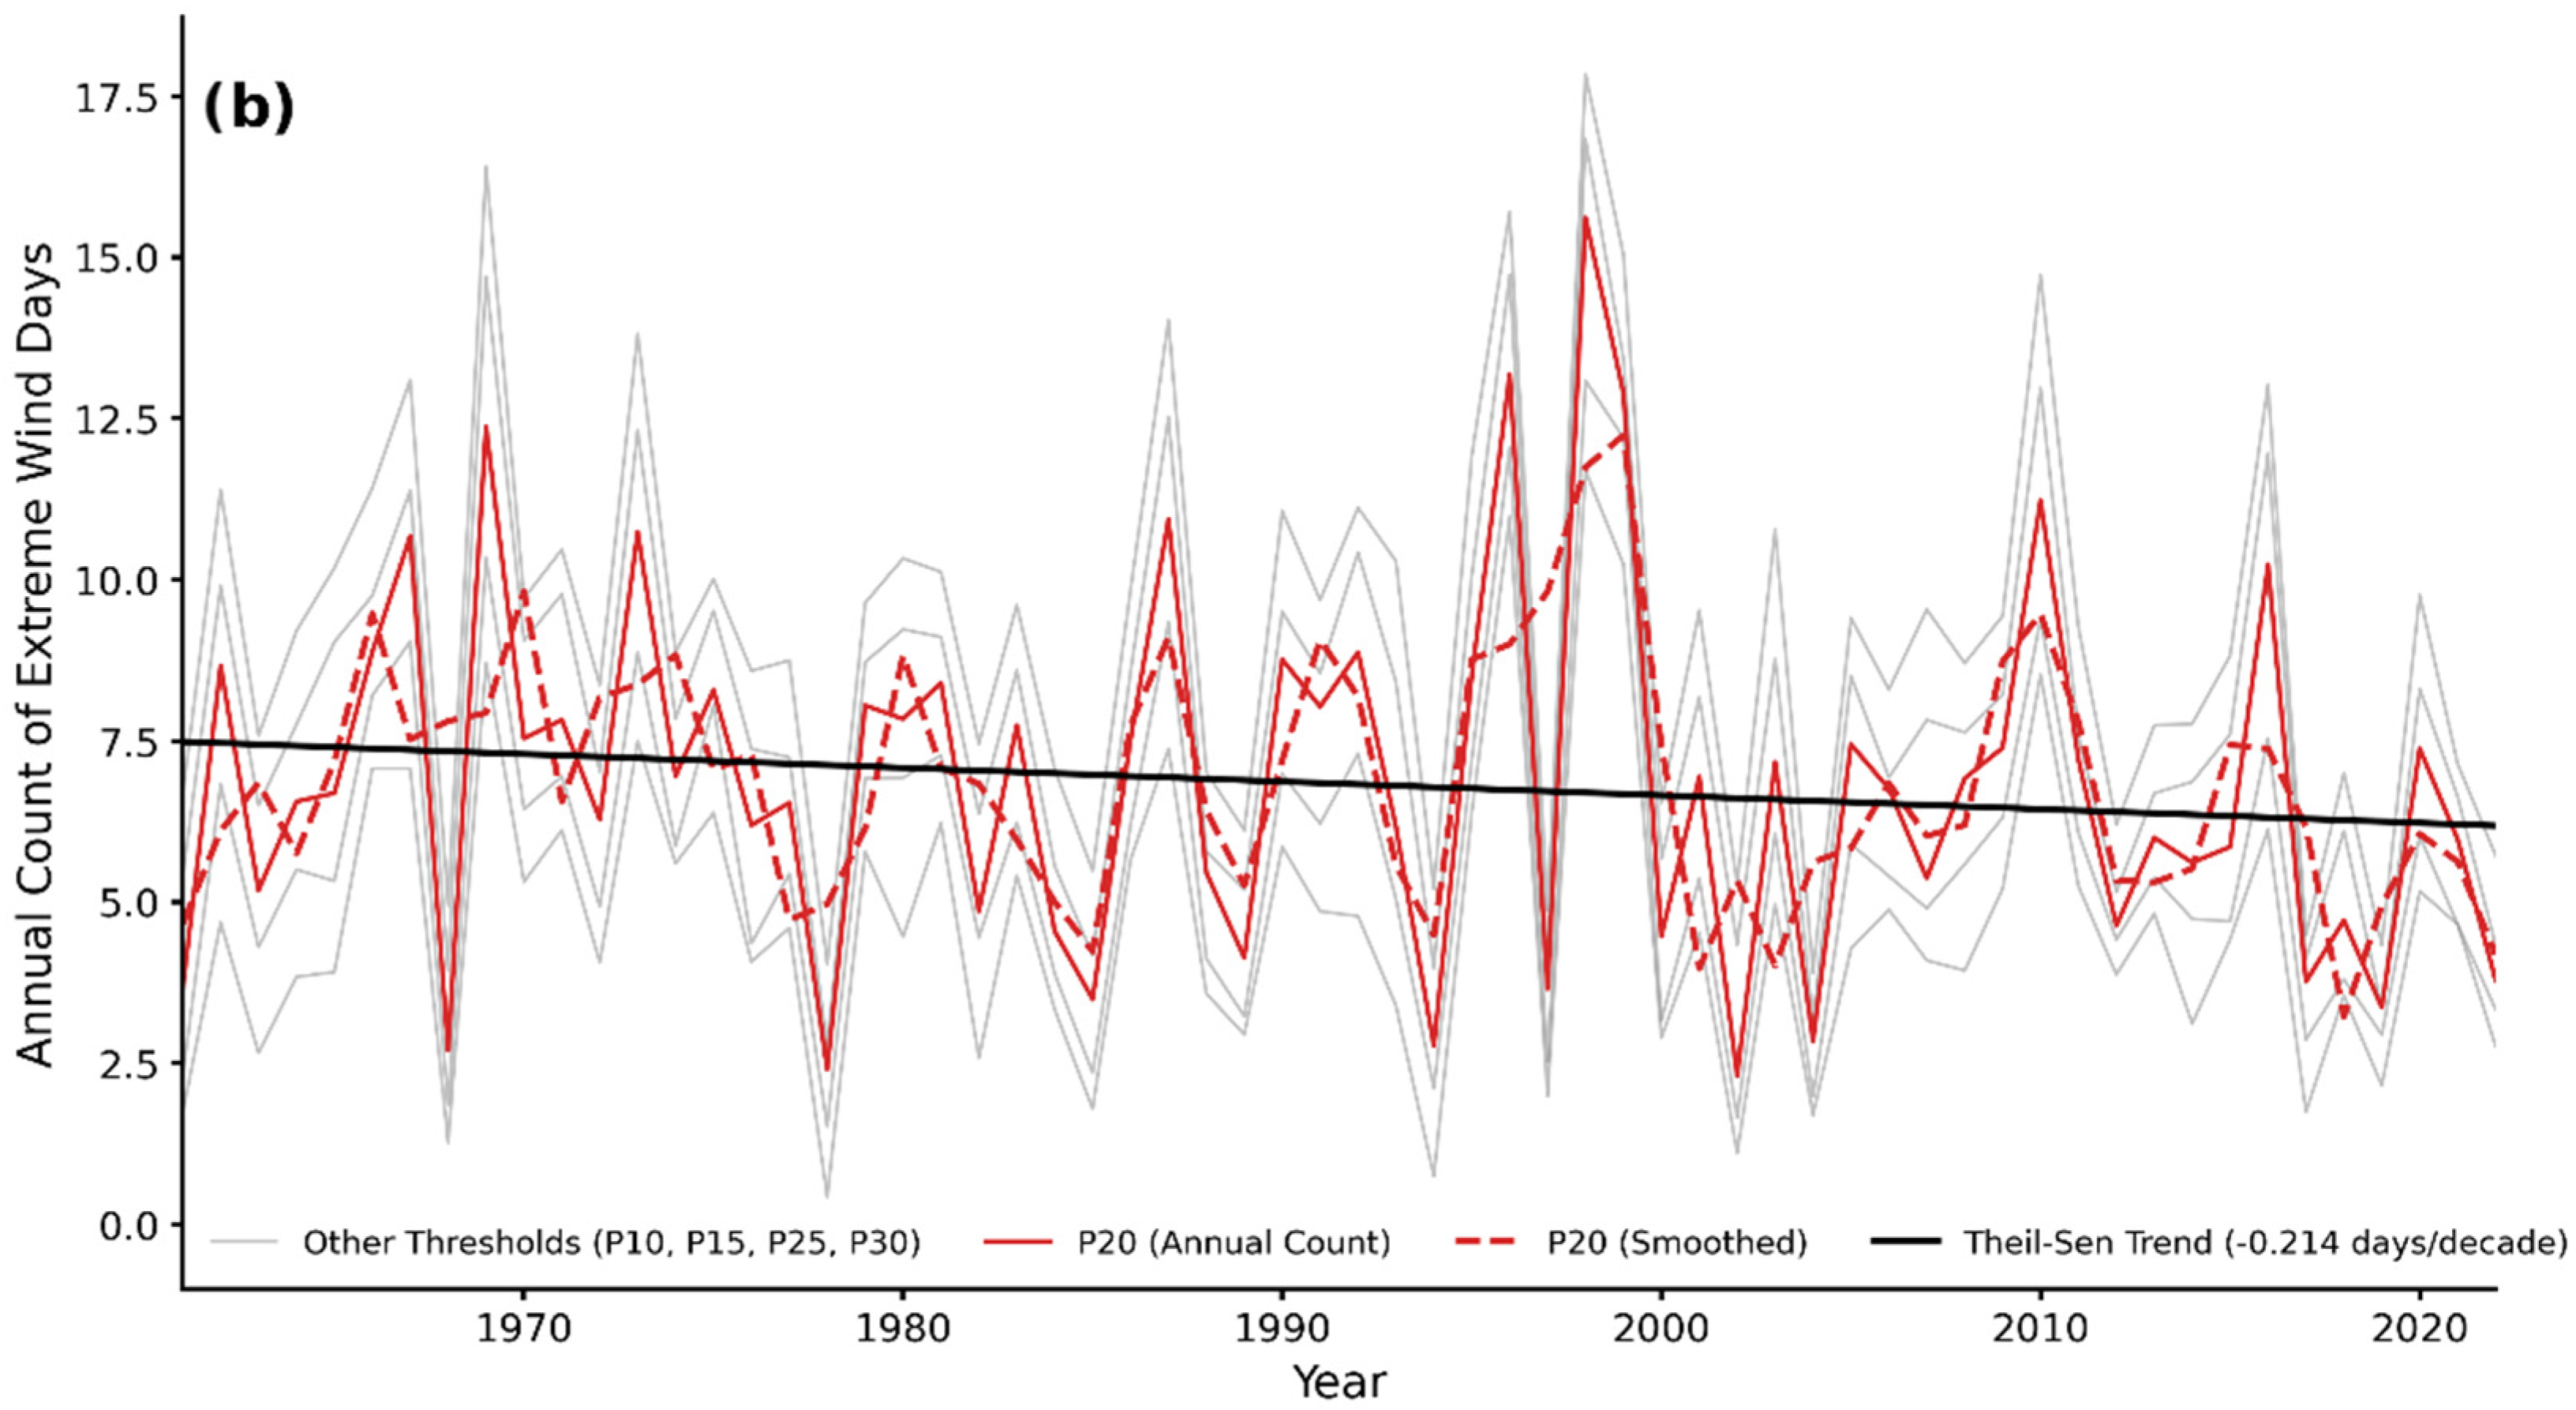
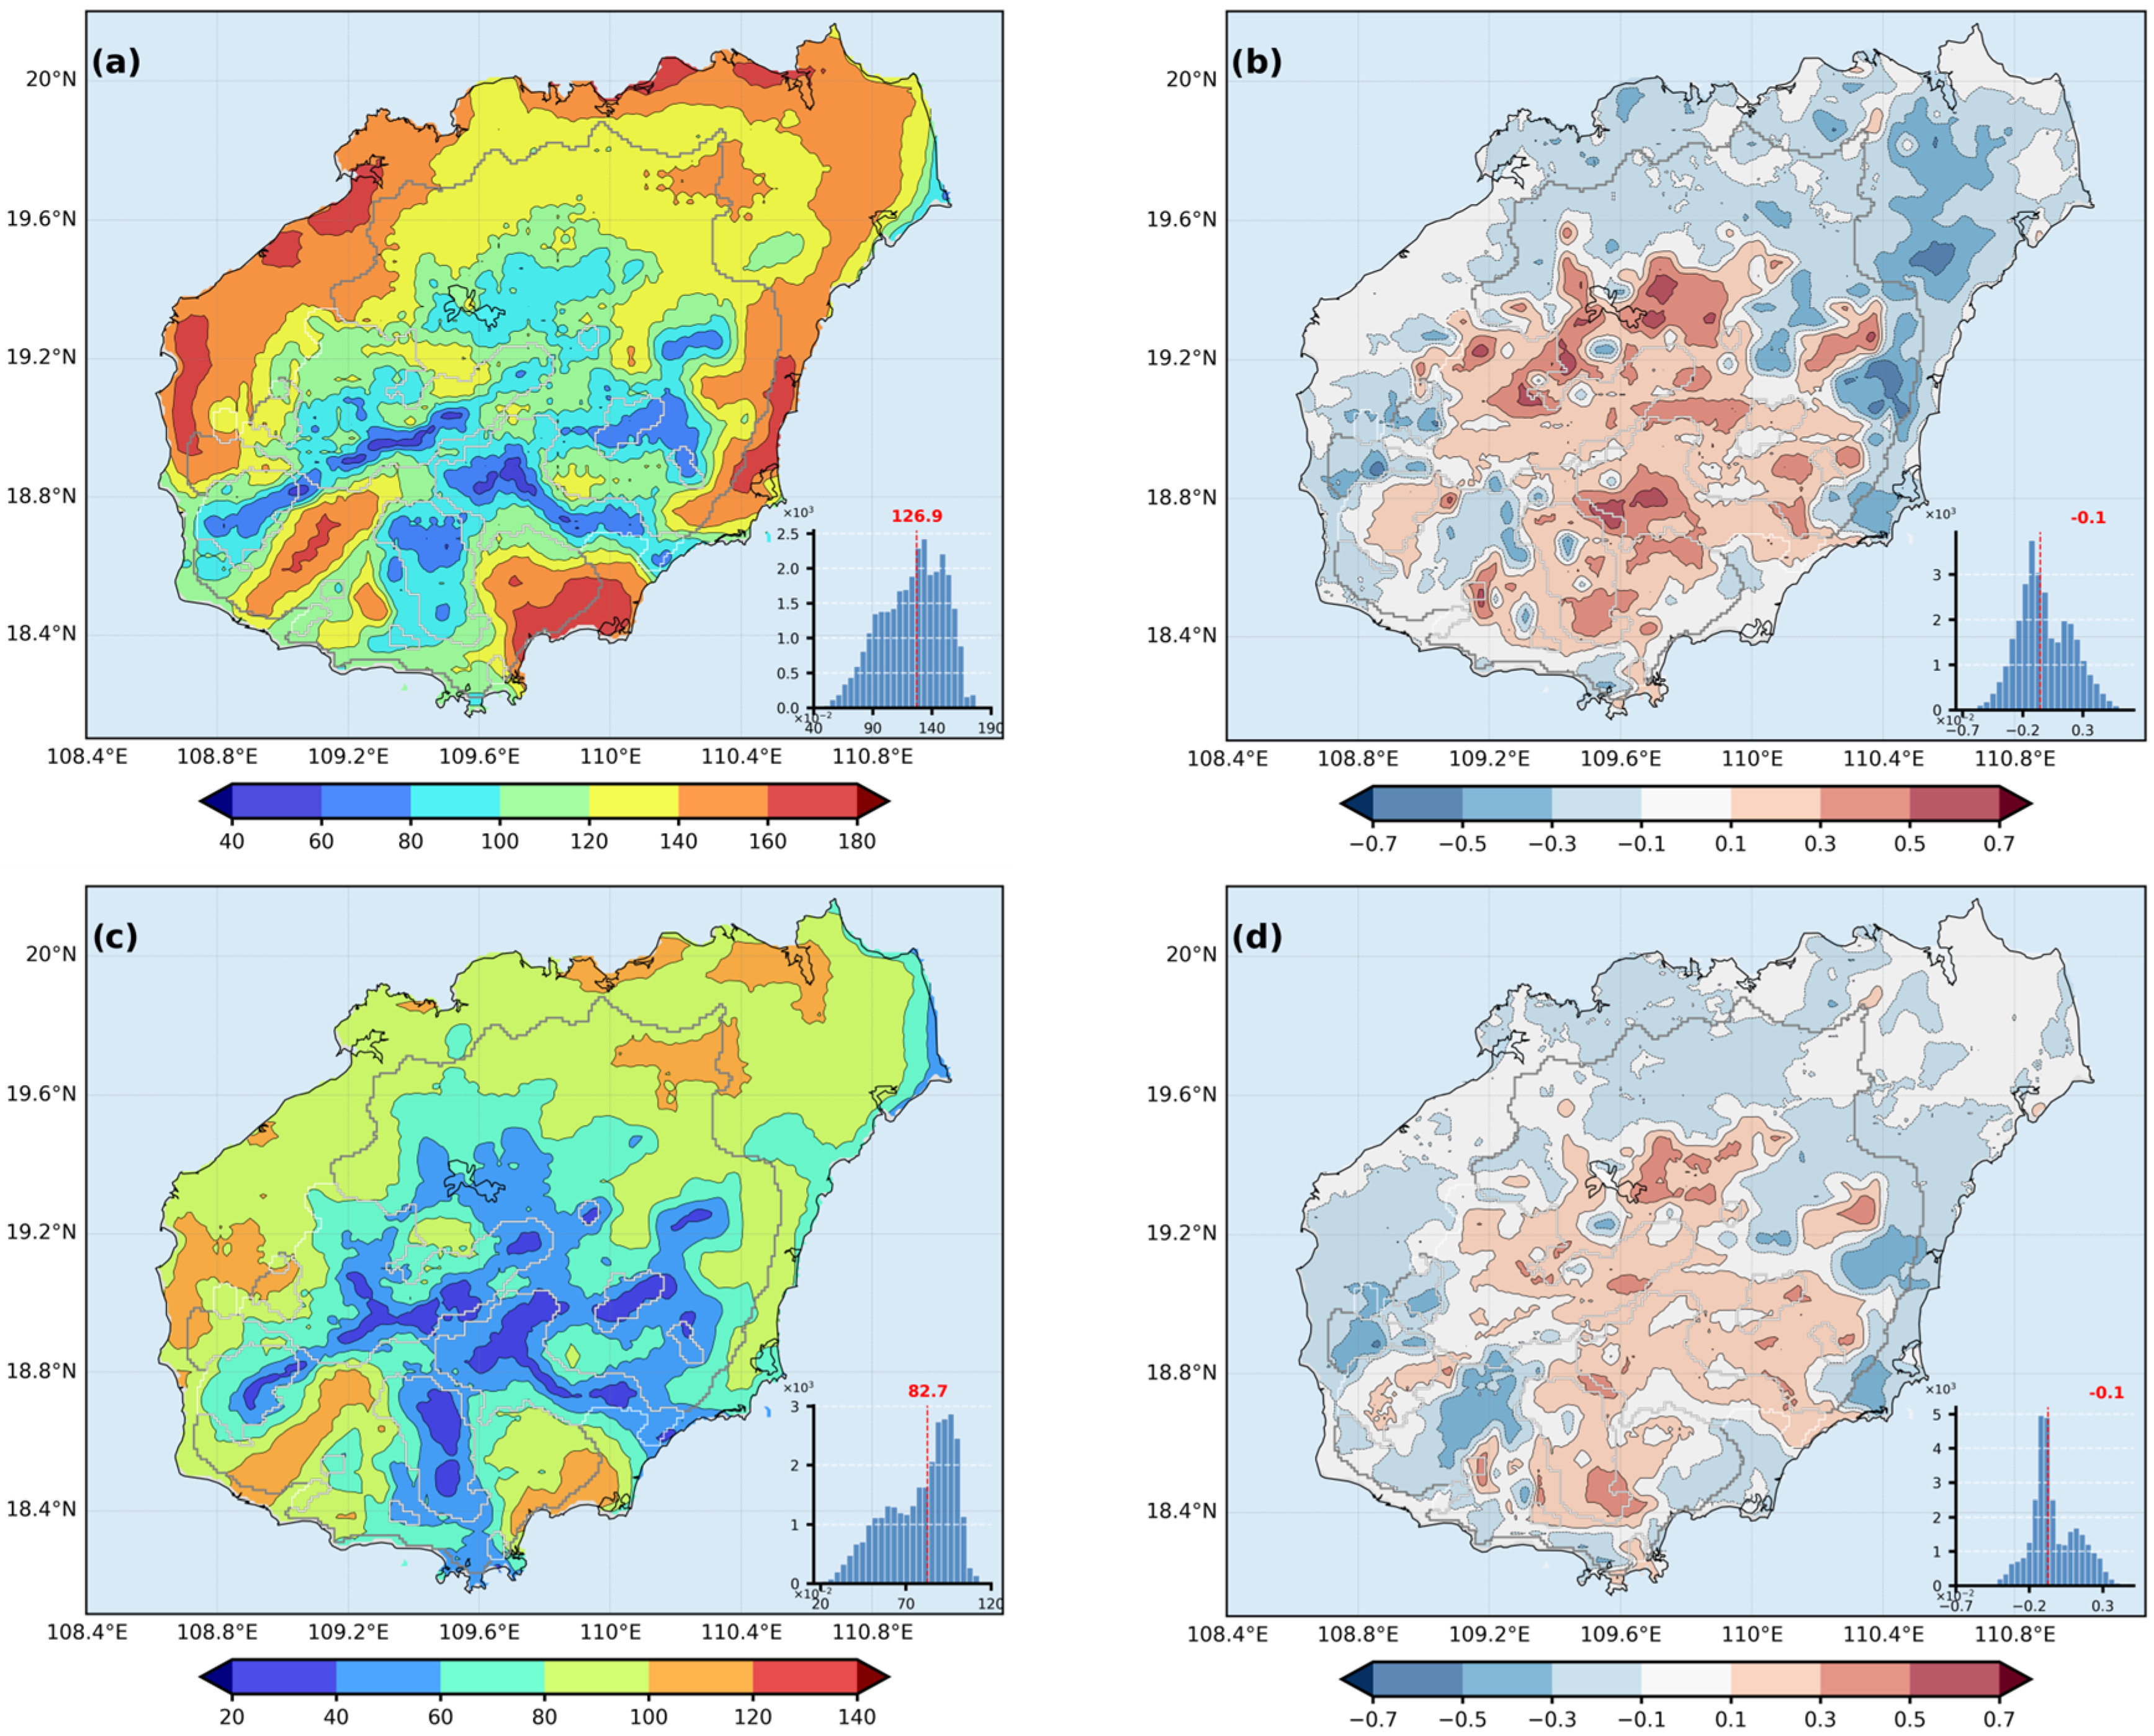
- The frequency of extreme wind events shows complex and asynchronous evolution. Widespread strong wind days have significantly decreased during the cold season (−0.214 days decade−1) but show a slight increasing trend in the warm season (+0.097 days decade−1). Furthermore, widespread weak wind days also exhibit subtle decreasing trends in the cold season (−0.021 days decade−1) while remaining stable in the warm season, suggesting nuanced changes in regional atmospheric stability.
- (5)
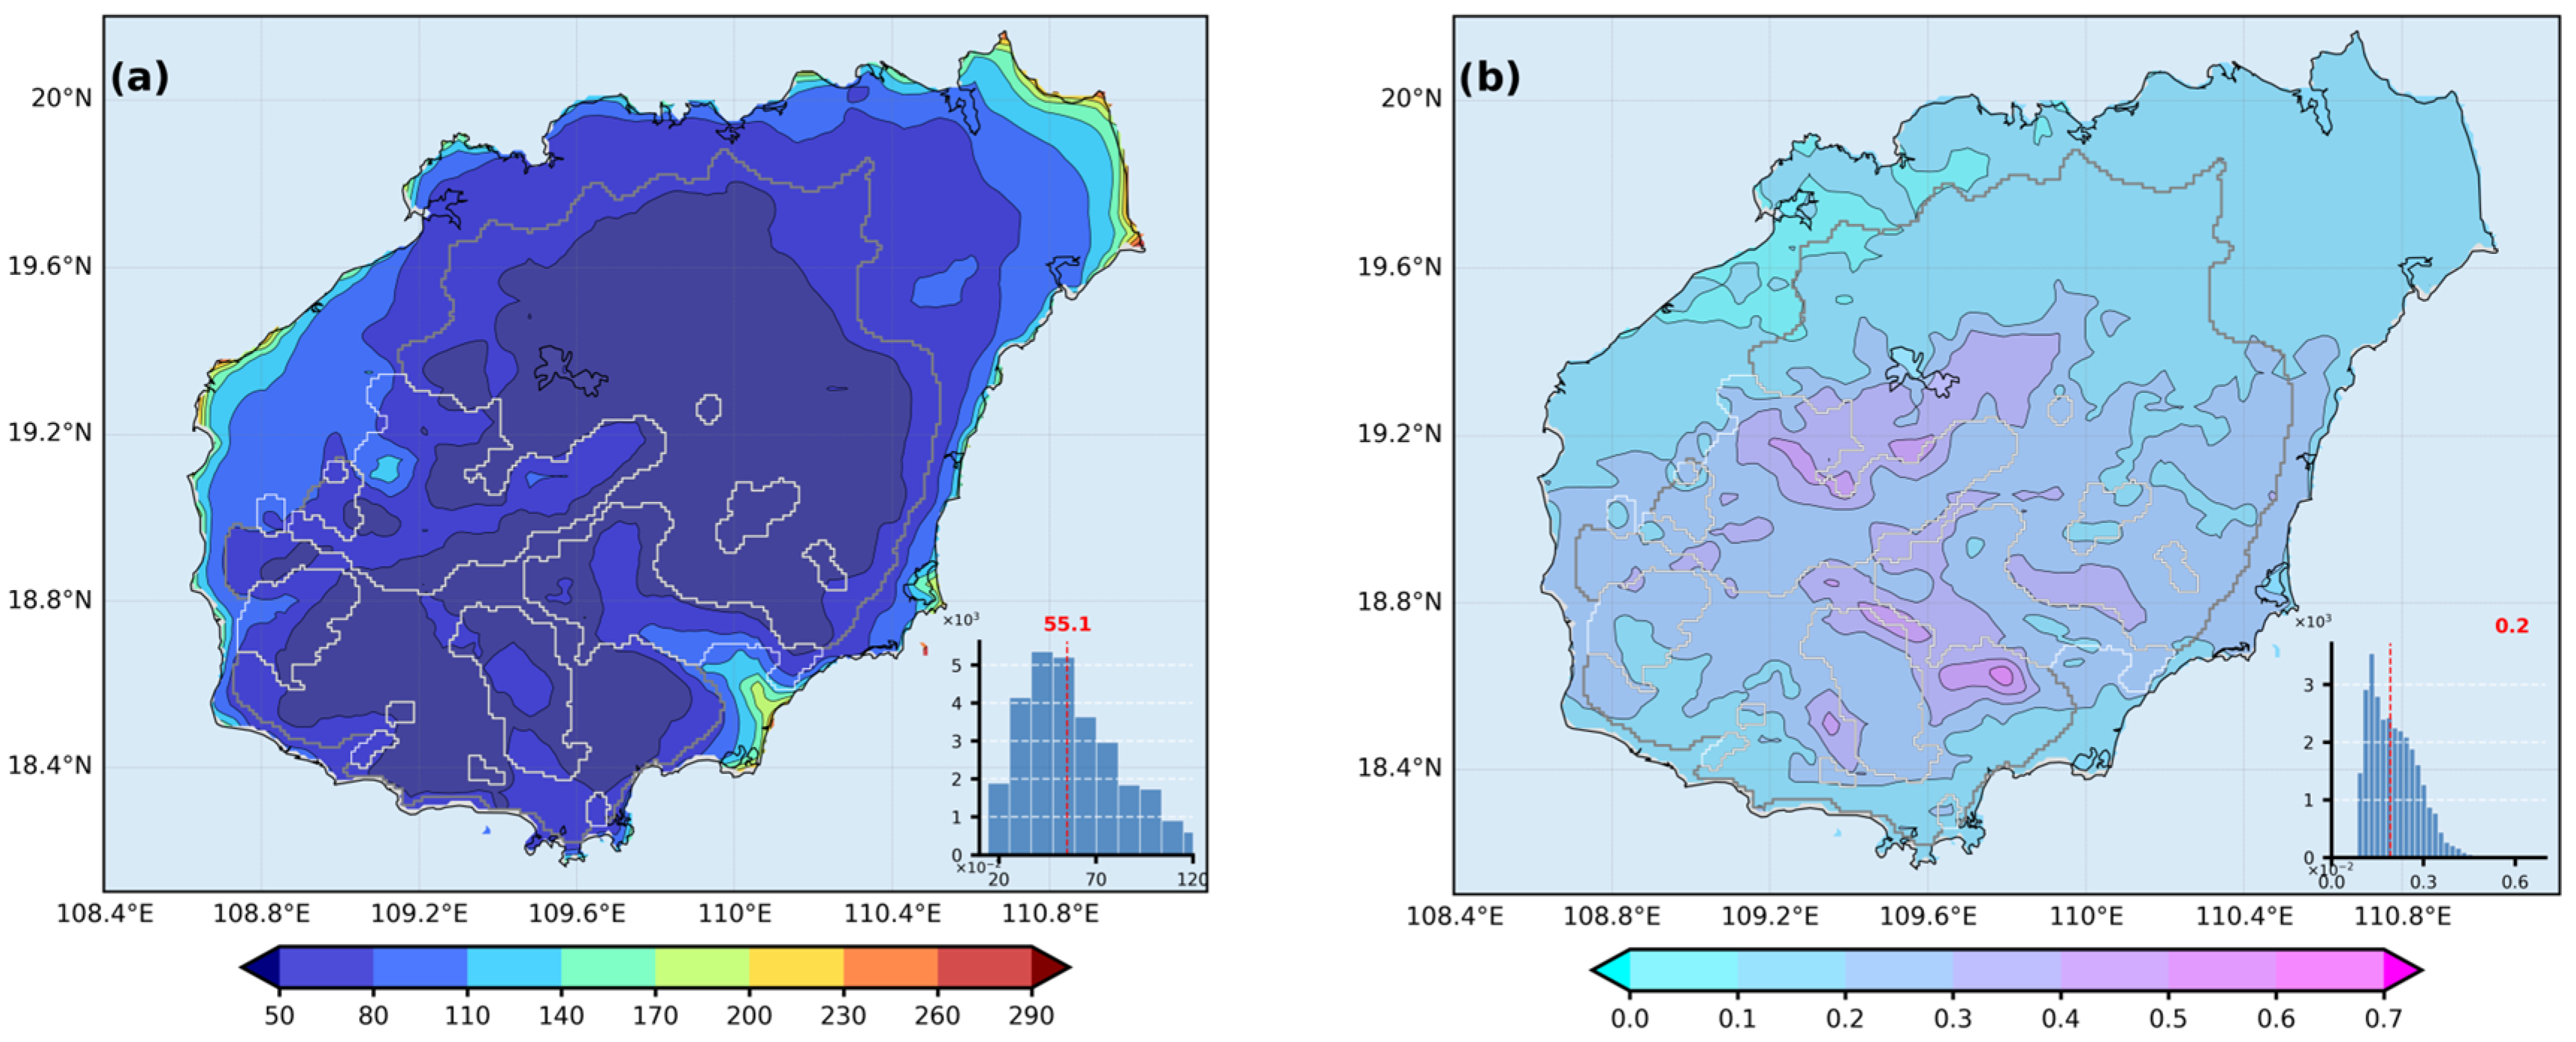
- The spatiotemporal evolution of the wind field has direct implications for regional wind resources and engineering design. Risk associated with 100-year return period extreme winds has undergone geographical redistribution, weakening along eastern coasts (by −0.2 to −0.5 m/s) but strengthening significantly in mountainous interiors (by +0.4 to +0.7 m/s). Concurrently, sea-land breezes, critical local climate resources, show decreasing trends in coastal regions where they are most frequent, with reductions of up to 3–7 days decade−1 in some areas.
Author Contributions
Funding
Institutional Review Board Statement
Informed Consent Statement
Data Availability Statement
Acknowledgments
Conflicts of Interest
Abbreviations
| WRF | Weather Research and Forecasting |
| ERA5 | European Centre for Medium-Range Weather Forecasts 5th generation reanalysis |
| EAWM | East Asian Winter Monsoon |
| ENSO | El Niño–Southern Oscillation |
| KF | Kain-Fritsch |
| FDDA | Four-Dimensional Data Assimilation |
| SST | Sea Surface Temperature |
| CMFD | China Meteorological Forcing Dataset |
| NOAA 20C | NOAA-CIRES-DOE 20th Century Reanalysis V3 |
| CMA | China Meteorological Administration |
| NRMS | National Reference Meteorological Stations |
| AWS | Automatic Weather Stations |
| BJT | Beijing Standard Time |
| MK | Mann-Kendall |
| GEV | Generalized Extreme Value |
| SLBDs | Sea-Land Breeze Days |
| WPD | Wind Power Density |
| CV | Coefficient of Variation |
| TNH | Tropical-Northern Hemisphere Pattern |
| NP | North Pacific Pattern |
| PT | Pacific Transition Pattern |
Appendix A. Statistical Summary of National Station Data in Hainan Island
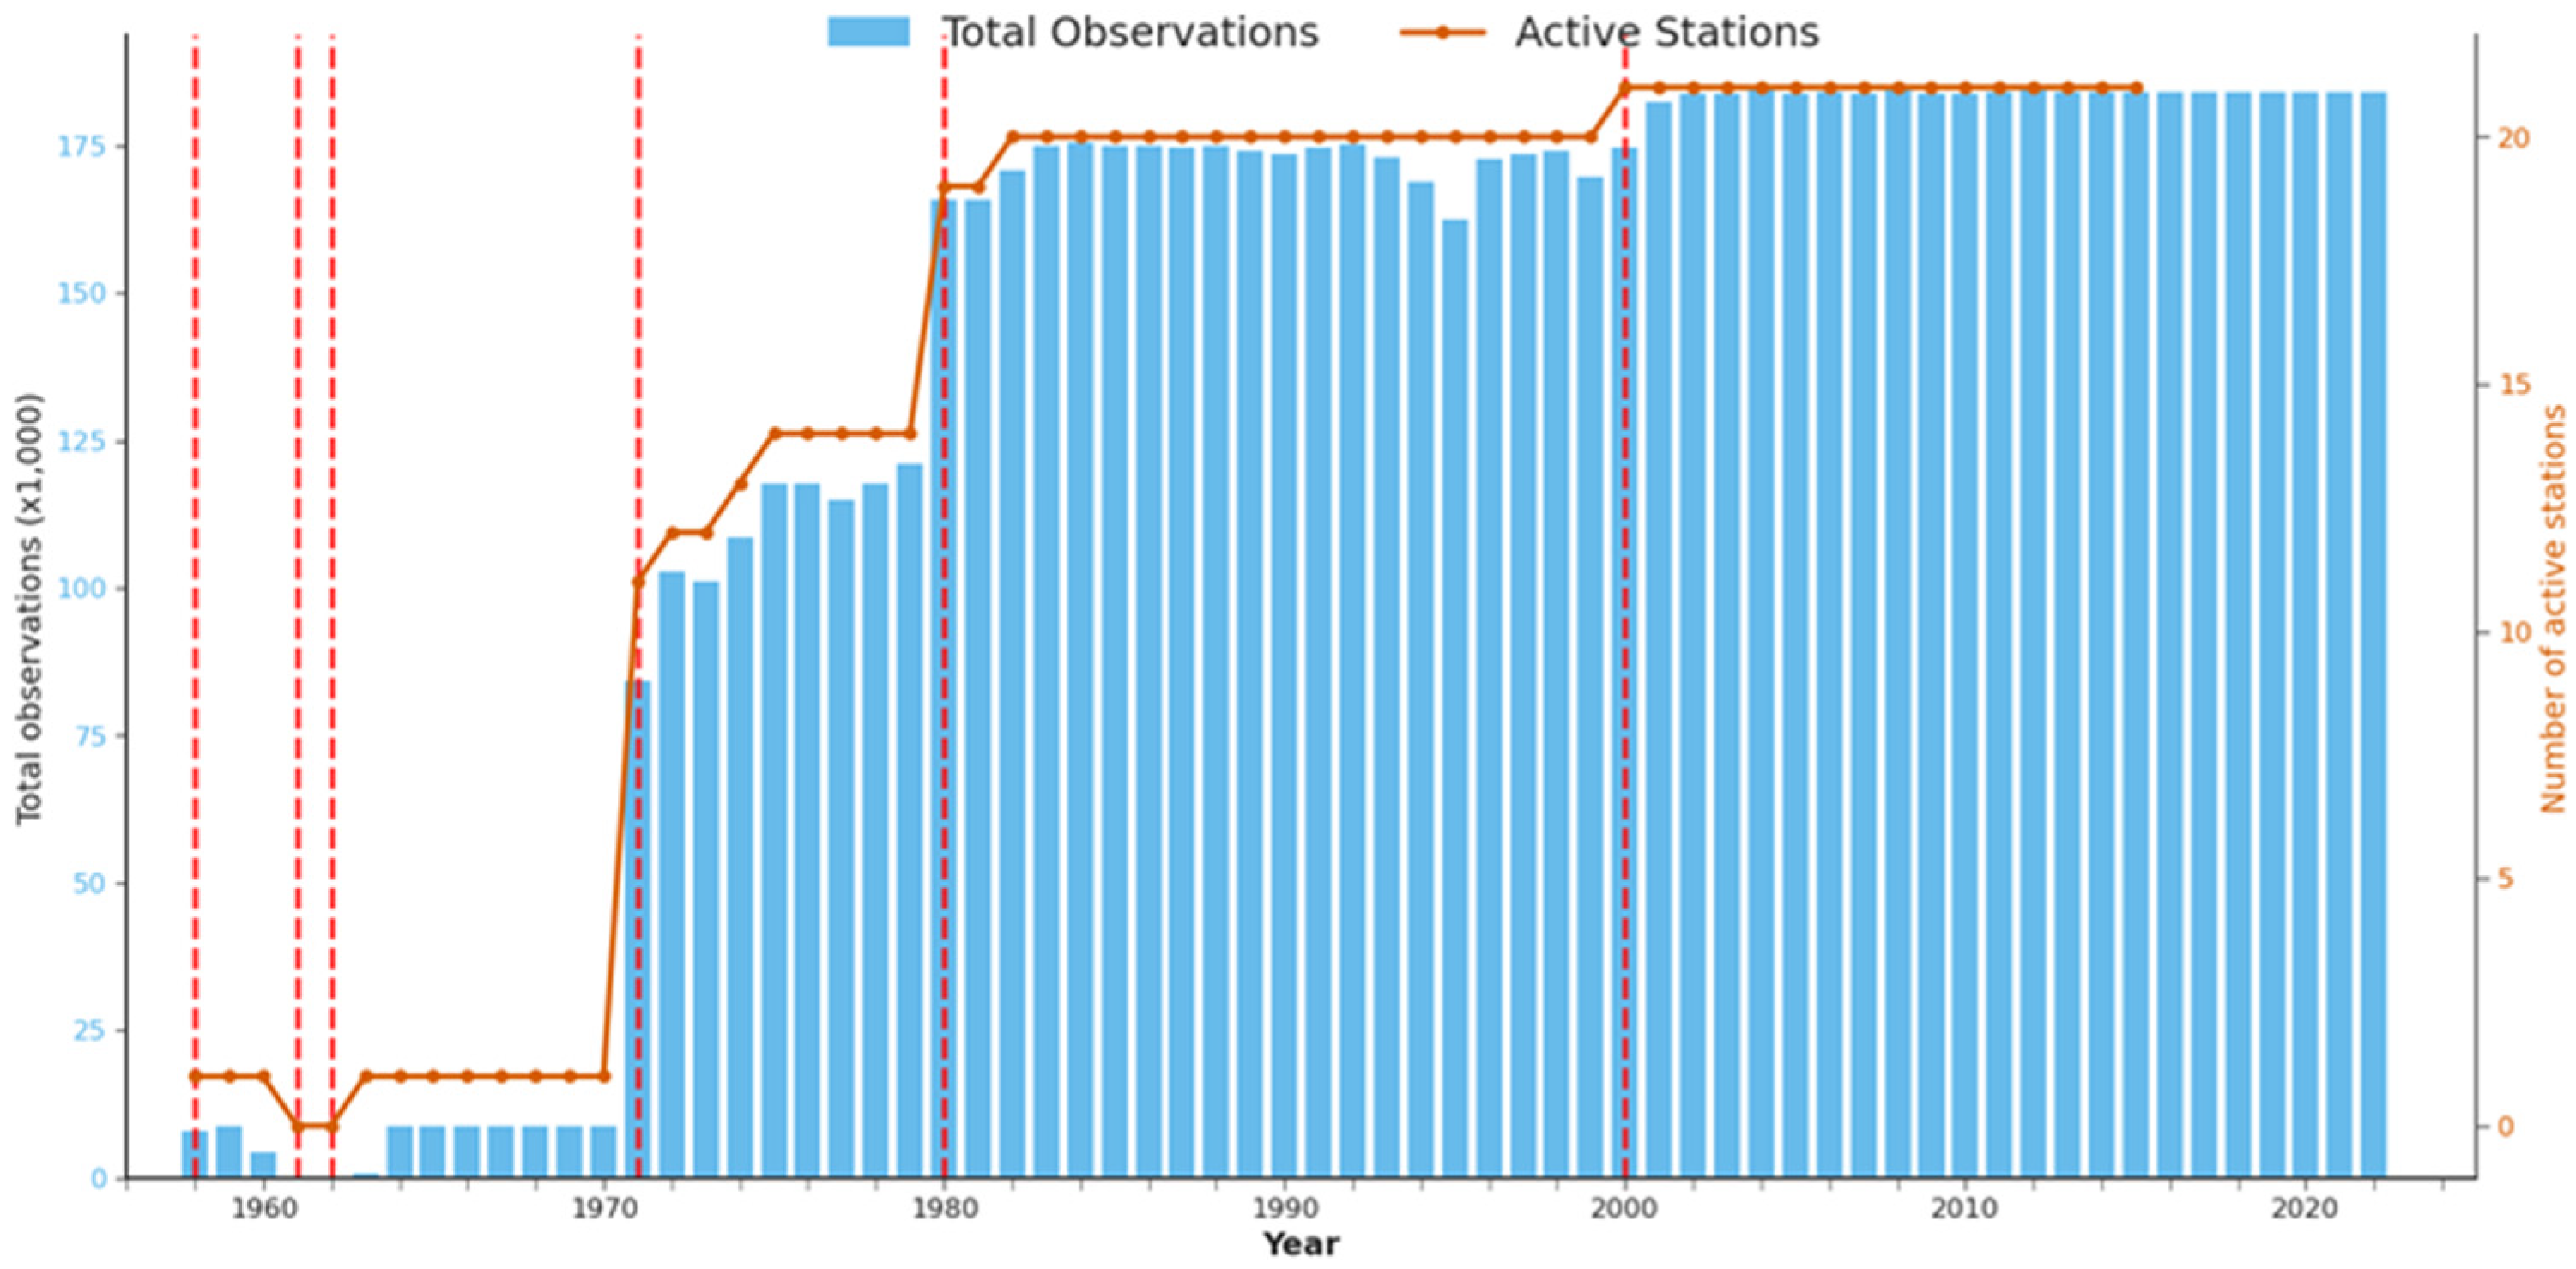
Appendix B
| No. | Category | Index Name |
|---|---|---|
| 1 | Atmospheric Circulation Index | Northern Hemisphere Subtropical High Area Index |
| 2 | Atmospheric Circulation Index | North African Subtropical High Area Index |
| 3 | Atmospheric Circulation Index | North African-North Atlantic-North American Subtropical High Area Index |
| 4 | Atmospheric Circulation Index | Indian Subtropical High Area Index |
| 5 | Atmospheric Circulation Index | Western Pacific Subtropical High Area Index |
| 6 | Atmospheric Circulation Index | Eastern Pacific Subtropical High Area Index |
| 7 | Atmospheric Circulation Index | North American Subtropical High Area Index |
| 8 | Atmospheric Circulation Index | Atlantic Subtropical High Area Index |
| 9 | Atmospheric Circulation Index | South China Sea Subtropical High Area Index |
| 10 | Atmospheric Circulation Index | North American-Atlantic Subtropical High Area Index |
| 11 | Atmospheric Circulation Index | Pacific Subtropical High Area Index |
| 12 | Atmospheric Circulation Index | Northern Hemisphere Subtropical High Intensity Index |
| 13 | Atmospheric Circulation Index | North African Subtropical High Intensity Index |
| 14 | Atmospheric Circulation Index | North African-North Atlantic-North American Subtropical High Intensity Index |
| 15 | Atmospheric Circulation Index | Indian Subtropical High Intensity Index |
| 16 | Atmospheric Circulation Index | Western Pacific Subtropical High Intensity Index |
| 17 | Atmospheric Circulation Index | Eastern Pacific Subtropical High Intensity Index |
| 18 | Atmospheric Circulation Index | North American Subtropical High Intensity Index |
| 19 | Atmospheric Circulation Index | North Atlantic Subtropical High Intensity Index |
| 20 | Atmospheric Circulation Index | South China Sea Subtropical High Intensity Index |
| 21 | Atmospheric Circulation Index | North American-North Atlantic Subtropical High Intensity Index |
| 22 | Atmospheric Circulation Index | Pacific Subtropical High Intensity Index |
| 23 | Atmospheric Circulation Index | Northern Hemisphere Subtropical High Ridge Position Index |
| 24 | Atmospheric Circulation Index | North African Subtropical High Ridge Position Index |
| 25 | Atmospheric Circulation Index | North African-North Atlantic-North American Subtropical High Ridge Position Index |
| 26 | Atmospheric Circulation Index | Indian Subtropical High Ridge Position Index |
| 27 | Atmospheric Circulation Index | Western Pacific Subtropical High Ridge Position Index |
| 28 | Atmospheric Circulation Index | Eastern Pacific Subtropical High Ridge Position Index |
| 29 | Atmospheric Circulation Index | North American Subtropical High Ridge Position Index |
| 30 | Atmospheric Circulation Index | Atlantic Sub Tropical High Ridge Position Index |
| 31 | Atmospheric Circulation Index | South China Sea Subtropical High Ridge Position Index |
| 32 | Atmospheric Circulation Index | North American-North Atlantic Subtropical High Ridge Position Index |
| 33 | Atmospheric Circulation Index | Pacific Subtropical High Ridge Position Index |
| 34 | Atmospheric Circulation Index | Northern Hemisphere Subtropical High Northern Boundary Position Index |
| 35 | Atmospheric Circulation Index | North African Subtropical High Northern Boundary Position Index |
| 36 | Atmospheric Circulation Index | North African-North Atlantic-North American Subtropical High Northern Boundary Position Index |
| 37 | Atmospheric Circulation Index | Indian Subtropical High Northern Boundary Position Index |
| 38 | Atmospheric Circulation Index | Western Pacific Subtropical High Northern Boundary Position Index |
| 39 | Atmospheric Circulation Index | Eastern Pacific Subtropical High Northern Boundary Position Index |
| 40 | Atmospheric Circulation Index | North American Subtropical High Northern Boundary Position Index |
| 41 | Atmospheric Circulation Index | Atlantic Subtropical High Northern Boundary Position Index |
| 42 | Atmospheric Circulation Index | South China Sea Subtropical High Northern Boundary Position Index |
| 43 | Atmospheric Circulation Index | North American-Atlantic Subtropical High Northern Boundary Position Index |
| 44 | Atmospheric Circulation Index | Pacific Subtropical High Northern Boundary Position Index |
| 45 | Atmospheric Circulation Index | Western Pacific Sub Tropical High Western Ridge Point Index |
| 46 | Atmospheric Circulation Index | Asia Polar Vortex Area Index |
| 47 | Atmospheric Circulation Index | Pacific Polar Vortex Area Index |
| 48 | Atmospheric Circulation Index | North American Polar Vortex Area Index |
| 49 | Atmospheric Circulation Index | Atlantic-European Polar Vortex Area Index |
| 50 | Atmospheric Circulation Index | Northern Hemisphere Polar Vortex Area Index |
| 51 | Atmospheric Circulation Index | Asia Polar Vortex Intensity Index |
| 52 | Atmospheric Circulation Index | Pacific Polar Vortex Intensity Index |
| 53 | Atmospheric Circulation Index | North American Polar Vortex Intensity Index |
| 54 | Atmospheric Circulation Index | Atlantic-European Polar Vortex Intensity Index |
| 55 | Atmospheric Circulation Index | Northern Hemisphere Polar Vortex Intensity Index |
| 56 | Atmospheric Circulation Index | Northern Hemisphere Polar Vortex Central Longitude Index |
| 57 | Atmospheric Circulation Index | Northern Hemisphere Polar Vortex Central Latitude Index |
| 58 | Atmospheric Circulation Index | Northern Hemisphere Polar Vortex Central Intensity Index |
| 59 | Atmospheric Circulation Index | Eurasian Zonal Circulation Index |
| 60 | Atmospheric Circulation Index | Eurasian Meridional Circulation Index |
| 61 | Atmospheric Circulation Index | Asian Zonal Circulation Index |
| 62 | Atmospheric Circulation Index | Asian Meridional Circulation Index |
| 63 | Atmospheric Circulation Index | East Asian Trough Position Index |
| 64 | Atmospheric Circulation Index | East Asian Trough Intensity Index |
| 65 | Atmospheric Circulation Index | Tibet Plateau Region 1 Index |
| 66 | Atmospheric Circulation Index | Tibet Plateau Region 2 Index |
| 67 | Atmospheric Circulation Index | India-Burma Trough Intensity Index |
| 68 | Atmospheric Circulation Index | Arctic Oscillation, AO |
| 69 | Atmospheric Circulation Index | Antarctic Oscillation, AAO |
| 70 | Atmospheric Circulation Index | North Atlantic Oscillation, NAO |
| 71 | Atmospheric Circulation Index | Pacific/North American Pattern, PNA |
| 72 | Atmospheric Circulation Index | East Atlantic Pattern, EA |
| 73 | Atmospheric Circulation Index | West Pacific Pattern, WP |
| 74 | Atmospheric Circulation Index | North Pacific Pattern, NP |
| 75 | Atmospheric Circulation Index | East Atlantic-West Russia Pattern, EA/WR |
| 76 | Atmospheric Circulation Index | Tropical-Northern Hemisphere Pattern, TNH |
| 77 | Atmospheric Circulation Index | Polar-Eurasia Pattern, POL |
| 78 | Atmospheric Circulation Index | Scandinavia Pattern, SCA |
| 79 | Atmospheric Circulation Index | Pacific Transition Pattern, PT |
| 80 | Atmospheric Circulation Index | 30 hPa zonal wind Index |
| 81 | Atmospheric Circulation Index | 50 hPa zonal wind Index |
| 82 | Atmospheric Circulation Index | Mid-Eastern Pacific 200 mb Zonal Wind Index |
| 83 | Atmospheric Circulation Index | West Pacific 850 mb Trade Wind Index |
| 84 | Atmospheric Circulation Index | Central Pacific 850 mb Trade Wind Index |
| 85 | Atmospheric Circulation Index | East Pacific 850 mb Trade Wind Index |
| 86 | Atmospheric Circulation Index | Atlantic-European Circulation W Pattern Index |
| 87 | Atmospheric Circulation Index | Atlantic-European Circulation C Pattern Index |
| 88 | Atmospheric Circulation Index | Atlantic-European Circulation E Pattern Index |
| 89 | Sea Temperature Index | NINO 1+2 SSTA Index |
| 90 | Sea Temperature Index | NINO 3 SSTA Index |
| 91 | Sea Temperature Index | NINO 4 SSTA Index |
| 92 | Sea Temperature Index | NINO 3.4 SSTA Index |
| 93 | Sea Temperature Index | NINO W SSTA Index |
| 94 | Sea Temperature Index | NINO C SSTA Index |
| 95 | Sea Temperature Index | NINO A SSTA Index |
| 96 | Sea Temperature Index | NINO B SSTA Index |
| 97 | Sea Temperature Index | NINO Z SSTA Index |
| 98 | Sea Temperature Index | Tropical Northern Atlantic SST Index |
| 99 | Sea Temperature Index | Tropical Southern Atlantic SST Index |
| 100 | Sea Temperature Index | Western Hemisphere Warm Pool Index |
| 101 | Sea Temperature Index | Indian Ocean Warm Pool Area Index |
| 102 | Sea Temperature Index | Indian Ocean Warm Pool Strength Index |
| 103 | Sea Temperature Index | Western Pacific Warm Pool Area Index |
| 104 | Sea Temperature Index | Western Pacific Warm Pool Strength Index |
| 105 | Sea Temperature Index | Atlantic Multi-decadal Oscillation Index |
| 106 | Sea Temperature Index | Oyashio Current SST Index |
| 107 | Sea Temperature Index | West Wind Drift Current SST Index |
| 108 | Sea Temperature Index | Kuroshio Current SST Index |
| 109 | Sea Temperature Index | ENSO Modoki Index |
| 110 | Sea Temperature Index | Warm-pool ENSO Index |
| 111 | Sea Temperature Index | Cold-tongue ENSO Index |
| 112 | Sea Temperature Index | Indian Ocean Basin-Wide Index |
| 113 | Sea Temperature Index | Tropic Indian Ocean Dipole Index |
| 114 | Sea Temperature Index | South Indian Ocean Dipole Index |
Appendix C
References
- Van Beusekom, A.E.; González, G. Near-Surface Atmospheric Behavior over Complex Tropical Topography in Puerto Rico Dominated by Seasonal Patterns Despite Frequent Environmental Changes. Earth Interact. 2022, 26, 151–167. [Google Scholar] [CrossRef]
- Wang, S.; Sobel, A.H. Factors Controlling Rain on Small Tropical Islands: Diurnal Cycle, Large-Scale Wind Speed, and Topography. J. Atmos. Sci. 2017, 74, 3515–3532. [Google Scholar] [CrossRef]
- Balsamo, G.; Agusti-Parareda, A.; Albergel, C.; Arduini, G.; Beljaars, A.; Bidlot, J.; Blyth, E.; Bousserez, N.; Boussetta, S.; Brown, A. Satellite and in situ observations for advancing global Earth surface modelling: A review. Remote Sens. 2018, 10, 2038. [Google Scholar] [CrossRef]
- Ren, B.; Wang, Q.; Zhang, R.; Zhou, X.; Wu, X.; Zhang, Q. Assessment of ecosystem services: Spatio-temporal analysis and the spatial response of influencing factors in hainan province. Sustainability 2022, 14, 9145. [Google Scholar] [CrossRef]
- Laurila, T.K.; Sinclair, V.A.; Gregow, H. Climatology, variability, and trends in near-surface wind speeds over the North Atlantic and Europe during 1979–2018 based on ERA5. Int. J. Clim. 2021, 41, 2253–2278. [Google Scholar] [CrossRef]
- Zhao, X.; Wu, Y.; Su, J.; Gou, J. Surface wind speed changes and their potential impact on wind energy resources across China during 1961–2021. Geohealth 2023, 7, e2023GH000861. [Google Scholar] [CrossRef] [PubMed]
- McVicar, T.R.; Roderick, M.L.; Donohue, R.J.; Li, L.T.; Van Niel, T.G.; Thomas, A.; Grieser, J.; Jhajharia, D.; Himri, Y.; Mahowald, N.M. Global review and synthesis of trends in observed terrestrial near-surface wind speeds: Implications for evaporation. J. Hydrol. 2012, 416, 182–205. [Google Scholar] [CrossRef]
- You, G.; Zhang, Y.; Liu, Y.; Song, Q.; Lu, Z.; Tan, Z.; Wu, C.; Xie, Y. On the attribution of changing pan evaporation in a nature reserve in SW China. Hydrol. Process 2013, 27, 2676–2682. [Google Scholar] [CrossRef]
- Miao, J.; Wang, T.; Wang, H.; Zhu, Y.; Sun, J. Interdecadal weakening of the East Asian winter monsoon in the mid-1980s: The roles of external forcings. J. Clim. 2018, 31, 8985–9000. [Google Scholar] [CrossRef]
- Luu, L.N.; van Meijgaard, E.; Philip, S.Y.; Kew, S.F.; de Baar, J.H.; Stepek, A. Impact of surface roughness changes on surface wind speed over western Europe: A study with the regional climate model RACMO. J. Geophys. Res. Atmos. 2023, 128, e2022JD038426. [Google Scholar] [CrossRef]
- Vautard, R.; Cattiaux, J.; Yiou, P.; Thépaut, J.; Ciais, P. Northern Hemisphere atmospheric stilling partly attributed to an increase in surface roughness. Nat. Geosci. 2010, 3, 756–761. [Google Scholar] [CrossRef]
- Zeng, Z.; Ziegler, A.D.; Searchinger, T.; Yang, L.; Chen, A.; Ju, K.; Piao, S.; Li, L.Z.; Ciais, P.; Chen, D. A reversal in global terrestrial stilling and its implications for wind energy production. Nat. Clim. Change 2019, 9, 979–985. [Google Scholar] [CrossRef]
- Tokinaga, H.; Xie, S. Wave-and anemometer-based sea surface wind (WASWind) for climate change analysis. J. Clim. 2011, 24, 267–285. [Google Scholar] [CrossRef]
- Young, I.R.; Zieger, S.; Babanin, A.V. Global trends in wind speed and wave height. Science 2011, 332, 451–455. [Google Scholar] [CrossRef]
- Song, J.; Yao, L.; Guo, J.; Fu, Y.; Cai, Y.; Wang, M. The Seasonal Correlation Between El Niño and Southern Oscillation Events and Sea Surface Temperature Anomalies in the South China Sea from 1958 to 2024. J. Mar. Sci. Eng. 2025, 13, 153. [Google Scholar] [CrossRef]
- Yihui, D.; Chan, J.C. The East Asian summer monsoon: An overview. Meteorol. Atmos. Phys. 2005, 89, 117–142. [Google Scholar] [CrossRef]
- Xu, M.Y.; Tan, Y.X.; Li, S.X.; Shang, M.; Shi, C.X.; Bai, L. Analysis on Multi-Scale Temporal and Spatial Distribution Characteristics of Typhoon Precipitation in Hainan Island Based on Remote Sensing Precipitation Data. Trop. Agric. Sci. 2025, 45, 96–104. [Google Scholar]
- Knutson, T.; Camargo, S.J.; Chan, J.C.; Emanuel, K.; Ho, C.; Kossin, J.; Mohapatra, M.; Satoh, M.; Sugi, M.; Walsh, K. Tropical cyclones and climate change assessment: Part II: Projected response to anthropogenic warming. Bull. Am. Meteorol. Soc. 2020, 101, E303–E322. [Google Scholar] [CrossRef]
- Widana Arachchige, E.L.; Zhou, W.; Toumi, R.; Wang, X. Projected tropical cyclone genesis and seasonality changes in the Northern Hemisphere under a warming climate. Npj Clim. Atmos. Sci. 2025, 8, 288. [Google Scholar] [CrossRef]
- Xu, M.; Tan, Y.; Shi, C.; Xing, Y.; Shang, M.; Wu, J.; Yang, Y.; Du, J.; Bai, L. Spatiotemporal Patterns of Typhoon-Induced Extreme Precipitation in Hainan Island, China, 2000–2020, Using Satellite-Derived Precipitation Data. Atmosphere 2024, 15, 891. [Google Scholar] [CrossRef]
- Zhang, Z.; Wang, K. Homogenization of observed surface wind speed based on geostrophic wind theory over China from 1970 to 2017. J. Clim. 2023, 36, 3667–3679. [Google Scholar] [CrossRef]
- Hersbach, H.; Bell, B.; Berrisford, P.; Hirahara, S.; Horányi, A.; Muñoz Sabater, J.; Nicolas, J.; Peubey, C.; Radu, R.; Schepers, D. The ERA5 global reanalysis. Q. J. R. Meteorol. Soc. 2020, 146, 1999–2049. [Google Scholar] [CrossRef]
- Fang, S.; Mao, K.; Xia, X.; Wang, P.; Shi, J.; Bateni, S.M.; Xu, T.; Cao, M.; Heggy, E.; Qin, Z. Dataset of daily near-surface air temperature in China from 1979 to 2018. Earth Syst. Sci. Data 2022, 14, 1413–1432. [Google Scholar] [CrossRef]
- Han, S.; Liu, B.; Shi, C.; Liu, Y.; Qiu, M.; Sun, S. Evaluation of CLDAS and GLDAS datasets for near-surface air temperature over major land areas of China. Sustainability 2020, 12, 4311. [Google Scholar] [CrossRef]
- Betts, A.K.; Chan, D.Z.; Desjardins, R.L. Near-surface biases in ERA5 over the Canadian Prairies. Front. Environ. Sci. 2019, 7, 129. [Google Scholar] [CrossRef]
- Jiao, Y.; Huang, S.; Xing, Y.; Wu, J.; Shang, M.; Shi, C.; He, Y.; Bai, L. A Study on the Simulation Performance of Different Cloud Microphysical Schemes for Heavy Rainfall in Tropical Island Areas: A Case Study of Hainan Island. Clim. Change Res. Lett. 2025, 14, 384. [Google Scholar] [CrossRef]
- Jiao, Y.; Xing, Y.; Huang, S.; Wu, J.; Shang, M.; Shi, C.; He, Y.; Bai, L. Research on the Optimal Initialization Time for Surface Elements in the Hainan Area Using the WRF Model. Clim. Change Res. Lett. 2025, 14, 399. [Google Scholar] [CrossRef]
- Jiao, Y.; Xing, Y.; Huang, S.; Wu, J.; Shang, M.; Shi, C.; He, Y.; Bai, L. Evaluation of the Simulation Performance of Cumulus Convection Parameterization Schemes for Multi-Scale Precipitation Systems in Tropical Islands: A Case Study of Hainan Island. Clim. Change Res. Lett. 2025, 14, 321. [Google Scholar] [CrossRef]
- Soci, C.; Hersbach, H.; Simmons, A.; Poli, P.; Bell, B.; Berrisford, P.; Horányi, A.; Muñoz Sabater, J.; Nicolas, J.; Radu, R. The ERA5 global reanalysis from 1940 to 2022. Q. J. R. Meteorol. Soc. 2024, 150, 4014–4048. [Google Scholar] [CrossRef]
- He, J.; Yang, K.; Tang, W.; Lu, H.; Qin, J.; Chen, Y.; Li, X. The first high-resolution meteorological forcing dataset for land process studies over China. Sci. Data 2020, 7, 25. [Google Scholar] [CrossRef]
- Wu, J.; Gao, X. A gridded daily observation dataset over China region and comparison with the other datasets. Chin. J. Geophys. 2013, 56, 1102–1111. [Google Scholar]
- NOAA National Centers for Environmental Information. NOAA-20 VIIRS. Available online: https://ncc.nesdis.noaa.gov/NOAA-20/index.php (accessed on 19 August 2025).
- National Climate Center. Official Website Information [EB/OL]. Available online: https://ncc-cma.net/cn/ (accessed on 19 August 2025).
- Qiu, X.N.; Fan, S.J. Research Progress on Sea-Land Breeze and Main Characteristics of Sea-Land Breeze in Three Coastal Regions of China. Meteorol. Mon. 2013, 39, 186–193. [Google Scholar]
- Huang, M.L.; Su, Z.; Zhou, S.Y. Analysis on Surface Climatic Characteristics of Sea-Land Breeze in Guangxi. Guangxi Meteorol. 2005, 26, 21–22. [Google Scholar]
- Lin, L.; Chen, T.S.; Huang, Q.Y. Climatic Characteristics of Sea-Land Breeze in Coastal Areas of Southern Fujian. Water Conserv. Sci. Technol. 2016, 33, 12–16. [Google Scholar]
- De Moliner, G.; Giani, P.; Lonati, G.; Crippa, P. Sensitivity of multiscale large Eddy simulations for wind power calculations in complex terrain. Appl. Energy 2024, 364, 123195. [Google Scholar] [CrossRef]
- Suárez-Molina, D.; Fernández-González, S.; Montero, G.; Oliver, A.; González, J.C.S. Sensitivity analysis of the WRF model: Assessment of performance in high resolution simulations in complex terrain in the Canary Islands. Atmos. Res. 2021, 247, 105157. [Google Scholar] [CrossRef]
- Zhou, X.; Yang, K.; Beljaars, A.; Li, H.; Lin, C.; Huang, B.; Wang, Y. Dynamical impact of parameterized turbulent orographic form drag on the simulation of winter precipitation over the western Tibetan Plateau. Clim. Dyn. 2019, 53, 707–720. [Google Scholar] [CrossRef]
- Hawker, L.; Uhe, P.; Paulo, L.; Sosa, J.; Savage, J.; Sampson, C.; Neal, J. A 30 m global map of elevation with forests and buildings removed. Environ. Res. Lett. 2022, 17, 24016. [Google Scholar] [CrossRef]
- Hofer, M.; Sapiro, G.; Wallner, J. Fair polyline networks for constrained smoothing of digital terrain elevation data. IEEE Trans. Geosci. Remote Sens. 2006, 44, 2983–2990. [Google Scholar] [CrossRef][Green Version]
- Jiménez, P.A.; Dudhia, J. Improving the representation of resolved and unresolved topographic effects on surface wind in the WRF model. J. Appl. Meteorol. Clim. 2012, 51, 300–316. [Google Scholar] [CrossRef]
- Liu, X.; Cao, J.; Xin, D. Wind field numerical simulation in forested regions of complex terrain: A mesoscale study using WRF. J. Wind. Eng. Ind. Aerodyn. 2022, 222, 104915. [Google Scholar] [CrossRef]
- Lei, L.; Anderson, J.L. Impacts of frequent assimilation of surface pressure observations on atmospheric analyses. Mon. Weather Rev. 2014, 142, 4477–4483. [Google Scholar] [CrossRef]
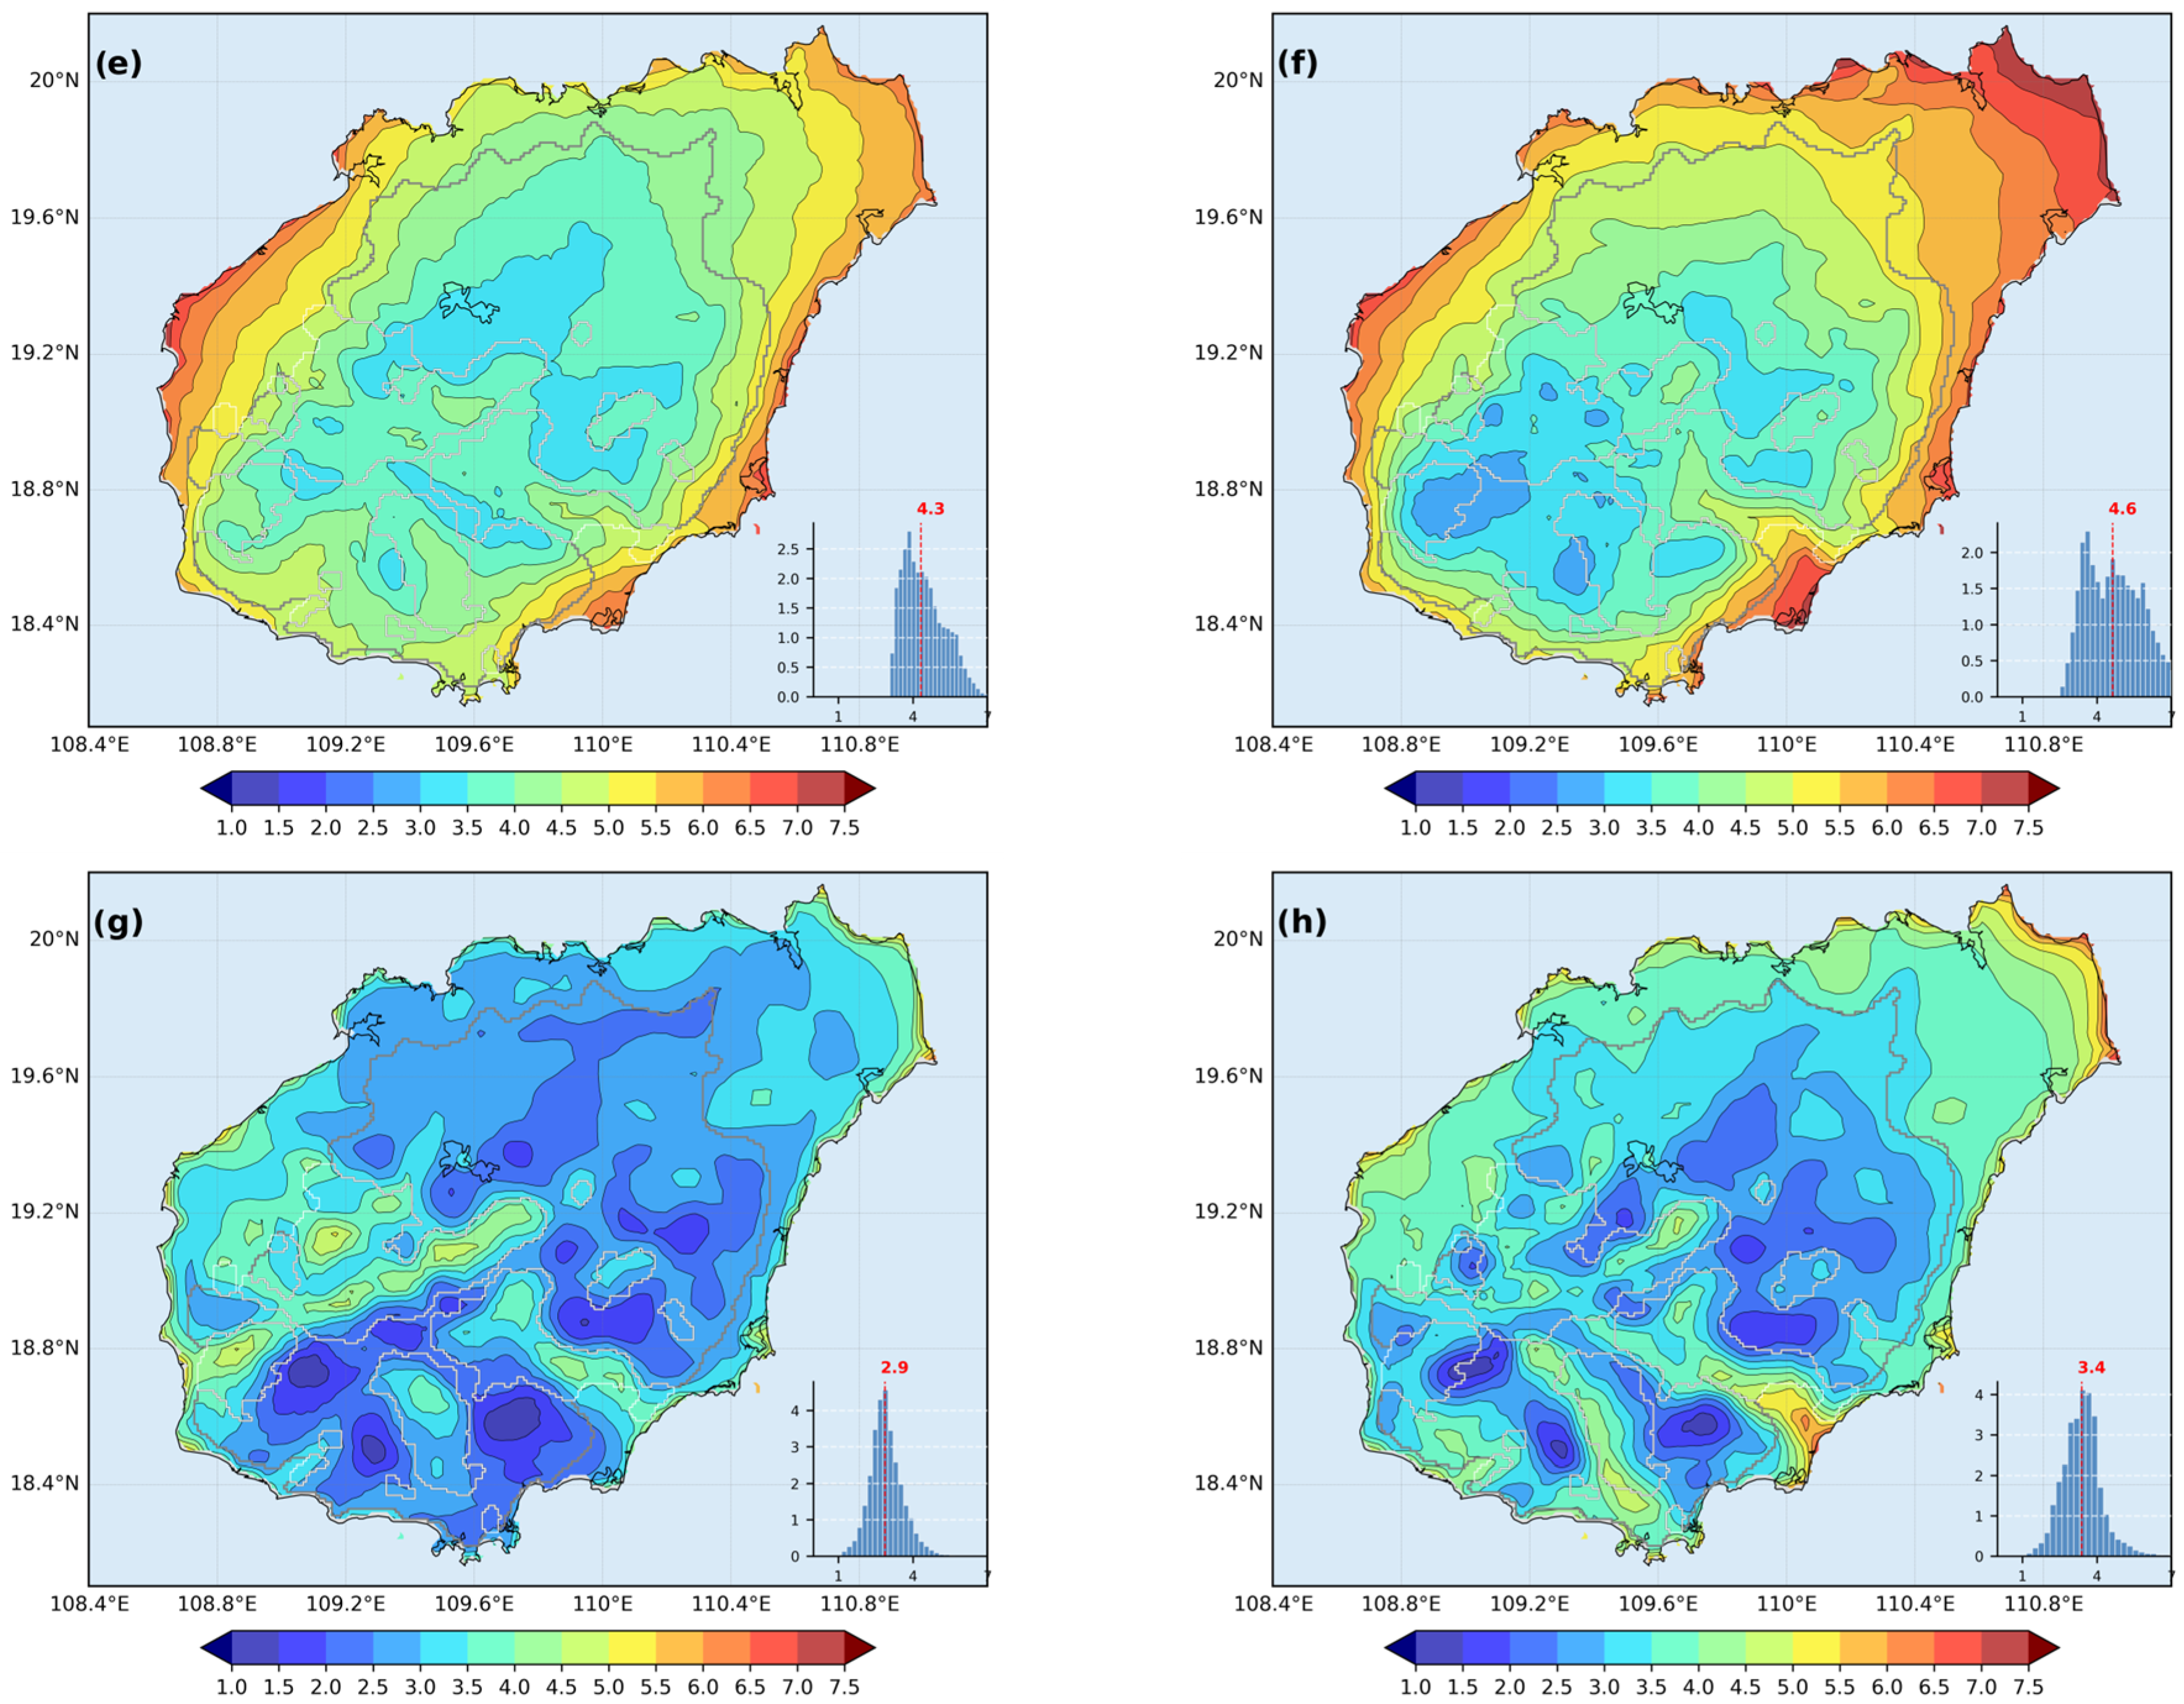
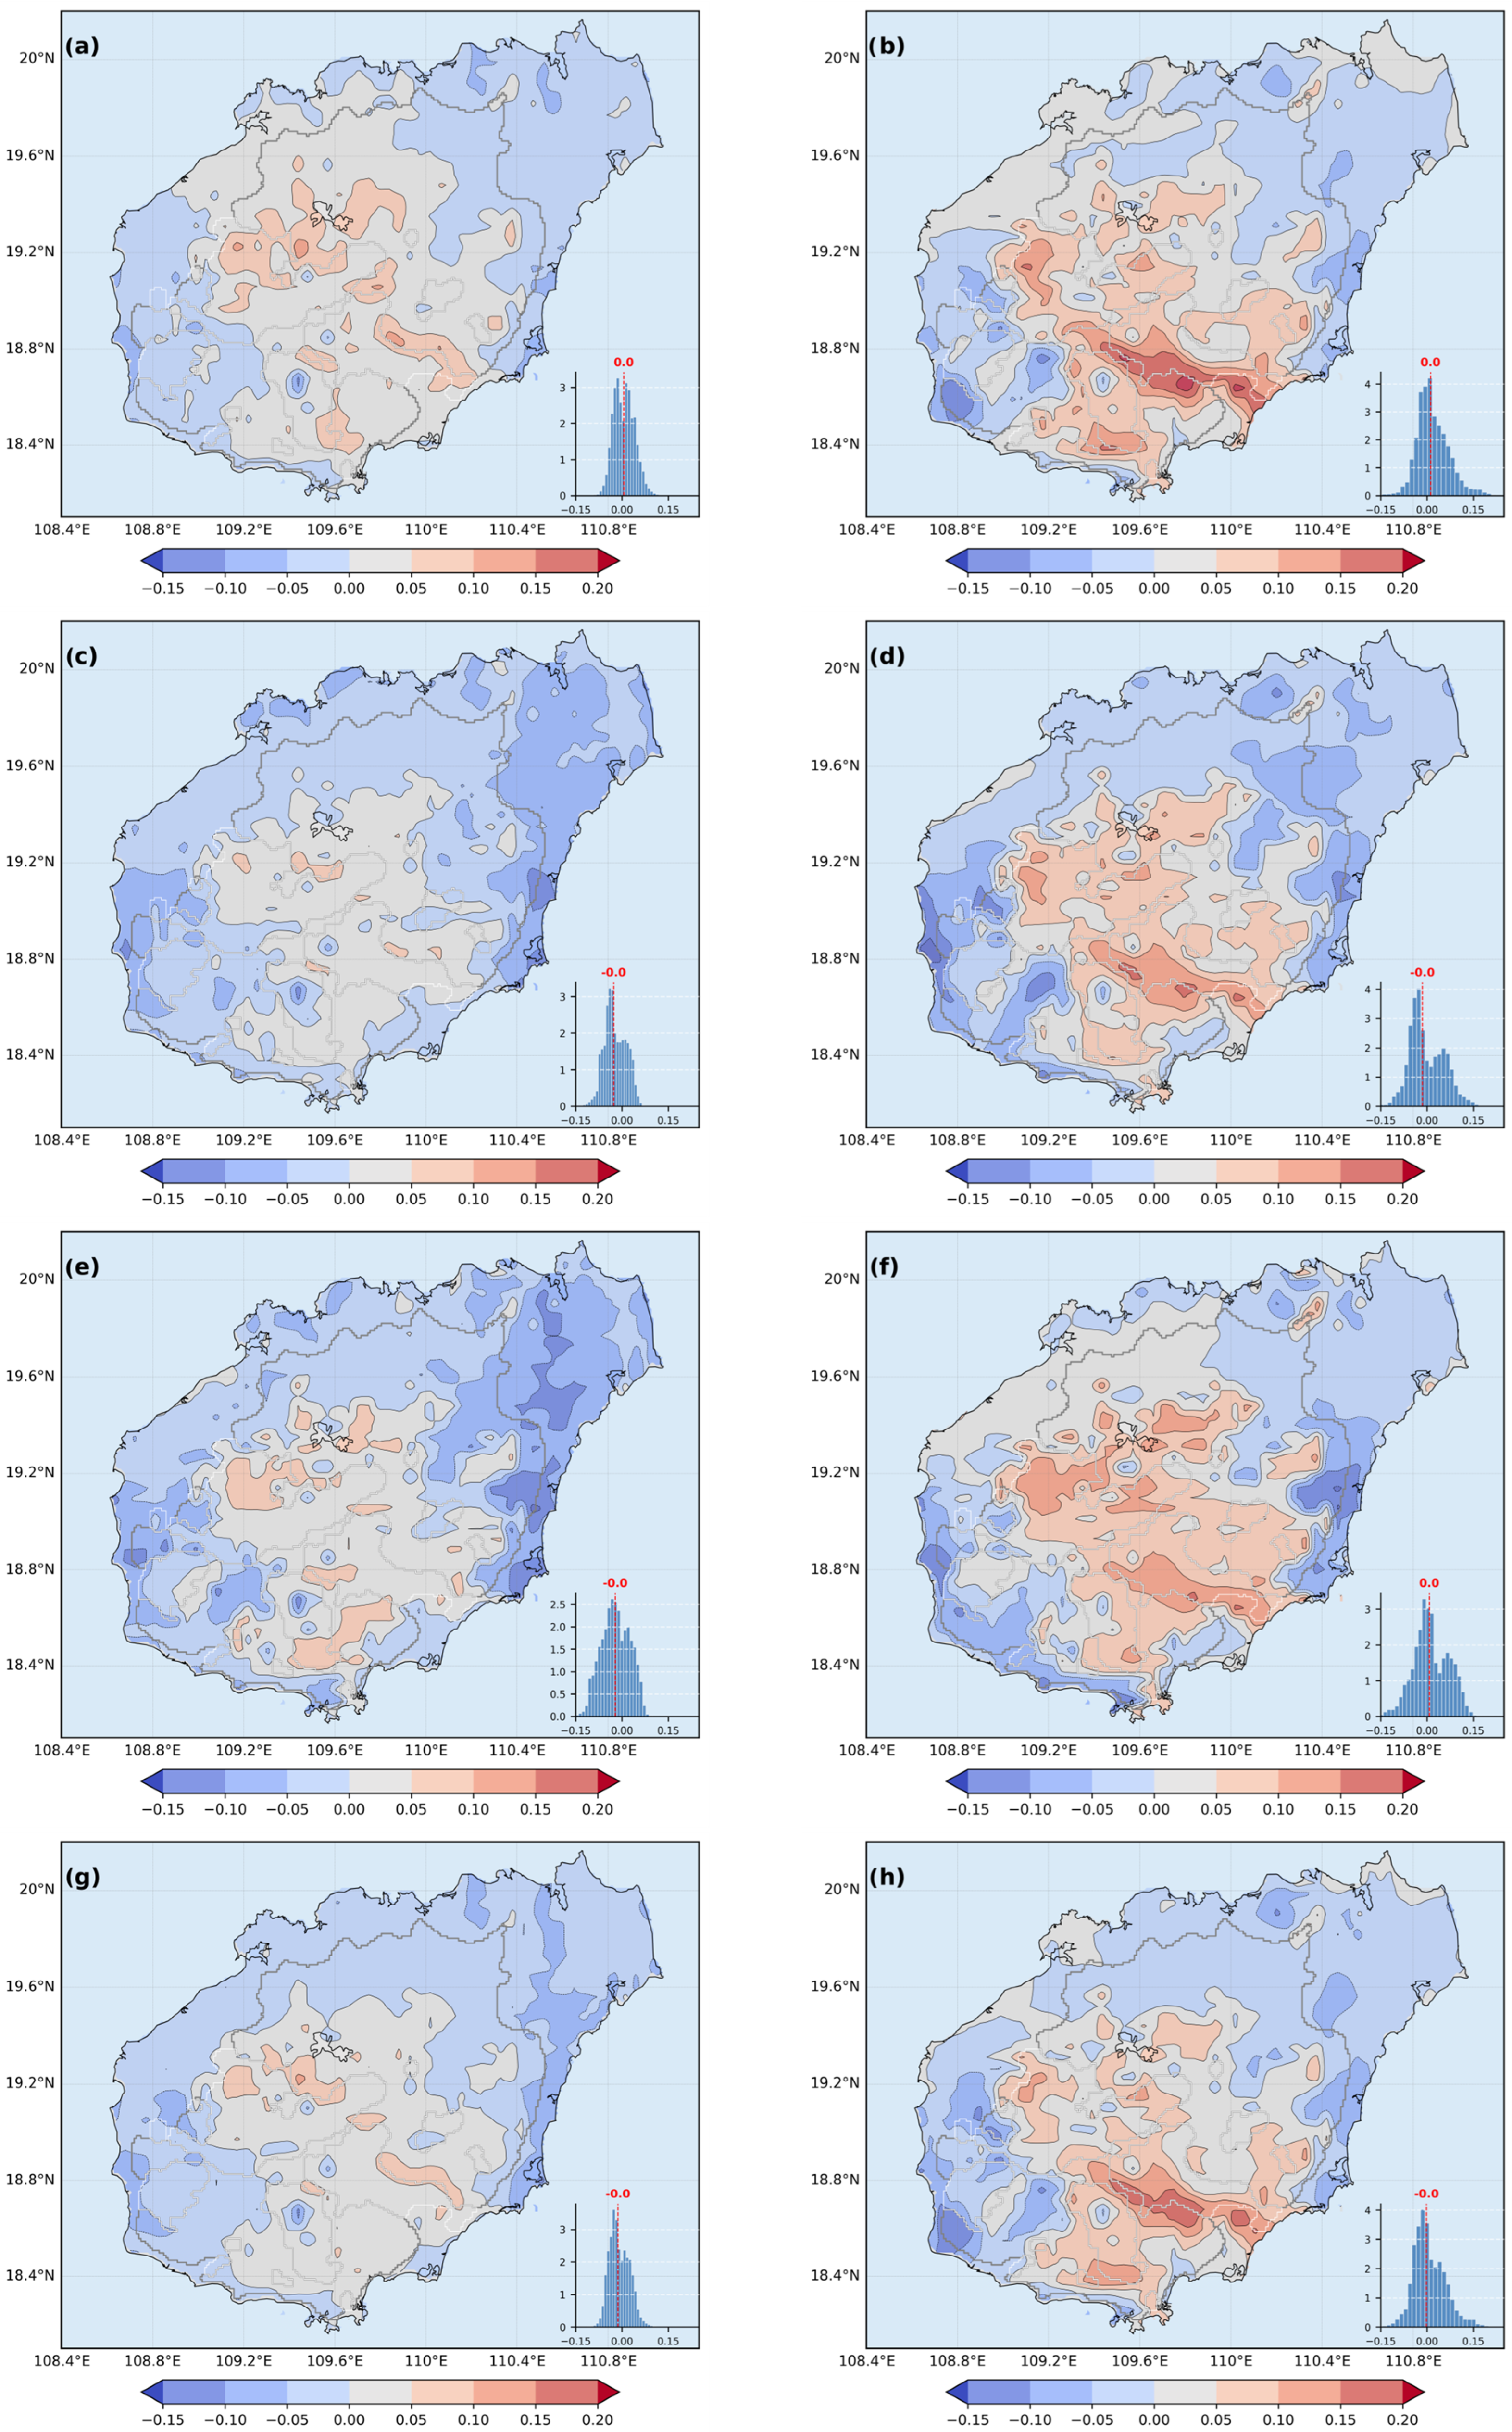
| Dataset | Provider | Temporal Coverage | Spatial Resolution (Atmosphere) | Key Advantages and Suitability for Regional Wind Studies in China |
|---|---|---|---|---|
| ERA5 | ECMWF | 1940–Present | ~31 km (0.28125°) | Highest resolution, hourly data, advanced assimilation. Widely validated and shown to perform well for wind studies in China. |
| ERA-Interim | ECMWF | 1979–2019 | ~79 km (0.75°) | Predecessor to ERA5. It was a benchmark but is now superseded; lower resolution and less advanced model. |
| MERRA-2 | NASA | 1980–Present | ~50 km (0.5° × 0.625°) | High resolution and includes aerosol-weather interactions. A strong alternative, but ERA5 generally has higher spatial/temporal resolution. |
| JRA-55 | JMA | 1958–Present | ~55 km (0.5625°) | Long-term, consistent, and high-quality dataset. Good performance, but slightly coarser resolution than ERA5. |
| NCEP/NCAR R1 | NCEP/NCAR | 1948–Present | ~210 km (2.5°) | Very long time series, but the very coarse resolution is unsuitable for detailed regional or local wind analysis. |
| NCEP-DOE R2 | NCEP/DOE | 1979–Present | ~210 km (2.5°) | An update to R1 with fixes for known errors, but retains the same coarse resolution, limiting its use for regional studies. |
| CFSR | NCEP | 1979–2010 | ~38 km (0.5°) | High resolution for its time, but the time series is discontinued, making it unsuitable for long-term climatological studies extending to the present. |
| Local Metric | Factor Tier | Climate Factor | r |
|---|---|---|---|
| Cold Season Mean Wind Speed | Primary | Pacific Subtropical High Ridge Position | +0.42 ** |
| Indian Subtropical High Ridge Position | +0.37 ** | ||
| North Pacific Pattern (NP) | −0.35 ** | ||
| Secondary | South China Sea Subtropical High Ridge Position | +0.34 * | |
| East Asian Trough Intensity | −0.30 * | ||
| Pacific Polar Vortex Intensity | +0.30 * | ||
| Cold Season SLBDs Count | Primary | Tropical-Northern Hemisphere Pattern (TNH) | −0.53 ** |
| Area of the Indian Ocean Warm Pool | +0.47 ** | ||
| Tibet Plateau Region 2 Index | +0.42 ** | ||
| Northern Hemisphere Polar Vortex Intensity | −0.41 ** | ||
| Secondary | Intensity of the Indian Ocean Warm Pool | +0.40 * | |
| East Pacific 850 mb Trade Wind | −0.31 * | ||
| East Asian Trough Intensity | +0.31 * |
| Local Metric | Factor Tier | Climate Factor | r |
|---|---|---|---|
| Warm Season Mean Wind Speed | Primary | Pacific Transition Pattern (PT) | −0.42 ** |
| Secondary | Tibet Plateau Region 2 Index | −0.24 * | |
| Pacific Polar Vortex Area | +0.24 * | ||
| Tibet Plateau Region 1 Index | −0.23 * | ||
| Warm Season SLBDs Count | Primary | North American Polar Vortex Intensity | −0.36 ** |
| Atlantic-European Polar Vortex Intensity | −0.35 ** | ||
| Northern Hemisphere Polar Vortex Intensity | −0.33 ** | ||
| Pacific Transition Pattern (PT) | −0.32 * | ||
| Secondary | Pacific Polar Vortex Intensity | −0.30 * | |
| Eurasian Zonal Circulation | −0.29 * | ||
| Asia Polar Vortex Intensity | −0.26 * |
Disclaimer/Publisher’s Note: The statements, opinions and data contained in all publications are solely those of the individual author(s) and contributor(s) and not of MDPI and/or the editor(s). MDPI and/or the editor(s) disclaim responsibility for any injury to people or property resulting from any ideas, methods, instructions or products referred to in the content. |
© 2025 by the authors. Licensee MDPI, Basel, Switzerland. This article is an open access article distributed under the terms and conditions of the Creative Commons Attribution (CC BY) license (https://creativecommons.org/licenses/by/4.0/).
Share and Cite
Huang, S.; Jiao, Y.; Shang, M.; Wu, J.; Yang, Q.; Yang, D.; Xing, Y.; Xu, J.; Shi, C.; Wang, B.; et al. High-Resolution Dynamical Downscaling Reveals Multi-Scale Evolution of the Surface Wind Field over Hainan Island (1961–2022). Atmosphere 2025, 16, 1037. https://doi.org/10.3390/atmos16091037
Huang S, Jiao Y, Shang M, Wu J, Yang Q, Yang D, Xing Y, Xu J, Shi C, Wang B, et al. High-Resolution Dynamical Downscaling Reveals Multi-Scale Evolution of the Surface Wind Field over Hainan Island (1961–2022). Atmosphere. 2025; 16(9):1037. https://doi.org/10.3390/atmos16091037
Chicago/Turabian StyleHuang, Shitong, Yue Jiao, Ming Shang, Jing Wu, Quanlin Yang, Deshi Yang, Yihang Xing, Jingying Xu, Chenxiao Shi, Bing Wang, and et al. 2025. "High-Resolution Dynamical Downscaling Reveals Multi-Scale Evolution of the Surface Wind Field over Hainan Island (1961–2022)" Atmosphere 16, no. 9: 1037. https://doi.org/10.3390/atmos16091037
APA StyleHuang, S., Jiao, Y., Shang, M., Wu, J., Yang, Q., Yang, D., Xing, Y., Xu, J., Shi, C., Wang, B., & Bai, L. (2025). High-Resolution Dynamical Downscaling Reveals Multi-Scale Evolution of the Surface Wind Field over Hainan Island (1961–2022). Atmosphere, 16(9), 1037. https://doi.org/10.3390/atmos16091037


