Article

Long-Range Plume Transport from Brazilian Burnings to Urban São Paulo: A Remote Sensing Analysis

by
Gabriel Marques da Silva
1,
Mateus Fernandes Rodrigues
1,*,
Laura Silva Pelicer
1,
Gregori de Arruda Moreira
1,2,
Alexandre Cacheffo
1,3,
Fábio Juliano da Silva Lopes
1,4,
Luisa D’Antola de Mello
1,
Giovanni Souza
1 and
Eduardo Landulfo
1
1
Center for Lasers and Applications (CELAP), Institute of Energy and Nuclear Research (IPEN), São Paulo 05508-000, Brazil
2
Federal Institute of São Paulo (IFSP), Campus Registro, São Paulo 11900-000, Brazil
3
Institute of Exact and Natural Sciences of Pontal (ICENP), Federal University of Uberlândia (UFU), Campus Pontal, Ituiutaba 38304-402, Brazil
4
Department of Environment Sciences, Institute of Environmental, Chemical and Pharmaceutical Sciences (ICAQF), Federal University of São Paulo (UNIFESP), Campus Diadema, São Paulo 09913-030, Brazil
*
Author to whom correspondence should be addressed.
Atmosphere 2025, 16(9), 1022; https://doi.org/10.3390/atmos16091022
Submission received: 11 July 2025 / Revised: 27 August 2025 / Accepted: 27 August 2025 / Published: 29 August 2025

Abstract

In 2024, Brazil experienced record-breaking wildfire activity, underscoring the escalating influence of climate change. This study examines the long-range transport of wildfire-generated aerosol plumes to São Paulo, combining multi-platform observations to trace their origin and properties. During August and September—a period marked by intense fire outbreaks in Pará and Mato Grosso do Sul—lidar measurements performed at São Paulo detected pronounced aerosol plumes. To investigate their source and characteristics, we integrated data from the Earth Cloud Aerosol and Radiation Explorer (EarthCARE) satellite, HYSPLIT back-trajectory modeling, and ground-based AERONET and Raman lidar measurements. Aerosol properties were derived from aerosol optical depth (AOD), Ångström exponent, and lidar ratio (LR) retrievals. Back-trajectory analysis identified three transport pathways originating from active fire zones, with coinciding AOD values (0.7–1.1) and elevated LR (60–100 sr), indicative of dense smoke plumes. Compositional analysis revealed a significant black carbon component, implicating wildfires near Corumbá (Mato Grosso do Sul) and São Félix do Xingu (Pará) as probable emission sources. These findings highlight the efficacy of satellite-based lidar systems, such as Atmospheric Lidar (ATLID) onboard EarthCARE, in atmospheric monitoring, particularly in data-sparse regions where ground instrumentation is limited.

1. Introduction

Forest fires have emerged as an environmental challenge in Brazil, with severe impacts across key biomes, including the Cerrado, Atlantic Forest, and the Pantanal and Amazon [1,2,3,4]. These events imply profound atmospheric consequences, as documented by the World Health Organization (WHO) [5]. Wildfires release substantial quantities of particulate matter (mainly PM2.5), greenhouse gases, and primary and secondary pollutants, all of which degrade air quality and disrupt climatic processes. Furthermore, they alter atmospheric dynamics by influencing cloud microphysics and precipitation patterns [6].
In addition to emitting pollutants, wildfires significantly modify the structure of the Planetary Boundary Layer (PBL) [7,8]. The intense heat generated enhances atmospheric turbulence, leading to PBL thickening and promoting vertical pollutant dispersion. At higher altitudes, advective transport intensifies due to wind and pressure gradients [9], facilitating long-range smoke plume transport from fire zones to populated regions [10]. This process elevates ambient pollutant concentrations and accelerates secondary pollutant formation [11], resulting in air quality degradation, which has direct consequences for public health [12].
During August 2024, Brazil experienced a marked surge in wildfire activity, particularly in the São Paulo, Mato Grosso do Sul, and Amazonas states. The BDQueimadas platform serves as the primary data source for Brazilian wildfire monitoring, providing near-real-time satellite-derived hotspot information [13]. This system processes and validates fire data with daily updates, presenting them through interactive maps, graphical analyses, and tabular formats to support research applications [13].
As mentioned in previous papers [14], the wildfires in Brazil’s Central-West and Northern regions impact São Paulo air quality, elevating PM2.5 concentrations during July and August, which overlap with the Southern Hemisphere’s wildfire and winter seasons [15]. The heightened toxicity of wildfire-derived PM2.5 disproportionately affects vulnerable populations. In 2024, combined local fires and transported plumes drove a 10% increase in pediatric respiratory hospitalizations, alongside rises of 12% (respiratory) and 13% (cardiovascular) among older adults [12].
Quantifying wildfire impacts is critical for evidence-based policymaking, public health mitigation, and environmental protection [16,17]. However, comprehensive monitoring in Brazil remains challenging due to the spatial scale required. In this scenario, remote sensing techniques, more specifically lidar systems, have emerged as essential tools, exemplified by studies analyzing São Paulo’s winter pollution in 2019 [18], as well as novel methodologies for biomass-burning aerosol detection and source attribution [18]. However, South America, more precisely Brazil, has a large deficit of this type of instrument.
This study aims to demonstrate how data from the recently launched Earth Cloud Aerosol and Radiation Explorer (EarthCARE) satellite can be a relevant tool to identify and characterize the transport of wildfire plumes by analyzing aerosol vertical profiles in areas where no lidar systems or other in situ instruments are available. Firstly, we performed a comparative analysis of backscatter and extinction profiles at 355 nm obtained from Atmospheric Lidar (ATLID), onboard EarthCARE, and coincident measurements from the São Paulo Urban (SPU) Lidar Station to identify the strong points and limitations of satellite data in comparison with a ground-based lidar. Then, a case study is presented where, to trace the transport pathways of wildfire plumes to São Paulo, we integrated HYSPLIT back-trajectory analysis with vertically resolved aerosol measurements from ATLID and column-integrated AERONET data.
This paper is organized into four main sections: Section 2 details the instrumentation and datasets employed in the study, while Section 3 presents the methodology. Section 4 discusses the key findings and their implications, with concluding remarks presented in Section 5.

2. Materials and Methods

2.1. Study Area and Data

This study examines three selected Brazilian regions, representing distinct climatic and demographic conditions: (1) São Paulo city (population about 11.4 million [19]), featuring a transitional tropical highland/subtropical climate; (2) São Félix do Xingu (population about 65,000 [19]), characterized by a humid equatorial climate with pronounced wet seasons (December–May) [20,21]; and (3) Corumbá (population about 96,000 [19]), situated in a tropical continental/humid subtropical transition zone with distinct seasonal precipitation patterns [20,21]. Figure 1 illustrates their geographic distribution.
The regions mentioned above were selected because of their prevalence of fire hotspots during August 2024 [13]. Data retrieved from the BDQueimadas platform for 1–31 August 2024 revealed Mato Grosso and Pará as the most affected states, with 14,620 (21.3% of Brazil’s total) and 13,800 (20.1%) hotspots, respectively, representing year-over-year increases of 457% and 105%, while Mato Grosso do Sul recorded the most dramatic surge: 4648 hotspots (6.8% of the total), marking a 1850% rise from just 239 in August 2023 [13]. At the regional level, Corumbá recorded 1268 hotspots, ranking as the 8th city with the highest number nationwide (4.1%) [13]. Regarding the number of hotspots and density (hotspots per square kilometer), São Félix do Xingu registered 2908 hotspots, the highest number among all Brazilian cities (9.3%) and the most critical municipality in the central Amazon [13]. Finally, São Paulo was selected because it hosts the lidar system used for monitoring.

2.2. Instrumentation

2.2.1. The SPU Lidar Station

The SPU Lidar Station is located at the Center for Lasers and Applications (CELAP) of the Institute for Energy and Nuclear Research (IPEN) in São Paulo (23.56 S, 46.74 W, 740–760 m a.s.l., UTC−3). It is part of the Latin America Lidar Network (LALINET), a federated and coordinated lidar network dedicated to monitoring the vertical distribution of aerosol optical properties across Latin America [22]. The system is a multiwavelength Raman lidar that employs an Nd:YAG pulsed laser operating at a 100 Hz repetition rate, emitting at three wavelengths (355, 532, and 1064 nm). Currently, the system utilizes six detection channels, including the three elastic backscatter signals mentioned above and three Raman-shifted signals at 387 nm (corresponding to nitrogen), 530 nm (corresponding to nitrogen), and 408 nm (corresponding to water vapor). The vertical (spatial) resolution is 7.5 m, reaching complete overlap at 300 m above ground level. This configuration enables high-resolution profiling of atmospheric aerosols and water vapor, thereby contributing to regional and international research on atmospheric composition.

2.2.2. Atmospheric Lidar (ATLID) Instrument Onboard EarthCARE

ATLID operates at an ultraviolet (UV) wavelength of 355 nm, with an energy of 38 mJ, at a repetition rate of 51 Hz and a pulse duration of 20 ns [23]. Through a 63 cm diameter telescope, the backscattered photons are collected and filtered by a high-spectral-resolution receiver (HSRL), enabling depolarization measurements that separate particulate and molecular components. The vertical resolution is 103 m for the first 20.5 km and 500 m from 20.5 to 40 km [24]. It features three detection channels: Mie co-polar, Rayleigh co-polar, and cross-polar. As a result, this instrument is capable of providing estimates of vertical profiles of aerosols and thin clouds, allowing for the classification of aerosol types. More technical details about EarthCARE (https://www.esa.int/Applications/Observing_the_Earth/FutureEO/EarthCARE/The_EarthCARE_satellite. Accessed on 28 August 2025) instruments can be found in References [24,25].

2.2.3. Hybrid Single-Particle Lagrangian Integrated Trajectory Model (HYSPLIT)

HYSPLIT is a computational tool designed to simulate air parcel trajectories and backward trajectories on a global scale, using satellite data and predefined altitude parameters [26]. In this study, HYSPLIT was employed to compute 72 h backward trajectories, initialized on 2 September 2024, at altitudes of 1500, 2000, and 2575 m above ground level (a.g.l.). These simulations aimed to evaluate the potential long-range transport of biomass burning aerosols from distant source regions to São Paulo.

2.2.4. Aerosol Robotic Network (AERONET)

AERONET (Aerosol Robotic Network) is a globally distributed ground-based monitoring system designed for the comprehensive characterization of aerosols at regional and global scales. NASA’s Earth Observing System established it and further developed it through collaboration with organizations worldwide [27]. For this study, the following aerosol-related parameters were determined: aerosol optical depth (AOD), Ångström exponent (AE), lidar ratio (LR), and the scattering and absorption Ångström exponents (SAE and AAE, respectively). These were obtained from the AERONET station in São Paulo. This station is situated near the SPU Lidar Station, ensuring coordinated observational capabilities. The analyzed data corresponds to the period of 1–2 September 2024.

3. Methodology

This study proposes an analysis of atmospheric conditions in areas where no lidar systems or other in situ instruments are available and is divided into two parts. In the first one, the backscatter and extinction products provided by ATLID are compared with the data measured by the SPU Lidar Station in São Paulo. In the second, after such a comparison, the ATLID’s products are used to investigate areas with biomass burning conditions. HYSPLIT back-trajectories beginning in the selected sites (Corumbá and São Félix do Xingu) were generated, mapping the occurrence of the fire events and the transportation of the plumes to the metropolitan region of São Paulo. The vertical profiles and aerosol classification measured by EarthCARE in both the selected areas and São Paulo were used to confirm the characteristics of the plumes generated in the fires and those that reached São Paulo.

3.1. EarthCARE and ATLID Data

The European Space Agency (ESA) provides the EarthCARE auxiliary orbit plotting files through the Online Dissemination website [28]. They are imported as input data into the Earth System Orbit Visualization (ESOV) software (https://earth.esa.int/eogateway/tools/esov-software-tools-esov-ng-), which provides the EarthCARE’s overpasses data within a radius and zone defined by the user [29]. For our purposes, we initially determined all the EarthCARE overpasses lying within a horizontal distance of 100 km or less from the selected sites, corresponding to an orbit portion within a 100 km radius around these sites [30]. For São Paulo, the location of the SPU Lidar Station was used to select the overpasses [30].
The ESA automatically processes the ATLID products [31]. They are generated under specific data-processing algorithms, the baselines, which are constantly being improved and updated. The ATLID products are available on the EarthCARE Online Dissemination Service [28], where EarthCARE data collections are accessible to various user communities. For this study, the ATLID Level 2A Extinction, Backscatter, and Depolarization Product (ATL_EBD_2A) was selected to obtain vertical profiles of backscatter, extinction, lidar ratio, and AOD [24]. At the same time, the ATLID Level 2A Target Classification Product (ATL_TC_2A) was used for aerosol classification and characterization [24]. The ATL_EBD_2A and ATL_TC_2A data used in this work were filtered considering the quality status flag “0” (0 for best quality and 4 for worst quality), and both products belong to the AC baseline.

3.2. SPU Lidar Station Data

Ultraviolet (355 nm) and visible (532 nm) lidar observations were used for the analysis. The backscattered signal (P(r)) is processed to reduce the interference of electronic noise (dark current (DC)) and background radiation (BG) [18]. The result is multiplied by the square of the height (z2) to account for the altitude-dependent variation in signal strength, giving the Range-Corrected Signal (RCS) [18]:
RCS(z) = (P(r) − DC(r) − BG) z2
The RCS is inverted using the Klett–Fernald–Sasano method [32,33,34,35], where a known LR is assumed to solve the lidar equation, enabling the obtention of both the backscatter coefficient (β) and the extinction coefficient (α). The LR value used in the signal inversion is adjusted according to the AOD at a 500 nm mean value measured for São Paulo in the last 20 years, resulting in a value of 56 sr for September [36].

3.3. AERONET and Ångström Matrix

Aerosol classification based on AOD and AE values is well established in the literature [27,37]. Elevated AOD values indicate a substantial concentration of suspended particulate matter in the atmosphere, signifying considerable light absorption or scattering as the solar radiation traverses the atmosphere [38,39]. In the same way, higher AE values suggest the predominance of fine-mode aerosols, typically associated with smoke and biomass-burning emissions. Inversion products (Version 3) from the AERONET station in São Paulo were used to derive the Ångström exponent matrix for characterization of the observed aerosol plume [40,41]. More details about the Ångström matrix can be found in [42,43].

3.4. BDQueimadas Data

The BDQueimadas database (from the Portuguese Base de Dados de Queimadas, Fire Database) is a public monitoring system maintained by Brazil’s National Institute for Space Research (INPE) [13]. This platform provides near-real-time detection of thermal hotspots, which serve as a proxy for active fires and biomass burning events across Brazil and other South American countries. The system offers tools for visualizing the current fire scenario, including the spatial distribution of hotspots, affected areas, and aggregated statistics by country, state, region, and biome [13].
For this study, wildfire hotspot data were acquired from the BDQueimadas platform [13]. The data extraction procedure involved applying a series of filters to isolate the relevant dataset. The initial filters were set to select data from the reference satellite (e.g., Aqua and Terra) for South America and Brazil [13]. Subsequently, data were extracted for individual states—specifically São Paulo, Mato Grosso do Sul, Mato Grosso, and Pará—using a fixed date range from 27 August 2024 to 2 September 2024. The filtered data for each state were then exported for further analysis.

4. Results and Discussion

4.1. Comparison Between ATLID and SPU Lidar Station Data

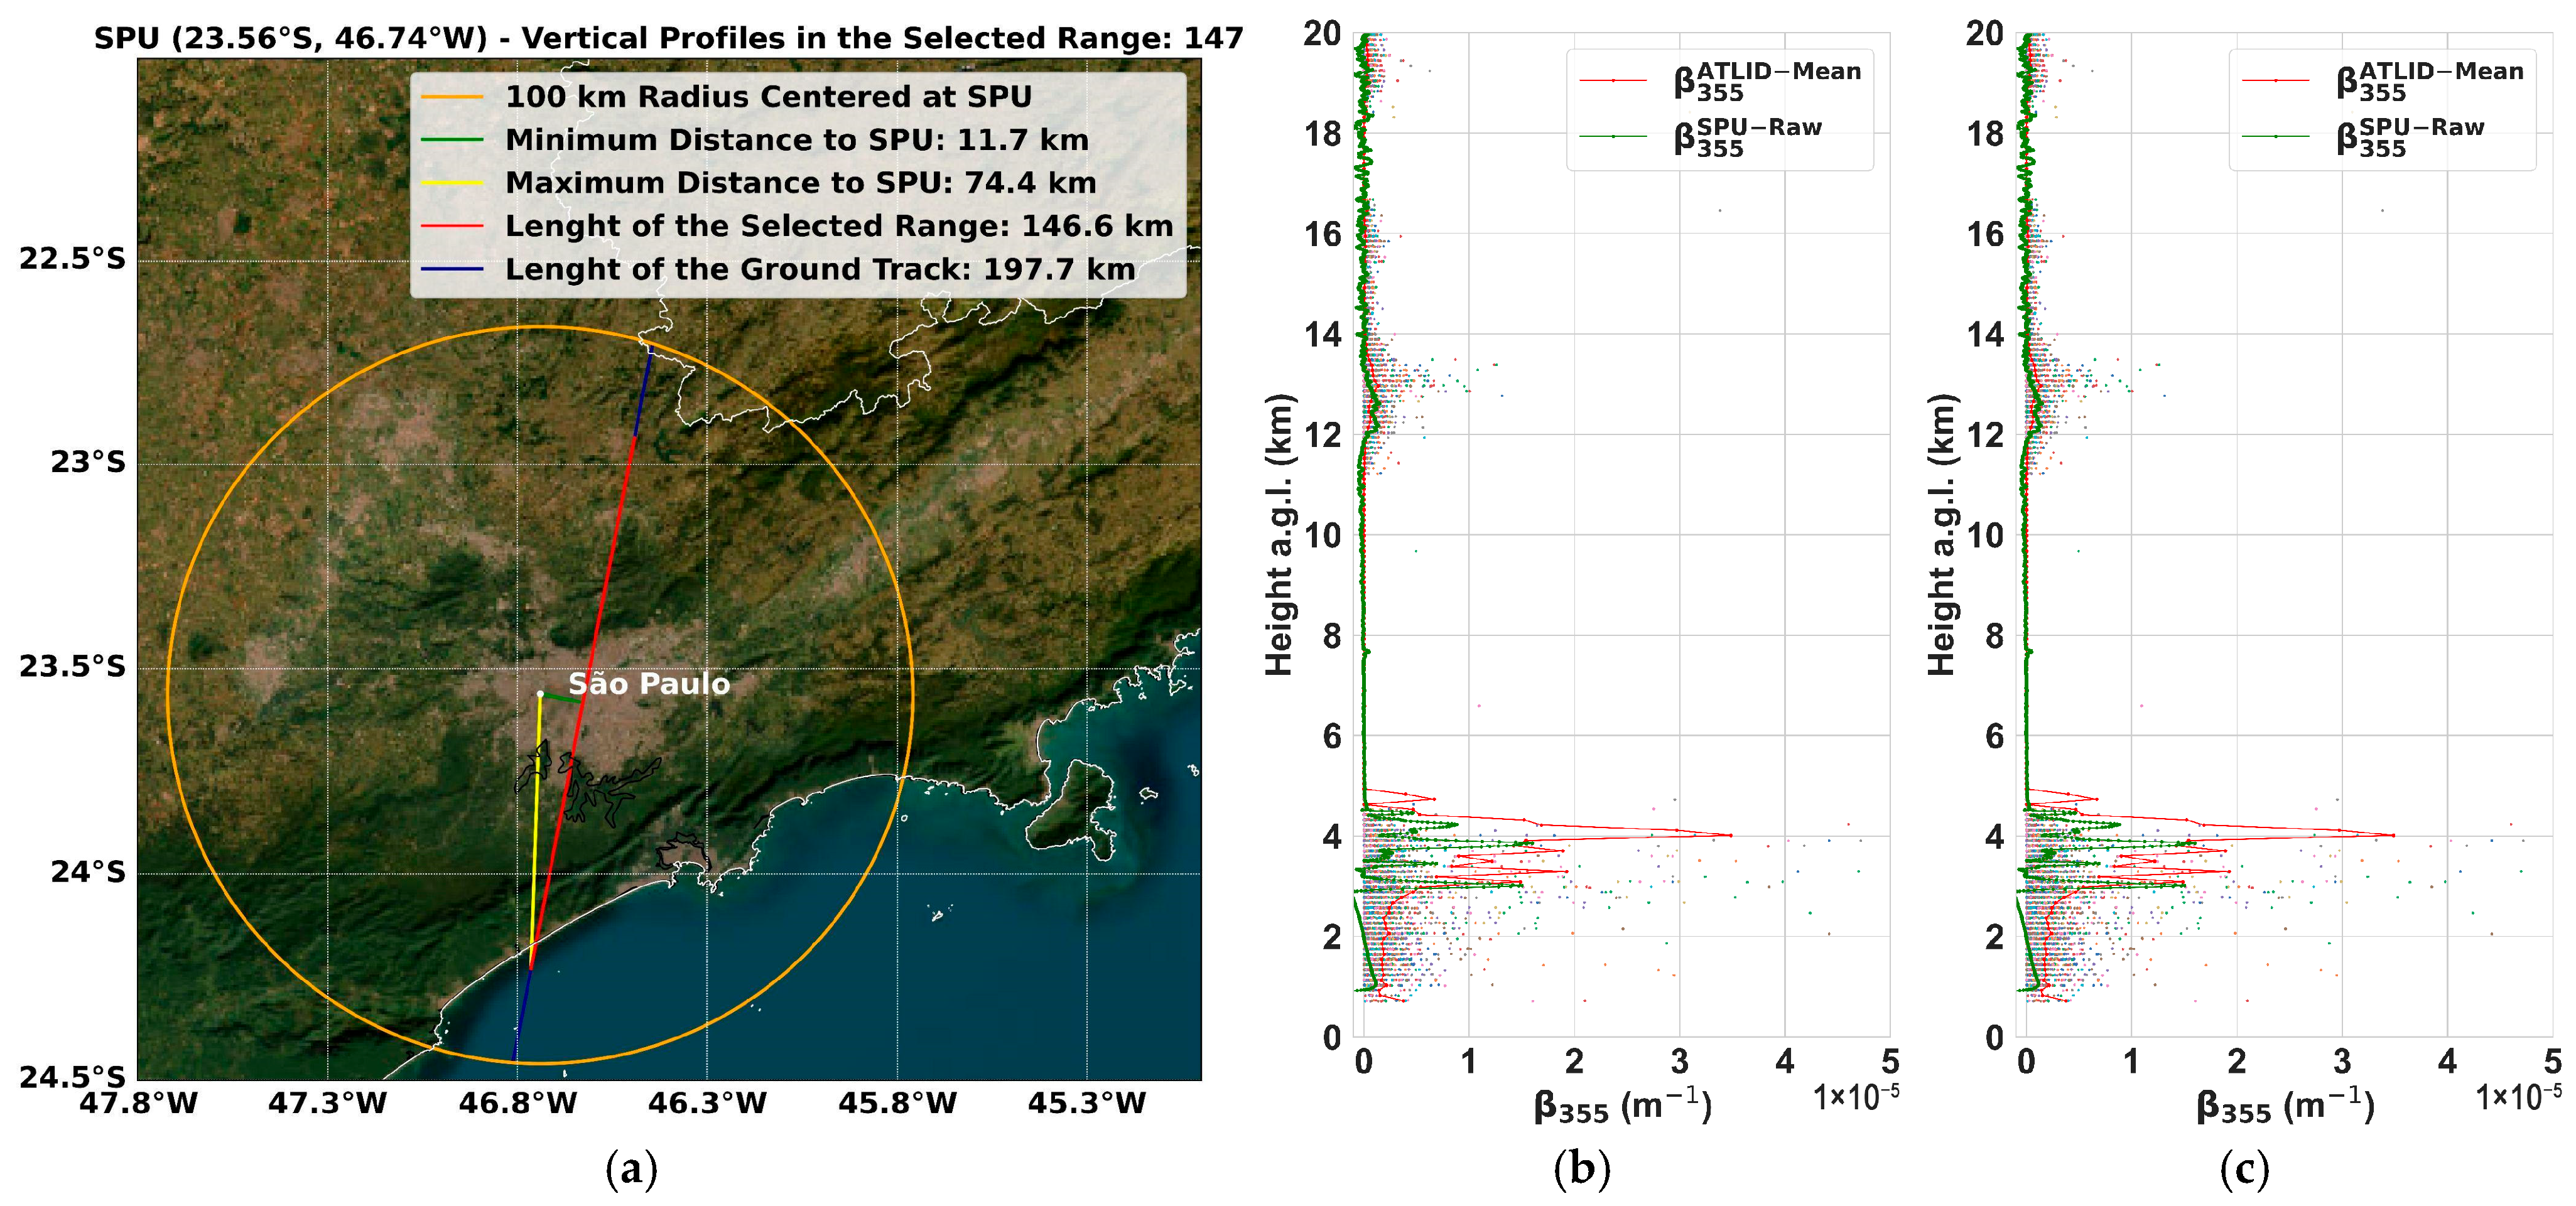
For the comparison between the ATLID and SPU Lidar Station Data, two days of measurements were considered: 2 September 2024, when the lidar measurements occurred during an ascending overpass of the satellite, at approximately 05:20 UTC, and 27 November 2024, when the lidar measurements occurred during a descending overpass at approximately 16:50 UTC. Such overpasses are presented in Figure 2a and Figure 3a, respectively. In such figures, the blue line represents the portion of the orbit contained within the radius of 100 km, centered at the SPU Lidar Station (orange circle). The red line represents a part (range) of this portion. Such a range is calculated when the minimum and maximum distances between the SPU Lidar Station are defined. The values of minimum and maximum distance are chosen so that the range contains a considerable number of vertical profiles closer to the station. This approach aims to compare the measurements taken from the atmospheric column closest to the SPU Lidar Station.
Once the range is defined, the mean of all vertical profiles contained in that interval (red line in Figure 2a and Figure 3a) is calculated. Additionally, the satellite measures along a path that is often relatively distant from the reference instrument (see the blue line in Figure 2a and Figure 3a), and the averaging process also includes atmospheric columns that are relatively far from the SPU Lidar Station location. Therefore, each profile included in the range is also plotted to identify outliers, which can influence the resulting mean and lead to an inaccurate representation of the data.
The red lines in Figure 2b,c and Figure 3b,c present the backscatter and the extinction mean vertical profiles, respectively, both for 355 nm, and calculated using the methodology proposed above. The green lines in both figures present the raw lidar data measured by the SPU Lidar Station.
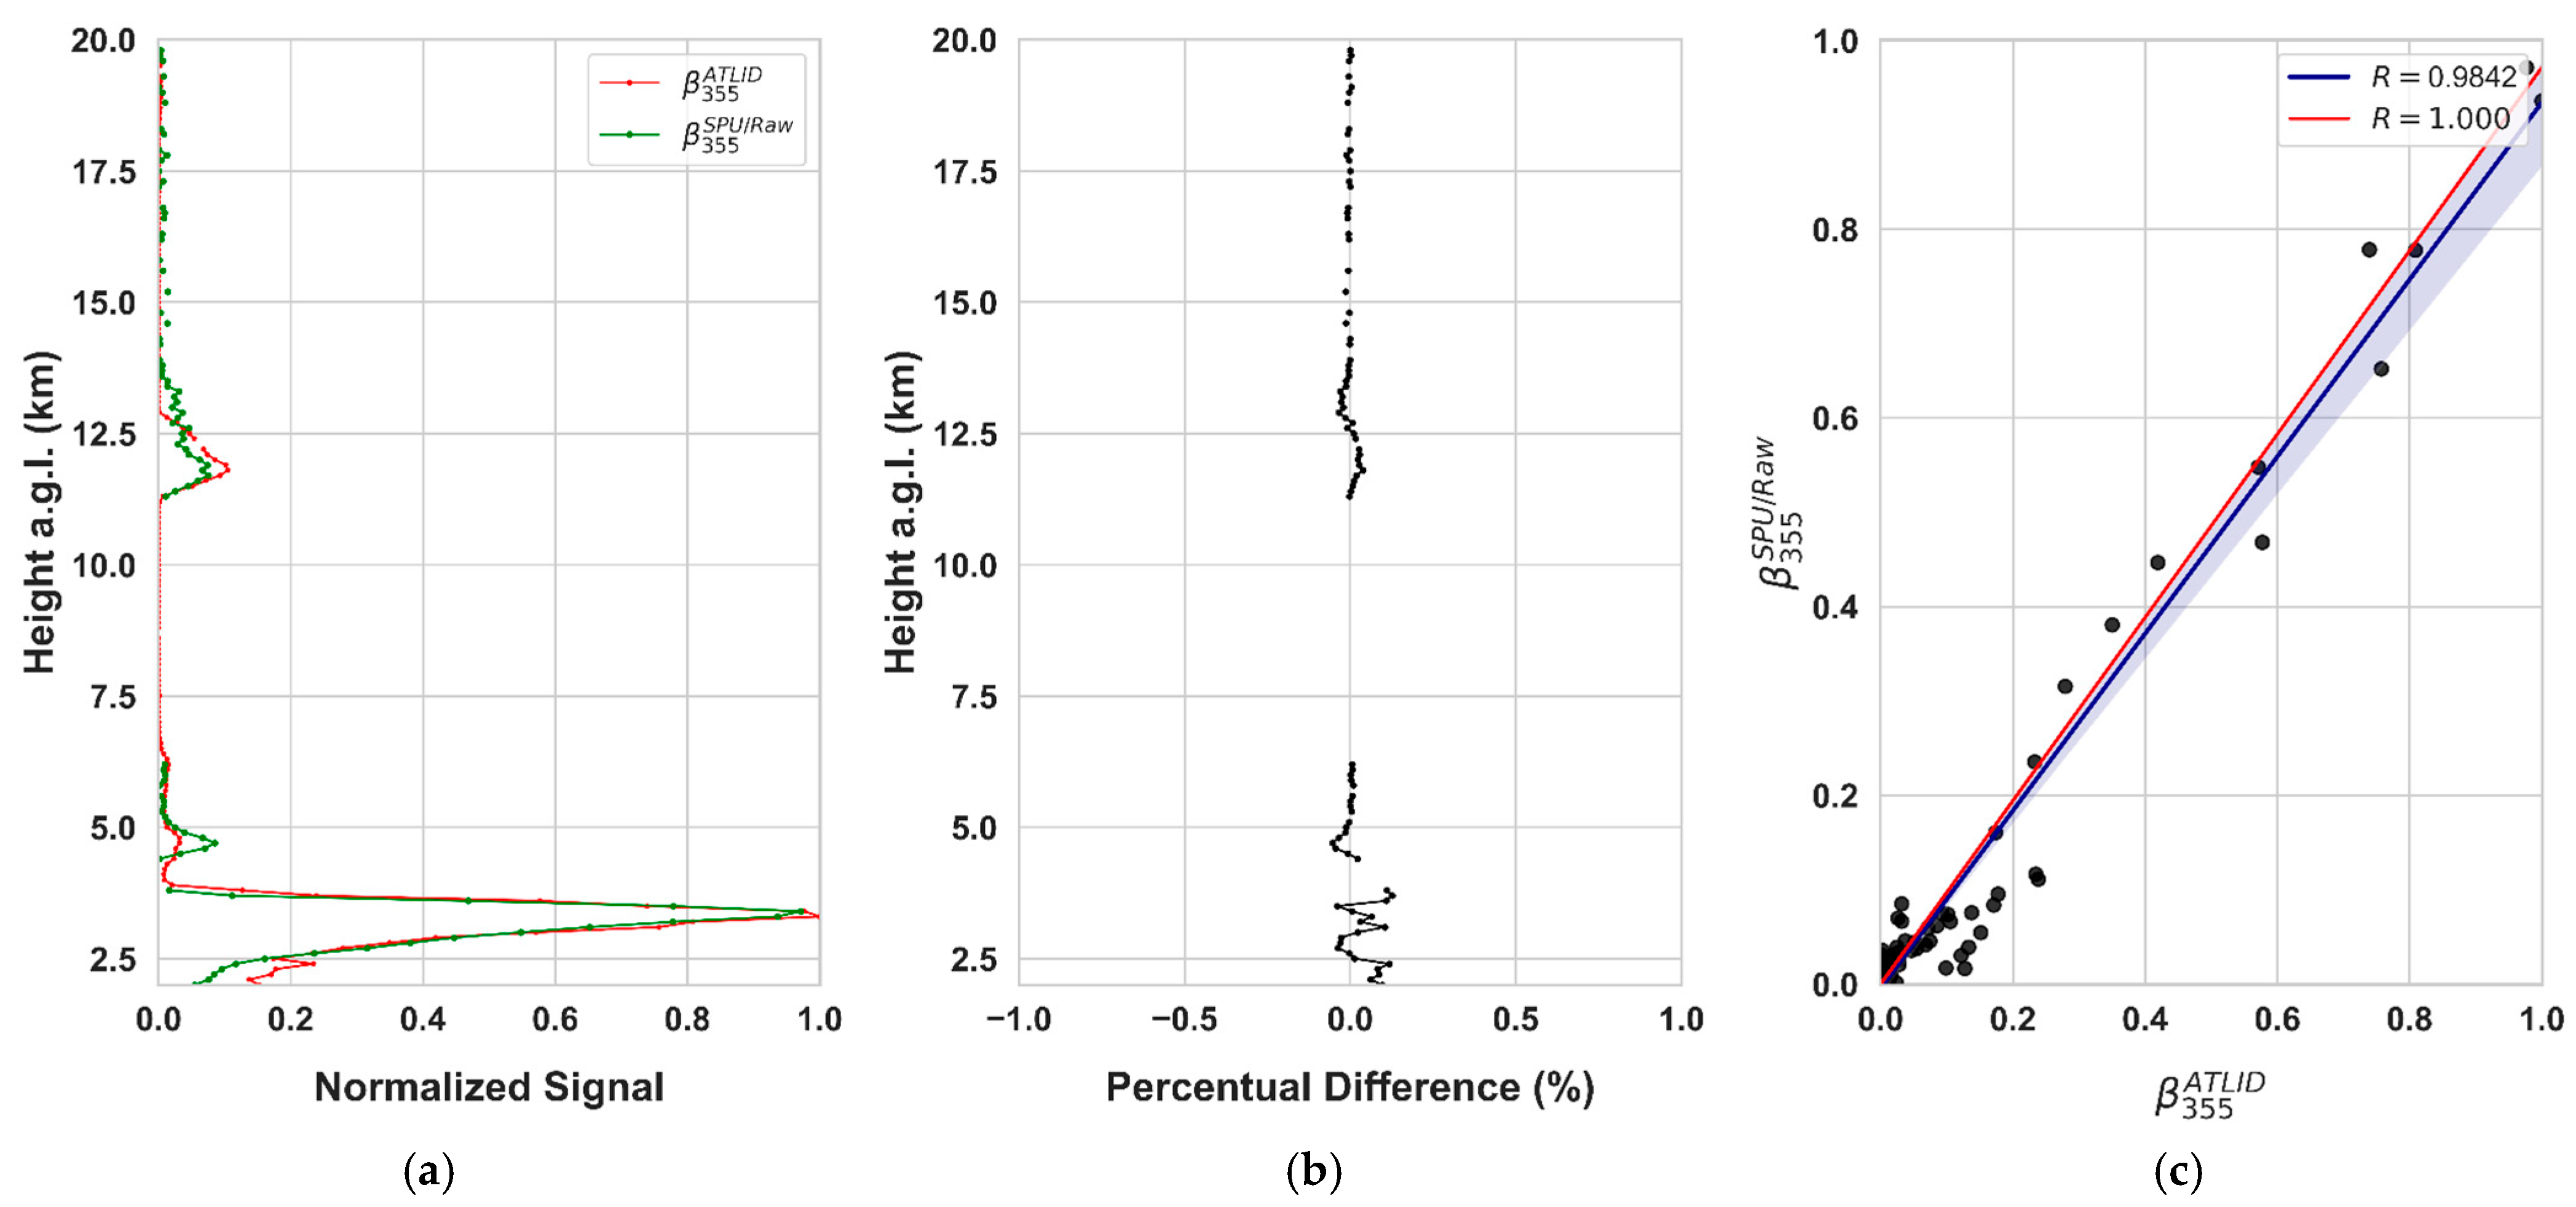
To compare the ATLID and SPU Lidar Station vertical profiles from 2 September 2024, we proceeded with the normalization of the data (Figure 4a), demonstrating that both systems exhibit maximum and minimum signal values at the same altitudes. Figure 4b shows the relative difference between the profiles, which is less than 15% at all points between 0 and 20 km. Finally, Figure 4c shows the correlation between the ATLID and SPU Lidar Station profiles, which has a significant agreement (R2~0.98).
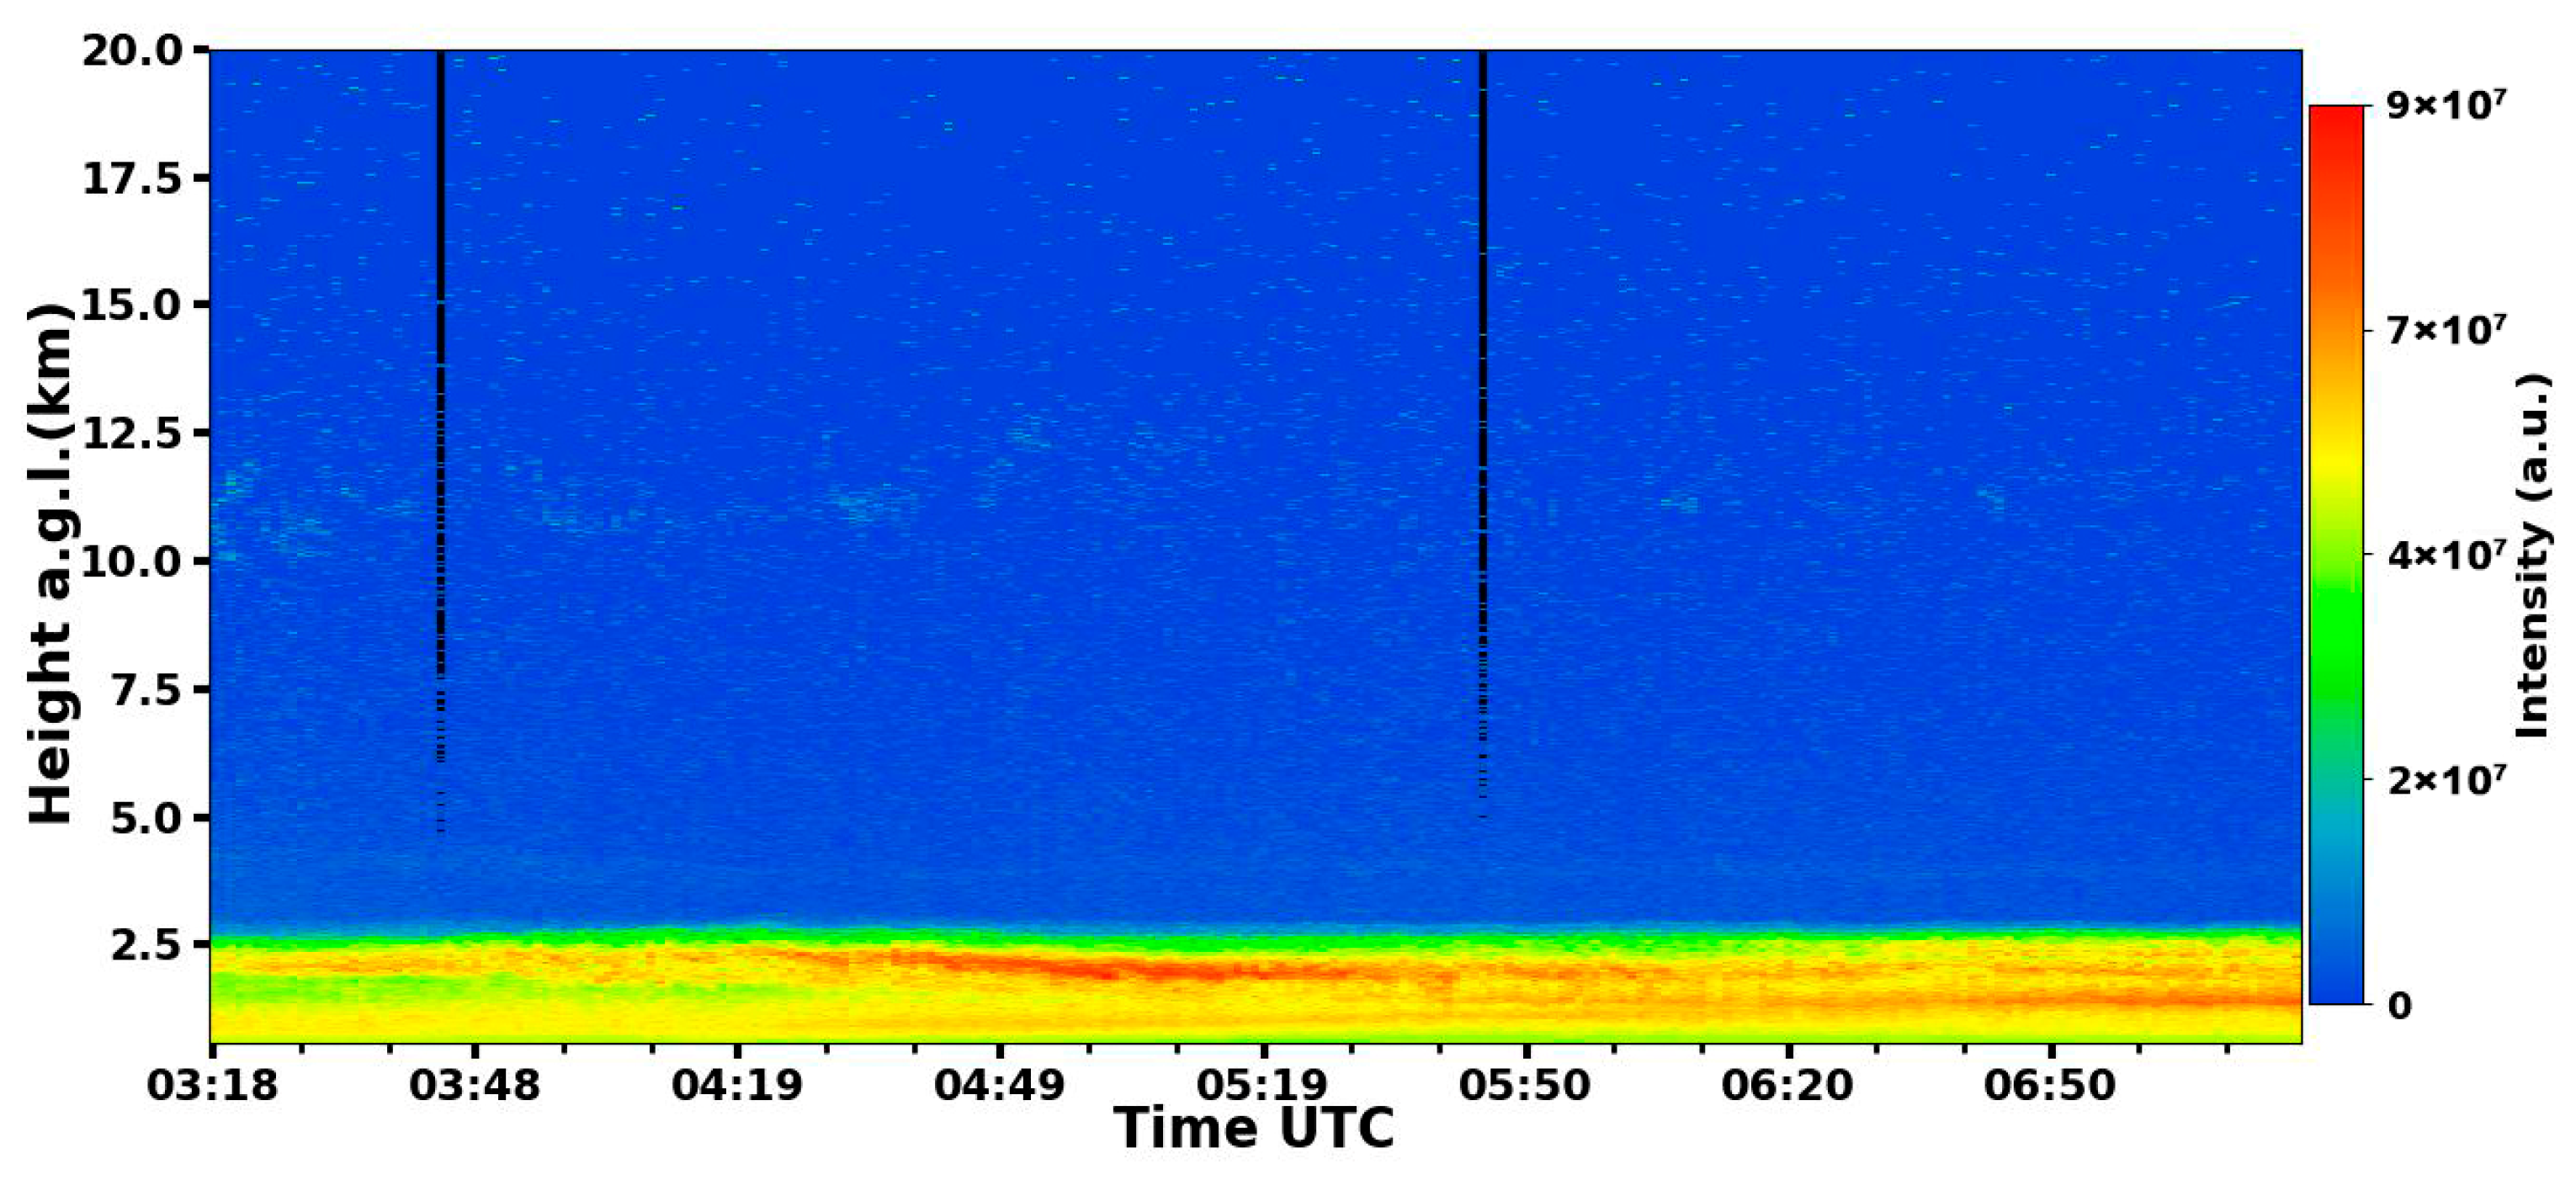
Figure 5 shows the Range-Corrected Signal (RCS) in a 532 nm (RCS532) curtain plot for the period used for data inversion. This period is considered ideal to perform the data inversion because of the absence of low clouds.
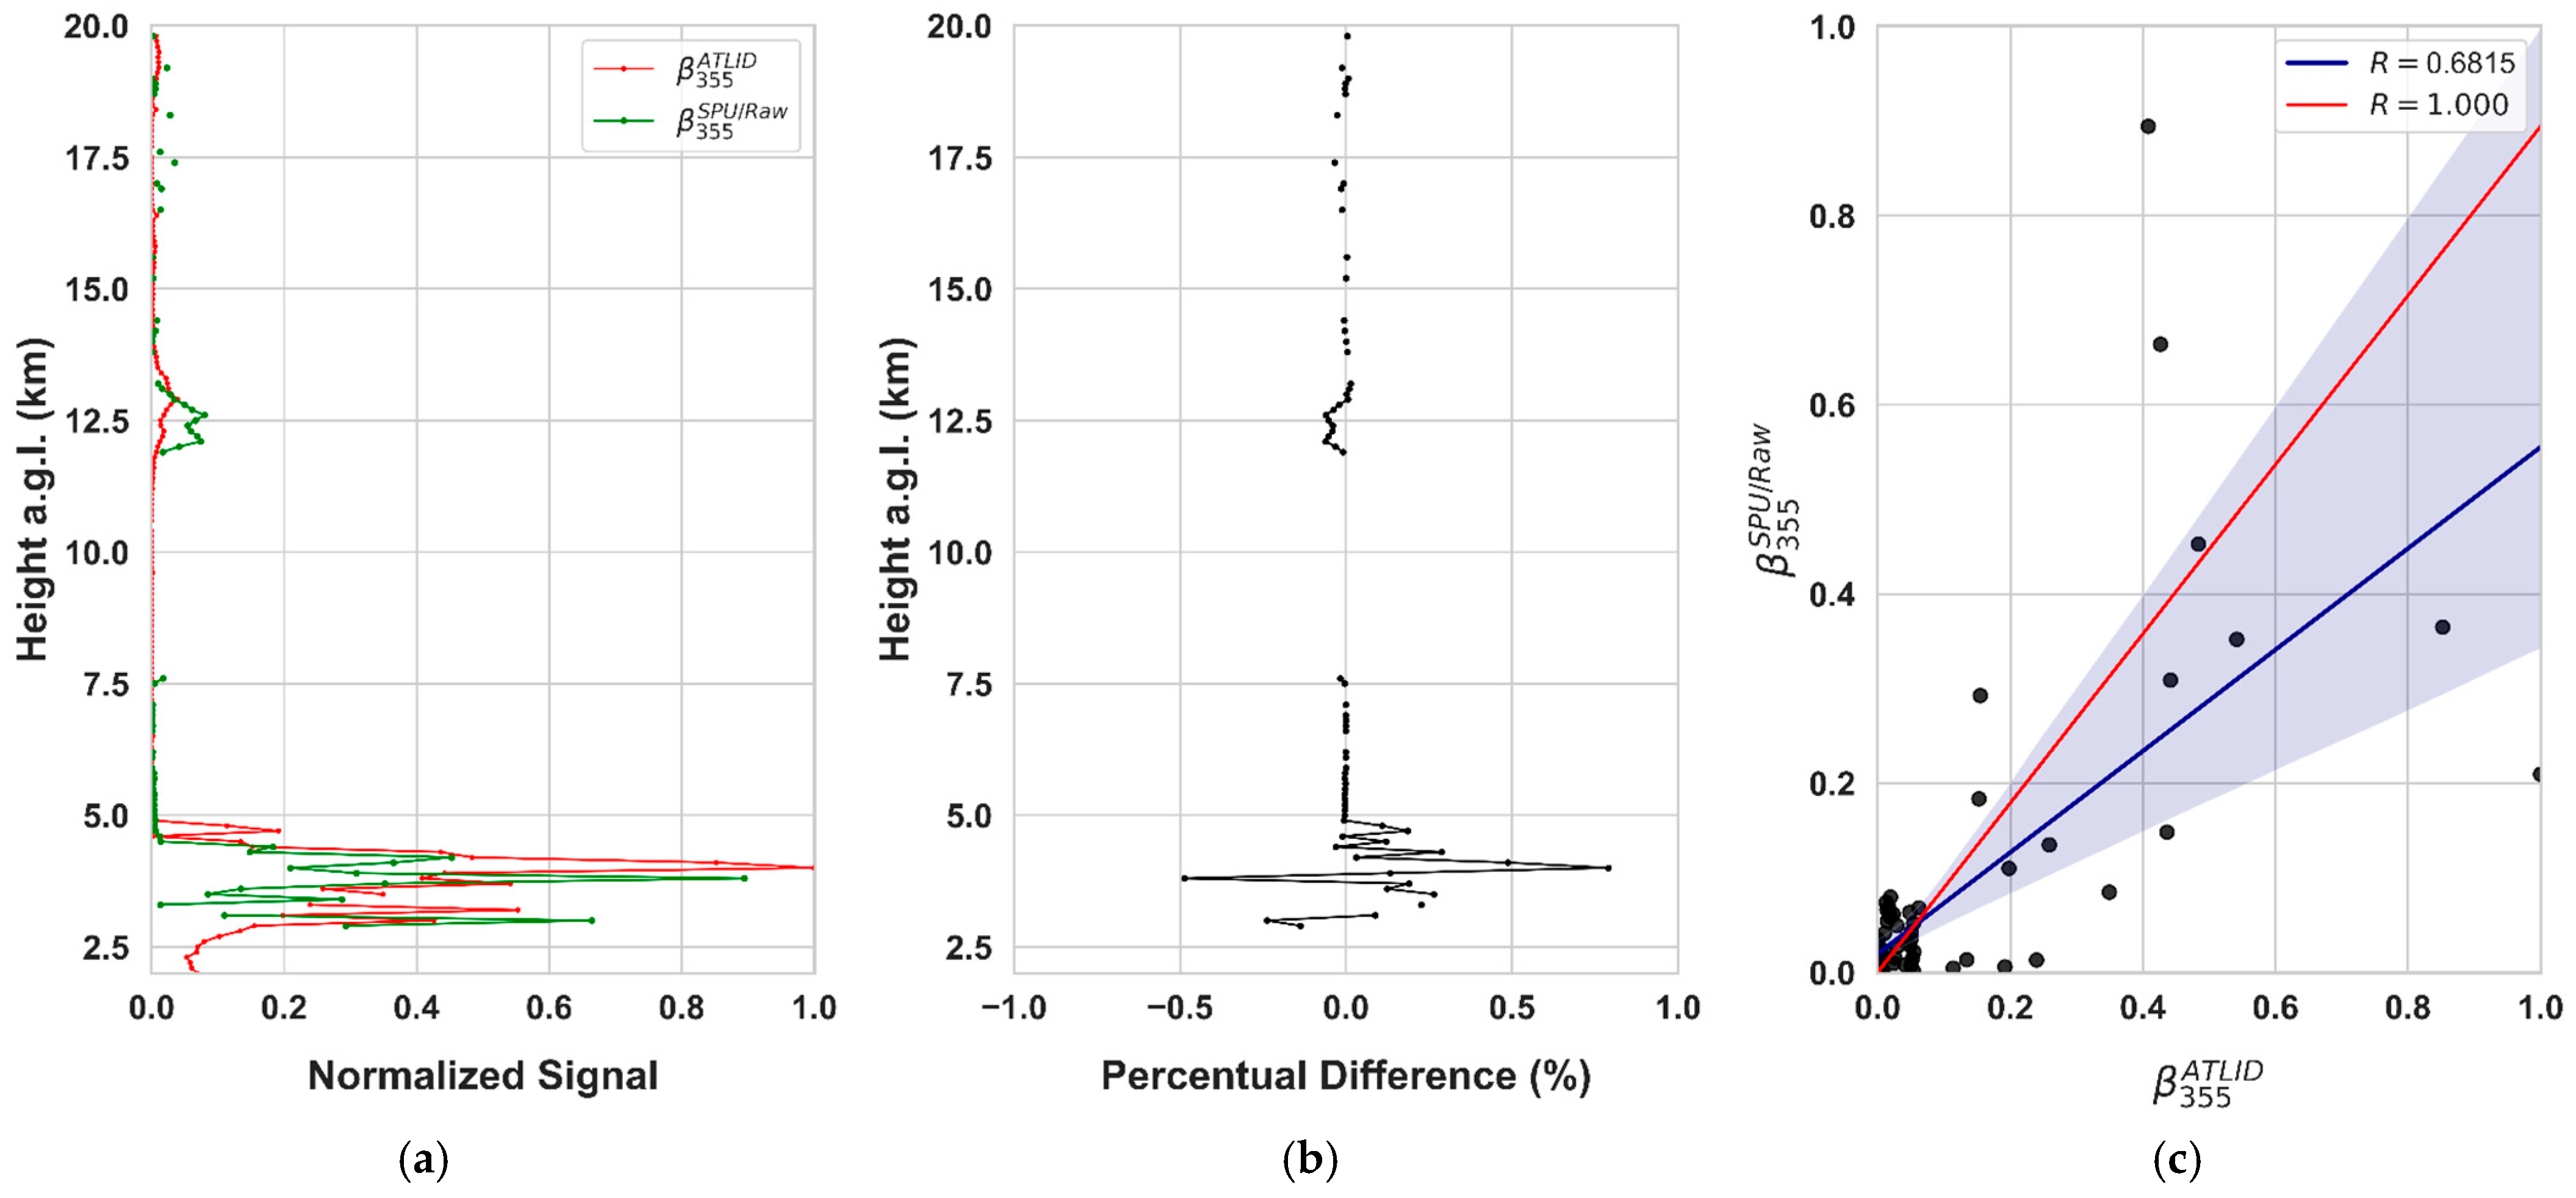
On the other hand, a comparison between the profiles from 27 November 2024, shows that the normalized profiles present considerable differences in the positions of the maximum and minimum values (Figure 6a), resulting in significant percentual differences (Figure 6b), especially below 5 km. The correlation (Figure 6c) also presents a value (R2~0.68) lower than that observed the previous day, demonstrating a disagreement between the ATLID and SPU Lidar Station profiles.
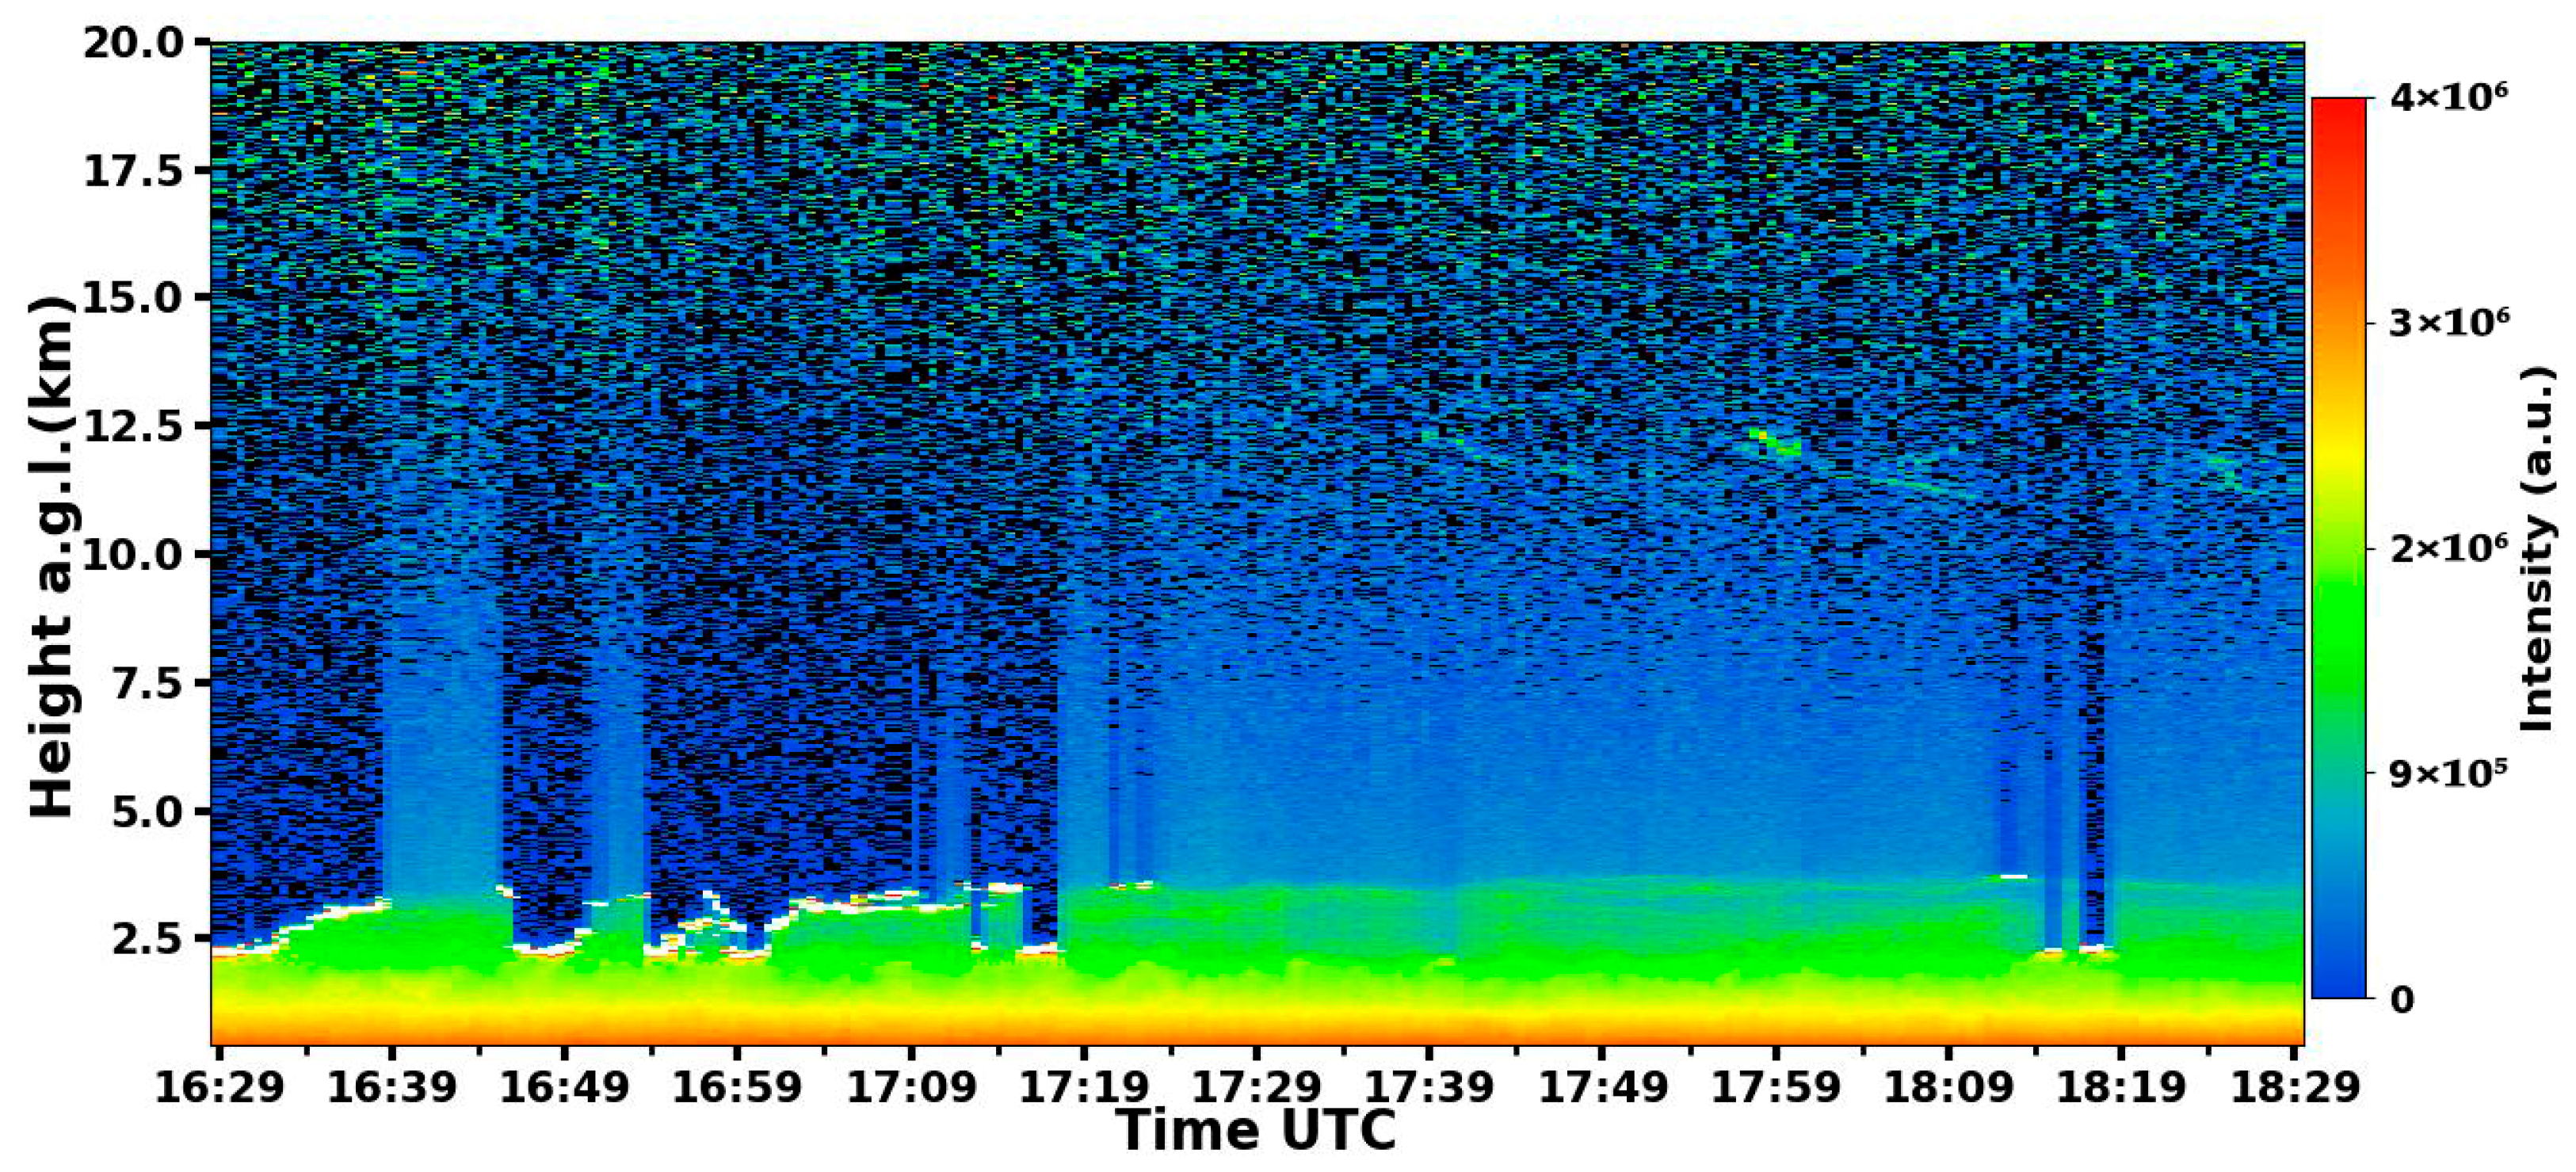
Observing the RCS532 curtain plot, shown in Figure 7, it is possible to observe the presence of low clouds, which makes the inversion process, as described in Section 3.2, more complex.
Finally, on days without the presence of clouds, we can observe that the ATLID and SPU Lidar Station data present very similar results. However, on days with low clouds, this statement is no longer valid.

4.2. Analysis of Atmospheric Transport to São Paulo

4.2.1. SPU Lidar Station Measurements

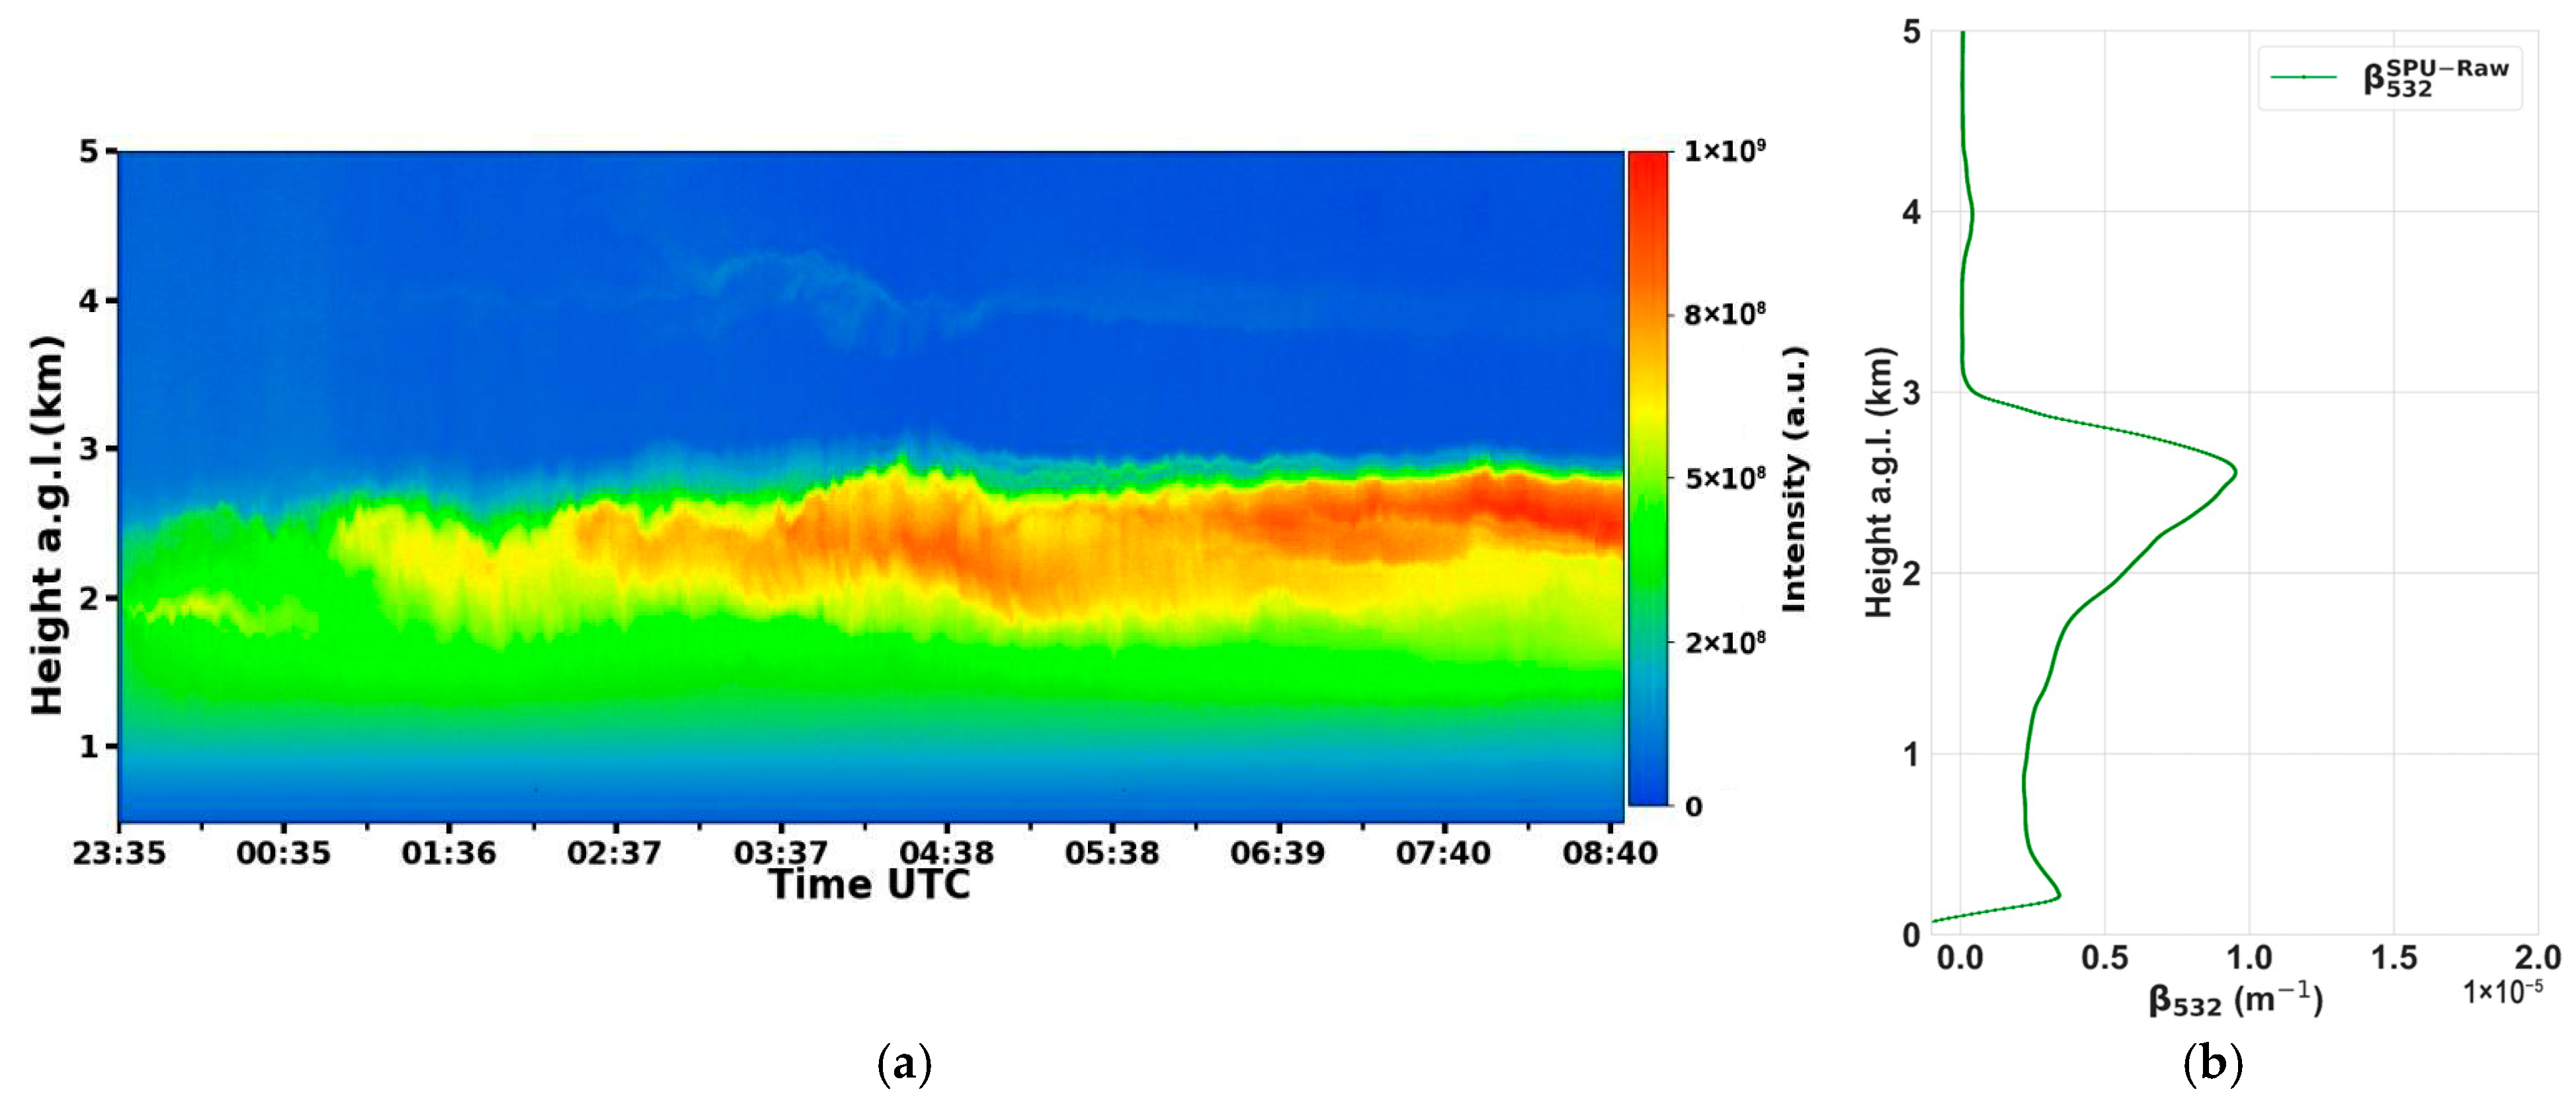
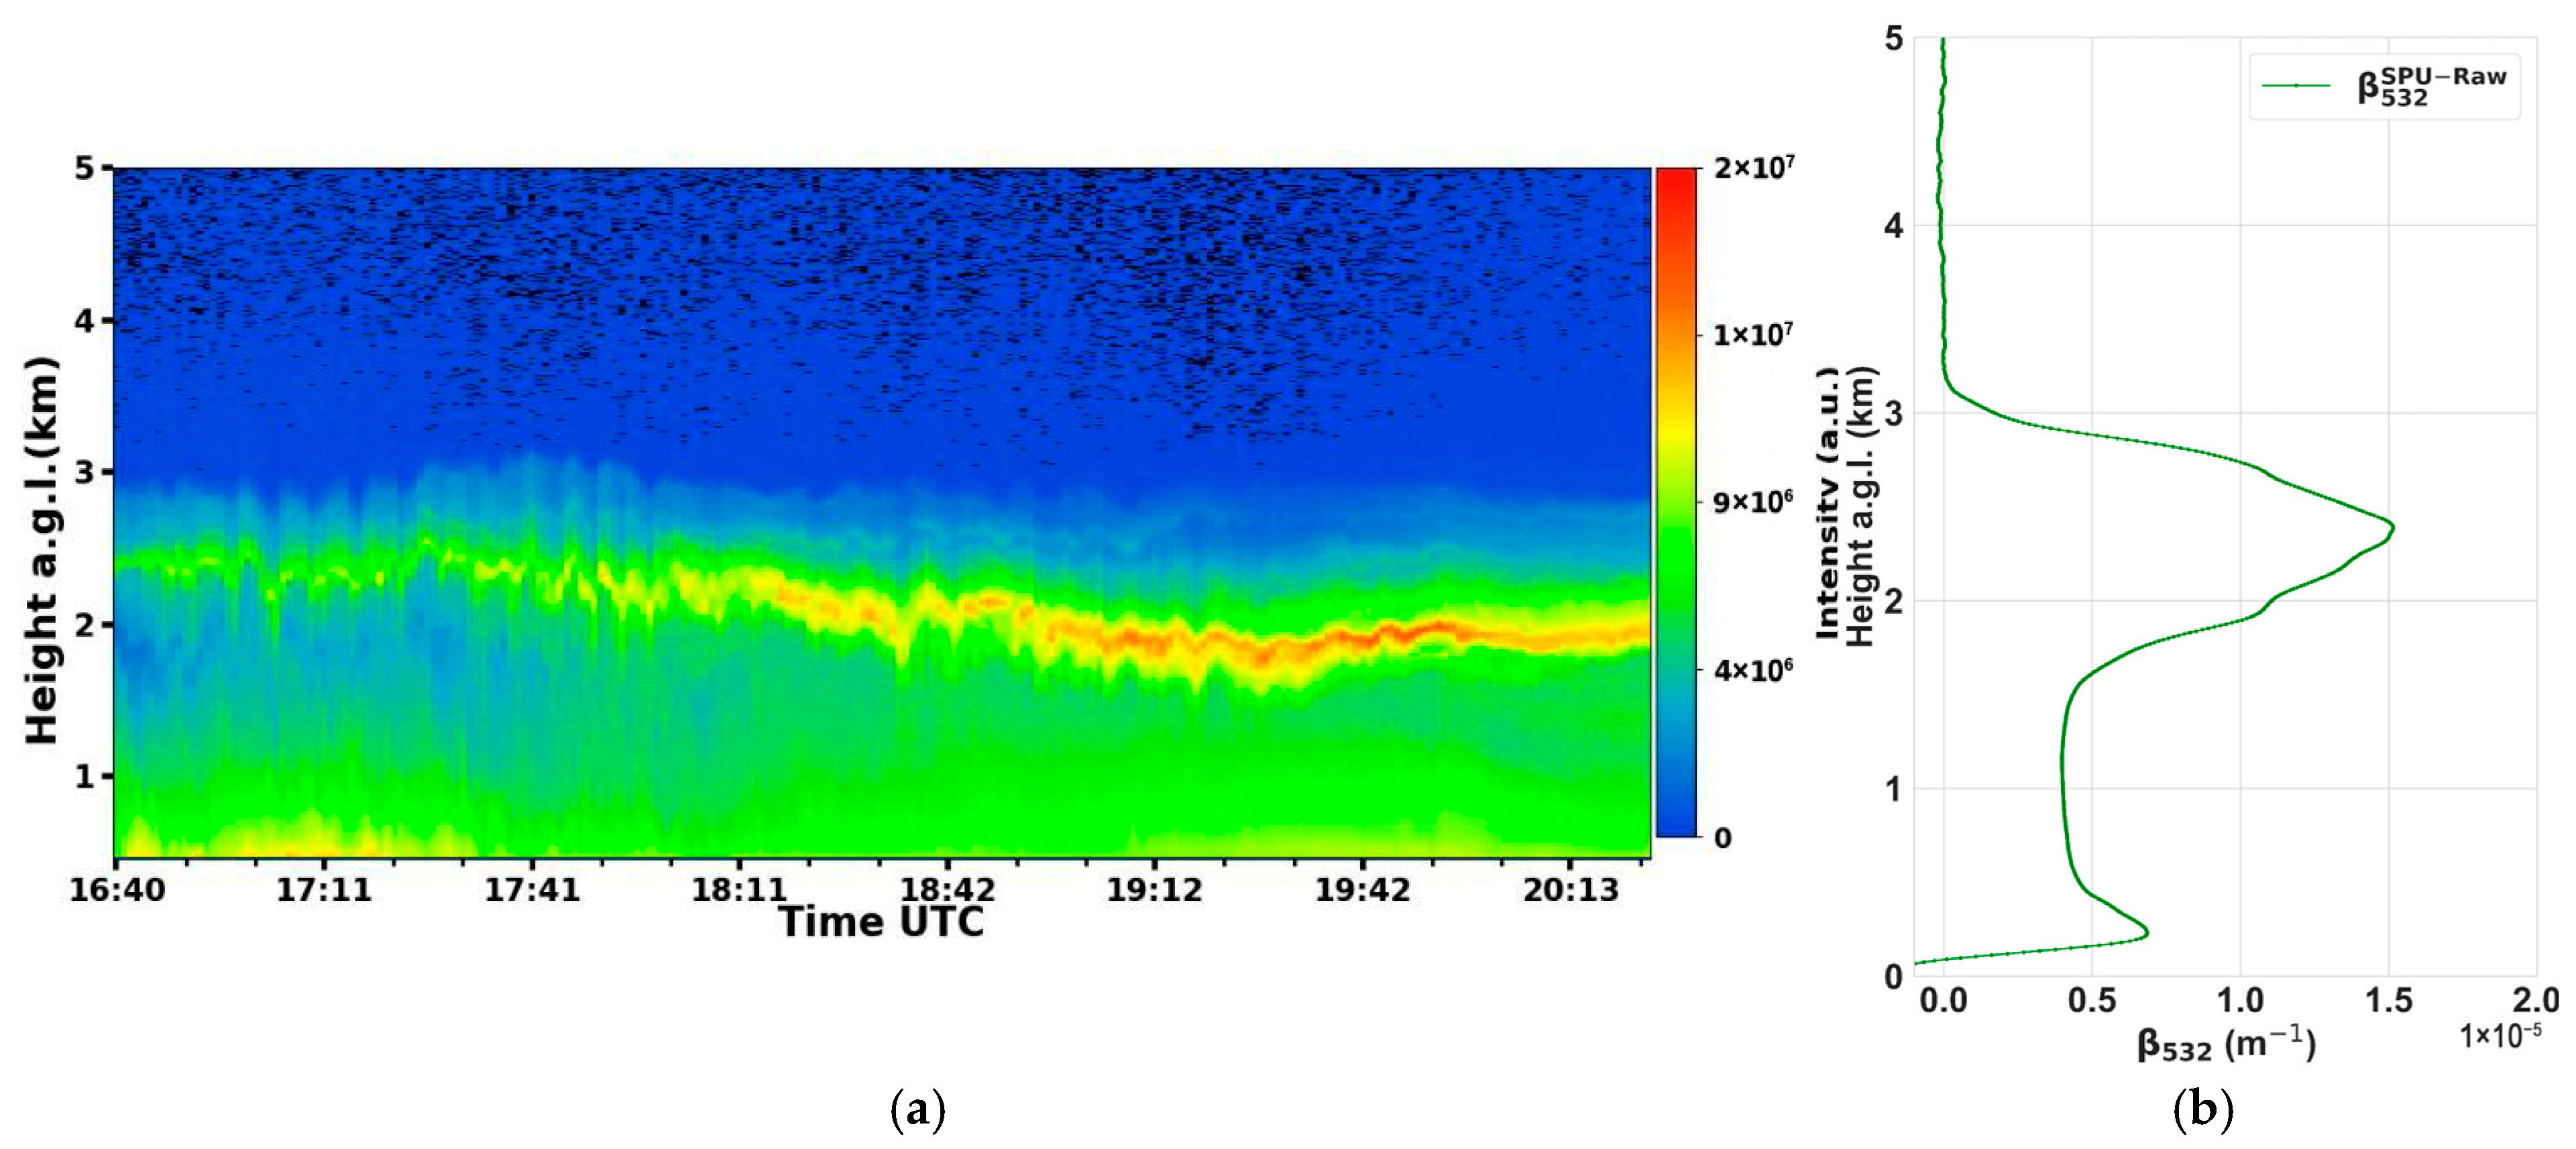
On 1 and 2 September 2024, respective nocturnal and diurnal measurements were conducted at the SPU Lidar Station. Figure 8a and Figure 9a present the RCS532 curtain plot, accompanied by the corresponding backscatter profiles depicted in Figure 8b and Figure 9b, respectively. The RCS532 curtain plot reveals the presence of an aerosol layer persisting between approximately 2 and 3 km in altitude, extending from the early hours of 1 September 2024 (Figure 8a) through the evening of 2 September 2024 (Figure 9a).

4.2.2. Ångström Matrix for São Paulo

Based on the Ångström matrix presented in Figure 10, it is possible to observe that most of the aerosols observed on 1 and 2 September 2024, are characterized as black carbon (BC), which is one of the primary aerosols emitted during biomass burning and can remain suspended in the atmosphere for approximately one week [44]. Therefore, aerosols resulting from biomass burning were present in São Paulo on 1 and 2 September and were detected by the SPU Lidar Station. Similar results were reported in previous studies. In Ref. [45], aerosol plumes were identified in São Paulo with potential origins in remote regions, including the southern Amazon basin, northern Argentina, and localized areas within São Paulo state—the latter attributed to sugarcane burning activities. Ref. [18] analyzed the impact of biomass burning events on the metropolitan region of São Paulo, further corroborating the influence of regional and long-range transport of particulate emissions.

4.2.3. BDQueimadas Data Analysis

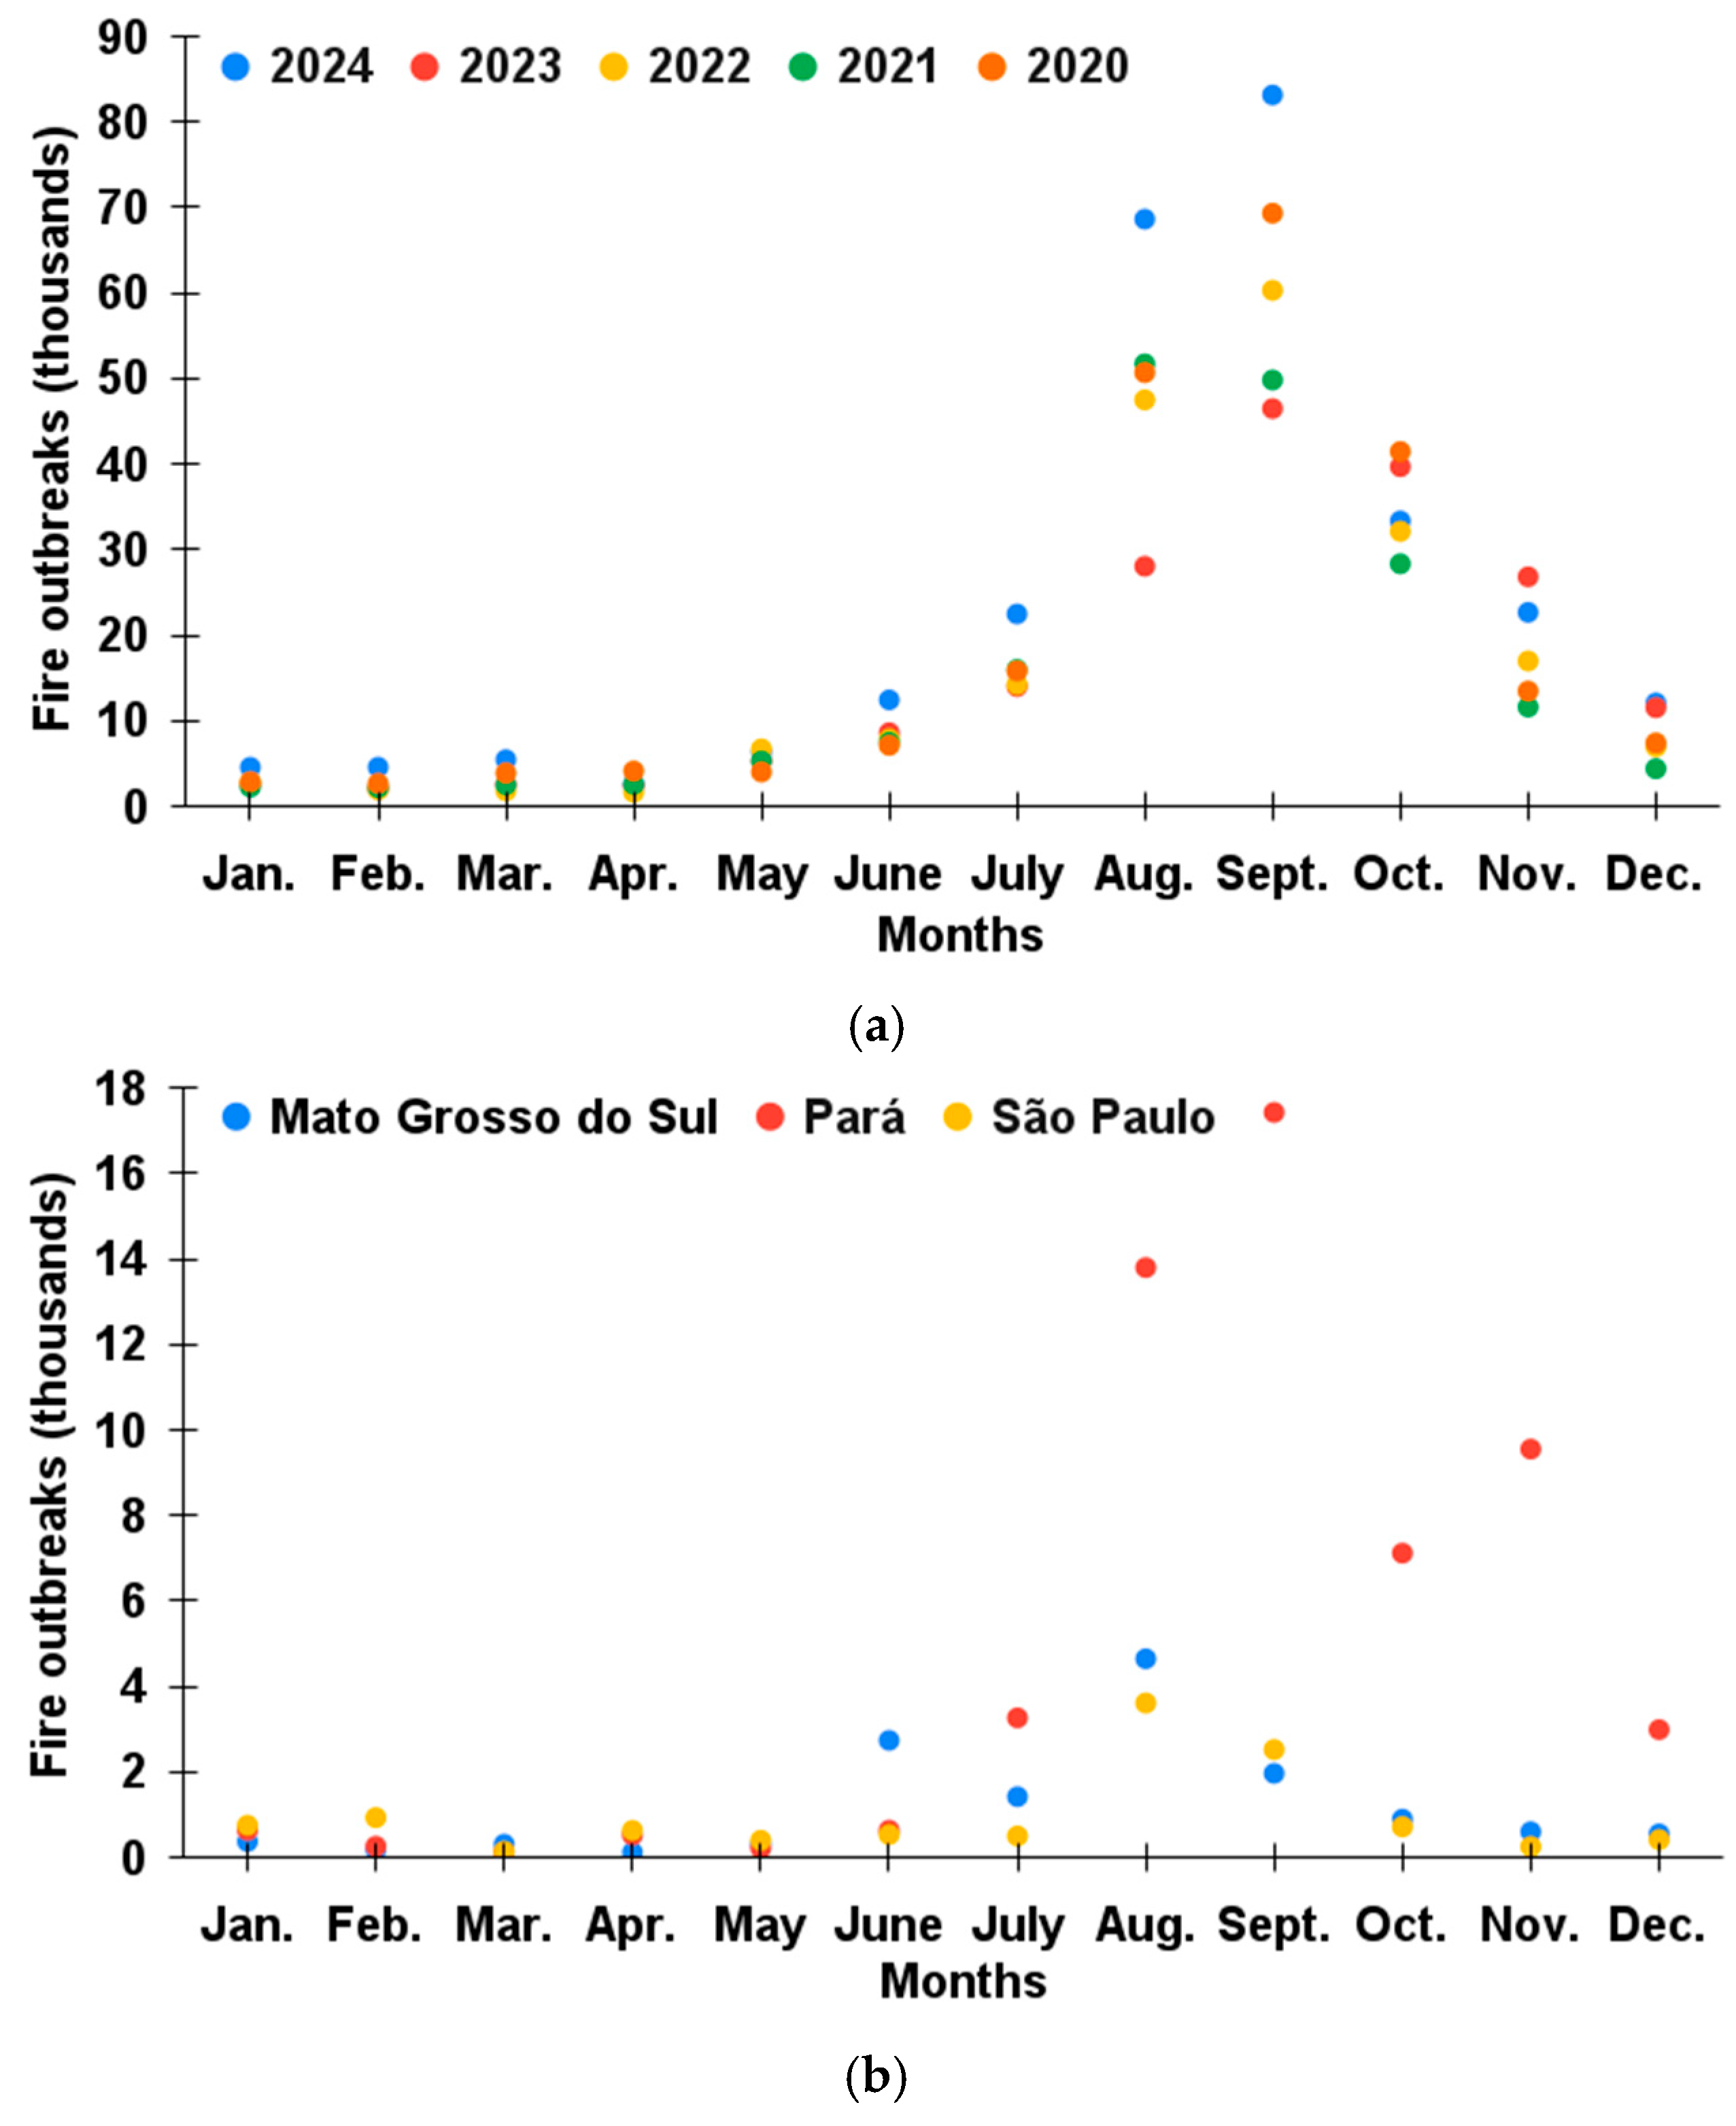
August exhibited the highest concentration of fire hotspots across the states of São Paulo and Mato Grosso do Sul [13]. Although August did not represent the most severe period for the state of Pará, persistently elevated and concerning values were still observed [13]. These findings underscore the necessity for advanced scientific remote sensing instrumentation to facilitate comprehensive atmospheric monitoring, as evidenced in Figure 11a,b.

4.2.4. HYSPLIT Analysis

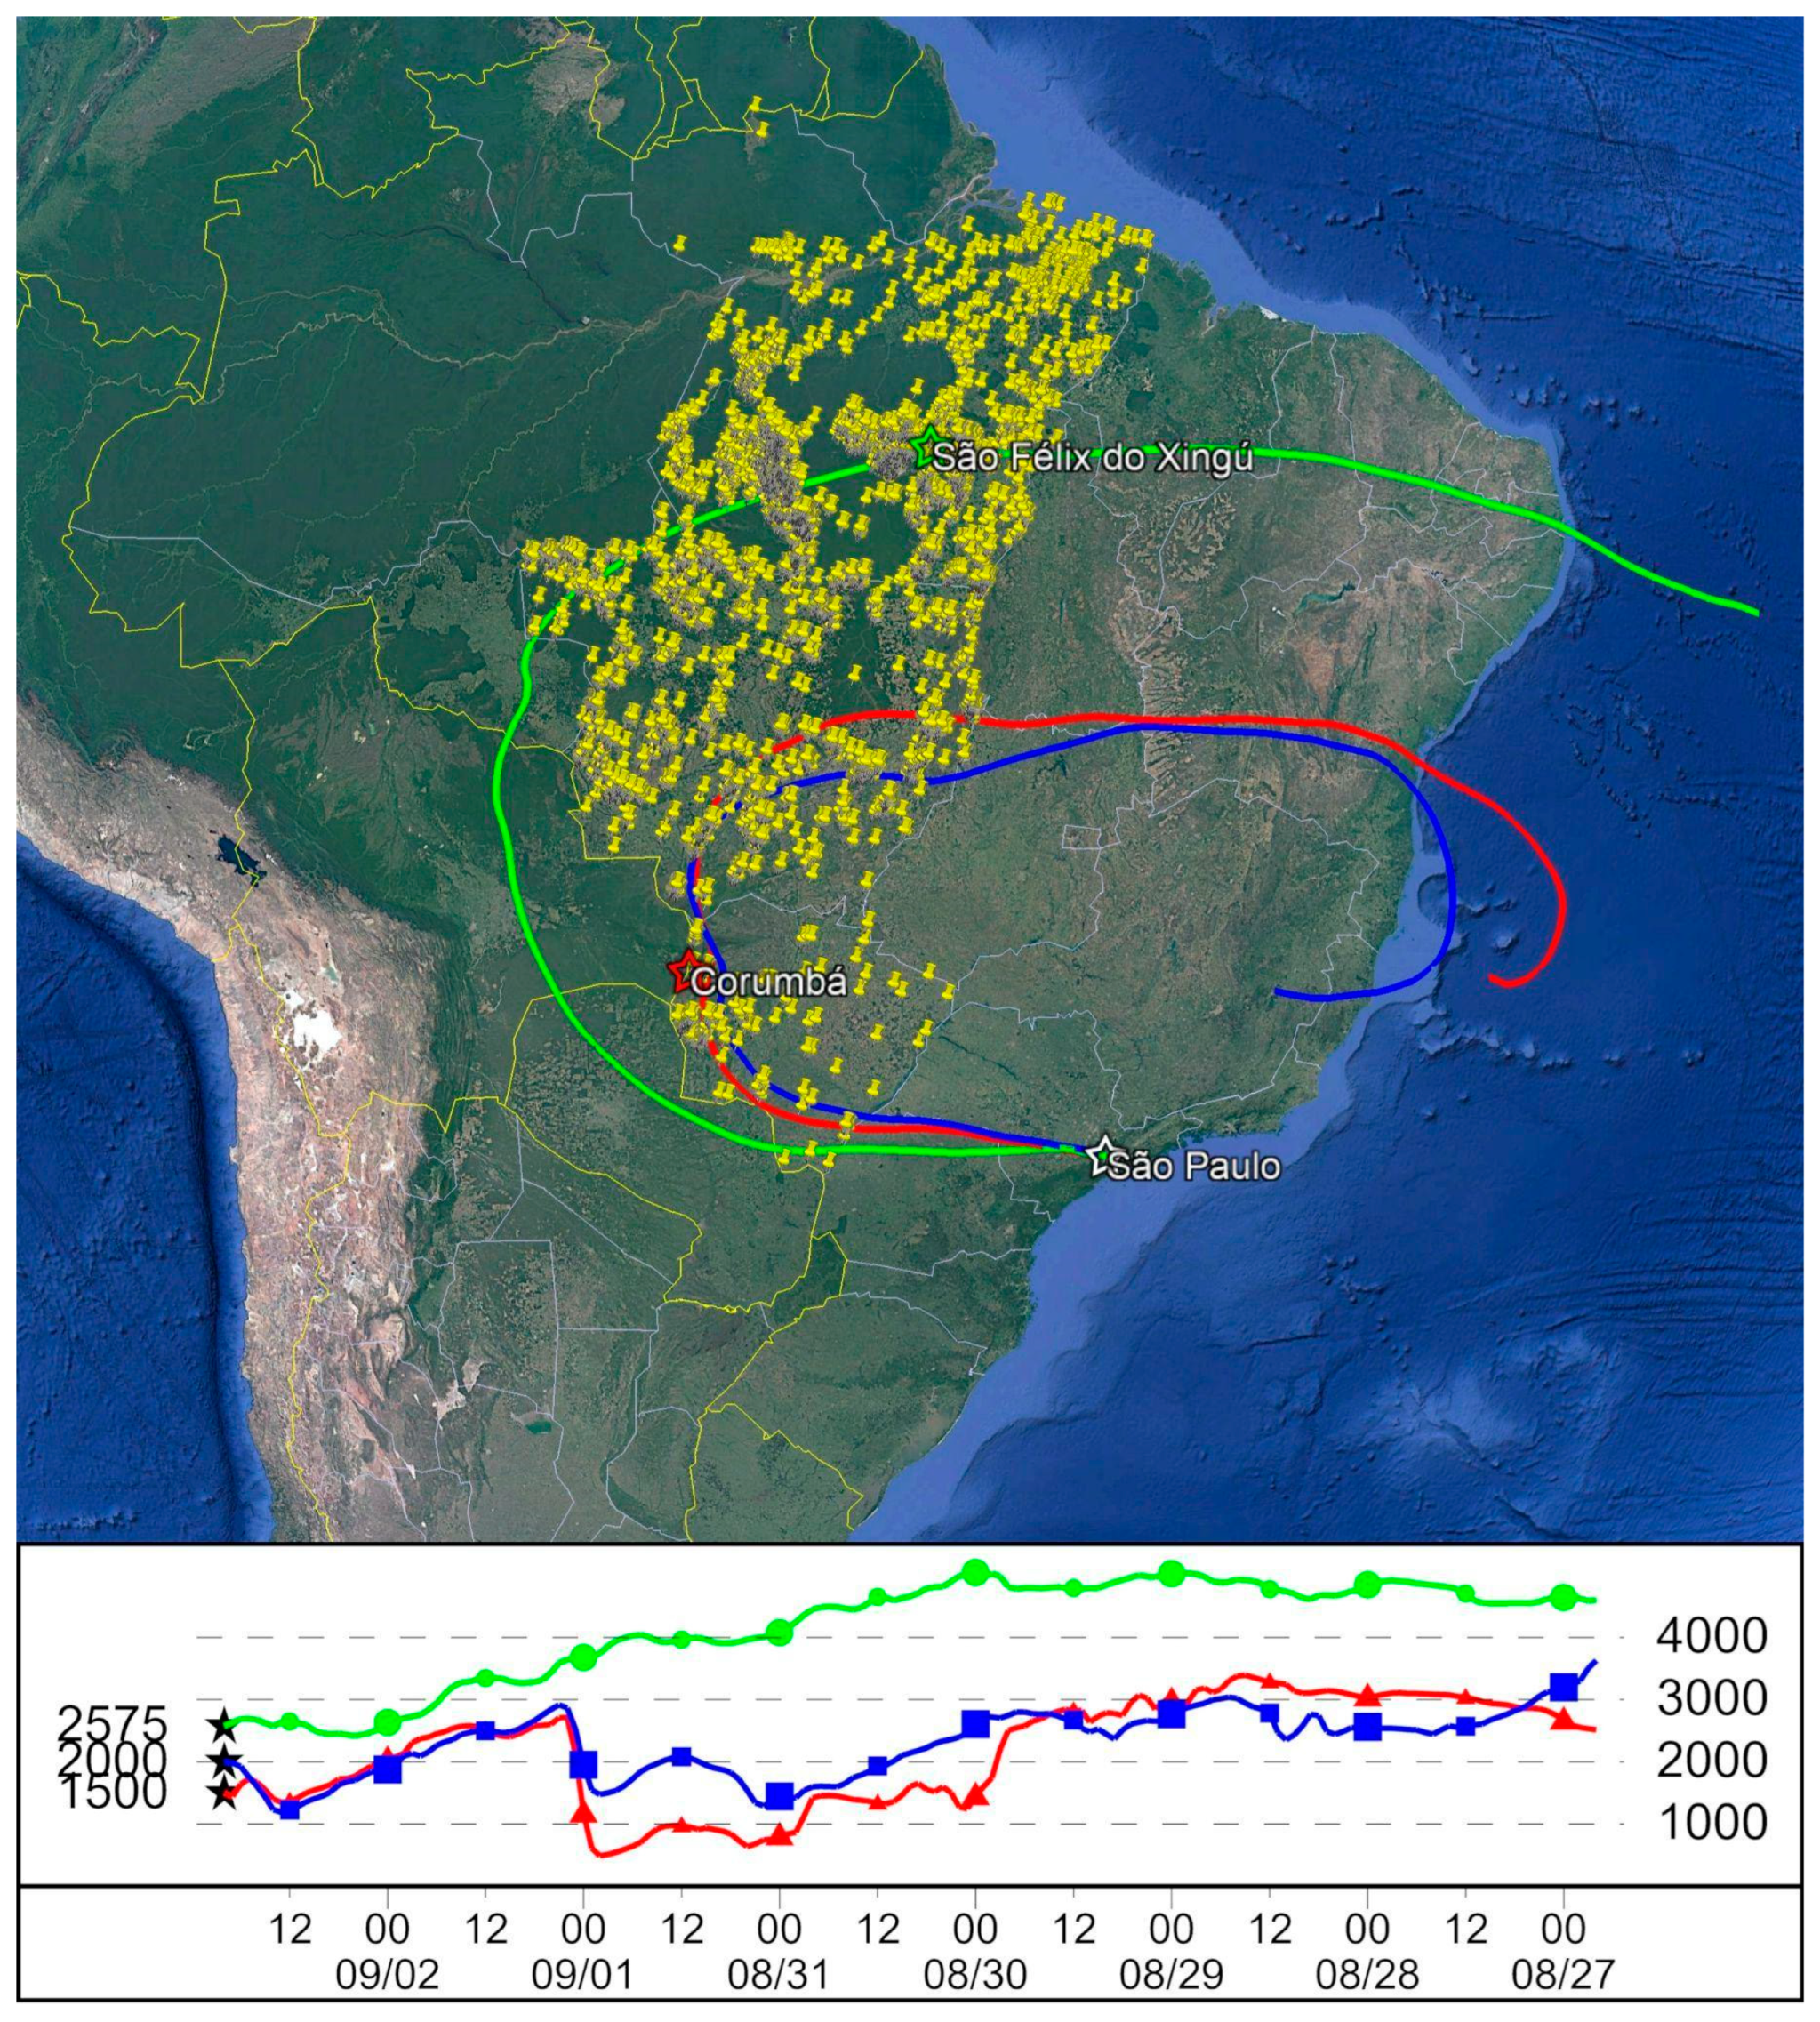
To determine the origin of the aerosol plume detected by the SPU Lidar Station, a trajectory analysis was conducted using the HYSPLIT model. Figure 12 presents the simulated transport pathway of the plume arriving over São Paulo on 2 September 2024 at 20:00 UTC. The trajectory altitudes were constrained using RCS532 measurements obtained from the SPU Lidar Station (Figure 3a,b), with a 120 h backward simulation period. The modeling results indicate that the air masses traversed the states of Pará and Mato Grosso do Sul before reaching São Paulo. Cross-referencing with fire hotspot data from the BDQueimadas platform for the period 27 August to 2 September 2024 demonstrates that the transport pathways intersected regions near the cities of Corumbá and São Félix do Xingu, known emission sources during the study period.

4.2.5. EarthCARE Data for Corumbá and São Félix do Xingu

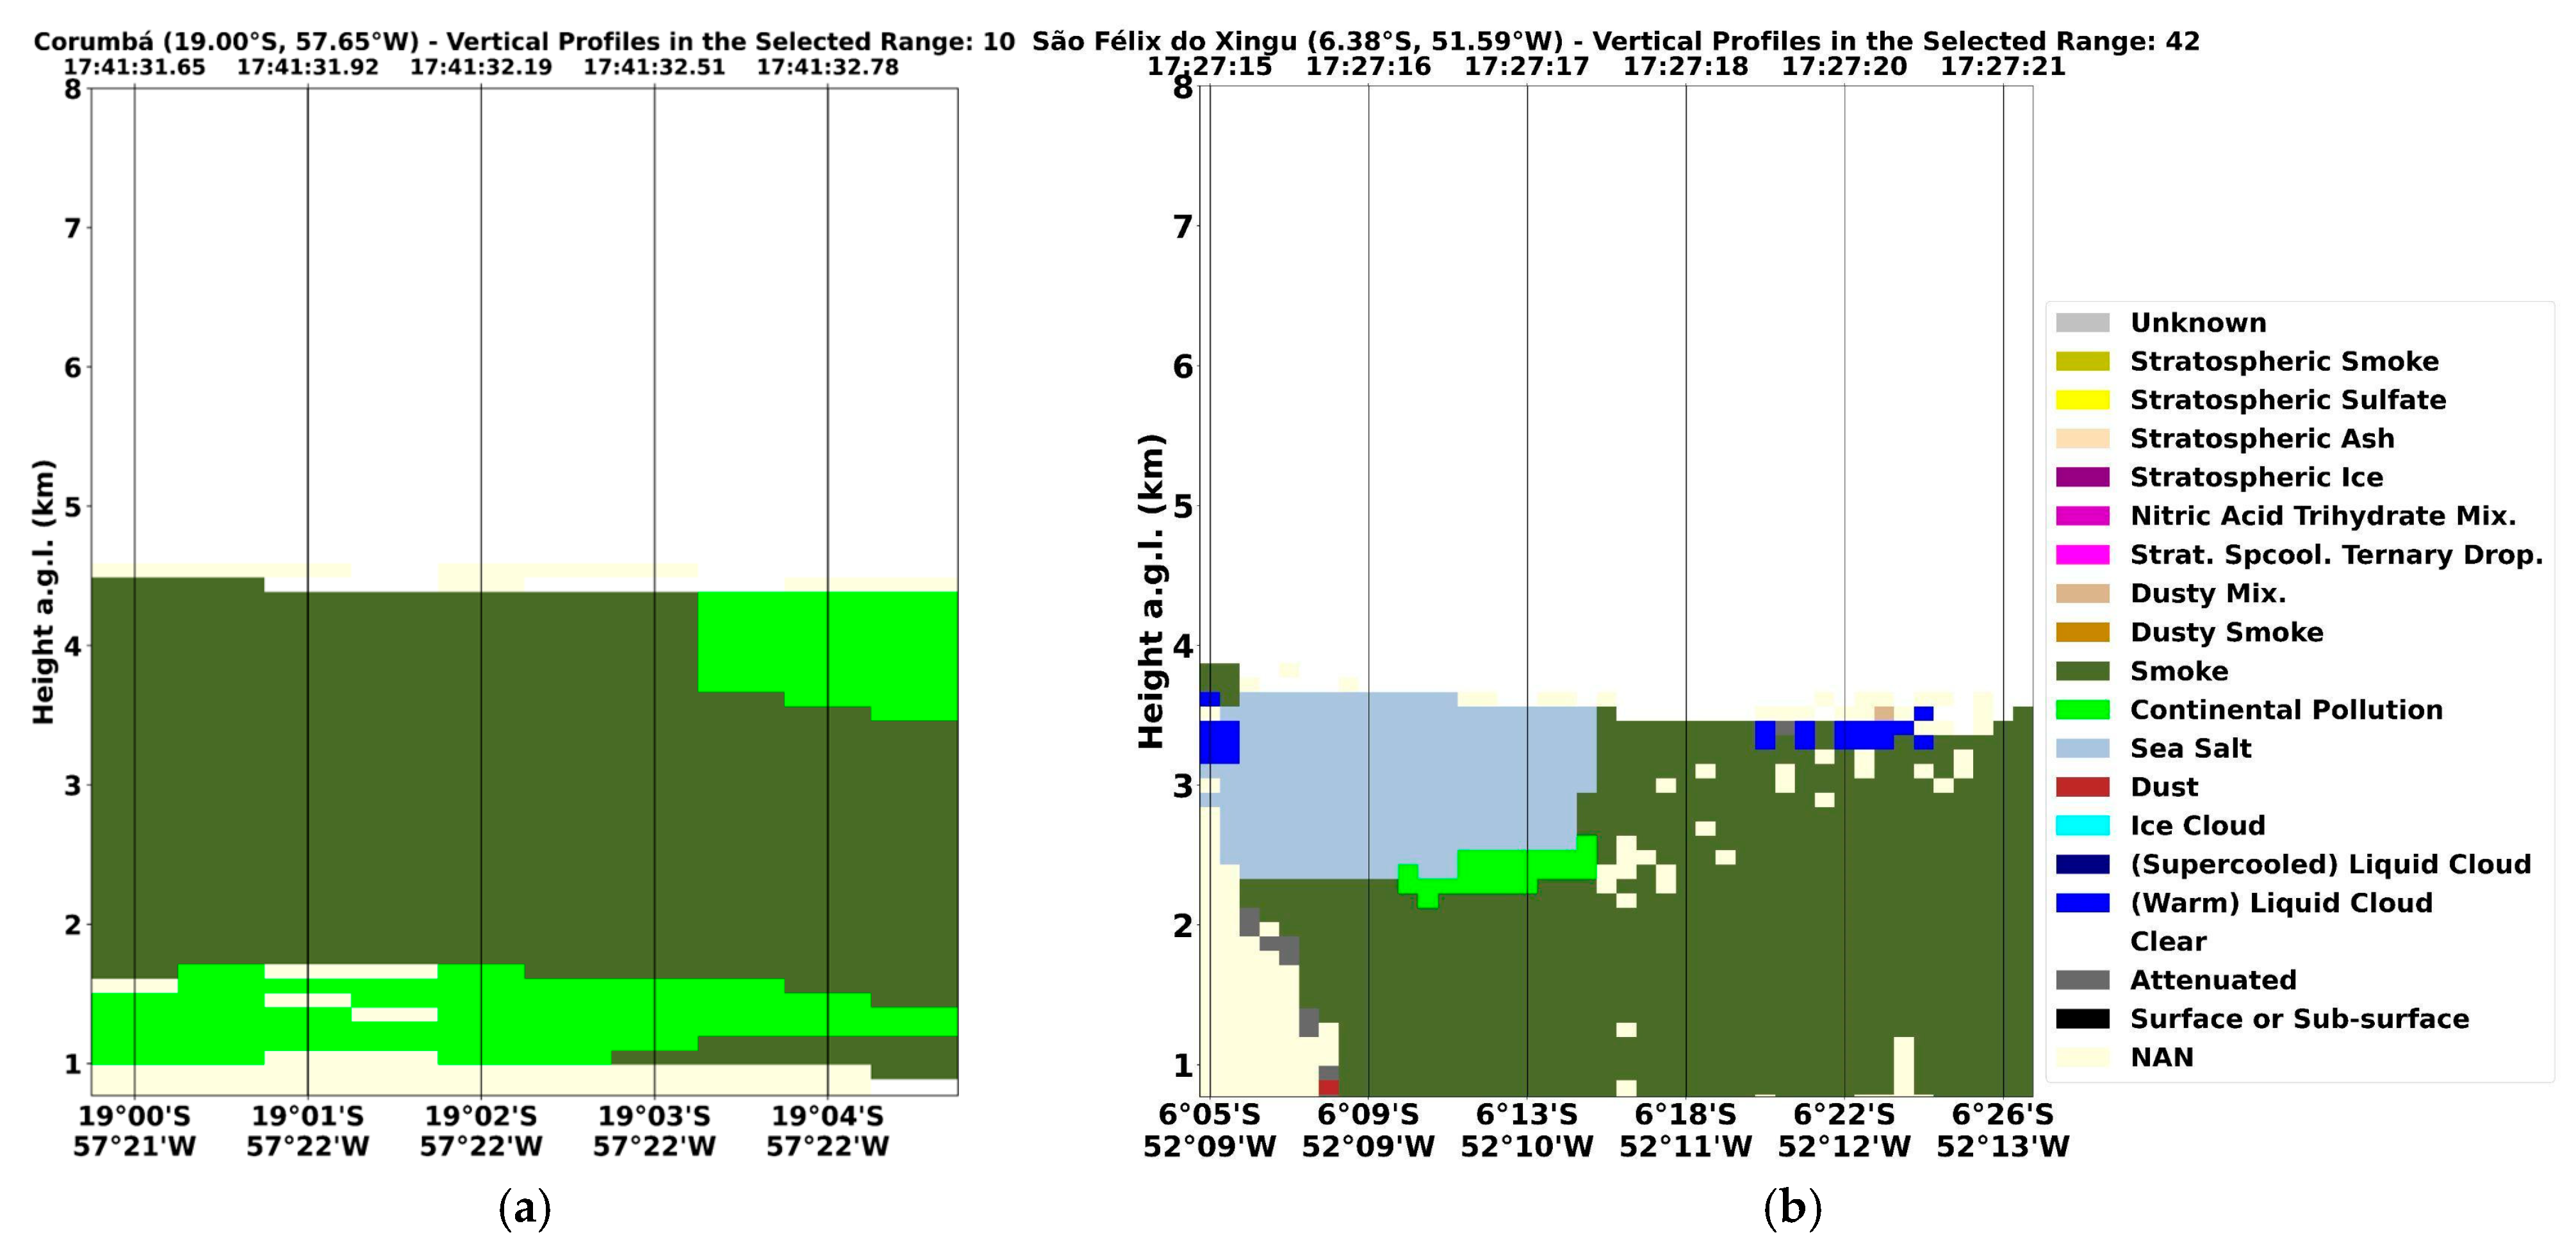
Based on the aforementioned selected regions, three distinct overpasses of EarthCARE were identified. The overpasses occurred on 27 August, 29 August, and 2 September 2024, with the satellite passing within a 100 km radius of Corumbá, São Félix do Xingu, and São Paulo, respectively. The precise spatiotemporal coverage of these overpasses is detailed in Table 1, and the ATL_TC_2A product for the region of Corumbá is illustrated in Figure 13a; this is the same in Figure 13b for São Félix do Xingu.
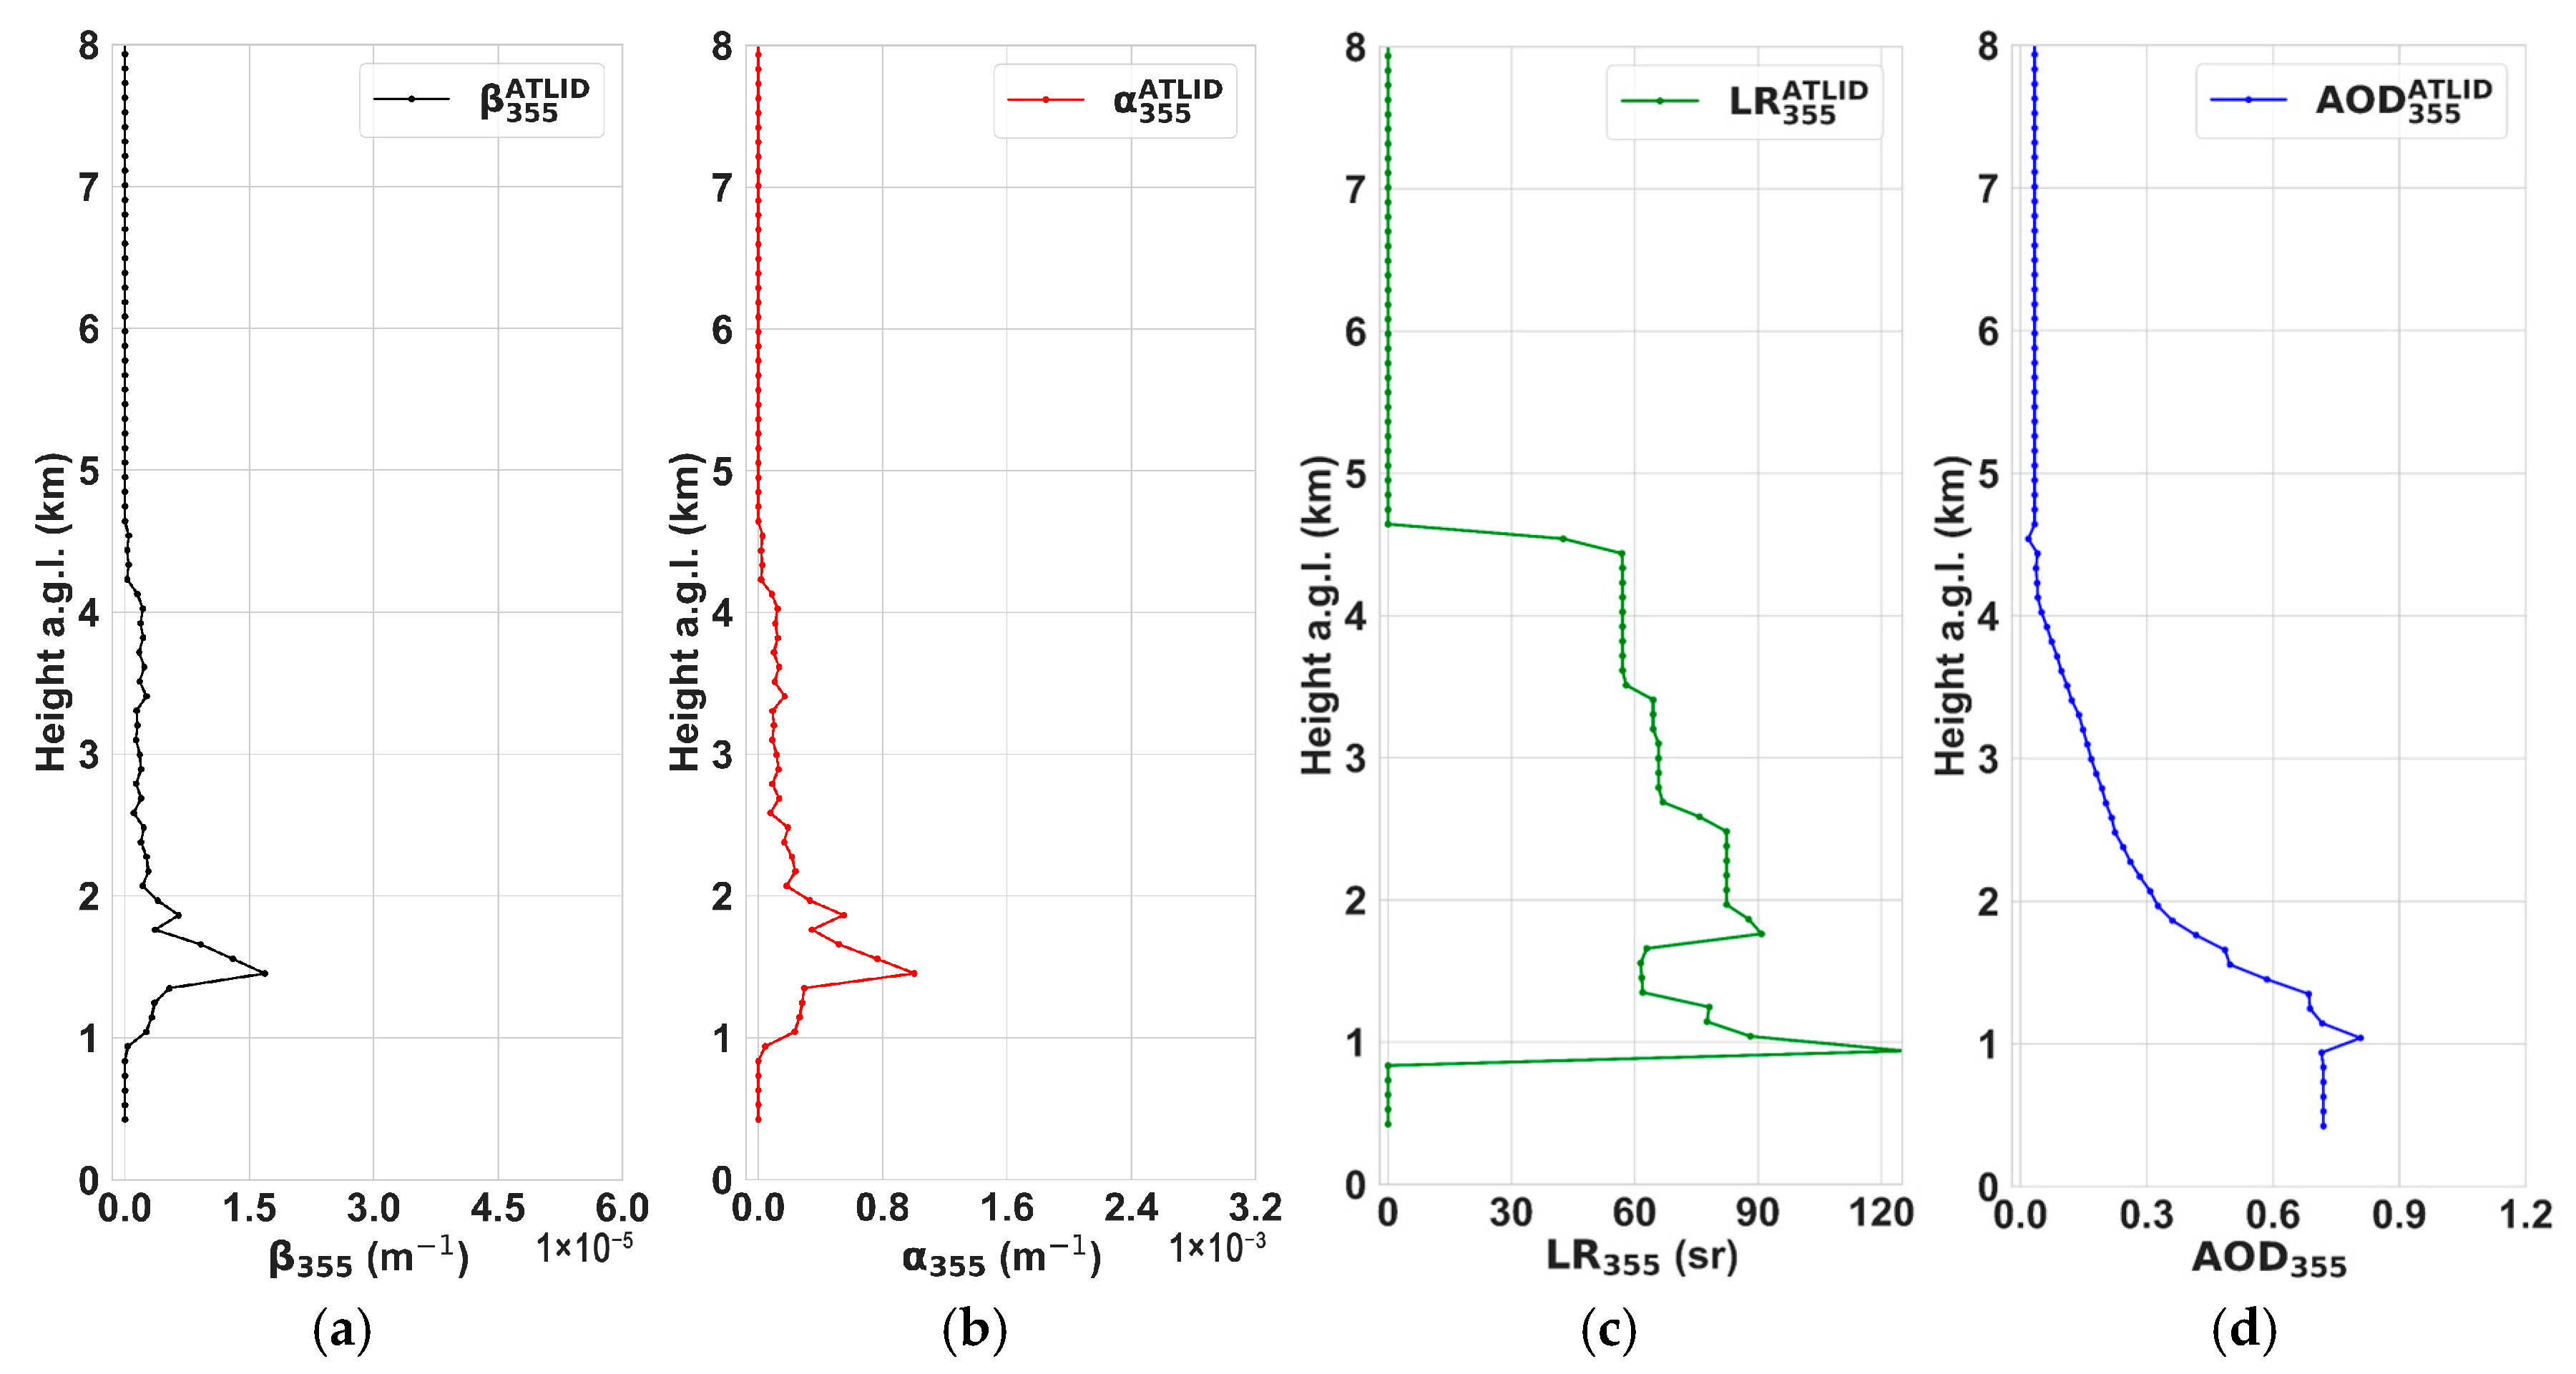
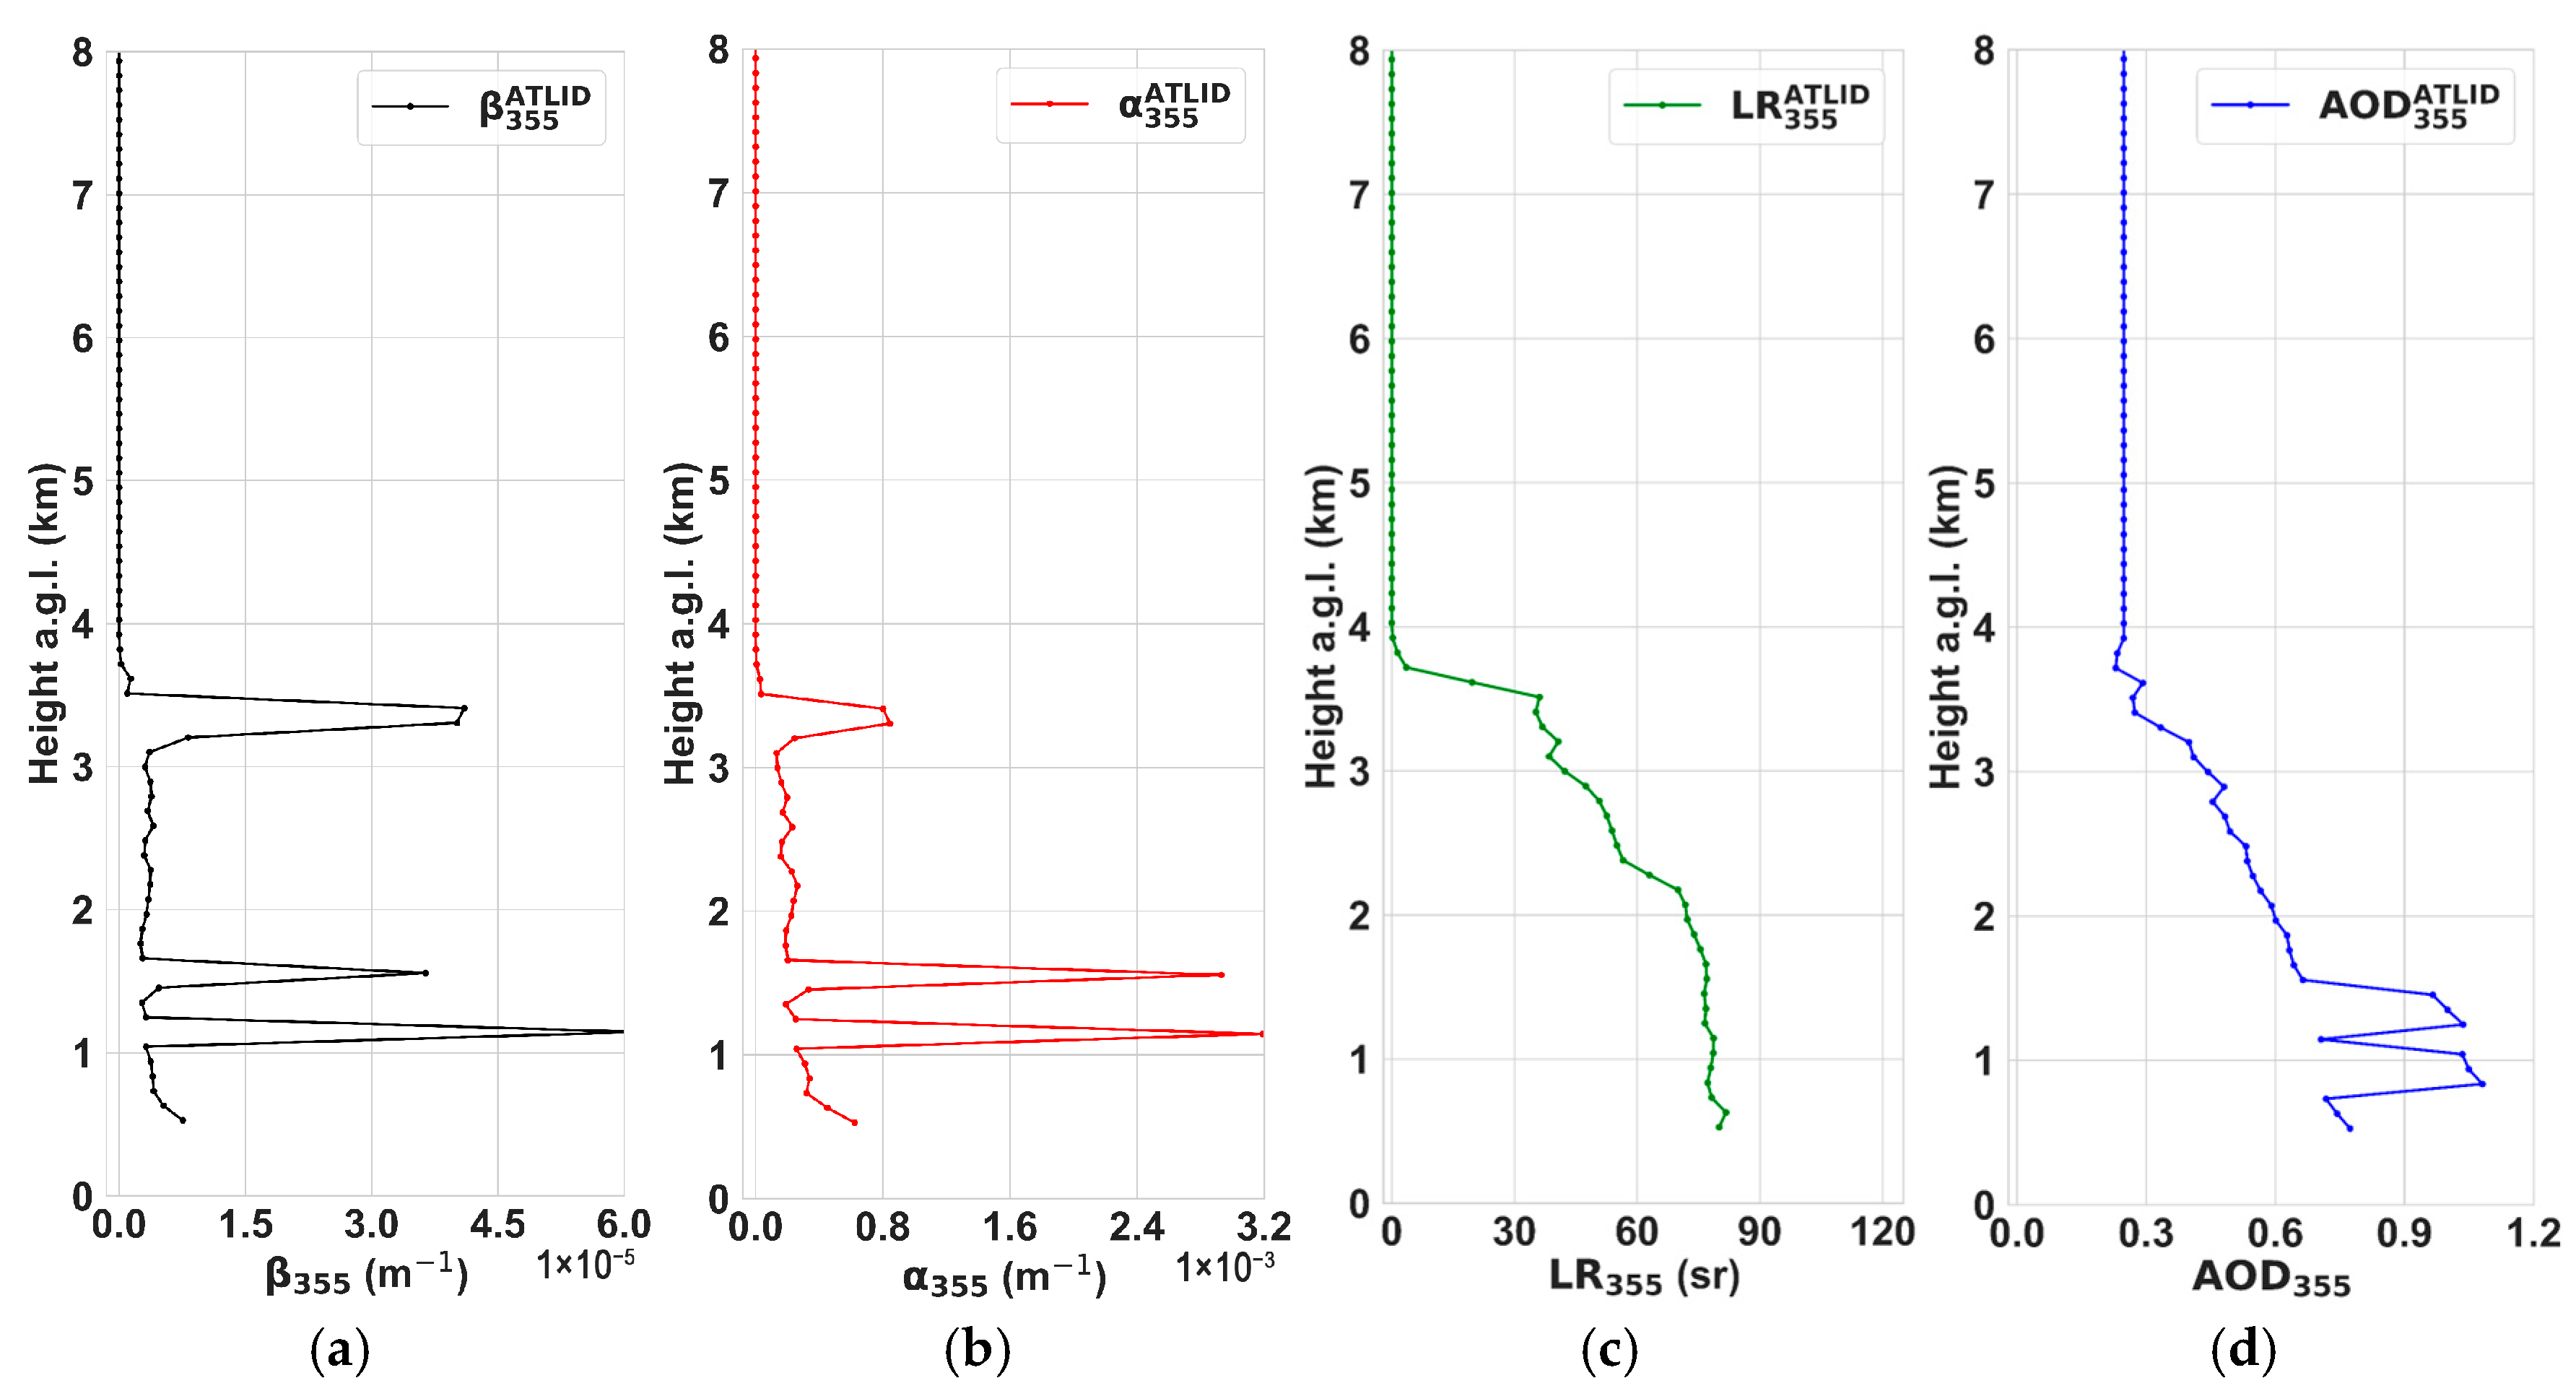
Figure 13a,b show vertically distributed aerosol layers classified as smoke, predominantly observed between 1 and 5 km altitude in both regions. This finding is consistent with HYSPLIT trajectory simulations (Figure 12), which show air mass transport over the selected areas from 27 August to 2 September 2024. The spatiotemporal agreement between the ATLID aerosol classification and modeled air mass trajectories therefore supports a biomass burning origin for these smoke plumes. The overpasses over the selected regions are presented in Figure 14a (Corumbá) and Figure 14b (São Félix do Xingu), and the mean vertical aerosol profiles are shown in Figure 15a–d (Corumbá) and Figure 16a–d (São Félix do Xingu).
Figure 15a–d and Figure 16a–d show the vertical distribution of aerosols, with distinct concentration peaks between approximately 800 m and 1.6 km altitude. This observation aligns with the findings of [46], who reported that biomass burning plumes in the Amazon region typically extend to altitudes of up to 3 km, accompanied by a mean aerosol optical depth (AOD) of ~0.5. Furthermore, AOD values in the range of 0.5–1.0 are recognized as characteristic of biomass burning conditions in the Pantanal region [2]. The ATLID-retrieved AOD values (product ATL_EBD_2A) exhibited higher magnitudes (0.7–1.1), consistent with the elevated fire activity observed in Pará and Mato Grosso do Sul during August—a period historically associated with intensified biomass burning. This enhancement in AOD correlates with a marked increase in fire hotspot counts across these regions. Finally, the aerosol profiles are consistent with the characteristics of the plumes detected by the SPU Lidar Station, indicating LR values ranging from 60 to 100 sr, typical of smoke particles [47,48,49].

5. Conclusions

The BDQueimadas platform data reveal that 2024 set unprecedented records for biomass burning events, with August and September exhibiting peak activity in Brazil’s Pantanal and Amazon regions. Despite being hotspots for wildfire occurrences, the North and Central-West regions of Brazil currently lack adequate atmospheric monitoring infrastructure. This study highlights the important role of ATLID data in addressing this observational gap, demonstrating its effectiveness in monitoring atmospheric conditions associated with biomass burning events. Firstly, ATLID and SPU Lidar Station data were compared for clear sky days and low cloud days. The results show that in the absence of low clouds, the data present considerable agreement (R2~0.98), while on low cloud days, this agreement no longer obtains the same relevance (R2~0.68). Then, measurements taken by the SPU Lidar Station on 2 September 2024 indicated the presence of aerosol layers and atypical peaks in the backscatter and extinction vertical profiles. After the synergistic use of the HYSPLIT model and BDQueimadas data, it was found that air currents had passed through Corumbá and São Félix do Xingu, reaching São Paulo on 2 September 2024. The classification of the aerosol plume over São Paulo was determined using the Ångström Matrix and AOD values for 1 and 2 September 2024, indicating the presence of black carbon aerosols.
To confirm this information, the EarthCARE’s ATLID products (backscatter, extinction, AOD, and LR vertical profiles) were evaluated at São Félix do Xingu and Corumbá, which indicated typical values for biomass burning.
Therefore, based on data analysis from BDQueimadas, HYSPLIT, and SPU Lidar Station measurements, we can conclude that ATLID performs well in detecting aerosol plumes/layers, enabling studies about the vertical profile of aerosols, as well as their characterization, in regions with a lack of ground-based LIDAR system data. The validation process of EarthCARE data is ongoing, and the use of its products for monitoring and studying aerosol plumes in under-resourced regions proves helpful.
The results presented herein demonstrate that satellite-based atmospheric monitoring, despite its inherent limitations, offers the advantage of providing measurements in locations impractical for ground-based systems over continuous periods, ideal for specific studies.

Author Contributions

Conceptualization, G.M.d.S., M.F.R. and G.d.A.M.; methodology, G.M.d.S., M.F.R., G.d.A.M., A.C. and F.J.d.S.L.; software, A.C., F.J.d.S.L. and L.D.d.M.; validation, G.M.d.S., A.C. and F.J.d.S.L.; formal analysis, G.M.d.S., A.C. and G.d.A.M.; investigation, G.M.d.S., A.C. and G.d.A.M.; resources, E.L.; data curation, G.M.d.S. and A.C.; writing—original draft preparation, G.M.d.S., G.d.A.M., A.C., F.J.d.S.L. and M.F.R.; writing—review and editing, G.M.d.S., G.d.A.M., A.C., F.J.d.S.L., M.F.R., G.S., L.D.d.M. and L.S.P.; supervision, E.L.; project administration, E.L.; funding acquisition, E.L. All authors have read and agreed to the published version of the manuscript.

Funding

This research was funded by the National Council for Scientific and Technological Development (CNPq) (Project: 406775/2023-0 and CAIPORA Project (444761/2023-3)).

Institutional Review Board Statement

Not applicable.

Informed Consent Statement

Informed consent was obtained from all subjects involved in the study.

Data Availability Statement

The data presented in this study are available on request from the corresponding author. The data are not publicly available due to privacy and ethical constraints.

Acknowledgments

The authors are thankful to the European Space Agency and the EarthCARE Online Dissemination Service, the team of the NASA/AERONET sun photometers network, and the PI of the São Paulo station (Paulo Artaxo) at the NOAA Air Resources Laboratory for providing the HYSPLIT model. The authors are thankful to the Brazilian National Institute for Space Research (INPE) for providing the data about the wildfires. The authors also acknowledge the following Brazilian Agencies: the National Nuclear Energy Commission (CNEN) (Project: 01342.006470/2023-73), the National Council for Scientific and Technological Development (CNPq) (Project: 144123/2024-0), and the Coordination for the Improvement of Higher Education Personnel (CAPES) (Projects: 88887.859244/2023-00, 88887.158285/2025-00).

Conflicts of Interest

The authors declare no conflicts of interest.

References

  1. Pivello, V.R. The Use of Fire in the Cerrado and Amazonian Rainforests of Brazil: Past and Present. Fire Ecol. 2011, 7, 24–39. [Google Scholar] [CrossRef]
  2. Rosário, N.É.D.; Sena, E.T.; Yamasoe, M.A. South American 2020 Regional Smoke Plume: Intercomparison with Previous Years, Impact on Solar Radiation, and the Role of Pantanal Biomass Burning Season. Atmos. Chem. Phys. 2022, 22, 15021–15033. [Google Scholar] [CrossRef]
  3. Moreira, D.S.; Longo, K.M.; Freitas, S.R.; Yamasoe, M.A.; Mercado, L.M.; Rosário, N.E.; Gloor, E.; Viana, R.S.M.; Miller, J.B.; Gatti, L.V.; et al. Modeling the radiative effects of biomass burning aerosols on carbon fluxes in the Amazon region. Atmos. Chem. Phys. 2017, 17, 14785–14810. [Google Scholar] [CrossRef]
  4. Thornhill, G.D.; Ryder, C.L.; Highwood, E.J.; Shaffrey, L.C.; Johnson, B.T. The effect of South American biomass burning aerosol emissions on the regional climate. Atmos. Chem. Phys. 2018, 18, 5321–5342. [Google Scholar] [CrossRef]
  5. World Health Organization; United Nations Children’s Fund (UNICEF); United Nations Development Programme; United Nations Environment Programme. Compendium of WHO and Other UN Guidance in Health and Environment, 2024 Update; World Health Organization: Geneva, Switzerland, 2024. Available online: https://iris.who.int/handle/10665/378095 (accessed on 20 August 2025).
  6. Correia, A.L.; Sena, E.T.; Silva Dias, M.A.F.; Koren, I. Preconditioning, aerosols, and radiation control the temperature of glaciation in Amazonian clouds. Commun. Earth Environ. 2021, 2, 168. [Google Scholar] [CrossRef]
  7. Feng, X.; Mickley, L.J.; Bell, M.L.; Liu, T.; Fisher, J.A.; Val Martin, M. Improved estimates of smoke exposure during Australia fire seasons: Importance of quantifying plume injection heights. Atmos. Chem. Phys. 2024, 24, 2985–3007. [Google Scholar] [CrossRef]
  8. Val Martin, M.; Kahn, R.A.; Tosca, M.G. A Global Analysis of Wildfire Smoke Injection Heights Derived from Space-Based Multi-Angle Imaging. Remote Sens. 2018, 10, 1609. [Google Scholar] [CrossRef]
  9. Stull, R.B. Practical Meteorology: An Algebra-Based Survey of Atmospheric Science; University of British Columbia: Vancouver, BC, Canada, 2017. Available online: https://www.eoas.ubc.ca/books/Practical_Meteorology/ (accessed on 7 July 2025).
  10. Rudke, A.P.; Martins, L.D.; Martins, J.A.; Mantoani, M.C.; Andrade, M.F.; Kumar, P.; Alves, R.A.; Pedruzzi, R.; Thompson, T.; Sobrinho, O.M.; et al. Where there is smoke, there is fire: Long- and mid-range biomass burning role on São Paulo’s state air quality. Environ. Pollut. 2025, 384, 126993. [Google Scholar] [CrossRef]
  11. Rogers, H.M.; Ditto, J.C.; Gentner, D.R. Evidence for impacts on surface-level air quality in the northeastern US from long-distance transport of smoke from North American fires during the Long Island Sound Tropospheric Ozone Study (LISTOS) 2018. Atmos. Chem. Phys. 2020, 20, 671–682. [Google Scholar] [CrossRef]
  12. Moreira, G.A.; Carbone, S.; Guerrero-Rascado, J.L.; Andrade, I.S.; Cacheffo, A.; Vélez-Pereira, A.M.; Zamora-Ledezma, E.; Thielen, D.; Gomes, A.A.; Duarte, E.S.F.; et al. Evidence of the Consequences of the Prolonged Fire Season on Air Quality and Public Health from 2024 São Paulo (Brazil) Data. Sci. Rep. 2025, 15, 28337. [Google Scholar] [CrossRef]
  13. Instituto Nacional de Pesquisas Espaciais (INPE). Programa Queimadas: Monitoramento de Focos Ativos por Satélite. BDQueimadas. São José dos Campos, São Paulo, Brazil. Available online: https://terrabrasilis.dpi.inpe.br/queimadas/bdqueimadas/ (accessed on 4 March 2025). (In Portuguese).
  14. Andrade, M.F.; Kumar, P.; Freitas, E.D.; Ynoue, R.Y.; Martins, J.; Martins, L.D.; Nogueira, T.; Perez-Martinez, P.; Miranda, R.M.; Albuquerque, T.; et al. Air quality in the megacity of São Paulo: Evolution over the last 30 years and future perspectives. Atmos. Environ. 2017, 159, 66–82. [Google Scholar] [CrossRef]
  15. Pereira, G.M.; Kamigauti, L.Y.; Pereira, R.F.; Santos, D.M.; Santos, T.S.; Martins, J.V.; Alves, C.; Gonçalves, C.; Rienda, I.C.; Kováts, N.; et al. Source apportionment and ecotoxicity of PM2.5 pollution events in a major Southern Hemisphere megacity: Influence of a biofuel-impacted fleet and biomass burning. Atmos. Chem. Phys. 2025, 25, 4587–4616. [Google Scholar] [CrossRef]
  16. Adetona, O.; Reinhardt, T.E.; Domitrovich, J.; Broyles, G.; Adetona, A.M.; Kleinman, M.T.; Ottmar, R.D.; Naeher, L.P. Review of the health effects of wildland fire smoke on wildland firefighters and the public. Inhal. Toxicol. 2016, 28, 95–139. [Google Scholar] [CrossRef]
  17. DeFlorio-Barker, S.; Crooks, J.; Reyes, J.; Rappold, A.G. Cardiopulmonary effects of fine particulate matter exposure among older adults, during wildfire and non-wildfire periods, in the United States, 2008–2010. Environ. Health Perspect. 2019, 127, 37006. [Google Scholar] [CrossRef]
  18. Moreira, G.A.; Andrade, I.S.; Cacheffo, A.; Lopes, F.J.S.; Yoshida, A.C.; Gomes, A.A.; da Silva, J.J.; Landulfo, E. Influence of a biomass-burning event in PM2.5 concentration and air quality: A case study in the metropolitan area of São Paulo. Sensors 2021, 21, 425. [Google Scholar] [CrossRef]
  19. Brazilian Institute of Geography and Statistics (IBGE). Cidades e Estados: São Paulo, São Félix do Xingu e Corumbá—Panorama do Censo 2022. Available online: https://www.ibge.gov.br/pt/inicio.html (accessed on 4 March 2025).
  20. Alvares, C.A.; Stape, J.L.; Sentelhas, P.C.; de Moraes Gonçalves, J.L.; Sparovek, G. Köppen’s Climate Classification Map for Brazil. Meteorol. Z. 2013, 22, 711–728. [Google Scholar] [CrossRef]
  21. Sant’Anna Neto, J.L.; Galvani, E.; Vieira, B.C. Climates of Brazil: Past and Present. In Landscapes and Landforms of Brazil; Vieira, B., Salgado, A., Santos, L., Eds.; World Geomorphological Landscapes; Springer: Dordrecht, The Netherlands, 2015; pp. 29–38. [Google Scholar] [CrossRef]
  22. Antuña, J.C.; Landulfo, E.; Estevan, R.; Barja, B.; Robock, A.; Wolfram, E.; Ristori, P.; Clemesha, B.; Zaratti, F.; Forno, R.; et al. LALINET: The First Latin American–Born Regional Atmospheric Observational Network. Bull. Am. Meteor. Soc. 2017, 98, 1255–1275. [Google Scholar] [CrossRef]
  23. Wehr, T.; Kubota, T.; Tzeremes, G.; Wallace, K.; Nakatsuka, H.; Ohno, Y.; Koopman, R.; Rusli, S.; Kikuchi, M.; Eisinger, M.; et al. The EarthCARE mission—Science and system overview. Atmos. Meas. Tech. 2023, 16, 3581–3608. [Google Scholar] [CrossRef]
  24. Donovan, D.P.; van Zadelhoff, G.-J.; Wang, P. The EarthCARE lidar cloud and aerosol profile processor (A-PRO): The A-AER, A-EBD, A-TC, and A-ICE products. Atmos. Meas. Tech. 2024, 17, 5301–5340. [Google Scholar] [CrossRef]
  25. Nishizawa, T.; Kudo, R.; Oikawa, E.; Higurashi, A.; Jin, Y.; Sugimoto, N.; Sato, K.; Okamoto, H. Algorithm to Retrieve Aerosol Optical Properties Using Lidar Measurements on Board the EarthCARE Satellite. Atmos. Meas. Tech. Discuss. 2024, 2024, 1–24. [Google Scholar] [CrossRef]
  26. Draxler, R.R.; Hess, G.D. An overview of the HYSPLIT-4 modelling system for trajectories, dispersion, and deposition. Atmos. Meas. Tech. 1998, 47, 295–308. [Google Scholar]
  27. Holben, B.N.; Eck, T.F.; Slutsker, I.; Tanré, D.; Buis, J.P.; Setzer, A.; Vermote, E.; Reagan, J.A.; Kaufman, Y.J.; Nakajima, T.; et al. AERONET—A Federated Instrument Network and Data Archive for Aerosol Characterization. Remote Sens. Environ. 1998, 66, 1–16. [Google Scholar] [CrossRef]
  28. European Space Agency (ESA). EarthCARE Online Dissemination Service—Online Collections. Available online: https://ec-pdgs-dissemination2.eo.esa.int/oads/access/collection (accessed on 10 July 2025).
  29. European Space Agency (ESA). Earth System Orbit Visualization (ESOV) Software User Manual. Available online: https://eop-cfi.esa.int/index.php/applications/esov (accessed on 16 April 2025).
  30. Amiridis, V.; Marinou, E.; Hostetler, C.; Koopman, R.; Cecil, D.; Moisseev, D.; Tackett, J.; Groß, S.; Baars, H.; Redemann, J.; et al. Best Practice Protocol for the validation of Aerosol, Cloud, and Precipitation Profiles (ACPPV) (Version 2). Zenodo 2025. [Google Scholar] [CrossRef]
  31. Eisinger, M.; Marnas, F.; Wallace, K.; Kubota, T.; Tomiyama, N.; Ohno, Y.; Tanaka, T.; Tomita, E.; Wehr, T.; Bernaerts, D. The EarthCARE mission: Science data processing chain overview. Atmos. Meas. Tech. 2024, 17, 839–862. [Google Scholar] [CrossRef]
  32. Weitkamp, C. (Ed.) Lidar: Range-Resolved Optical Remote Sensing of the Atmosphere; Springer Series in Optical Sciences; Springer: New York, NY, USA, 2005; ISBN 978-0-387-40075-4. [Google Scholar] [CrossRef]
  33. Klett, J.D. Lidar inversion with variable backscatter/extinction ratios. Appl. Opt. 1985, 24, 1638–1643. [Google Scholar] [CrossRef]
  34. Fernald, F.G. Analysis of Atmospheric Lidar Observations: Some Comments. Appl. Opt. 1984, 23, 652–653. [Google Scholar] [CrossRef] [PubMed]
  35. Sasano, Y.; Browell, E.V. Light Scattering Characteristics of Various Aerosol Types Derived from Multiple Wavelength Lidar Observations. Appl. Opt. 1989, 28, 1670–1679. [Google Scholar] [CrossRef]
  36. Jesus, E.O. Classificação de Aerossóis na América do Sul Utilizando a Rede de Fotômetros Solares AERONET—Preparação para uma Metodologia de Validação do Satélite EarthCARE—ESA. Available online: https://repositorio.unifesp.br/handle/11600/65371 (accessed on 20 August 2025). (In Portuguese).
  37. Jin, J.; Henzing, B.; Segers, A. How aerosol size matters in aerosol optical depth (AOD) assimilation and the optimization using the Ångström exponent. Atmos. Chem. Phys. 2023, 23, 1641–1660. [Google Scholar] [CrossRef]
  38. Bergstrom, R.W.; Russell, P.B.; Hignett, P. Wavelength dependence of the absorption of black carbon particles: Predictions and results from the TARFOX experiment and implications for the aerosol single scattering albedo. J. Atmos. Sci. 2002, 59, 567–577. [Google Scholar] [CrossRef]
  39. Kim, M.; Kim, S.H.; Kim, W.V.; Lee, Y.G.; Kim, J.; Kafatos, M.C. Assessment of Aerosol optical depth under background and polluted conditions using AERONET and VIIRS datasets. Atmos. Environ. 2021, 245, 117994. [Google Scholar] [CrossRef]
  40. Cazorla, A.; Bahadur, R.; Suski, K.J.; Cahill, J.F.; Chand, D.; Schmid, B.; Ramanathan, V.; Prather, K.A. Relating aerosol absorption due to soot, organic carbon, and dust to emission sources determined from in situ chemical measurements. Atmos. Chem. Phys. 2013, 13, 9337–9350. [Google Scholar] [CrossRef]
  41. Romano, S.; Perrone, M.R.; Pavese, G.; Esposito, F.; Calvello, M. Optical properties of PM2.5 particles: Results from a monitoring campaign in southeastern Italy. Atmos. Environ. 2019, 203, 35–47. [Google Scholar] [CrossRef]
  42. Cappa, C.D.; Kolesar, K.R.; Zhang, X.; Atkinson, D.B.; Pekour, M.S.; Zaveri, R.A.; Zelenyuk, A.; Zhang, Q. Understanding the optical properties of ambient sub- and supermicron particulate matter: Results from the CARES 2010 field study in northern California. Atmos. Chem. Phys. 2016, 16, 6511–6535. [Google Scholar] [CrossRef]
  43. Moosmüller, H.; Chakrabarty, R.K. Technical Note: Simple analytical relationships between Ångström coefficients of aerosol extinction, scattering, absorption, and single scattering albedo. Atmos. Chem. Phys. 2011, 11, 10677–10680. [Google Scholar] [CrossRef]
  44. Morais, F.G.; Franco, M.A.; Palácios, R.; Machado, L.A.T.; Rizzo, L.V.; Barbosa, H.M.J.; Jorge, F.; Schafer, J.S.; Holben, B.N.; Landulfo, E.; et al. Relationship between Land Use and Spatial Variability of Atmospheric Brown Carbon and Black Carbon Aerosols in Amazonia. Atmosphere 2022, 13, 1328. [Google Scholar] [CrossRef]
  45. Mariano, G.L.; Lopes, F.J.S.; Jorge, M.P.P.M.; Landulfo, E. Assessment of biomass burnings activity with the synergy of sunphotometric and LIDAR measurements in São Paulo, Brazil. Atmos. Res. 2010, 98, 486–499. [Google Scholar] [CrossRef]
  46. Gonzalez-Alonso, L.; Val Martin, M.; Kahn, R.A. Biomass-Burning Smoke Heights over the Amazon Observed from Space. Atmos. Chem. Phys. 2019, 19, 1685–1702. [Google Scholar] [CrossRef]
  47. Wandinger, U.; Floutsi, A.A.; Baars, H.; Haarig, M.; Ansmann, A.; Hünerbein, A.; Docter, N.; Donovan, D.; van Zadelhoff, G.-J.; Mason, S.; et al. HETEAC—The Hybrid End-to-End Aerosol Classification Model for EarthCARE. Atmos. Meas. Tech. 2023, 16, 2485–2510. [Google Scholar] [CrossRef]
  48. Nepomuceno Pereira, S.; Preißler, J.; Guerrero-Rascado, J.L.; Silva, A.M.; Wagner, F. Forest Fire Smoke Layers Observed in the Free Troposphere over Portugal with a Multiwavelength Raman Lidar: Optical and Microphysical Properties. Sci. World J. 2014, 2014, 421838. [Google Scholar] [CrossRef] [PubMed]
  49. Irbah, A.; Delanoë, J.; van Zadelhoff, G.-J.; Donovan, D.P.; Kollias, P.; Puigdomènech Treserras, B.; Mason, S.; Hogan, R.J.; Tatarevic, A. The Classification of Atmospheric Hydrometeors and Aerosols from the EarthCARE Radar and Lidar: The A-TC, C-TC, and AC-TC Products. Atmos. Meas. Tech. 2023, 16, 2795–2820. [Google Scholar] [CrossRef]
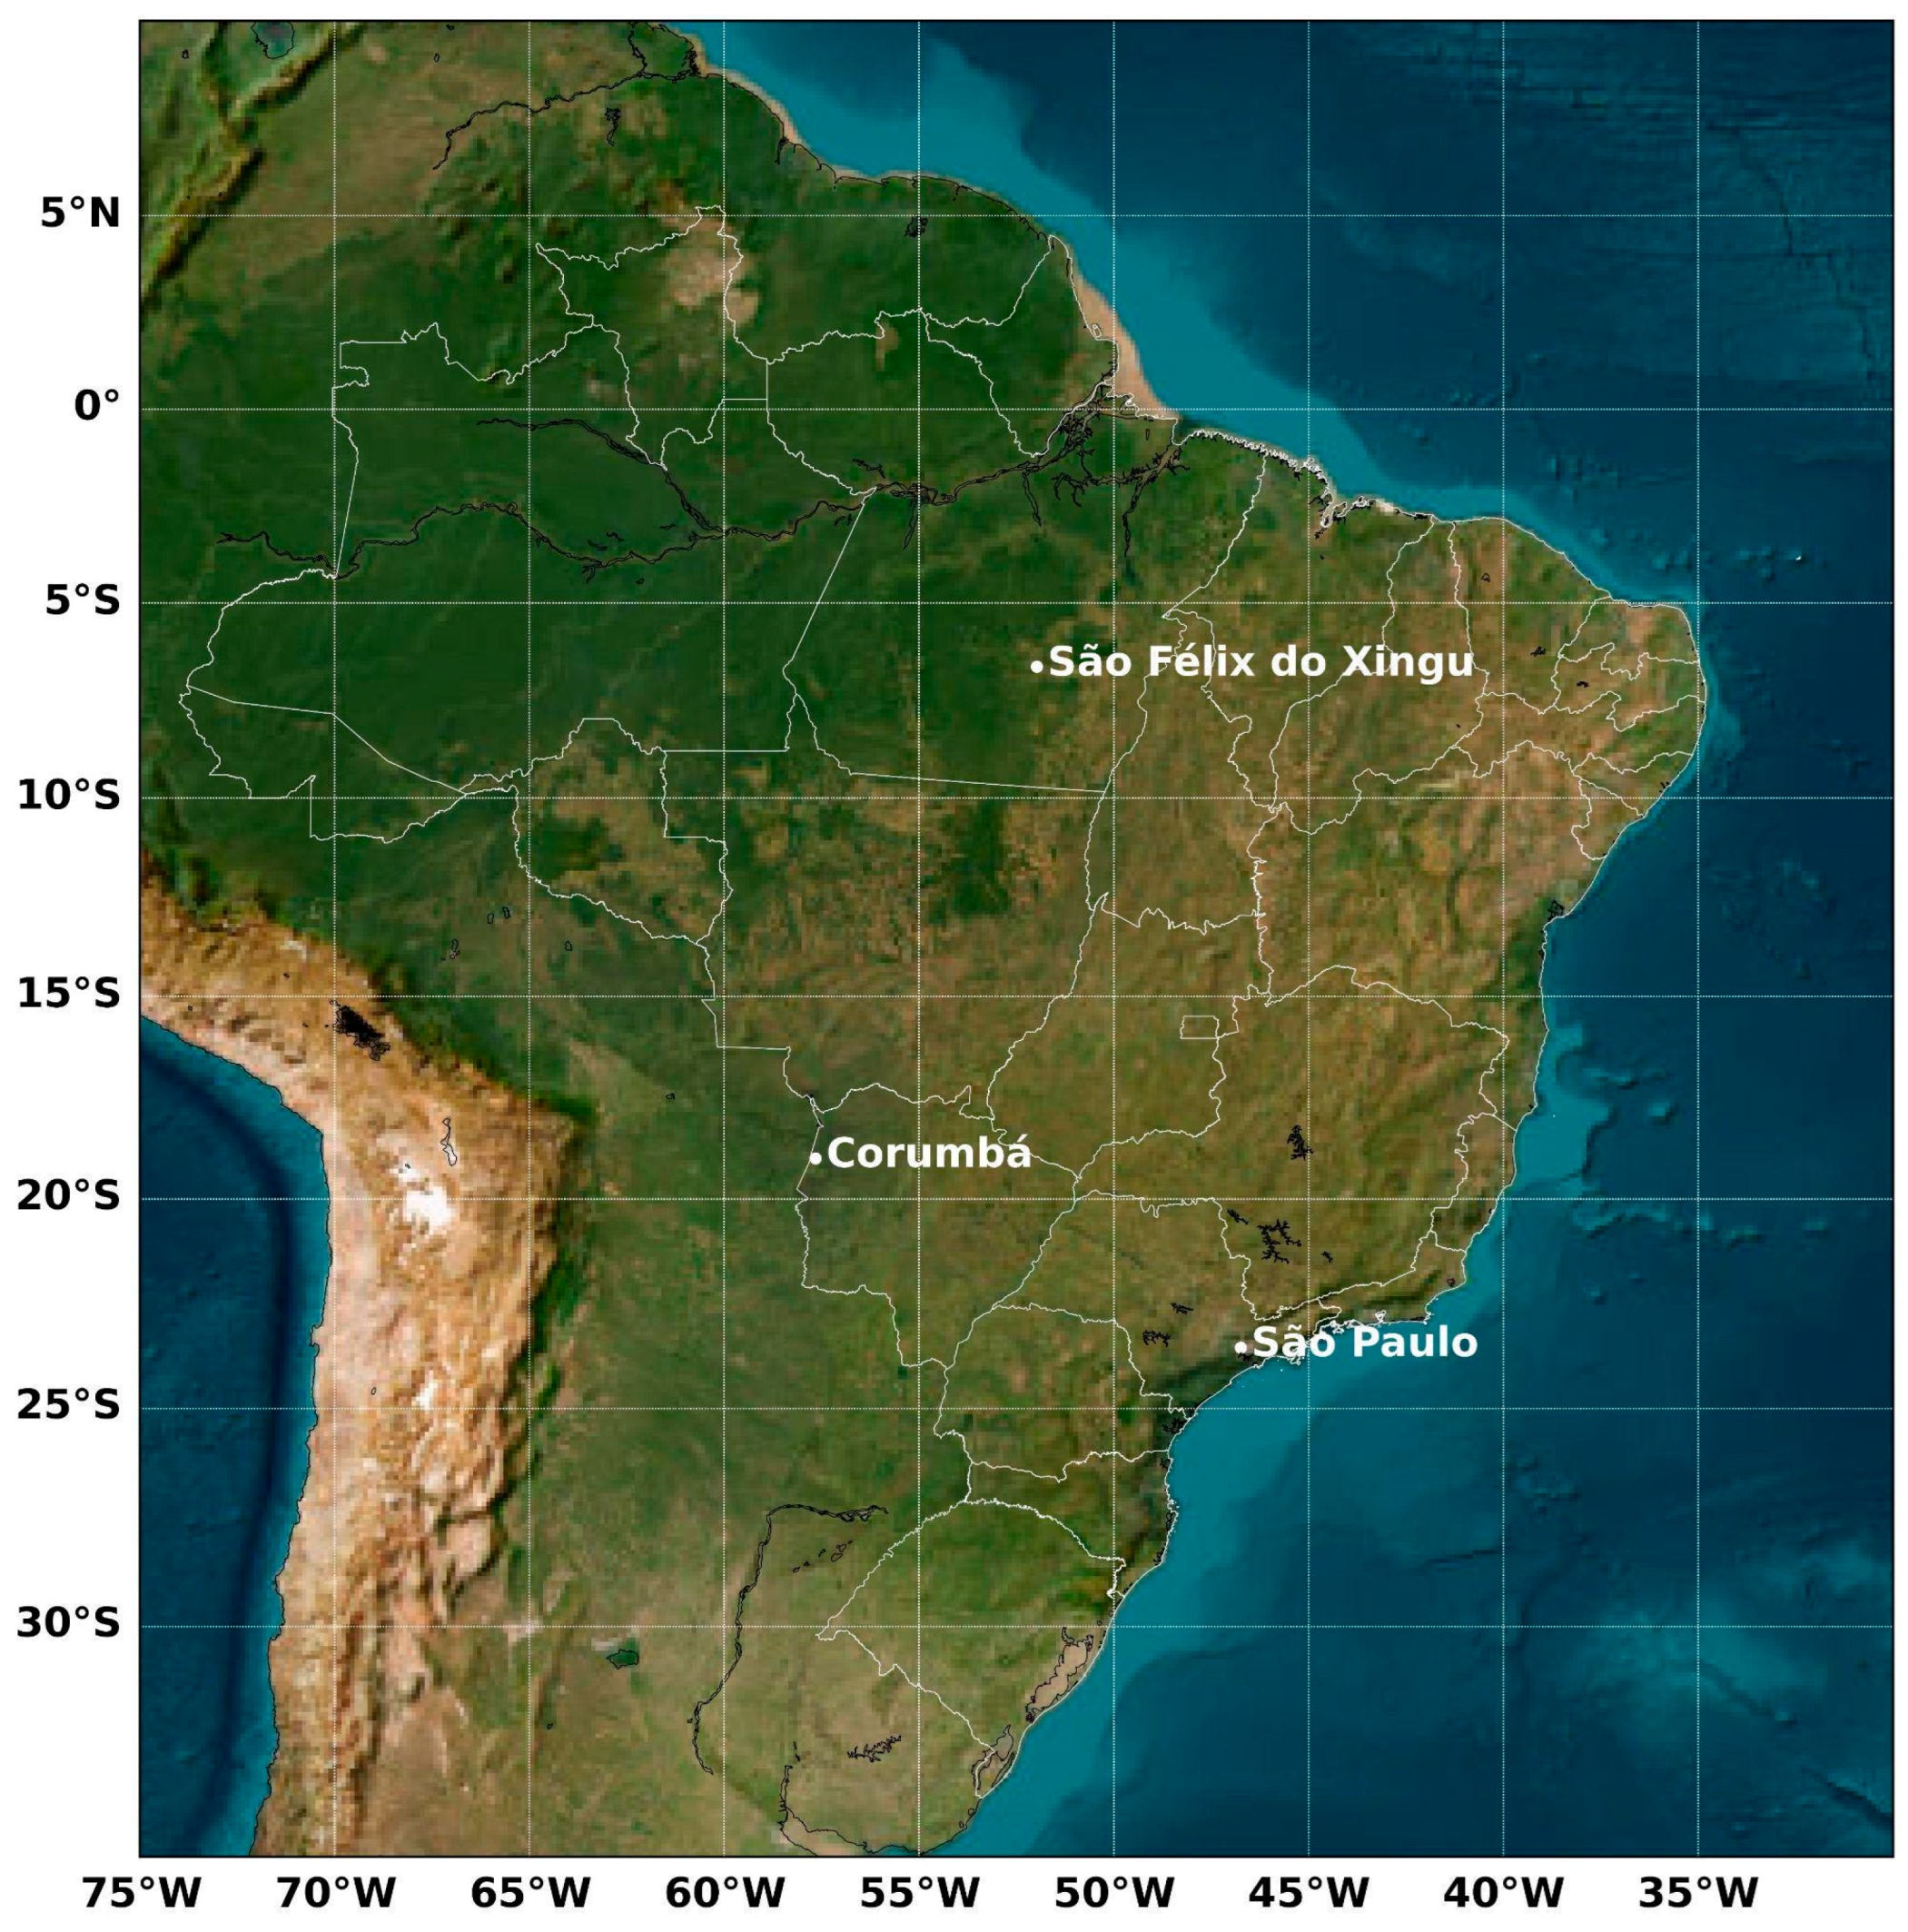
Figure 1. Geographical map of Brazil highlighting São Paulo (Southeast), Corumbá (Central-West/Pantanal), and São Félix do Xingu (Northern Amazon). These three selected regions were chosen for analyzing atmospheric transport influenced by biomass burning. São Paulo—the location of the SPU Lidar Station—reflects urban–industrial emissions alongside regional fire impacts. Corumbá, bordering Bolivia, anchors the fire-prone Pantanal wetlands, while São Félix do Xingu exemplifies Amazonian deforestation frontiers with intense agricultural burning.
Atmosphere 16 01022 g001
Figure 2. (a) EarthCARE satellite overpass on 2 September 2024 at 05:24:52 UTC (Orbit 1497) over the SPU Lidar Station. A maximum distance of 75 km between São Paulo and the overpass trajectory was selected, giving an available range of 78 km. Such a range included the mean of 76 vertical profiles. Panels (b,c) show the mean vertical profiles of backscatter and extinction, respectively. The overpass reveals aerosol layers in the lower troposphere and cirrus clouds near the tropopause, as captured by ATLID and the SPU Lidar Station.
Atmosphere 16 01022 g002
Figure 3. (a) EarthCARE satellite overpass on 27 November 2024 at 16:53:30 UTC (Orbit 2843) over the SPU Lidar Station. A maximum distance of 75 km between São Paulo and the overpass trajectory was selected, giving an available range of 147 km. Such a range included the mean of 147 vertical profiles. Panels (b,c) show the mean vertical profiles of backscatter and extinction, respectively. The overpass reveals aerosol layers in the lower troposphere and cirrus clouds near the tropopause, as captured by ATLID and the SPU Lidar Station.
Atmosphere 16 01022 g003
Figure 4. (a) Normalized backscatter (β) vertical profiles for ATLID (red line—mean backscatter within the range of 76 vertical profiles) and SPU Lidar Station (green line). The height for both profiles was resampled in 100 m intervals. It can be observed that there is good agreement between the signals of both instruments at matching altitudes, as demonstrated by the (b) percentual difference between the β signals and the (c) Pearson’s correlation coefficient between the β signals. Ground-based lidar measurements performed at the SPU Lidar Station on 2 September 2024.
Atmosphere 16 01022 g004
Figure 5. RCS532 curtain plot for the first 20 km of the atmosphere, corresponding to the nighttime measurement performed at the SPU Lidar Station on 2 September 2024. Nighttime measurements in clear skies yield the best conditions for analyzing vertically structured atmospheric features due to low solar interference and stable air layers.
Atmosphere 16 01022 g005
Figure 6. (a) Normalized backscatter (β) vertical profiles for ATLID (red line—mean backscatter within the range of 147 vertical profiles) and SPU Lidar Station (green line—raw data). The height for both profiles was resampled in 100 m intervals. It can be observed that the agreement between the signals of both instruments at matching altitudes is adversely affected, as can be seen by the (b) percentual difference between the β signals and the (c) Pearson’s correlation coefficient between the β signals. Ground-based lidar measurements performed at the SPU Lidar Station on 27 November 2024.
Atmosphere 16 01022 g006
Figure 7. RCS532 curtain plot for the first 20 km of the atmosphere, corresponding to the daytime measurement performed at the SPU Lidar Station on 27 November 2024. The presence of low clouds can be observed between approximately 16:29 UTC and 17:19 UTC. The low clouds make it difficult to retrieve backscatter and extinction profiles.
Atmosphere 16 01022 g007
Figure 8. (a) RCS532 curtain plot for the first 5 km of the lower troposphere. (b) Particle backscatter profile, displaying typical backscattered signal values from aerosols. Both plots correspond to the nighttime measurement performed on 1 September 2024.
Atmosphere 16 01022 g008
Figure 9. (a) RCS532 curtain plot for the first 5 km of the lower troposphere. (b) Particle backscatter profile, displaying typical backscattered signal values from aerosols. Both plots correspond to the daytime measurement performed on 2 September 2024.
Atmosphere 16 01022 g009
Figure 10. Ångström matrix retrieved for São Paulo on 1–2 September 2024 revealing a significant presence of black carbon aerosols, consistent with expected biomass burning influence in the region.
Atmosphere 16 01022 g010
Figure 11. Seasonal distribution of wildfire hotspots (thousands of cases) across Brazilian states from 2020 to 2024 (a) with detailed comparison for Mato Grosso do Sul, Pará, and São Paulo during 2024 (thousands of cases) (b). Data were obtained from the BDQueimadas monitoring platform [13]. The analysis reveals August and September as the peak months for fire occurrences, with 2024 showing a marked increase in hotspot frequency compared to preceding years [13].
Atmosphere 16 01022 g011
Figure 12. HYSPLIT 120 h backward trajectories at predefined altitudes (1500, 2000, and 2575 m above sea level) for air masses arriving in São Paulo on 2 September 2024, overlaid with fire hotspot distribution (yellow markers) across Pará, Mato Grosso, and Mato Grosso do Sul (27 August–2 September 2024). The colored lines represent the trajectories followed by the air, with the colors indicating the corresponding altitudes. The black stars indicate arrival in São Paulo. The trajectory analysis shows the transport of air masses from fire-affected regions to the measurement location in São Paulo. Map plotted with Google Earth Pro.
Atmosphere 16 01022 g012
Figure 13. ATLID aerosol classification (product ATL_TC_2A) for (a) Corumbá region on 27 August 2024 and (b) São Félix do Xingu region on 29 August 2024, as presented in Table 1. The classification indicates the presence of aerosol layers categorized as smoke in both regions. These data products are accessible via the EarthCARE Online Dissemination Service [28].
Atmosphere 16 01022 g013
Figure 14. (a) Data from the ATL_EBD_2A product from the overpass on 27 August 2024 for Corumbá. A maximum distance of 30 km between Corumbá and the overpass trajectory was selected, giving an available range of 9.3 km. (b) Same for São Félix do Xingu on 29 August 2024. A maximum distance of 70 km between São Félix do Xingu and the overpass trajectory was selected, giving an available range of 41.2 km.
Atmosphere 16 01022 g014
Figure 15. (a) Data from the ATL_EBD_2A product from the overpass on 27 August 2024 for Corumbá. The 9.3 km range included the mean of 10 vertical profiles, showing the values of backscatter (a) and extinction (b) coefficients, LR (c), and AOD (d), all at 355 nm.
Atmosphere 16 01022 g015
Figure 16. (a) Data from the ATL_EBD_2A product from the overpass on 29 August 2024 for São Félix do Xingu. The 41.2 km range included the mean of 42 vertical profiles, showing the values of backscatter (a) and extinction (b) coefficients, LR (c), and AOD (d), all at 355 nm.
Atmosphere 16 01022 g016
Table 1. EarthCARE satellite overpasses in Corumbá, São Félix do Xingu, and São Paulo.
Corumbá São Félix do XinguSão Paulo
Start Orbit141214431497
Start Sec305428655187
Start Date27 August 202429 August 20242 September 2024
Start UTC~T17:41:32~T17:27:18~T05:17:14
Disclaimer/Publisher’s Note: The statements, opinions and data contained in all publications are solely those of the individual author(s) and contributor(s) and not of MDPI and/or the editor(s). MDPI and/or the editor(s) disclaim responsibility for any injury to people or property resulting from any ideas, methods, instructions or products referred to in the content.