Article

Toledo and Climate Change: 30 Years of Clinical Aerobiology in the Center of Spain

by
Angel Moral de Gregorio
1,*,
Raúl Guzmán Rodríguez
1,
Carlos Senent Sánchez
1,
Francisco Feo Brito
2 and
Pedro Beneyto Martin
3
1
Allergy Department, Hospital Universitario Toledo, 45007 Toledo, Spain
2
Faculty of Medicine of Ciudad Real, 13071 Ciudad Real, Spain
3
Research Unit, Hospital Universitario Toledo, 45007 Toledo, Spain
*
Author to whom correspondence should be addressed.
Atmosphere 2025, 16(8), 981; https://doi.org/10.3390/atmos16080981
Submission received: 21 June 2025 / Revised: 3 August 2025 / Accepted: 13 August 2025 / Published: 18 August 2025
(This article belongs to the Special Issue Characterization and Toxicity of Atmospheric Pollutants)

Abstract

The incidence of allergic diseases has increased notably in recent years. The reasons for this increase include air pollution, diet, and infectious factors. This study aims to analyze the interactions between aeroallergens, environmental pollutants, and meteorological factors and their impact on allergenic sensitization in Toledo, Spain. An aerobiological study was conducted over the past 30 years (1994–2023) using a Burkard collector and the SEAIC (Spanish Society of Allergology and Clinical Immunology) methodology. Meteorological data were obtained from the State Meteorological Agency (AEMET) and pollutant data were acquired from the Castilla-La Mancha Air Quality Monitoring Network. Patients presenting with seasonal allergic symptoms at the University Hospital of Toledo were selected for skin testing with various types of airborne pollen. A total of twenty pollen taxa were identified in the Toledo atmosphere, as follows: Cupressaceae (26.53%); Olea europaea (21.62%); Quercus (21.12%); Poaceae (10.30%); Urticaceae (2.58%); Plantago (2.48%); Platanus (2.00%); Amaranthaceae (1.72%); Rumex (1.68%); and Morus, Pistacia, Populus, Artemisia, Fraxinus, Alnus, Carex, and Ericaceae (less than 1% each). The average temperature increased by 1.2 °C, while the level of precipitation remained stable. Among all pollutants, only a moderate increase in ozone levels was observed; however, the concentrations of particulate matter and nitrogen oxides decreased. The prevalence of pollen sensitization in allergic patients ranged from 8% for Pinus nigra to 84% for Phleum pratense. In conclusion, the rise in temperature due to climate change, coupled with high concentrations of pollutants such as ozone, can result in increased concentrations of the main types of wind-borne pollen. Thus, this can lead to a greater sensitivity to pollen and, consequently, more people becoming allergic to pollen.

1. Introduction

Allergic diseases, such as rhinoconjunctivitis and pollen allergy asthma, were not very common several decades ago, but currently constitute a public health problem, having reached an epidemic frequency and affecting up to 35% of young European adolescents. In up to 80% of cases, allergic rhinitis begins before the age of 20, representing the top reason for consultation in pediatric allergology and one of the top ten in primary care [1,2,3,4,5].
Genetic and environmental factors are related to the increase in the incidence of allergic diseases, but genetic factors are unlikely to be responsible for such notable changes in such a short period of time. Over recent years, the abundance of some pollen taxa has increased while that of others has decreased, making the exponential increase in pollen-induced allergic rhinitis and asthma paradoxical. Climate change, with its increased temperatures and extreme weather events due to the burning of fossil fuels and the emission of greenhouse gases, may be one of the causes [6,7,8]. Alternatively, germs, microplastics, enzymes, and emulsifiers from processed foods may also contribute to alterations in epithelial and mucosal barriers, favoring the penetration of aeroallergens and their contact with the immune system [9,10,11].
Similarly, pollen grains from contaminated areas not only have new antigenic characteristics, but also carry contaminating particles on their surfaces and have direct effects on allergic patients, increasing the risk of allergic sensitization and the exacerbation of symptoms in susceptible individuals [7,12]. Furthermore, an analysis of pollen gene expression in areas of environmental contamination revealed genes encoding lipid transfer proteins (LTPs) and thaumatins related to severe episodes of food allergy [13,14].
Environmental factors related to climate change and environmental pollution worsen the prevalence and severity of allergic diseases, with pollutants such as ozone (O3), nitrogen dioxide (NO2), and particulate matter 2.5 (PM2.5) being the drivers of such increases [15,16].
The climatic characteristics of both Toledo and the entire Central Peninsular area—i.e., a dry, continental climate with extreme temperatures—favor explosive levels of pollination. The consequence of this meteorological profile is that the threshold of allergenic types of pollen is widely exceeded at various times throughout the year, especially during spring [17,18]. These effects are particularly alarming in weeds, the invasion of which is becoming increasingly evident [19].
Some members of Toledo’s population have been sensitized to allergenic types of pollen from species such as Cupressaceae (November–March), Platanus (April), Poaceae (May–June), Olea europaea (May–June), and Amaranthaceae (July–November). Moreover, the broad spectrum of pollination in Toledo parallels the risk of symptoms for people with allergies [20,21]. In addition, 88% of allergy patients are allergic to more than one type of pollen, which increases the duration of risk because the inflammatory response triggered by one type of pollen leads to that of other types, leading to the constant presentation of clinical symptoms even at lower concentrations [22,23].
Our aim was to study the evolution of pollen and Alternaria spores over the last thirty years (1994–2023) at an atmospheric level and their relationships with different meteorological and environmental variables.
Skin tests were used to determine the prevalence of sensitization to the types of pollen currently present in the atmosphere in Toledo.

2. Materials and Methods

2.1. Study Area

Toledo, located in central Spain (39°51′ N, 4°01′ W), has a population of 86.070 inhabitants and features a flat terrain with uniform vegetation (Figure 1). It is 529 m above sea level, surrounded by the Tagus River, and belongs to the Autonomous Community of Castilla-La Mancha. This area has a dry continental climate, with an average annual temperature of 15.8 °C and an average annual rainfall of 342 mm.
The high presence of pollen grains in the atmosphere of Toledo is due to the large number of anemophilous species in this area, including natural species such as Quercus spp., Plantago spp., Poaceae, Urticaceae, Artemisia spp., and Amaranthaceae; ornamental species such as Cupressaceae and Platanus spp.; and even cultivated species such as Olea europaea.

2.2. Aerobiological Study

Average daily pollen concentrations were measured at Virgen del Valle Hospital (Toledo) between 1994 and 2023. Pollen grain count was measured using a Hirst sampler collector (Burkard Manufacturing Co., Rickmansworth, Herts, UK). The sampling air flow rate was 10 L/min, and the collector hole size was 14 × 2 mm. The pollen was captured on 24 mm wide transparent tape coated with a thin film of petroleum jelly. This tape was mounted on a cylinder rotating at a speed of 2 mm/h. To study the pollen captured over a 24 h period, a 48 mm scan (2 mm/h × 24 h) was performed with a Leica DM750 microscope (Leica, Wetzlar, Germany) 10× eyepiece, 40× objective, and 0.44 mm field diameter. The pollen data and taxa recommended by the Manual of the Spanish Aerobiology Network, as modified by the Clinical Aerobiology Committee of the Spanish Society of Allergology and Clinical Immunology, were used [24,25].

2.3. Air Pollution Data and Meteorological Variables

Data on chemical pollutants were obtained from the website of the Air Pollution Control and Surveillance Network of the Castilla-La Mancha Community Board, between 1999 and 2023 (https://www.castillalamancha.es/gobierno/desarrollosostenible/estructura/dgcalamb/actizaciones/stations-of-the-public-network-of-control-and-surveillance-of-the-atmospheric-pollution-of-castilla-la-mancha) (accessed on 1 January 2024).
Meteorological data between 1994 and 2023 was provided by the Toledo-Buenavista station of the State Meteorological Agency (AEMET), headquarters of the Geophysical Observatory of the National Geographic Institute, located 4.720 m from the sampler at the Virgen del Valle Hospital, with the code 3620 B, with the following coordinates: 39°53′5″ N and 4°2′43″ W, at an altitude of 515 m above sea level (http://www.aemet.es, accessed on 1 January 2024).
The climatological data collected at the Toledo station included average daily temperature, minimum daily temperature, maximum daily temperature, daily precipitation, daily hours of sunshine, average daily relative humidity, average daily wind speed, maximum wind gust, maximum daily wind direction, maximum daily atmospheric pressure, minimum daily atmospheric pressure, and solar radiation.

2.4. Skin Tests

Between 1 January and 15 March, 2023, skin tests were performed on 240 patients who visited the allergy department due to symptoms of seasonal allergy.
The skin tests were performed with the aeroallergen battery, using histamine chloride (10 mg/mL) as a positive control and glycerosaline as a negative control. The skin tests were read after 15 min. A positive reaction was defined as a wheal with a mean diameter (longest diameter + orthogonal diameter/2) greater than 3 mm, in the presence of a negative reaction with glycerol saline, according to the protocol of the European Academy of Allergy [26]. The ethical committee of the University Hospital of Toledo approved this study.
The following sixteen pollen families were evaluated using prick tests: Artemisia vulgaris, Betula verrucosa, Cupressus arizonica, Morus alba, Olea europaea, Parietaria judaica, Phleum pratense, Pinus nigra, Pistacia terebinthus, Plantago lanceolata, Platanus acerifolia, Populus alba, Quercus ilex, Rumex acetosella, Salsola kali, and Ulmus glabra and also the fungus Alternaria alternata.

2.5. Statistical Analysis

A statistical analysis was carried out using SPSS version 29.0.1.0. Descriptive statistics are presented as means and standard deviations, and as percentages. For the correlation analysis, the Kolmogorov–Smirnoff test was performed to determine whether the data were normally distributed. If the data were normally distributed, the Pearson parametric test was used, and if not, a Spearman correlation analysis was performed.
To confirm statistically a possible relationship between daily pollen concentrations and the different meteorological parameters and pollutants between 1994 and 2023, a non-parametric Spearman’s correlation test was performed. A non-parametric correlation analysis was used, since the data were not normally distributed.

3. Results

3.1. Pollen and Alternaria Spores (1994–2023)

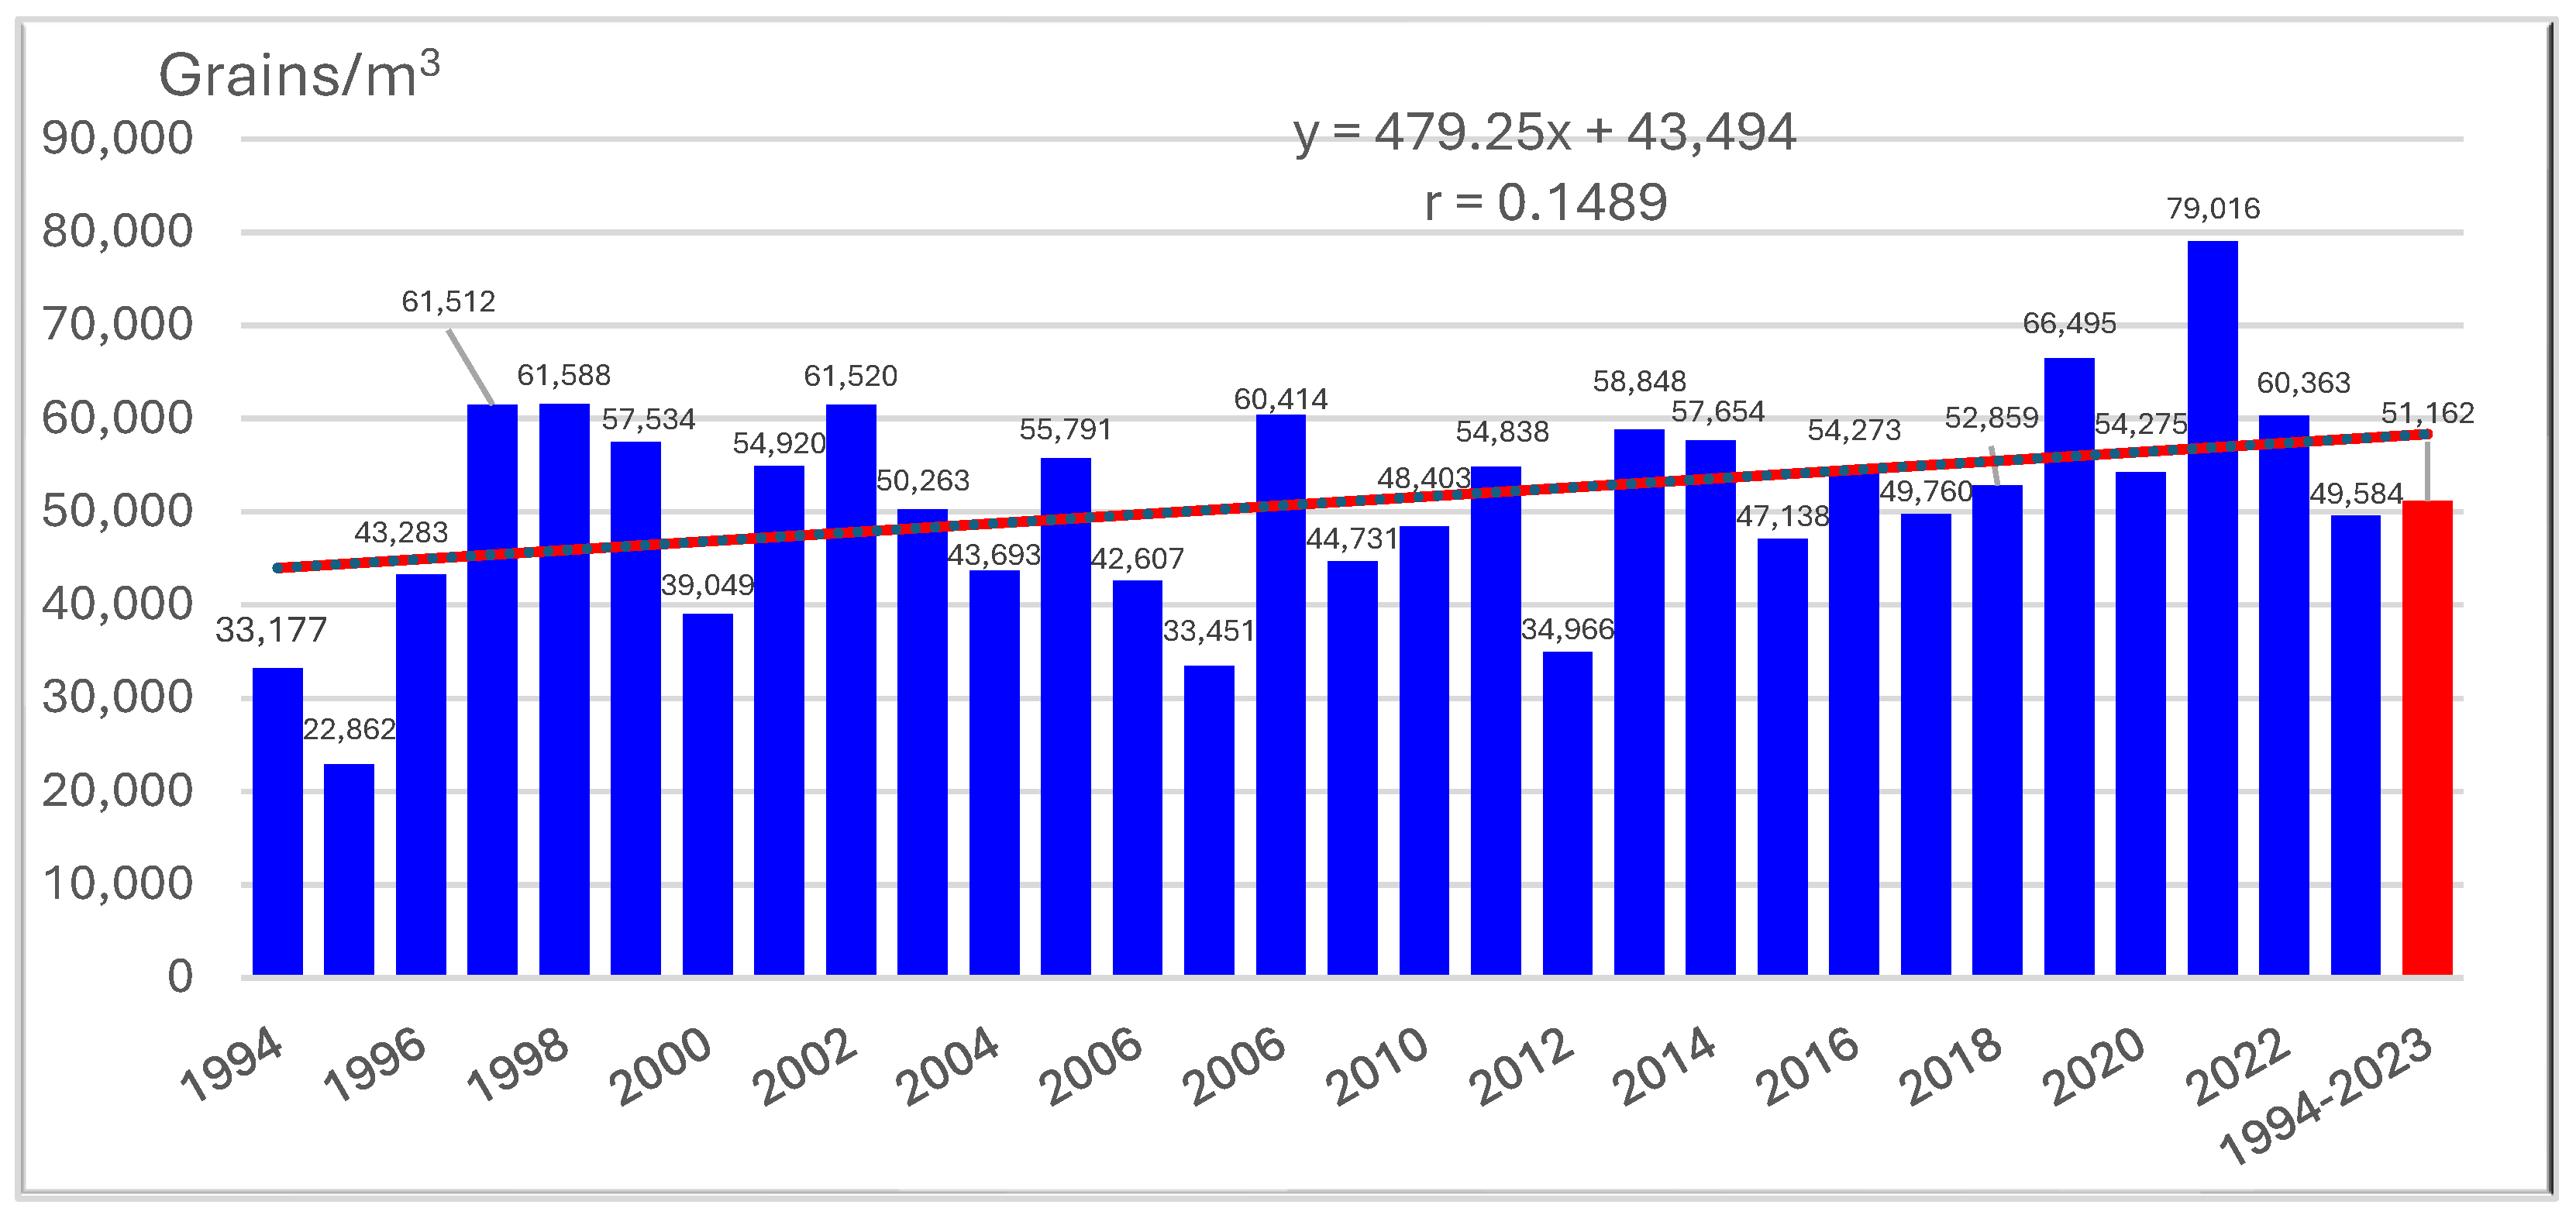
The average annual pollen concentration during the 30 years of study was 51.162 pollen grains/m3, with a maximum of 79.016 pollen grains/m3 in 2021, a minimum of 22.862 grains/m3 in 1995, and a coefficient of variability of 110% (Figure 2).
Among the types of pollen representing more than 0.15% of the total number of pollen grains in Toledo during the period 1994–2023, 20 different pollen taxa were collected. The mean annual concentration, peak day, and maximum annual concentration in grains/m3 for each of the 20 taxa are presented in Table 1.
A total of 20 different pollen taxa were collected, with pollen from Cupressaceae species being the most prevalent at 26.53% of the total (peak day, 26 January 2014, with 3.734 grains/m3), followed by Olea europaea at 21.62% (peak 30 May 1999, 5.064 grains/m3), Quercus spp. at 21.12% (peak 28 April 2002, 3.486 grains/m3), Poaceae at 10.30% (peak 18 May 2003, 1320 grains/m3), Pinus spp at 3.79% (peak 17 June 2018), Urticaceae at 2.58% (peak 8 March 2017, 452 grains/m3), Plantago spp. at 2.48% (peak 24 May 2008, 210 grains/m3), Platanus spp. at 2.00% (peak 8 April 2018, 668 grains/m3), Amaranthaceae at 1.72% (peak 2 September 2007, 62 grains/m3), Rumex spp. at 1.68% (peak 10 June 1998, 164 grains/m3), Morus spp. at 0.90% (peak 7 April 1999, 216 grains/m3), Pistacia spp. at 0.73% (peak 6 April 2001, 401 grains/m3), Populus spp. at 0.86% (peak 20 February 2020, 112 grains/m3), Artemisia spp. at 0.83% (peak 13 November 1998, 92 grains/m3), Fraxinus spp. at 0.75% (peak 2 February 2016, 92 grains/m3), Ulmus spp. at 0.44% (peak 9 February 2019, 84 grains/m3), Asteraceae (non-Artemisia) at 0.42% (peak 20 May 2000, 72 grains/m3), Alnus spp. at 0.37% (peak 26 January 2013, 124 grains/m3), Carex spp. at 0.27% (peak 28 May 1995, 44 grains/m3), Ericaceae at 0.16% (peak 9 May 2021, 34 grains/m3) and other pollen at 0.45% (Figure 3).
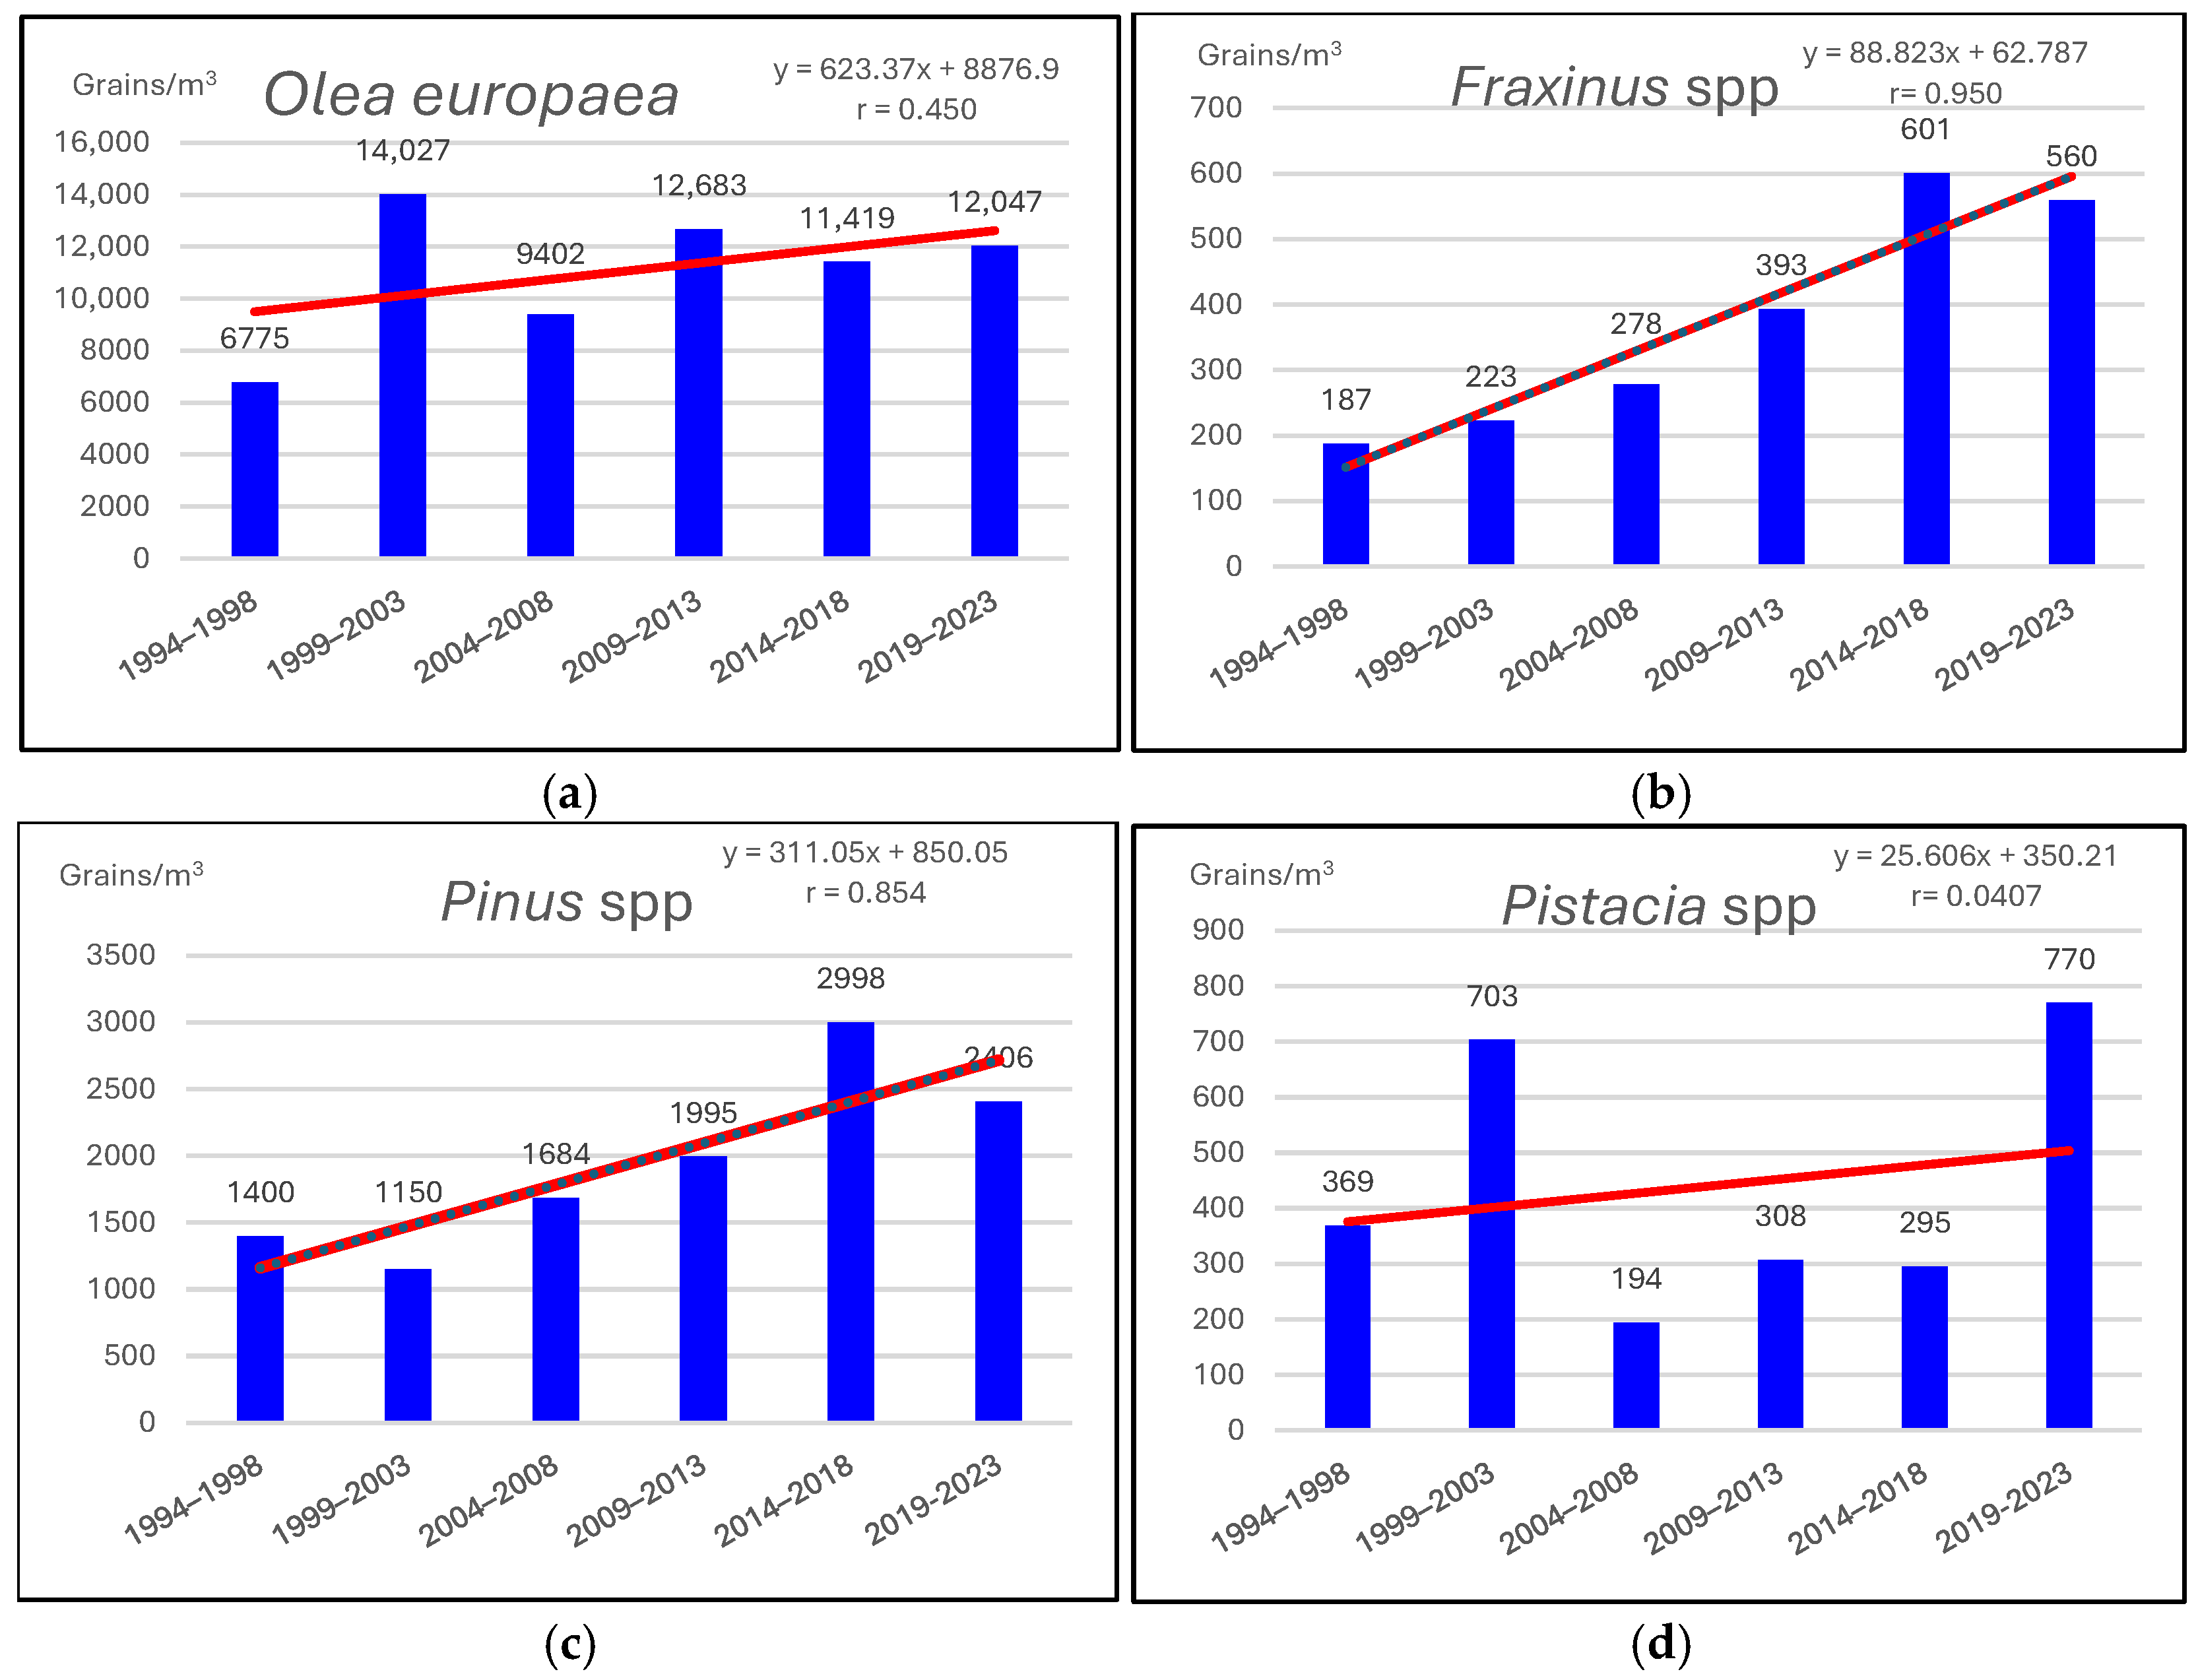
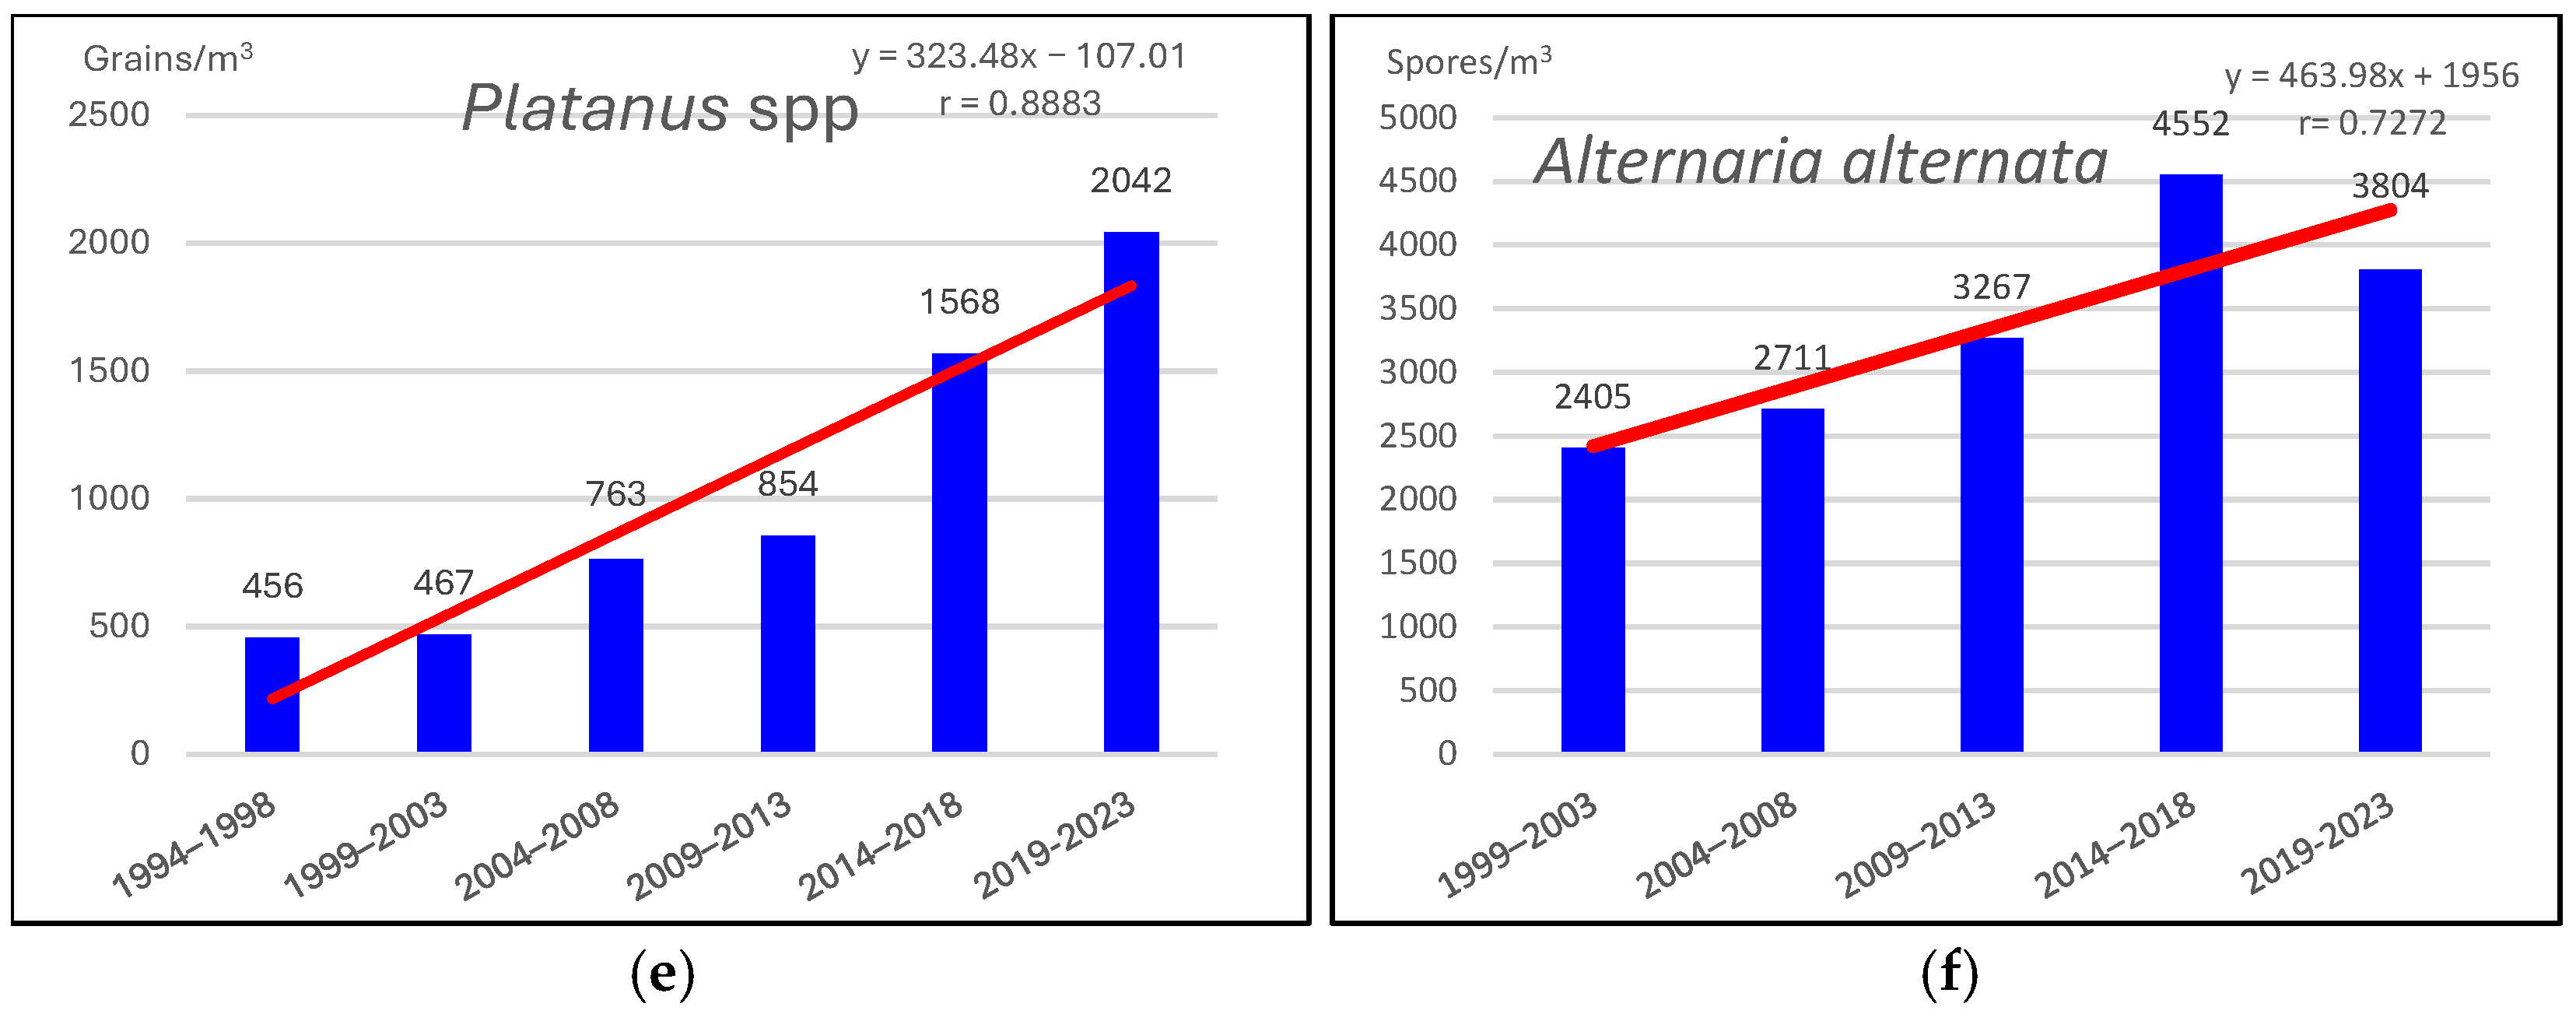
To reduce the interannual variability of pollen from 1994 to 2023 in Toledo, the concentrations were grouped into 5-year periods, showing a tendency to increase over time. The concentrations for almost all types of pollen, including the total pollen concentration, increased; some of them nearly doubled, such as for Olea europaea, Fraxinus, Pinus, and Pistacia spp. pollen and Alternaria spores, while others, such as Platanus spp., quadrupled (Figure 4).
During the study period, the number of pollen grains only decreased for the following species: Quercus spp., Artemisia spp., Carex spp., and Amaranthaceae.
Highly positive correlations between 1994 and 2023 were found for Fraxinus spp. (r = 0.950), Platanus spp. (r = 0.947), and Cupressaceae (r = 0.922) pollen and Alternaria spores (r = 0.959), positive correlations were found for Plantago spp. (r = 0.628) and Urticaceae (r = 0.611), and highly negative correlations were found for Carex spp. (r = −0.991), Amaranthaceae (r = −0.891), Quercus spp. (r = −0.853), and Artemisia spp. (r = −0.623) pollen.
The average concentration for Alternaria alternata was 3.306 spores/m3 (maximum in 2018, at 6.254 grains/m3), with an increase observed over time. The annual coefficient of variability of Alternaria alternata was 144%.

3.2. Meteorological Variables (1994–2023)

An analysis of the average annual temperature data from 1994 to 2023 revealed an increase of 1.2 °C from 16.3 °C to 17.5 °C, with an average of 16.4 °C, whereas the average from 1920 to 1993 was 15.1 °C. Therefore, in the last 30 years, the average temperature in Toledo has increased by 1.3 °C with respect to the average of the previous 74 years (Figure 5).
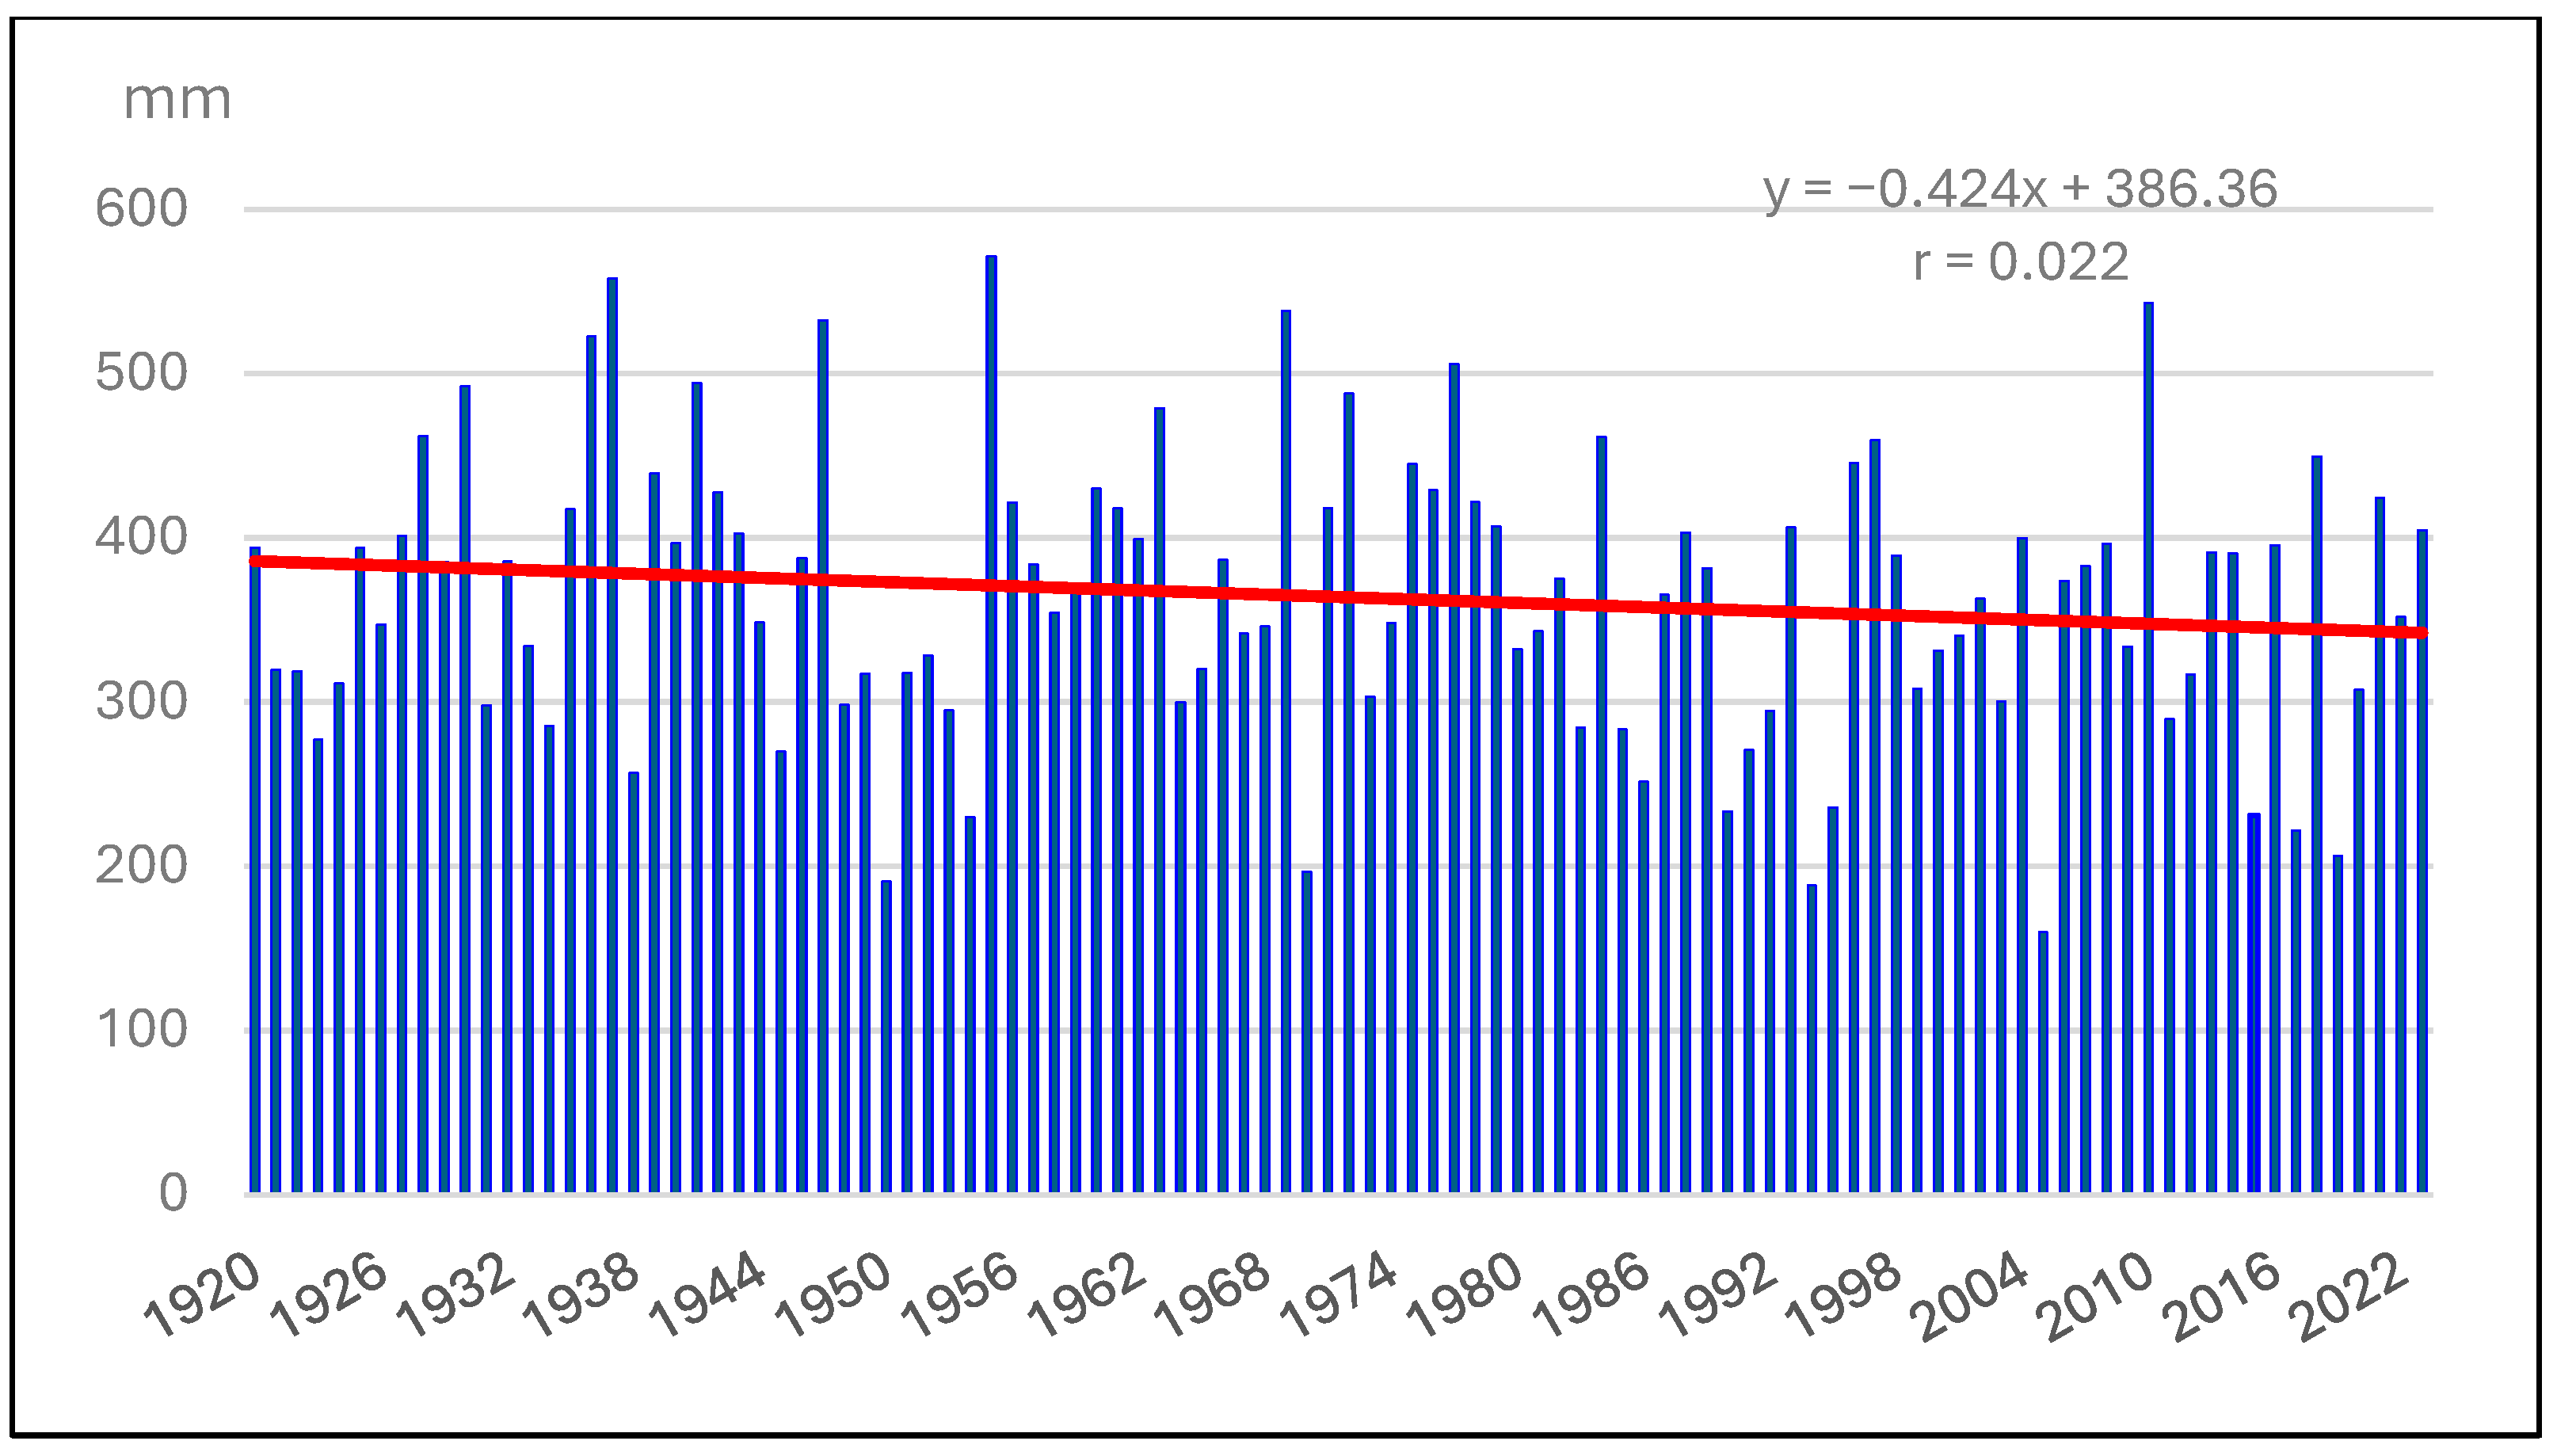
The mean total precipitation from 1920 to 2023 was 364.1 mm, with a standard deviation of ± 86.2 mm. The highest accumulated annual precipitation occurred in 1955, at 571.3 mm, and the lowest occurred in 2005, at 159.6 mm (Figure 6). The mean total precipitation from 1994 to 2023 was 344.25 mm, with a standard deviation of ± 177.1 mm.

3.3. Chemical Pollutants (1999–2023)

The mean annual concentration of particulate matter 10 (PM10) decreased from 40.45 µgr/m3 in 1999 to 19.08 µgr/m3 in 2023. The concentration of PM2.5 declined from 9.79 µgr/m3 in 2010 to 8.73 µgr/m3 in 2023. Similarly, NO2 levels decreased from 18.87 µgr/m3 in 1999 to 15.38 µgr/m3 in 2023. In contrast, ozone levels slightly increased from 54.3 µgr/m3 in 1999 to 57.46 µgr/m3 in 2023 (Figure 7).

3.4. Relationships Between Meteorological Variables and Chemical and Biological Pollutants

The correlation analyses between the meteorological variables and PM10 particles were significant for all variables, being moderately positive for thermal range and weakly positive for maximum, mean, and minimum temperature, solar radiation, mean pressure, and insolation and weakly negative for rainfall, humidity, and wind speed (Table 2).
In the case of PM2.5 particles, the correlations with almost all meteorological factors were significant but weakly positive for mean pressure, maximum, mean, and minimum temperature, and insolation and weakly negative for wind speed and rainfall.
There was a highly positive correlation between O3 and solar radiation, temperature, insolation, and wind speed. The correlation was highly negative between O3 and humidity.
A significant negative correlation was found between nitrogen oxides (NO and NO2) and wind speed, average temperature, insolation, and solar radiation, while a significant positive correlation was found for humidity and average atmospheric pressure. Moreover, positive correlations were found between NOx and average atmospheric pressure and between NO and humidity.
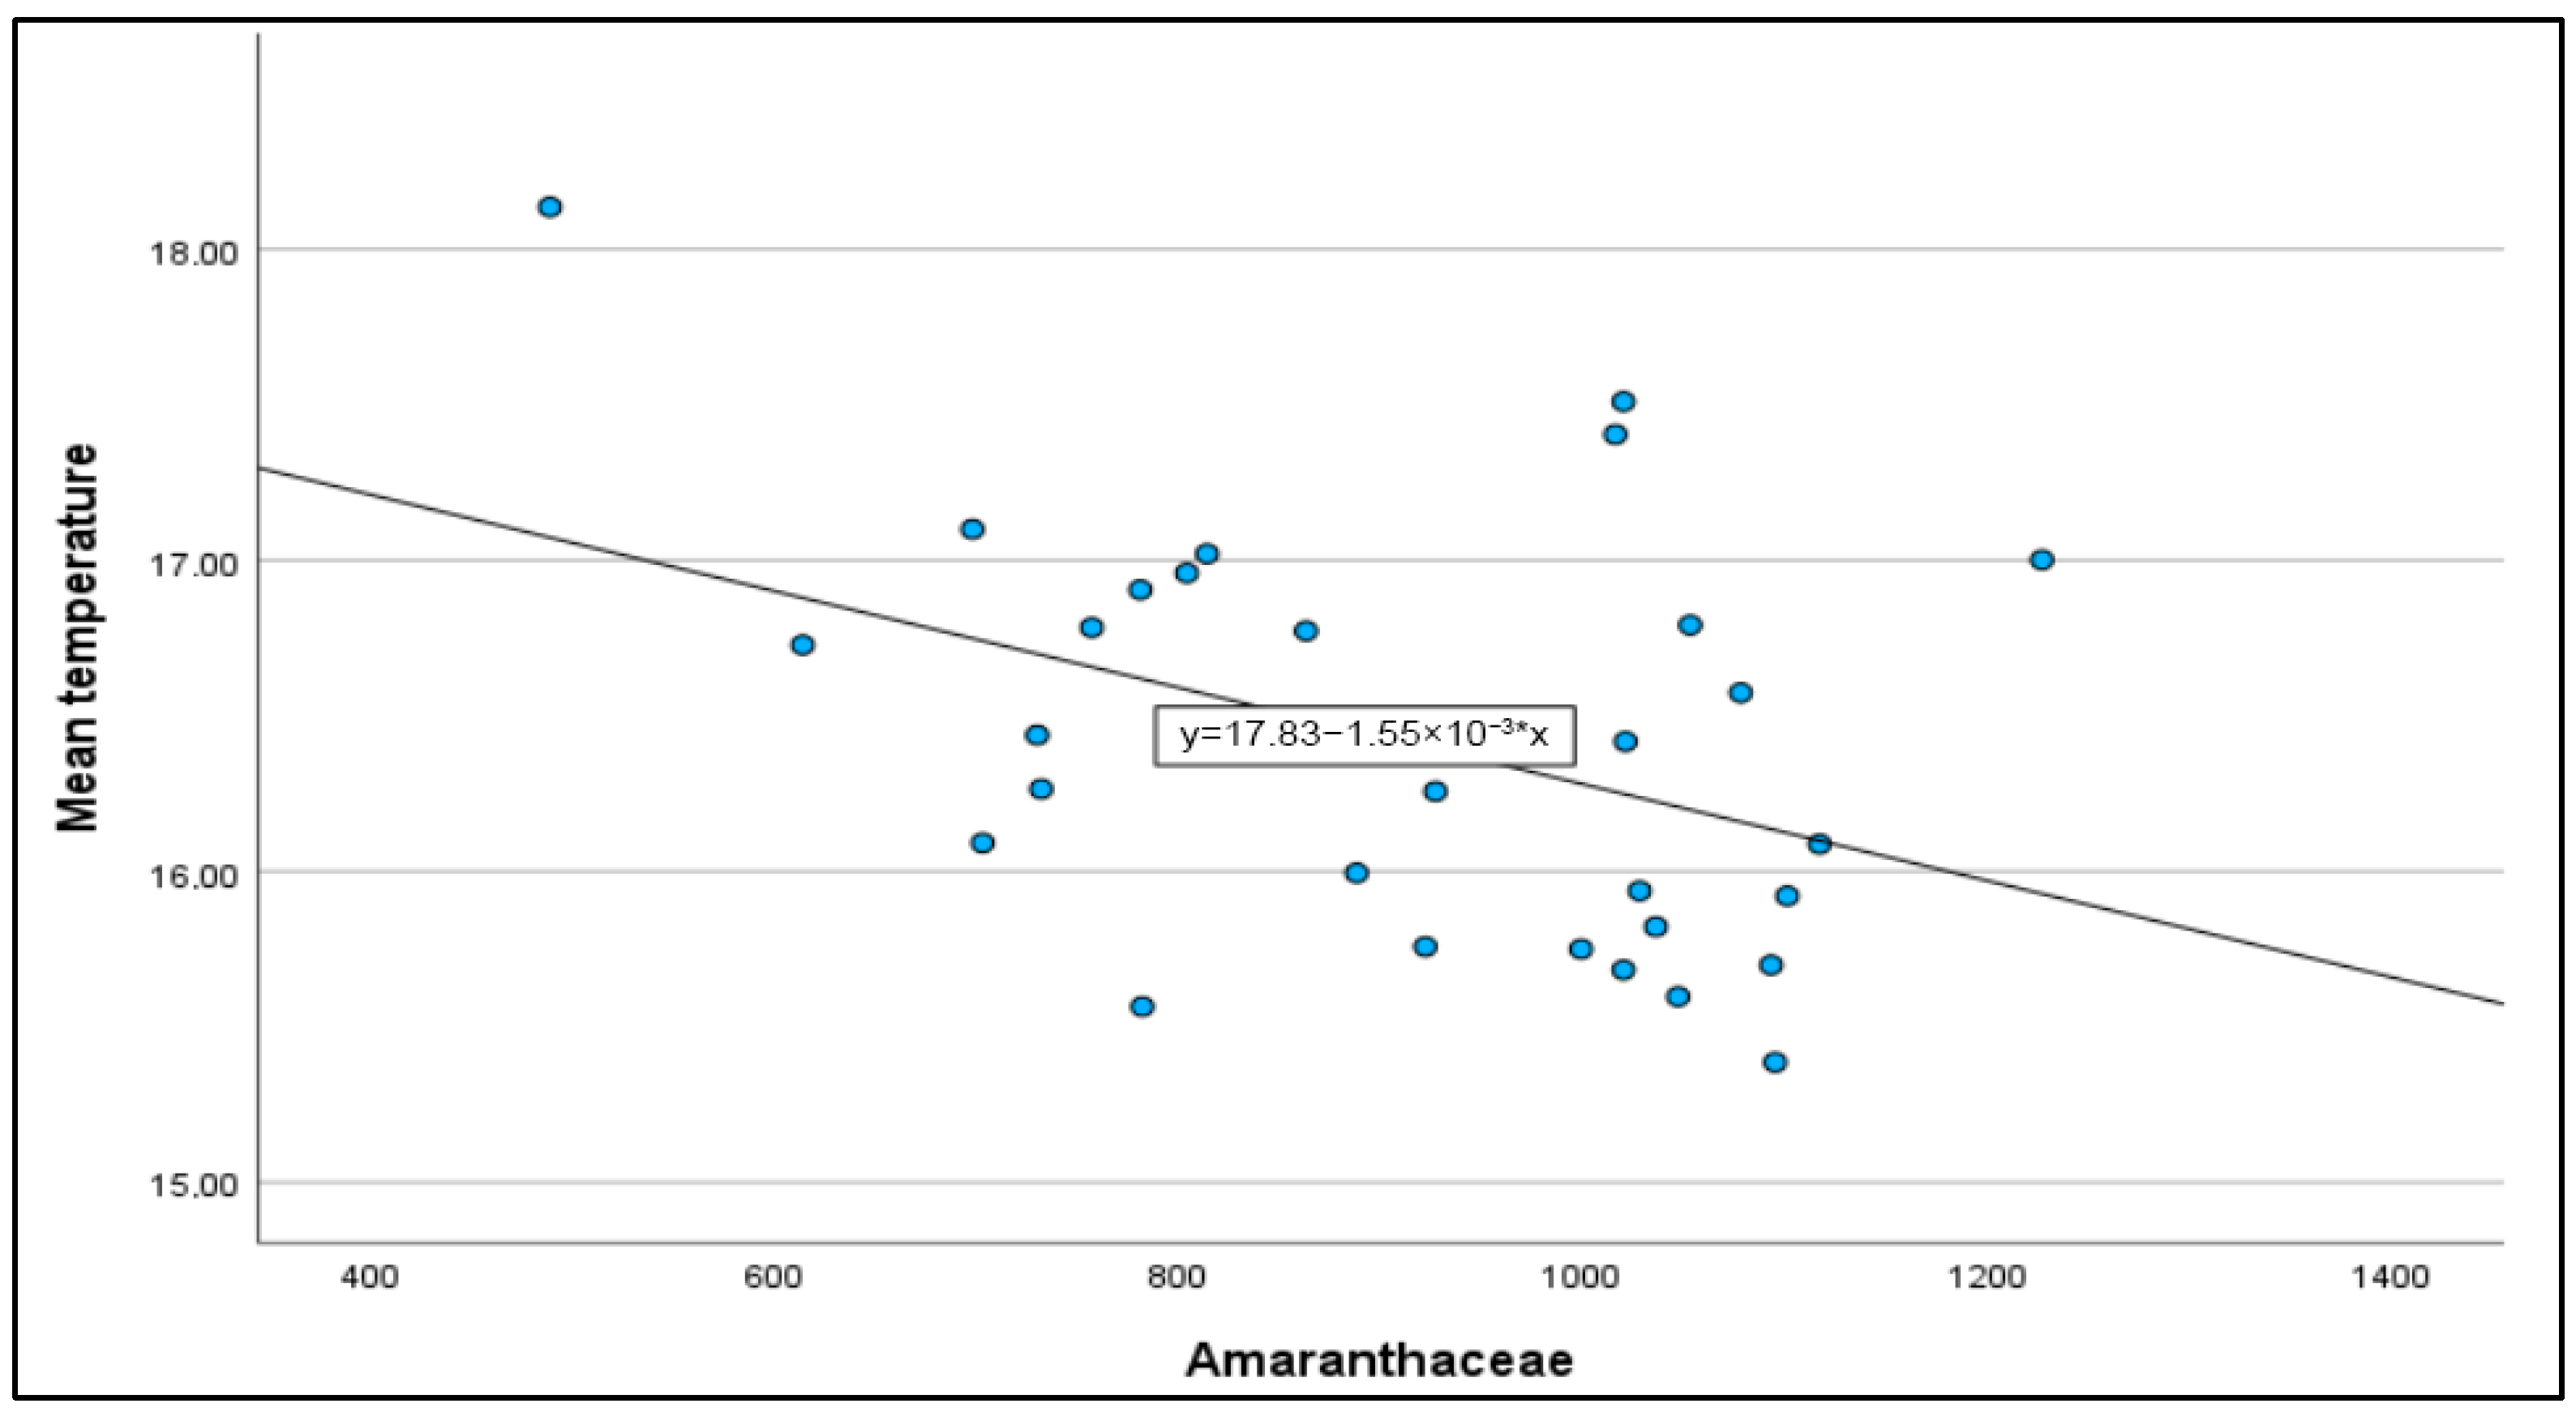
Temperature was significantly positively correlated with Olea and Poaceae pollen and Alternaria spores, and negatively correlated with Cupressaceae pollen (Table 3A,B). Amaranthaceae was strongly negatively correlated with mean temperature in August (r = 0.684) (Figure 8).
Thermal range was significantly positively correlated with the abundance of Amaranthaceae, Poaceae, Olea, Pinus, Asteraceae, Carex, Plantago, and total pollen and Alternaria spores. Solar radiation was positively correlated with the abundance of Amaranthaceae, Poaceae, Olea, Plantago, and Quercus pollen and Alternaria spores. Wind speed was significantly correlated with the abundance of Olea, Pinus, Plantago, Poaceae, and Quercus pollen (Table 3A,B).
The main correlations between chemical pollutants, total pollen counts, and the most allergenic pollen in Toledo were due to nitrogen oxides (NO, NO2, and NOx), with ozone (O3) being the main contributor. A very significant correlation was found between ozone and pollen during spring and summer flowering and a significant negative correlation was found during winter flowering. For nitrogen oxides, the Spearman correlation was weak and positive for winter pollen and weak and negative for spring and summer pollen. The correlation between pollen and chemical pollutants other than O3 and nitrogen oxides was weaker and occurred between particulate matter (PM10 and PM2.5), with a weak negative significance (Table 4A,B). As shown above, pollen and pollutants had common correlations with the weather, which determines the relationship between pollen and pollutants.

3.5. Prevalence of Pollen Sensitivity

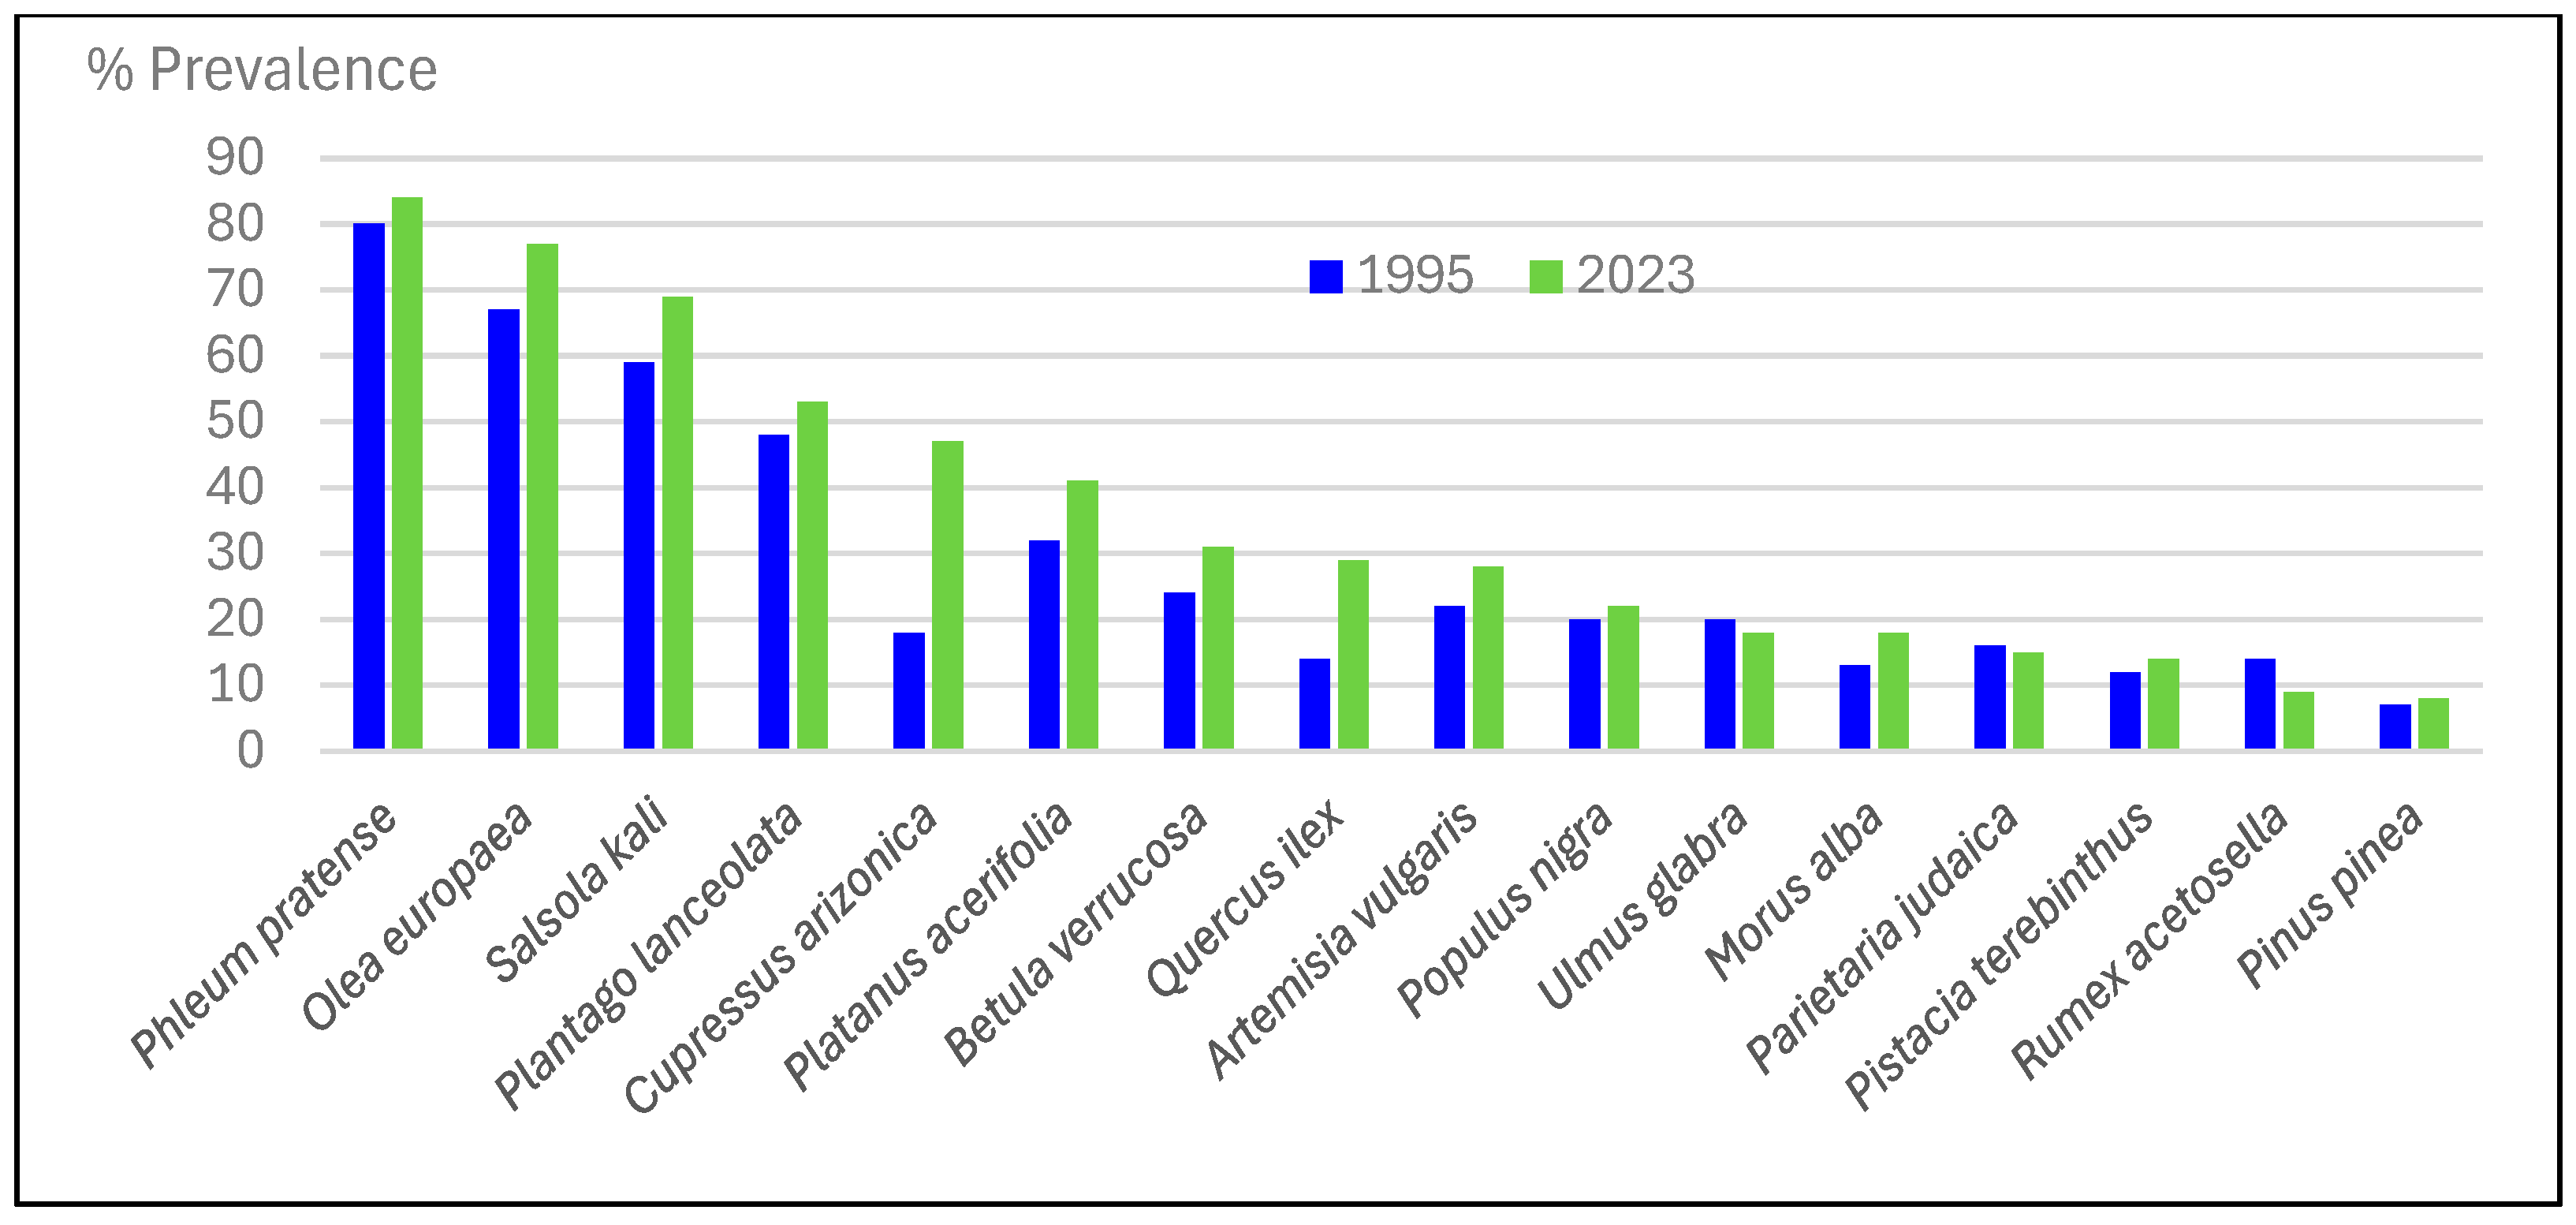
A total of 240 patients were included in the 2023 study. The results revealed that the greatest incidence of sensitivity was to Phleum pratense (84%), followed by Olea europaea (77%), Salsola kali (69%), Plantago lanceolata (53%), Cupressus arizonica (47%), Platanus acerifolia (41%), Betula verrucosa (31%), Quercus ilex (29%), Artemisia vulgaris (28%), Populus alba (22%), Ulmus glabra (18%), Morus alba (18%), Parietaria judaica (15%), Pistacia terebinthus (14%), Rumex acetosella (9%), and Pinus nigra (8%). The results of the pollen sensitivity prevalence study were compared with those from a previous study conducted in Toledo in 1995 [17], indicating an increase in practically all types of pollen, except for Ulmus glabra and Rumex acetosella. The increase for Cupressus arizonica more than doubled, from 18% in 1995 to 47% in 2023 and, for Quercus ilex, it doubled from 14 to 29%. The other types of pollen with significant increases were Olea europaea (10%), Salsola kali (10%), Platanus acerifolia (9%), Betula verrucosa (7%), Artemisia vulgaris (6%), Plantago lanceolata (5%), and Phleum pratense (4%), all of which are allergenic (Figure 9).

4. Discussion

The average temperature increased by 1.2 °C during the 30 years of study in Toledo (in the previous 72 years, it increased by 1.3 °C). This thermal rise was correlated in parallel with an increase in pollen production, the duration of pollination, and modification of the pollen season. Our results are in line with those of Subiza et al. in Madrid [22] and with broader European series such as that of Picornell [27], which have shown how an increase in CO2 intensifies photosynthesis and induces a phenological uncoupling that increases plant stress in Central Europe. In addition, the early onset of flowering makes species more vulnerable to possible extreme weather conditions, such as cold waves.
In the analysis of pollutants in Toledo, only ozone slightly exceeded the health thresholds recommended by environmental agencies, while other pollutants were reduced (NO2, PM10, and PM2.5). In total, 39 incidences of ozone exceedance occurred in the 30 years of study. Ozone is a secondary pollutant whose highest values are reached far from the source of production. Toledo is 68 km from Madrid, so when winds come from the north (the predominant winds are from the west), the high level of pollution from Madrid may contribute ozone to the atmosphere of Toledo. This polluting gas adheres to the surface of pollen and, if the pollen locally releases a high dose of ozone, it may exceed the natural protection ability of mucous membranes; in this way, ozone can, thus, reach cells in higher doses. Ozone increases the permeability of the epithelial layer due to oxidative stress and reduces the frequency of ciliary beating, which leads to a delay in the elimination of inhaled allergens and irritants. In turn, the increased permeability of airways may increase the access of these agents to the submucosa, where they interact with immune cells, enhancing the allergic response [6,12].
An increase in the expression of the allergens Pla or 1 and Pla or 3 from Platanus orientalis has been demonstrated in polluted areas in Iran [28]. Platanus pollen grains exposed to gaseous pollutants (NO2 and O3) can damage pollen cell membranes and increase the amount of Pla a 3 released into the atmosphere. Additionally, NO2 and O3 altered the structure of Pla a 3 protein through nitrification and oxidation, which not only enhanced the immunogenicity of allergens, but also increased the stability of the protein [29].
Modifications of the epithelial barrier are seen at the beginning of immune-mediated pathologies, such as rhinitis and allergic asthma. Such modifications are, on the one hand, the consequence of factors associated with climate change, such as increased temperatures, air pollution, and extreme weather factors, and on the other hand, due to other environmental exposures (exposomes) such as pathogens, detergents, surfactants, microplastics, nanoparticles, enzymes and emulsifiers in processed foods, and eating habits [7,9]. A classic study carried out in school-aged children from two different agricultural communities revealed that the group residing in a community that used traditional farming practices had a lower prevalence of asthma and allergic sensitization than the group residing in a community that used industrial farming methods [10]. In summary, a combination of environmental and infectious factors seems to be responsible for the increase in allergic diseases.
During the last 30 years, pollen sensitization has increased notably in the city of Toledo, coinciding with a notable increase in most pollen concentrations collected in the atmosphere of Toledo.
Cupressaceae pollen is the most prevalent in the atmosphere, with a threefold increase in clinical sensitization, rising from 20% in the 1995 study to 45% in the 2023 study [17]. Possible reasons for this dramatic increase include, on the one hand, the urban profile of the city, with a large number of residential areas, parks, and garden areas, and, on the other hand, the greater allergenicity of this pollen as a consequence of environmental contamination. In our area, Cupressus arizonica pollen from places with high levels of traffic (highways) has been shown to express a panallergen (Cup a 3, thaumatin) that enhances its sensitizing capacity compared with pollen from rural areas [14].
Olive pollen is the second most prevalent type of pollen in Toledo and exhibits considerable interannual variation, with an increase in concentration during the study period. Additionally, sensitization to olive pollen increased by 10% during the study period (1995 vs. 2023). The characteristics of this type of pollen include a high travel capacity, extending hundreds of kilometers from its place of origin [30,31]. The increase in extreme meteorological phenomena concomitant with climate change facilitates the displacement of olive pollen from the olive-growing provinces of the southern portion of the peninsula (Jaén, Córdoba, and Granada) to the city of Toledo [32,33]. These phenomena have important clinical repercussions, since they prolong the pollen season and present a risk of greater symptomatic intensity due to increased allergenic power with pollen intruding from other areas, such as in the case of the Portuguese city of Évora with respect to Córdoba. In that case, the concentration of Ole e 1 in pollen from Córdoba was quintuple the concentration of Ole e 1 in local pollen [34].
Poaceae pollen is the most universal and allergenic type; thus, in the 1995 study, very high levels of sensitization (80%) were already observed, with a slight increase (6%) in the present study. Like the other types of pollen mentioned, the concentration of Poaceae pollen showed significant year-to-year variability, with an increasing trend over time. Several studies have demonstrated the effect of pollutants on Poaceae pollen, namely, a greater allergenicity, which induces an increase in symptoms, episodes of bronchospasm, and clinical decompensation in allergic patients [4,5,7,35]. However, the levels of pollutants in Toledo were low, especially those related to vehicle traffic and industrial activities (NOx, PM10, and PM2.5). These good environmental values are linked to the application of the different measures taken by the Castilla-La Mancha Air Quality Department to limit exposure to pollutants among the population of Toledo.
The population in Toledo currently shows a high degree of sensitivity to Amaranthaceae pollen (66%), representing a 6% increase with respect to that in 1995. This slight increase occurred despite a slight decrease in the concentration of pollen between the two stages of this study. This lower amount of pollen contrasts with the increase observed in neighboring areas, such as Alcázar de San Juan or the Mediterranean area, which have a greater prevalence of Amaranthaceae pollen [36,37]. The reduction in Amaranthaceae pollen in Toledo is probably due to urban modifications, with fewer agricultural areas, or due to the extreme increase in temperatures in summer affecting the phenology of Amaranthaceae plants.
The plane tree grows quickly, tolerates pollution, and has a brief but intense pollination period. Its pollination period is also the shortest among the environmental taxa analyzed, and for this reason, sycamore plane tree pollen reached values that widely exceed its threshold of clinical response. In this manner, sensitization to plane tree pollen levels also increased over the 30 analyzed years (9%). The high rate of polysensitization (90%) in those allergic to plane tree pollen may be due to panallergens in its components [36]. The LTP of plane tree (Pla a 3) affects almost a quarter of sensitized patients and is associated with allergies to pollen and plant foods [38].
The levels of Plantago spp. pollen slightly increased (5%) over the 30 years of study. The clinical value of Plantago spp. was difficult to determine, since its maximum peak coincided with that of Poaceae. However, in years of low rainfall, Plantago spp. has notable relevance [39].
Urticaceae pollen, specifically Parietaria spp. pollen, is one of the most important causes of pollinosis in the Mediterranean region. However, in the central Iberian Peninsula, this pollen is not highly relevant at the clinical level [18,25].
Allergy to Quercus ilex pollen is controversial. In 1988, Fernández-Caldas reported difficulty in elucidating the clinical relevance of oak allergens because of their atmospheric presence together with other potent allergens such as ragweed and Poaceae pollen or Alternaria [40]. In an epidemiological study in Mérida, Prados et al. [41] did not find individuals monosensitive to holm oak pollen, and provocation tests were negative. On the other hand, Lluch-Bernal et al. [42] demonstrated sensitization to Quercus ilex in 22.9% of adults and 56% of children in Madrid, with positive nasal provocation in all cases. A total of 60.5% of patients were sensitized to a panallergen (Que i 1, PR10), which may explain some of the sensitization and the relationship between its prevalence in contaminated vs. uncontaminated areas. The prevalence in the population of Toledo is similar to that of the population in Madrid, i.e., with 29% sensitization to this type of pollen. The differences between Madrid and other neighboring areas may reflect the effects of climate change, according to recent European studies that showed that some types of pollen, but not all, are increasing in severity and season duration and experiencing an earlier onset [43]. A follow-up with patients using a chart of symptoms would likely enable a clearer understanding of the clinical relevance of Q. ilex pollen, since its co-occurrence with Gramineae and olive tree pollen and Alternaria spores during the pollination season obscures the results [5,38].
Pistacia terebinthus (cornicabra) pollen levels slightly increased over the study period in Toledo. Similarly, sensitization to this type of pollen has slightly increased over the last 30 years (12% vs. 14%). Keynan [44] demonstrated a higher sensitization rate in Israel than in Toledo (31%), and Velasco-Jiménez [45] detailed its phenological characteristics in Córdoba, with pollination in March–April and the risk of possible allergenicity. Similarly, our group presented an epidemiological study two decades ago on its possible allergenicity [46]. Monitoring patients allergic to Pistacia terebinthus to determine its clinical repercussions is convenient during its pollen season.
Among allergenic fungi, Alternaria is noteworthy because of its presence in the atmosphere during most of the year, with its period of greatest allergenicity occurring during the spring and autumn months, which are associated with mild temperatures and high humidity. During the 30 years of study, Alternaria spore concentrations increased in Toledo, with maximum values occurring during the summer months; however, high temperatures suppress the release of its main allergen (Alt a 1), so symptoms in summer are more moderate [47]. Polimood et al. [48] demonstrated an interaction between Alternaria and Poaceae pollen in Cambridge. Gramineae plants pollinate earlier, which facilitates asthma attacks in patients allergic to Alternaria [23]. In addition, this effect is enhanced on stormy days, when spores break, thus facilitating access to bronchial trees, subsequently causing severe exacerbations of asthma [1,49].

5. Conclusions

The average temperature in Toledo increased by 1.2 °C between 1994 and 2023, which has led to significant changes in pollination patterns. This warming has been directly correlated with increased pollen production, longer pollen seasons, and altered flowering periods.
This study identified 20 pollen taxa in the Toledo atmosphere, the most prevalent of which were Cupressaceae (27%), Olea europaea (21.62%), and Quercus spp. (21.12%). Most types of pollen have experienced significant temporal increases, with some doubling or even quadrupling in abundance, as in the case of Platanus pollen.
While the abundances of most atmospheric pollutants (PM10, PM2.5, and NO2) have decreased, ozone levels have increased slightly—a finding that is particularly relevant, since O3 enhances the allergenic capacity of pollen.
The greatest increase was observed in allergic sensitization: the abundance of Cupressus arizonica increased from 18% to 47% between 1995 and 2023. Phleum pratense remained the most prevalent allergen (84%), followed by Olea europaea (77%) and Salsola kali (69%).
Toledo is experiencing the consequences of climate change through changes in its aerobiological profile, with direct implications for public health. The combination of high temperatures, increasing pollen concentrations, and the presence of pollutants such as O3 creates an increased risk for those with allergies, in addition to increases in ornamental plants in parks and gardens.
In summary, a combination of environmental and infectious factors seems to be responsible for the increase in allergic diseases.

Author Contributions

Conceptualization, A.M.d.G. and F.F.B.; methodology, A.M.d.G., F.F.B. and P.B.M.; software, A.M.d.G., F.F.B. and P.B.M.; validation, A.M.d.G. and F.F.B.; formal analysis, A.M.d.G. and P.B.M.; investigation, A.M.d.G. and F.F.B.; resources, A.M.d.G., F.F.B., R.G.R., P.B.M. and C.S.S.; data curation, A.M.d.G. and F.F.B.; writing—original draft preparation, A.M.d.G. and F.F.B.; writing—review and editing, A.M.d.G., F.F.B., R.G.R., P.B.M. and C.S.S.; visualization, A.M.d.G., F.F.B., R.G.R., P.B.M. and C.S.S.; supervision, A.M.d.G., F.F.B., R.G.R., P.B.M. and C.S.S.; project administration, A.M.d.G. All authors have read and agreed to the published version of the manuscript.

Funding

This research received no external funding.

Institutional Review Board Statement

The study was conducted in accordance with the Declaration of Helsinki and approved by the Ethics Committee of the University Hospital Complex of Toledo (16 March 2025).

Informed Consent Statement

Informed consent was obtained from all subjects involved in the study.

Data Availability Statement

The data supporting reported results can be requested by contacting the corresponding author.

Acknowledgments

The authors would like to thank all members of the Allergy Department at Toledo University Hospital, assistant doctors, resident doctors, nurses, nursing assistants, and secretaries.

Conflicts of Interest

The authors declare no conflicts of interest.

Abbreviations

The following abbreviations are used in this manuscript:
PM10Particulate matter 10
PM2.5Particulate matter 2.5
NO2Nitrogen dioxide
NONitrogen monoxide
O3Ozone

References

  1. D’Amato, G.; Chong-Neto, H.J.; Monge Ortega, O.P.; Vitale, C.; Ansotegui, I.; Rosario, N.; Haahtela, T.; Galan, C.; Pawankar, R.; Murrieta-Aguttes, M.; et al. The effects of climate change on respiratory allergy and asthma induced by pollen and mold allergens. Allergy 2020, 75, 2219–2228. [Google Scholar] [CrossRef]
  2. Strachan, D.P.; Rutter, C.E.; Asher, M.I.; Bissell, K.; Chiang, C.; Sony, A.E.; Ellwood, E.; Ellwood, P.; García-Marcos, L.; Marks, G.B.; et al. Worldwide time trends in prevalence of symptoms of rhinoconjunctivitis in children: Global Asthma Network Phase I. Pediatr. Allergy Immunol. 2022, 33, e13656. [Google Scholar] [CrossRef] [PubMed]
  3. García-Mozo, H. Poace pollen as the leading aeroallergen worldwide: A review. Allergy 2017, 72, 1849–1858. [Google Scholar] [CrossRef] [PubMed]
  4. Cabrera, M.; Subiza, J.; Fernández-Caldas, E.; Garzón García, B.; Moreno-Grau, S.; Subiza, J.L. Influence of environmental drivers on allergy to pollen grains in a case study in Spain (Madrid): Meteorological factors, pollutants, and airborne concentration of aeroallergens. Environ. Sci. Pollut. Res. 2021, 28, 53614–53628. [Google Scholar] [CrossRef]
  5. Feo-Brito, F.; Alfaya Arias, T.; Amo-Salas, M.; Somoza Alvarez, M.L.; Haroun Diaz, E.; Mayorga Mayorga, C.; Fernandez Santamaria, R.; Urra Ardanaz, J.M. Clinical impact and immunological alterations in asthmatic patients allergic to grass pollen subjected to high urban pollution in Madrid. Clin. Exp. Allergy 2022, 52, 530–539. [Google Scholar] [CrossRef]
  6. Schiavoni, G.; D’Amato, G.; Afferni, C. The dangerous liaison between pollens and pollution in respiratory allergy. Ann. Allergy Asthma Immunol. 2017, 118, 269–275. [Google Scholar] [CrossRef] [PubMed]
  7. Pacheco, S.E.; Guidos-Fogelbach, G.; Annesi-Maesano, I.; Pawankar, R.; D’ Amato, G.; Latour-Staffeld; Urrutia-Pereira, M.; Kesic, M.J.; Hernandez, M.L. Climate change and global issues in allergy and immunology. J. Allergy Clin. Immunol. 2021, 148, 1366–1377. [Google Scholar] [CrossRef]
  8. Verscheure, P.; Honnay, O.; Speybroeck, N.; Daelemans, R.; Bruffaerts, N.; Devleesschauwer, B.; Ceulemans, T.; Van Gerven, L.; Aerts, R.; Schrijvers, R. Impact of environmental nitrogen pollution on pollen allergy: A scoping review. Sci. Total Environ. 2023, 893, 164801. [Google Scholar] [CrossRef]
  9. Losol, P.; Sokolowska, M.; Hwang, Y.K.; Ogulur, I.; Mitamura, Y.; Yazici, D.; Pat, Y.; Radzikowska, U.; Ardicli, S.; Yoon, J.E.; et al. Epithelial Barrier Theory: The Role of Exposome, Microbiome, and Barrier Function in Allergic Diseases. Allergy Asthma Immunol. Res. 2023, 15, 705–724. [Google Scholar] [CrossRef]
  10. Stein, M.M.; Hrusch, C.L.; Gozdz, J.; Igartua, C.; Pivniouk, V.; Murray, S.E.; Ledford, J.G.; Marques dos Santos, M.; Anderson, R.L.; Metwali, N.; et al. Innate Immunity and Asthma Risk in Amish and Hutterite Farm Children. N. Engl. J. Med. 2016, 375, 411–421. [Google Scholar] [CrossRef]
  11. Lucas, J.A.; Gutierrez-Albanchez, E.; Alfaya, T.; Feo-Brito, F.; Gutiérrez-Mañero, F.J. Oxidative stress in ryegrass growing under different air pollution levels and its likely effects on pollen allergenicity. Plant Physiol. Biochem 2019, 135, 331–340. [Google Scholar] [CrossRef] [PubMed]
  12. Visez, N.; Hamzé, M.; Vandenbossche, K.; Occelli, F.; de Nadaï, P.; Tobon, Y.; Hájek, T.; Choël, M. Uptake of ozone by allergenic pollen grains. Environ. Pollut. 2023, 331 Pt 1, 121793. [Google Scholar] [CrossRef] [PubMed]
  13. Lucas, J.A.; Gutierrez-Albanchez, E.; Alfaya, T.; Feo Brito, F.; Gutierrez-Mañero, F.J. Search for New Allergens in Lolium perenne Pollen Growing under Different Air Pollution Conditions by Comparative Transcriptome Study. Plants 2020, 9, 1507. [Google Scholar] [CrossRef]
  14. Cortegano, I.; Civantos, E.; Aceituno, E.; del Moral, A.; Lopez, E.; Lombardero, M.; Del Pozo, V.; Lahoz, C. Cloning and expression of a major allergen from Cupressus arizonica pollen, Cup a 3, a PR-5 protein expressed under polluted environment. Allergy 2004, 59, 485–490. [Google Scholar] [CrossRef]
  15. Montoro, J.; Antolín-Amérigo, D.; Artés, M.; Izquierdo-Domínguez, A.; Zapata, J.J.; Mur, P.; Carrillo, T.; Antépara, I.; Feo, F.; Moral, A.; et al. Impact of Climate Change-Related Environmental Factors on Allergen Production and the Epidemiology and Severity of Allergic Diseases. J. Investig. Allergol. Clin. Immunol. 2024, 34, 358–366. [Google Scholar] [CrossRef]
  16. Montoro, J.; Antolín-Amérigo, D.; Izquierdo-Domínguez, A.; Zapata, J.J.; García-Gallardo, M.V.; González, R.; Armentia, A.; Rondón, C.; Fernández, M.M.; Pedrero, S.G.; et al. Climate Change-Associated Environmental Factors and Pollutants: Impact on Allergic Diseases, Epidemiology, Severity, and Health Care Burden. J. Investig. Allergol. Clin. Immunol. 2025, 35, 240–250. [Google Scholar] [CrossRef]
  17. Moral de Gregorio, A.; Senent Sánchez, C.; Cabañes Higuero, N.; García Villamuza, Y.; Gomez-Serranillos Reus, M. Pólenes alergénicos y polinosis en Toledo durante 1995–1996. Rev. Esp. Alergol. Inmunol. Clin. 1998, 13, 107–119. [Google Scholar] [PubMed]
  18. Moral de Gregorio, A.; Senent Sanchez, C.; Garcia Gomez, E.; Perez-Badia, R. Manuel de Alergopalinología: Plantas, Pólenes y Proteínas, 1st ed.; MIlkPost: Toledo, OH, USA, 2016. [Google Scholar]
  19. Montagnani, C.; Gentili, R.; Citterio, S. Ragweed is in the Air: Ambrosia L. (Asteraceae) and Pollen Allergens in a Changing World. Curr. Protein Pept. Sci. 2023, 24, 98–111. [Google Scholar] [CrossRef]
  20. Lara, B.; Rojo, J.; Costa, A.R.; Burgos-Montero, A.M.; Antunes, C.M.; Pérez-Badia, R. Atmospheric pollen allergen load and environmental patterns in central and southwestern Iberian Peninsula. Sci. Total Environ. 2023, 858 Pt 2, 159630. [Google Scholar] [CrossRef]
  21. Subiza, J.; Feo Brito, F.; Pola, J.; Moral, A.; Fernández, J.; Jerez, M.; Ferreiro, M. Pólenes alergénicos y polinosis en 12 ciudades españolas. Rev. Esp. Alergol. Inmunol. Clin. 1998, 13, 45–58. [Google Scholar]
  22. Subiza, J.; Cabrera, M.; Cárdenas-Rebollo, J.M.; Craciunescu, J.C.; Narganes, M.J. Influence of climate change on airborne pollen concentrations in Madrid, 1979–2018. Clin. Exp. Allergy J. Br. Soc. Allergy Clin. Immunol. 2022, 52, 574–577. [Google Scholar] [CrossRef] [PubMed]
  23. Connell, J.T. Quantitative intranasal pollen challenges. 3. The priming effect in allergic rhinitis. J. Allergy 1969, 43, 33–44. [Google Scholar] [CrossRef]
  24. Galán, C.; Cariñanos; González, P.; Alcázar, P.; Rodríguez, E. Manual de Calidad y Gestión de la Red Española de Aerobiología; Servicio de Publicaciones de la Universidad de Córdoba: Córdoba, Spain, 2007; ISBN 978-84-690-6354-5. [Google Scholar]
  25. Pola, J.; Subiza, F.J.; García, J.M.; Porcel, S.L. Pólenes de interés en Alergología en nuestro medio. In Tratado de Alergología; Ergon: Madrid, Spain, 2015; pp. 247–275. ISBN 978-84-16270-36-1. [Google Scholar]
  26. Dreborg, S. The skin prick test in the diagnosis of atopic allergy. J. Am. Acad. Dermatol. 1989, 21, 820–821. [Google Scholar] [CrossRef]
  27. Pickrell, A.; Smith, M.; Rojo, J. Climate change related phenological decoupling in species belonging to the Betulaceae family. Int. J. Biometeorol. 2023, 67, 195–209. [Google Scholar] [CrossRef]
  28. Sedghy, F.; Sankian, M.; Mogadhan, M.; Ghasemi, Z.; Mahmoudi, M.; Varasteh, A. Impact of traffic-related air pollution on the expression of Platanus orientalis pollen allergens. Int. J. Biometeorol. 2017, 6, 1–9. [Google Scholar] [CrossRef] [PubMed]
  29. Zhou, S.; Wang, X.; Lu, S.; Yao, C.; Zhang, L.; Lao, R.; Liu, X.; Zhang, W.; Li, S.; Wang, W.; et al. Characterization of allergenicity of Platanus pollen allergen a 3 (Pla a 3) after exposure to NO2 and O3. Environ. Pollut. 2021, 278, 116913. [Google Scholar] [CrossRef]
  30. Galera, M.D.; Elvira-Rendueles, B.; Moreno, J.M.; Negral, L.; Ruiz-Abellón, M.C.; García-Sánchez, A.; Moreno-Grau, S. Analysis of airborne Olea pollen in Cartagena (Spain). Sci. Total Environ. 2018, 622–623, 436–445. [Google Scholar] [CrossRef] [PubMed]
  31. Rojo, J.; Orlandi, F.; Pérez-Badia, R.; Aguilera, F.; Ben Dhiab, A.; Bouziane, H.; de la Guardia, C.D.; Galán, C.; Gutiérrez-Bustillo, A.M.; Moreno-Grau, S.; et al. Modeling olive pollen intensity in the Mediterranean region through analysis of emission sources. Sci. Total Environ. 2016, 551–552, 73–82. [Google Scholar] [CrossRef]
  32. Brito, F.F.; Gimeno, P.M.; Carnés, J.; Martín, R.; Fernández-Caldas, E.; Lara, P.; López-Fidalgo, J.; Guerra, F. Olea europaea pollen counts and aeroallergen levels predict clinical symptoms in patients allergic to olive pollen. Ann. Allergy Asthma Immunol. 2011, 106, 146–152. [Google Scholar] [CrossRef] [PubMed]
  33. Penedos, C.; Salamanca, G.; Tavares, B.; Fonseca, J.; Carreiro-Martins, P.; Rodrigues-Alves, R.; Moral de Gregorio, Á.; Valero, A.; Branco Ferreira, M. Aerobiology of Olive Pollen (Olea europaea L.) in the Atmosphere of the Iberian Peninsula. Atmosphere 2024, 15, 1087. [Google Scholar] [CrossRef]
  34. Galan, C.; Antunes, C.; Brandao, R.; Torres, C.; Garcia-Mozo, H.; Caeiro, E.; Ferro, R.; Prank, M.; Sofiev, M.; Albertini, R.; et al. Airborne olive pollen counts are not representative of exposure to the major olive allergen Ole e 1. Allergy 2013, 68, 809–812. [Google Scholar] [CrossRef] [PubMed]
  35. Marques Mejías, M.A.; Tomás Pérez, M.; Hernández, I.; López, I.; Quirce, S. Asthma Exacerbations in the Pediatric Emergency Department at a Tertiary Hospital: Association With Environmental Factors. J. Investig. Allergol. Clin. Immunol. 2019, 29, 365–370. [Google Scholar] [CrossRef] [PubMed]
  36. Burgos-Montero, A.M.; Sánchez-García, A.M.; Feo-Brito, F.; Pérez-Badia, R. Primera aproximación a la caracterización del espectro polínico y presencia del alérgeno Sal k 1 en la atmósfera de Alcázar de San Juan (Ciudad Real). Rev. Salud Ambient. 2017, 17, 157–164. [Google Scholar]
  37. Villalba, M.; Barderas, R.; Mas, S.; Colás, C.; Batanero, E.; Rodríguez, R. Amaranthaceae pollens: Review of an emerging allergy in the mediterranean area. J. Investig. Allergol. Clin. Immunol. 2014, 24, 371–381. [Google Scholar] [PubMed]
  38. Nuñez Borque, E.; Betancor, D.; Fernández Bravo, S.; Gómez Cardeñosa, A.; Esteban, V.; Garrido Arandia, M.; de Las Heras, M.; Pastor Vargas, C.; Cuesta Herranz, J. Allergen Profile of London Plane Tree Pollen: Clinical and Molecular Pattern in Central Spain. J. Investig. Allergol. Clin. Immunol. 2022, 32, 367–374. [Google Scholar] [CrossRef]
  39. González-Parrado, Z.; Fernández-González, D.; Camazón, B.; Valencia-Barrera, R.M.; Vega-Maray, A.M.; Asturias, J.A.; Monsalve, R.I.; Mandrioli, P. Molecular aerobiology—Plantago allergen Pla l 1 in the atmosphere. Ann. Agric. Environ. Med. 2014, 21, 282–289. [Google Scholar] [CrossRef]
  40. Fernandez-Caldas, E.; Swanson, M.C.; Pravda, J.; Welsh, P.; Yunginger, J.W.; Reed, C.E. Immunochemical Demonstration of Red Oak Pollen Aeroallergens outside the Oak Pollination Season. Grana 1989, 28, 205–209. [Google Scholar] [CrossRef]
  41. Prados, M.; Aragon, R.; Carranco, M.I.; Martinez, A.; Martinez, J. Assessment of sensitization to holm oak (Quercus ilex) pollen in the Mérida area (Spain). Allergy 1995, 50, 456–459. [Google Scholar] [CrossRef]
  42. Lluch-Bernal, M.; Pedrosa, M.; Domínguez-Ortega, J.; Colque-Bayona, M.; Correa-Borit, J.; Phillips-Anglés, E.; Gómez-Traseira, C.; Quirce, S.; Rodríguez-Pérez, R. Sensitization to Quercus ilex Pollen Is Clinically Relevant in Patients With Seasonal Pollen Allergy. J. Investig. Allergol. Clin. Immunol. 2024, 34, 338–340. [Google Scholar] [CrossRef]
  43. Adams-Groom, B.; Selby, K.; Derrett, S.; Frisk, C.A.; Pashley, C.H.; Satchwell, J.; King, D.; McKenzie, G.; Neilson, R. Pollen season trends as markers of climate change impact: Betula, Quercus and Poaceae. Sci. Total Environ. 2022, 831, 154882. [Google Scholar] [CrossRef]
  44. Keynan, N.; Tamir, R.; Waisel, Y.; Reshef, A.; Spitz, E.; Shomer-Ilan, A.; Geller-Bernstein, C. Allergenicity of the pollen of Pistacia. Allergy 1997, 52, 323–330. [Google Scholar] [CrossRef]
  45. Velasco-Jiménez, M.J.; Arenas, M.; Alcázar, P.; Galán, C.; Domínguez-Vilches, E. Aerobiological and phenological study of Pistacia in Córdoba city (Spain). Sci. Total Environ. 2015, 505, 1036–1042. [Google Scholar] [CrossRef] [PubMed]
  46. Jiménez Lara, M.; Moral de Gregorio, A.; Núñez Aceves, A.; Rodríguez, R.; Arenas, M.; Senent Sanchez, C. Pistacea terebinthus, una nueva polinosis en España. Rev. Esp. Alergol. Inmunol. Clínica 2003, 18, 152–153. [Google Scholar]
  47. Brito, F.F.; Alonso, A.M.; Carnés, J.; Martín-Martín, R.; Fernández-Caldas, E.; Galindo, P.A.; Alfaya, T.; Amo-Salas, M. Correlation between Alt a 1 levels and clinical symptoms in Alternaria alternata-monosensitized patients. J. Investig. Allergol. Clin. Immunol. 2012, 22, 154–159. [Google Scholar] [PubMed]
  48. Pulimood, T.B.; Corden, J.M.; Bryden, C.; Sharples, L.; Nasser, S.M. Epidemic asthma and the role of the fungal mold Alternaria alternata. J. Allergy Clin. Immunol. 2007, 120, 610–617. [Google Scholar] [CrossRef]
  49. Targonski, P.V.; Persky, V.W.; Ramekrishnan, V. Effect of environmental molds on risk of death from asthma during the pollen season. J. Allergy Clin. Immunol. 1995, 95, 955–961. [Google Scholar] [CrossRef]
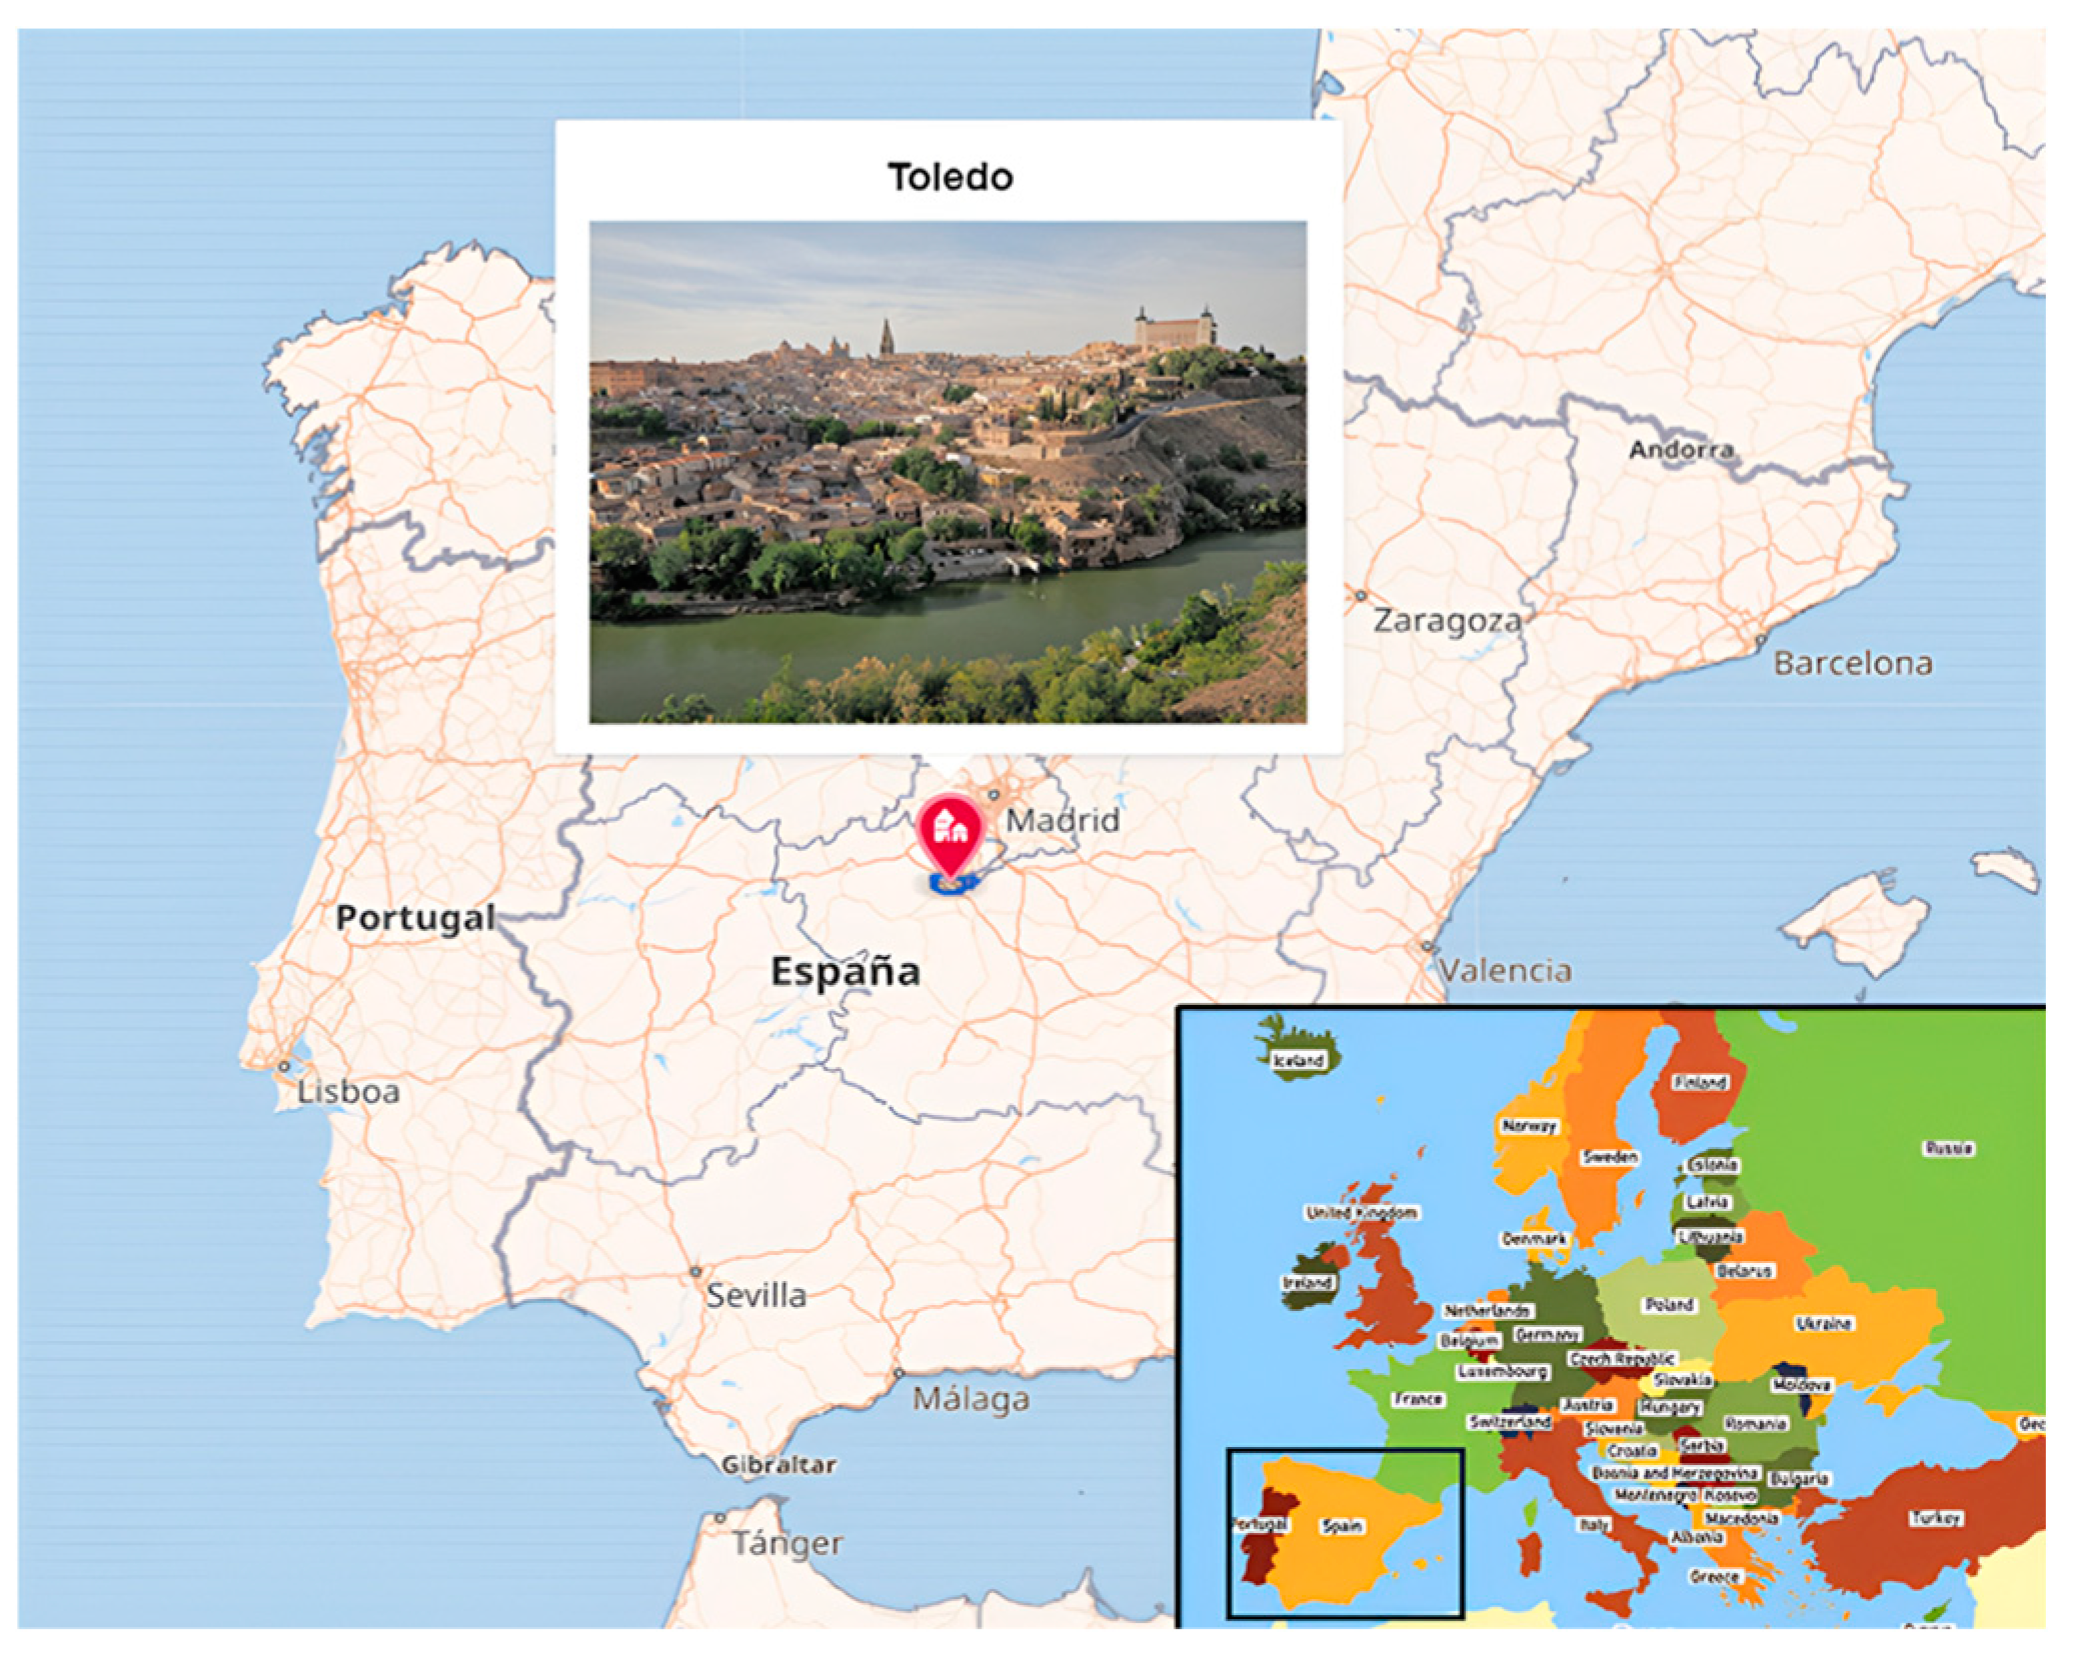
Figure 1. Map showing the location of Toledo in central Spain (Europe).
Atmosphere 16 00981 g001
Figure 2. Average annual concentrations of total pollen in Toledo (1994–2023).
Atmosphere 16 00981 g002
Figure 3. Percentages of pollen in the atmosphere of Toledo (1994–2023).
Atmosphere 16 00981 g003
Figure 4. Average concentrations of Olea europaea (a), Fraxinus spp. (b), Pinus spp. (c), Pistacia spp. (d), Platanus spp. pollen (e), and Alternaria alternata spores (f) in Toledo (1994–2023, in 5-year intervals).
Atmosphere 16 00981 g004aAtmosphere 16 00981 g004b
Figure 5. Average annual temperature in Toledo (1920–2023).
Atmosphere 16 00981 g005
Figure 6. Annual accumulated precipitation in Toledo (1920–2023).
Atmosphere 16 00981 g006
Figure 7. Average annual concentrations of chemical pollutants in Toledo (1999–2023).
Atmosphere 16 00981 g007
Figure 8. Scatter plot of annual Amaranthaceae pollen concentrations and mean temperature in August.
Atmosphere 16 00981 g008
Figure 9. Prevalence of sensitivity in patients allergic to pollen in Toledo (1995 and 2023).
Atmosphere 16 00981 g009
Table 1. Average annual pollen integral, peak concentration day, and maximum annual pollen integral in Toledo (1994–2023).
PollenAverage Annual Pollen Integral (grains/m3)Peak Concentration Day (grains/m3)Maximum Annual Pollen Integral (grains/m3) (year)
Cupressaceae13.735 (26.53%)3.734 (26 January 2014)33.095 (2014)
Olea europaea11.059 (21.62%)5.064 (30 May 1999)21.893 (2013)
Quercus spp.10.806 (21.12%)3.456 (28 April 2002)25.111 (2002)
Poaceae 5.272 (10.3%)1.320 (18 May 2003)9.747 (2016)
Pinus spp.1.939 (3.79%)420 (17 June 2018)4.232 (2018)
Urticaceae1.321 (2.58%)452 (8 March 2017)3.348 (2020)
Plantago spp.1.269 (2.48%)210 (24 May 2008)2.282 (2020)
Platanus spp.1.025 (2.00%)668 (8 April 2018)2.988 (2019)
Amaranthaceae932 (1.72%)62 (2 September 2007)1.129 (2022)
Rumex spp.861 (1.68%)164 (10 June 1998)2.287 (1998)
Morus spp.463 (0.90%)216 (7 April 1999)1.910 (2023)
Pistacia spp.440 (0.86%)401 (6 April 2001)2.630 (2023)
Populus spp.427 (0.83%)112 (20 February 2020)1.046 (2022)
Artemisia spp.382 (0.75%)92 (13 November 1998)1.073 (1998)
Fraxinus spp.374 (0.73%)92 (2 February 2016)962 (2019)
Ulmus spp.225 (0.44%)84 (9 February 2019)576 (2018)
Asteraceae
(no Artemisia)
214 (0.42%)72 (20 May 2000)414 (1996)
Alnus spp.190 (0.37%)124 (26 January 2013)566 (2013)
Carex spp.145 (0.27%)44 (28 May 1995)366 (1998)
Ericaceae83 (0.16%)34 (9 May 2021)238 (2023)
Table 2. Correlations between meteorological variables and chemical pollutants in Toledo (1999–2023).
PM10PM2.5SO2NO2NONOxCOO3
Mean
temp
0.202 **0.090 **−0.095−0.320 **−0.477 **−0.323−0.145 **0.617 **
<0.001<0.001<0.001<0.001<0.001<0.001<0.001<0.001
Min
temp
0.142 **0.041−0.112 **−0.388 **−0.521 **−0.378 **−0.145 **0.616 **
<0.0010.004<0.001<0.001<0.001<0.001<0.001<0.001
Max
temp
0.2560.145 **−0.072−0.243 **−0.412 **−0.253 **−0.1370.585 **
<0.001<0.001<0.001<0.001<0.001<0.001<0.001<0.001
Rain−0.202 **−0.155 **−0.042 **−0.141 **−0.100 **−0.152 **0.016−0.050 **
<0.001<0.001<0.001<0.001<0.001<0.0010.185<0.001
Wind
Speeed
−0.110 **−0.233 **−0.069 **0.452 **−0.439 **−0.512 **−0.051 **0.471 **
<0.001<0.001<0.001<0.001<0.0010.015<0.001<0.001
Thermal
range
0.3350.267 **0.046 *0.143 **−0.026 **0.113 **−0.057 **0.241 **
<0.001<0.001<0.001<0.0010.015<0.001<0.001<0.001
Insolation−0.155 **0.072 **−0.032−0.015 **−0.247 **−0.121 **−0.118 **0.510 **
<0.001<0.0010.003<0.001<0.001<0.001<0.001<0.001
Mean
pressure
0.190 **0.226 **0.049 **0.350 **0.380 **0.398 **0.060 **−0.402 **
<0.001<0.001<0.001<0.001<0.001<0.001<0.001<0.001
Humidity−0.177 **−0.0250.058 **0.199 *0.377 **0.221 **0.164 **−0.629
<0.0010.083<0.001<0.001<0.001<0.001<0.001<0.001
Solar
radiation
0.172 **−0.009−0.001−0.184 **−0.366 **−0.265 **−0.084 **0.681 **
<0.0010.6040.933<0.001<0.001<0.001<0.001<0.001
* The correlation is significant at the 0.05 level; ** The correlation is significant at the 0.01 level.
Table 3. (A) Correlations between meteorological variables and pollen in Toledo (1994–2023). (B) Correlations between meteorological variables and pollen in Toledo (1994–2023).
(A)
AmarantaceaeArtemisiaBetulaCupressaceaeFraxinusOleaPlantago
Mean
temp
0.684 **−0.0050.029 **−0.547 **−0.362 **0.3590.211 **
<0.0010.4710.002<0.001<0.001<0.001<0.001
Min
temp
0.661 *0.0010.008−0.565 **−0.374 **0.337 **0.172 **
<0.0010.9190.401<0.001<0.001<0.001<0.001
Max
temp
0.678 **−0.0070.038−0.512 **−0.330 **0.358 **0.221
<0.0010.471<0.001<0.001<0.001<0.001<0.001
Rain−0.203 **−0.027 **−0.0110.042 **−0.009−0.049 **−0.029 **
<0.0010.0050.241<0.0010.342<0.0010.002
Wind
Speeed
0.097 **−0.119 **0.015−0.083 **−0.043 **0.178 **0.151 **
<0.001<0.0010.114<0.001<0.001<0.001<0.001
Thermal
range
0.389−0.021 **−0.021 *−0.184 **−0.084 **0.209 **0.157 **
<0.0010.0270.027<0.001<0.001<0.001<0.001
Insolation0.494 **−0.079 **0.078 **−0.316 **−0.171 **0.338 **−0.144 **
<0.001<0.001<0.001<0.001<0.001<0.001<0.001
Mean
pressure
−0.122 **0.060 **−0.027 **0.224 **0.181 **−0.160 **0.264 **
<0.001<0.0010.005<0.001<0.001<0.001<0.001
Humidity−0.596 **0.070−0.047 **0.375 *0.207 **−0.326 **−0.208 **
<0.001<0.001<0.001<0.001<0.001<0.001<0.001
Solar
radiation
0.553 **−0.126 **0.115 **−0.429 **−0.261 **0.468 **0.387 **
<0.001<0.001<0.001<0.001<0.001<0.001<0.001
(B)
PlatanusPistaciaPoaceaeQuercusUrticaceaeTotal PollenAlternaria
Mean
temp
−0.083 **−0.026 **0.333 **0.080 **−0.070 **0.026 **0.386 **
<0.0010.007<0.001<0.001<0.001<0.001<0.001
Min
temp
−0.129 *−0.056 **0.277 **0.040 **−0.127 **−0.047 **0.370 **
<0.001<0.001<0.001<0.001<0.001<0.001<0.001
Max
temp
−0.059 **−0.0150.357 **0.091 **−0.033 **0.073 **0.379 **
<0.0010.110<0.001<0.001<0.001<0.001<0.001
Rain0.019 *−0.040 **−0.135 **0.045 **−0.070 **−0.091 **−0.054 **
0.048<0.001<0.001<0.001<0.001<0.001<0.001
Wind
Speeed
0.048 **−0.063 **0.188 **0.139 **0.036 **0.141 **0.080 **
<0.001<0.001<0.001<0.001<0.001<0.001<0.001
Thermal
range
0.038 **0.020 *0.288 ***0.086 **0.093 **0.196 **0.190 **
<0.0010.034<0.001<0.001<0.001<0.001<0.001
Insolation0.017−0.034 **0.420 **0.150 **0.092 **0.213 **0.290 **
0.077<0.001<0.001<0.001<0.001<0.001<0.001
Mean
pressure
−0.034 **−0.094 **−0.105 **−0.165 **0.060 **0.013−0.130 **
<0.001<0.001<0.001<0.001<0.0010.190<0.001
Humidity0.0020.019−0.370 **−0.111 *−0.017 **−0.135 **−0.280 **
0.8320.074<0.001<0.001<0.001<0.001<0.001
Solar
radiation
0.074 **0.111 **0.529 **0.301 **0.113 **0.266 **0.321 **
<0.001<0.001<0.001<0.001<0.001<0.001<0.001
* The correlation is significant at the 0.05 level; ** The correlation is significant at the 0.01 level.
Table 4. (A) Correlations between chemical pollutants and pollen in Toledo (1999–2023). (B) Correlations between chemical pollutants and pollen in Toledo (1999–2023).
(A)
AmaranthaceaeAsteraceaeBetulaCupressaceaeFraxinusOleaPlantago
PM100.186 **0.0760.025−0.118−0.0660.032−0.058 **
<0.001<0.0010.024<0.001<0.0010.004<0.001
PM2.50.058 **−0.003−0.045 **−0.0020.028 *0.001−0.085 **
<0.0010.8110.0020.9050.0470.933<0.001
SO2−0.0410.0160.008−0.017−0.0130.0040.016
<0.0010.1470.4740.1170.2280.6890.144
NO2−0.190 **−0.161 **−0.032 **0.184 **0.181 **−0.272 **−0.246 **
<0.001<0.0010.003<0.001<0.001<0.001<0.001
NO−0.308 **−0.183−0.032 **0.249 **0.207 **−0.290 **−0.239 **
<0.001<0.0010.003<0.001<0.001<0.001<0.001
NOX−0.181−0.209−0.049 *0.241 **0.271 **−0.345−0.295 **
<0.001<0.0010.037<0.001<0.001<0.001<0.001
CO−0.058 **−0.0120.0140.039 **0.019−0.074 **−0.042 **
<0.0010.3230.2430.0020.126<0.001<0.001
O30.421 **0.288 **0.083 **−0.316 **−0.227 **0.443 **0.362 **
<0.001<0.001<0.001<0.001<0.001<0.001<0.001
(B)
PlatanusPistaciaPoaceaeQuercusUrticaceaeTotal PollenAlternaria
PM10−0.076 **−0.0750.029 **−0.100 **−0.089 **−0.031 **−0.072 **
<0.001<0.0010.007<0.001<0.0010.004<0.001
PM2.5−0.069 **−0.085 **−0.031 **−0.157 **−0.056 *−0.040 **0.057 **
<0.001<0.0010.031<0.001<0.0010.005<0.001
SO2−0.033 **−0.0180.0120.0030.0090.012−0.094 **
<0.0020.0940.2830.7700.4150.268<0.001
NO2−0.052 **−0.105 **−0.218 **−0.225 **−0.043 **−0.119 **−0.204 **
<0.001<0.001<0.001<0.001<0.001<0.001<0.001
NO−0.074 **−0.087−0.256 **−0.191 **−0.037 **−0.103 **−0.266 **
<0.001<0.001<0.001<0.001<0.001<0.001<0.001
NOX−0.096 **−0.130−0.225 *−0.251 **−0.046−0.081 **−0.214 **
<0.001<0.001<0.001<0.0010.052<0.001<0.001
CO−0.004 **−0.016−0.037 **0.0110.007−0.033 **−0.160 **
0.7700.1980.0030.3540.5850.008<0.001
O30.132 **0.1430.446 **0.305 **−0.113 **0.250 **0.299 **
<0.001<0.001<0.001<0.001<0.001<0.001<0.001
* The correlation is significant at the 0.05 level; ** The correlation is significant at the 0.01 level.
Disclaimer/Publisher’s Note: The statements, opinions and data contained in all publications are solely those of the individual author(s) and contributor(s) and not of MDPI and/or the editor(s). MDPI and/or the editor(s) disclaim responsibility for any injury to people or property resulting from any ideas, methods, instructions or products referred to in the content.