Article

Concentration Characteristics, Source Analysis, and Health Risk Assessment of Water-Soluble Heavy Metals in PM2.5 During Winter in Taiyuan, China

1
Shanxi Key Laboratory of Complex Air Pollution Control and Carbon Reduction, College of Environment and Ecology, Taiyuan University of Technology, Taiyuan 030024, China
2
Shanxi Ecological Environment Monitoring and Emergency Support Center (Shanxi Research Institute of Ecological and Environmental Sciences), Taiyuan 030027, China
3
CNNC No. 7 Research and Design Institute Co., Ltd., Taiyuan 030032, China
4
State Key Laboratory of Advanced Environmental Technology, Guangdong Provincial Key Laboratory of Environmental Protection and Resources Utilization, Guangzhou Institute of Geochemistry, Chinese Academy of Sciences, Guangzhou 510640, China
*
Authors to whom correspondence should be addressed.
Atmosphere 2025, 16(8), 980; https://doi.org/10.3390/atmos16080980 (registering DOI)
Submission received: 16 July 2025 / Revised: 10 August 2025 / Accepted: 15 August 2025 / Published: 17 August 2025
(This article belongs to the Section Air Quality and Health)

Abstract

To address the research gap on water-soluble heavy metals (WSHMs) in Taiyuan, China, we conducted a winter campaign (18–29 January 2019) at an urban site to measure fifteen WSHMs (Zn, Fe, Mn, Ba, Cu, Se, As, Sb, Sn, Pb, Ni, V, Ti, Cd, and Co). The mean concentration of total WSHMs (∑WSHMs) in PM2.5 was 209.17 ± 187.21 ng m−3. Notably, the mass concentrations of ∑WSHMs on heavy pollution days (291.01 ± 170.64 ng m−3) were 224.8% higher than those on mild pollution days (89.61 ± 55.36 ng m−3). Principal component analysis (PCA) was applied in combination with absolute principal component score–multiple linear regression (APCS-MLR) to analyze pollution sources and their contributions. The results showed that the main sources of pollution were coal combustion and vehicle emissions (42.50%), along with the metallurgical industry and natural dust (34.47%). The carcinogenic and non-carcinogenic risks of WSHMs were assessed for both adults and children based on the United States Environmental Protection Agency’s (U.S. EPA) assessment guidelines and the International Agency for Research on Cancer (IARC) database. Children faced higher non-carcinogenic risks (hazard index = 2.37) than adults (hazard index = 0.30), exceeding the safety threshold (hazard index = 1). The total carcinogenic risk reached 2.20 × 10⁻⁵, exceeding the threshold value (1 × 10⁻⁶) for carcinogenic risk. Water-soluble arsenic (As) dominated both carcinogenic and non-carcinogenic risks in winter and was the riskiest element. These findings provide an essential basis for controlling PM2.5-bound WSHMs in industrialized areas.

1. Introduction

PM2.5 (particulate matter with aerodynamic diameter ≤ 2.5 μm) poses greater health risks than PM10 (particulate matter with aerodynamic diameter ≤ 10 μm) due to its deeper lung penetration and systemic circulation [1,2]. More critically, these risks are further amplified by toxic components, such as heavy metals, carried by PM2.5. Despite their trace concentrations in PM2.5, these metals pose a dual threat to public health and the ecosystem due to their bioaccumulation potential and toxicity mechanisms [3,4,5,6]. Water-soluble heavy metals (WSHMs) exhibit higher toxicity due to their enhanced environmental mobility and high bioavailability. Their solubility facilitates transport through dry and wet deposition into surface soils and water bodies, where they accumulate [7,8,9,10]. Moreover, their high bioavailability enables deeper penetration into biological systems, increasing potential ecological and health risks [11,12,13]; they can also affect atmospheric aerosol composition. Water-soluble Fe and Mn catalyze the oxidation of S(IV) in the aqueous phase, playing a crucial role in ambient sulfate formation [14,15,16]. Wang et al. observed that Mn(II)-catalyzed oxidation contributed to 92.5 ± 3.9% of sulfate formation during a haze event [15]. Studies also show that water-soluble Fe can react with organic components in atmospheric aerosols (such as catechol, dicarboxylic acids, and oxalate) to form secondary brown carbon, thereby enhancing atmospheric light absorption and radiative forcing [17,18,19]. These characteristics have made WSHMs a growing research focus in atmospheric chemistry and environmental science.
WSHMs in atmospheric particles originate from both anthropogenic sources (e.g., fossil fuel combustion, vehicular emissions) and natural sources (e.g., mineral dust, sea salt) [20,21,22]. Specifically, water-soluble Zn, Cd, Pb, As, and Se are mainly derived from fine particles of anthropogenic high-temperature combustion [10,23,24], and their mass concentrations fluctuate significantly with the intensity of human activities. For example, in Ho Chi Minh, concentrations of water-soluble Zn exhibited significant variability (ranging from 39 to 2780 ng m−3), primarily due to fluctuating anthropogenic emissions from nonferrous metal refineries and road vehicles [25]. As crustal metal elements, Fe and Ti primarily originate from coarse particles in natural soil dust [26], but their anthropogenic contributions from industrial activities cannot be ignored [27,28]. Research indicates that water-soluble heavy metals tend to accumulate in fine particles (PM2.5) [20,29,30,31]. For example, a study in Los Angeles found that the water-soluble mass concentrations of metals in PM2.5 were higher than those in coarse fraction (PM2.5–10), such as Pb (0.27 vs. 0.02 ng m−3), Zn (12.9 vs. 3.45 ng m−3), and Fe (8.44 vs. 2.58 ng m−3) [20]. Similarly, observations in Xiamen indicated substantially elevated levels of water-soluble Pb, V, As, and Se in PM2.5, with concentrations exceeding those in PM2.5–10 by factors of 41.5, 21.7, 16.2, and 13.6, respectively [31]. In addition to emission sources, the acidity of aerosols and their complexation with water-soluble organic matter or carboxylic acids can also influence the mass concentration of WSHMs [16,32,33]. Fang et al. demonstrated that insoluble Cu can be gradually mobilized by sulfuric acid, ultimately converting into soluble forms [32]. These factors collectively shape the environmental behavior and bioavailability of WSHMs in atmospheric particles.
WSHMs in atmospheric particles exhibit significant regional and seasonal variations. Urban areas generally show higher concentrations of water-soluble fractions (e.g., Zn, Cd, Pb, and As in PM2.5) than rural areas, primarily due to intensified anthropogenic emissions [34]. For example, during winter in Greece, the mass concentrations of WSHMs in the medium-sized city of Patras (208.26 ng m−3) were 2.98 times higher than those in the small town of Megalopolis (69.97 ng m−3) [34]. This contrast was largely driven by more frequent anthropogenic oil combustion activities (e.g., domestic heating, ship emissions, and traffic) in Patras [34]. In northern Chinese cities (Tianjin, Yantai), the mass concentrations of WSHMs in winter are generally higher than those in summer, which is due to increased coal-fired heating emissions [35]. Lower winter atmospheric boundary layers and frequent temperature inversions further trap pollutants near the ground [36,37]. However, an exception occurs in Los Angeles, where summer WSHM mass concentrations exceed winter levels [20], driven by the combined effects of elevated humidity and enhanced photochemical activity, leading to accelerated metal dissolution [38,39]. The concentrations of WSHMs also change significantly with the aggravation of PM2.5 pollution [23,40]. During an observation period in Guangzhou, the mass concentrations of WSHMs on polluted days were 3.53 times higher than those on days with excellent air quality [23].
The high bioavailability of WSHMs in atmospheric fine particles has raised concerns about their potential health risks, but studies assessing these risks remain limited. The United States Environmental Protection Agency’s (U.S. EPA) Health Risk Assessment Model has been employed to evaluate both the carcinogenic and non-carcinogenic risks of WSHMs [41,42]. Model calculations demonstrate that in Hanoi, Vietnam, water-soluble Cr(VI) and As exceeded the U.S. EPA’s acceptable carcinogenic risk threshold (1 × 10⁻⁶), suggesting significant carcinogenic potential [25]. In Xi’an, China, water-soluble Pb was found to pose notable non-carcinogenic risks to children (hazard index > 1) [21]. Additionally, water-soluble As was identified as the element exhibiting the highest carcinogenic risk in PM2.5, specifically observed in indoor environments across Greece [43] and in the urban areas of Iasi, Romania [44].
Given the demonstrated health risks and environmental effect of WSHMs, accurate quantification of these metals is crucial for both research and policy interventions. Square Wave Anodic Stripping Voltammetry (SWASV), especially when enhanced with carbonaceous nanomaterial and Fe3O4 nanoparticle-based sensors, provides a promising method for cost-effective detection of water-soluble heavy metals [45]. For applications requiring high-precision, multi-element, and robust quantification of WSHMs in complex PM2.5 extracts−particularly for reliable source apportionment and health risk assessment, Inductively Coupled Plasma Mass Spectrometry (ICP-MS) has become the established analytical technique of choice, meeting these critical analytical demands through its superior sensitivity and multi-element capabilities [34].
Taiyuan, the capital of Shanxi Province, is a typical coal-dependent industrial city [46]. Influenced by its topography and industrial structure, Taiyuan faces severe atmospheric PM2.5 pollution [47]. Current research in Taiyuan primarily focuses on total heavy metal concentrations in particulate matter, including studies of mass concentration, source apportionment, and health risk assessment [48,49,50], in addition to their ecological impacts on aquatic and soil ecosystems [51,52]. WSHMs show greater environmental mobility and higher cytotoxicity than particulate-bound fractions [53]. These properties are crucial for effective pollution control. However, their concentration characteristics, sources, and health risks have not been adequately studied in Taiyuan. In this study, we investigated the WSHMs present in PM2.5 during winter in Taiyuan and aimed to (1) analyze their concentration characteristics, (2) explore their sources, and (3) conduct a health risk assessment. The findings provide a scientific basis for the control of regional atmospheric PM2.5 pollution.

2. Materials and Methods

2.1. Sampling and Measurement

2.1.1. Sample Collection

The sampling site was situated on the rooftop (approximately 35 m above ground level) of the Boxue Building on the Yingxi Campus of Taiyuan University of Technology (37°51′ N, 112°31′ E). The site is located in the city center, surrounded by major traffic arteries, residential zones, and cultural and educational districts, which is a typical urban environment (Figure S1). A medium flow sampler (Tianhong TH-150, Wuhan, China, 100 L min−1) was used to collect PM2.5 samples. Equipment calibration and cutting head cleaning were completed prior to sampling. Each sample was collected continuously for 24 h; 90 mm diameter quartz fiber filters were used for sampling, which were baked in a muffle furnace at 450 °C for 4 h beforehand. Before and after sampling, the filters were balanced in a constant-temperature and -humidity chamber (T = 25 °C, RH = 50%) for 24 h and then weighed. The sampled filters were stored at −40 °C until analysis. The field blank sample underwent identical handling, storage, and weighing procedures as the ambient samples.
During the sampling period, the mean ambient temperature (T), relative humidity (RH), and wind speed (v) were −2.48 ± 2.47 °C, 37.3 ± 7.86%, and 1.29 ± 0.39 m s−1, respectively (Figure S2). As shown in Figure S1, Taiyuan’s basin topography (surrounded by mountains on three sides) significantly suppresses pollutant dispersion, particularly under low wind speeds (v < 2 m s−1 in 79.71% of sampling hours) [54,55]. In basin areas, the atmospheric thermal structure in the lower troposphere may form a vertical convergence layer between the boundary layer and the free troposphere. This layer acts as a lid to inhibit air diffusion, particularly in wintertime, where a strong warm lid exacerbates the accumulation of pollutants [56]. The basin terrain of Taiyuan and its winter weather conditions enable our dataset to be highly representative of the pattern of pollutant accumulation in Taiyuan during winter.

2.1.2. WSHMs Extraction and Measurements

The concentration of WSHMs was determined based on an extraction and analysis method described in a previous study [34]. For the extraction of WSHMs, the sampled quartz filters were processed as follows. A quarter of each filter was shredded and then added to 15 mL ultrapure water (18.2 MΩ cm) and ultrasonicated (30 °C) for 15 min; the ultrasonication was then repeated twice. The extract was filtered through a 0.45 μm polytetrafluoroethylene (PTFE) filter to remove insoluble particles or filter debris, then transferred into pre-cleaned (10% HNO3, rinsed with Milli-Q water) 10 mL polypropylene centrifuge tubes. To stabilize the aqueous phase and prevent adsorption of dissolved metals onto container walls, the filtrate was acidified with ultrapure HNO3 at a ratio of 0.2 mL acid per 10 mL of extract. These acidified extracts were subsequently analyzed for water-soluble fractions of Fe, Ti, V, Mn, Co, Ni, Cu, Zn, As, Se, Cd, Sn, Sb, Ba, and Pb using inductively coupled plasma mass spectrometry (iCAP Qc ICP-MS, Thermo Fisher, Waltham, MA, USA).

2.1.3. Auxiliary Data

The meteorological data, including T, RH, wind direction, and v, were provided by Shanxi Ecological Environment Monitoring and Emergency Support Center; they are provided in more detail in the Supporting Information. The 72 h air mass backward trajectories were calculated using the Hybrid Single Particle Lagrangian Integrated Trajectory (HYSPLIT) model (http://ready.arl.noaa.gov/HYSPLIT.php, accessed on 5 February 2025) in this study. The starting time was set to 4:00 UTC, and an altitude of 800 m was selected as the endpoint in the model.

2.2. Data Analysis

2.2.1. Principal Component Analysis (PCA)

Principal component analysis (PCA) was employed to identify the sources of the WSHMs found in PM2.5 in this study. As a source apportionment method recommended by the U.S. EPA [57], PCA begins with original element concentration data, calculates eigenvalues from variance–covariance matrices, and reduces dimensionality by synthesizing variables into fewer common factors. Factor loadings were computed to quantify variable contributions, with dominant components identified through their relative magnitudes. These components were then qualitatively interpreted as distinct pollution source types based on loading patterns and source profiles [58].

2.2.2. Absolute Principal Component Score–Multiple Linear Regression (APCS-MLR)

In this study, absolute principal component score–multiple linear regression (APCS-MLR) analysis was used to quantify the contributions of source factors (identified by PCA) as independent variables to the total metal mass concentration (dependent variable) [57,59]. Both standardized regression coefficients (β) and unstandardized coefficients, along with MLR analysis constants, were calculated to evaluate the contribution of each principal component to the total metal concentration [60]. The process of conversion from the principal factor scores to the absolute principal factor scores in the APCS-MLR receptor model is as follows:
( Ζ 0 ) i = 0 C i ¯ σ i
( A k ) j = i = 1 i S i j × ( Z 0 ) i
A P C S k j = ( A k ) j ( A 0 ) j
where (Z0)i denotes the standardized value when the content of heavy metal element i is 0. Ci is the mean value of heavy metal element i (mg kg−1). σi is the standard deviation of heavy metal element i. (A0)i represents the principal component score at absolute zero, j is the principal factor number, and Sij is the score coefficient of the j-th principal factor for heavy metal element i. (Ak)j is the score value of the j-th principal factor, where k is the sample number. APCSkj denotes the absolute principal factor score of the j-th principal factor for k-th sample.
When using the APCS-MLR model to calculate source contribution rates, the results may be negative. This introduces bias in the contribution rate calculation. To ensure the reliability of the results, all negative values must be converted to positive values using the absolute value function.
C i = i = 1 ( a i m × A P C S m ) + b i
P C i m = a i m × A P C S ¯ i m b i + m = 1 m a i m × A P C S i m ¯
P C i u = b i b i + m = 1 m a i m × A P C S i m ¯
Here, Ci represents the estimated concentration of heavy metal i, and bi is the constant term in the multivariate linear model. aim denotes the multivariate regression coefficient of source m on heavy metal i. APCSm represents the contribution of the m-th factor to Ci. aim × APCSm quantifies the contribution of source m to metal i. PCim is the contribution from a known source (source m) to heavy metal i, while PCiu denotes the contribution from unknown source u to heavy metal i. The term bi represents the contribution from unidentified sources. APCSim is defined as the mean of the absolute principal component factor scores across all samples for heavy metal i.

2.2.3. Health Risk Assessment

The health risk assessment included both non-carcinogenic and carcinogenic risk assessments. Reference values from health risk assessment models published by the U.S. EPA and the International Agency for Research on Cancer (IARC) were integrated to evaluate the human health risks associated with particulate matter-bound elements [41,42]. The average daily exposure dose (ADD, mg kg−1 day−1) of WSHMs through the ingestion (ing), dermal contact (der), and inhalation (inh) pathways were calculated using equations. The parameters of Equations (7)–(10) are provided in Table S1. Average daily exposure dose by ingestion (ADDing, mg kg−1 day−1):
A D D i n g = C × C F × ln g R × E F × E D B W × A T C a r / N o n - c a r
Average daily exposure dose by dermal contact (ADDder, mg kg−1 day−1):
A D D d e r = C × C F × S A × S L × A B S × E F × E D B W × A T C a r / N o n - c a r
Average daily exposure dose by inhalation (ADDinh, mg kg−1 day−1):
A D D i n h = C × ln h R × E F × E D P E F × B W × A T C a r / N o n - c a r
The non-carcinogenic risk of a single pollutant is quantified using the hazard quotient (HQ), which assesses the potential health risk magnitude. The cumulative non-carcinogenic risk is characterized by the hazard index (HI). This is calculated using Equation (10).
H I = H I = H Q i m = A D D N o n - c a r R f D
In the equation, RfD is the reference dose (mg (kg d)−1). The RfD values for heavy metal elements across different exposure routes are provided in Table S2. For non-cancer risk assessment, when HQ < 1, the risk from a single element is considered low or negligible; if HQ > 1, a non-cancer risk is indicated. For accumulative effects of multiple pollutants, if HI < 1, the combined risk remains small or negligible; if HI > 1, a non-cancer risk exists.
The cancer risk of a carcinogenic pollutant is derived from the lifetime average daily dose (LADD) for the ingestion (LADD = (ADDchild + ADDadult)car), dermal contact, and inhalation routes and expressed as the incremental lifetime cancer risk (ILCR). Equation (11) is calculated as follows:
I L C R = L A D D × S F
In the formula, SF is the slope factor mg (kg d)−1. The SF values of carcinogenic heavy metals via the respiratory inhalation pathway are shown in Table S2. If the ILCR is between 10−6 and 10−4, the pollutant is considered to have no carcinogenic risk; if it exceeds 10−6–10−4, it is considered unacceptable and there is a carcinogenic risk [61].

3. Results and Discussion

3.1. Concentration Characteristics of WSHMs

The mean PM2.5 concentration during the sampling period reached 144.90 ± 40.38 μg m−3. Based on the daily PM2.5 concentrations shown in the Figure 1, the 12 sampling days were categorized into two groups: mild pollution days (MDs) (19th, 20th, 21st, 23rd, and 25th), with PM2.5 concentrations ranging between 75 and 150 μg m−3, and heavy pollution days (HDs) (18th, 22nd, 24th, 26th, 27th, and 29th), where PM2.5 concentrations exceeded 150 μg m−3. As shown in Figure 1, although the PM2.5 concentration on January 28 was relatively low (115.82 μg m−3), the proportion of WSHMs in PM2.5 was the highest (0.32 μg m−3, accounting for 0.27% of PM2.5). Therefore, January 28 was classified as a special pollution day (SD) to highlight its unique pollution mechanism.

3.1.1. Overview of WSHMs Mass Concentrations

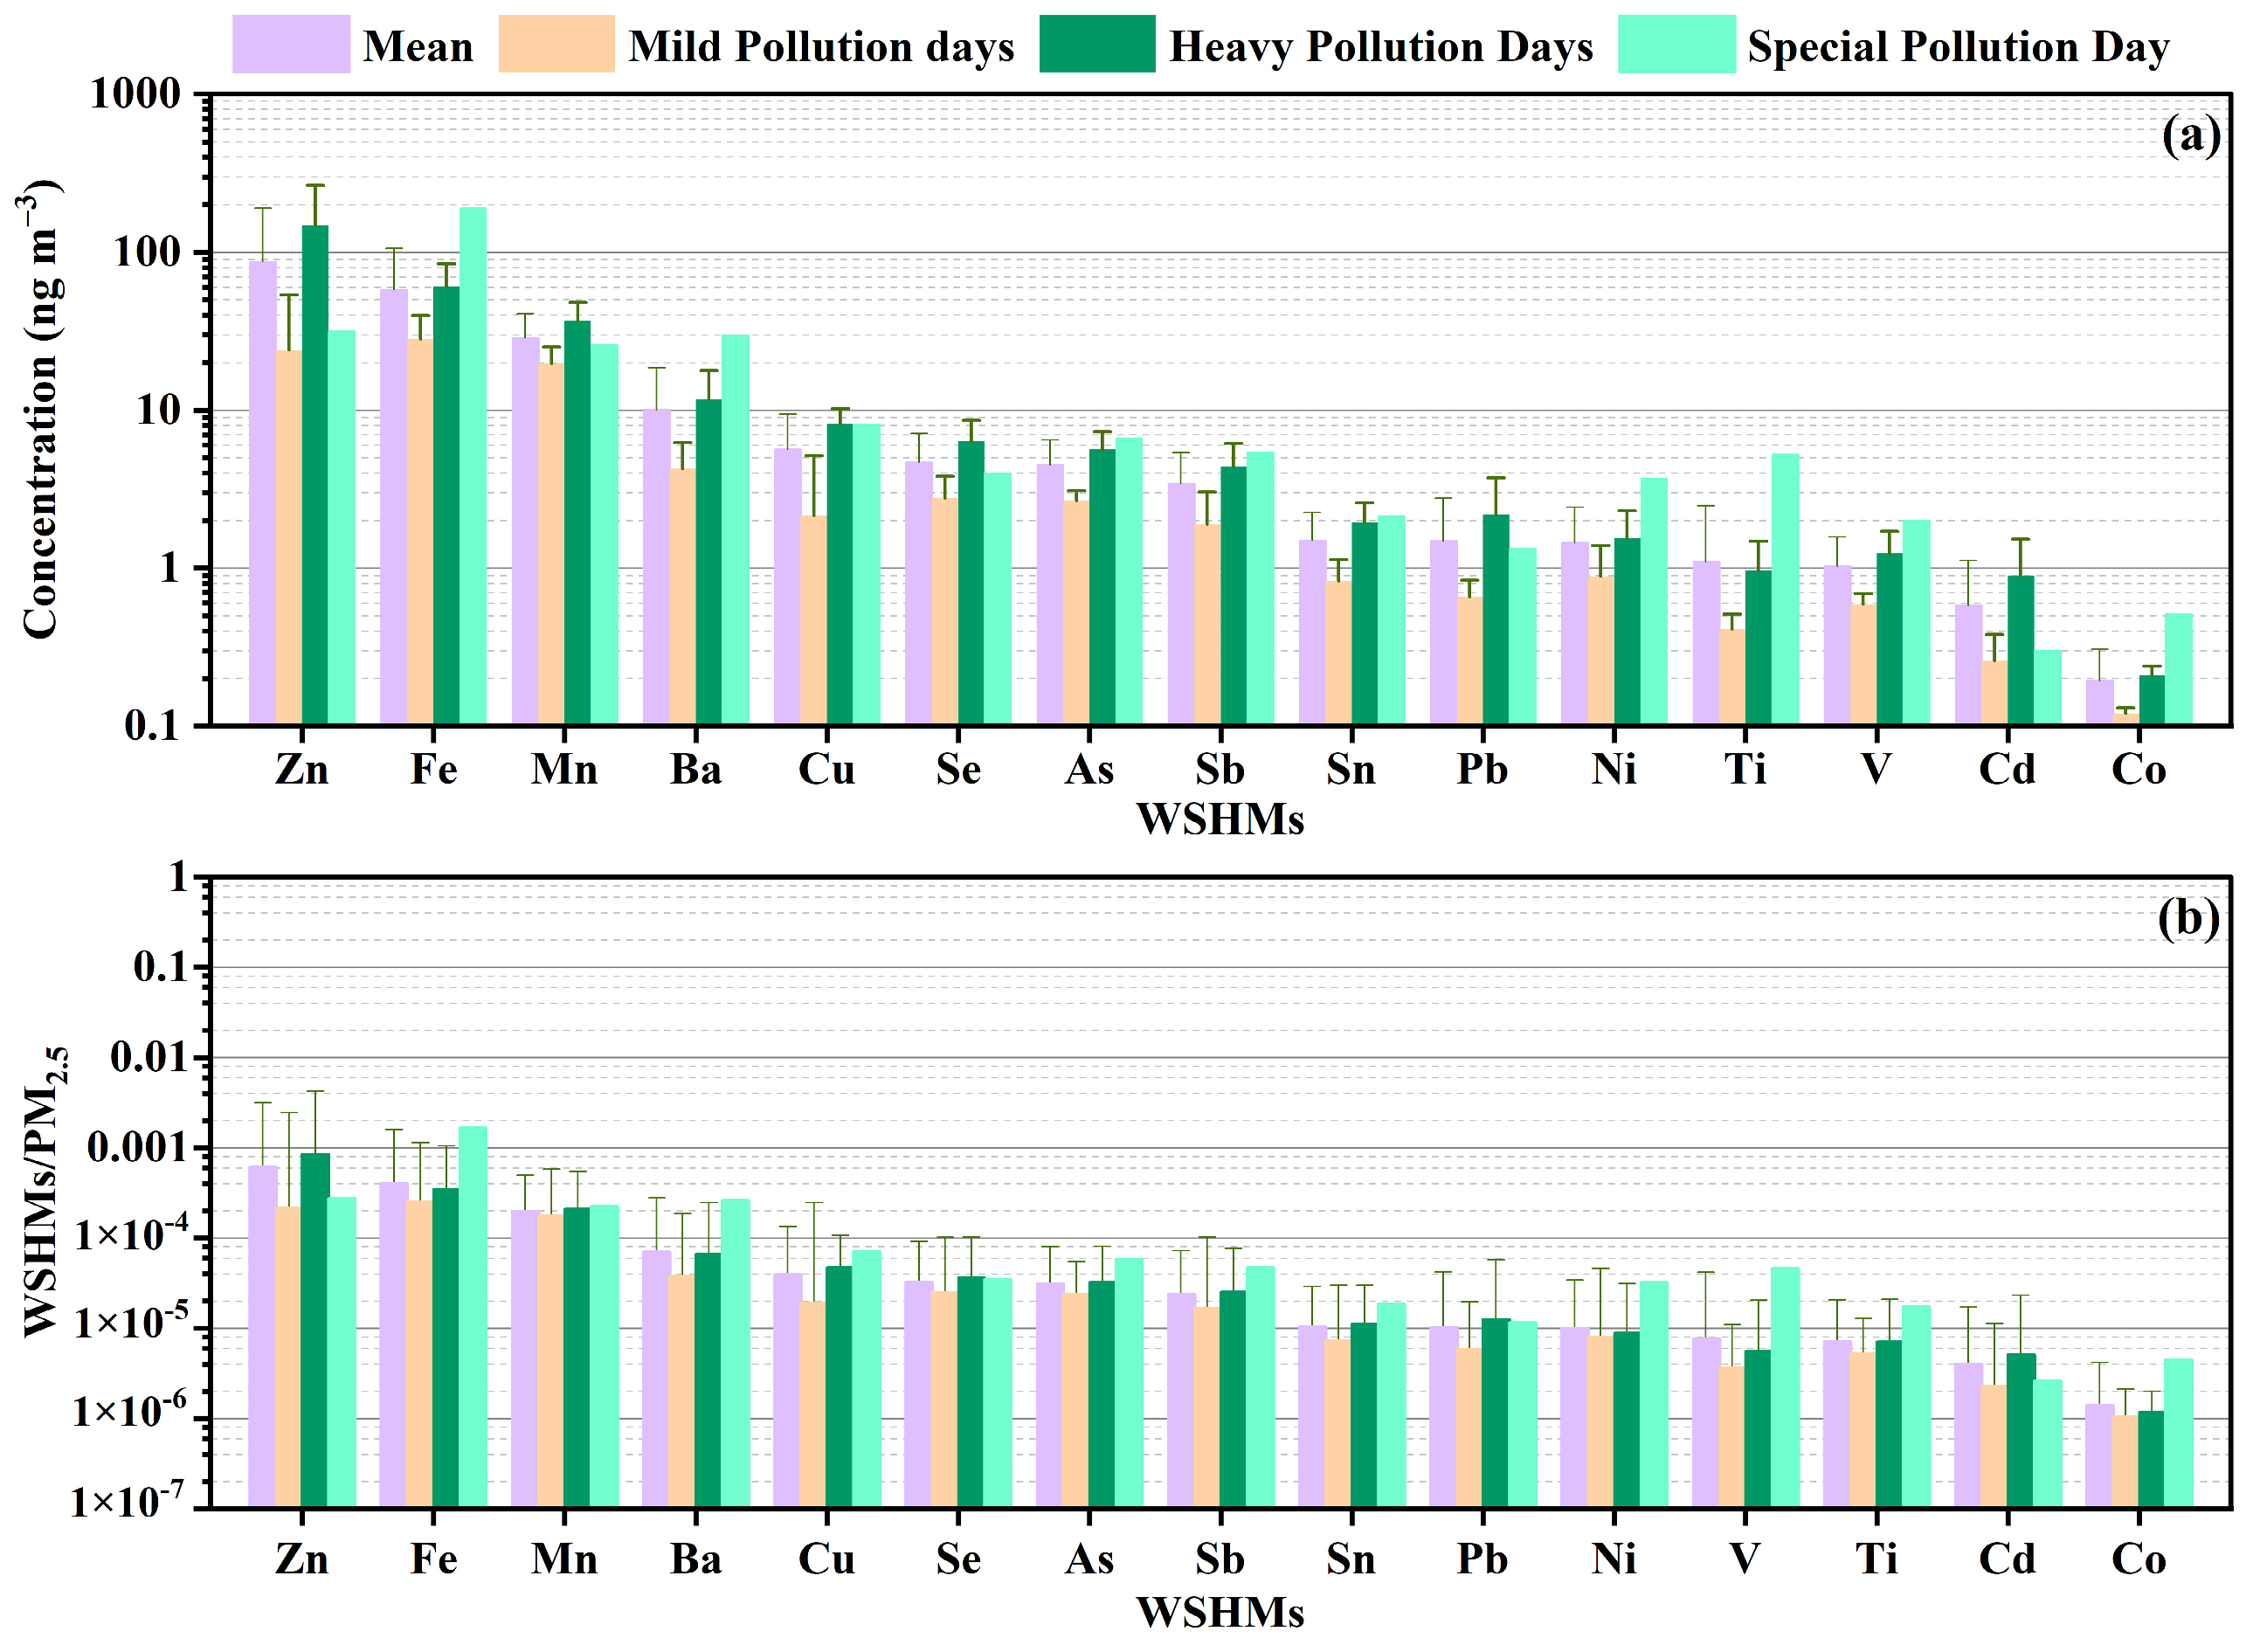
A total of fifteen WSHMs were detected in all samples, with their mean mass concentrations in descending order as follows: Zn > Fe > Mn > Ba > Cu > Se > As > Sb > Sn > Pb > Ni > Ti > V > Cd > Co (Figure 2a). The total mass concentration of the fifteen WSHMs (∑WSHMs) in PM2.5 ranged from 45.73 ng m−3 to 593.05 ng m−3, with a mean mass concentration of 209.17 ± 187.21 ng m−3, contributing 0.14% ± 0.07% to PM2.5 mass. Table S3 shows the concentrations of WSHMs observed in various regions. In this study, the winter concentrations of WSHMs in Taiyuan (an inland city) was comparable to previously observed results in inland cities (Sanmenxia, 219.58 ng m−3) [62], but significantly lower than those observed in Beijing (522.99 ng m−3), especially for Zn (Beijing vs. Taiyuan, 412.81 vs. 87.01 ng m−3) [40]. Additionally, the mass concentrations of WSHMs in Taiyuan were also lower than the winter data of coastal cities such as Tianjin (515.2 ± 401.7 ng m−3), Jinzhou (249.2 ± 212.8 ng m−3), Yantai (440.3 ± 445.6 ng m−3) [35], and Hong Kong (527.79 ng m−3) [63]. This phenomenon can be attributed to the influence of sea salt aerosols in coastal regions, which enhance the water-soluble fractions of certain metals (e.g., Fe, Zn) via chloride-mediated complexation processes [23,64,65]. The concentrations of WSHMs in Taiyuan in this study were higher than those in Los Angeles (39.5 ± 18.42 ng m−3) [20], Greece (69.97 ng m−3) [34], Singapore (83.25 ± 32.13 ng m−3) [66] and Romania (158.39 ± 122.08 ng m−3) [44], which are related to the local heavy-industry-dominated structure of Taiyuan.
Based on their concentrations, the measured WSHMs (Figure 2a) were classified into three categories: high-concentration metals (10—100 ng m−3, including Zn, Fe, Mn, and Ba), medium-concentration metals (1—10 ng m−3, including Cu, Se, As, Sb, Sn, Pb, Ni, V, and Ti), and low-concentration metals (<1 ng m−3, including Cd and Co). The high-concentration group dominated ∑WSHMs (87.8%), this result is consistent with observations in Yantai (82.19%), Tianjin (92.97%), and Jinzhou (89.45%) [35]. Zn (87.01 ± 103.15 ng m−3), Fe (57.80 ± 47.88 ng m−3), and Mn (28.73 ± 11.93ng m−3), were the three WSHMs with the highest mean mass concentrations. This rankings pattern was generally consistent with findings reported in studies from Tianjin [35], Greece [34], and Los Angeles [20]. Additionally, the mass concentrations of individual WSHMs in this study fall within the ranges reported for other regions (Table S3).

3.1.2. WSHMs in Different Pollution Conditions

As shown in Figure 2a, the mean mass concentration of ∑WSHMs during HDs (291.01 ± 170.64 ng m−3) exceeded that observed during MDs (89.61 ± 55.36 ng m−3) by 224.8%, indicating significantly enhanced WSHM pollution during HDs. Furthermore, the mean concentrations of high-, medium-, and low-concentration metals in HDs were 3.37, 2.51, and 2.95 times their respective concentrations in MDs. Correspondingly, their proportional contributions to PM2.5 mass were also significantly elevated during HDs (Figure 2b). The dominant order of abundance of WSHMs differed between pollution levels (Table S3). In HDs, the mean mass concentrations followed the order Zn (148.73 ± 116.26 ng m−3) > Fe (60.46 ± 24.11 ng m−3) > Mn (36.66 ± 11.51 ng m−3). In contrast, the order during MDs was Fe (28.25 ± 10.57 ng m−3) > Zn (24.08 ± 29.49 ng m−3) > Mn (19.79 ± 5.87 ng m−3). Zn is typically derived from anthropogenic activities [67,68], and was particularly pronounced in HDs, reaching 6.18 times the level observed in MDs. This marked increase underscores the heightened intensity of anthropogenic emissions (e.g., from coal combustion, vehicular exhaust, and industrial processes) characteristic of heavy pollution events.
On SD, the dominant WSHMs in PM2.5 exhibited a distinct ranking: Fe (189.55 ng m−3) > Zn (31.43 ng m−3) > Ba (29.83 ng m−3). Fe mass concentration increased significantly, reaching 3.14 times higher levels on SD compared to HDs, and 6.71 times higher levels than on MDs. Critically, Fe serves as a common tracer of both crustal material and industrial emissions. Its water-soluble fraction (as a redox-active transition metal) enhances particle oxidative potential [69,70], which may intensify intracellular oxidative stress linked to pulmonary/cardiovascular risks [35,71,72,73]. Concurrently, specific WSHMs showed pronounced peaks during SD: the mass concentrations and proportions of Fe, Ba, Ni, V, Ti, and Co in PM2.5 all reached maxima during SD (Figure 2a,b). Given that Fe and Ti are well-documented markers of crustal dust (e.g., soil resuspension) [26], while Ni and Co are associated with metallurgical emissions [74], these features collectively suggest localized pollution sources that were likely dominated by soil dust resuspension and metallurgical activities during SD. In contrast, during a representative heavy pollution episode (January 26) (Figure 1), the total WSHM mass concentration peaked at 593.05 ng m−3, and concentrations of Zn (371.99 ng m−3), Mn (59.10 ng m−3), Se (10.29 ng m−3), As (8.56 ng m−3), Pb (5.20 ng m−3), and Cd (2.06 ng m−3) all reached their maximum recorded levels. The dominance of these elements, which are established markers of industrial combustion, smelting, and fossil fuel emissions, demonstrates exceptionally strong anthropogenic influence during this event.
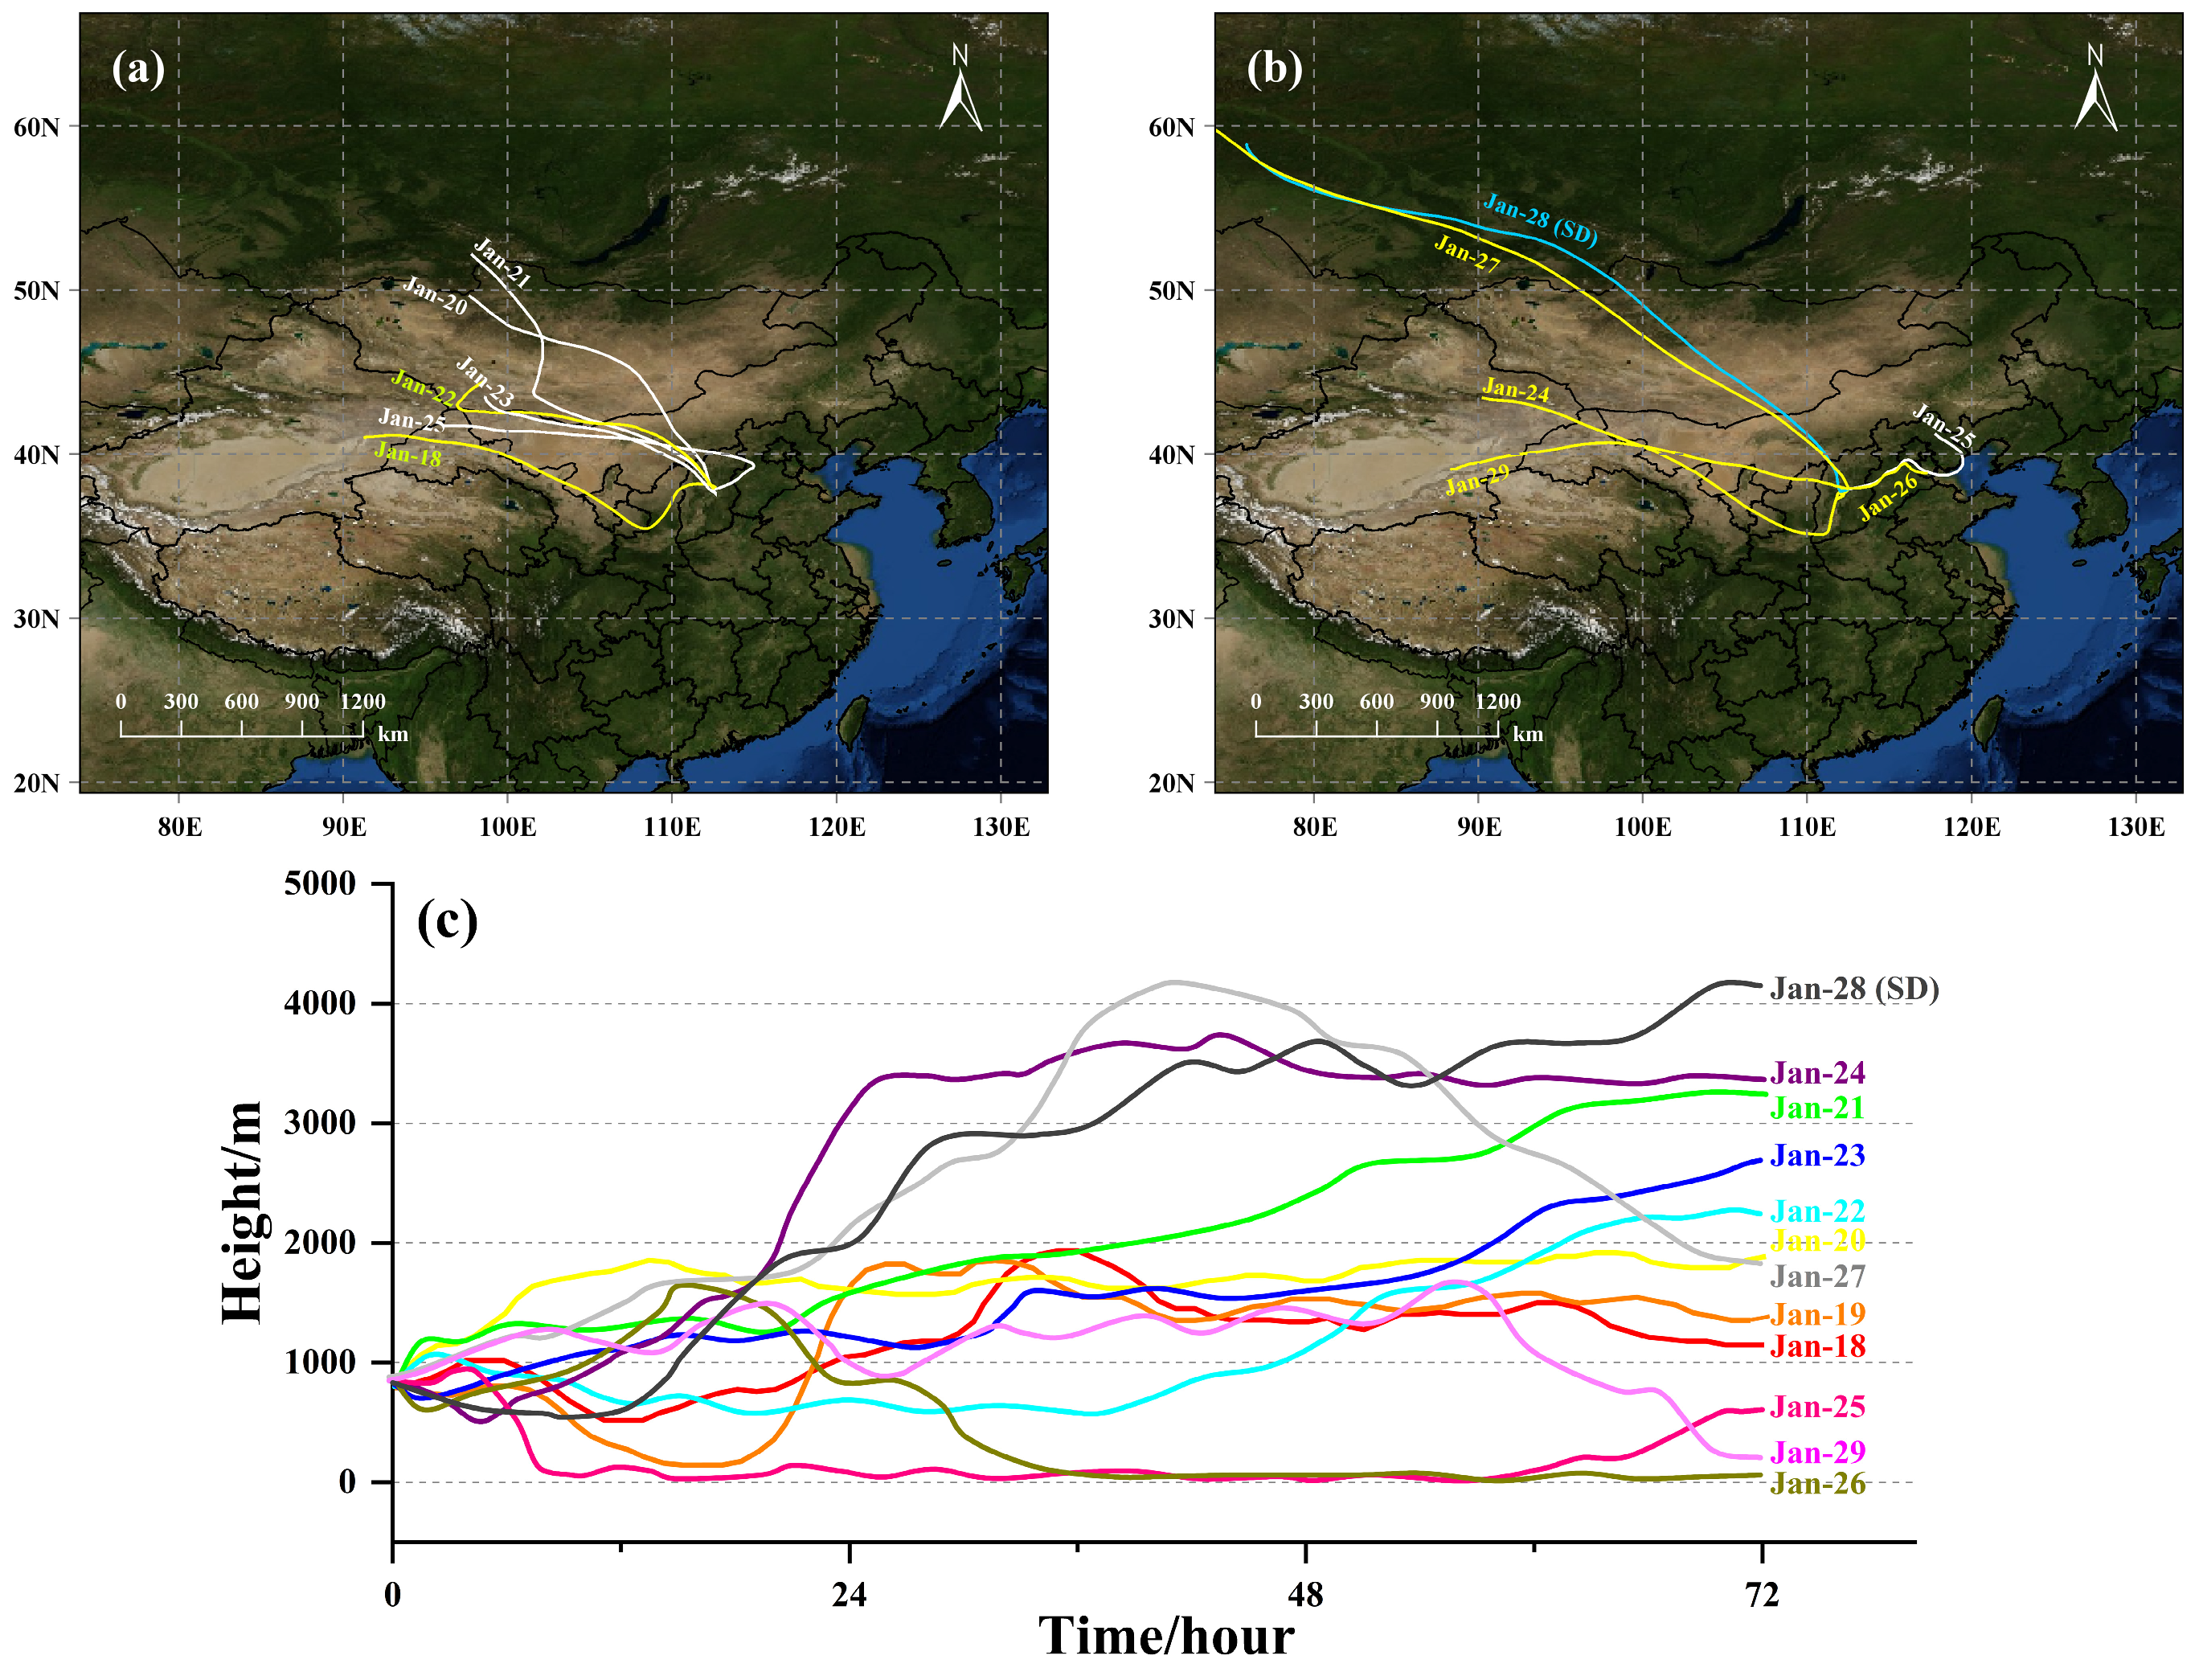
To further analyze the unique distribution of WSHMs on SD, air mass trajectory analysis was performed. The HYSPLIT backward trajectory (72 h) for air mass throughout the whole sampling period is shown in Figure 3. Overall, the sampling site was predominantly influenced by northwesterly air masses (Figure 3a,b). It is worth noting that the air mass on January 26 originated from the Beijing–Tianjin–Hebei region (Figure 3b), and its altitude (<500 m) was significantly lower than on other dates (Figure 3c). The low-altitude air mass, being closer to the surface in the regions of anthropogenic activity, was more susceptible to influence from industrial emissions and transportation sources during transport [23,34,75], explaining the extreme enrichment of anthropogenic WSHMs (e.g., Zn, Pb, Cd) observed that day. Conversely, air masses on an SD (January 28) and the preceding day (January 27) underwent high-altitude, long-range transport from inland northwest China (Figure 3b), carrying crustal-derived metals (Fe, Ti, Ba) [26]. Notably, during the final 12 h preceding SD sampling, the trajectory descended to altitudes < 800 m (Figure 3c), passing directly over northern Taiyuan (a zone dense with metallurgical enterprises) (Figure S1). This shift allowed the interception of local industrial emissions. Therefore, the elevated WSHM concentrations observed on SD reflect contributions from two distinct sources: crustal dust transported long distances from northwest China, and regional industrial emissions intercepted during low-altitude air transport over Taiyuan. Critically, persistently low wind speeds (0.83 m s−1 (Figure S2)) during this period inhibited atmospheric dispersion, enabling accumulation of pollutants from the preceding high-pollution days (January 26–27) and trapping the mixed pollutants near the surface.

3.2. Source Distribution of WSHMs in PM2.5

3.2.1. Source Analysis Based on PCA

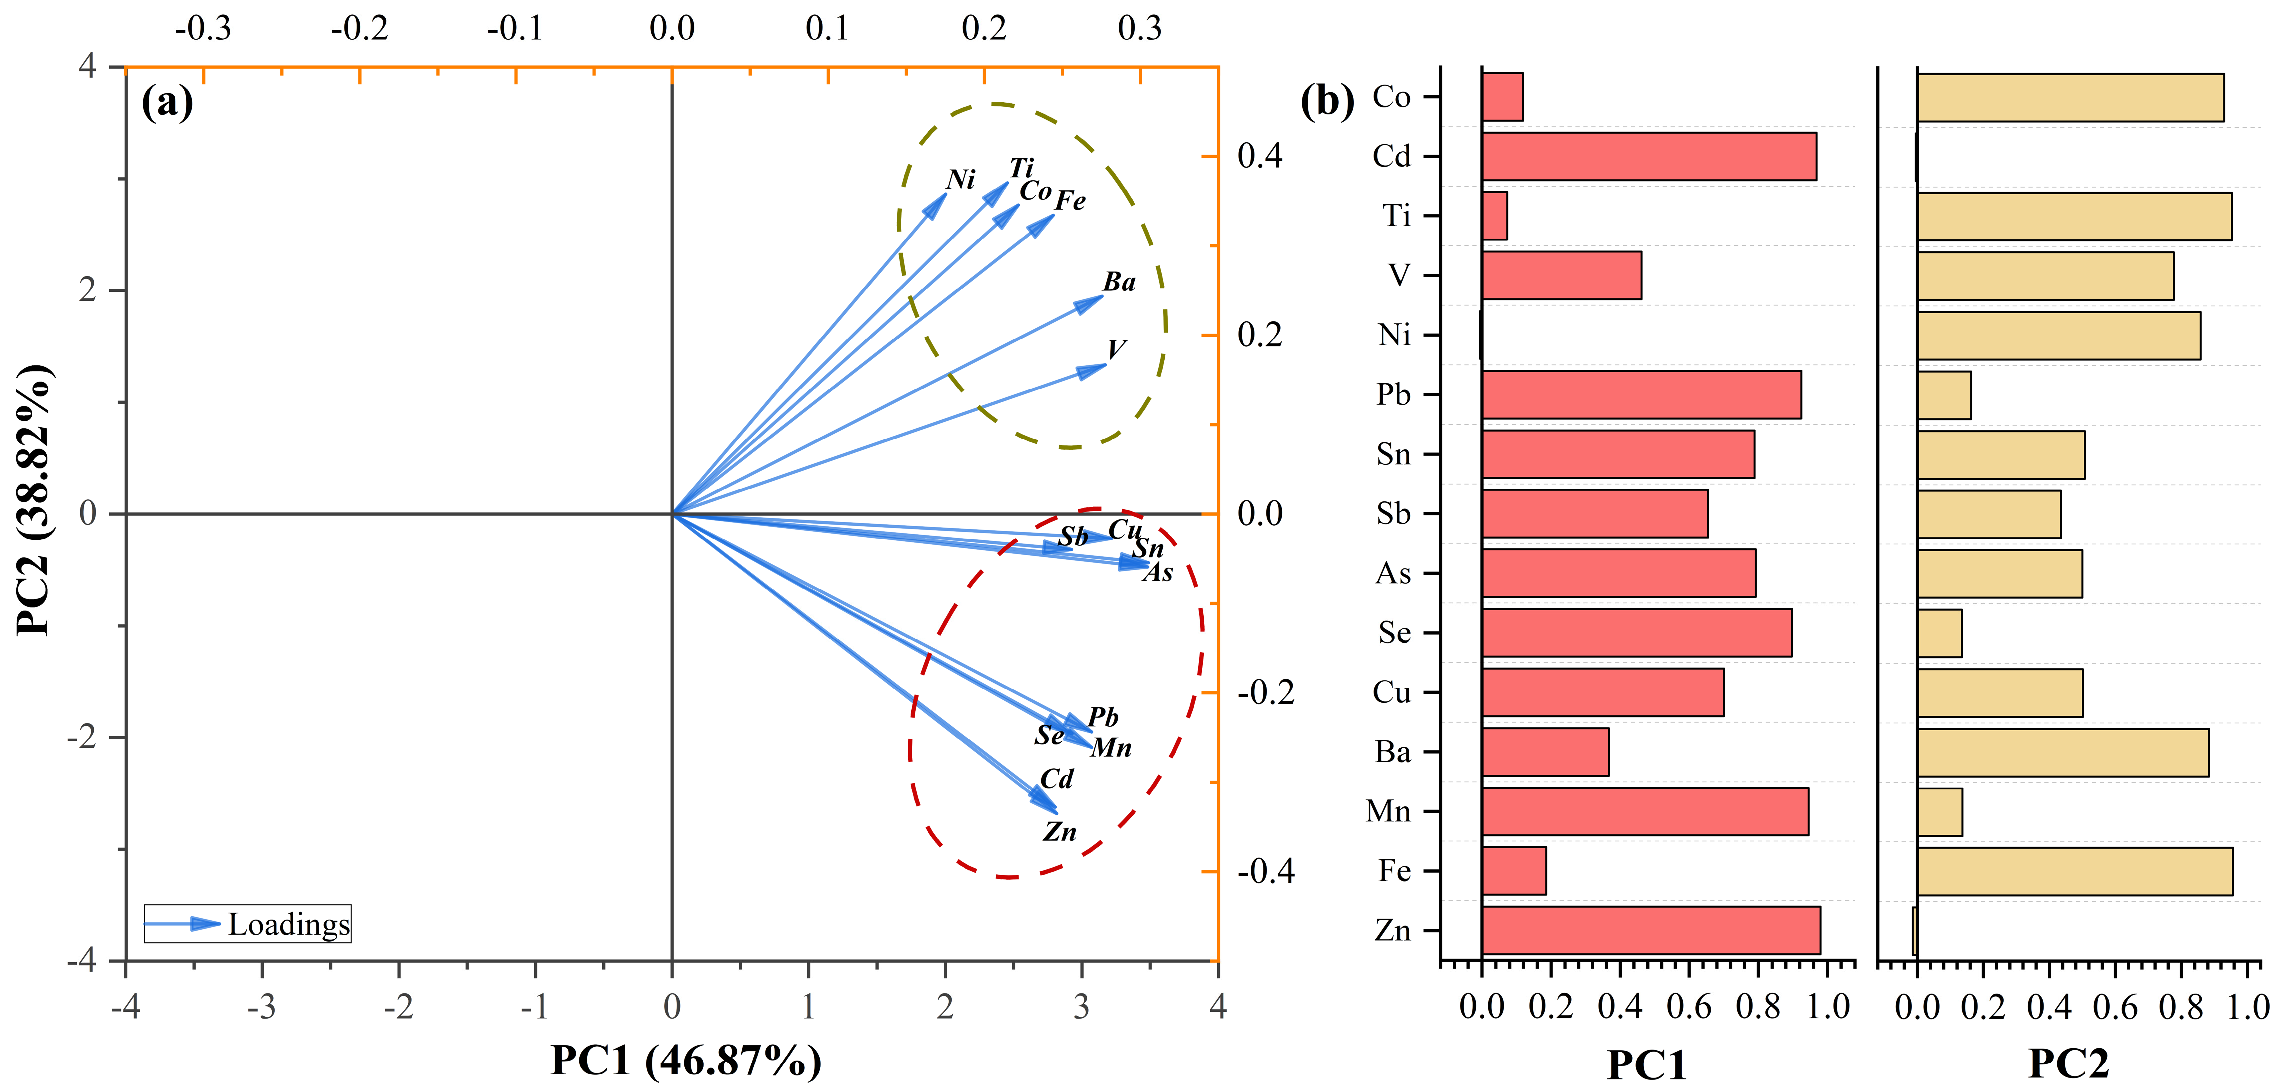
PCA was used to analyze the source of the 15 WSHMs in this study. Vari-max-rotated factor analysis with Kaiser-normalization (converged after three iterations) extracted two principal components (PCs) that explained 85.69% of the total variance in WSHMs from winter PM2.5 in Taiyuan. The variance contributions were 46.87% (PC1) and 38.82% (PC2), respectively (Figure 4).
PC1 exhibited significant positive factor loadings for Zn (0.980), Cd (0.969), Mn (0.946), Pb (0.925), Se (0.898), and As (0.793) (Figure 4). Zn, Mn, and Pb are primarily derived from vehicle emissions and brake wear [76,77,78,79,80], with Cd in Taiyuan’s winter PM2.5 also associated with these sources [81]. As shown in Figure S1, the sampling area is situated within a high-density urban setting (within a 5 km radius of residential areas, commercial centers, offices, institutions, and hospitals), adjacent to major traffic arteries and experiencing high vehicular density (1.68 million civilian vehicles in 2019; Taiyuan Municipal Bureau of Statistics). These source characteristics align with the site’s location, particularly given frequent traffic activity from proximity to a major artery, rail transit, and schools. Elevated vehicular emissions and brake/tire wear particulates were further intensified by pre-holiday travel during the sampling period near the Chinese Lunar New Year, including heightened activity around the ‘Little New Year’ (January 28th). Coal combustion, recognized as the dominant source of fine aerosols in northern China during winter, is a significant contributor to WSHMs [4,82]. This was further exacerbated by a surge in coal consumption for winter heating, particularly in densely populated surrounding areas, driven mainly by lower temperatures (−2.48 ± 2.47 °C) during the sampling period. High-temperature combustion processes volatilize Zn, Cd, Pb, and As directly from coal into the atmosphere [49,83,84]. Zn emissions are especially prominent in Shanxi Province, a major coal-producing region where coal exhibits elevated Zn concentrations (mean: 60.5 μg g−1 [85]). This value significantly exceeds the national mean (39.81 μg g−1) reported for coals from 26 Chinese provinces [85]. Coal combustion is also the primary anthropogenic source for As and Pb emissions in China, accounting for 74.2% and 60.1% of national totals, respectively [24]. Although its contribution to Cd emissions is comparatively lower (32.7%), coal remains a substantial emission source for this element [24]. Intensive winter coal consumption for heating and power generation further amplifies emissions [4]. Therefore, PC1 represents a mixed source of coal combustion and vehicular emissions.
PC2 exhibited significant positive factor loadings (>0.7) for Fe (0.957), Ti (0.953), Co (0.930), Ba (0.884), Ni (0.858), and V (0.777) (Figure 4). While Fe, Ti, and Ba are established crustal element tracers for natural dust [23,86], Fe and Ti additionally exhibit strong associations with industrial high-temperature processes, particularly blast furnace steelmaking and coal fly ash production [27,28,87,88]. Similarly, both Ni and Co are sourced from metal processing and nonferrous industries [89,90] and serve as important alloying elements in various types of steel [74]. Critically, emissions from such metallurgical processes generate fine particles with enhanced aqueous solubility [23]. Crucially, the sampling site lies approximately 10 km south of major industrial complexes (notably steel production facilities). During sampling, prevailing northwesterly winds were spatially aligned with these facilities located to the north. Given Taiyuan’s basin topography and winter meteorology, characterized by frequent temperature inversions and low wind speeds, the site is situated downwind relative to these dominant industrial sources under prevailing northerly/northwesterly winter air masses. This positioning allows the site to function as a sink for regionally transported pollutants accumulating within the urban basin. This meteorological and spatial linkage indicates that the transported air masses delivered metallurgical emissions (e.g., Fe, Ti, Ni, Co, V) and dust to the sampling site, explaining the observed elemental loadings. PC2 therefore represents a dual-source signature combining metallurgical emissions (transported from the northern industrial area) and natural dust.

3.2.2. APCS-MLR Quantification of WSHM Sources

The APCS-MLR receptor model, informed by PM2.5 WSHM factor loadings from rotational factor analysis, quantified the source contributions of WSHMs. Notably, 23.03% of WSHMs remained unportioned. This value is higher than the 12% reported in Los Angeles [20] and comparable to the 15.35—21.27% range observed in the Fen-Wei Plain [58].
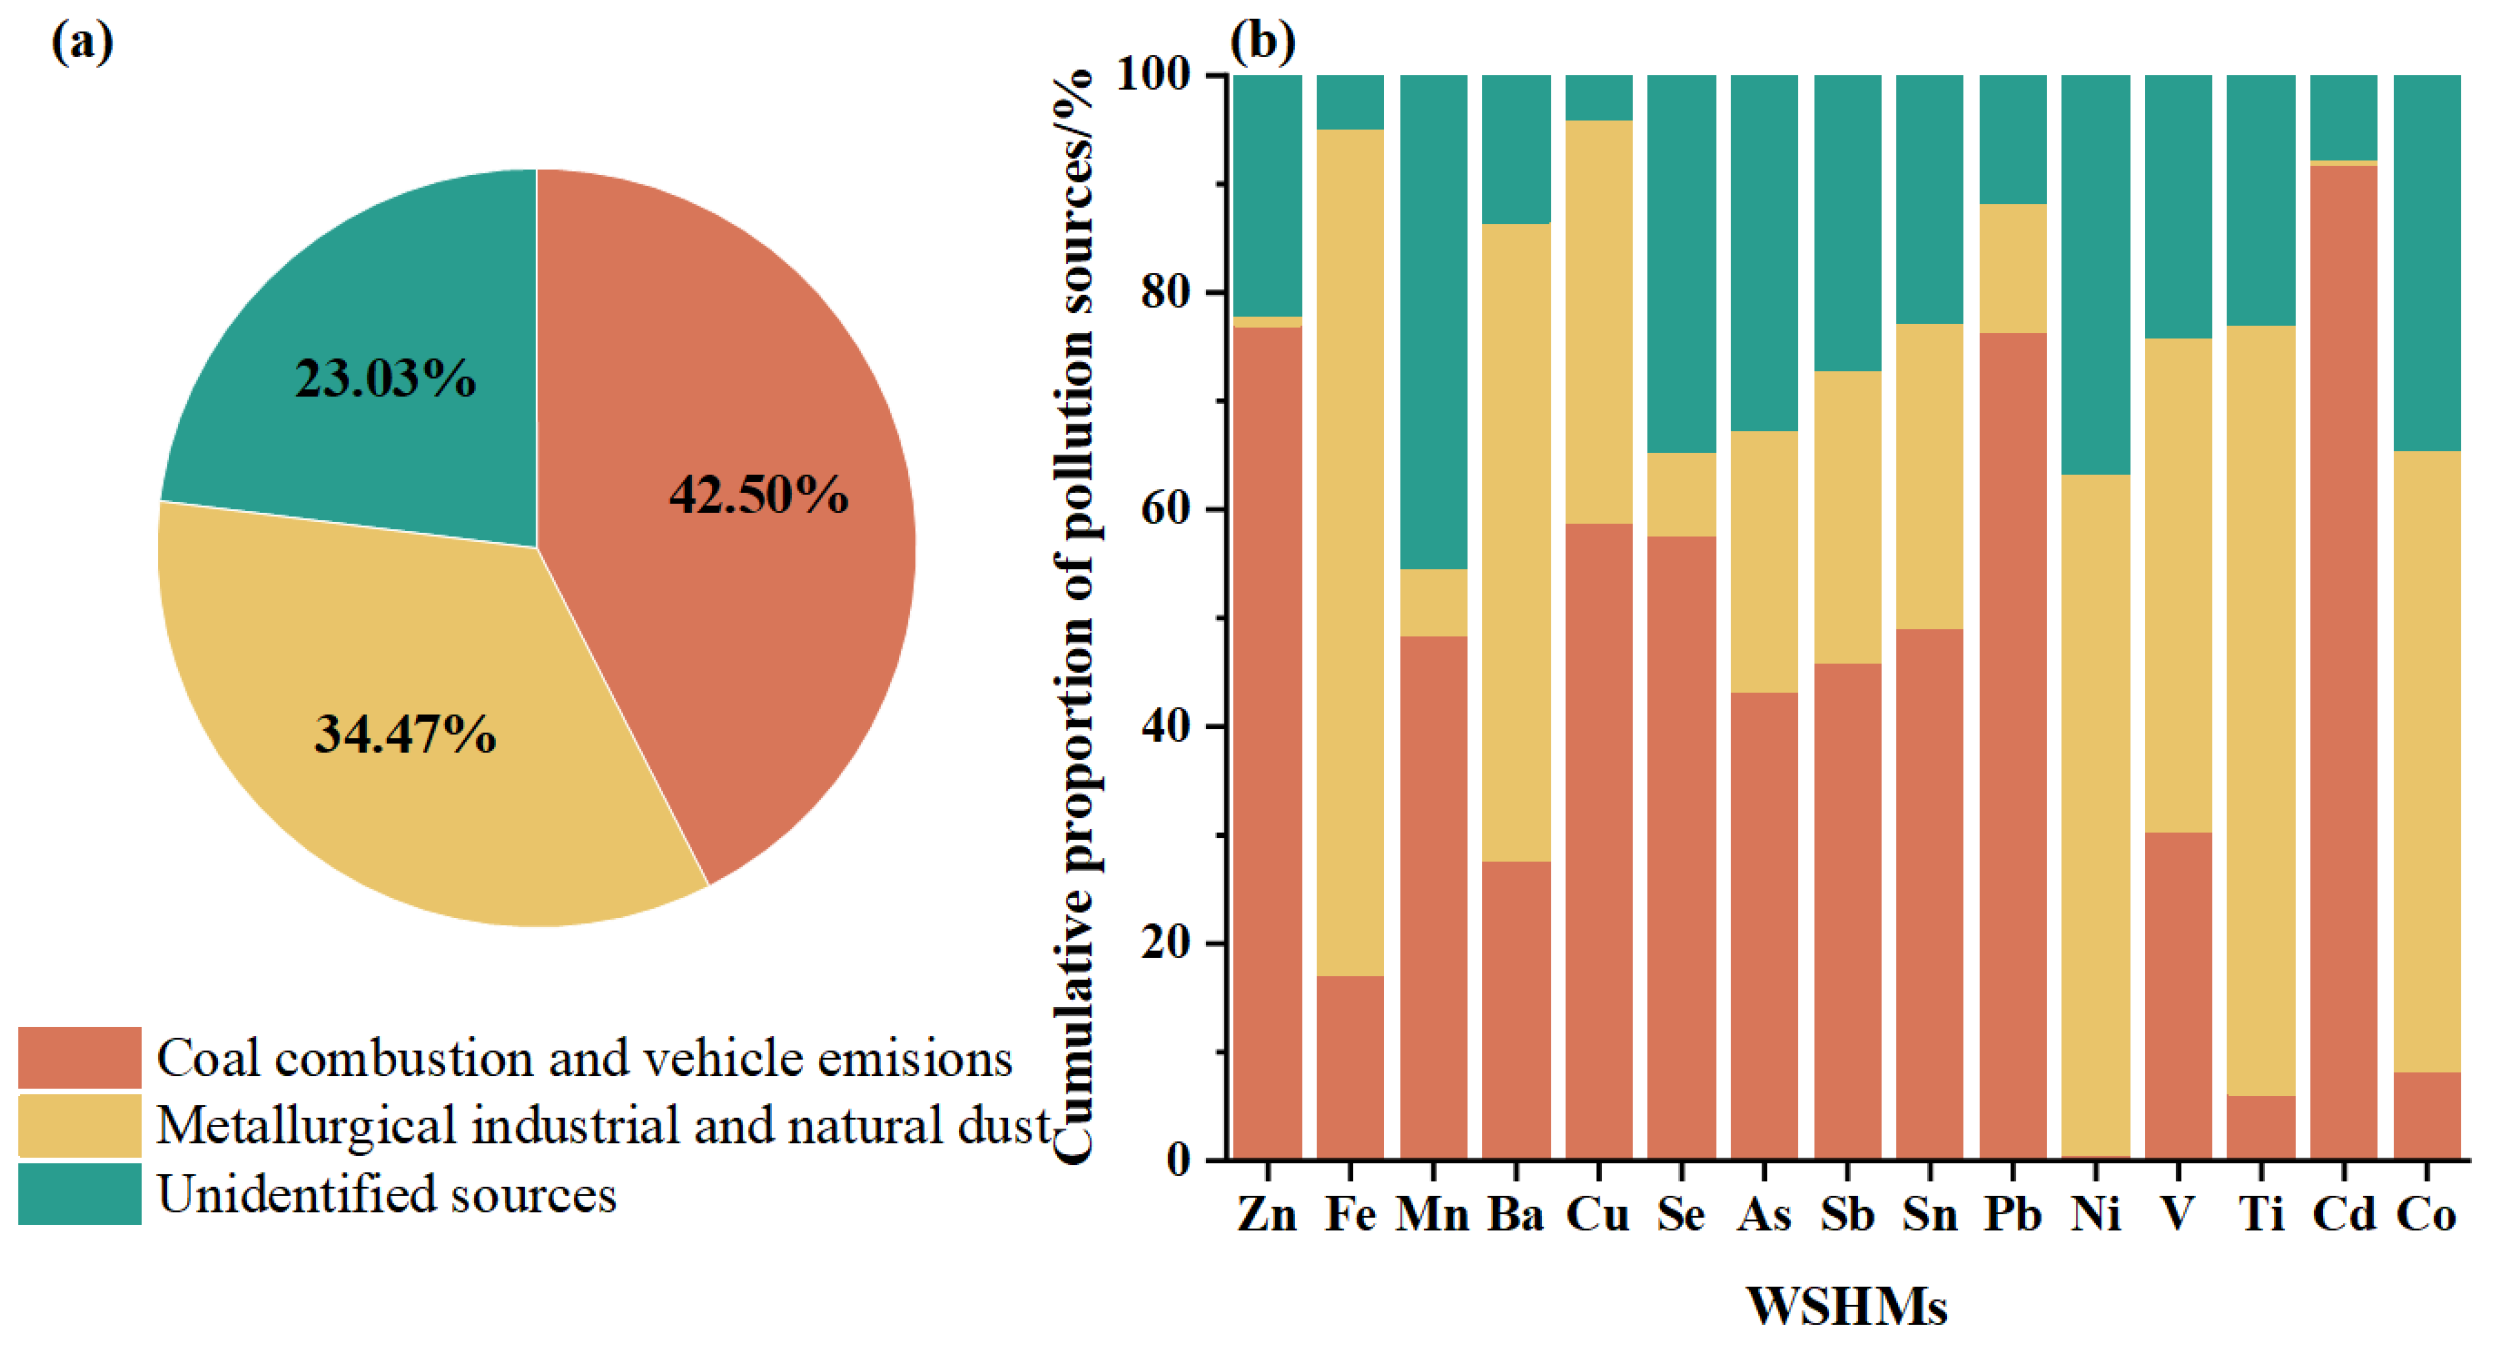
The source distributions and contributions of each WSHM are shown in Figure 5a. During winter sampling, the combination of coal combustion and vehicle emissions was the main source of WSHMs in PM2.5 during the winter sampling period, accounting for 42.50% of the total WSHMs. Previous studies have shown that almost all Cd and Pb originate from anthropogenic emissions [23]. In this study, coal combustion and traffic emissions contributed 91.77% of Cd, 76.89% of Zn, and 76.37% of Pb in Taiyuan during winter (Figure 5a). Coal-fired pollution is heavy in winter, and the heating activities of urban residents greatly increase the contribution of this source to air pollution. The mixed source of metallurgical industry and natural dust accounted for 34.47% of WSHMs and accounted for over 50% of the Fe, Ti, Co, Ni, and Ba pollutants. This is related to emissions from the local metallurgical industry and the long-distance transportation of natural dust during this period. Collectively, these two dominant sources drove increased air pollution loads in Taiyuan.

3.3. Health Risk Assessment of WSHMs in PM2.5

WSHMs in PM2.5 pose significant human health risks via ingestion, dermal contact, and inhalation. These metals can induce organ damage, disrupt biological functions, and cause both non-carcinogenic and carcinogenic effects. Due to the lack of established reference RfD or SF for Fe, Ti, and V, this study assessed non-carcinogenic risks of twelve WSHMs (Mn, Co, Ni, Cu, Zn, As, Cd, Pb, Se, Sn, Sb, and Ba) during a short-term high exposure period using Equations (10) and (11) with values from Tables S1 and S2, alongside carcinogenic risks for Cr, Co, Ni, As, and Cd.
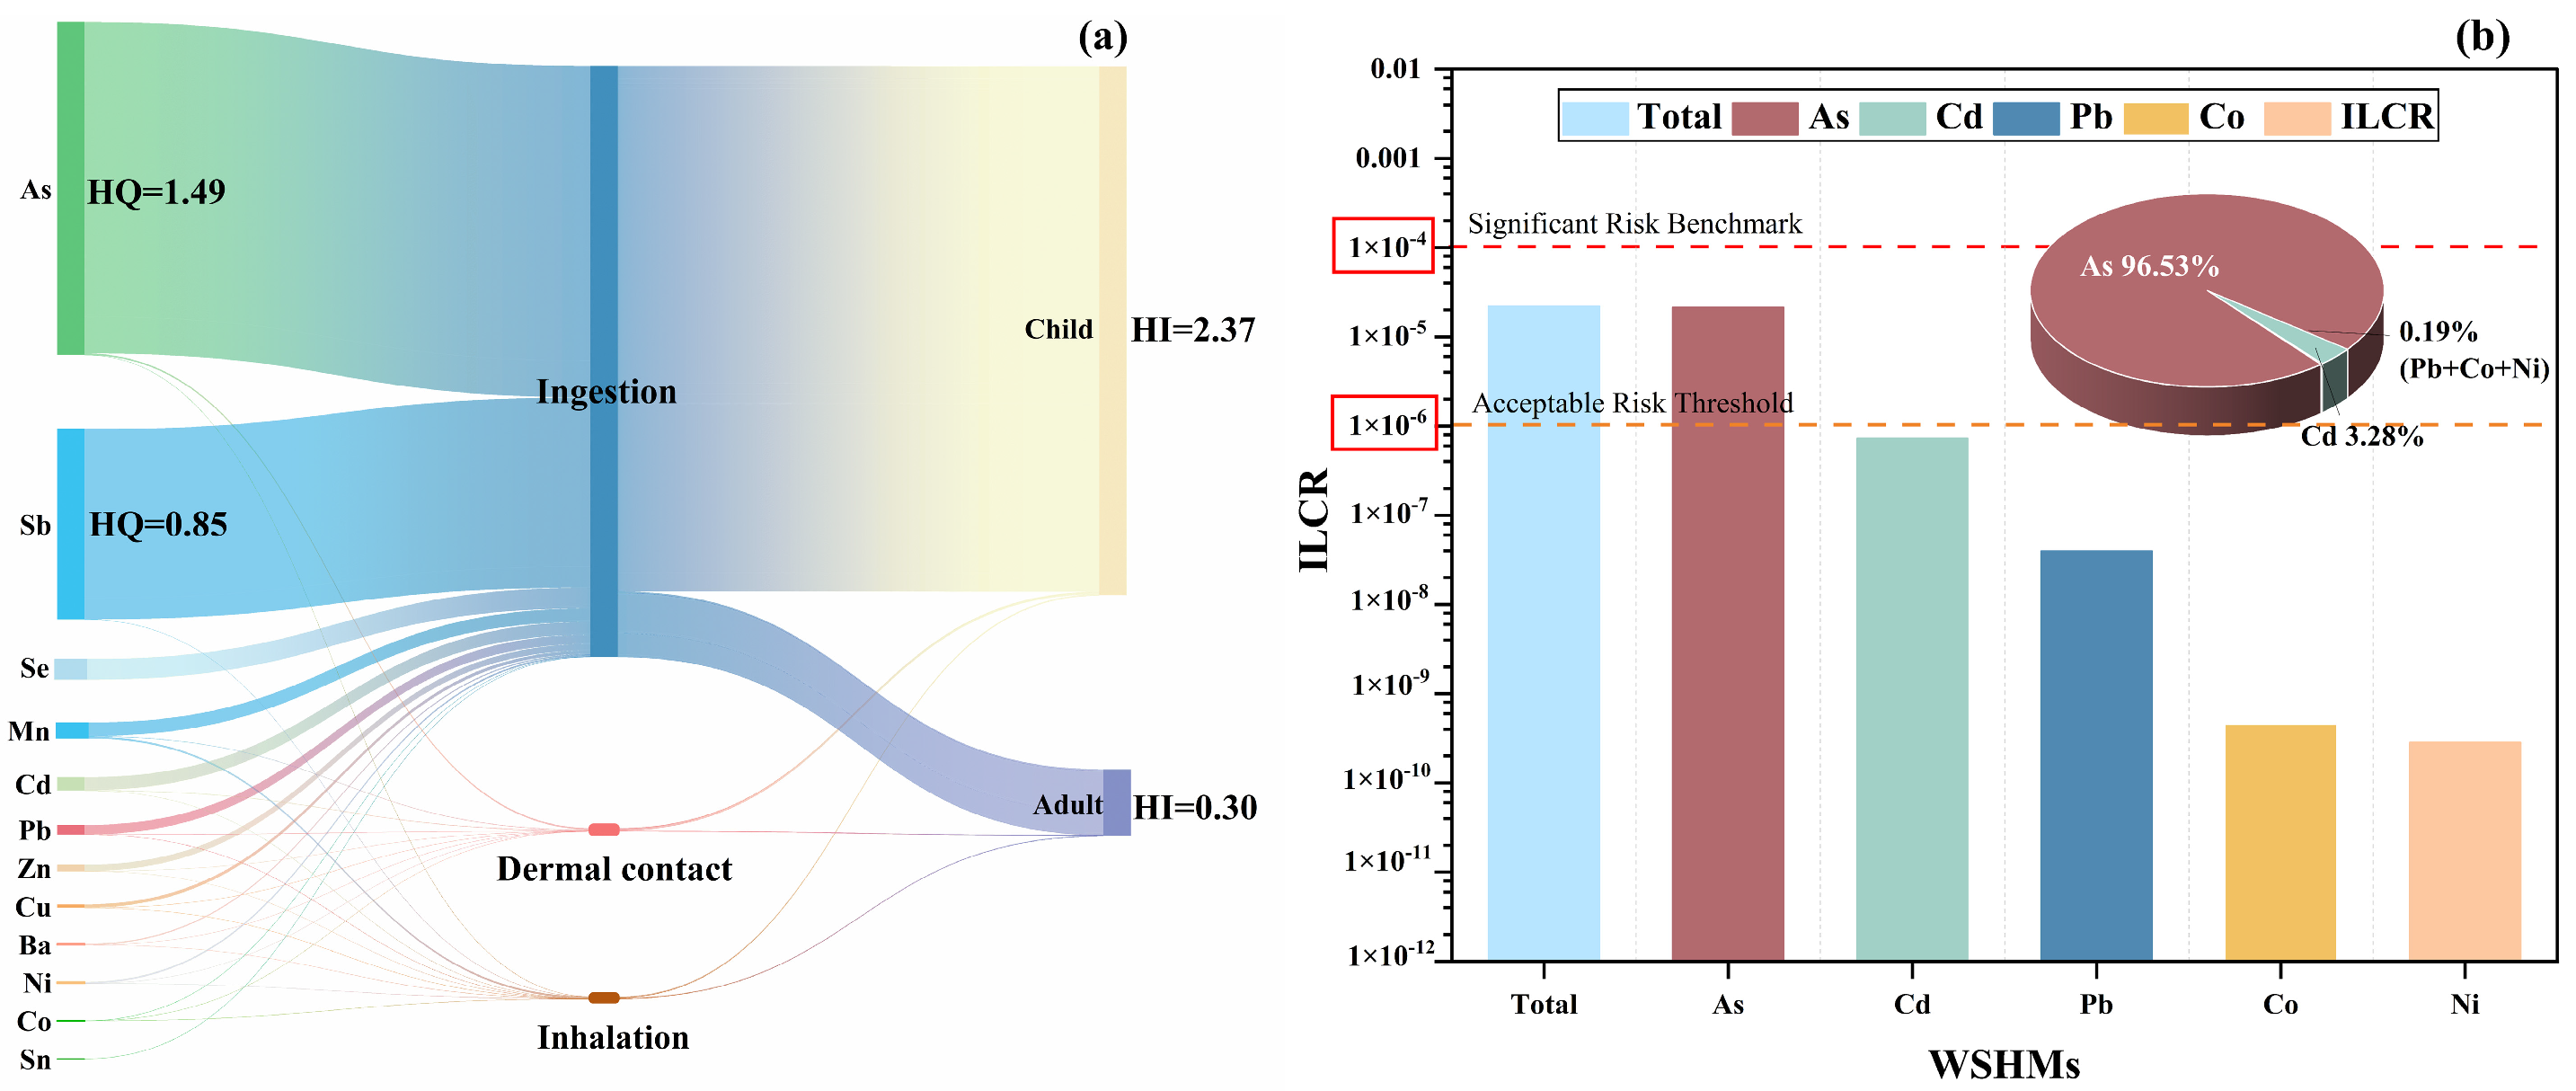
The total HI for non-carcinogenic effects across pathways was as follows: ingestion >> dermal contact > inhalation (Figure 6a). Ingestion risks exceeded dermal/inhalation risks by 2–3 orders of magnitude, consistent with the literature [21,31]. Children exhibited significantly higher non-carcinogenic risks than adults across all pathways. The total HI for children reached 2.37 in winter, substantially exceeding the safety threshold (HI = 1.0). Elevated HQs for As (1.32, accounting for 55.91%) and Sb (0.76, accounting for 31.98%) were the primary contributors to the increased risk in children. For adults, individual HQs for all pathways remained below 1.0. However, the cumulative total HI (0.30) approached the threshold of 1.0, suggesting a potential concern regarding long-term non-carcinogenic effects with sustained exposure during the winter in Taiyuan. Non-carcinogenic risks from dermal contact and inhalation exposure to WSHMs were negligible for both children and adults. Overall, WSHMs pose significant non-carcinogenic risks to children and potential cumulative risks to adults, with As being the dominant contributor to the total non-carcinogenic risk in both populations.
Figure 6b presents the ILCR resulting from exposure to five carcinogenic metals (Co, Ni, As, Cd, and Pb) via the ingestion, dermal contact, and inhalation pathways during the winter in Taiyuan. ILCR decreased as follows: As (2.13 × 10⁻⁶) > Cd (7.23 × 10⁻⁷) > Pb (3.97 × 10⁻⁸) > Co (4.46 × 10⁻¹⁰) > Ni (2.84 × 10⁻¹⁰). As exceeds the widely recognized threshold of concern (1 × 10⁻⁶). Water-soluble As accounted for 96.53% of the total carcinogenic risk and was the main element affecting carcinogenic risk, consistent with previous studies [25,43,44]. Water-soluble Cd, Pb, Co, and Ni exhibit risks below 1 × 10⁻⁶, indicating that their individual contributions do not pose significant carcinogenic hazards. The ILCR for five water-soluble heavy metals (WSHMs) in Taiyuan during winter reached 2.20 × 10⁻⁵. This value is higher than the reported levels in Ho Chi Minh, Vietnam (6.07 × 10⁻⁶) [25], and Iasi, Romania (7.12 × 10⁻⁶) [44], comparable to the value in Hanoi, Vietnam (1.13 × 10⁻⁵) [25], but lower than the data for Nanjing, China (4.59 × 10⁻⁵) [61]. This indicates that prolonged exposure to WSHM during the winter in Taiyuan may pose a significant carcinogenic risk, necessitating priority control measures (especially for As).

4. Conclusions

In this study, fifteen WSHMs (Zn, Fe, Mn, Ba, Cu, Se, As, Sb, Sn, Pb, Ni, V, Ti, Cd, and Co) were detected in PM2.5 during winter in Taiyuan, China. The mean mass concentration of ∑WSHMs was 209.17 ± 187.21 ng m−3. Zn was the most abundant metal, with a mean concentration of 87.01 ± 103.15 ng m−3. Notably, under different pollution levels, the ∑WSHM mean mass concentration during heavy pollution days (291.01 ± 170.64 ng m−3) was 3.25 times higher than during mild pollution days (89.61 ± 55.36 ng m−3).
WSHM concentrations and their proportional contribution to PM2.5 increased significantly during heavy pollution periods, primarily driven by anthropogenic sources including coal combustion and traffic emissions. During a special pollution day, pollution sources were influenced by both long-range transport from the northwestern regions and local industrial emissions. Factor analysis for WSHMs identified two dominant sources: Factor 1 represented a mixed source of coal combustion and traffic emissions (42.50% contribution), and Factor 2 represented a mixed source of metallurgical industry and natural dust (34.47% contribution).
The study also assessed the carcinogenic and non-carcinogenic risks of WSHMs in Taiyuan during winter. For non-carcinogenic effects, the HI for children (2.37) exceeded the safety threshold (HI > 1), indicating significant risk, while the HI for adults (0.30) remained within safe limits. For carcinogenic risk, the total incremental lifetime cancer risk was 2.20 × 10⁻⁵, exceeding the U.S. EPA’s acceptable threshold (1 × 10⁻⁶). Arsenic (As) was the dominant contributor to both non-carcinogenic (accounting for 55.85% of total HI for children and adults) and carcinogenic risks (ILCR = 2.13 × 10⁻⁵, representing 96.53% of total risk). These findings emphasize that WSHMs in PM2.5 require sufficient attention, and further research is needed to provide a scientific basis for policy-making.

Supplementary Materials

The following supporting information can be downloaded at: https://www.mdpi.com/article/10.3390/atmos16080980/s1. References [91,92,93] are cited in the Supplementary Materials. Figure S1: The location of the sampling points and their surrounding environment. Within a 5 km radius of the sampling points is a cultural, educational, and residential area, including schools, museums, hospitals, shopping malls, major transportation routes, and train stations. To the north is an industrial area, including the First and Second Power Plants, Taiyuan Iron and Steel Plant, and Taiyuan Heavy Machinery Plant; Figure S2. Meteorological parameters during the winter sampling period in Taiyuan; Table S1: Meaning and value of calculate parameters for daily average exposure of heavy metals; Table S2: RfD and SF for different exposure of heavy metals; Table S3: Mass concentrations of WSHMs in Taiyuan and other regions.

Author Contributions

Conceptualization, F.L.; methodology, F.L. and Z.G.; formal analysis, Q.H., C.Z., Y.C., N.P., and Y.Z.; investigation, F.L., L.S. and J.L.; writing—original draft preparation, Q.H. and F.L.; writing—review and editing, Q.H. and F.L.; supervision, X.B.; project administration, L.M. and J.W.; funding acquisition, F.L., Z.G., J.W. and X.B.; All authors have read and agreed to the published version of the manuscript.

Funding

This research was funded by the National Natural Science Foundation of China (42130611 and 42407331), Shanxi Provincial Basic Research Program (202403021221042), Central Government Guidance Fund for local Scientific and Technological Development (YDZJSX2025C008), Guangdong Foundation for Program of Science and Technology Research (2023B1212060049), and Technical Service Project for Continuous Improvement of Ambient Air Quality in Taiyuan and Surrounding Areas (1 + 30) (1499002025CCS00004).

Institutional Review Board Statement

Not applicable.

Informed Consent Statement

Not applicable.

Data Availability Statement

The datasets are available from the corresponding author upon reasonable request. The data are not publicly available due to privacy.

Acknowledgments

The authors gratefully acknowledge: L.S. and J.L. for providing meteorological data support; National Climatic Data Center (NCDC) for climatic data resources; Taiyuan Municipal Bureau of Statistics for access to vehicle information data.

Conflicts of Interest

Fengxian Li is employee of CNNC No.7 Research and Design Institute Co., Ltd. The paper reflects the views of the scientists and not the company.

References

  1. Liu, X.; Zhai, Y.; Zhu, Y.; Liu, Y.; Chen, H.; Li, P.; Peng, C.; Xu, B.; Li, C.; Zeng, G. Mass concentration and health risk assessment of heavy metals in size-segregated airborne particulate matter in Changsha. Sci. Total Environ. 2015, 517, 215–221. [Google Scholar] [CrossRef]
  2. Yin, H.; Xu, L. Comparative study of PM10/PM2.5-bound PAHs in downtown Beijing, China: Concentrations, sources, and health risks. J. Clean. Prod. 2018, 177, 674–683. [Google Scholar] [CrossRef]
  3. Cho, W.-S.; Duffin, R.; Poland, C.A.; Duschl, A.; Oostingh, G.J.; MacNee, W.; Bradley, M.; Megson, I.L.; Donaldson, K. Differential pro-inflammatory effects of metal oxide nanoparticles and their soluble ions in vitro and in vivo; zinc and copper nanoparticles, but not their ions, recruit eosinophils to the lungs. Nanotoxicology 2012, 6, 22–35. [Google Scholar] [CrossRef] [PubMed]
  4. Cheng, K.; He, Y.; Zhong, Y.; Li, X.; Li, S.; Ayitken, M. Source apportionment and health risk assessment of PM2.5-bound elements on winter pollution days in industrial cities on the northern slope of Tianshan Mountain, China. Atmos. Pollut. Res. 2024, 15, 102036. [Google Scholar] [CrossRef]
  5. He, L.; Wang, S.; Liu, M.; Chen, Z.; Xu, J.; Dong, Y. Transport and transformation of atmospheric metals in ecosystems: A review. J. Hazard. Mater. Adv. 2023, 9, 100218. [Google Scholar] [CrossRef]
  6. Mitra, S.; Chakraborty, A.J.; Tareq, A.M.; Emran, T.B.; Nainu, F.; Khusro, A.; Idris, A.M.; Khandaker, M.U.; Osman, H.; Alhumaydhi, F.A. Impact of heavy metals on the environment and human health: Novel therapeutic insights to counter the toxicity. J. King Saud Univ.-Sci. 2022, 34, 101865. [Google Scholar] [CrossRef]
  7. Burada, A.; Topa, C.M.; Georgescu, L.P.; Teodorof, L.; Nastase, C.; Seceleanu-Odor, D.; Iticescu, C. Heavy Metals Environment Accumulation in Somova—Parches Aquatic Complex from the Danube Delta Area. Rev. Chim.-Buchar.-Orig. Ed 2015, 66, 48–54. [Google Scholar]
  8. Chen, L.; Zhou, S.; Wu, S.; Wang, C.; He, D. Concentration, fluxes, risks, and sources of heavy metals in atmospheric deposition in the Lihe River watershed, Taihu region, eastern China. Environ. Pollut. 2019, 255, 113301. [Google Scholar] [CrossRef]
  9. Siddiqui, E.; Pandey, J. Atmospheric deposition: An important determinant of nutrients and heavy metal levels in urban surface runoff reaching to the Ganga River. Arch. Environ. Contam. Toxicol. 2022, 82, 191–205. [Google Scholar] [CrossRef]
  10. Duan, J.; Tan, J. Atmospheric heavy metals and arsenic in China: Situation, sources and control policies. Atmos. Environ. 2013, 74, 93–101. [Google Scholar] [CrossRef]
  11. Niu, J.; Rasmussen, P.E.; Hassan, N.M.; Vincent, R. Concentration distribution and bioaccessibility of trace elements in nano and fine urban airborne particulate matter: Influence of particle size. Water Air Soil Pollut. 2010, 213, 211–225. [Google Scholar] [CrossRef]
  12. Li, W.; Xu, L.; Liu, X.; Zhang, J.; Lin, Y.; Yao, X.; Gao, H.; Zhang, D.; Chen, J.; Wang, W. Air pollution–aerosol interactions produce more bioavailable iron for ocean ecosystems. Sci. Adv. 2017, 3, e1601749. [Google Scholar] [CrossRef] [PubMed]
  13. Mahowald, N.M.; Hamilton, D.S.; Mackey, K.R.; Moore, J.K.; Baker, A.R.; Scanza, R.A.; Zhang, Y. Aerosol trace metal leaching and impacts on marine microorganisms. Nat. Commun. 2018, 9, 2614. [Google Scholar] [CrossRef] [PubMed]
  14. Harris, E.; Sinha, B.; Van Pinxteren, D.; Tilgner, A.; Fomba, K.W.; Schneider, J.; Roth, A.; Gnauk, T.; Fahlbusch, B.; Mertes, S. Enhanced role of transition metal ion catalysis during in-cloud oxidation of SO2. science 2013, 340, 727–730. [Google Scholar] [CrossRef]
  15. Wang, W.; Liu, M.; Wang, T.; Song, Y.; Zhou, L.; Cao, J.; Hu, J.; Tang, G.; Chen, Z.; Li, Z. Sulfate formation is dominated by manganese-catalyzed oxidation of SO2 on aerosol surfaces during haze events. Nat. Commun. 2021, 12, 1993. [Google Scholar] [CrossRef]
  16. Zhu, Y.; Li, W.; Lin, Q.; Yuan, Q.; Liu, L.; Zhang, J.; Zhang, Y.; Shao, L.; Niu, H.; Yang, S.; et al. Iron solubility in fine particles associated with secondary acidic aerosols in east China. Environ. Pollut. 2020, 264, 114769. [Google Scholar] [CrossRef]
  17. Slikboer, S.; Grandy, L.; Blair, S.L.; Nizkorodov, S.A.; Smith, R.W.; Al-Abadleh, H.A. Formation of light absorbing soluble secondary organics and insoluble polymeric particles from the dark reaction of catechol and guaiacol with Fe (III). Environ. Sci. Technol. 2015, 49, 7793–7801. [Google Scholar] [CrossRef]
  18. Tran, A.; Williams, G.; Younus, S.; Ali, N.N.; Blair, S.L.; Nizkorodov, S.A.; Al-Abadleh, H.A. Efficient formation of light-absorbing polymeric nanoparticles from the reaction of soluble Fe (III) with C4 and C6 dicarboxylic acids. Environ. Sci. Technol. 2017, 51, 9700–9708. [Google Scholar] [CrossRef]
  19. Al Nimer, A.; Rocha, L.; Rahman, M.A.; Nizkorodov, S.A.; Al-Abadleh, H.A. Effect of oxalate and sulfate on iron-catalyzed secondary brown carbon formation. Environ. Sci. Technol. 2019, 53, 6708–6717. [Google Scholar] [CrossRef]
  20. Badami, M.M.; Tohidi, R.; Jalali Farahani, V.; Sioutas, C. Size-segregated source identification of water-soluble and water-insoluble metals and trace elements of coarse and fine PM in central Los Angeles. Atmos. Environ. 2023, 310, 119984. [Google Scholar] [CrossRef]
  21. He, X.; Liu, P.; Zhao, W.; Xu, H.; Zhang, R.; Shen, Z. Size distribution of water-soluble metals in atmospheric particles in Xi’an, China: Seasonal variations, bioavailability, and health risk assessment. Atmos. Pollut. Res. 2021, 12, 101090. [Google Scholar] [CrossRef]
  22. von Schneidemesser, E.; Stone, E.A.; Quraishi, T.A.; Shafer, M.M.; Schauer, J.J. Toxic metals in the atmosphere in Lahore, Pakistan. Sci. Total Environ. 2010, 408, 1640–1648. [Google Scholar] [CrossRef] [PubMed]
  23. Zhang, Z.; Tao, J.; Zhang, L.; Hu, B.; Liu, M.; Nie, F.; Lu, H.; Chen, L.; Wu, Y.; Chen, D.; et al. Influence of sources and atmospheric processes on metal solubility in PM2.5 in urban Guangzhou, South China. Sci. Total Environ. 2024, 951, 175807. [Google Scholar] [CrossRef] [PubMed]
  24. Tian, H.Z.; Zhu, C.Y.; Gao, J.J.; Cheng, K.; Hao, J.M.; Wang, K.; Hua, S.B.; Wang, Y.; Zhou, J.R. Quantitative assessment of atmospheric emissions of toxic heavy metals from anthropogenic sources in China: Historical trend, spatial distribution, uncertainties, and control policies. Atmos. Chem. Phys. 2015, 15, 10127–10147. [Google Scholar] [CrossRef]
  25. Hien, T.T.; Chi, N.D.T.; Huy, D.H.; Le, H.A.; Oram, D.E.; Forster, G.L.; Mills, G.P.; Baker, A.R. Soluble trace metals associated with atmospheric fine particulate matter in the two most populous cities in Vietnam. Atmos. Environ. X 2022, 15, 100178. [Google Scholar] [CrossRef]
  26. Wang, Q.; Cao, J.; Shen, Z.; Tao, J.; Xiao, S.; Luo, L.; He, Q.; Tang, X. Chemical characteristics of PM2.5 during dust storms and air pollution events in Chengdu, China. Particuology 2013, 11, 70–77. [Google Scholar] [CrossRef]
  27. Wu, J.; Tou, F.; Guo, X.; Liu, C.; Sun, Y.; Xu, M.; Liu, M.; Yang, Y. Vast emission of Fe-and Ti-containing nanoparticles from representative coal-fired power plants in China and environmental implications. Sci. Total Environ. 2022, 838, 156070. [Google Scholar] [CrossRef]
  28. Yang, Q.; Yang, L.; Chen, C.; Yun, J.; Zhao, C.; Liu, G. Atmospheric emissions of Ti-containing nanoparticles from industrial activities in China. Environ. Sci. Nano 2024, 11, 3816–3825. [Google Scholar] [CrossRef]
  29. Contini, D.; Cesari, D.; Genga, A.; Siciliano, M.; Ielpo, P.; Guascito, M.R.; Conte, M. Source apportionment of size-segregated atmospheric particles based on the major water-soluble components in Lecce (Italy). Sci. Total Environ. 2014, 472, 248–261. [Google Scholar] [CrossRef]
  30. Wang, Q.; Ma, Y.; Tan, J.; Zheng, N.; Duan, J.; Sun, Y.; He, K.; Zhang, Y. Characteristics of size-fractionated atmospheric metals and water-soluble metals in two typical episodes in Beijing. Atmos. Environ. 2015, 119, 294–303. [Google Scholar] [CrossRef]
  31. Wu, S.-P.; Li, X.; Xiao, S.-H.; Zhang, J.; Schwab, J.J. Solubility of aerosol minor and trace elements in Xiamen Island, Southeast China: Size distribution, health risk and dry deposition. Sci. Total Environ. 2022, 844, 157100. [Google Scholar] [CrossRef]
  32. Fang, T.; Guo, H.; Zeng, L.; Verma, V.; Nenes, A.; Weber, R.J. Highly acidic ambient particles, soluble metals, and oxidative potential: A link between sulfate and aerosol toxicity. Environ. Sci. Technol. 2017, 51, 2611–2620. [Google Scholar] [CrossRef]
  33. Taira, M.; Sakakibara, K.; Saeki, K.; Ohira, S.-I.; Toda, K. Determination of oxoanions and water-soluble species of arsenic, selenium, antimony, vanadium, and chromium eluted in water from airborne fine particles (PM2.5): Effect of acid and transition metal content of particles on heavy metal elution. Environ. Sci. Process. Impacts 2020, 22, 1514–1524. [Google Scholar] [CrossRef] [PubMed]
  34. Manousakas, M.; Papaefthymiou, H.; Eleftheriadis, K.; Katsanou, K. Determination of water-soluble and insoluble elements in PM2.5 by ICP-MS. Sci. Total Environ. 2014, 493, 694–700. [Google Scholar] [CrossRef] [PubMed]
  35. Liu, W.; Xu, Y.; Liu, W.; Liu, Q.; Yu, S.; Liu, Y.; Wang, X.; Tao, S. Oxidative potential of ambient PM2.5 in the coastal cities of the Bohai Sea, northern China: Seasonal variation and source apportionment. Environ. Pollut. 2018, 236, 514–528. [Google Scholar] [CrossRef] [PubMed]
  36. Li, Q.; Zhang, H.; Cai, X.; Song, Y.; Zhu, T. The impacts of the atmospheric boundary layer on regional haze in North China. NPJ Clim. Atmos. Sci. 2021, 4, 9. [Google Scholar] [CrossRef]
  37. Stull, R.B. An Introduction to Boundary Layer Meteorology; Springer Science & Business Media: Berlin/Heidelberg, Germany, 2012; Volume 13. [Google Scholar]
  38. Yang, J.; Ma, L.; He, X.; Au, W.C.; Miao, Y.; Wang, W.-X.; Nah, T. Measurement Report: Abundance and fractional solubilities of aerosol metals in urban Hong Kong: Insights into factors that control aerosol metal dissolution in an urban site in South China. Atmos. Chem. Phys. Discuss. 2022, 23, 1403–1419. [Google Scholar] [CrossRef]
  39. Vione, D.; Maurino, V.; Minero, C.; Pelizzetti, E.; Harrison, M.A.; Olariu, R.-I.; Arsene, C. Photochemical reactions in the tropospheric aqueous phase and on particulate matter. Chem. Soc. Rev. 2006, 35, 441–453. [Google Scholar] [CrossRef]
  40. Wang, Q.-Q.; Ma, Y.-L.; Tan, J.-H.; Yang, F.-M.; Wei, L.-F.; Duan, J.-C.; He, K.-B. Characterization of water-soluble heavy metals of PM2.5 during winter in Beijing. China Environ. Sci. 2014, 34, 2204–2210. [Google Scholar] [CrossRef]
  41. United States Environmental Protection Agency (U.S. EPA). Exposure Factors Handbook; PA/600/P-95/002F. EPA; Office of Research and Development: Washington, DC, USA, 1997.
  42. United States Environmental Protection Agency (U.S. EPA). Risk Assessment Guidance for Superfund (RAGS). Part A (1989): Human Health Evaluation Manual; Part E (2005): Supplemental Guidance for Dermal Risk Assessment; Part F (2009): Supplemental Guidance for Inhalation Risk Assessment. Available online: https://www.epa.gov/risk/risk-assessment-guidance-superfund-rags-part (accessed on 9 August 2025).
  43. Kogianni, E.; Kouras, A.; Samara, C. Indoor concentrations of PM2.5 and associated water-soluble and labile heavy metal fractions in workplaces: Implications for inhalation health risk assessment. Environ. Sci. Pollut. Res. 2021, 28, 58983–58993. [Google Scholar] [CrossRef]
  44. Galon-Negru, A.G.; Olariu, R.I.; Arsene, C. Size-resolved measurements of PM2.5 water-soluble elements in Iasi, north-eastern Romania: Seasonality, source apportionment and potential implications for human health. Sci. Total Environ. 2019, 695, 133839. [Google Scholar] [CrossRef] [PubMed]
  45. Dinu, A.; Bounegru, A.V.; Iticescu, C.; Georgescu, L.P.; Apetrei, C. Electrochemical detection of Cd2+, Pb2+, Cu2+ and Hg2+ with sensors based on carbonaceous nanomaterials and Fe3O4 nanoparticles. Nanomaterials 2024, 14, 702. [Google Scholar] [CrossRef]
  46. Xie, R.; Seip, H.M.; Wibetoe, G.; Nori, S.; McLeod, C.W. Heavy coal combustion as the dominant source of particulate pollution in Taiyuan, China, corroborated by high concentrations of arsenic and selenium in PM10. Sci. Total Environ. 2006, 370, 409–415. [Google Scholar] [CrossRef] [PubMed]
  47. Wei, W.; Li, P.; Wang, H.; Song, M. Quantifying the effects of air pollution control policies: A case of Shanxi province in China. Atmos. Pollut. Res. 2018, 9, 429–438. [Google Scholar] [CrossRef]
  48. Liu, K.; Shang, Q.; Wan, C.; Song, P.; Ma, C.; Cao, L. Characteristics and Sources of Heavy Metals in PM2.5 during a Typical Haze Episode in Rural and Urban Areas in Taiyuan, China. Atmosphere 2018, 9, 2. [Google Scholar] [CrossRef]
  49. Liu, X.; Wang, Z.; Bai, H.; Zhang, S.; Mu, L.; Peng, L. Characteristics and health risk assessments of heavy metals in PM2.5 in Taiyuan and Yuci college town, China. Air Qual. Atmos. Health 2020, 13, 909–919. [Google Scholar] [CrossRef]
  50. Qin, S.; Li, B.; Wang, X.; Huang, H.; Zeng, M.; Xiao, F.; Xu, X. Metal Element Detection and Carcinogenicity Risk Assessment of PM2.5 Samples. Environ. Toxicol. Chem. 2020, 39, 1273–1276. [Google Scholar] [CrossRef]
  51. Ding, X.; Zhao, W.; Yan, T.; Wang, L. Response of Ecosystem Service Value to Spatio-Temporal Pattern Evolution of Land Use in Typical Heavy Industry Cities: A Case Study of Taiyuan City, China. Land 2022, 11, 2035. [Google Scholar] [CrossRef]
  52. Ma, H.; Zhen, Z.; Mi, M.; Wang, Q. Characteristics of nutrients pollution and ecological risk assessment of heavy metal in sediments of Fenhe River, Taiyuan section, China. Water Supply 2022, 22, 2596–2611. [Google Scholar] [CrossRef]
  53. Zhang, Y.; Ji, X.; Ku, T.; Li, G.; Sang, N. Heavy metals bound to fine particulate matter from northern China induce season-dependent health risks: A study based on myocardial toxicity. Environ. Pollut. 2016, 216, 380–390. [Google Scholar] [CrossRef]
  54. Zhao, W.; Xuan, L.; Li, W.; Wang, W.; Wang, X. Comprehensive Impact of Different Urban Form Indices on Land Surface Temperature and PM2.5 Pollution in Summer and Winter, Based on Urban Functional Zones: A Case Study of Taiyuan City. Sustainability 2025, 17, 6618. [Google Scholar] [CrossRef]
  55. Xu, Y.; Xue, W.; Lei, Y.; Zhao, Y.; Cheng, S.; Ren, Z.; Huang, Q. Impact of meteorological conditions on PM2.5 pollution in China during winter. Atmosphere 2018, 9, 429. [Google Scholar] [CrossRef]
  56. Shu, Z.; Zhao, T.; Liu, Y.; Zhang, L.; Ma, X.; Kuang, X.; Li, Y.; Huo, Z.; Ding, Q.; Sun, X. Impact of deep basin terrain on PM2.5 distribution and its seasonality over the Sichuan Basin, Southwest China. Environ. Pollut. 2022, 300, 118944. [Google Scholar] [CrossRef] [PubMed]
  57. Zhang, H.; Cheng, S.; Li, H.; Fu, K.; Xu, Y. Groundwater pollution source identification and apportionment using PMF and PCA-APCA-MLR receptor models in a typical mixed land-use area in Southwestern China. Sci. Total Environ. 2020, 741, 140383. [Google Scholar] [CrossRef] [PubMed]
  58. Wang, W.; Chen, C.; Liu, D.; Wang, M.; Han, Q.; Zhang, X.; Feng, X.; Sun, A.; Mao, P.; Xiong, Q.; et al. Health risk assessment of PM2.5 heavy metals in county units of northern China based on Monte Carlo simulation and APCS-MLR. Sci. Total Environ. 2022, 843, 156777. [Google Scholar] [CrossRef] [PubMed]
  59. Larsen, R.K.; Baker, J.E. Source Apportionment of Polycyclic Aromatic Hydrocarbons in the Urban Atmosphere: A Comparison of Three Methods. Environ. Sci. Technol. 2003, 37, 1873–1881. [Google Scholar] [CrossRef]
  60. Jin, G.; Fang, W.; Shafi, M.; Wu, D.; Li, Y.; Zhong, B.; Ma, J.; Liu, D. Source apportionment of heavy metals in farmland soil with application of APCS-MLR model: A pilot study for restoration of farmland in Shaoxing City Zhejiang, China. Ecotoxicol. Environ. Saf. 2019, 184, 109495. [Google Scholar] [CrossRef]
  61. Sun, Y.; Hu, X.; Wu, J.; Lian, H.; Chen, Y. Fractionation and health risks of atmospheric particle-bound As and heavy metals in summer and winter. Sci. Total Environ. 2014, 493, 487–494. [Google Scholar] [CrossRef]
  62. Liu, M.; Wang, W.; Li, J.; Wang, T.; Xu, Z.; Song, Y.; Zhang, W.; Zhou, L.; Lian, C.; Yang, J.; et al. High fraction of soluble trace metals in fine particles under heavy haze in central China. Sci. Total Environ. 2022, 841, 156771. [Google Scholar] [CrossRef]
  63. Jiang, S.Y.N.; Yang, F.; Chan, K.L.; Ning, Z. Water solubility of metals in coarse PM and PM2.5 in typical urban environment in Hong Kong. Atmos. Pollut. Res. 2014, 5, 236–244. [Google Scholar] [CrossRef]
  64. Guieu, C.; Chester, R.; Nimmo, M.; Martin, J.M.; Guerzoni, S.; Nicolas, E.; Mateu, J.; Keyse, S. Atmospheric input of dissolved and particulate metals to the northwestern Mediterranean. Deep Sea Res. Part II Top. Stud. Oceanogr. 1997, 44, 655–674. [Google Scholar] [CrossRef]
  65. Morel, F.M.; Price, N.M. The biogeochemical cycles of trace metals in the oceans. Science 2003, 300, 944–947. [Google Scholar] [CrossRef]
  66. Karthikeyan, S.; Joshi, U.M.; Balasubramanian, R. Microwave assisted sample preparation for determining water-soluble fraction of trace elements in urban airborne particulate matter: Evaluation of bioavailability. Anal. Chim. Acta 2006, 576, 23–30. [Google Scholar] [CrossRef] [PubMed]
  67. Alias, N.F.; Khan, M.F.; Sairi, N.A.; Zain, S.M.; Suradi, H.; Rahim, H.A.; Banerjee, T.; Bari, M.A.; Othman, M.; Latif, M.T. Characteristics, emission sources, and risk factors of heavy metals in PM2.5 from Southern Malaysia. ACS Earth Space Chem. 2020, 4, 1309–1323. [Google Scholar] [CrossRef]
  68. Mondal, S.; Singh, G. PM2.5-bound trace elements in a critically polluted industrial coal belt of India: Seasonal patterns, source identification, and human health risk assessment. Environ. Sci. Pollut. Res. 2021, 28, 32634–32647. [Google Scholar] [CrossRef]
  69. Charrier, J.G.; Anastasio, C. On dithiothreitol (DTT) as a measure of oxidative potential for ambient particles: Evidence for the importance of soluble transition metals. Atmos. Chem. Phys. 2012, 12, 9321–9333. [Google Scholar] [CrossRef]
  70. Lyu, Y.; Guo, H.; Cheng, T.; Li, X. Particle size distributions of oxidative potential of lung-deposited particles: Assessing contributions from quinones and water-soluble metals. Environ. Sci. Technol. 2018, 52, 6592–6600. [Google Scholar] [CrossRef]
  71. Li, J.-M.; Zhao, S.-M.; Wu, S.-P.; Jiang, B.-Q.; Liu, Y.-J.; Zhang, J.; Schwab, J.J. Size-segregated characteristics of water-soluble oxidative potential in urban Xiamen: Potential driving factors and implications for human health. Sci. Total Environ. 2024, 912, 168902. [Google Scholar] [CrossRef]
  72. Palleschi, S.; Rossi, B.; Armiento, G.; Montereali, M.R.; Nardi, E.; Tagliani, S.M.; Inglessis, M.; Gianfagna, A.; Silvestroni, L. Toxicity of the readily leachable fraction of urban PM2.5 to human lung epithelial cells: Role of soluble metals. Chemosphere 2018, 196, 35–44. [Google Scholar] [CrossRef]
  73. Liu, Q.; Baumgartner, J.; Zhang, Y.; Liu, Y.; Sun, Y.; Zhang, M. Oxidative potential and inflammatory impacts of source apportioned ambient air pollution in Beijing. Environ. Sci. Technol. 2014, 48, 12920–12929. [Google Scholar] [CrossRef]
  74. Tian, S.; Liang, T.; Li, K.; Wang, L. Source and path identification of metals pollution in a mining area by PMF and rare earth element patterns in road dust. Sci. Total Environ. 2018, 633, 958–966. [Google Scholar] [CrossRef] [PubMed]
  75. Li, M.; Wu, L.; Zhang, X.; Wang, X.; Bai, W.; Ming, J.; Geng, C.; Yang, W. Comparison of PM2.5 chemical compositions during haze and non-haze days in a heavy industrial city in north China. Aerosol Air Qual. Res. 2020, 20, 1950–1960. [Google Scholar] [CrossRef]
  76. Banerjee, T.; Murari, V.; Kumar, M.; Raju, M. Source apportionment of airborne particulates through receptor modeling: Indian scenario. Atmos. Res. 2015, 164, 167–187. [Google Scholar] [CrossRef]
  77. Fussell, J.C.; Franklin, M.; Green, D.C.; Gustafsson, M.; Harrison, R.M.; Hicks, W.; Kelly, F.J.; Kishta, F.; Miller, M.R.; Mudway, I.S. A review of road traffic-derived non-exhaust particles: Emissions, physicochemical characteristics, health risks, and mitigation measures. Environ. Sci. Technol. 2022, 56, 6813–6835. [Google Scholar] [CrossRef]
  78. Hjortenkrans, D.S.; Bergbäck, B.G.; Häggerud, A.V. Metal emissions from brake linings and tires: Case studies of Stockholm, Sweden 1995/1998 and 2005. Environ. Sci. Technol. 2007, 41, 5224–5230. [Google Scholar] [CrossRef]
  79. Lin, Z.; Fan, X.; Chen, G.; Hong, Y.; Li, M.; Xu, L.; Hu, B.; Yang, C.; Chen, Y.; Shao, Z.; et al. Sources appointment and health risks of PM2.5-bound trace elements in a coastal city of southeastern China. J. Environ. Sci. 2024, 138, 561–571. [Google Scholar] [CrossRef]
  80. Coufalík, P.; Matoušek, T.; Křůmal, K.; Vojtíšek-Lom, M.; Beránek, V.; Mikuška, P. Content of metals in emissions from gasoline, diesel, and alternative mixed biofuels. Environ. Sci. Pollut. Res. 2019, 26, 29012–29019. [Google Scholar] [CrossRef]
  81. Liu, K.; Shang, Q.; Wan, C. Sources and health risks of heavy metals in PM2.5 in a campus in a typical suburb area of Taiyuan, North China. Atmosphere 2018, 9, 46. [Google Scholar] [CrossRef]
  82. Zhang, R.; Jing, J.; Tao, J.; Hsu, S.-C.; Wang, G.; Cao, J.; Lee, C.S.L.; Zhu, L.; Chen, Z.; Zhao, Y. Chemical characterization and source apportionment of PM2.5 in Beijing: Seasonal perspective. Atmos. Chem. Phys. 2013, 13, 7053–7074. [Google Scholar] [CrossRef]
  83. Senior, C.; Granite, E.; Linak, W.; Seames, W. Chemistry of trace inorganic elements in coal combustion systems: A century of discovery. Energy Fuels 2020, 34, 15141–15168. [Google Scholar] [CrossRef]
  84. Bartoňová, L.; Raclavská, H.; Čech, B.; Kucbel, M. Behavior of Cd during coal combustion: An overview. Processes 2020, 8, 1237. [Google Scholar] [CrossRef]
  85. Li, R.; Li, J.; Cui, L.; Wu, Y.; Fu, H.; Chen, J.; Chen, M. Atmospheric emissions of Cu and Zn from coal combustion in China: Spatio-temporal distribution, human health effects, and short-term prediction. Environ. Pollut. 2017, 229, 724–734. [Google Scholar] [CrossRef] [PubMed]
  86. Yadav, K.; Sunder Raman, R. Size-segregated chemical source profiles and potential health impacts of multiple sources of fugitive dust in and around Bhopal, central India. Environ. Pollut. 2021, 284, 117385. [Google Scholar] [CrossRef] [PubMed]
  87. Dai, Q.L.; Bi, X.H.; Wu, J.H.; Zhang, Y.F.; Wang, J.; Xu, H.; Yao, L.; Jiao, L.; Feng, Y.C. Characterization and Source Identification of Heavy Metals in Ambient PM10 and PM2.5 in an Integrated Iron and Steel Industry Zone Compared with a Background Site. Aerosol Air Qual. Res. 2015, 15, 875–887. [Google Scholar] [CrossRef]
  88. Yang, Y.; Weber, R.J. Ultrafiltration to characterize PM2.5 water-soluble iron and its sources in an urban environment. Atmos. Environ. 2022, 286, 119246. [Google Scholar] [CrossRef]
  89. Ogundele, L.T.; Owoade, O.K.; Olise, F.S.; Hopke, P.K. Source identification and apportionment of PM2.5 and PM2.5-10 in iron and steel scrap smelting factory environment using PMF, PCFA and UNMIX receptor models. Environ. Monit. Assess. 2016, 188, 574. [Google Scholar] [CrossRef]
  90. Mehta, U.H.; Kaul, D.S.; Westerdahl, D.; Ning, Z.; Zhang, K.; Sun, L.; Wei, P.; Gajjar, H.H.; Jeyaraman, J.D.; Patel, M.V. Understanding the Sources of Heavy Metal Pollution in Ambient Air of Neighboring a Solid Waste Landfill Site. Aerosol Sci. Eng. 2022, 6, 161–175. [Google Scholar] [CrossRef]
  91. Assessment, P.R. Risk Assessment Guidance for Superfund: Volume III-Part a. Process for Conducting Probabilistic Risk Assessment; Unites States Environmental Protection Agency: Washington, DC, USA, 2001. [Google Scholar]
  92. Lu, X.; Zhang, X.; Li, L.Y.; Chen, H. Assessment of metals pollution and health risk in dust from nursery schools in Xi’an, China. Environ. Res. 2014, 128, 27–34. [Google Scholar] [CrossRef]
  93. United States Environmental Protection Agency (U.S. EPA). Exposure Factors Handbook 2011 Edition (Final); United States Environmental Protection Agency: Washington, DC, USA, 2011; Volume 414.
Figure 1. The concentrations of WSHMs and PM2.5, and the ratios of WSHMs/PM2.5 during the sampling period; “SD” means January 28 is a special pollution day (SD).
Atmosphere 16 00980 g001
Figure 2. The mass concentration (a) and the proportion of WSHMs in PM2.5 (b).
Atmosphere 16 00980 g002
Figure 3. HYSPLIT backward trajectory (72 h) for air mass at 800 m during the entire sampling period ((a) January 18–23; (b) January 24–29) and (c) the heights above sea level of the air masses as a function of time. (In (a,b), white represents MDs, yellow HDs, and blue SD).
Atmosphere 16 00980 g003
Figure 4. Cumulative explained variance of PCA. (a) shows the load map and (b) shows the load distribution of individual WSHMs.
Atmosphere 16 00980 g004
Figure 5. Source distribution of WSHMs in PM2.5 based on the APCS-MLR model (a), and the distribution of pollution sources for each WSHM (b).
Atmosphere 16 00980 g005
Figure 6. Evaluation of the non-carcinogenic risk (a) and carcinogenic risk (b) of WSHMs.
Atmosphere 16 00980 g006
Disclaimer/Publisher’s Note: The statements, opinions and data contained in all publications are solely those of the individual author(s) and contributor(s) and not of MDPI and/or the editor(s). MDPI and/or the editor(s) disclaim responsibility for any injury to people or property resulting from any ideas, methods, instructions or products referred to in the content.