Article

Assessing the Impact of Ammonia Emissions from Mink Farming in Denmark on Human Health and Critical Load Exceedance

by
Lise Marie Frohn
1,*,
Jesper Leth Bak
2,
Jørgen Brandt
1,
Jesper Heile Christensen
1,
Steen Gyldenkærne
1 and
Camilla Geels
1
1
Department of Environmental Science, Aarhus University, 4000 Roskilde, Denmark
2
Department of Ecoscience, Aarhus University, 8000 Aarhus, Denmark
*
Author to whom correspondence should be addressed.
Atmosphere 2025, 16(8), 966; https://doi.org/10.3390/atmos16080966
Submission received: 20 March 2025 / Revised: 30 June 2025 / Accepted: 17 July 2025 / Published: 15 August 2025

Abstract

In this study, the objective is to assess the impacts of NH3 emissions from mink farming on human health and nature, which are sensitive to atmospheric nitrogen deposition. The impact-pathway approach is applied to follow the emissions from source to impact on human health in Europe (including Denmark) and from source to critical nitrogen load exceedances for NH3-sensitive nature in Denmark. The Danish Eulerian Hemispheric Model (DEHM) is used for modelling the air pollution concentrations in Europe and nitrogen depositions on land and water surfaces in Denmark arising from NH3 emissions from mink farming in Denmark. The Economic Valuation of Air (EVA) pollution model system is applied for deriving the health effects and corresponding socio-economic costs in Denmark and Europe arising from the emissions from mink farming. On a local scale in Denmark, the deposition resulting from the NH3 emissions from mink farming is modelled using the results from the OML-DEP model at a high resolution to derive the critical nitrogen load exceedances for Danish nature areas sensitive to NH3. From the analysis of the impacts through human exposure to the air pollutants PM2.5, NO2, and O3, it is concluded that in total, ~60 premature deaths annually in Europe, including Denmark, can be attributed to the emissions of NH3 to the atmosphere from the mink farming sector in Denmark. This corresponds to annual socio-economic costs on the order of EUR 142 million. From the analysis of critical load exceedances, it is concluded that an exceedance of the critical load of nitrogen deposition of ~14,600 hectares (ha) of NH3-sensitive nature areas in Denmark can be attributed to NH3 emissions from mink farming. The cost for restoring nature areas of this size, damaged by eutrophication from excess nitrogen deposition, is estimated to be ~EUR 110 million. In 2020, the mink sector in Denmark was shut down in connection with the COVID-19 pandemic. All mink were culled by order of the Danish Government, and now in 2025, the process of determining the level of financial compensation to the farmers is still ongoing. The socio-economic costs following the impacts on human health in Europe and nitrogen-sensitive nature in Denmark of NH3 emissions from the now non-existing mink sector can therefore be viewed as socio-economic benefits. In this study, these benefits are compared with the expected level of compensation from the Danish Government to the mink farmers, and the conclusion is that the compensation to the mink farmers breaks even with the benefits from reduced NH3 emissions over a timescale of ~20 years.

1. Introduction

On 3 November 2020, the Danish Prime Minister announced a temporary ban on mink until the end of 2021 and ordered that all mink in the fur animal sector in Denmark be culled within 14 days. The ban was later extended to the end of 2022. The reason was the fast spreading of a COVID-19 virus mutation in animals among the Danish fur farms combined with the findings of this specific mutation in infected humans. These findings were centred around nursing homes in the area of mink farms, mink farm workers, and other employees of the mink industry. The Netherlands, Poland, and Ireland made similar bans on mink production. Denmark was globally the largest producer of mink furs with world leading qualities. In 1990, around 10 million mink furs were produced, increasing to 18 million mink furs in 2017 [1] out of a global production of app. 66 million mink and fox pelts in 2019 [2]. Denmark also included the world’s largest fur auction house, Kopenhagen Fur (https://www.kopenhagenfur.dk, accessed on 11 November 2021). In Denmark, as a result of the ban, a total of 17 million mink were culled within a short time period, and a governmental process to financially compensate the affected mink farmers started. In 2025, this process is still ongoing.
Before the COVID-19 pandemic, Denmark, the Netherlands, Finland, and Poland were the countries in Europe with the most mink farms. Mainly due to animal welfare concerns, several European countries (Austria, Belgium, Croatia, Czechia, Luxembourg, North Macedonia, Serbia, Slovenia, Switzerland, and the UK) had for some years banned fur farming. More recently, and after the pandemic, a number of countries are planning bans or have decided on a phase-out period (these include the Netherlands, France, Ireland, Slovakia, Norway, Belgium (Flanders), Germany, Bosnia, and Herzegovina) [3]. In 2023, the global production was estimated to be only 15 million mink and fox pelts [2].
Mink are carnivores, the production of mink smells, and it attracts flies. The Danish success with mink fur production relies on skilled farmers and their ability to systematise the sale, combined with access to large quantities of feed and relatively small areas of open land where the mink production can be located. The food for mink is mainly leftovers from the large Danish fishing industry, and mink production is therefore typically found near the large fishing harbours in the western part of Denmark. Good agricultural soil is not necessary to produce mink fur, and so the production historically originated among the poorest farmers/farm workers, which coincided with those owning or working on limited land with nutrient-poor sandy soils, which are typical for the western part of the country.
Sensitive nature areas are typically also characterised by nutrient-poor soils, and a strong correlation between the location of sensitive nature areas and mink fur farms is therefore found in Denmark. In 2019, the mink farming sector was responsible for 7.3% of the agricultural ammonia (NH3) emissions in Denmark. NH3 contributes to the atmospheric concentration and deposition of reactive nitrogen (Nr) to ecosystems, and loss of biodiversity in terrestrial ecosystems has been shown to be a direct consequence of elevated Nr deposition from the atmosphere [4,5,6]. Emissions contributing to atmospheric Nr deposition are regulated using the critical load (CL) approach, where nature areas are protected according to the critical load of Nr deposition for the specific nature type [7,8,9]. However, exceedances of the critical loads are still widespread for terrestrial ecosystems in Europe, and Denmark is one of the most affected areas [9]. Accumulated consequences of Nr deposition are seen in many terrestrial ecosystems, where species richness is declining in Europe [10,11,12] as well as outside of Europe [13,14]. Similar results have been observed in the Danish monitoring programme for water and nature.
Human health is impacted by air pollution, especially by the concentration of fine particulate matter (PM2.5) in the air [15,16]. The evaluation of impacts and socio-economic costs as well as how reductions in ambient air pollution concentrations benefit society are emerging research topics [17,18,19,20]. NH3 contributes to PM2.5 in the atmosphere through chemical reactions with nitric acid and sulfuric acid to form ammonium-nitrate and ammonium-sulphates. The agricultural emissions therefore also play a role in human health impacts. Calculations within the Danish national air quality monitoring programme have shown that 27% of the total socio-economic costs in Denmark related to health impacts from all emissions of air pollution in 2023 arose from Danish emissions of NH3, which is mainly attributed to agricultural activities [21].
Other studies have examined the environmental impact of mink farming, primarily with a focus on aquatic eutrophication from run-off [22], environmental contamination with heavy metals and persistent organic compounds [22,23], the transmission of viruses, such as COVID-19, to other animals and humans [24], and mink as an invasive species in nature [22,25]. Studies focusing on how air pollution from mink farming specifically impacts human health and atmospheric Nr deposition have not been found, while more general studies of how agricultural activities lead to negative impacts can be found. A mini-review by de Vries [6] summarises how the loss of reactive nitrogen leads to adverse impacts on terrestrial ecosystems (e.g., plant species loss), aquatic ecosystems (algal blooms, plant species loss), and human health through both PM formation and the pollution of drinking water. The impacts on human health are described in more detail in the review by Wyer et al. 2022 [26], where both the direct effects of NH3 (mainly on the respiratory system) and the contribution of PM2.5 exposure, and hence chronic health problems leading to premature mortality, can be directly linked to NH3 emissions from agriculture.
On this background, the focus of this study is to assess the impact on sensitive ecosystems in Denmark and human health in Europe, including Denmark, from the reduction in NH3 emissions following the ban on mink farming in Denmark. It is also the aim to estimate the corresponding socio-economic costs and potential benefits. It is hypothesised that there are substantial socio-economic benefits from the reduction in NH3 emissions when mink farming is banned. It is also hypothesised that these benefits could be comparable in size to the governmental compensation costs of closing the entire national mink industry.

2. Methods and Data

In the evaluation of the environmental impacts of the Danish mink farming sector presented in this study, the focus is solely on the changes in emission of NH3 from the point sources (houses and manure storage) corresponding to the locations of the farms in 2019. Data detailing point source emissions are well reported in the Danish system and can be directly included in the modelling study. Additional emissions will take place from the application of the manure from mink farms on agricultural fields; however, the data on field applications of manure are not available and have therefore not been included in the model calculations. Data on the housing location of all agriculture-related animals including fur animals have been recorded since 1996, and from 2010, the information also includes housing type [27,28]. The annual NH3 emissions from housing and manure stores are based on the Danish Normative System [29]. The Danish Normative System is the annually updated normative nitrogen excretion rates for all agricultural animals, including correction factors for differences in productivity on each farm (nitrogen feeding strategy, milk production, number of piglets, number of cubs, etc.) and the related NH3 emission for each housing system.
The flow of NH3, from emission to the atmosphere to effects in humans and the environment, is depicted in Figure 1. In this study, we consider the chemical transformations of NH3 resulting in airborne PM2.5 and the contribution from NH3 and reaction products of NH3 to the dry and wet deposition of Nr.
To quantify the impacts, a combination of air pollution modelling and impact assessment has been used. The modelling is performed with the regional-scale chemistry-transport model DEHM (Danish Eulerian Hemispheric Model) and a local downscaling technique for the NH3 deposition based on high-resolution proxies from the OML-DEP model. The impact assessment is performed with the EVA (Economic Valuation of Air pollution) model system for human health impacts and costs. All methodologies and data are described in the following.

2.1. Regional Scale Modelling

The Danish Eulerian Hemispheric Model (DEHM; [30,31]) is used to calculate the concentrations and depositions of all relevant air pollution components (80 in total, including the components NH3 and PM2.5) for the whole of Denmark. All relevant reaction products and reactants related to the emissions of NH3 from mink farming are included. Both organic as well as inorganic chemical reactions are included in the model. The inorganic reactions describe the transformation and reactions of the different Nr components. Included in the calculated depositions from the DEHM are the gaseous Nr components NH3, nitric acid (HNO3), nitrogen-oxides (NO and NO2), dinitrogen-pentoxide (N2O5), and peroxy-nitric-acid (HO2NO2) and the particulate components ammonium-nitrate (NH4NO3), ammonium-bisulphate (NH4HSO4), ammonium-sulphate ((NH4)2SO4), peroxy-acetyl-nitrate (PAN) and organically bound nitrates. Some of these components are in the gas phase (e.g., NH3), others in the particle phase (e.g., reaction products from NH3), and both gas phase reactions and gas-to-particle conversions are taken into account. All the particulate components resulting from NH3 also contribute to the mass concentration of PM2.5.
The domain of the DEHM covers the Northern Hemisphere in a polar stereographic projection true at 60° N, with a spatial resolution of 150 km × 150 km. High resolution is obtained over the Danish area using a two-way nesting technique, increasing the resolution over Europe (to 50 km × 50 km), Northern Europe/Scandinavia (to 16.67 km × 16.67 km), and Denmark (to 5.56 km × 5.56 km). In the vertical, 29 model levels resolve the lowest app. 15 km of the atmosphere.
The DEHM is part of the Copernicus Atmospheric Monitoring Service, which provides ensemble-based operational daily air quality forecasts for Europe (https://atmosphere.copernicus.eu/, accessed on 3 January 2024). The calculated concentrations and depositions of the DEHM are evaluated in [32,33] and on a routine basis in the Danish monitoring programme for water and nature (NOVANA; e.g., [34]).

Setup of the DEHM

Meteorological data calculated with the Weather Research and Forecasting model version 3 (WRF, [35]) are used as input for the DEHM. The WRF model is setup with the same domain and horizontal resolution as the DEHM to avoid interpolation in space, and hourly output is saved to minimise errors from interpolation in time. Land cover data are based on the EMEP classification [36]. Anthropogenic emission data for the hemisphere are based on the Eclipse v6b database [37] and for Europe on the EMEP database [38].
For Denmark, the emissions from the national emission model SPREAD [39] with 1 km × 1 km resolution are included in the calculations. These data are supplemented with very-high-resolution emission data for NH3 from the agricultural sector, further described below. Natural emissions are derived from the Global Emissions InitiAtive dataset (GEIA, [40]) or are calculated directly in the DEHM (see [41,42]). All anthropogenic emissions are provided as gridded annual totals and redistributed over the year for individual countries, emission sectors, and chemical components using standard monthly temporal profiles. The temporal variation across the week and the day also depends on the sector and chemical component but is averaged across the whole of Europe. All temporal profiles are obtained from the EURODELTA project [43]. Dynamic temporal time profiles are included for the Danish NH3 emissions taking agricultural practice and meteorology into account [44,45].
Meteorology is an important factor for air pollution, and to reduce the influence of meteorological variations on the resulting concentrations and depositions, the model runs are performed for the meteorological years 2017, 2018, and 2019, with emissions from 2019. The DEHM provides the possibility for following—or tagging—emissions from a specific sector, country, or individual source. The methodology is documented in [46].
NH3 emissions from mink farming in Denmark are tagged in the model runs with the DEHM, and the atmospheric concentrations and depositions, here denoted delta-concentrations and delta-depositions, of the chemical pollutants directly related to the emissions of NH3 from mink are analysed separately. The delta-concentrations are used as input for the impact assessment for human health, and the delta-depositions of NH3 (together with the other components that contribute to Nr) are used as input for the assessment of critical load exceedances. Both assessment methodologies are described below.
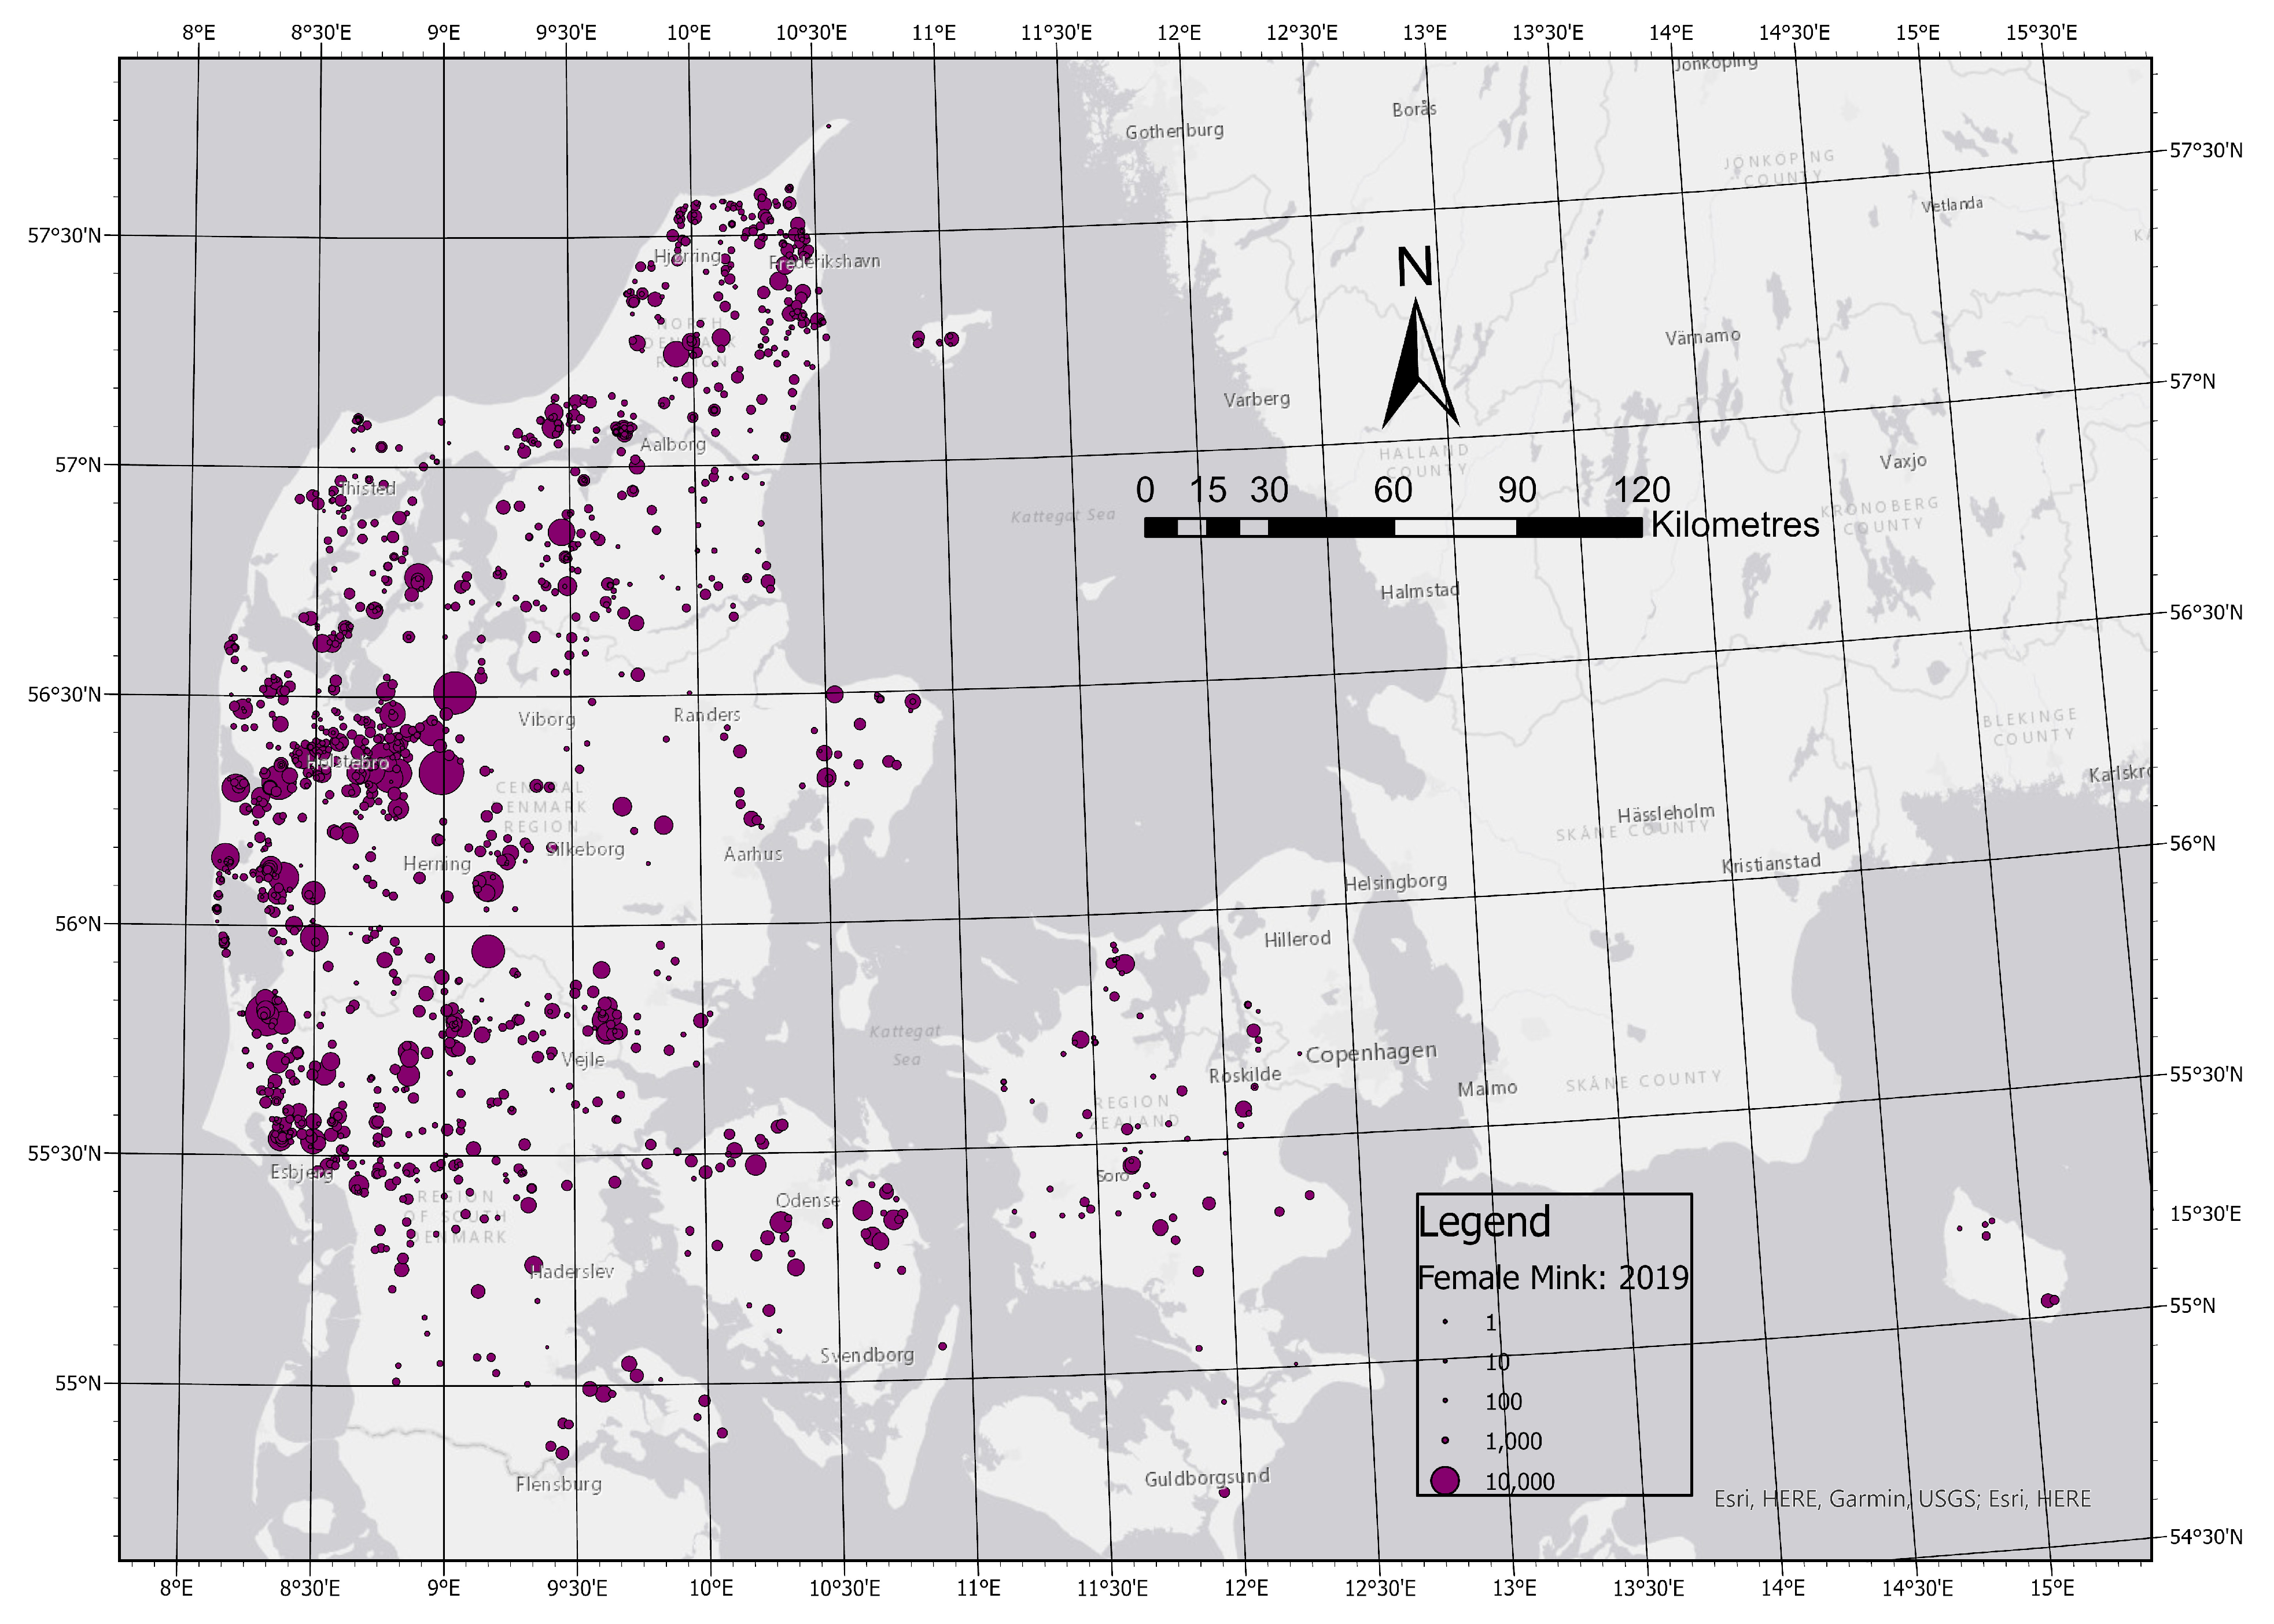
The NH3 emissions from mink farming are based on the national inventory of all farm animals, from which the emissions of the individual mink farms have been extracted. The specific location is only known for the point sources (housing and manure stores), whereas the locations of the area sources (the agricultural fields where the manure from the mink farms are applied) are unknown in the system. Figure 2 shows the distribution (location and number) of female mink in Denmark. As described in the introduction, the concentration of mink farms is most dense in the western part of Denmark, where sandy soils dominate over clay. This is clearly seen in the distribution of female mink in Figure 2.

2.2. Human Health Impact Assessment

The Economic Valuation of Air pollution model system (EVA; [46,47]) is based on the impact-pathway chain [48]. This is a method used for understanding the impacts from specific emission sources or source sectors, by following the emissions in atmospheric transformation and transport to exposure and the final impact, e.g., on human health. The EVA system makes it possible to assess the health effects and related societal costs/benefits of air pollution from specific emission groupings/scenarios, e.g., in sectors, countries, or otherwise.
The EVA system is based on the combination of modelled air pollution concentrations, gridded population data, exposure–response functions connecting exposure to air pollution with health outcomes, and cost estimates per single outcome. In this study, the EVAv8 setup is applied, and the modelled air pollution delta-concentrations are obtained from the DEHM as described above. The population data are based on a 2017 distribution from the national Central Person Registry (CPR) for Denmark, scaled to 2018 and 2019 with the annual national totals. For the rest of Europe, the global population density data have been combined with a dataset for country-specific age distributions and interpolated to the years 2017, 2018, and 2019 [41]. The choice of relevant air pollutants and the implementation of exposure–response functions detailing the relationship between exposure to air pollutants and health effects are based on the meta-reviews and recommendations of the WHO global air quality guidelines [16,49]. Monetary valuations are derived from [50]. Table 1 presents the included health outcomes and corresponding cost functions.
The most important air pollution components for human health impacts are PM2.5, nitrogen dioxide (NO2), and ozone (O3). The delta-concentrations of these three components (and the now—due to a large decline in concentrations—less important component sulphur dioxide, SO2) are here extracted from the results of the tagged model runs with the DEHM. In this way, the delta-concentrations reflect the emissions of NH3 from mink farming point sources. Following the extraction, the delta-concentrations are processed with the EVA system to estimate the impact on human health.

2.3. Local-Scale Deposition of Nitrogen

The distribution of air pollution concentrations, arising from emissions from mink farming and calculated with the DEHM, are available at a 5.56 km × 5.56 km spatial resolution, which is suitable for the calculation of premature mortality and morbidity in the EVA system. However, the spatial resolution of the nitrogen deposition estimates (and therefore the delta-depositions) is too coarse for a detailed assessment of the critical load exceedances of Nr in Denmark. This is because only a few Danish nature areas, sensitive to Nr, are comparable in size to these 5.56 km × 5.56 km grid squares. Additionally, the contribution to the deposition in nature areas from local sources can be high and cause exceedances, even though these high values of deposition are not captured by the DEHM due to the relatively coarse resolution.
At the local scale, the most important component to the model is NH3, as this component has a relatively high activity rate. It either deposits close to the source or is transported farther away by the wind, where the NH3 either can be transformed to ammonium (NH4+)-forming particles, wet deposited due to rain or snow, or dry deposited. The chemical transformation and wet deposition processes are handled in the DEHM, but for the local-scale NH3 dry deposition, a different approach is used to complement the results of the DEHM.
Based on the same farm-level NH3 emission inventory for the point sources of mink farming in Denmark, NH3 dry deposition is calculated on a 50 m × 50 m grid covering Denmark, using dry deposition functions for NH3. The resulting high-resolution dry depositions of NH3 are added to the DEHM background depositions (mean of 2017–2019) of all the other components included in Nr depositions. Finally, the total high resolution Nr deposition map is compared with national critical load limits for Nr and detailed land use data for Denmark to assess the impact of changes in Nr deposition to sensitive nature areas with respect to where critical loads are exceeded.
The dry deposition functions have been constructed using the local-scale Gaussian plume model OML-DEP [51,52]. OML-DEP is a high-resolution dispersion model specifically developed for the local-scale deposition of ammonia and part of the Danish Ammonia MOdelling System (DAMOS; [33]). The DAMOS is based on a coupling between the DEHM for the regional scale and the OML-DEP model for the local scale, and the system is used, e.g., in the reporting of the deposition of NH3 to Danish nature areas in the national monitoring programme for water and nature (NOVANA; e.g., [34]).
To construct the dry deposition functions, the OML-DEP model was run on a 4 km × 4 km domain with a horizontal resolution of 400 m × 400 m. The model was run with and without emissions of NH3 from a point source located on the upwind edge of the domain. The difference in the calculated dry deposition between the two runs corresponds to the contribution of the specific source to the dry deposition of NH3. The calculated dry deposition from the source is then scaled according to the emission strength of the source to provide the annual dry deposition of NH3 corresponding to one kg of emitted NH3. These calculations with the OML-DEP model have been repeated for a large number of combinations of source characteristics and land cover categories to reflect the variation in parameters relevant for dry deposition processes.
The resulting dry deposition of NH3 to a nature area at distance L from the source can be calculated as:
A L = E · D ( L ) · V F 100 · V K
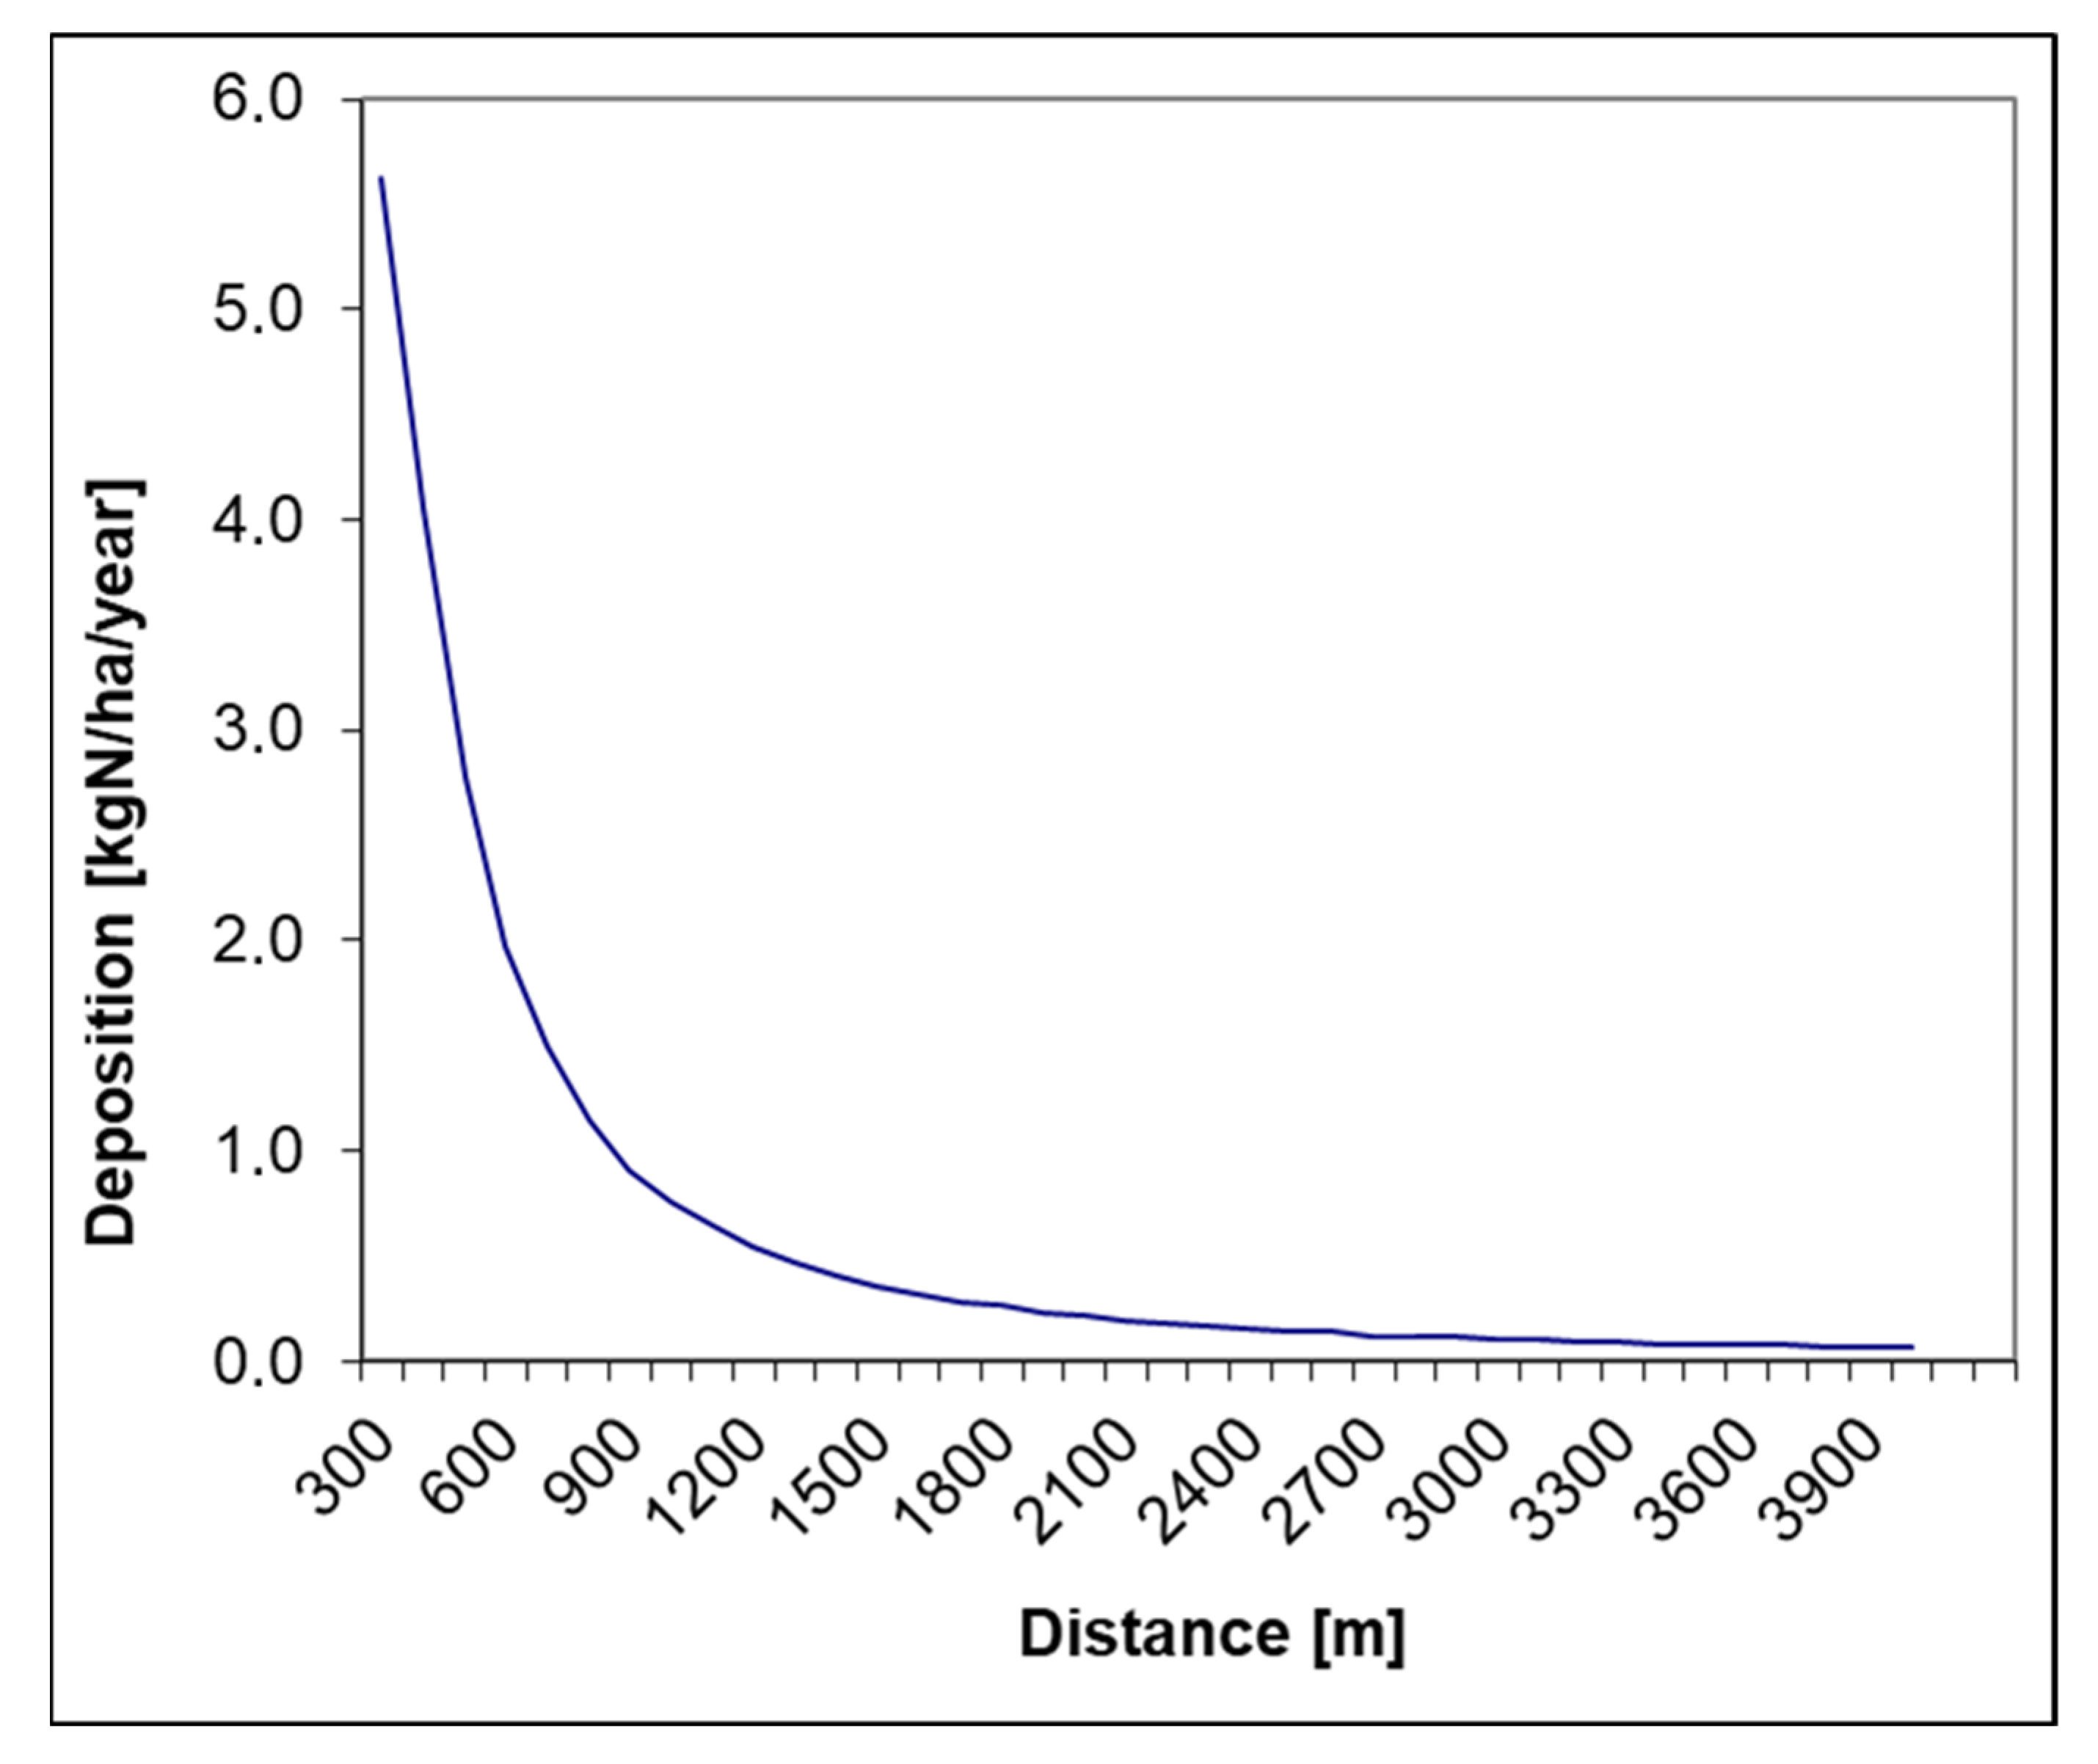
where A is the annual dry deposition of NH3 [kg N/ha/yr], E is the emission from the point source, and L is the distance from the source. D is the dry deposition function derived from the OML-DEP results. It describes the standard dry deposition at distance L for the relevant land cover characteristics of the nature area/the surface between the point source and the nature area. VF is the mean wind frequency in the 30° wind sector towards the nature area (based on regional data from the Danish Meteorological Institute for the time period 1985–2004). VK is a tabulated wind correction, depending on the mean wind speed in the selected wind sector (derived in sensitivity studies with the OML-DEP model). Figure 3 shows an example of a deposition function, D. The unit for D is kgN/ha/year pr kgN/year emitted.
It is expected that the use of deposition curves based on twenty years of meteorological data and a spatial resolution of 50 m × 50 m for the deposition assessment is a good choice for the country-scale effect. Because of the large number of farms included (~10,000) and the limited accuracy of the precise location of the emission sources (~100 m), it is not expected that the use of more advanced dispersion models would improve the accuracy of the country-scale assessment.
In the analysis of critical load exceedances for Denmark, three nature categories (defined in the Danish ammonia regulation; BEK nr 2256 by 29/12/2000) where sensitivity to NH3 is important, are investigated:
  • Category 1: NH3-sensitive nature types within Natura 2000 areas including heathland and dry grassland in Natura 2000 areas.
  • Category 2: Selected NH3-sensitive nature types outside Natura 2000 areas, such as heath areas larger than 10 ha, dry grassland larger than 2.5 ha, raised bogs, and lobelia lakes.
  • Category 3: All NH3-sensitive nature types outside Natura 2000 areas that are not included in Categories 1 and 2; heaths, bogs, dry grasslands and NH3-sensitive forests.
For each of the nature types included in these categories, the number of ha where the critical load is exceeded can be computed based on the resulting local-scale gridded deposition of Nr, the extent of the nature areas, and the critical loads for the specific nature types. For nature areas included in Category 1, nationally computed critical loads based on targets for biodiversity have been used [53]. For nature areas included in Categories 2 and 3, empirical critical loads developed by the UNECE Air Convention [54] have been used.
The extent and location of the nature areas is derived from the land-cover dataset Basemap02 [55], which is based on a combination of a topographical database, management plans for state forests and defence holdings, maps of protected habitat types, Natura2000 habitat types, field parcel maps, field block maps, and cadastre maps. The conversion from vector data to raster format is based on a cell size of 10 m × 10 m [56].

3. Results

In this section, the delta-concentrations and corresponding exposure and impact assessment for human health as well as the downscaled delta-depositions and resulting critical load exceedances are presented. The concentrations modelled with the DEHM for 2017–2019 have been evaluated for Europe with all available measurements of NH3, NH4+, and PM2.5 from EBAS [57] and the Danish monitoring network [21]. The result of the evaluation is presented in the Supplementary Material, Figures S1–S4.

3.1. Health Effects and Related Socio-Economic Costs Calculated with EVA

The emissions of NH3 from mink farming result in changes in the concentrations of a number of components through chemical transformation in the atmosphere. PM2.5 is directly influenced through the formation of NH4+-containing particles from NH3. NO2 and O3 are indirectly influenced (but to a much smaller extent) through the reaction between NH3 and nitric acid, which in turn affects the concentration of NO2 and thereby also O3, as these components are inter-related through several chemical reactions.
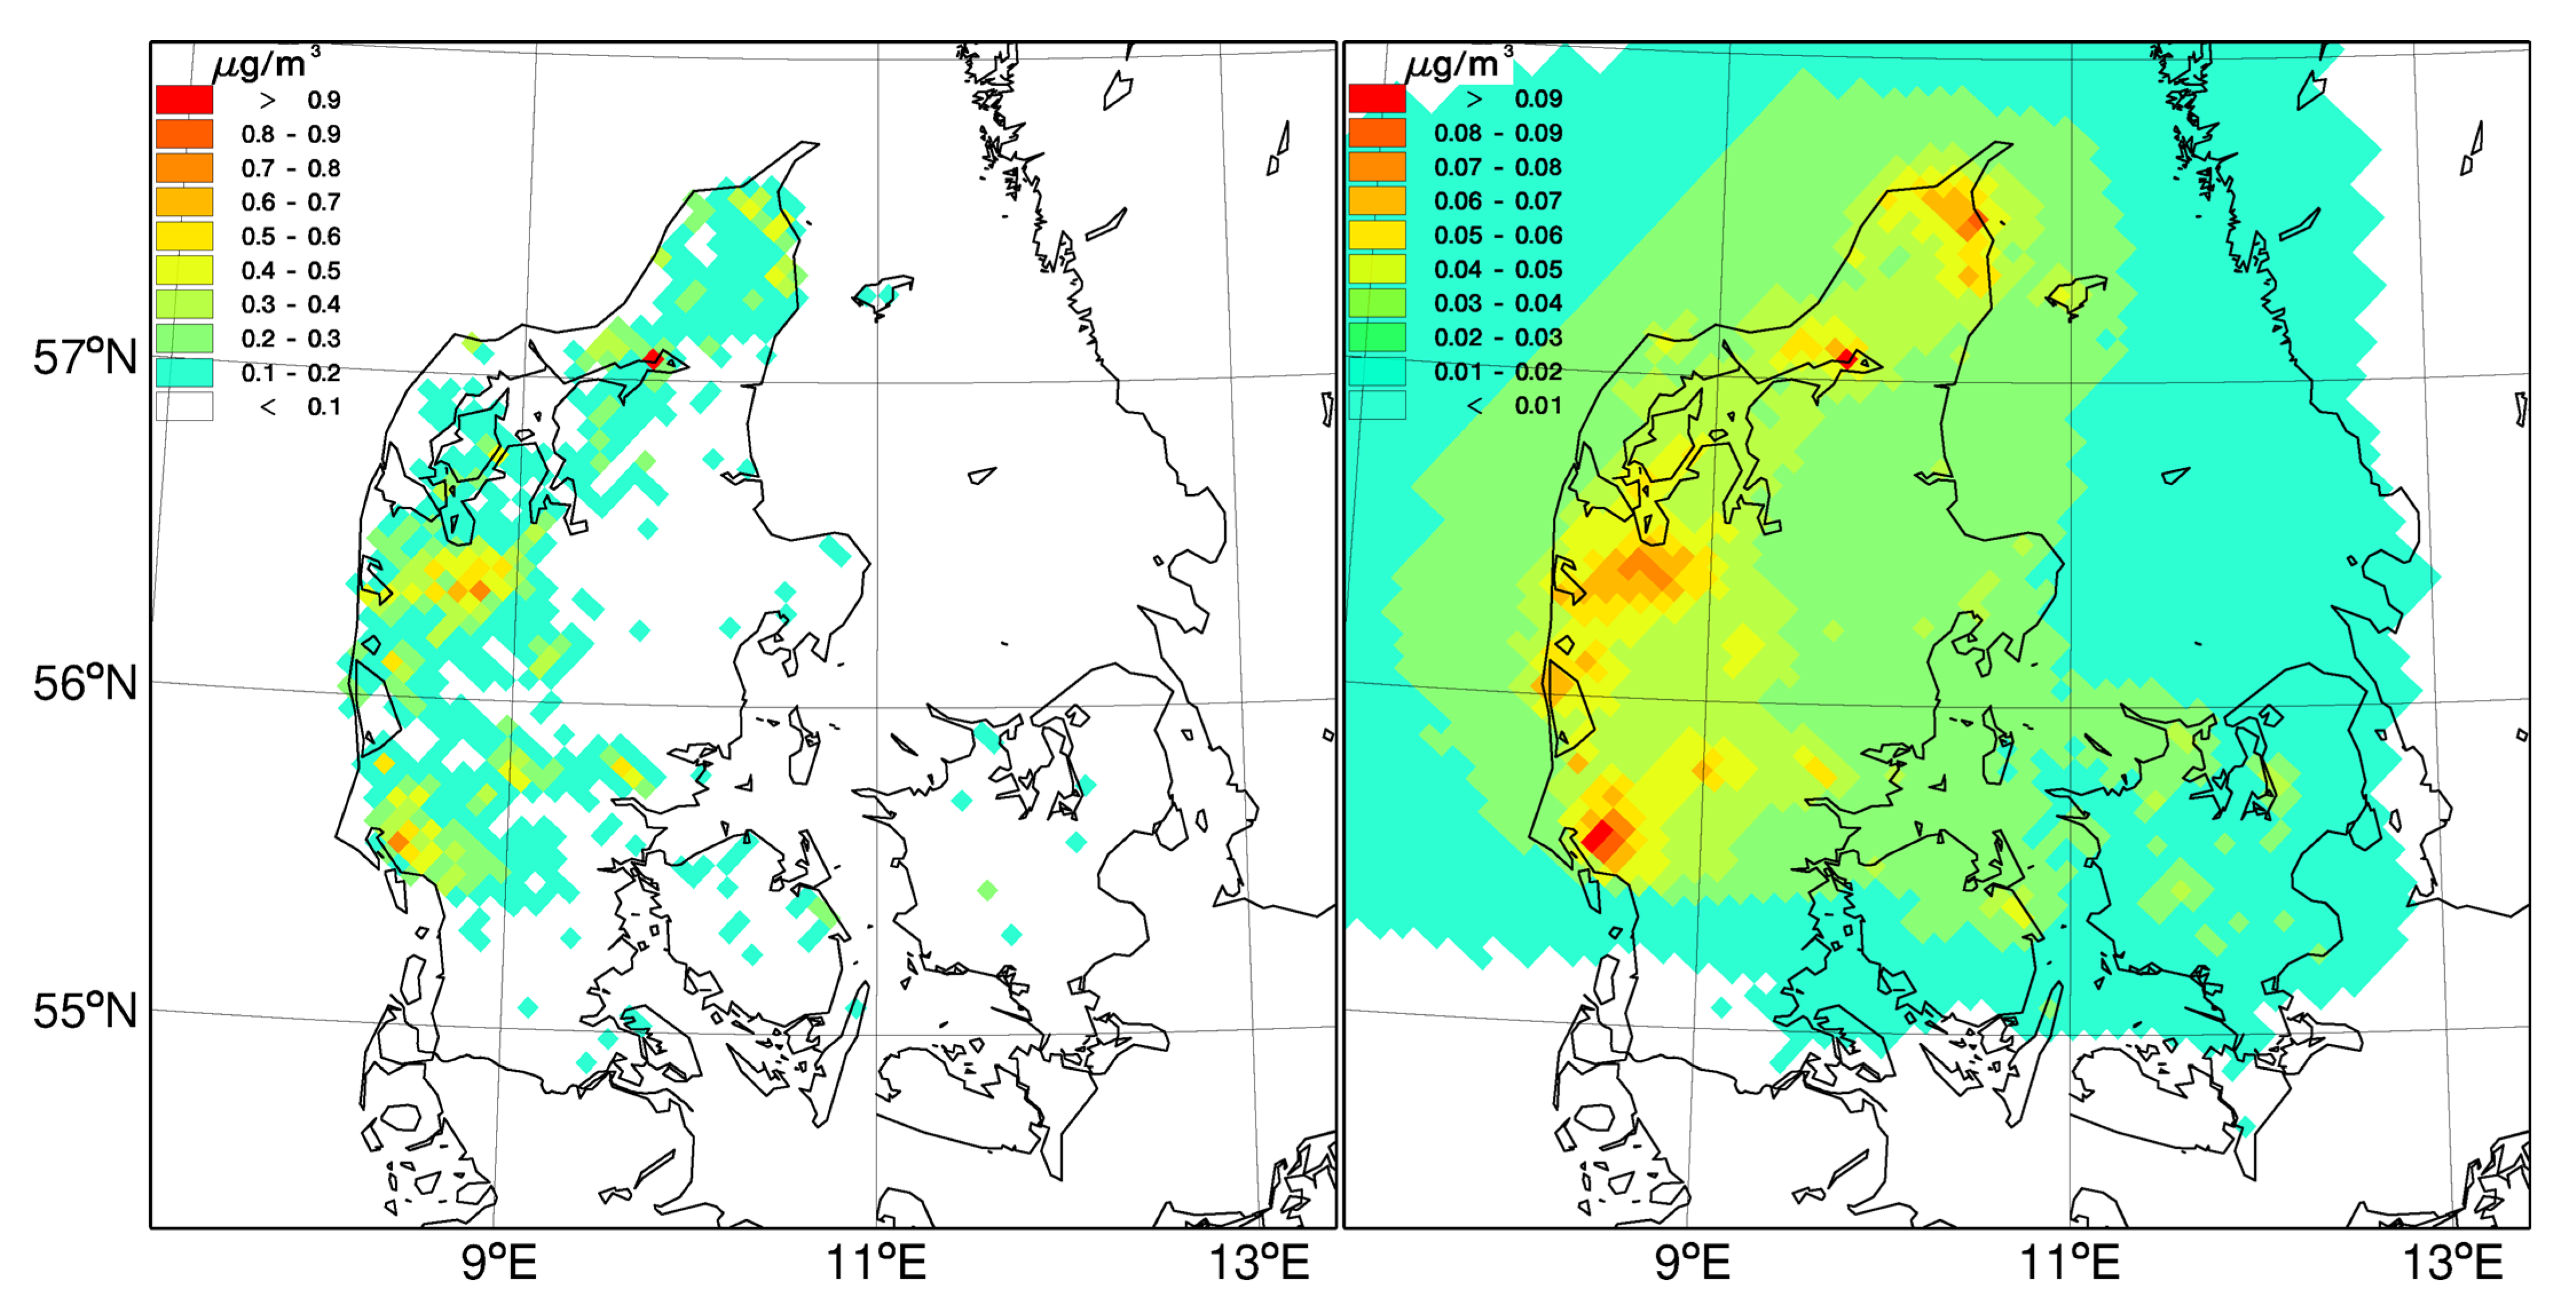
The modelled concentrations of NH3 and PM2.5 are shown in Figure 4 as the total concentration (all emissions included) and in Figure 5 as the delta-concentrations arising from the mink sector (based on the emissions from mink farming point sources only) for the average of the years 2017, 2018, and 2019.
The ambient concentration of NH3 is seen to have a north–south as well as an east–west gradient. The first is due to the relatively lower level of agricultural activities to the north, combined with relatively higher levels of agricultural activity in the south of Denmark. Within Denmark, the highest emissions of NH3 from agriculture take place in the western part of the country, hence the east–west gradient. Ambient PM2.5 concentrations are dominated by a strong north–south gradient due to the long lifetime of the fine particles in the air, combined with the large source areas in northern Germany, Poland, and The Netherlands.
Examining the delta-concentration plots in Figure 5, it can be seen that there is a strong correspondence between the location of the mink farms (Figure 2) and the concentration of NH3 that arises from mink farm emissions. This is also the case for PM2.5; however, the levels of the delta-concentrations of PM2.5 are an order of magnitude smaller than the levels of NH3, and the extent of the delta-concentration signal related to the source is larger. This can be explained by NH3 being the primary component with by far the largest emission from the mink sector and by the shorter lifetime of NH3 in the atmosphere compared with PM2.5.
The annual impacts on human health for 2019 emissions are presented in Table 2. Impacts include premature deaths (mortality) and illness (morbidity) resulting from the emissions of NH3 from mink farming, and the results are averaged over the meteorological years 2017–2019. The main cause of impacts on human health is long-term exposure to the PM2.5 concentration in the air. In the EVA model system, the impacts can be separated between Denmark and the rest of Europe, and Table 2 presents the total impacts in Europe as a whole as well as the impacts in Denmark alone.
In total, 64 premature deaths can be ascribed to the emissions from Danish mink farming in 2019. For Denmark alone, there are 12 cases of premature mortality. With respect to morbidity, some ~40 extra hospital admissions, ~200 extra cases of bronchitis, and ~40,000 days with work loss or restricted activity are the most prominent results. The non-linearity of the chemical reactions in the atmosphere can be seen in the results for the days with minor restricted activity. Here, the result is small but negative due to the complex chemical interactions involving NO2 and O3.
The annual socio-economic costs arising from these impacts on human health are also presented in Table 2. The total cost for Europe including Denmark is estimated at ~EUR 142 million annually. For Denmark alone, the cost sums up to ~EUR 29 million. It is the premature mortality that is responsible for the majority of the socio-economic costs. The results for health impacts and costs for the individual meteorological years are presented in the Supplementary Material as Tables S1–S3.
The administrative financial cost of closing the entire mink farming sector in Denmark is estimated to be DKK 24 billion (~EUR 3.2 billion). This is based on a broad political agreement regarding compensation for mink farmers [58]. With an estimated saved health cost—or benefit—per year in Denmark of ~EUR 29.3 million, it takes ~110 years before the compensation cost of closing the mink sector breaks even with the benefits from the reduction in health impacts if only the effects in Denmark are considered. If the health effects in Europe are also included, the benefit amounts to ~142 million, and the break-even point occurs after ~23 years.

3.2. Nitrogen Deposition and Critical Load Exceedances

The emissions of NH3 from mink farms contribute to the total deposition of Nr both directly as NH3 deposition and indirectly through the transformation of NH3 to NH4+-containing particles. Both NH3 and particles containing NH4+ deposit through dry and wet deposition processes, and the results for both deposition pathways as well as the total deposition calculated with the DEHM are presented for the five administrative regions in Denmark in Table 3.
The numbers in black in Table 3 present the ambient average NH3 concentration and the total Nr deposition to all land surfaces in each of the five administrative regions covering Denmark. Additionally included is the ambient average NH3 concentration for the country as a whole and the sum of the Nr deposition to all Danish land and marine areas. All emission sources, national and international, are included in these concentrations and depositions. The numbers in red in Table 3 show the percentage contribution to the average concentrations, respectively, the sum of depositions, from Danish emissions of NH3 from mink farming.
In general, the largest ambient average concentrations of NH3 are observed in the Mid Jutland and Southern Denmark regions. This can be explained by the higher intensity of agricultural activities in the western/southern part of Denmark and in the northern part of Germany. This distribution is also evident in Figure 4, left, showing the modelled ambient average concentration of NH3. For the sum of Nr deposition, the highest values are found in North and Mid Jutland as well as in Southern Denmark, and the lowest values are found in Zealand and the Capitol region. The two latter regions are both located in the eastern part of the country.
Considering the mink farms specifically, the largest farms in 2019 were located in North Jutland and Mid Jutland. This is also reproduced in the results from the calculations with the DEHM presented in Table 3 in red, where the highest contributions to the concentration of NH3 from mink farming are seen in these two regions. Dry deposition is the most important pathway for NH3, and the contribution to dry deposition from mink farming is around 5% for Nr for the North Jutland and Mid Jutland regions. For Denmark as a whole, emissions of NH3 from mink farming in 2019 contributed 4.4% to the average NH3 concentration level and 0.8% to the total deposition of Nr (averaged over three years of meteorological data for the time period 2017–2019).
Figure 6 shows the spatial distribution of the dry, wet, and total delta-depositions of Nr averaged over 2017–2019 across Denmark, calculated with the DEHM. To obtain the dry deposition values in each grid cell, the dry deposition is calculated for each surface type included in the model, and the resulting deposition is then based on the land cover weighted deposition.

3.2.1. Local-Scale Deposition of Nr

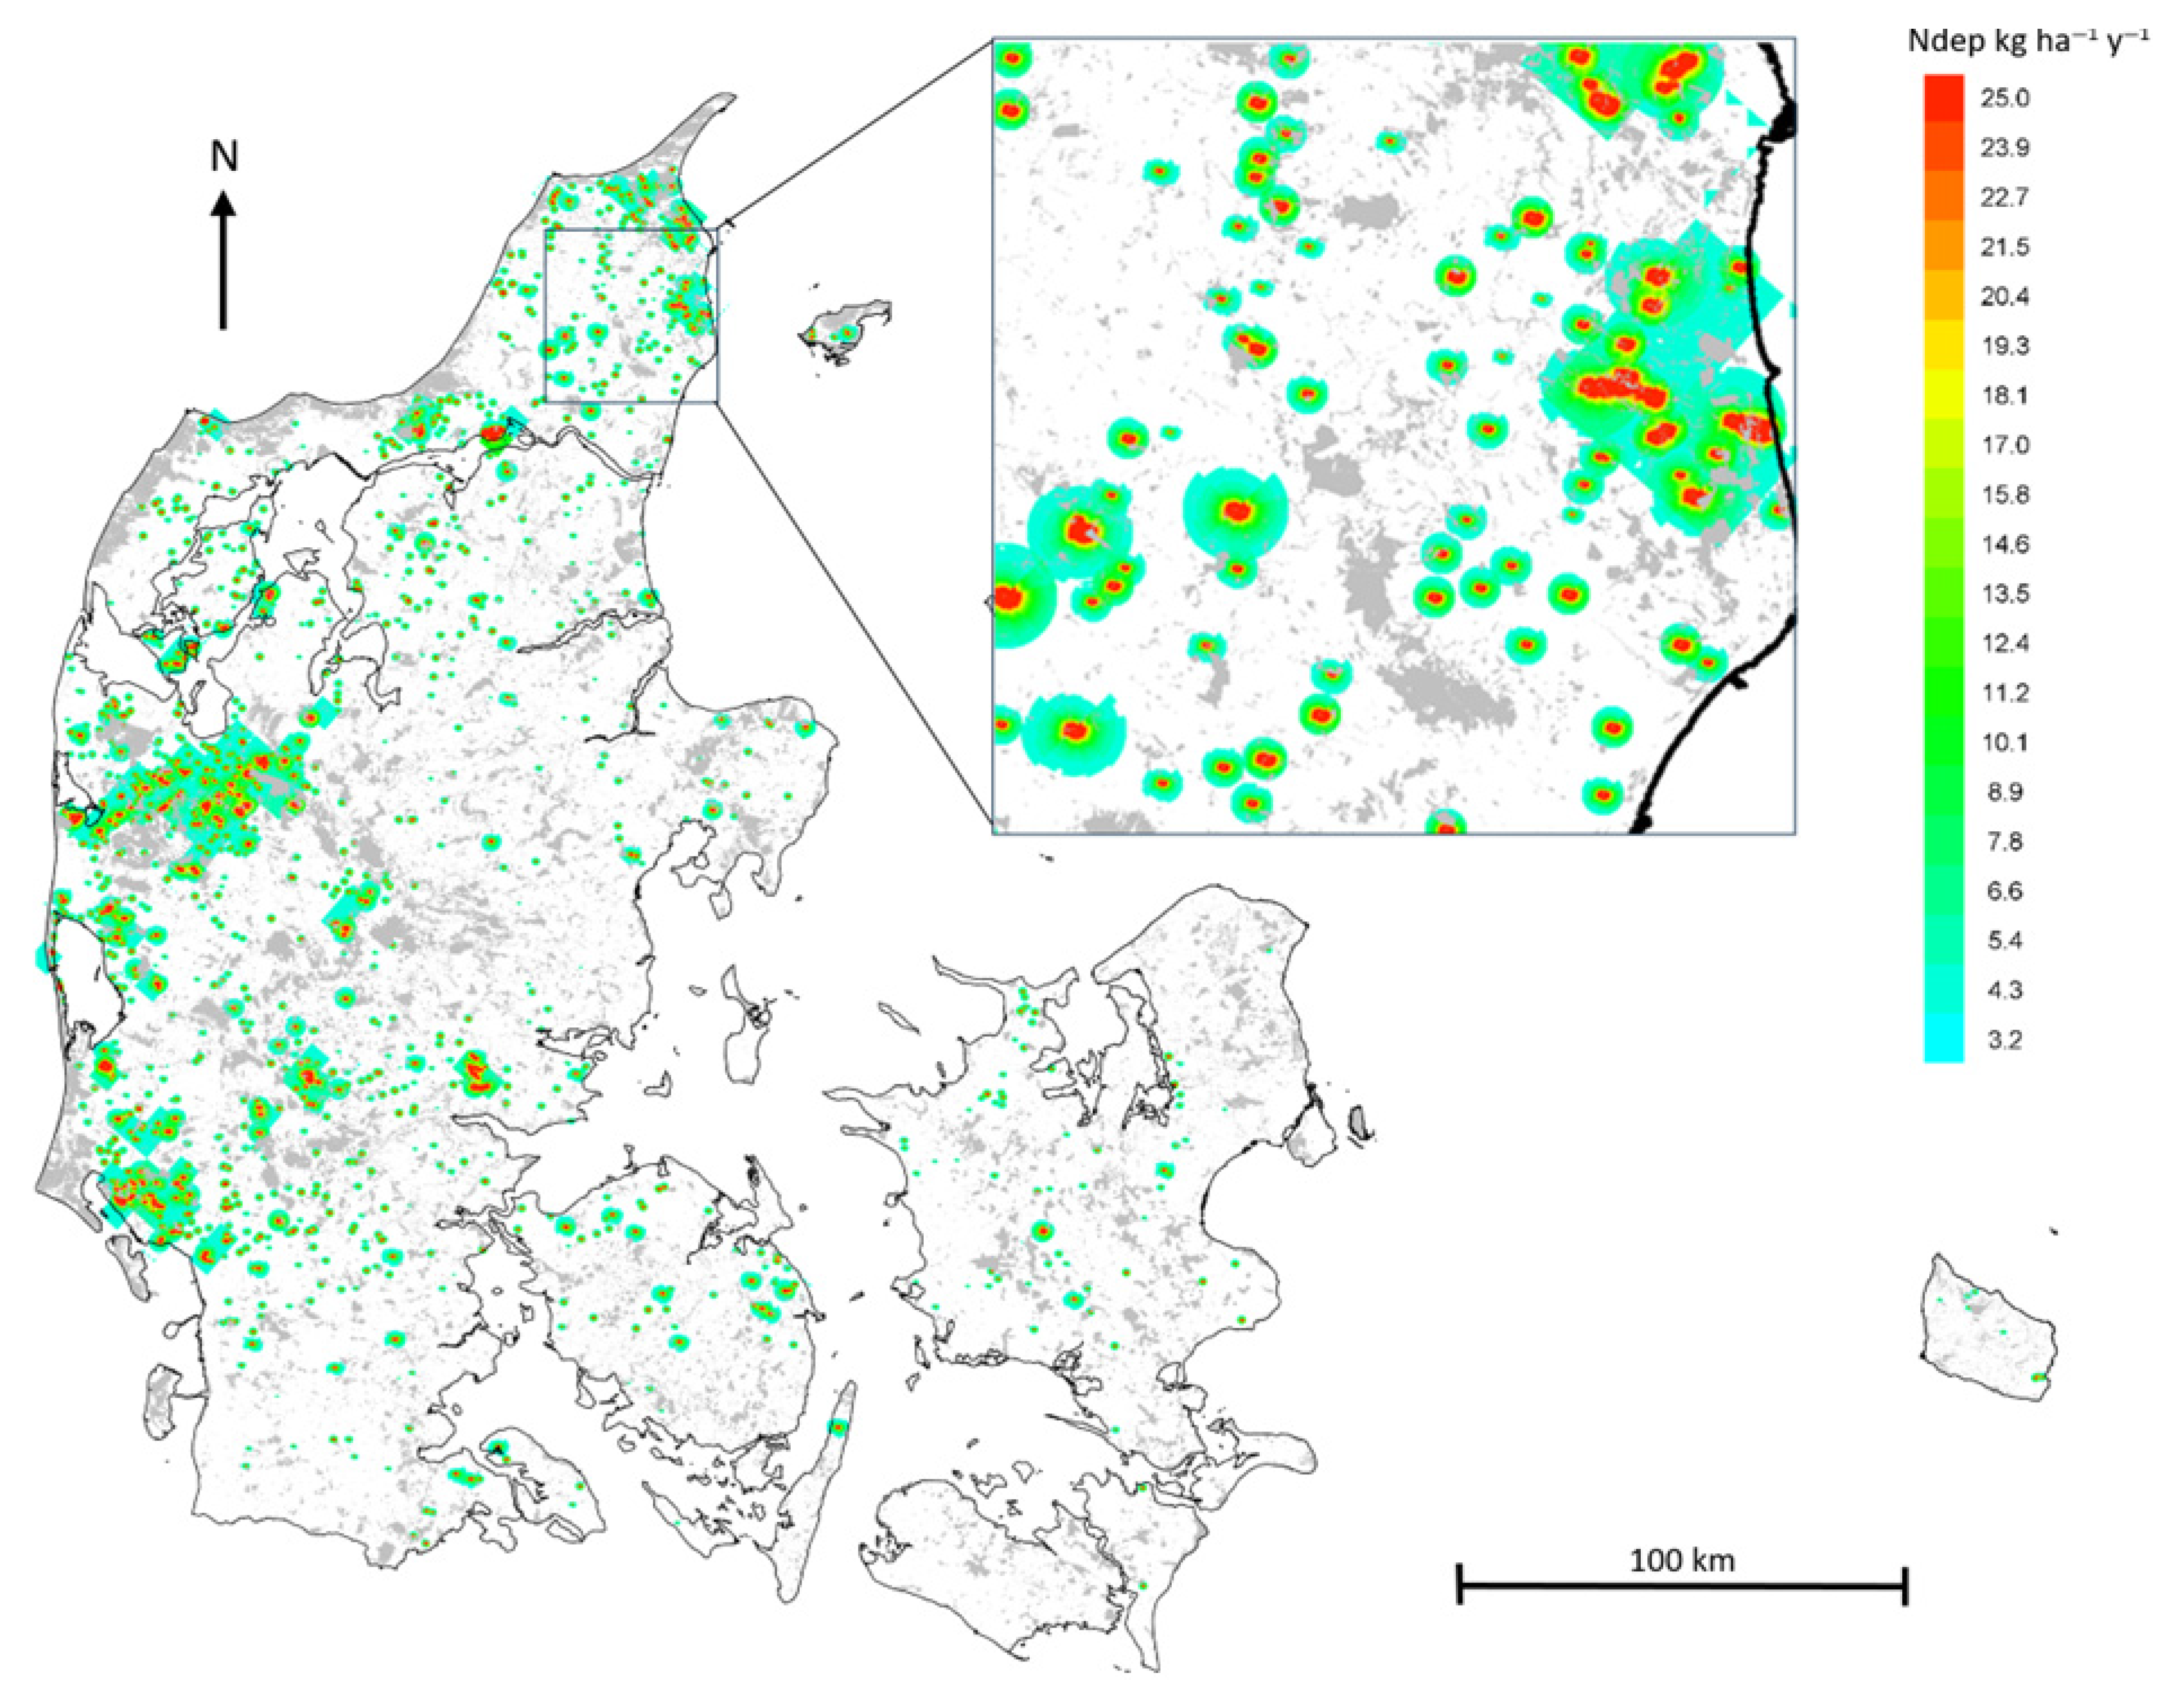
Using the methodology described earlier, the local-scale calculated NH3 dry deposition is combined with the gridded dry depositions of the rest of the Nr components and the wet deposition of all Nr components from the DEHM. The resulting detailed map of the total Nr deposition for Denmark for emissions from mink farms is shown in Figure 7. The deposition pattern naturally reflects the distribution of mink farms (compare to Figure 2) The proximity of mink farms to sensitive nature areas is also clearly visible in the zoom over Northeast Jutland (sensitive nature areas marked with grey in Figure 7).

3.2.2. Critical Load Exceedances

Many nature areas in Denmark are subject to Nr deposition exceeding the critical load applicable for the area. Based on the results for local-scale deposition from 2019 mink farming emissions, it is possible to calculate the reduction in area with critical load exceedance that will occur when there are no longer emissions from mink farming. Table 4 shows the size of the areas with exceedance of the critical load for the three main categories of sensitive nature for the two scenarios with and without 2019 point source emissions from mink farming in Denmark.
From Table 4, it can be seen that the complete cessation of point source emissions from Danish mink farming reduces the area of sensitive non-forested nature with critical load exceedances in Denmark by ~4000 ha. The area of NH3-sensitive forest with critical load exceedance is also reduced by ~10,600 ha. In total, sensitive nature with a Nr deposition above the critical load will be reduced by ~10% in terms of area when there are no emissions of NH3 from mink farming.
The cost for eutrophication of sensitive nature areas is difficult to calculate and not yet included in the EVA system. An attempt to compare the cost for eutrophication to the estimated socio-economic benefits related to reduced effects on human health from reduced mink farming is to consider the restauration cost for severely eutrofied (non-forested) nature areas. Given an approximate restauration cost of EUR 27,000 pr ha [59], the present case with 4000 ha of sensitive nature affected represents a (one-time) socio-economic benefit of ~EUR 110 million, corresponding to ~77% of the annual benefits estimated for health effects attributed to air pollution.

4. Conclusions/Discussion

Emissions of NH3 from applied manure from mink are not included in this study due to the lack of data. This will underestimate the contribution from mink to the atmospheric concentration of NH3 and thereby PM2.5, leading to an overall underestimation of the health impacts. It will also underestimate the contribution from mink to the deposition of Nr, calculated with the DEHM and the deposition functions from OML-DEP on the local scale. The area-based emissions from manure application of NH3 in general constitute about one-third of the total NH3 emission in Denmark [60]. The share is probably a little smaller for mink, but the application of mink manure takes place relatively closer to nature areas due to the location of the mink farms. With this in mind, the benefits for nature areas and human health from closing the mink farming in Denmark could be up to 50% higher than estimated in this assessment.
NH3 is also subject to long-range transport, and although emissions of NH3 from Danish mink farming mainly deposit on Danish land (and water areas) according to the calculations with the DEHM, there can also be a substantial contribution and corresponding effects from the deposition of Nr from Danish mink farming abroad. This impact is also not included in the present assessment.
In conclusion, the socio-economic impact for human health and critical load deposition of closing the mink sector down constitutes an annual benefit. The reduced health impacts correspond to an annual benefit of ~EUR 142 million, and there is also a one-time benefit from reduced eutrophication of ~EUR 110 million. Compared to the compensation cost of ~EUR 3200 million, it is concluded that over a time period of ~22 years, the benefits of closing the mink sector break even with the costs from compensation to mink farmers, assuming that the mink sector activities are closed for good.
In the review performed by Wyer et al. [26], the results showed that emissions from agricultural activities constitute ~90% of the total emissions of NH3 and contribute to 50% of the ambient PM2.5 in Europe. They concluded that one of the most efficient ways to reduce PM2.5 is to reduce global NH3 emissions from agriculture. In 2019, emissions from all Danish agricultural activities constituted ~95% of the national emissions of NH3 [61], of which ~7% were from mink farming. The emissions of all air pollutants from the Danish agricultural sector were, through reactions with other components in the atmosphere, associated with ~63% of the ambient concentration of PM2.5 arising from Danish sources in 2019. Agricultural emissions were also responsible for ~20% of the annual number of premature deaths and ~19% of the total socio-economic costs of air pollution attributable to Danish emission sources in Denmark [62]. Both Wyer et al. [26] and De Vries [6] show that the socio-economic benefits for human health will outweigh the costs of reducing NH3 emissions, e.g., by introducing better technology for manure handling. In the present assessment, the costs are not from reducing NH3 emissions but from compensation to former mink farmers, and these costs are higher.
Focusing on the ~10% reduction in nature areas with critical load exceedances from reducing mink farming emissions to zero, it is interesting to compare this number with the ~7% that the mink emissions constitute of the entire Danish NH3 emissions. The relatively higher contribution of NH3 emissions from mink farming to the critical load exceedance compared to the emission contribution from mink farming is linked to the fact that the mink farms are located close to the sensitive nature areas. The benefit of reducing this specific emission source is therefore relatively larger than the reduction itself.
Another perspective regarding the benefits for society is that the reduction in national total NH3 emissions obtained as a result of closing the mink farming sector ensured that Denmark was able to attain the reduction target goal for NH3 emissions in 2020. This is required by the UNECE Gothenburg protocol on long-range transboundary air pollutants (https://unece.org/environment-policy/air, accessed 20 March 2025) and the EU NEC Directive (2016/2284/EU). With this protocol, Denmark had agreed to reduce national total NH3 emissions by 24% from 2010 to 2020. As of 2021, it had only been possible to reduce the national total emission by ~17–18%, thus making it difficult to reach the reduction target. However, by introducing the ban on mink production and thereby reducing the national NH3 emissions, Denmark was able to reach its commitment with respective to the directive. With the closing of the mink sector, the projections for 2030 also show compliance with the NEC 2030 targets.
As of 2023, the ban on mink farming has been lifted. Due to the complete eradication of the mink farming sector, leading also to the collapse of supply chains, the sector has only slowly started returning to Danish agriculture.

Supplementary Materials

The following supporting information can be downloaded at: https://www.mdpi.com/article/10.3390/atmos16080966/s1, Table S1: Health effects (cases) and socio-economic costs (1000 €) in Europe (EU) and Denmark (DK) attributed to the air pollution arising directly from emissions of NH3 from mink farming in Denmark in 2019. All numbers represent meteorological data for the year 2017; Table S2: Health effects (cases) and socio-economic costs (1000 €) in Europe (EU) and Denmark (DK) attributed to the air pollution arising directly from emissions of NH3 from mink farming in Denmark in 2019. All numbers represent meteorological data for the year 2018; Table S3: Health effects (cases) and socio-economic costs (1000 €) in Europe (EU) and Denmark (DK) attributed to the air pollution arising directly from emissions of NH3 from mink farming in Denmark in 2019. All numbers represent meteorological data for the year 2019; Figure S1: Comparison of measured (y-axis) and modelled (x-axis) annual mean atmospheric concentrations of NH3; Figure S2: Comparison of measured (y-axis) and modelled (x-axis) annual mean atmospheric concentrations of NH4+; Figure S3: Comparison of measured (y-axis) and modelled (x-axis) annual mean atmospheric concentrations of the sum of NH3 and NH4+ (denoted SNH4); Figure S4: Comparison of measured (y-axis) and modelled (x-axis) annual mean atmospheric concentrations of PM2.5.

Author Contributions

Conceptualization: L.M.F. and C.G.; Methodology: L.M.F., J.L.B., J.B., J.H.C., S.G. and C.G.; Formal Analysis: L.M.F., J.L.B., J.B. and J.H.C.; Data Curation: L.M.F.; Writing—Original Draft Preparation: L.M.F.; Writing—Review and Editing: L.M.F., J.L.B., J.B., J.H.C., S.G. and C.G. All authors have read and agreed to the published version of the manuscript.

Funding

This work was supported by the Nordic Council of Ministers (NKL-2305_2024 BenefitNature) and the Horizon Europe MARCHES project (grant agreement no. 101095430).

Institutional Review Board Statement

Not applicable.

Informed Consent Statement

Not applicable.

Data Availability Statement

The datasets presented in this article are not readily available because of the level of detail, which makes them subject to GDPR restrictions. Requests to access the datasets should be directed to the corresponding author.

Conflicts of Interest

The authors declare no conflicts of interest.

References

  1. DSt. Fur Production in Denmark, Statistics Denmark. 2025. Available online: https://statistikbanken.dk/statbank5a/default.asp?w=1175 (accessed on 18 March 2025).
  2. Buchholz, K. Global Fur Production in Drastic Decline, Statista. 2025. Available online: https://www.statista.com/chart/33876/supply-volumes-of-mink-fox-pelts-on-the-world-market/ (accessed on 18 March 2025).
  3. Fenollar, F.; Mediannikov, O.; Maurin, M.; Devaux, C.; Colson, P.; Levasseur, A.; Fournier, P.E.; Raoult, D. Mink, SARS-CoV-2, and the Human-Animal Interface. Front Microbiol 2021, 12, 663815. [Google Scholar] [CrossRef]
  4. Stevens, C.J.; Duprè, C.; Dorland, E.; Gaudnik, C.; Gowing, D.J.G.; Bleeker, A.; Diekmann, M.; Alard, D.; Bobbink, R.; Fowler, D.; et al. Nitrogen deposition threatens species richness of grasslands across Europe. Environ. Pollut. 2010, 158, 2940–2945. [Google Scholar] [CrossRef]
  5. Midolo, G.; Alkemade, R.; Schipper, A.M.; Benítez-López, A.; Perring, M.P.; De Vries, W. Impacts of nitrogen addition on plant species richness and abundance: A global meta-analysis. Glob. Ecol. Biogeogr. 2019, 28, 398–413. [Google Scholar] [CrossRef]
  6. De Vries, W. Impacts of nitrogen emissions on ecosystems and human health: A mini review. Curr. Opin. Environ. Sci. Health 2021, 21, 100249. [Google Scholar] [CrossRef]
  7. Grennfelt, P.; Engleryd, A.; Forsius, M.; Hov, Ø.; Rohde, H.; Cowling, E. Acid rain and air pollution: 50 years of progress in environmental science and policy. Ambio 2020, 40, 849–864. [Google Scholar] [CrossRef] [PubMed]
  8. De Vries, W.; Hettelingh, J.P.; Posch, M. (Eds.) Critical Loads and Dynamic Risk Assessments: Nitrogen, Acidity and Metals in Terrestrial and Aquatic Ecosystems. Environmental Pollution Series; Springer: Dordrecht, The Nederlands, 2015; ISBN 978-94-017-9507-4. [Google Scholar] [CrossRef]
  9. Hettelingh, J.P.; Posch, M.; Slootweg, J. (Eds.) European Critical Loads: Database, Biodiversity and Ecosystems at Risk; CCE Final Report 2017, Coordination Centre for Effects; RIVM Report: Bilthoven, The Netherlands, 2017. [Google Scholar] [CrossRef]
  10. Payne, R.J.; Dise, N.B.; Field, C.D.; Dore, A.J.; Caporn, S.J.M.; Stevens, C.J. Nitrogen deposition and plant biodiversity: Past, present, and future. Front. Ecol. Environ. 2017, 15, 431–436. [Google Scholar] [CrossRef]
  11. Dirnböck, T.; Grandin, U.; Bernhardt-Römermann, M.; Beudert, B.; Canullo, R.; Forsius, M.; Grabner, M.T.; Holmberg, M.; Kleemola, S.; Lundin, L.; et al. Forest floor vegetation response to nitrogen deposition in Europe. Glob. Change Biol. 2013, 20, 429–440. [Google Scholar] [CrossRef] [PubMed]
  12. McClean, C.J.; van den Berg, L.J.L.; Ashmore, M.R.; Preston, C.D. Atmospheric nitrogen deposition explains patterns of plant species loss. Glob. Change Biol. 2011, 17, 2882–2892. [Google Scholar] [CrossRef]
  13. Han, W.J.; Cao, J.Y.; Liu, J.L.; Jiang, J.; Ni, J. Impacts of nitrogen deposition on terrestrial plant diversity: A meta-analysis in China. J. Plant Ecol. 2019, 12, 1025–1033. [Google Scholar] [CrossRef]
  14. De Schrijver, A.; De Frenne, P.; Ampoorter, E.; Van Nevel, L.; Demey, A.; Wuyts, K.; Verheyen, K. Cumulative nitrogen input drives species loss in terrestrial ecosystems. Glob. Ecol. Biogeogr. 2011, 20, 803–816. [Google Scholar] [CrossRef]
  15. Pope, C.A.; Coleman, N.; Pond, Z.A.; Burnett, R.T. Fine particulate air pollution and human mortality: 25+ years of cohort studies. Environ. Res. 2020, 183, 108924. [Google Scholar] [CrossRef]
  16. Orellano, P.; Kasdagli, M.I.; Velasco, R.P.; Samoli, E. Long-Term Exposure to Particulate Matter and Mortality: An Update of the WHO Global Air Quality Guidelines Systematic Review and Meta-Analysis. Int. J. Public Health 2024, 69, 1607683. [Google Scholar] [CrossRef]
  17. Khomenko, S.; Cirach, M.; Pereira-Barbosa, E.; Mueller, N.; Rojas-Rueda, D.; de Hoogh, K.; Hoek, G.; Nieuwenhuijsen, M. Premature mortality due to air pollution in European cities: A health impact assessment. Lancet Planet. Health 2021, 5, S2542–S5196. [Google Scholar] [CrossRef]
  18. Schucht, S.; Colette, A.; Rao, S.; Holland, M.; Schöpp, W.; Kolp, P.; Klimont, Z.; Bessagnet, B.; Szopa, S.; Vautard, R.; et al. Moving towards ambitious climate policies: Monetised health benefits from improved air quality could offset mitigation costs in Europe. Environ. Sci. Policy 2015, 50, 252–269. [Google Scholar] [CrossRef]
  19. Schucht, S.; Real, E.; Létinois, L.; Colette, A.; Holland, M.; Spadaro, J.V.; ¸Opie, L.; Brook, R.; Garland, L.; Gibbs, M. Costs of Air Pollution from European Industrial Facilities 2008–2017. ETC/ATNI Report 04/2020, European Topic Centre Health and Environment (When the Work Was Undertaken, the Name of the ETC Was Air Pollution, Transport, Noise, and Industrial Pollution or ETC/ATNI). Available online: https://www.eionet.europa.eu/etcs/etc-atni/products/etc-atni-reports/etc-atni-report-04-2020-costs-of-air-pollution-from-european-industrial-facilities-200820132017 (accessed on 24 March 2025).
  20. Giannadaki, D.; Giannakis, E.; Pozzer, A.; Lelieveld, J. Estimating health and economic benefits of reductions in air pollution from agriculture. Sci. Total Environ. 2018, 622–623, 1304–1316. [Google Scholar] [CrossRef] [PubMed]
  21. Nordstrøm, C.; Ellermann, T.; Brandt, J.; Christensen, J.; Ketzel, M.; Massling, A.; Bossi, R.; Frohn, L.M.; Geels, C.; Solvang Jensen, S.; et al. Luftkvalitet 2023. Status for den Nationale Luftkvalitetsovervågning; Scientific Report No. 627; Aarhus Universitet, DCE—National Center for Environment and Energy: Roskilde, Denmark, 2024; 158p, Available online: https://dce.au.dk/fileadmin/dce.au.dk/Udgivelser/Videnskabelige_rapporter_600-699/SR627.pdf (accessed on 16 July 2025).
  22. Warwick, C.; Pilny, A.; Steedman, C.; Grant, R. One health implications of fur farming. Front. Anim. Sci. 2023, 4, 1249901. [Google Scholar] [CrossRef]
  23. Gregory, B.R.B.; Kissinger, J.A.; Clarkson, C.; Kimpe, L.E.; Eickmeyer, D.C.; Kurek, J.; Smol, J.P.; Blais, J.M. Are fur farms a potential source of persistent organic pollutants or mercury to nearby freshwater ecosystems? Sci. Total Environ. 2022, 833, 155100. [Google Scholar] [CrossRef] [PubMed]
  24. Peacock, T.P.; Barclay, W.S. Mink farming poses risks for future viral pandemics. Proc. Natl. Acad. Sci. USA 2023, 120, e2302408120. [Google Scholar] [CrossRef]
  25. Bonesi, L.; Palazon, S. The American mink in Europe: Status, impacts and control. Biol. Conserve. 2007, 134, 470–483. [Google Scholar] [CrossRef]
  26. Wyer, K.E.; Kelleghan, D.B.; Blanes-Vidal, V.; Schauberger, G.; Curran, T.P. Ammonia emissions from agriculture and their contribution to fine particulate matter: A review of implications for human health. J. Environ. Manag. 2022, 323, 116285. [Google Scholar] [CrossRef]
  27. CHR. Central Husbandry Register, The Danish Veterinary and Food Administration. 2025. Available online: https://chr.fvst.dk/chri/faces/frontpage;jsessionid=odOt0NhMQOpi4bl5GJvwlCFrhrHZLlj7UTBkF3TyorXnLNsrp6uK!-1045603659 (accessed on 14 March 2025).
  28. GHI. Manure and Housing Register, Ministry of Food, Agriculture and Fisheries of Denmark. 2025. Available online: https://landbrugsindberetning.dk/ghi/startside.jsp (accessed on 14 March 2025).
  29. DNS. The Danish Normative System, Department of Animal and Veterinary Sciences, Aarhus University. 2025. Available online: https://anivet.au.dk/forskning/sektioner/husdyrernaering-og-fysiologi/normtal (accessed on 14 March 2025).
  30. Christensen, J.H. The Danish Eulerian Hemispheric Model—A Three-Dimensional Air Pollution Model Used for the Arctic. Atmos. Environ. 1997, 31, 4169–4191. [Google Scholar] [CrossRef]
  31. Frohn, L.M.; Geels, C.; Andersen, C.; Andersson, C.; Bennet, C.; Christensen, J.H.; Im, U.; Karvosenoja, N.; Kindler, P.A.; Kukkonen, J.; et al. Evaluation of multi-decadal high-resolution atmospheric chemistry-transport modelling for exposure assessments in the continental Nordic countries. Atmos. Environ. 2022, 290, 119334. [Google Scholar] [CrossRef]
  32. Vivanco, M.G.; Theobald, M.R.; García-Gómez, H.; Luis Garrido, J.; Prank, M.; Aas, W.; Adani, M.; Alyuz, U.; Andersson, C.; Bellasio, R.; et al. Modeled deposition of nitrogen and sulfur in Europe estimated by 14 air quality model systems: Evaluation, effects of changes in emissions and implications for habitat protection. Atmos. Chem. Phys. 2018, 18, 10199–10218. [Google Scholar] [CrossRef]
  33. Geels, C.; Andersen, H.V.; Skjøth, C.A.; Christensen, J.H.; Ellermann, T.; Løfstrøm, P.; Gyldenkærne, S.; Brandt, J.; Hansen, K.M.; Frohn, L.M.; et al. Improved modelling of atmospheric ammonia over Denmark using the coupled modelling system DAMOS. Biogeosciences 2012, 9, 2625–2647. [Google Scholar] [CrossRef]
  34. Ellermann, T.; Nygaard, J.; Nøjgaard, J.K.; Nordstrøm, C.; Brandt, J.; Christensen, J.; Ketzel, M.; Massling, A.; Bossi, R.; Jensen, S.S. The Danish Air Quality Monitoring Programme; Annual Summary for 2017; Scientific Report No. 281; Aarhus University, DCE—Danish Centre for Environment and Energy: Roskilde, Denmark, 2018; 83p, Available online: http://dce2.au.dk/pub/SR281.pdf (accessed on 1 March 2025).
  35. Skamarock, W.C.; Klemp, J.; Dudhia, J.; Gill, D.O.; Barker, D.; Wang, W.; Powers, J.G. A Description of the Advanced Research WRF Version 3; NCAR Technical Note; NCAR/TN-475+STR; National Center for Atmospheric Research: Boulder, CO, USA, 2008; 27p. Available online: https://opensky.ucar.edu/islandora/object/%3A3814 (accessed on 16 July 2025).
  36. Simpson, D.; Benedictow, A.; Berge, H.; Bergström, R.; Emberson, L.D.; Fagerli, H.; Flechard, C.R.; Hayman, G.D.; Gauss, M.; Jonson, J.E.; et al. The EMEP MSC-W chemical transport model—Technical description. Atmos. Chem. Phys. 2012, 12, 7825–7865. [Google Scholar] [CrossRef]
  37. Klimont, Z.; Kupiainen, K.; Heyes, C.; Purohit, P.; Cofala, J.; Rafaj, P.; Borken-Kleefeld, J.; Schöpp, W. Global anthropogenic emissions of particulate matter including black carbon. Atmos. Chem. Phys. 2017, 17, 8681–8723. [Google Scholar] [CrossRef]
  38. Ullrich, B.; Wankmüller, R.; Schindlbacher, S. Inventory Review 2023. Review of Emission Data Reported Under the LRTAP Convention. Stage 1, 2 and 3 Review. Status of Gridded and LPS Data. Technical Report 04/2023, EMEP Centre on Emission Inventories and Projections. Available online: https://www.ceip.at/fileadmin/inhalte/ceip/00_pdf_other/2023/dp188.pdf (accessed on 16 July 2025).
  39. Plejdrup, M.S.; Nielsen, O.K.; Bruun, H.G. Influence of improved methodology and increased spatial resolution on gridded emissions. Int. J. Environ. Impacts 2019, 2, 161–173. [Google Scholar] [CrossRef]
  40. Frost, G.J.; Middleton, P.; Tarrason, L.; Granier, C.; Guenther, A.B.; Cardenas, B.; van der Gon, H.D.; Janssens-Maenhout, G.; Kaiser, J.W.; Keating, T.; et al. New Directions: GEIA’s 2020 vision for better air emissions information. Atmos. Environ. 2013, 81, 710–712. [Google Scholar] [CrossRef]
  41. Zare, A.; Christensen, J.H.; Irannejad, P.; Brandt, J. Evaluation of two isoprene emission models for using in a long-range air pollution model. Atmos. Chem. Phys. 2012, 12, 7399–7412. [Google Scholar] [CrossRef]
  42. Soares, J.; Sofiev, M.; Geels, C.; Christensen, J.H.; Andersson, C.; Tsyro, S.; Langner, J. Impact of climate change on the production and transport of sea salt aerosol on European seas. Atmos. Chem. Phys. 2016, 16, 13081–13104. [Google Scholar] [CrossRef]
  43. Friedrich, R. GENEMIS: Assessment, improvement, temporal and spatial disaggregation of European emission data. In Tropospheric Modelling and Emission Estimation (PART2); Ebel, A., Friedrich, R., Rhode, H., Eds.; Springer: New York, NY, USA, 1997. [Google Scholar]
  44. Gyldenkærne, S.; Ambelas Skjøth, C.; Hertel, O.; Ellermann, T. A dynamical ammonia emission parameterization for use in air pollution models. J. Geophys. Res. Atmos. 2005, 110, 1–14. [Google Scholar] [CrossRef]
  45. Skjøth, C.A.; Geels, C.; Berge, H.; Gyldenkærne, S.; Fagerli, H.; Ellermann, T.; Frohn, L.M.; Christensen, J.; Hansen, K.M.; Hansen, K.; et al. Spatial and temporal variations in ammonia emissions—A freely accessible model code for Europe. Atmos. Chem. Phys. 2011, 11, 5221–5236. [Google Scholar] [CrossRef]
  46. Brandt, J.; Silver, J.D.; Christensen, J.H.; Andersen, M.S.; Bønløkke, J.; Sigsgaard, T.; Geels, C.; Gross, A.; Hansen, A.B.; Hansen, K.M.; et al. Contribution from the ten major emission sectors in Europe to the Health-Cost Externalities of Air Pollution using the EVA Model System—An integrated modelling approach. Atmos. Chem. Phys. 2013, 13, 7725–7746. [Google Scholar] [CrossRef]
  47. Im, U.; Brandt, J.; Bauer, S.E.; Tsigaridis, K.; Frohn, L.M.; Geels, C. Present-day and future PM2.5 and O3-related global and regional premature mortality in the EVAv6.0 health impact assessment model. Environ. Res. 2023, 216, 114702. [Google Scholar] [CrossRef]
  48. Friedrich, R.; Bickel, P. The Impact Pathway Methodology. In Environmental External Costs of Transport; Friedrich, R., Bickel, P., Eds.; Springer: Berlin/Heidelberg, Germany, 2001. [Google Scholar] [CrossRef]
  49. WHO. WHO Global Air Quality Guidelines: Particulate Metter (PM2.5 and PM10), Ozone, Nitrogen Dioxide, Sulfur Dioxide and Carbon Monoxide; World Health Organization: Geneva, Switzerland, 2021; Available online: https://www.who.int/publications/i/item/9789240034228 (accessed on 16 July 2025).
  50. Andersen, M. Co-benefits of climate mitigation: Counting statistical lives or life-years? Ecol. Indic. 2017, 79, 11–18. [Google Scholar] [CrossRef]
  51. Sommer, S.G.; Østergård, H.S.; Løfstrøm, P.; Andersen, H.V.; Jensen, L.S. Validation of model calculation of ammonia deposition in the neighbourhood of a poultry farm using measured NH3 concentrations and N deposition. Atmos. Environ. 2009, 43, 915–920. [Google Scholar] [CrossRef]
  52. Theobald, M.R.; Løfstrøm, P.; Walker, J.; Andersen, H.V.; Pedersen, P.; Vallejo, A.; Sutton, M.A. An intercomparison of models used to simulate the short-range atmospheric dispersion of agricultural ammonia emissions. Environ. Model. Softw. 2012, 37, 90–102. [Google Scholar] [CrossRef]
  53. Bak, J.L. Critical loads for nitrogen based on criteria for biodiversity conservation. Water Air Soil Pollut. 2014, 225, 2180. [Google Scholar] [CrossRef]
  54. Bobbink, R.; Loran, C.; Tomassen, H. Review and Revision of Empirical Critical Loads of Nitrogen for Europe; German UBA: Dessau-Roßlau, Germany, 2022; ISSN 1862-4804. [Google Scholar]
  55. Jepsen, M.R.; Levin, G. Semantically based reclassification of Danish land-use and land-cover information. Int. J. Geogr. Inf. Sci. 2013, 27, 2375–2390. [Google Scholar] [CrossRef]
  56. Levin, G.; Iosub, V.I.; Jepsen, M.R. BASEMAP02. Technical Documentation of a Model for Elaboration of a Land-Use and Land-Cover Map for Denmark; Technical Report No. 95; Danish Center for Energy and Environment, DCE: Aarhus, Denmark, 2017; 64p, Available online: https://dce2.au.dk/pub/TR95.pdf (accessed on 16 July 2025).
  57. EBAS Database for Atmospheric Measurment Data Developed and Operated by NILU—Norwegian Institute for Air Research, Kjeller, Norway. Available online: https://ebas.nilu.no (accessed on 16 July 2025).
  58. FVM. Ministry of Food, Agriculture and Fisheries of Denmark, 30 January 2024. Available online: https://fvm.dk/nyheder-og-pressemeddelelser/2024/jan/skoennet-over-udgifter-til-minkerstatninger-opjusteres (accessed on 16 July 2025).
  59. Verburg, R.W.; Puister, L.F.; Michels, R.; Van Duijvendijk, K. Estimating Costs of Nature Management in the European Union; Wageningen University and Research: Wageningen, The Netherlands, 2012; 108p. [Google Scholar] [CrossRef]
  60. Nielsen, O.K.; Plejdrup, M.S.; Winther, M.; Mikkelsen, M.H.; Nielsen, M.; Gyldenkærne, S.; Fauser, P.; Albrektsen, R.; Hjelgaard, K.H.; Bruun, H.G.; et al. Annual Danish Informative Inventory Report to UNECE; Emission Inventories from the Base Year of the Protocols to Year 2018. Scientific Report No. 369; Aarhus University, DCE—Danish Centre for Environment and Energy: Roskilde, Denmark, 2020; 559p, Available online: http://dce2.au.dk/pub/SR369.pdf (accessed on 16 July 2025).
  61. Ellermann, T.; Bossi, R.; Nygaard, J.; Christensen, J.; Løfstrøm, P.; Monies, C.; Geels, C.; Nilesen, I.E.; Poulsen, M.B. Atmosfærisk Deposition 2019; NOVANA. Scientific Report No. 415; Aarhus Universitet, DCE—Danish Centre for Environment and Energy: Roskilde, Denmark, 2021; 90p, Available online: https://dce2.au.dk/pub/SR415.pdf (accessed on 16 July 2025).
  62. Ellermann, T.; Nordstrøm, C.; Brandt, J.; Christensen, J.; Ketzel, M.; Massling, A.; Bossi, R.; Frohn, L.M.; Geels, C.; Jensen, S.S.; et al. Luftkvalitet 2019; Status for den Nationale Luftkvalitetsovervågning. Scientific Report No. 410; Aarhus Universitet, DCE—National Centre for Environment and Energy: Roskilde, Denmark, 2020; 128p, Available online: https://dce2.au.dk/pub/SR410.pdf (accessed on 16 July 2025).
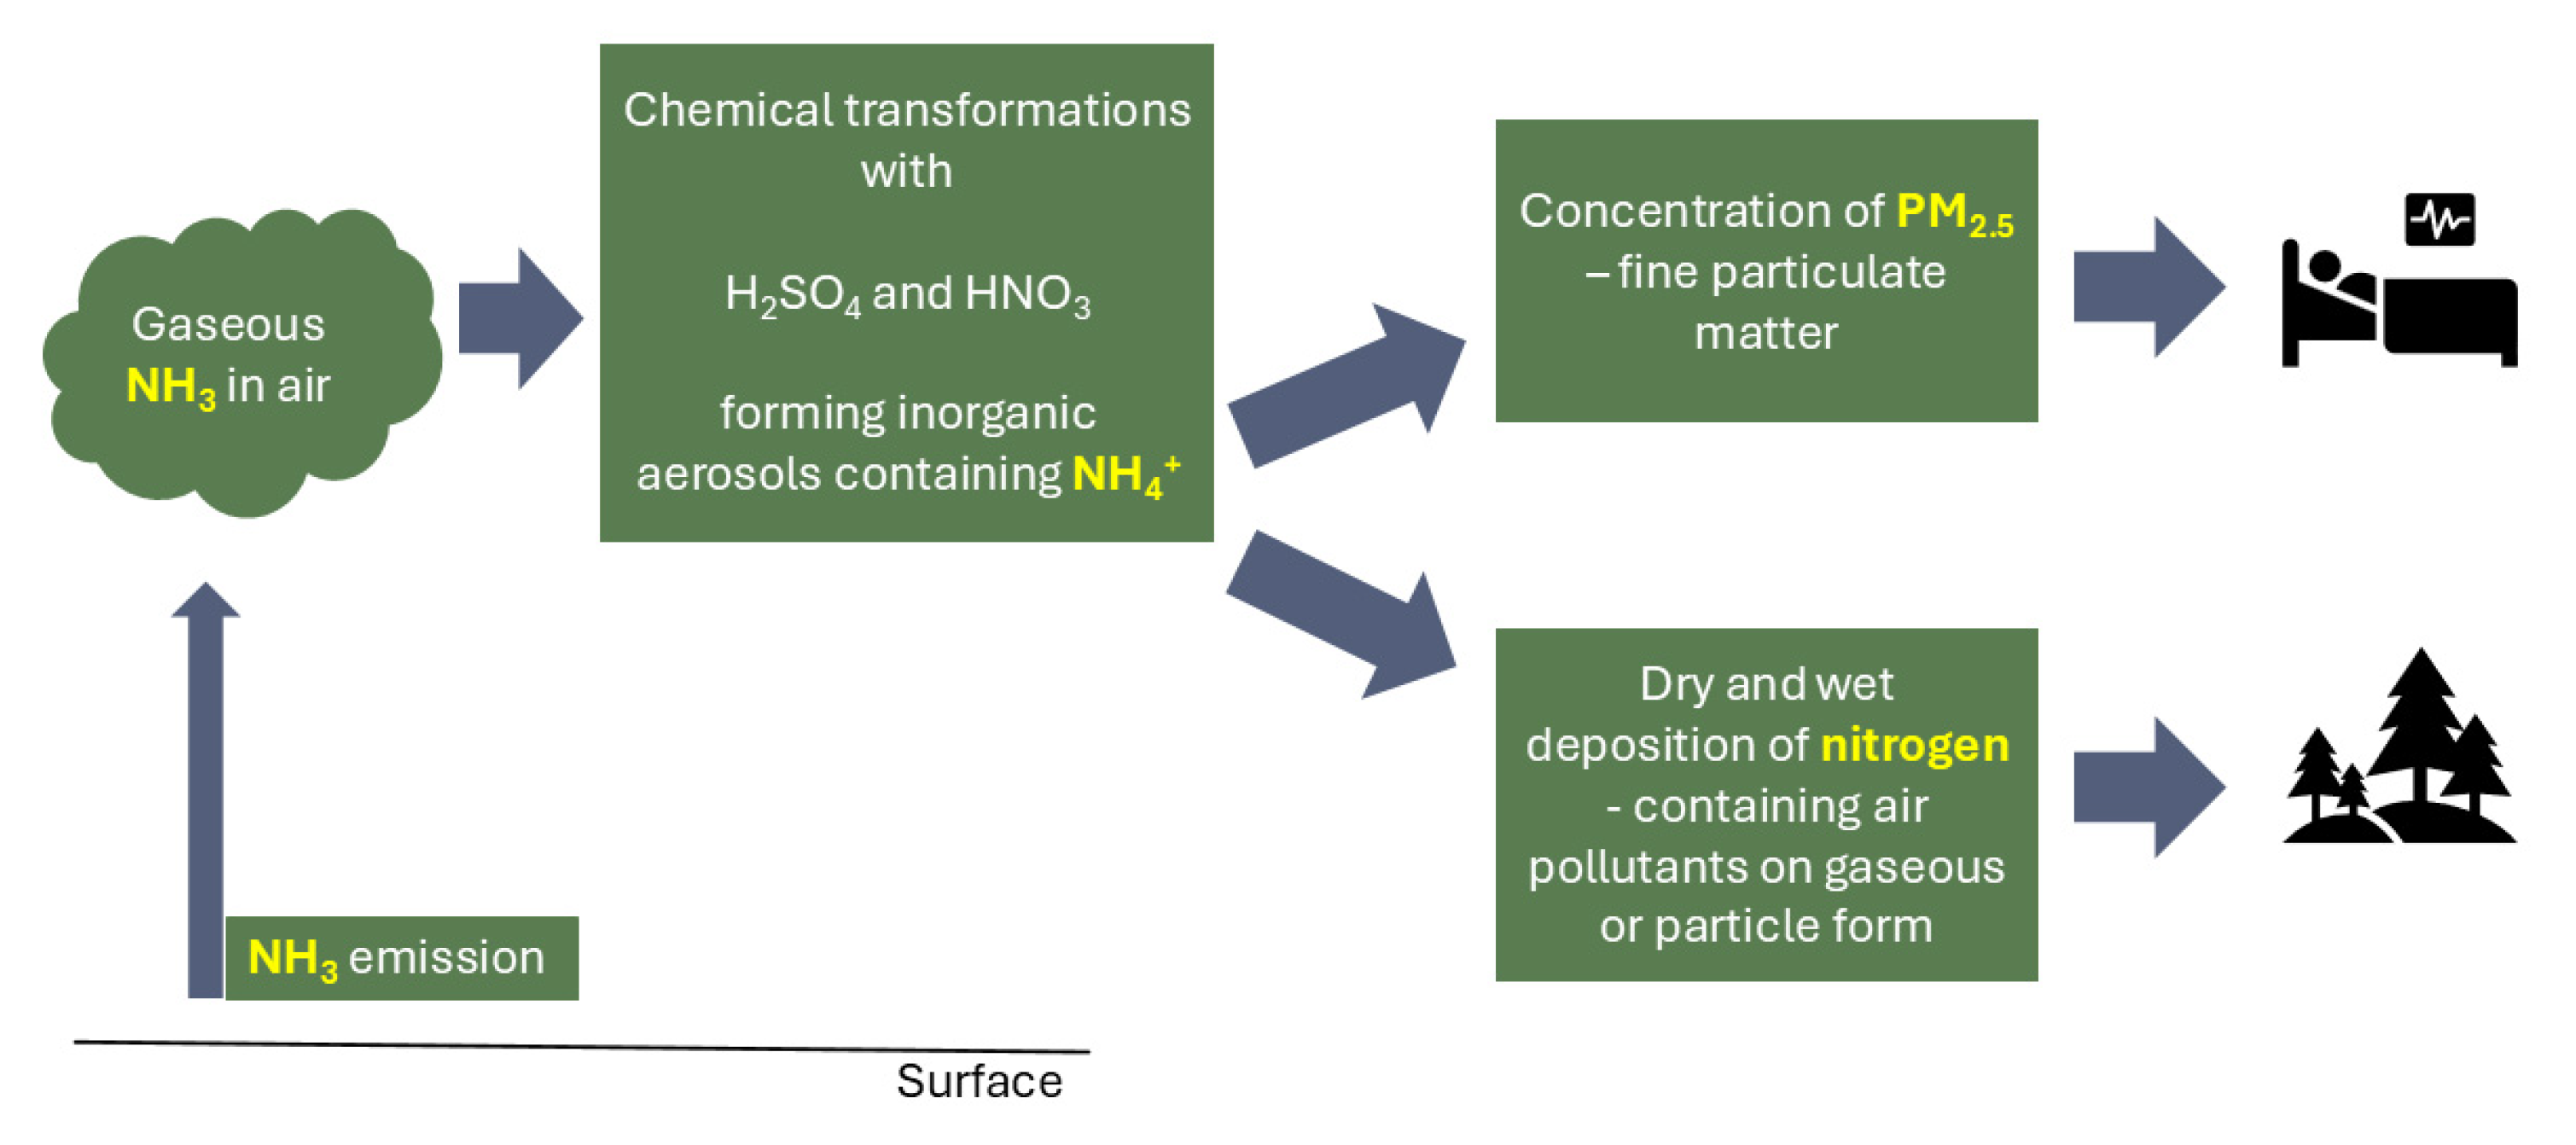
Figure 1. Flow of NH3 from emissions from sources to gaseous NH3 in air, where the gas will be transported with the wind and either react with sulfuric acid (H2SO4) or nitric acid (HNO3) to form inorganic aerosols that contain NH4+ or deposit on the surface. NH4+ contributes to the ambient concentration of fine particulate matter, which affects human health, and NH3 and NH4+ both contribute to the dry and wet deposition of Nr.
Atmosphere 16 00966 g001
Figure 2. Location and number of female mink in Denmark. Data are obtained from the Danish Central Husbandry Register for 2019 [27].
Atmosphere 16 00966 g002
Figure 3. Annual dry deposition of NH3 (unit kgN/ha/year) in a 30° sector with constant wind direction based on an annual point source emission of 1000 kg NH3. Land cover characteristics in this example correspond to forest (for the nature area) and sparse vegetation (for the surface between the point source and the nature area traversed by the NH3 emitted from the point source).
Atmosphere 16 00966 g003
Figure 4. Average concentrations of NH3 (left) in µgN/m3 and PM2.5 (right) in µg/m3 for the time period 2017–2019 calculated with the DEHM in a setup where all emissions are included.
Atmosphere 16 00966 g004
Figure 5. Average concentrations of NH3 (left) in µgN/m3 and PM2.5 (right) in µg/m3 for the time period 2017–2019 calculated with the DEHM in a setup where the contribution from the emissions from the mink sector are assessed (i.e., delta-concentrations).
Atmosphere 16 00966 g005
Figure 6. Gridded values of dry (left), wet (centre), and total (right) delta-depositions of Nr in kg/ha/year, calculated with the DEHM on a 5.56 km × 5.56 km spatial resolution based on 2019 emissions and averaged over model runs with meteorological data for the time period 2017–2019.
Atmosphere 16 00966 g006
Figure 7. Nr deposition arising from 2019 emissions from mink farming only, calculated as a combination of the local-scale modelled NH3 dry deposition from dry deposition functions and the DEHM-modelled Nr dry and wet deposition (minus NH3 dry deposition). The grey marked areas in the plot correspond to sensitive nature areas.
Atmosphere 16 00966 g007
Table 1. Health outcomes, related air pollutants, and valuation applied in the EVAv8 calculations (2022 prizes).
Health Effect (Response)Relevant Air Pollution ComponentsValuation
Mortality
Premature deaths, short-term exposurePM2.5, SO2, NO2, O3EUR 4,903,877/case
Premature deaths, long-term exposurePM2.5, NO2, O3EUR 4,167,143/YOLL *
Morbidity
Respiratory hospital admissionsPM2.5, NO2, O3EUR 9260/case
Cardiovascular hospital admissionsPM2.5, O3EUR 15,513/case
CoughPM2.5EUR 1418/case
BronchitisPM2.5EUR 49,521/case
Work loss daysPM2.5EUR 318/case
Restricted activity daysPM2.5EUR 180/case
Minor restricted activity daysO3EUR 100/case
Lung cancerPM2.5EUR 74,804/case
* Corresponding to Years Of Life Lost (YOLL).
Table 2. Health effects (cases) and socio-economic costs (in EUR 1000) in Europe (EU) and Denmark (DK) attributed to the air pollution arising directly from emissions of NH3 from mink farming in Denmark in 2019. All numbers represent mean values for the meteorological years 2017–2019.
Health EffectCases EU + DKCases DKCosts (EUR 1000) EU + DKCosts (EUR 1000) DK
Mortality
Premature deaths, short-term exposure5123,4004840
Premature deaths, long-term exposure5711108,00022,200
Morbidity
Respiratory hospital admissions23521444
Cardiovascular hospital admissions16324651
Cough7192
Chronic bronchitis197412390492
Work loss days2850555906174
Days with restricted activity37,900766068201370
Days with minor restricted activity−499−7−50−1
Lung cancer82577119
Total (costs only) 142,00029,300
Table 3. Concentration of NH3 and dry, wet, and total deposition of Nr modelled including all emission sources (black). Percentage contribution to the concentration and deposition (red) from emissions from mink farming in Denmark. All results are calculated with the DEHM and presented for the five administrative regions of Denmark. All numbers represent mean values for the meteorological years 2017–2019.
RegionNH3NH3 Cont.Dry NrDry Nr Cont.Wet NrWet Nr Cont.Total NrTotal Nr Cont.
µgN/m3%kgN/ha%kgN/ha%kgN/ha%
North Jutland0.966.46.954.95.511.812.53.5
Mid Jutland1.116.17.624.65.501.713.13.4
Southern Denmark1.333.58.483.06.080.914.62.1
Capitol region0.681.85.900.74.710.410.60.6
Zealand0.951.76.401.14.780.411.20.8
Ʃ DK (land)1.094.47.433.45.501.212.92.5
Ʃ DK (marine) 2.381.33.710.56.090.8
Table 4. Calculated area with critical load exceedances based on the two scenarios with and without the 2019 point source emissions from mink farming in Denmark for the three main categories of sensitive nature including a few sub-categories.
Area with Exceedance of Critical Load (ha)With MinkWithout MinkDifference%
Category 1: NH3-sensitive light-open nature in Natura 200037,35337,0992540.7
-
NH3-sensitive forest in Natura 2000
10,71610,962−246−2.3
-
other heathland and dry grassland in Natura 2000
8437549011
Category 2: Larger heathland and grassland areas, Natura 200047783740103822
-
raised bogs, lobelia lakes, outside Natura 2000
36736700
Category 3: All NH3-sensitive areas, outside Natura 2000, not included in Categories 1 and 2.29,48426,65828269.6
-
NH3-sensitive forest, outside Natura 2000.
61,27350,62610,64717
Total144,814130,20614,60910
Disclaimer/Publisher’s Note: The statements, opinions and data contained in all publications are solely those of the individual author(s) and contributor(s) and not of MDPI and/or the editor(s). MDPI and/or the editor(s) disclaim responsibility for any injury to people or property resulting from any ideas, methods, instructions or products referred to in the content.