Estimating Planetary Boundary Layer Height over Central Amazonia Using Random Forest
Abstract
1. Introduction
2. Materials and Methods
2.1. Data
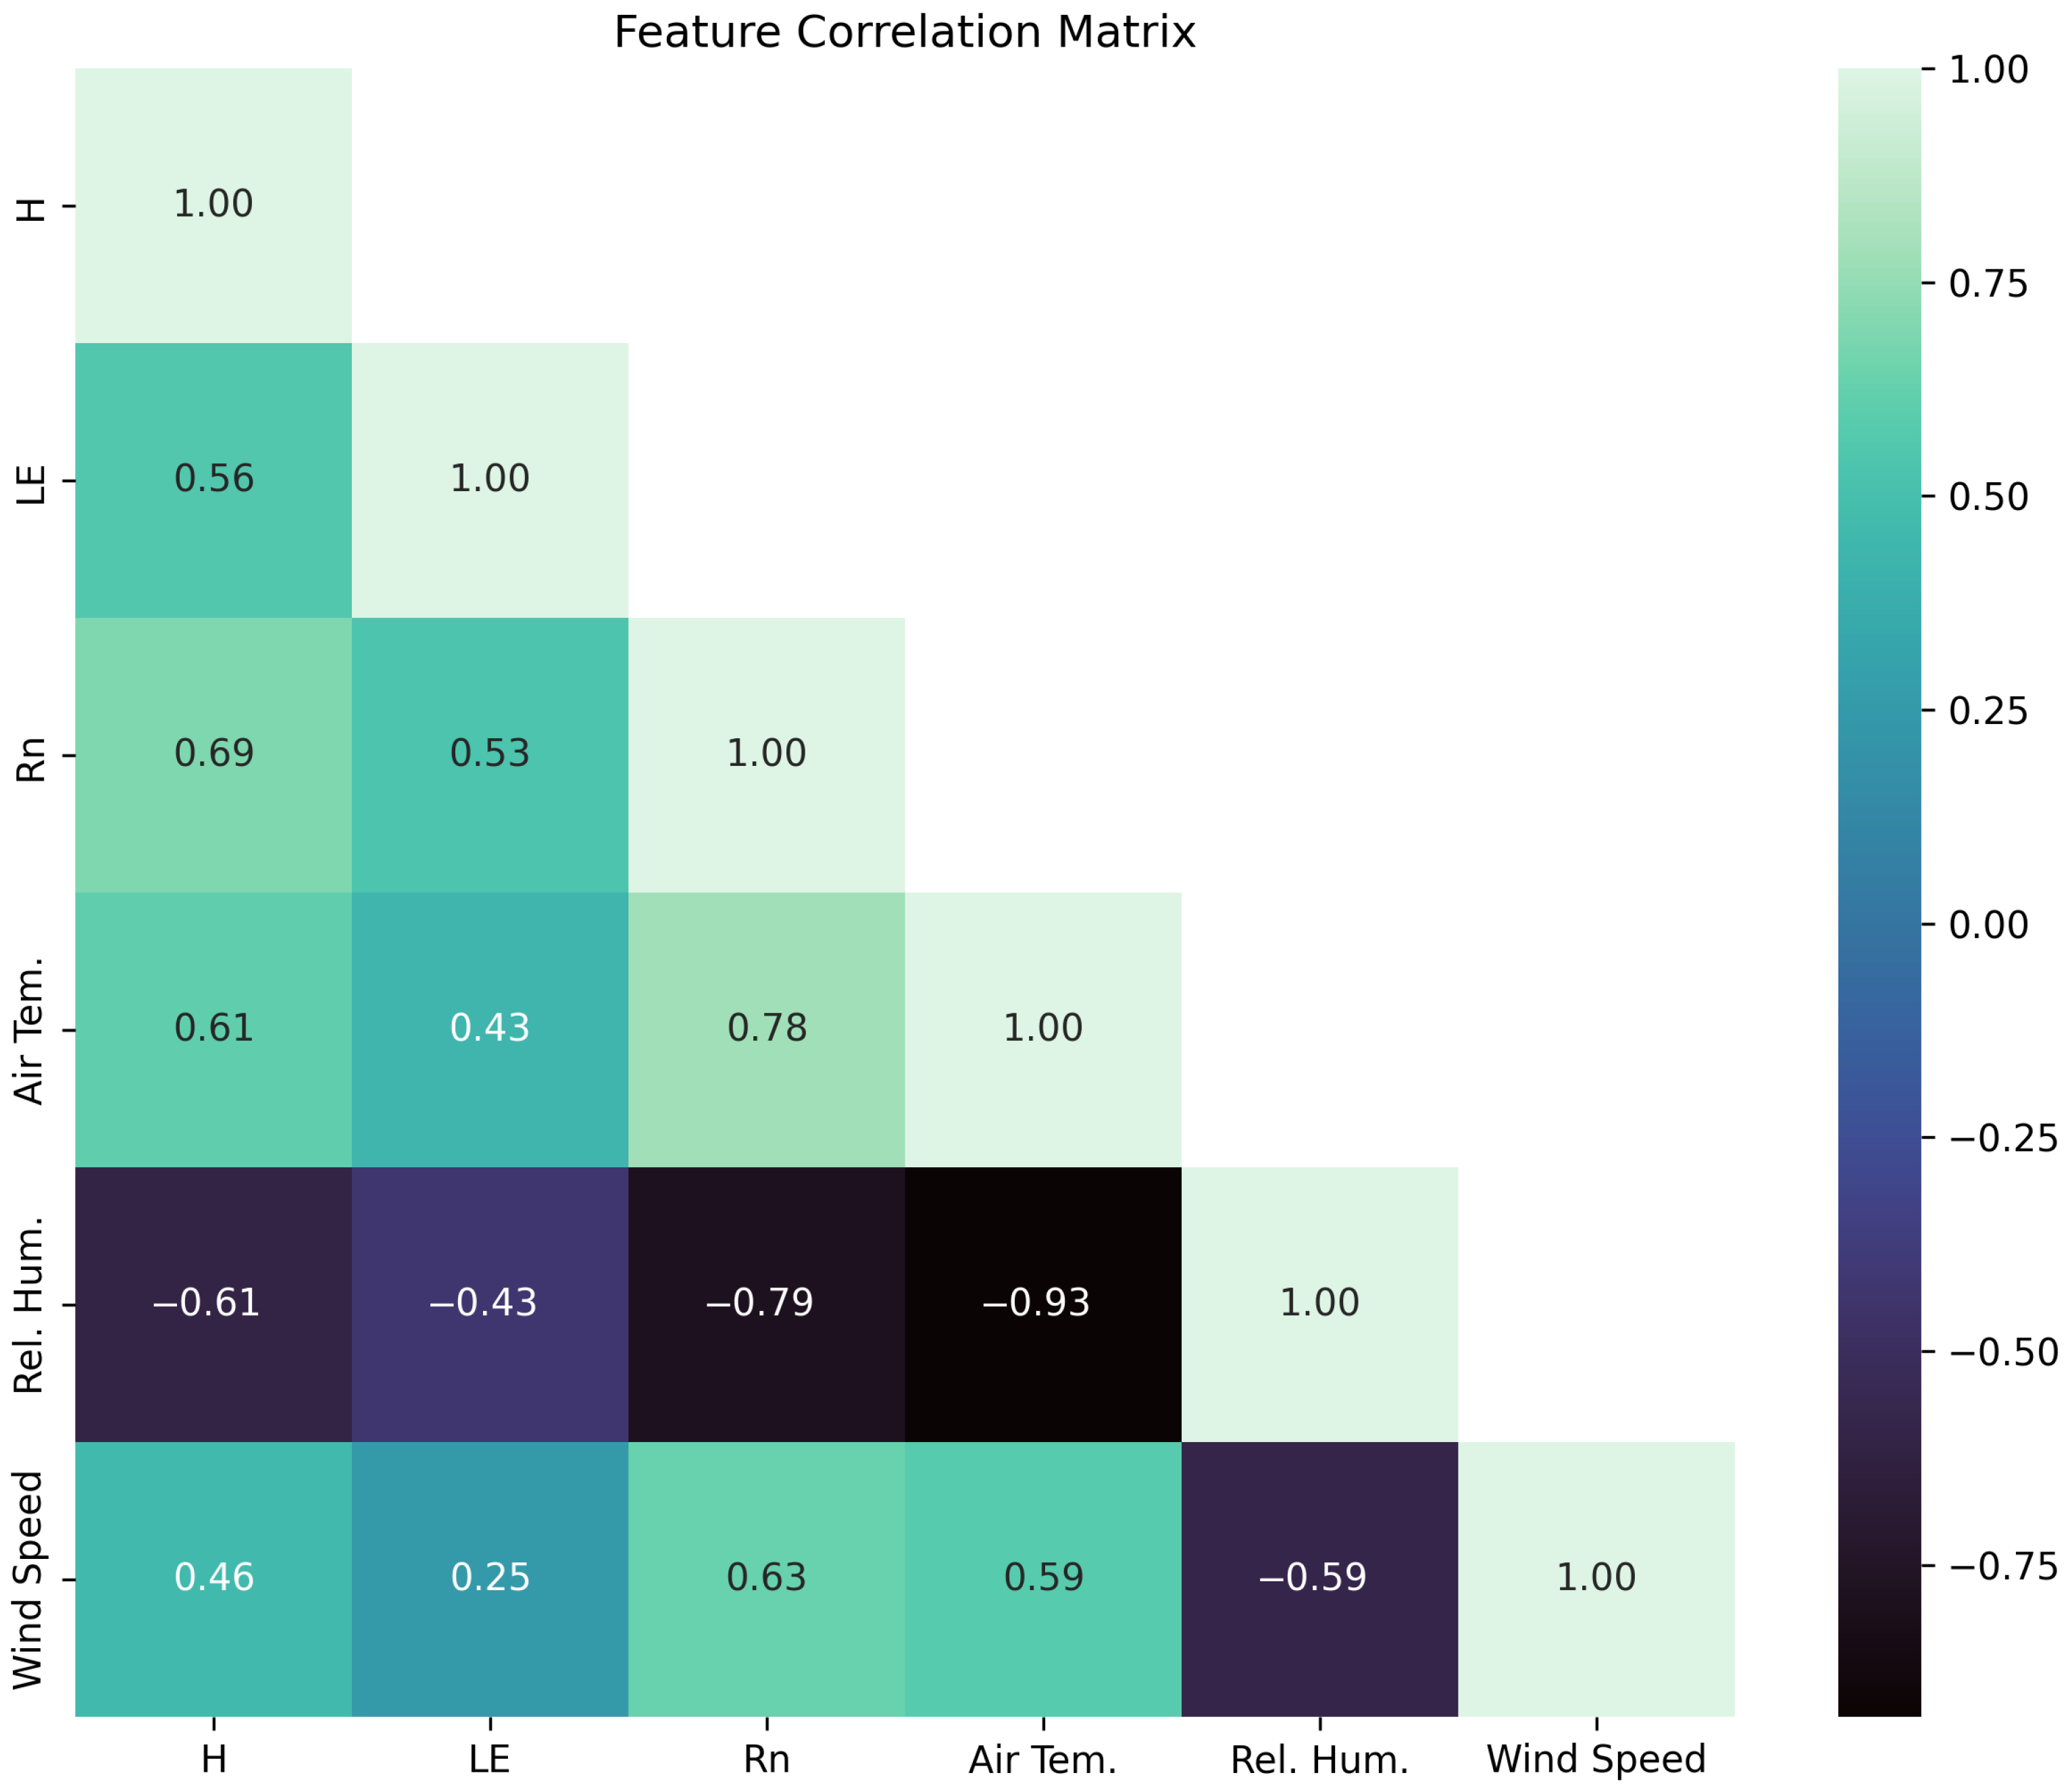
2.2. Preliminary Analysis
- Sensible Heat Flux (H): Directly impacts atmospheric buoyancy and PBL growth and depth.
- Latent Heat Flux (LE): Provides information on evapotranspiration and moisture flux.
- Net Radiation (Rn): Drives surface energy balance, influencing temperature, relative humidity, and atmospheric stability.
- Air Temperature and Relative Humidity: Key atmospheric conditions affecting thermal stratification and mixing.
- Wind Velocity: Contributes to mechanical turbulence and mixing processes.
- Hour of the Day and Daytime: Captures diurnal and nocturnal patterns in PBL dynamics.These features, along with the PBL height, form the basis of our Random Forest (RF) model for PBL estimation.
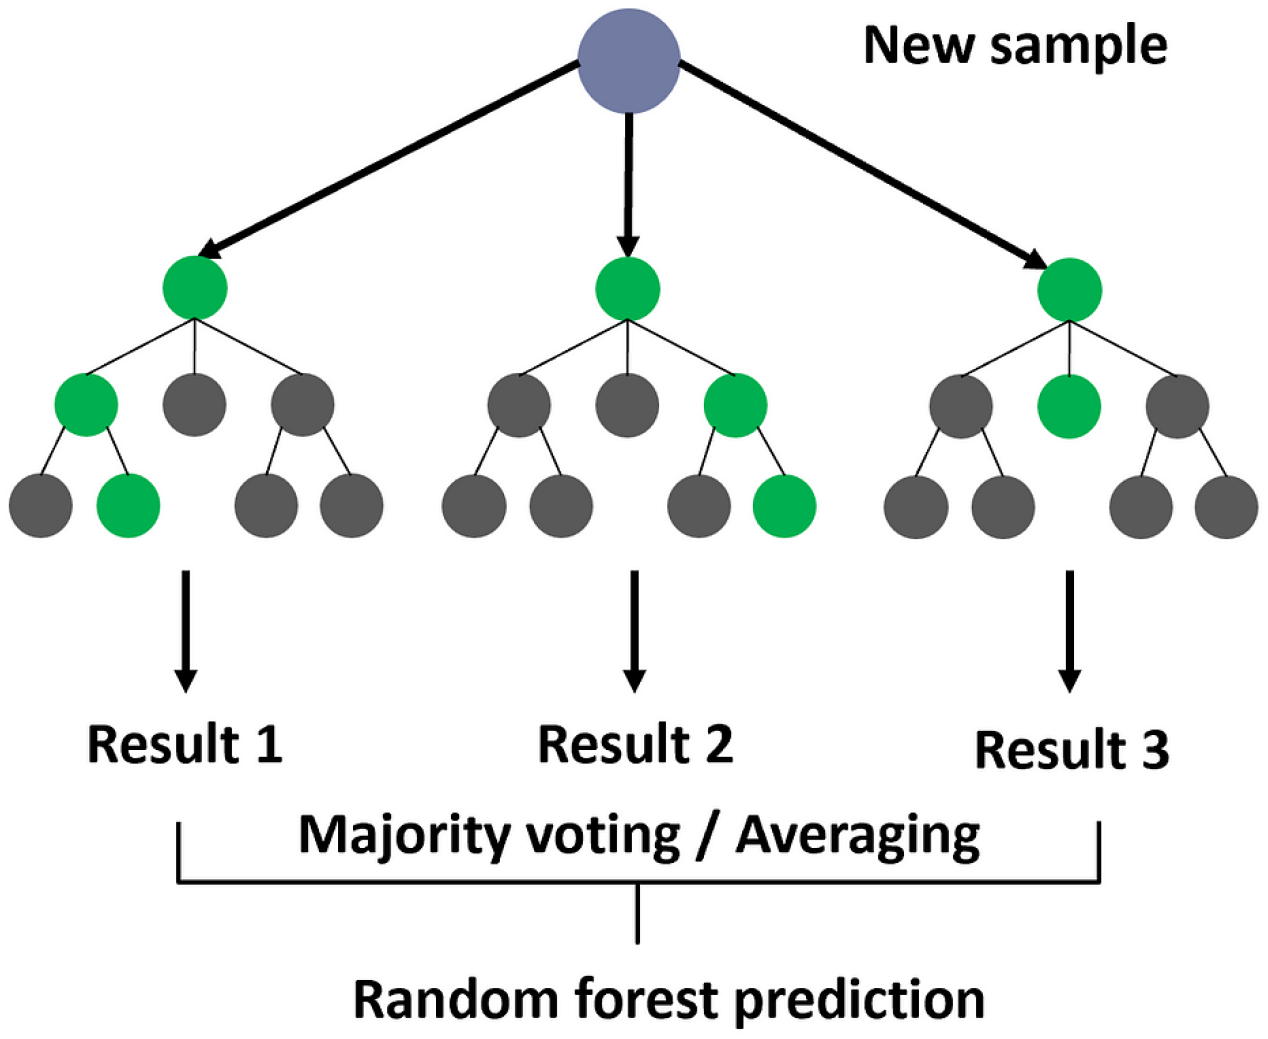
2.3. Random Forest (RF) Model
2.4. Parameter Tuning
2.5. Evaluation Metrics
2.6. Computational Performance
3. Results
3.1. Model Performance
3.2. Comparison with State-of-the-Art Models
3.3. Statistical Analysis
3.4. Feature Importance Analysis
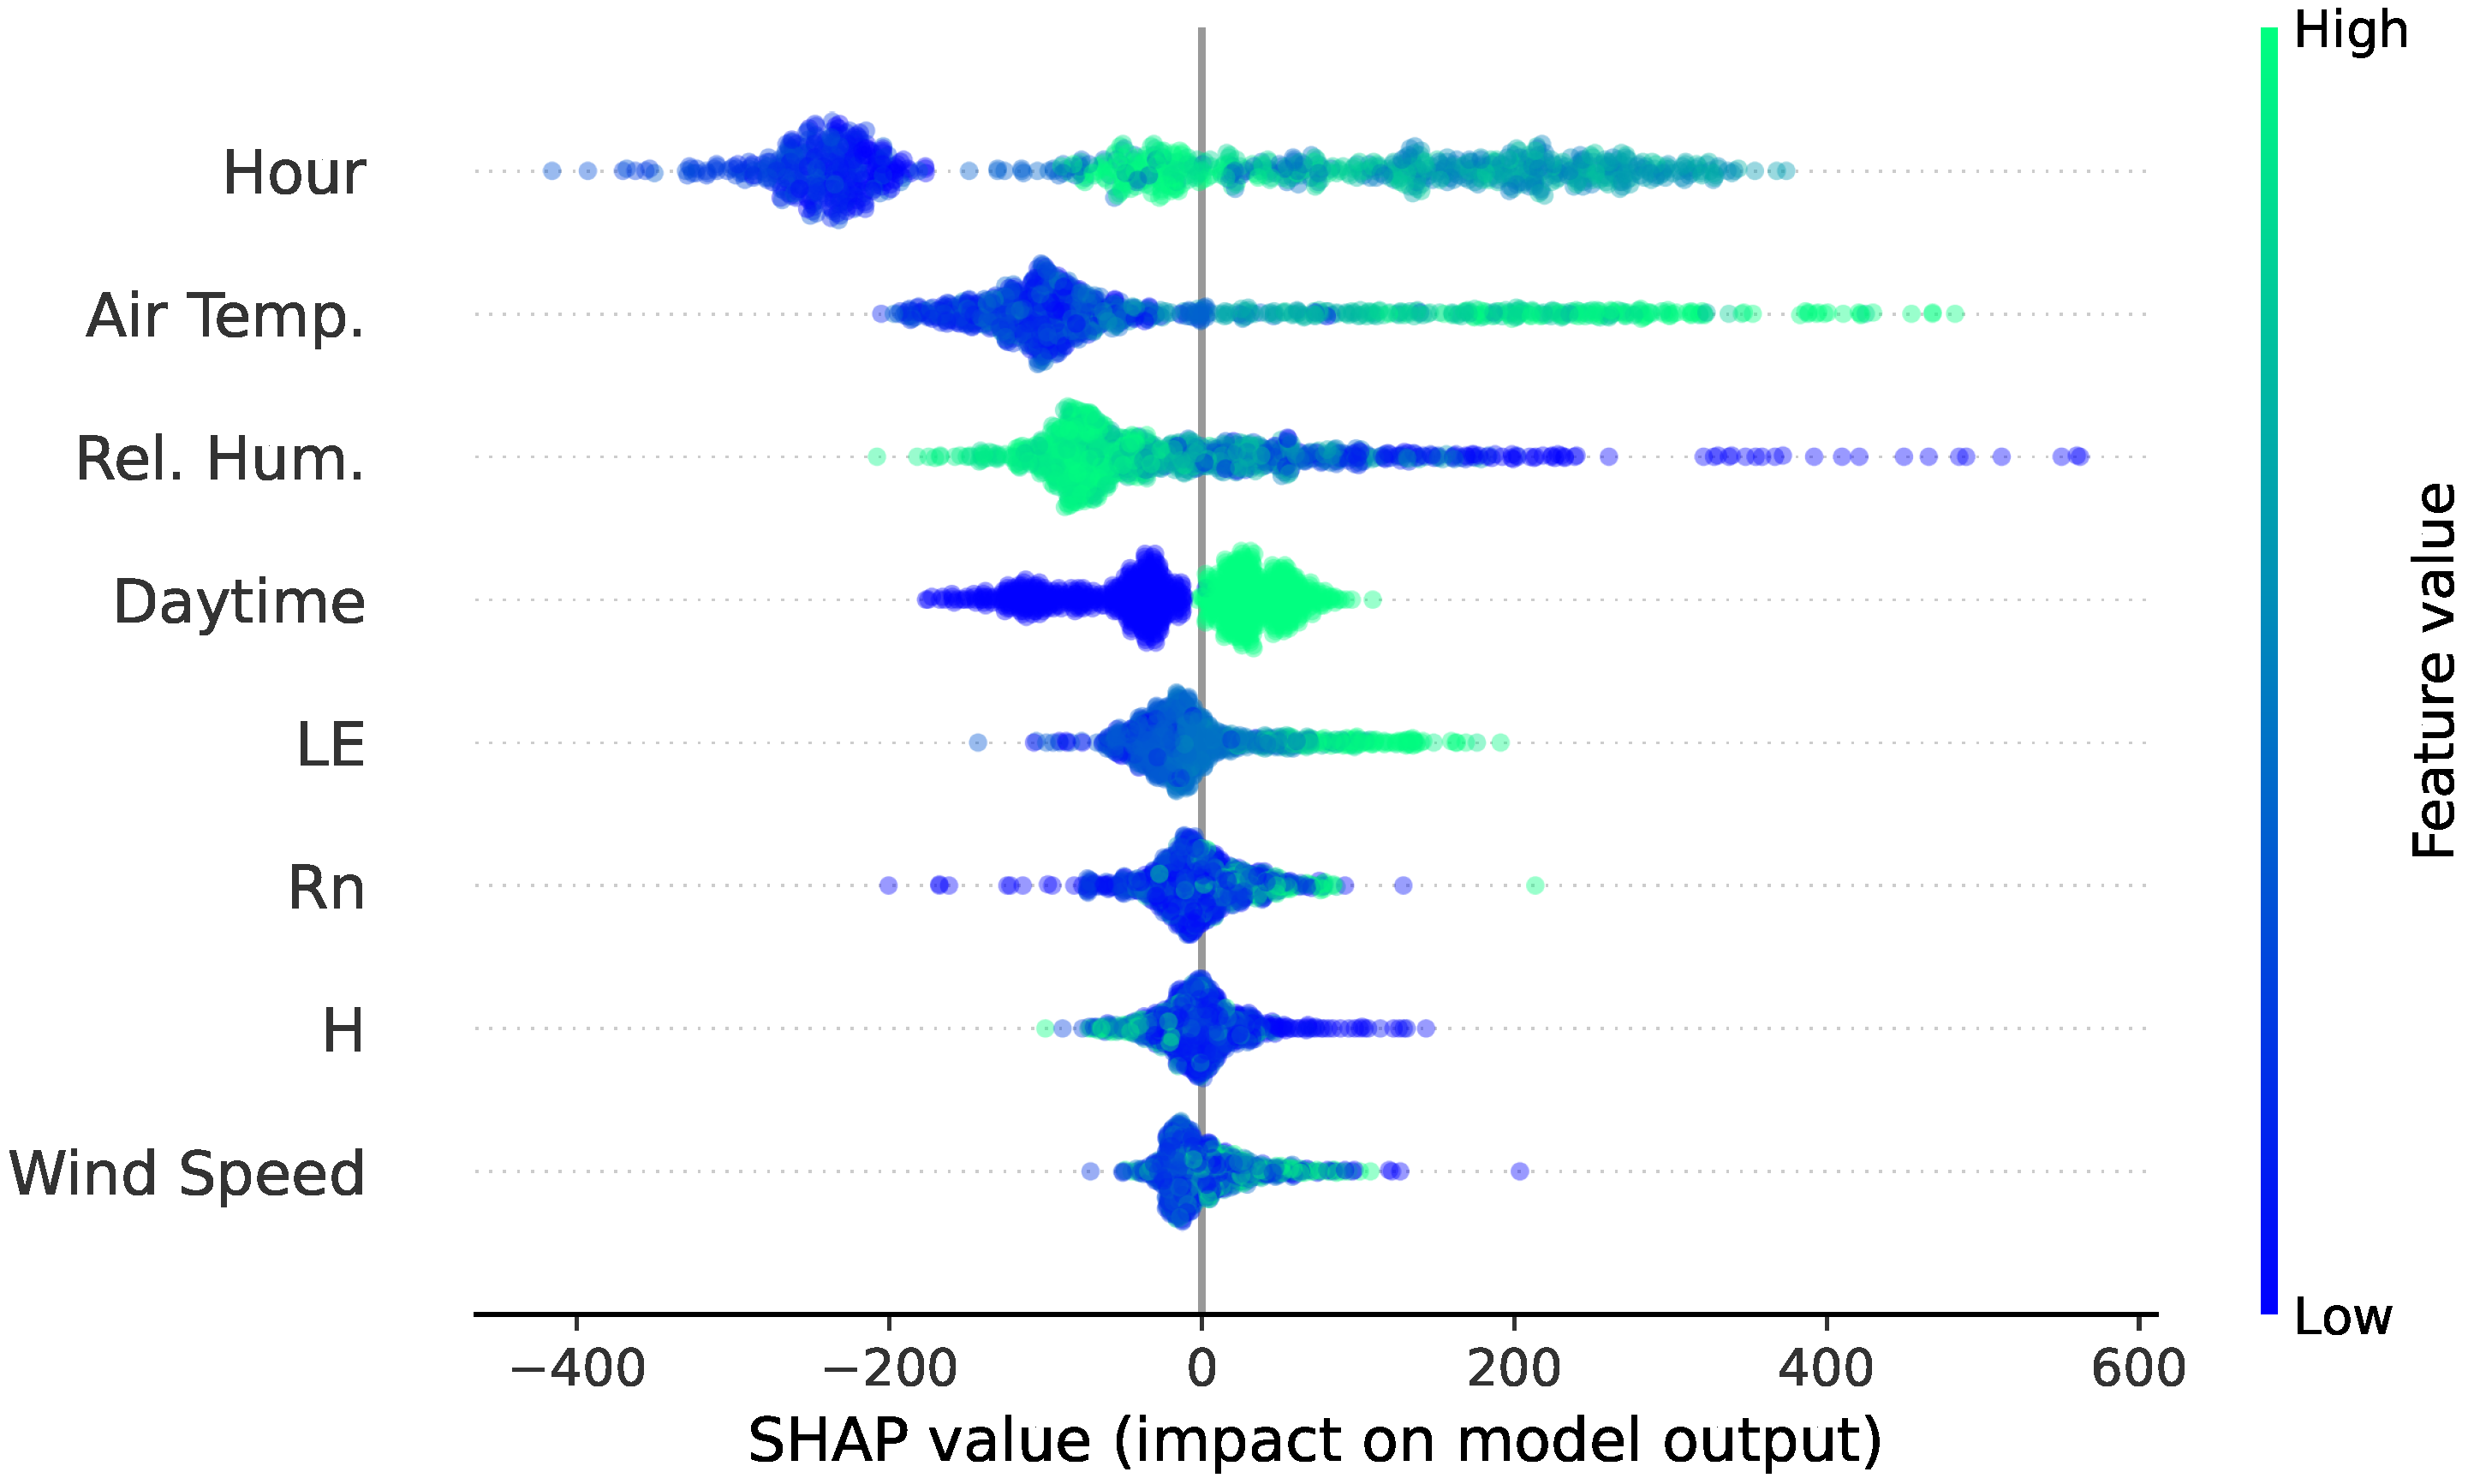
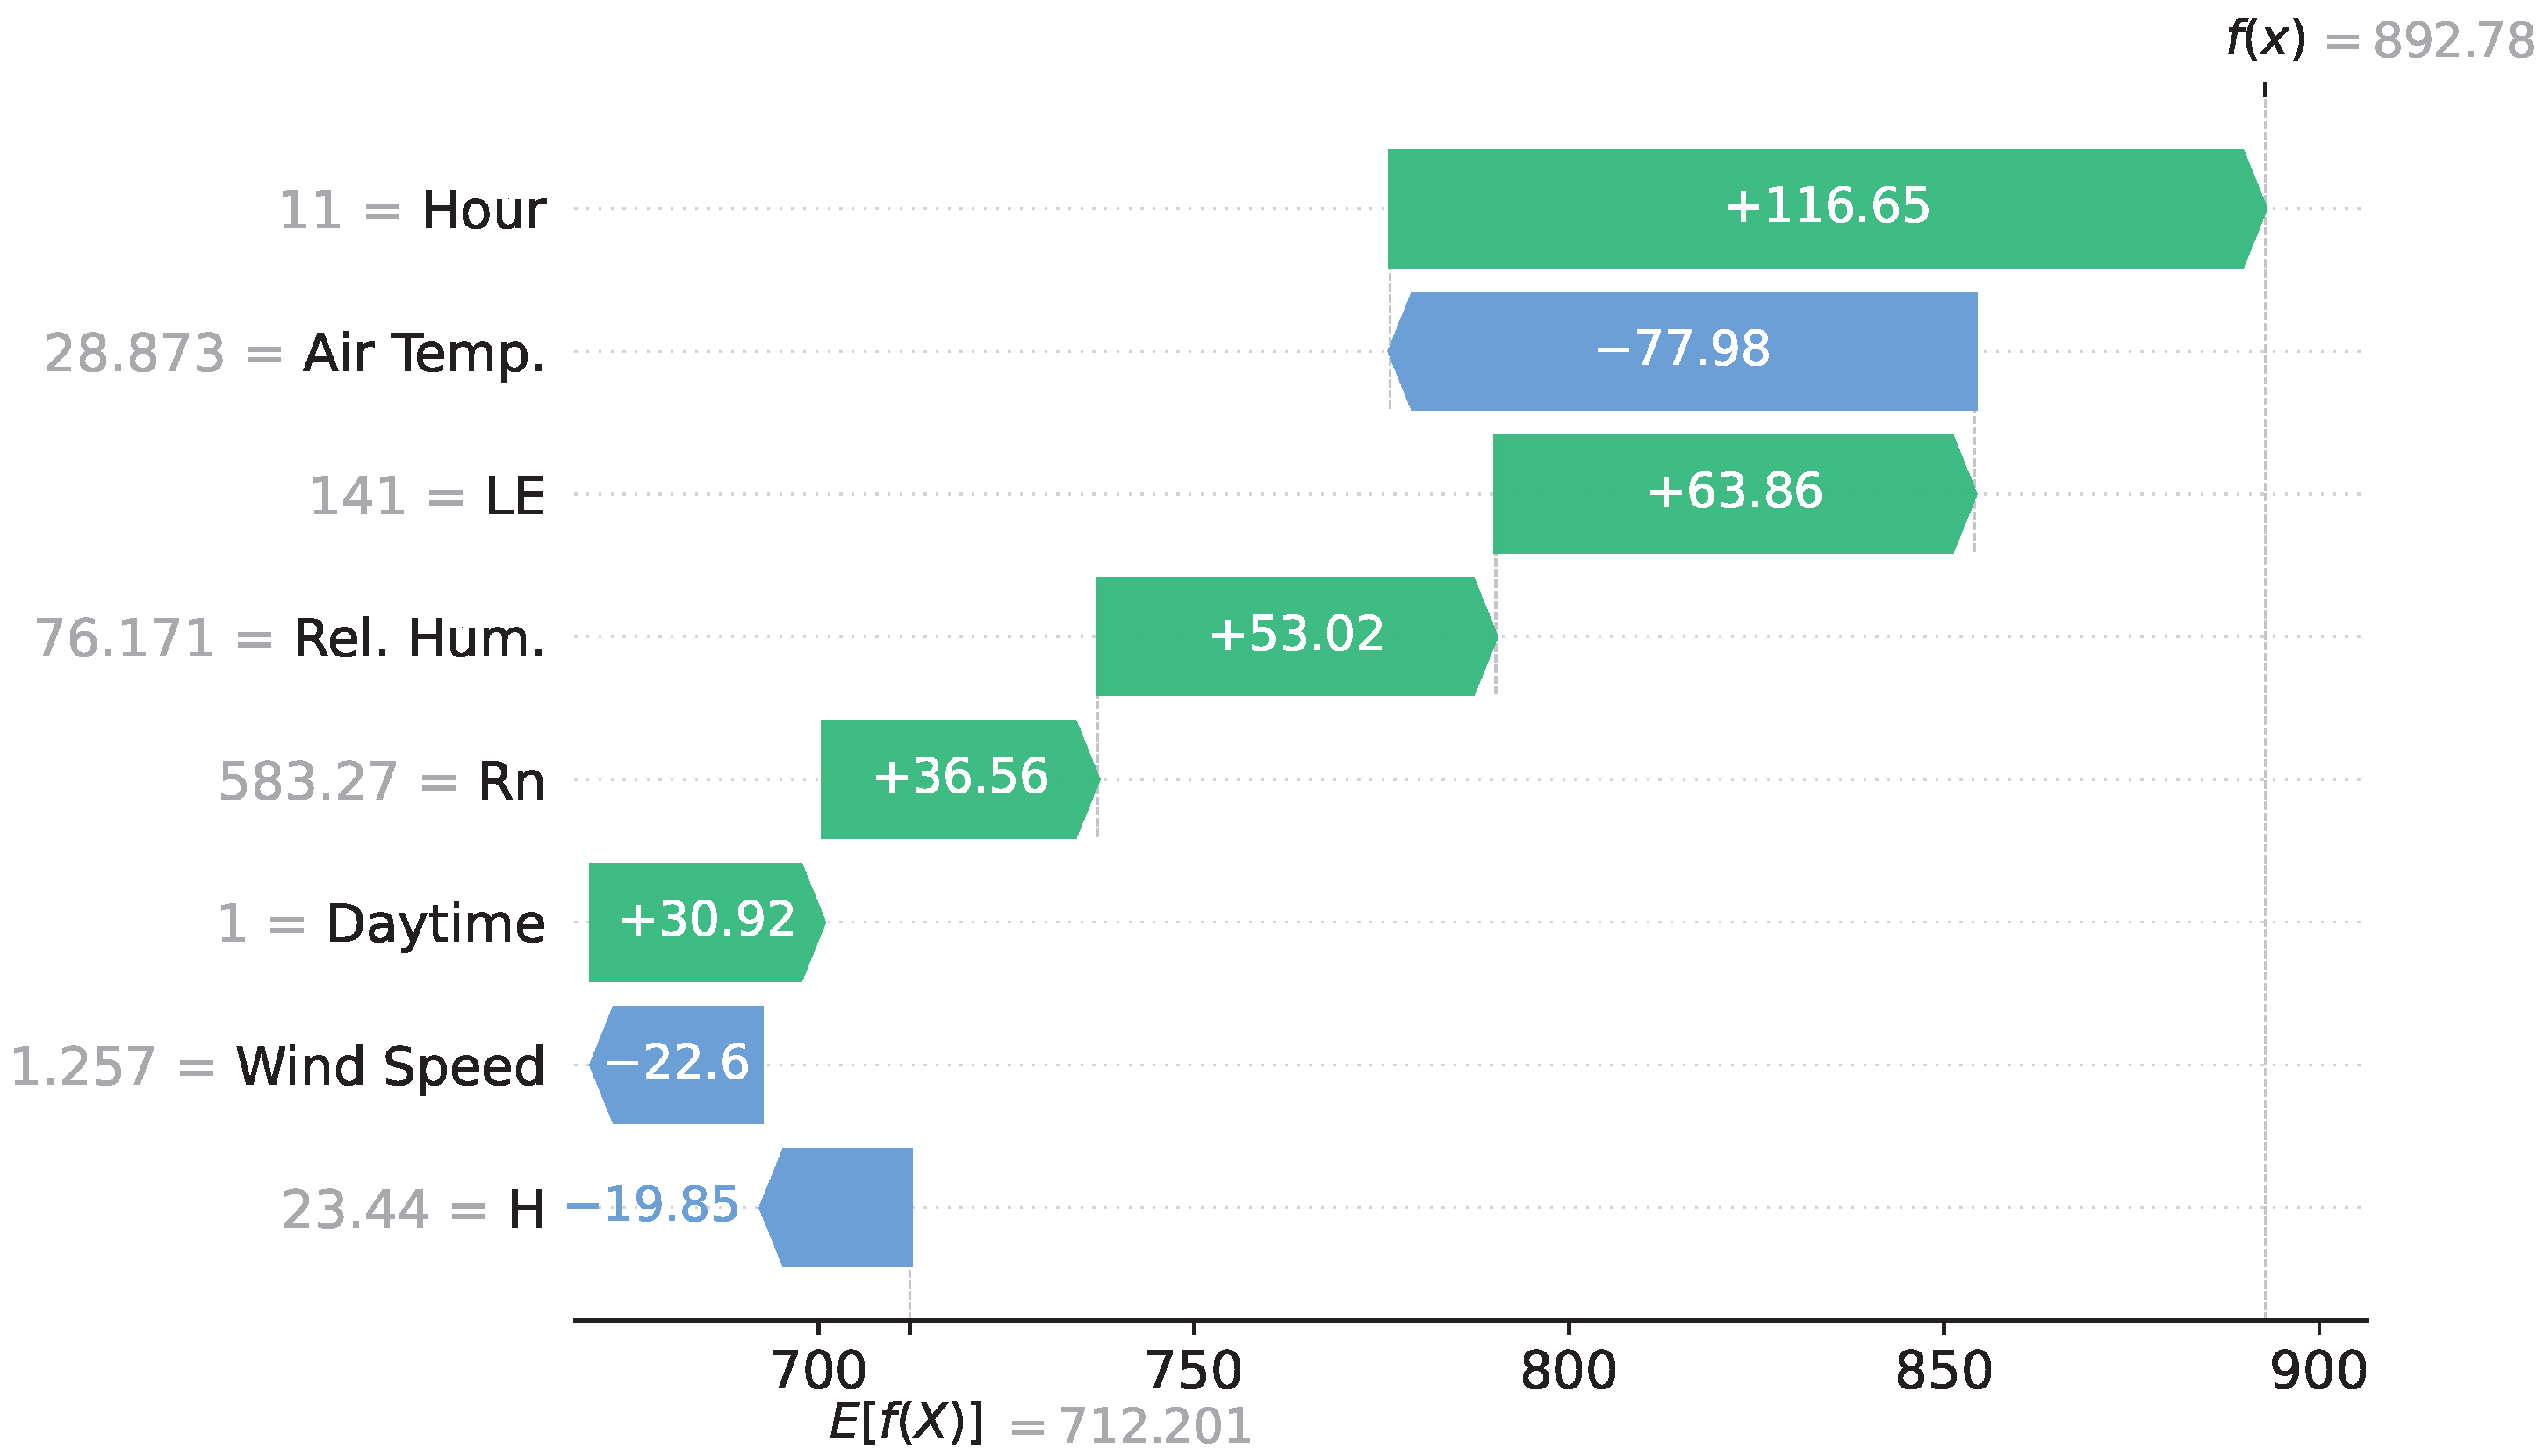
3.5. Explainability Analysis
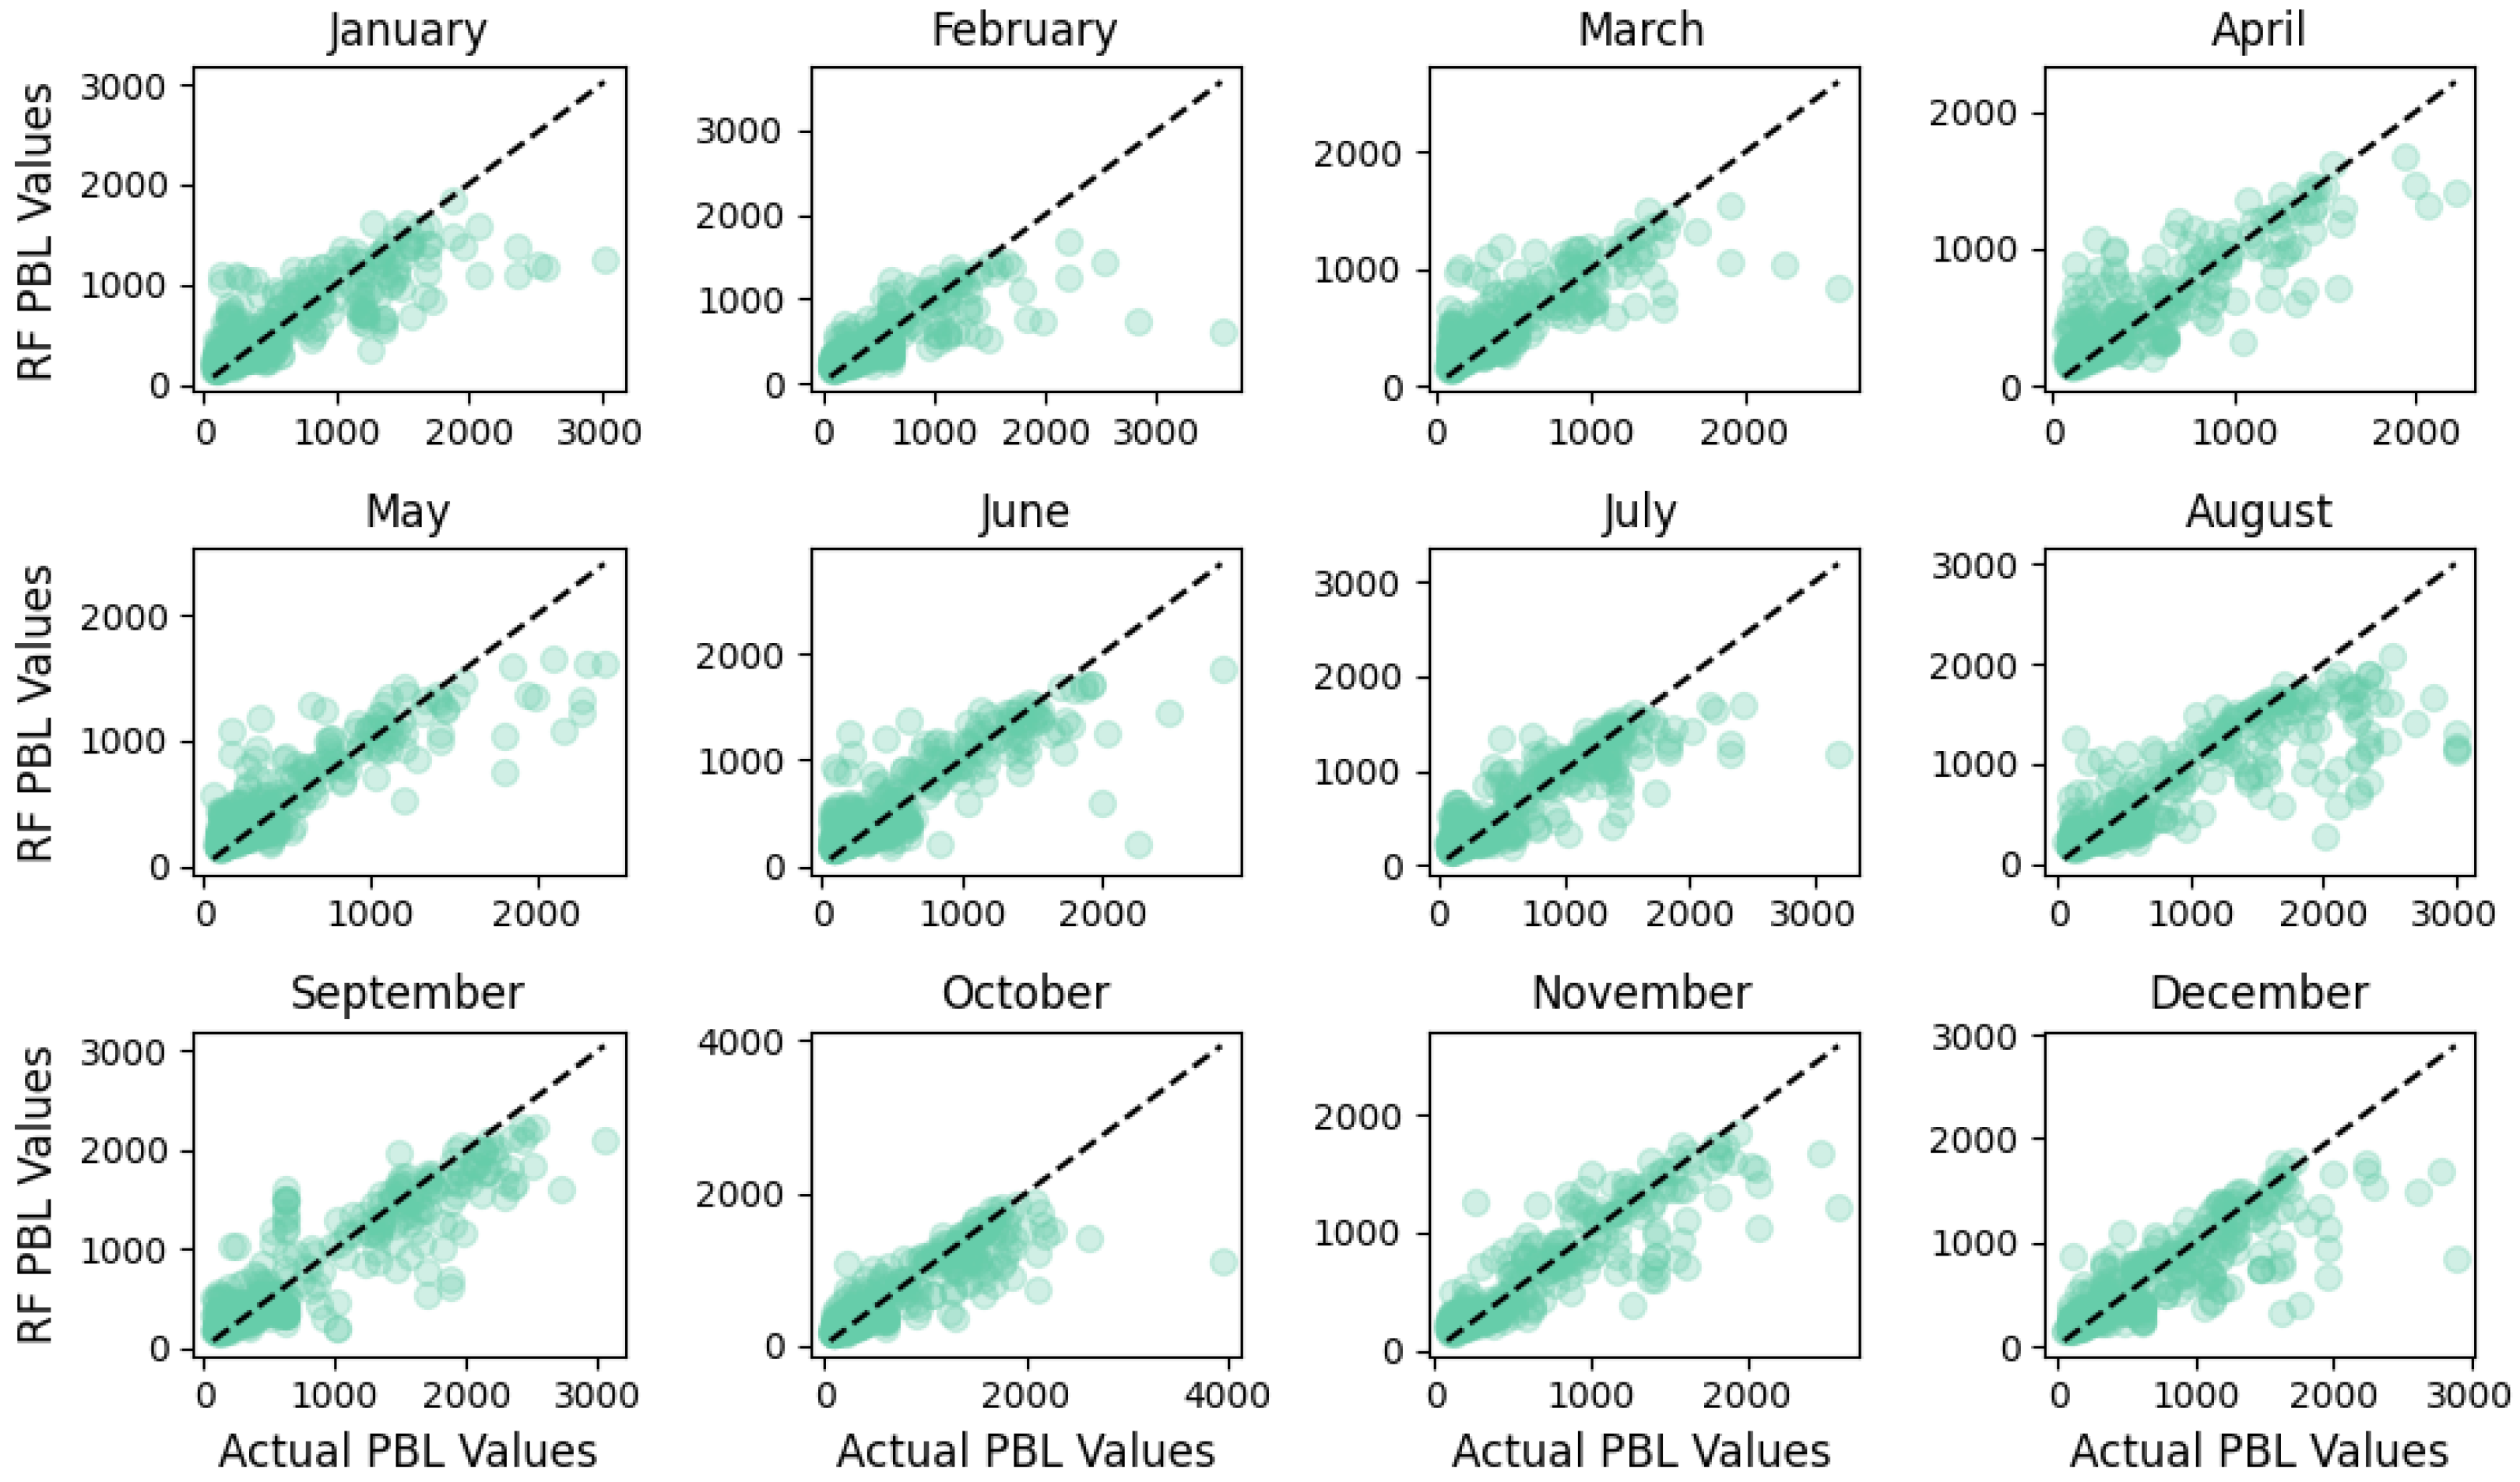
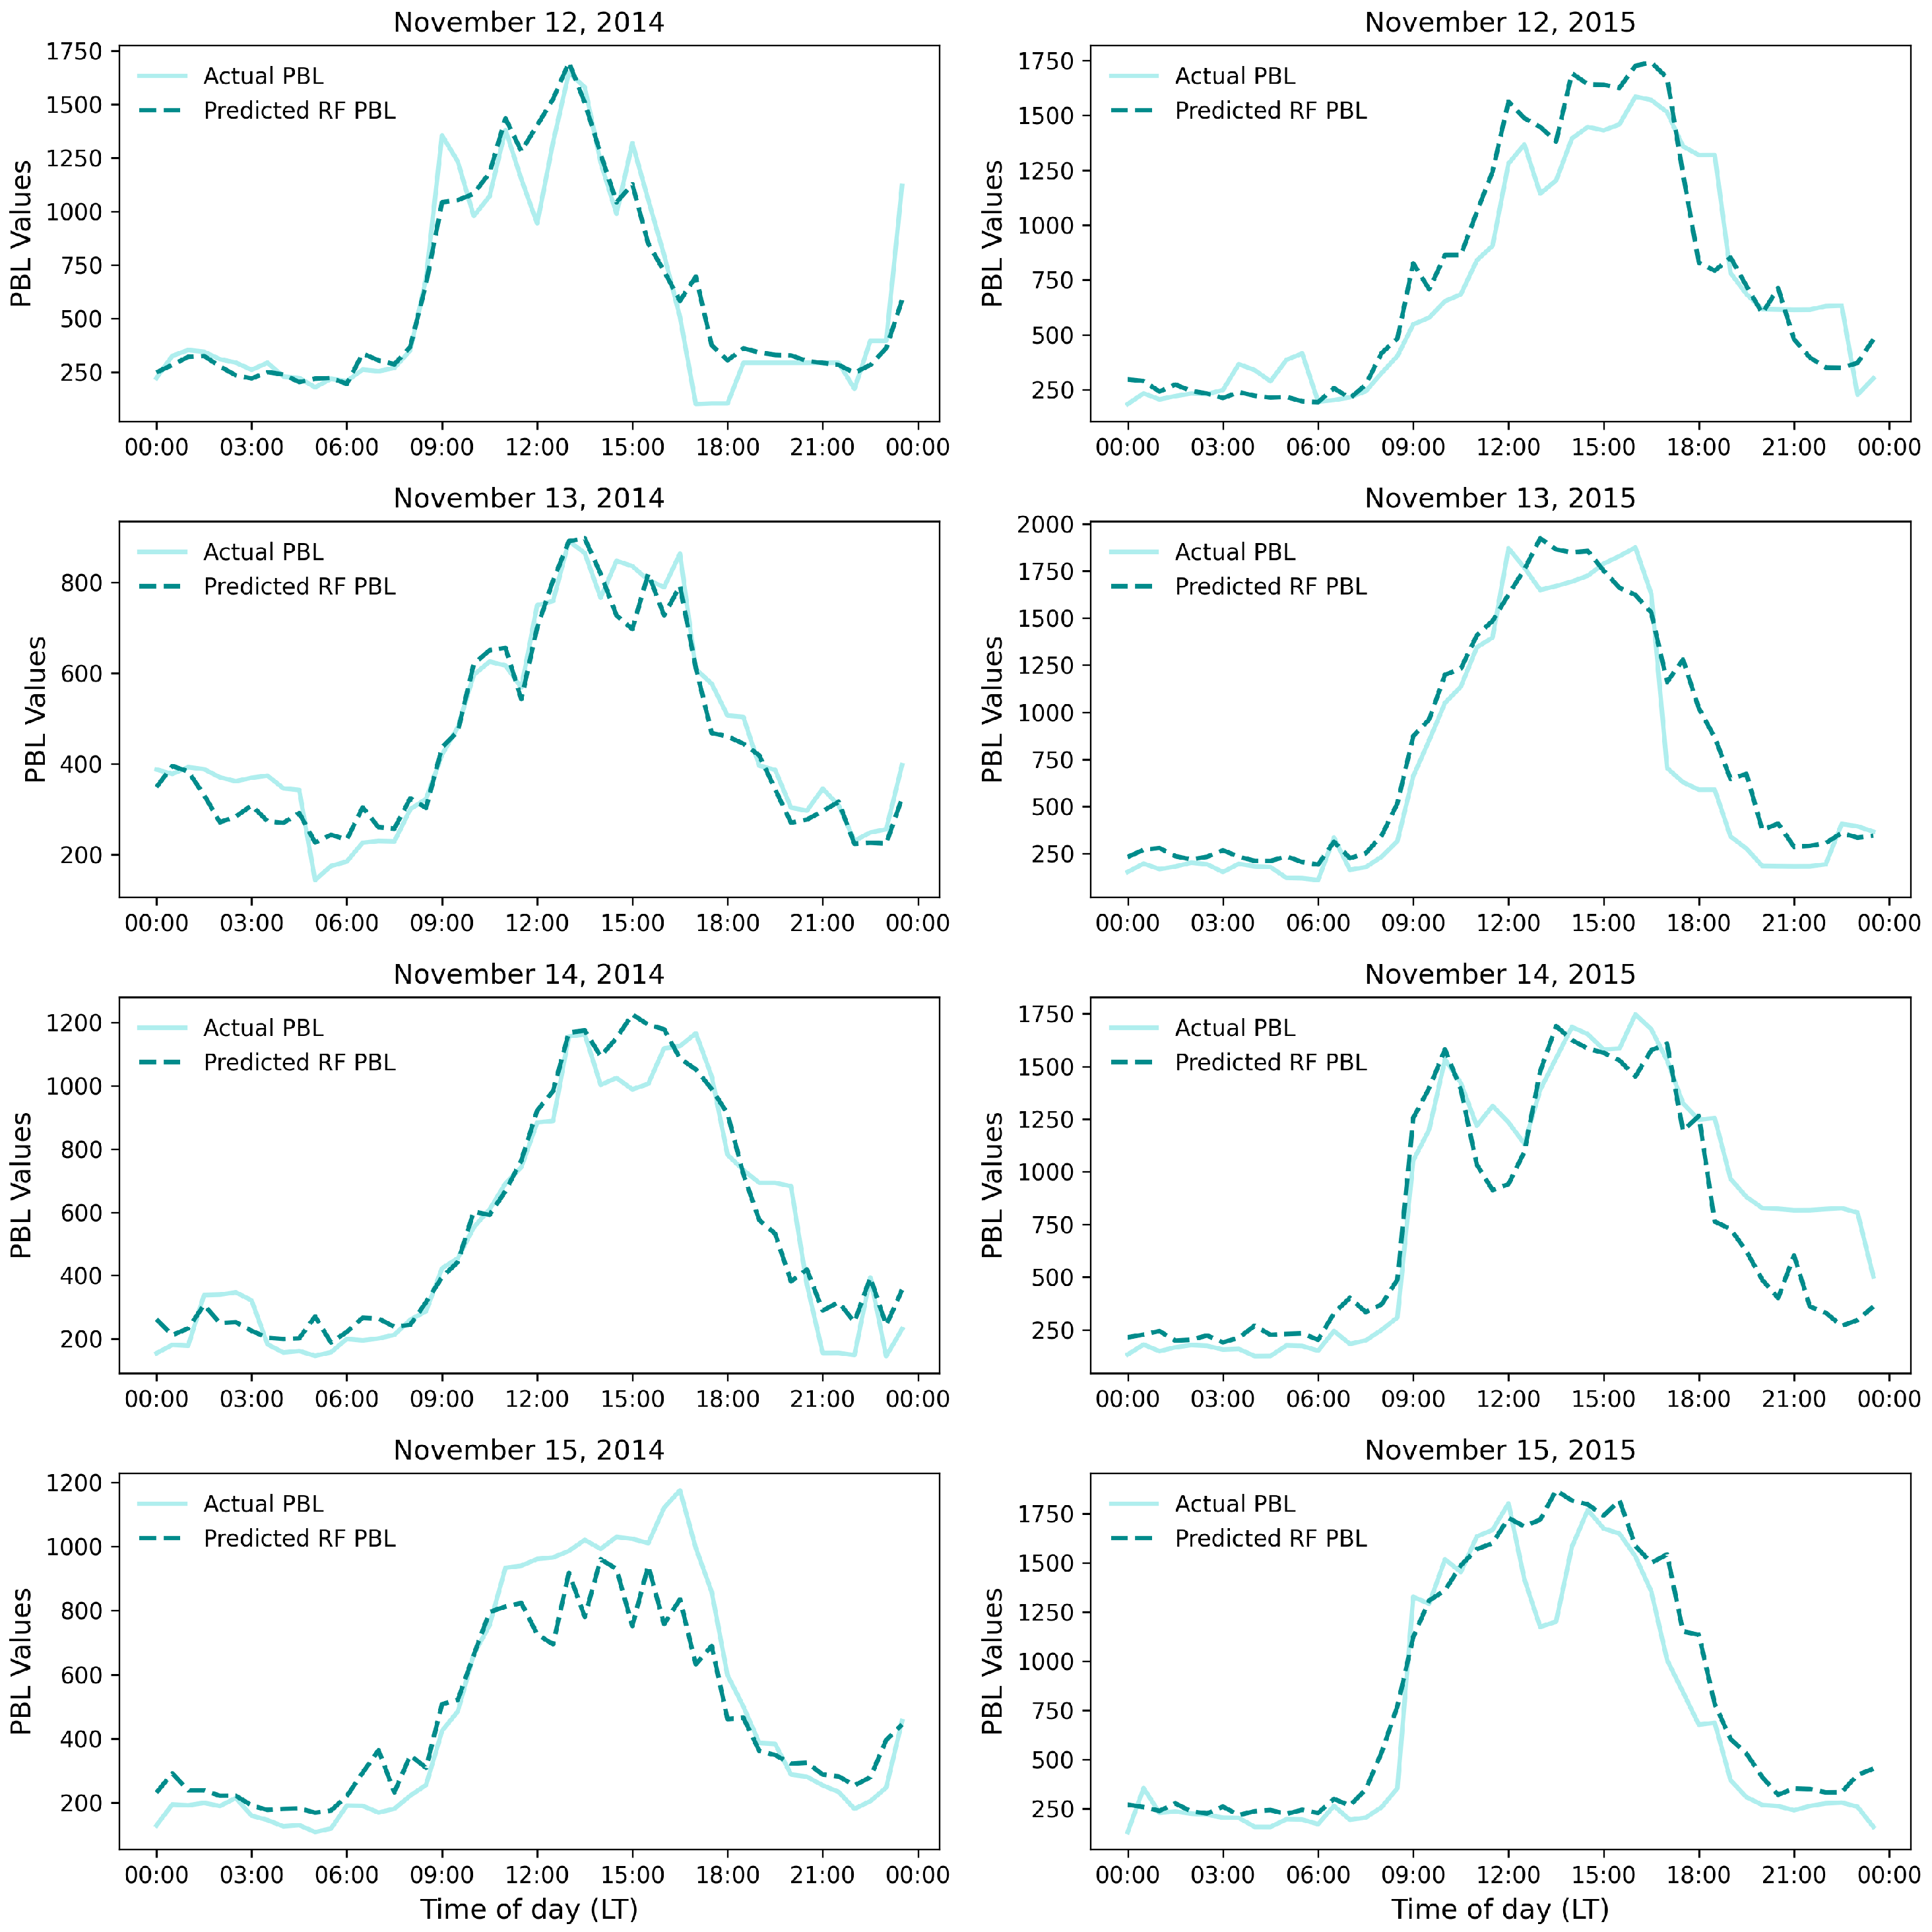
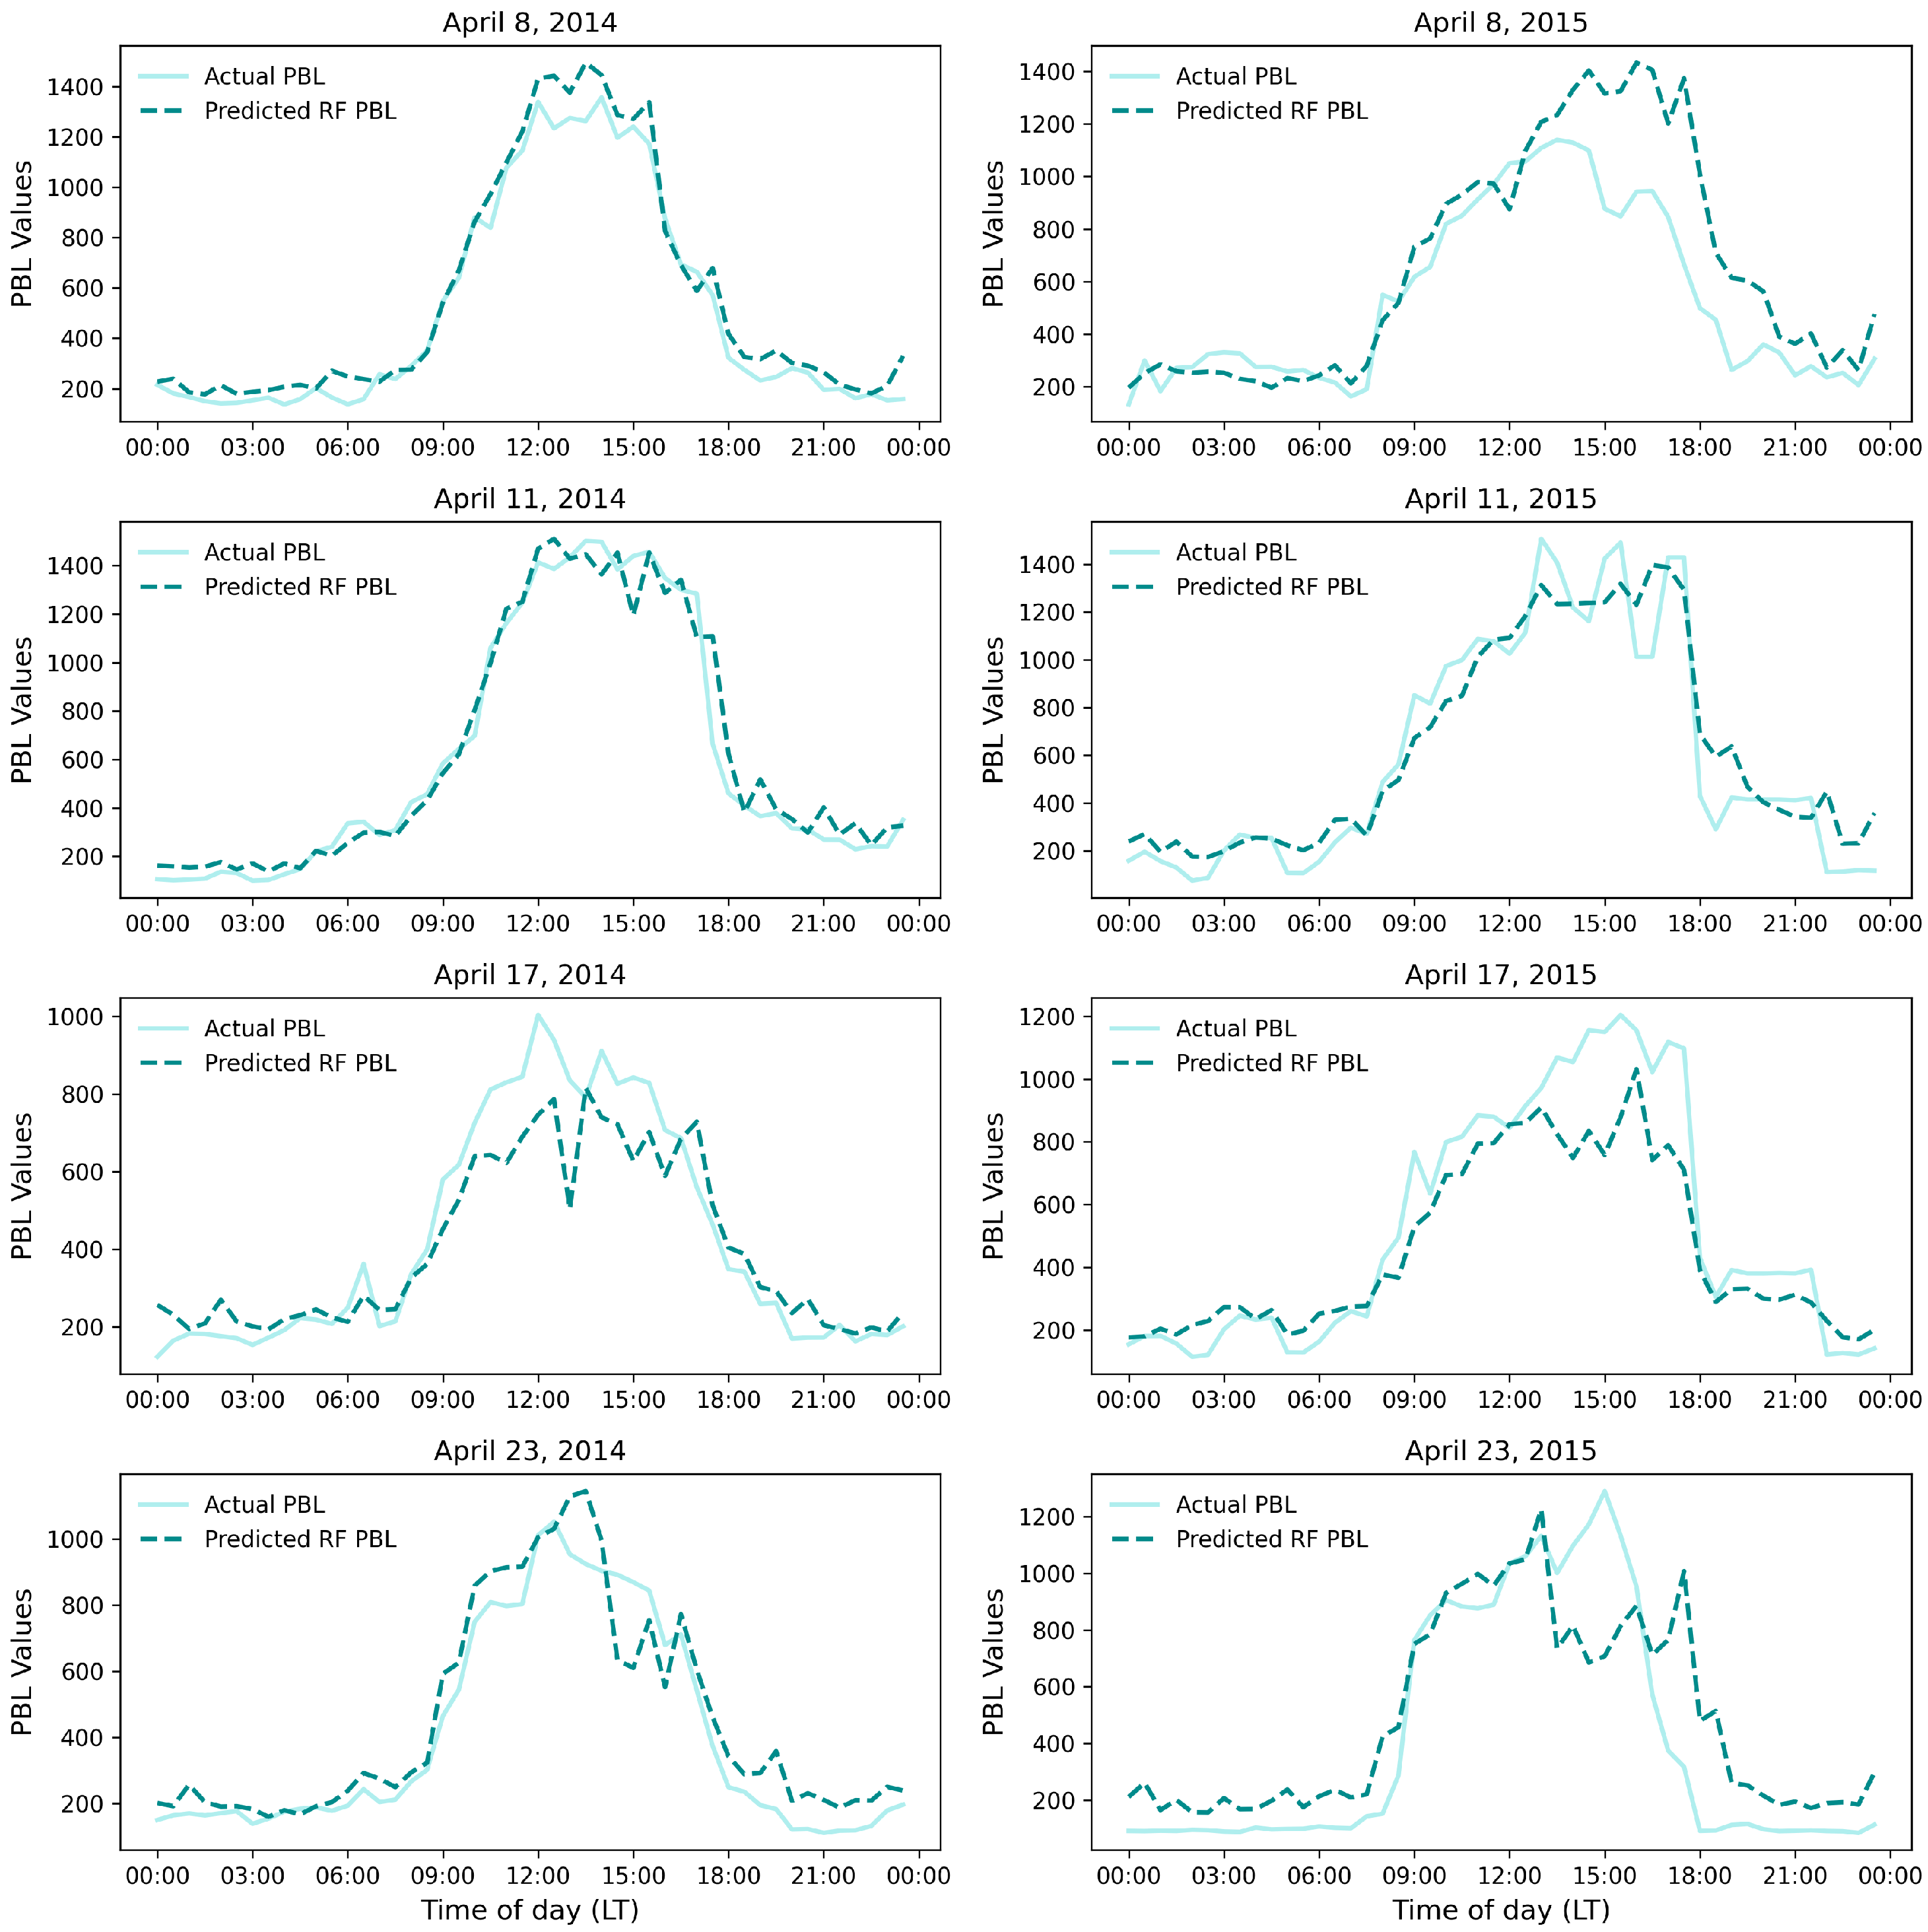
3.6. RF Performance on Diurnal and Seasonal Scale Data
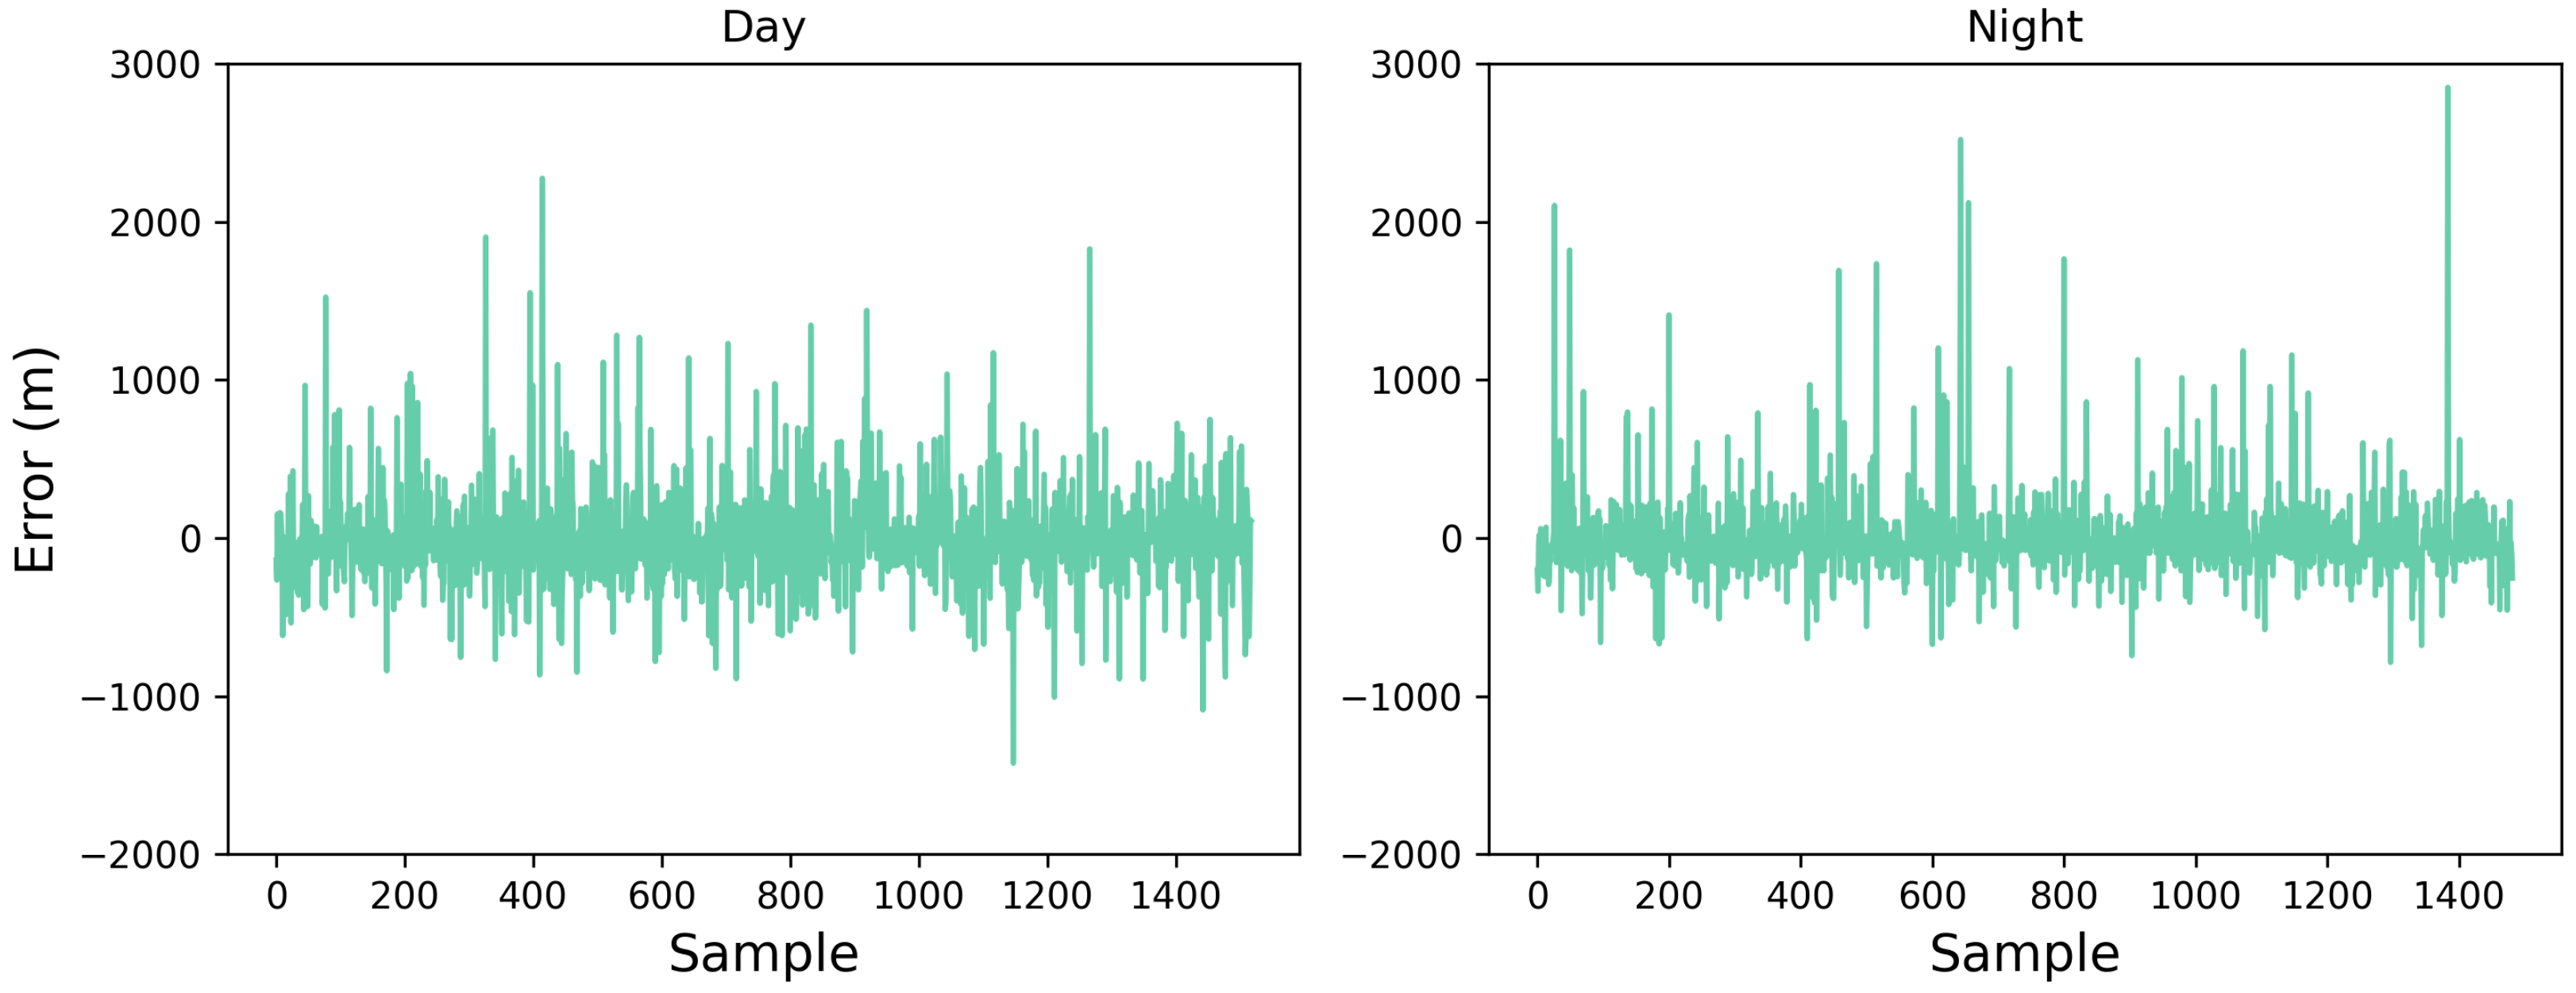
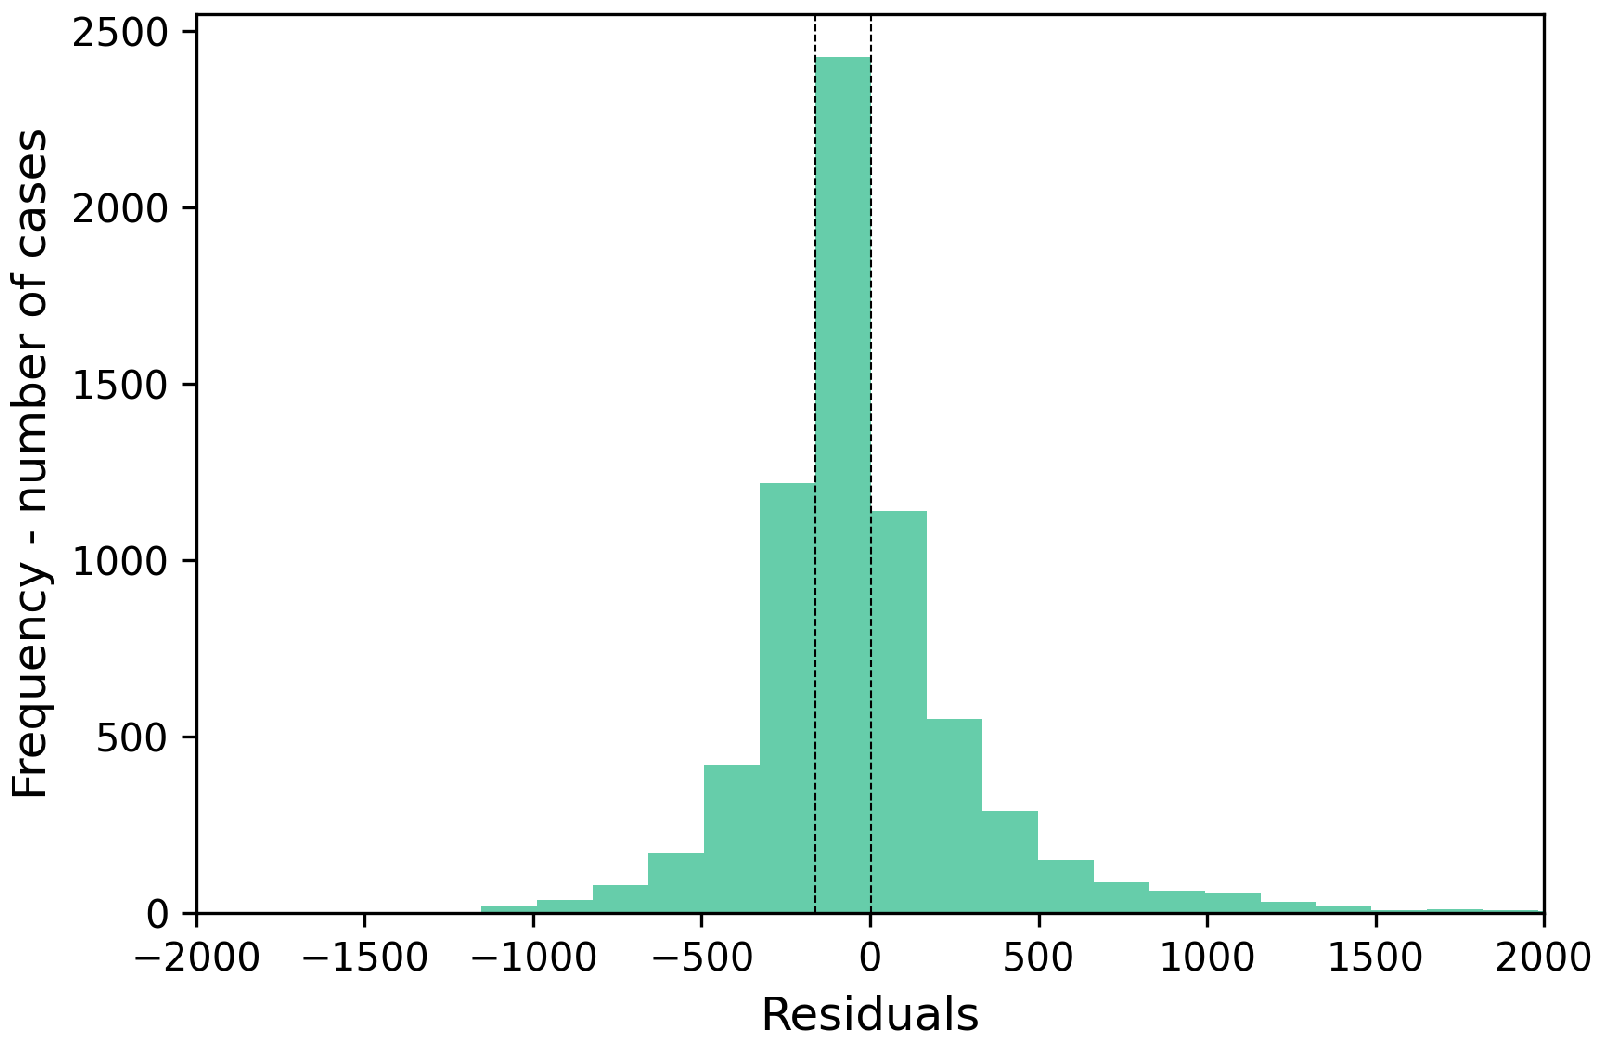
3.7. Residual Analysis
4. Conclusions
Author Contributions
Funding
Data Availability Statement
Acknowledgments
Conflicts of Interest
Appendix A
| Model | Hyperparameters / Configuration |
|---|---|
| LR | Default parameters from |
| sklearn.linear_model.LinearRegression | |
| SVR | Kernel: ‘rbf’ |
| C: 1.0 | |
| Epsilon: 0.1 | |
| Input and target scaled using StandardScaler | |
| LightGBM | Objective: ‘regression’ |
| Metric: ‘rmse’ | |
| Boosting type: ‘gbdt’ | |
| Learning rate: 0.05 | |
| Num leaves: 31 | |
| Feature fraction: 0.9 | |
| Bagging fraction: 0.8 | |
| Bagging frequency: 5 | |
| Verbosity: -1 | |
| XGBoost | Objective: ‘reg:squarederror’ |
| n_estimators: 100 | |
| Learning rate: 0.1 | |
| Max depth: 6 | |
| Subsample: 0.8 | |
| Colsample_bytree: 0.8 | |
| Random state: 42 | |
| DNN | Architecture: 3 hidden layers (128 → 64 → 32 neurons) |
| Activation: ‘relu’ for all hidden layers | |
| Dropout rates: 0.2, 0.1, 0.1 | |
| Output: 1 neuron (linear activation) | |
| Optimizer: ‘adam’ | |
| Loss: ‘mse’ | |
| Metrics: ‘mae’ |
References
- Kaimal, J.C.; Finnigan, J.J. Atmospheric Boundary Layer Flows: Their Structure and Measurement; Oxford University Press: Oxford, UK, 1994. [Google Scholar]
- Stull, R.B. An Introduction to Boundary Layer Meteorology; Springer Science & Business Media: New York, NY, USA, 2012; Volume 13. [Google Scholar]
- Xi, X.; Zhang, Y.; Gao, Z.; Yang, Y.; Zhou, S.; Duan, Z.; Yin, J. Diurnal climatology of correlations between the planetary boundary layer height and surface meteorological factors over the contiguous United States. Int. J. Climatol. 2022, 42, 5092–5110. [Google Scholar] [CrossRef]
- Geiß, A.; Wiegner, M.; Bonn, B.; Schäfer, K.; Forkel, R.; von Schneidemesser, E.; Münkel, C.; Chan, K.L.; Nothard, R. Mixing layer height as an indicator for urban air quality? Atmos. Meas. Tech. 2017, 10, 2969–2988. [Google Scholar] [CrossRef]
- de Arruda Moreira, G.; Guerrero-Rascado, J.L.; Bravo-Aranda, J.A.; Foyo-Moreno, I.; Cazorla, A.; Alados, I.; Lyamani, H.; Landulfo, E.; Alados-Arboledas, L. Study of the planetary boundary layer height in an urban environment using a combination of microwave radiometer and ceilometer. Atmos. Res. 2020, 240, 104932. [Google Scholar] [CrossRef]
- Díaz-Esteban, Y.; Raga, G.B. Observational evidence of the transition from shallow to deep convection in the Western Caribbean Trade Winds. Atmosphere 2019, 10, 700. [Google Scholar] [CrossRef]
- Oliveira, M.I.; Acevedo, O.C.; Sörgel, M.; Nascimento, E.L.; Manzi, A.O.; Oliveira, P.E.; Brondani, D.V.; Tsokankunku, A.; Andreae, M.O. Planetary boundary layer evolution over the Amazon rainforest in episodes of deep moist convection at the Amazon Tall Tower Observatory. Atmos. Chem. Phys. 2020, 20, 15–27. [Google Scholar] [CrossRef]
- Troen, I.; Mahrt, L. A simple model of the atmospheric boundary layer; Sensitivity to surface evaporation. Bound.-Layer Meteorol. 1986, 37, 129–148. [Google Scholar] [CrossRef]
- Noh, Y.; Cheon, W.; Hong, S.; Raasch, S. Improvement of the K-profile model for the planetary boundary layer based on large eddy simulation data. Bound.-Layer Meteorol. 2003, 107, 401–427. [Google Scholar] [CrossRef]
- Yao, H.; Li, X.; Pang, H.; Sheng, L.; Wang, W. Application of random forest algorithm in hail forecasting over Shandong Peninsula. Atmos. Res. 2020, 244, 105093. [Google Scholar] [CrossRef]
- Mohammed, A.; Kora, R. A comprehensive review on ensemble deep learning: Opportunities and challenges. J. King Saud-Univ.-Comput. Inf. Sci. 2023, 35, 757–774. [Google Scholar] [CrossRef]
- Zheng, L.; Lin, R.; Wang, X.; Chen, W. The development and application of machine learning in atmospheric environment studies. Remote Sens. 2021, 13, 4839. [Google Scholar] [CrossRef]
- Peng, Z.; Zhang, B.; Wang, D.; Niu, X.; Sun, J.; Xu, H.; Cao, J.; Shen, Z. Application of machine learning in atmospheric pollution research: A state-of-art review. Sci. Total Environ. 2024, 910, 168588. [Google Scholar] [CrossRef]
- Breiman, L. Random forests. Mach. Learn. 2001, 45, 5–32. [Google Scholar] [CrossRef]
- Das, S.; Chakraborty, R.; Maitra, A. A random forest algorithm for nowcasting of intense precipitation events. Adv. Space Res. 2017, 60, 1271–1282. [Google Scholar] [CrossRef]
- Krishnamurthy, R.; Newsom, R.K.; Berg, L.K.; Xiao, H.; Ma, P.L.; Turner, D.D. On the estimation of boundary layer heights: A machine learning approach. Atmos. Meas. Tech. Discuss. 2020, 2020, 4403–4424. [Google Scholar] [CrossRef]
- Xing Zhao, Z.; Lin Fu, S.; Jie Chen, J. A machine learning algorithm for planetary boundary layer height estimating by combining remote sensing data. In Proceedings of the Sixth Conference on Frontiers in Optical Imaging and Technology: Applications of Imaging Technologies, Nanjing, China, 22–24 October 2023; SPIE: Bellingham, WA, USA, 2024; Volume 13157, pp. 393–398. [Google Scholar]
- Peng, K.; Xin, J.; Zhu, X.; Wang, X.; Cao, X.; Ma, Y.; Ren, X.; Zhao, D.; Cao, J.; Wang, Z. Machine learning model to accurately estimate the planetary boundary layer height of Beijing urban area with ERA5 data. Atmos. Res. 2023, 293, 106925. [Google Scholar] [CrossRef]
- Canché-Cab, L.; San-Pedro, L.; Ali, B.; Rivero, M.; Escalante, M. The atmospheric boundary layer: A review of current challenges and a new generation of machine learning techniques. Artif. Intell. Rev. 2024, 57, 1–51. [Google Scholar] [CrossRef]
- Zhang, D.; Comstock, J.; Sivaraman, C.; Mo, K.; Krishnamurthy, R.; Tian, J.; Su, T.; Li, Z.; Roldán-Henao, N. Best Estimate of the Planetary Boundary Layer Height from Multiple Remote Sensing Measurements. EGUsphere 2025, 2025, 1–36. [Google Scholar] [CrossRef]
- Martin, S.T.; Artaxo, P.; Machado, L.A.T.; Manzi, A.O.; Souza, R.A.F.d.; Schumacher, C.; Wang, J.; Andreae, M.O.; Barbosa, H.; Fan, J.; et al. Introduction: Observations and modeling of the Green Ocean Amazon (GoAmazon2014/5). Atmos. Chem. Phys. 2016, 16, 4785–4797. [Google Scholar] [CrossRef]
- Jadhav, A.; Pramod, D.; Ramanathan, K. Comparison of performance of data imputation methods for numeric dataset. Appl. Artif. Intell. 2019, 33, 913–933. [Google Scholar] [CrossRef]
- Genuer, R.; Poggi, J.M.; Genuer, R.; Poggi, J.M. Random Forests; Springer: Berlin/Heidelberg, Germany, 2020. [Google Scholar]
- Akiba, T.; Sano, S.; Yanase, T.; Ohta, T.; Koyama, M. Optuna: A next-generation hyperparameter optimization framework. In Proceedings of the 25th ACM SIGKDD International Conference on Knowledge Discovery & Data Mining, Anchorage, AK, USA, 4–8 August 2019; pp. 2623–2631. [Google Scholar]
- Shekhar, S.; Bansode, A.; Salim, A. A comparative study of hyper-parameter optimization tools. In Proceedings of the 2021 IEEE Asia-Pacific Conference on Computer Science and Data Engineering (CSDE), Brisbane, Australia, 8–10 December 2021; IEEE: New York, NY, USA, 2021; pp. 1–6. [Google Scholar]
- Nti, I.K.; Nyarko-Boateng, O.; Aning, J. Performance of machine learning algorithms with different K values in K-fold cross-validation. Int. J. Inf. Technol. Comput. Sci. 2021, 13, 61–71. [Google Scholar]
- Zhang, X.; Liu, C.A. Model averaging prediction by K-fold cross-validation. J. Econom. 2023, 235, 280–301. [Google Scholar] [CrossRef]
- Su, T.; Zhang, Y. Deep-learning-derived planetary boundary layer height from conventional meteorological measurements. Atmos. Chem. Phys. 2024, 24, 6477–6493. [Google Scholar] [CrossRef]
- Lundberg, S.M.; Lee, S.I. A unified approach to interpreting model predictions. Adv. Neural Inf. Process. Syst. 2017, 30, 4768–4777. [Google Scholar]
- Scornet, E. Trees, forests, and impurity-based variable importance in regression. In Annales de l’Institut Henri Poincare (B) Probabilites et Statistiques; Institut Henri Poincaré: Paris, France, 2023; Volume 59, pp. 21–52. [Google Scholar]
- Mendonça, A.C.; Dias-Júnior, C.Q.; Acevedo, O.C.; Marra, D.M.; Cely-Toro, I.M.; Fisch, G.; Brondani, D.V.; Manzi, A.O.; Portela, B.T.; Quesada, C.A.; et al. Estimation of the nocturnal boundary layer height over the Central Amazon forest using turbulence measurements. Agric. For. Meteorol. 2025, 367, 110469. [Google Scholar] [CrossRef]
- Carneiro, R.G.; Ribeiro, M.M.; Gatti, L.V.; de Souza, C.M.A.; Dias-Júnior, C.Q.; Tejada, G.; Domingues, L.G.; Rykowska, Z.; dos Santos, C.A.; Fisch, G. Assessing the effectiveness of convective boundary layer height estimation using flight data and ERA5 profiles in the Amazon biome. Clim. Dyn. 2025, 63, 109. [Google Scholar] [CrossRef]
- Kamińska, J.A. Residuals in the modelling of pollution concentration depending on meteorological conditions and traffic flow, employing decision trees. ITM Web Conf. 2018, 23, 00016. [Google Scholar] [CrossRef]
- Stapleton, A.; Dias-Junior, C.Q.; Von Randow, C.; Farias D’Oliveira, F.A.; Pötextker, C.; de Araújo, A.C.; Roantree, M.; Eichelmann, E. Intercomparison of machine learning models to determine the planetary boundary layer height over Central Amazonia. J. Geophys. Res. Atmos. 2025, 130, e2024JD042488. [Google Scholar] [CrossRef]





| Instrument | Measurements or Features | Sensor Resolution |
|---|---|---|
| Ceilometer (CL31 from Vaisala Inc., Helsinki, Finland) | PBL height estimates (m) | 16 s to 10 min |
| Thermo-hygrometer (HMP45C Vaisala Inc., Helsinki, Finland) | Air temperature (°C) | 1 min |
| Thermo-hygrometer (HMP45C Vaisala Inc., Helsinki, Finland) | Relative Humidity (%) | 1 min |
| RM Young 05103/05106 Wind Monitor | Wind Velocity (m/s) | 1 min |
| CNR4/CNF4, (Kipp & Zonen, Delft, the Netherlands) | Radiation Balance () | 30 min |
| Sonic Anemometer (3D; CSAT model-3, Campbell Scientific Inc., Logan, USA) | Latent Heat Flux () | 30 min |
| Sonic Anemometer (3D; CSAT model-3, Campbell Scientific Inc., Logan, USA) | Sensible Heat Flux () | 30 min |
| Y | M | D | Hour 1 | H | LE | Rn | Air Temp. (°C) | Rel. Hum. (%) | Wind Speed (m/s) | PBL Heig. (m) |
|---|---|---|---|---|---|---|---|---|---|---|
| 2014 | 2 | 27 | 10:00 | - | −216 | - | 28.0 | 83.0 | 1.2 | 503 |
| 2014 | 10 | 1 | 13:30 | 61 | 287 | - | 34.7 | 53.0 | 2.7 | 2048 |
| 2014 | 7 | 18 | 01:30 | −1 | - | −12 | 23.4 | 97.2 | 0.0 | 97 |
| 2015 | 1 | 7 | 16:30 | −21 | 104 | 263 | 32.0 | 62.5 | 3.1 | 1481 |
| 2015 | 5 | 14 | 18:30 | −1 | −1 | −39 | 24.9 | 99.1 | 0.7 | 2107 |
| 2015 | 4 | 1 | 04:00 | 0 | −13 | −5 | 21.9 | 99.5 | 0.9 | - |
| 2015 | 4 | 1 | 08:30 | 43 | −26 | 151 | 24.2 | 97.5 | 1.1 | 280 |
| Statistic | H | LE | Rn | Air Temperature | Relative Humidity | Wind Speed | PBL Height |
|---|---|---|---|---|---|---|---|
| Count | 25,889 | 21,833 | 22,616 | 33,037 | 32,457 | 33,322 | 31,954 |
| Missing Ratio | 27% | 38% | 36% | 6% | 8% | 6% | 7.3% |
| Mean | 20.6 | 33.3 | 121.5 | 27 | 87.1 | 1.5 | 616.6 |
| Std | 54.7 | 124.8 | 213.6 | 3.5 | 15 | 1.2 | 616.4 |
| Min | −449.7 | −1233 | −290.8 | 13.2 | −245 | 0 | 40 |
| 25% | −1.8 | −1.8 | −27.3 | 24.3 | 78.1 | 0.59 | 146.1 |
| 50% | 0.9 | 1.7 | −8.8 | 26 | 94.1 | 1.2 | 340 |
| 75% | 29.7 | 76.3 | 234.4 | 29.6 | 98.3 | 2.2 | 970.4 |
| 90% | 83.3 | 206.7 | 491.4 | 32.3 | 99.7 | 3.3 | 1559.6 |
| Max | 384.6 | 573.4 | 1708.8 | 38.8 | 102.8 | 10.6 | 4000 |
| Strategy | Feature Exclusion | Row Removal | Imputation |
|---|---|---|---|
| 1 | - | Any missing values | - |
| 2 | - | Fully Missing Rows | Mean Imputation |
| 3 | - | - | Mean Imputation |
| 4 | Exclude LE | - | Mean Imputation |
| 5 | Exclude LE | Fully Missing Rows | Mean Imputation |
| 6 | Exclude LE and Rn | - | Mean Imputation |
| 7 | Exclude LE and Rn | Fully Missing Rows | Mean Imputation |
| 8 | - | Fully Missing Rows | Nearest Neighbors 2 Mean Imputation 3 |
| 9 | - | Fully Missing Rows Empty PBL | Nearest Neighbors 2 |
| 10 | - | Any missing values | Mean Imputation 1 |
| 11 | - | Fully Missing Rows Empty PBL | Nearest Neighbors Mean Imputation 1 |
| Strategy | RF | LR | SVR | ||||||
|---|---|---|---|---|---|---|---|---|---|
| RMSE | MAE | R2 | RMSE | MAE | R2 | RMSE | MAE | R2 | |
| 1 | 381.09 | 240.60 | 0.65 | 424.01 | 281.53 | 0.57 | 479.41 | 294.48 | 0.45 |
| 2 | 375.89 | 241.27 | 0.60 | 421.06 | 281.64 | 0.50 | 442.94 | 272.20 | 0.45 |
| 3 | 381.21 | 238.43 | 0.59 | 421.07 | 278.69 | 0.49 | 443.56 | 276.14 | 0.44 |
| 4 | 383.11 | 239.94 | 0.58 | 421.57 | 278.98 | 0.49 | 442.32 | 272.91 | 0.44 |
| 5 | 377.81 | 242.40 | 0.60 | 422.24 | 282.85 | 0.50 | 442.76 | 270.23 | 0.45 |
| 6 | 387.00 | 244.22 | 0.57 | 421.49 | 278.89 | 0.49 | 441.36 | 270.49 | 0.45 |
| 7 | 382.19 | 245.36 | 0.59 | 426.81 | 284.35 | 0.49 | 443.81 | 268.46 | 0.44 |
| 8 | 381.18 | 245.79 | 0.59 | 424.30 | 286.49 | 0.50 | 442.75 | 272.37 | 0.45 |
| 9 | 380.05 | 241.56 | 0.61 | 414.34 | 275.90 | 0.54 | 437.02 | 262.74 | 0.49 |
| 10 | 391.18 | 251.41 | 0.62 | 434.10 | 290.71 | 0.53 | 472.44 | 290.29 | 0.45 |
| 11 | 376.10 | 239.06 | 0.62 | 413.47 | 275.88 | 0.54 | 436.15 | 261.65 | 0.49 |
| Model | RMSE | MAE | R2 |
|---|---|---|---|
| RF | 375.89 | 241.27 | 0.6 |
| LightGBM | 379.16 | 244.3 | 0.6 |
| XGBoost | 379.31 | 244 | 0.6 |
| DNN | 390.89 | 251.56 | 0.57 |
Disclaimer/Publisher’s Note: The statements, opinions and data contained in all publications are solely those of the individual author(s) and contributor(s) and not of MDPI and/or the editor(s). MDPI and/or the editor(s) disclaim responsibility for any injury to people or property resulting from any ideas, methods, instructions or products referred to in the content. |
© 2025 by the authors. Licensee MDPI, Basel, Switzerland. This article is an open access article distributed under the terms and conditions of the Creative Commons Attribution (CC BY) license (https://creativecommons.org/licenses/by/4.0/).
Share and Cite
Silva, P.R.P.; Carneiro, R.G.; Moraes, A.O.; Dias-Junior, C.Q.; Fisch, G. Estimating Planetary Boundary Layer Height over Central Amazonia Using Random Forest. Atmosphere 2025, 16, 941. https://doi.org/10.3390/atmos16080941
Silva PRP, Carneiro RG, Moraes AO, Dias-Junior CQ, Fisch G. Estimating Planetary Boundary Layer Height over Central Amazonia Using Random Forest. Atmosphere. 2025; 16(8):941. https://doi.org/10.3390/atmos16080941
Chicago/Turabian StyleSilva, Paulo Renato P., Rayonil G. Carneiro, Alison O. Moraes, Cleo Quaresma Dias-Junior, and Gilberto Fisch. 2025. "Estimating Planetary Boundary Layer Height over Central Amazonia Using Random Forest" Atmosphere 16, no. 8: 941. https://doi.org/10.3390/atmos16080941
APA StyleSilva, P. R. P., Carneiro, R. G., Moraes, A. O., Dias-Junior, C. Q., & Fisch, G. (2025). Estimating Planetary Boundary Layer Height over Central Amazonia Using Random Forest. Atmosphere, 16(8), 941. https://doi.org/10.3390/atmos16080941


