Abstract
To investigate the spatiotemporal evolution characteristics and primary driving factors of Gross Primary Productivity (GPP) on the Qinghai-Tibet Plateau, we employed an enhanced MODIS-PSN model. Utilizing the fifth-generation global climate reanalysis dataset (ECMWF ERA5), we generated GPP remote sensing products by integrating six natural factors. Through correlation analysis and geographical detector modeling, we quantitatively analyzed the spatiotemporal dynamics and key drivers of vegetation GPP across the Qinghai-Tibet Plateau from 2001 to 2022. The results demonstrate that GPP changes across the Qinghai-Tibet Plateau display pronounced spatial heterogeneity. The humid northeastern and southeastern regions exhibit significantly positive change rates, primarily distributed across wetland and forest ecosystems, with a maximum mean annual change rate of 12.40 gC/m2/year. In contrast, the central and southern regions display a decreasing trend, with the minimum change rate reaching −1.61 gC/m2/year, predominantly concentrated in alpine grasslands and desert areas. Vegetation GPP on the Qinghai-Tibet Plateau shows significant correlations with temperature, vapor pressure deficit (VPD), evapotranspiration (ET), leaf area index (LAI), precipitation, and radiation. Among the factors analyzed, LAI demonstrates the strongest explanatory power for spatial variations in vegetation GPP across the Qinghai-Tibet Plateau. The dominant factors influencing vegetation GPP on the Qinghai-Tibet Plateau are LAI, ET, and precipitation. The pairwise interactions between these factors exhibit linear enhancement effects, demonstrating synergistic multifactor interactions. This study systematically analyzed the response mechanisms and variations of vegetation GPP to multiple driving factors across the Qinghai-Tibet Plateau from a spatial heterogeneity perspective. The findings provide both a critical theoretical framework and practical insights for better understanding ecosystem response dynamics and drought conditions on the plateau.
1. Introduction
The Qinghai-Tibet Plateau, often referred to as the “Roof of the World” and the “Third Pole of the Earth,” serves as a vital ecological barrier, playing a pivotal role in safeguarding China’s environmental security [1,2,3]. With an average elevation of over 4400 m, it is the highest plateau in the world, and Mount Everest, located on the plateau [4], has an elevation of 8848.86 m (as measured in December 2020).
GPP is essential for human survival and development, serving as the foundation of the global carbon cycle and playing a key role in maintaining greenhouse gas concentrations and regulating the global climate. The Qinghai-Tibet Plateau has been called the “water tower of Asia” [5], and its ecosystems are more fragile and sensitive to climate change and anthropogenic disturbances at higher altitudes than at lower altitudes [6,7]. Over the past 20 years, human activity on the Qinghai-Tibet Plateau has intensified more than the global average, with the region’s warming rate being twice that of the global land average [8,9]. In the context of climate change and increasing human disturbances, investigating the variations in vegetation GPP and its driving factors on the Qinghai-Tibet Plateau is crucial for assessing the region’s ecosystem health and formulating effective strategies to preserve its ecological stability [10].
Studies on multiple environmental factors primarily use methods such as general linear modeling, principal component analysis (PCA), structural equation modeling (SEM), geographical detector (GD) modeling, and covariance analysis [11,12,13]. Factor detectors are used to assess the explanatory power of individual factors on a variable [13]. This enables one to analyze data more objectively, quantify indicator factors, and identify their coupling with geography. The q-value (q-statistic value) is used to characterize decision power, with higher q-values indicating stronger explanatory power. The GD model is a widely used statistical tool for geographical attribution analysis, offering a new spatial statistical method to detect spatial heterogeneity and identify determinants related to risk, factors, ecology, and interactions. It includes various detectors such as factor, ecological, risk, and interaction detectors. The aim of this study was to identify the key drivers affecting GPP and their interaction mechanisms. The main drivers selected were LAI, temperature, VPD, ET, precipitation, and radiation. This study focused on the assessment of spatial heterogeneity, identification of influencing factors, and in-depth analysis of interactions between variables.
Over the past 40 years, the spatial and temporal patterns of vegetation GPP on the Qinghai-Tibet Plateau have been characterized by a number of studies showing that the vegetation GPP on the Qinghai-Tibet Plateau is increasing, with “overall increase and local decrease” [14]. Li Hongyan et al. [15] investigated the spatial pattern of interannual changes in GPP on the Qinghai-Tibet Plateau from 2001 to 2019, which was “low in the northwest and high in the southeast” using a linear trend detection method. Vegetation growth is influenced by a combination of various factors. These factors are typically categorized into two groups: natural factors and human activities. Studies indicate that the primary drivers of robust vegetation growth in the Northern Hemisphere are the increase in global atmospheric carbon dioxide concentrations and rising temperatures due to global warming [16]. Numerous previous studies have shown that climatic factors such as temperature and precipitation are the key drivers influencing the growth and development of vegetation [17]. ET is one of the important variables in the terrestrial hydrological cycle, and evapotranspiration on the Qinghai-Tibet Plateau has shown complex trends under the influence of warming and humidification [18]. Precipitation also affects vegetation growth. Some studies have shown that the relationship between vegetation cover, temperature, and rainfall varies in stages and may even exhibit a negative correlation [19]. There is a need to explore the relationship between the interannual variability of GPP, climate factors, and different vegetation types on the Qinghai-Tibet Plateau [20]. Factors influencing vegetation change across the country based on the leaf area index [21]. The relationship between vegetation cover and GPP also varies by season, with the positive correlation being strongest in summer. In spring, summer, and autumn, the areas where GPP and NDVI are significantly correlated are mainly distributed in the southeastern Qinghai-Tibet Plateau [22]. Combined with previous studies, LAI, precipitation, temperature, radiation, VPD, and ET were selected as driving factors in this study to analyze the spatial variability of vegetation GPP in the Qinghai-Tibet Plateau. The study found that both climate factors and human activities play significant roles in vegetation cover changes, highlighting the strong correlation between climate change and vegetation dynamics. It also emphasized that human activities, such as policies like returning farmland to forests, have positively contributed to vegetation restoration [23]. The default parameters of the MODIS-PSN model show large deviation on the Qinghai-Tibet Plateau; using the MCMC parameter optimization method and measured data, the MODIS-PSN model was calibrated, which greatly improved its simulation accuracy, and, as a result, a set of GPP model parameters suitable for the Qinghai-Tibet Plateau was obtained. Using the reanalysis information and MODIS remote sensing data, the regional-scale GPP of the Qinghai-Tibet Plateau was estimated, and it was found that the GPP of the Qinghai-Tibet Plateau has shown a significant increasing trend in the last 20 years, and the relationship between the GPP of the Qinghai-Tibet Plateau and the driving factors (LAI, temperature, precipitation, radiation, VPD, and ET) was analyzed using correlation analysis and GD. Therefore, it is of great significance to study the changes in vegetation GPP and its relationship with driving factors in the Qinghai-Tibet Plateau region, to quantitatively investigate how changes in vegetation GPP relate to climatic factors, and to safeguard the ecological security of the Qinghai-Tibet Plateau while improving the ecological environment.
2. Materials and Methods
2.1. Study Area
The research area comprises approximately 2.5813 million square kilometers within China’s Qinghai-Tibet Plateau region (25.99° N~40.02° N, 67.68° E~104.68° E) [24,25]. The study area encompasses the entirety of the Tibet Autonomous Region, Qinghai Province, Xinjiang Uygur Autonomous Region, and Gansu Province, along with portions of Sichuan Province and Yunnan Province [24,26,27], as illustrated in Figure 1.
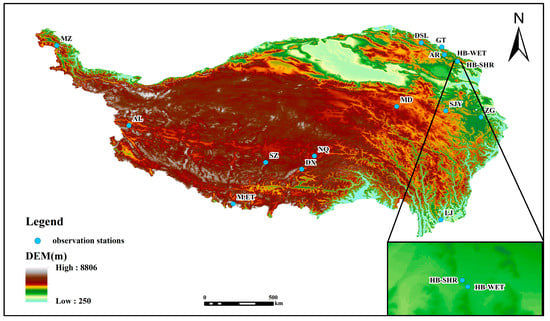
Figure 1.
The study area.
2.2. Data
(1) The Moderate Resolution Imaging Spectroradiometer (MODIS) products used in this study include the MCD15A2H Version 6 FPAR product (8-day temporal resolution, 500 m spatial resolution, available from 2001 to 2022), the MOD17A2H Version 6 GPP product (8-day temporal resolution, 500 m spatial resolution, available from 2001 to 2022), the MOD09A1 product (8-day composited global surface reflectance data, 500 m spatial resolution, available from 2001 to 2022), and the MCD12Q1 land cover classification product (IGBP classification scheme, focusing on evergreen coniferous forests, shrubs, grasslands, and permanent wetlands, with 8-day temporal resolution, 500 m spatial resolution, available from 2001 to 2022).
(2) The ECMWF Analysis v5 (ERA5) dataset provides hourly meteorological data at a spatial resolution of approximately 9 km (0.1° × 0.1°). This study utilizes three key ERA5-Land variables critical for meteorological analysis and climate research: 2 m dew point temperature (dewpoint_temperature_2m, K), 2 m air temperature (temperature_2m, K), and precipitation (precipitation, mm). The vapor pressure deficit (VPD) used in this study was calculated using dew point temperature and air temperature. To ensure data consistency, this study resampled the spatial resolution of ERA5-Land variables to 500 m and synthesized the temporal resolution into 8-day data for ease of calculation with MODIS.
(3) The MOD16A2 evapotranspiration dataset, derived from MODIS (Moderate Resolution Imaging Spectroradiometer) satellite remote sensing data and processed using the Penman–Monteith equation, was selected for evapotranspiration analysis. This dataset provides global vegetation cover evapotranspiration data with an 8-day temporal resolution and 500 m spatial resolution, covering the period from 2001 to 2022.
(4) The Leaf Area Index (LAI) data, obtained from the MOD15A2H Version 6.1 product of the Moderate Resolution Imaging Spectroradiometer (MODIS), has an 8-day temporal resolution and 500 m spatial resolution, covering the period from 2001 to 2022.
(5) In this study, six stations were selected from the Qinghai-Tibet Plateau region of China for data accuracy validation, representing four major ecosystems: evergreen coniferous forests, alpine grasslands, wetlands, and shrubland (Table 1). The observed meteorological data used in this study were obtained from the Arou, Dashalong, and Guantan sites. These three stations were established as part of the Black River Integrated Remote Sensing Joint Experiment (Watershed Allied Telemetry Experimental Research, WATER). Data from the Haibei shrubland site, Haibei Wetland site, and Dangxiong site were freely obtained through the China FLUX website (China Flux Observation Research Union).

Table 1.
Flux observation site.
2.3. Methods
2.3.1. Correlation Analysis
The Pearson correlation coefficient is a commonly used statistical method for measuring the strength and direction of a linear relationship between two continuous variables [28,29].
The Pearson correlation coefficient is calculated using the following formula [30]:
In Equation (1), r is the correlation coefficient between variables X and Y, and the spatial correlation coefficient range based on pixels is [−1, 1]. Positive (negative) values indicate a positive (negative) correlation between GPP and its driving factors, whereas zero denotes no statistically significant relationship between these variables; n is the study time, and the number of years is 22. In this study, Xi denotes the annual mean GPP for year i, and Yi represents the corresponding mean value of a specific driving factor during year i. represents the mean GPP over n years; represents the average driving factor for n years; and n is the total number of years. The strength of the correlation between two variables is represented by the magnitude of the positive or negative values of the correlation coefficient [30]. When the Pearson correlation coefficient approaches 0, it indicates that there is no significant linear relationship between two variables [31]. The Pearson correlation can help study the factors influencing the structure, function, and ecological processes of ecosystems [29].
2.3.2. MCMC Algorithm
The MCMC method was chosen for the MODIS-PSN model parameter optimization process because it is based on the assumed prior probability, the probability of observing different data under the given assumptions, and the observed data itself. Unlike other methods, the Bayesian estimation method does not consider the parameter to be estimated as a fixed unknown, but rather as a random variable that conforms to some prior probability distribution. Based on the Bayesian theory, the ideal Bayesian inference process is approximated by constructing a Markov chain with an equilibrium distribution and iterating continuously, leading to parameter optimization and convergence of samples obtained through the recommended distribution. In practical applications, parameter estimation methods provide more accurate and efficient tools, especially in small sample situations. The efficiency advantage of the Bayesian estimation method in estimating the shape parameters of this distribution makes it a more reliable choice and helps improve the science and accuracy of decision-making.
2.3.3. MODIS-PSN Model
In 2000, Running et al. proposed the MODIS algorithm, based on the light energy utilization model [32,33] with the following expression:
where PAR is the solar active radiation utilized by the vegetation; FPAR is the ratio of photosynthetically active radiation absorbed by the plant.
The MCD15A2H FPAR product was used, which has a spatial resolution of 500 and a temporal resolution of 8 days. direct is the maximum light energy utilization, which is the key parameter in the light energy utilization model; its unit is gC/MJ. Under practical conditions, light energy utilization is often maximum, which is affected by temperature stress f(Tmin) and moisture stress f(VPD) [34].
2.3.4. Geographical Detector Method
Geographical detectors are grounded in the measurement of “factor force” indicators, integrating spatial overlay techniques and set theory within Geographic Information Systems (GIS) [35]. Factor and interaction detection are widely employed to identify spatial differentiation patterns and the driving forces of variables, serving as effective approaches for spatial heterogeneity analysis [36]. This study employs geographical detectors to examine the factors influencing the spatial heterogeneity of GPP across the Qinghai-Tibet Plateau, while quantitatively assessing the effects of various drivers on GPP variation through factor and interaction detection analyses [37]. By employing the q statistic in geographical detectors, this approach enables robust assessment of spatial heterogeneity, precise identification of key influencing factors, and comprehensive analysis of variable interaction mechanisms [38].
The differentiation factor serves to quantify both the spatial heterogeneity of independent variables and their respective explanatory power in relation to the spatial variation of the dependent variable. These results are expressed through q-values, with the corresponding calculation formula presented in Equation (5):
In the equation, h = 1, 2, …, L denotes the stratification of variable Y or factor X, representing classification or partitioning; Nh and N correspond to the number of units in the h-th stratum and the total sample size, respectively. and represent the variances of Y-values in stratum h and the entire study area, respectively [39]. The q-value ranges between 0 and 1, with higher values indicating greater spatial heterogeneity significance.
Interaction detection examines the relationships between driving factors, X1: ET, X2: LAI, X3: Precipitation, X4: Radiation, X5: Temperature, and X6: VPD, assessing whether their combined effects on the dependent variable Y (GPP) demonstrate synergistic enhancement, antagonistic weakening, or mutual independence in explanatory power [35,37].
Interaction probes are used to explore the interactions between independent variables, i.e., to assess whether the explanatory power for the variable Y is enhanced or diminished when two factors act together, or whether the independent variables are independent of each other.
3. Results
3.1. MODIS-PSN Model Validation
In this study, four vegetation ecotypes were selected from the Qinghai-Tibet Plateau: evergreen coniferous forests, wetlands, alpine grasslands, and shrublands. Comparison with MODIS GPP data reveals that the scatter plots and fitted curves of the simulated versus observed GPP data demonstrate that the model effectively simulates the GPP trend. The results showed that the coefficients of determination between the simulated GPP and the GPP obtained from the flux site for the MODIS-PSN model evergreen coniferous forest, alpine grassland, wetland, and shrubland were 0.91, 0.80, 0.89, and 0.94, respectively; the model and station R2 data are similar to the results of a study by Ma et al. [40] and are higher than the coefficients of determination between MODIS GPP products and flux sites, which were 0.65, 0.69, 0.86, and 0.77, respectively. The Root Mean Square Error (RMSE) values of simulated GPP compared to flux sites were 16.01 gC/m2/8 day, 10.84 gC/m2/8 day, 6.77 gC/m2/8 day, and 6.99 gC/m2/8 day, respectively, while the Root Mean Square Error values for MODIS GPP versus flux sites were 21.06 gC/m2/8 day, 13.59 gC/m2/8 day, 7.55 gC/m2/8 day, and 13.92 gC/m2/8 day, respectively. The simulated data are all lower than the MODIS GPP product, indicating that the accuracy of the simulated GPP product has been greatly improved. The results of alpine grassland validation are shown in Figure 2 and Figure 3.
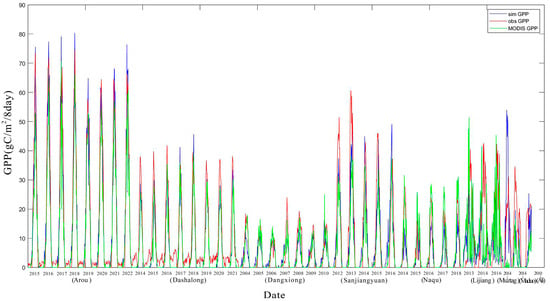
Figure 2.
Time-series trends of observed, model-estimated GPP, and MODIS GPP in alpine grasslands.
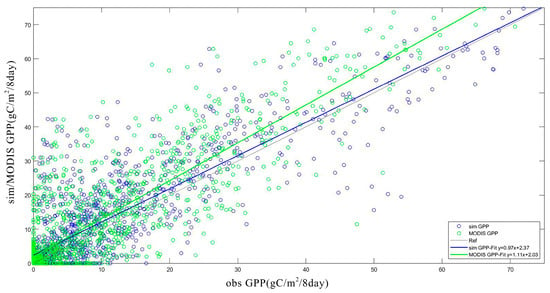
Figure 3.
Scatter-fit plot of observed GPP, model-estimated GPP, and MODIS GPP for alpine grasslands.
3.2. Characteristics of Spatial and Temporal Evolution of Vegetation GPP on the Qinghai-Tibet Plateau
3.2.1. Characterization of Temporal Variation in GPP of Vegetation on the Qinghai-Tibet Plateau
As illustrated in Figure 4, the interannual trend of Gross Primary Productivity (GPP) on the Qinghai-Tibet Plateau from 2001 to 2022, estimated based on MODIS-PSN simulations, exhibits an overall fluctuating upward trajectory. The mean interannual GPP value is 476.69 gC/m2/year, with an annual growth rate of 2.9894 gC/m2/year. Notably, the highest interannual GPP values occurred in 2006, 2010–2013, 2015–2016, and 2018–2022, all exceeding the interannual average. The peak value of 505.082 gC/m2/year was recorded in 2020, while the lowest interannual value of 428.055 gC/m2/year was observed in 2003. Periods of consistent increase in GPP were identified in 2001–2002, 2003–2006, 2008–2011, 2014–2015, and 2017–2020. The results indicate that the vegetation GPP on the Qinghai-Tibet Plateau exhibited a significant fluctuating growth trend (p < 0.05), suggesting that policies such as the conversion of pasture to grassland, along with other ecological protection measures, have positively contributed to vegetation restoration and environmental improvement in the region [39,41].
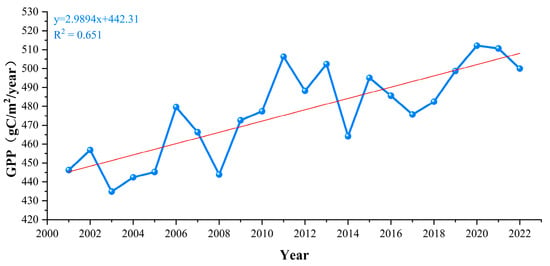
Figure 4.
Annual average GPP variation trends of simulated GPP on the Qinghai-Tibet Plateau from 2001 to 2022.
3.2.2. Model Parameter Optimization Process
As shown in Figure 5a, based on the MOD17A2H product, the interannual spatial distribution of GPP on the Qinghai-Tibet Plateau from 2001 to 2022 reveals a decreasing trend from the southeast to the northwest. The eastern and southeastern regions of the Qinghai-Tibet Plateau exhibit higher GPP values, although areas with high values are relatively sparse. The transition zone is located in the central part of the plateau, where vegetation primarily consists of grasslands and shrubs. This region experiences a relatively arid climate, with precipitation and temperature conditions gradually worsening, leading to significantly lower GPP values compared to the southeast. In contrast, the northwestern part of the plateau displays the lowest GPP values, characterized by scarce precipitation, high elevation, and an arid climate that limits plant growth. In comparison, the southeastern part of the Qinghai-Tibet Plateau, with abundant precipitation, lower topography, and a humid climate conducive to plant growth, shows significantly higher GPP values than the high-altitude and arid northwestern region.

Figure 5.
Spatial distribution of interannual average GPP on the Qinghai-Tibet Plateau from 2001 to 2022: (a) Spatial distribution of MODIS data; (b) MODIS-PSN model simulates GPP spatial distribution.
Figure 5b illustrates the spatial distribution of the multi-year average GPP values on the Qinghai-Tibet Plateau from 2001 to 2022, as simulated by the MODIS-PSN model. The model estimates show a gradual decrease in GPP from southeast to northwest. Areas with GPP greater than 600 gC/m2/year account for 32.2% of the total study area (excluding regions shown in white in the figure as non-study areas). The northwestern portion of the plateau, including parts of Xinjiang and northern Tibet at higher elevations, exhibits relatively low GPP values, indicating lower ecological productivity in these regions. These areas are primarily characterized by cold, arid climatic conditions that limit vegetation growth, resulting in lower GPP. The high-altitude regions, such as the central and eastern mountainous areas of the Qinghai-Tibet Plateau, also show relatively low GPP, likely due to the combined effects of high elevation, low temperatures, and limited precipitation. In contrast, the southeastern portion of the plateau, including regions like Sichuan and Yunnan, demonstrates significantly higher GPP values. These areas, being lower in elevation, experience relatively warmer and more humid climatic conditions that support diverse vegetation and vigorous photosynthetic activity, leading to higher GPP values. The GPP in these lowland areas is significantly higher than in the high-altitude regions, showing a clear spatial gradient. The southeastern part of the plateau consistently exhibits high GPP values, indicating a strong GPP of the ecosystem in these regions. The central regions show a gradual decline in GPP, with vegetation primarily composed of grasslands and shrubs, closely linked to increasing elevation and decreasing precipitation. The northwestern regions of the Qinghai-Tibet Plateau, with sparse vegetation and dominated by bare land and deserts, exhibit the lowest GPP values. The spatial variation in GPP is largely attributed to differences in the plateau’s topography, precipitation, temperature, solar radiation, saturated water vapor pressure, evapotranspiration, and leaf area index, which result in an imbalanced distribution of GPP across the region.
Figure 6 displays the difference between the model-simulated interannual mean GPP and the annual mean GPP from the MODIS product, calculated using ArcGIS 10.8.2. This comparison highlights the regional characteristics of the differences and potential ecological and environmental impact mechanisms. In general, the southeastern region is characterized by positive differences, indicating that the model-estimated GPP exceeds the MODIS GPP. In contrast, the central and northwestern regions are dominated by negative differences, suggesting that the model underestimates GPP compared to MODIS. Overall, the difference maps reveal a spatial trend, with positive values in the southeastern region transitioning to negative values in the central and western regions.
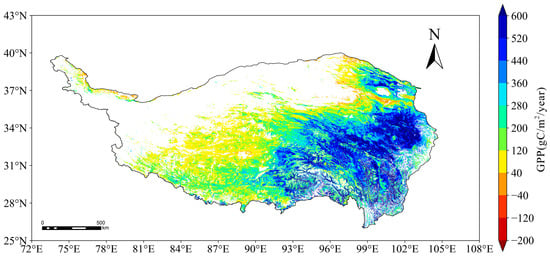
Figure 6.
Interannual mean difference between GPP and MODIS GPP simulated by the Qinghai-Tibet Plateau model from 2001 to 2022.
As shown in Figure 7, the distribution of the annual average rate of change in GPP on the Qinghai-Tibet Plateau from 2001 to 2022 illustrates the dynamic changes in ecosystem productivity. Overall, GPP change exhibits significant spatial heterogeneity: the rate of change in the humid regions of the northeast and southeast is significantly positive, with 96% of the area showing a positive correlation. These regions, primarily wetlands and forest ecosystems, may have been influenced by climate warming and ecological restoration policies. The maximum annual average rate of change reached 12.40 gC/m2/year. In contrast, the central and southern regions exhibit a decreasing trend, with the lowest rate of change at −1.61 gC/m2/year and the negative correlation area accounting for 4%, mainly concentrated in alpine grasslands and desert regions. This decrease could be linked to climate aridification and land degradation. The area showing significant change (p < 0.05) accounts for 68.7%, indicating a substantial increase in GPP across the Qinghai-Tibet Plateau. The overall pattern of change reflects the complex response of the Qinghai-Tibet Plateau’s ecosystems to both climate change and human activities, providing important insights for regional ecological conservation and management.

Figure 7.
Rates of change and significance of interannual mean GPP on the Qinghai-Tibet Plateau, 2001–2022: (a) Spatial distribution of rates of change; (b) spatial distribution of significance.
3.3. Characterization of Spatial and Temporal Changes in Drivers
3.3.1. Characterization of Interannual Variation in Drivers
The drivers selected for this study were precipitation, air temperature, radiation, vapor pressure deficit (VPD), leaf area index (LAI), evapotranspiration (ET).
Figure 8a demonstrates a statistically significant increasing trend in annual precipitation, with a rate of 1.75 mm/year. The peak precipitation (892.76 mm) was recorded in 2020, while the minimum (741.49 mm) occurred in 2015, yielding a multi-year average of 832.23 mm.
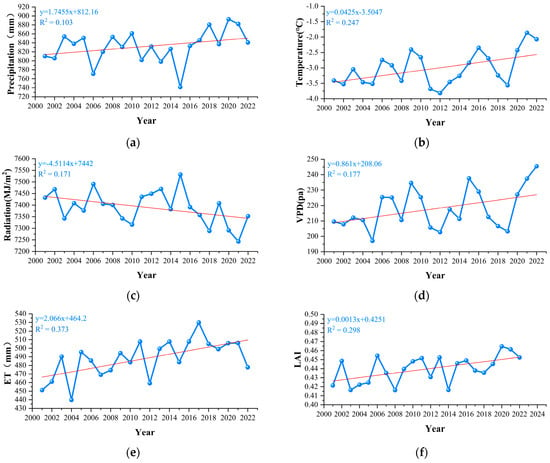
Figure 8.
Characterization of interannual temporal variation of drivers on the Qinghai-Tibet Plateau from 2001 to 2022: (a) precipitation; (b) temperature; (c) radiation; (d) vapor pressure deficit; (e) evapotranspiration; (f) leaf area index.
Figure 8b reveals a fluctuating but significantly volatile upward trend in annual mean temperature. The highest recorded value (−1.86 °C) occurred in 2021, while the lowest (−3.82 °C) was observed in 2012, with an overall warming trend of 0.04 °C/year and a long-term average of −3.02 °C.
Figure 8c indicates a declining trend in annual radiation levels at a rate of −4.51 MJ/m2/year, albeit with considerable interannual variability. The peak radiation level (7531.72 MJ/m2) was recorded in 2015, contrasting with the minimum value (7243.17 MJ/m2) observed in 2021, resulting in a mean annual radiation of 7390.16 MJ/m2.
Figure 8d displays a modest increasing trend in annual radiation levels, though with substantial interannual variability. The maximum saturated vapor pressure difference (245.50 Pa) was observed in 2022, whereas the minimum (197.12 Pa) occurred in 2005, exhibiting an overall increasing rate of 0.861 Pa/year and a long-term mean of 217.96 Pa.
Figure 8e illustrates that annual evapotranspiration ranges from 529.79 to 741.49 mm, exhibiting a fluctuating yet increasing trend with notable interannual variations. The time series reaches its minimum value (529.79 mm) in 2017 and peaks at 741.49 mm in 2015, demonstrating an overall increasing rate of 2.1 mm/year and a multi-year average of 487.96 mm.
Figure 8f reveals that the annual leaf area index (LAI) ranges from 0.42 to 0.46, exhibiting a fluctuating but significantly increasing trend (p < 0.05). The maximum LAI value (0.46) was recorded in 2020, while the minimum (0.42) occurred in 2008, showing an overall growth rate of 0.0013 year−1 and a long-term mean of 0.44.
3.3.2. Interannual Spatial Distribution of Drivers
Figure 9 shows the following:
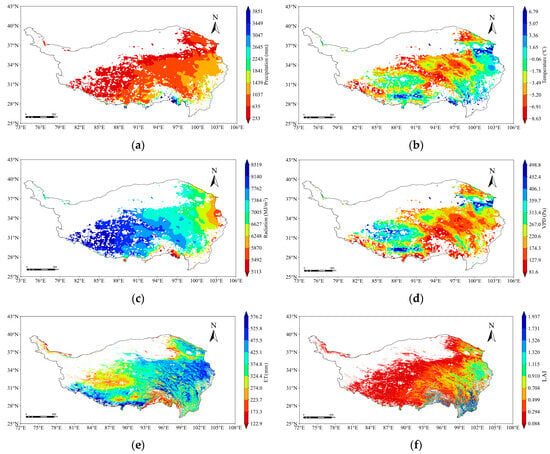
Figure 9.
Characteristics of interannual spatial variation of drivers on the Qinghai-Tibet Plateau from 2001 to 2022: (a) precipitation; (b) temperature; (c) radiation; (d) vapor pressure deficit; (e) evapotranspiration; (f) leaf area index.
sim_GPP represents the GPP data simulated by the MODIS-PSN model; obs_GPP refers to the observed GPP data from alpine grasslands; and MODIS GPP corresponds to MOD17A2H data, with GPP values provided every 8 days. All three datasets exhibit consistent seasonal patterns, with cyclical peaks and troughs occurring annually. The simulated, observed, and MODIS GPP data all demonstrate seasonal variation characteristics.
3.3.3. Spatial Distribution of Rate of Change and Significance of Temperature on the Qinghai-Tibet Plateau
More than 60% of the area shows a positive correlation between precipitation, air temperature, VPD, LAI, ET, and vegetation GPP. The effects of air temperature, ET, and LAI on GPP were significant in certain regions. Excessive radiation or unfavorable climatic conditions may inhibit plant photosynthesis. The saturated water vapor pressure difference is a key factor affecting vegetation growth, and an excessively high vapor pressure difference can lead to rapid water evaporation from plants, thereby inhibiting growth. An increase in vegetation GPP does not always correspond with an increase in evapotranspiration and may even show an inverse relationship. Increases in the leaf area index are typically associated with higher vegetation GPP, highlighting the crucial role of leaf area in regulating regional carbon uptake and photosynthesis, as shown in Figure 10 and Table 2.
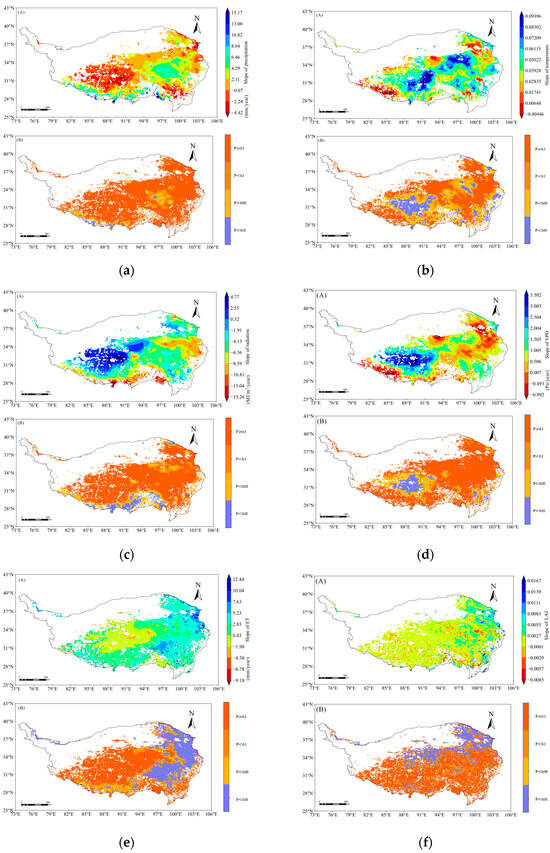
Figure 10.
Characteristics of interannual spatial variation of drivers on the Qinghai-Tibet Plateau from 2001 to 2022: (A) rate of spatial variation; (B) significance analysis. (a) precipitation; (b) temperature; (c) radiation; (d) vapor pressure deficit; (e) evapotranspiration; (f) leaf area index.

Table 2.
Summary of driver change rates and significance analysis.
3.4. Analysis of the Impact of Spatial Differentiation on Vegetation GPP
3.4.1. Impact of Individual Factors on Vegetation GPP
The spatial correlation patterns between GPP and various driving factors solely characterize their association strength, without establishing quantitative causal relationships regarding GPP’s influence on these factors. Geographical detectors enable the examination of both individual factor contributions and multifactor interaction effects on dependent variables, while quantitatively assessing these influences to enhance explanatory power [37]. Compared with conventional statistical approaches, geographical detectors demonstrate superior capability in objectively analyzing spatial data, quantitatively assessing influencing factors, and revealing their coupling relationships with geographical phenomena. The application of geographical detector models to vegetation GPP studies enables quantitative evaluation of both individual factor contributions and their synergistic effects [42,43], as illustrated in Figure 11.
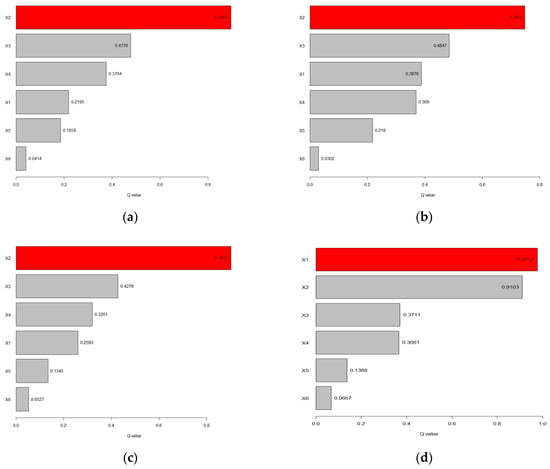
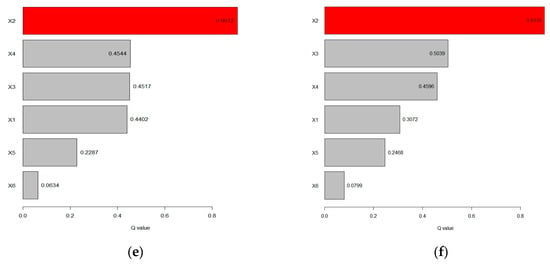
Figure 11.
Detection of GPP impact factor q-value: (a) 2001; (b) 2006; (c) 2011; (d) 2016; (e) 2022; (f) 2001~2022.
The spatial correlation patterns between various influencing factors and GPP merely reflect regional correlation strength, without enabling quantitative determination of their actual impacts on GPP. The geographical detector model’s differentiation and factor detection results (Table 3) reveal that all influencing factors exhibit statistically significant impacts (p < 0.001) on the spatial distribution of GPP across the Qinghai-Tibet Plateau, confirming the robust explanatory power of the selected factors [44].

Table 3.
Divergence and q-valves of factor detection result.
This study employs the geographical detector method to analyze six natural factors, temperature, precipitation, radiation, vapor pressure deficit (VPD), evapotranspiration (ET) and leaf area index (LAI), influencing vegetation GPP spatial patterns simulated by the modified MODIS-PSN model across the Qinghai-Tibet Plateau (2001~2022). The q-statistic quantifies factor influence, where higher values indicate greater explanatory power for vegetation GPP variation [37,45]. For the five representative years analyzed (2001, 2006, 2011, 2016, 2022, and 2001~2022), the dominant factors ranked by q-values were as follows: LAI (0.8954), LAI (0.7473), LAI (0.9011), ET (0.9757), ET (0.4401), and LAI (0.8976).
LAI consistently served as the primary determinant of vegetation GPP spatial differentiation on the Qinghai-Tibet Plateau, demonstrating the strongest explanatory power in 2001 (q = 0.8954), 2006 (q = 0.7473), and 2022 (q = 0.9072). Notably, ET emerged as the dominant factor in 2016, exhibiting exceptional explanatory power (q = 0.9757) for GPP spatial patterns. From 2001 to 2022, the interannual variation of LAI emerged as the dominant factor among natural factors. Comprehensive analysis revealed that LAI exhibits the strongest explanatory power for vegetation GPP spatial differentiation on the Qinghai-Tibet Plateau, with corresponding influence q-values of 0.8976, 0.8609, 0.9210, and 0.8888. The spatial differentiation of annual vegetation GPP on the Qinghai-Tibet Plateau is not governed by any single dominant factor. This primarily results from regional variations among the various factors influencing GPP’s spatiotemporal differentiation characteristics, as well as their dynamic evolution across temporal scales. While temperature and vapor pressure deficit exhibit weaker explanatory power compared to other variables, their influence demonstrates a gradual year-by-year increase. Although their impact on GPP spatial distribution remains generally weaker than that of leaf LAI, these climatic factors show a slowly growing contribution to GPP dynamics.
3.4.2. Impact of Multifactor Interactions on Vegetation GPP
The interactions between the different drivers were probed using an interaction detector, and the results are shown in the Figure 12, where the explanatory power of any two factors interacting with each other is greater than the single-factor results. The results showed that the interactions among the environmental factors significantly enhanced the influence of a single factor on GPP, and the two relationships showed two-factor enhancement and nonlinear enhancement, indicating that the growth and change in vegetation was the result of the joint action of the factors.
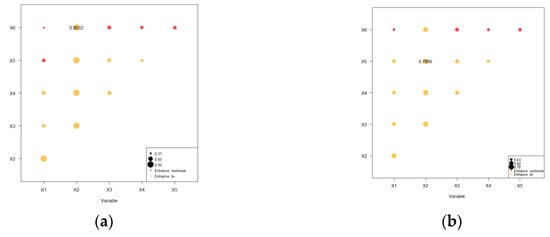
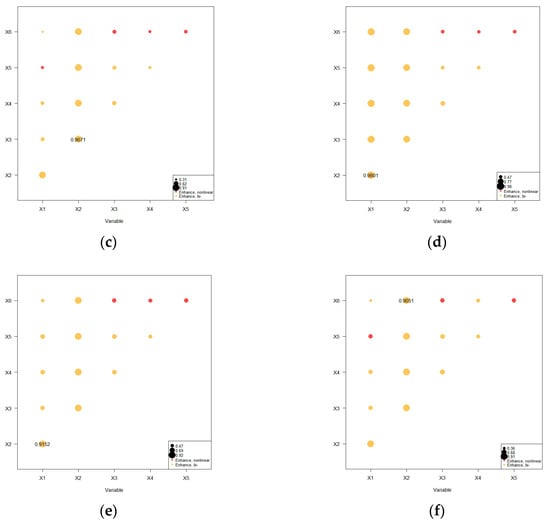
Figure 12.
Interacting factor effects results: (a) 2001; (b) 2006; (c) 2011; (d) 2016; (e) 2022; (f) 2001~2022.
Through multifactor interaction detection using the geographical detector, we found that any two factors demonstrated nonlinear enhancement effects. The q-values for two-factor interactions in the study area were significantly higher than those for single factors. The interaction between any two GPP driving factors exhibited a nonlinear enhancement pattern, suggesting that such two-factor interactions can substantially improve the explanatory power of GPP influencing factors, as presented in Table 4.

Table 4.
Interacting values of vegetation GPP in five representative years.
This study ranked the dominant interaction factors for five representative years based on the magnitude of their explanatory power (q-values), revealing that the most influential interaction factor consistently involved the combination of the dominant GPP single factor with another relevant influencing factor in each corresponding year.
Using a geographical detector to analyze the effects of both individual and multifactor interactions on vegetation GPP variations, this study determined that the leaf area index, evapotranspiration, and precipitation factors exhibit dominant influence under single-factor conditions. Notably, the interaction between any two high-impact factors demonstrates a linear enhancement effect on vegetation GPP, revealing a synergistic relationship among multiple influencing factors.
4. Discussion
4.1. Trends in the Spatial and Temporal Evolution of Vegetation GPP
Precipitation changes across the Qinghai-Tibet Plateau display significant regional variation, with some areas exhibiting minimal or decreasing trends and most regions demonstrating an increasing precipitation trend. Precipitation changes in the northern and northwestern regions remain relatively minor, with slight decreases observed, potentially associated with regional climate characteristics, moisture sources, and other natural factors including prevailing wind patterns and topographic features, which are consistent with previous findings [46]. Overall, the annual mean temperature across most regions exhibits an increasing trend, potentially reflecting the long-term warming tendency of regional climate. Similarly, radiation levels in most regions have exhibited an increasing trend, suggesting that both local and large-scale factors have contributed to enhanced regional radiation during this period. This phenomenon likely reflects climate change impacts, including regional temperature rise and enhanced evaporation rates [47].
Negative correlation areas account for 15.7% of the total, with limited regions demonstrating an inverse relationship between VPD changes and associated factors. This phenomenon may be attributed to increases in localized humidity or other regulatory mechanisms, leading to a decline in VPD in these specific areas. This trend likely indicates an intensification of water evaporation processes associated with temperature increases across the Qinghai-Tibet Plateau. Furthermore, concurrent with climate warming and enhanced monsoon influence, the spatial heterogeneity of ET has become increasingly pronounced across the region. Vegetation phenology on the Qinghai-Tibet Plateau is influenced not only by climate change but also regulated by elevation and geographic position. In high-elevation zones, vegetation growth is restricted by low temperatures and relatively limited precipitation, typically resulting in lower LAI values.
The spatial distribution of interannual average GPP values for vegetation on the Qinghai-Tibet Plateau, simulated using the improved MODIS-PSN model from 2001 to 2022, shows a decreasing trend from southeast to northwest. The annual average spatial distribution and rate of change reflect the dynamic characteristics of ecosystem productivity, consistent with previous findings [48]. Overall, the changes in GPP exhibit significant spatial heterogeneity: The rate of change in the humid regions of the northeast and southeast is significantly positive, mainly distributed in wetland and forest ecosystems, with the maximum annual average rate of change reaching 12.40 gC/m2/year. In contrast, the central and southern regions show a decreasing trend, with the lowest rate of change at −1.61 gC/m2/year, predominantly concentrated in alpine grasslands and desert regions.
4.2. Impact Analysis of Drivers
LAI was the dominant factor and exhibited the strongest explanatory power for the spatial differentiation of vegetation GPP on the Qinghai-Tibet Plateau in 2001, 2006, 2011, 2022, and overall period from 2001 to 2022. In contrast, ET was the dominant factor in 2016. LAI provided the strongest explanation for the spatial variability of vegetation GPP on the Qinghai-Tibet Plateau. The spatial variability of annual vegetation GPP on the Qinghai-Tibet Plateau was not governed by a single, absolute factor, primarily because the factors influencing the spatial and temporal characteristics of vegetation GPP varied regionally and evolved over time. The explanatory power of temperature and the saturated water vapor pressure difference was weaker than that of LAI, exhibiting a slow, gradual increase over the years. Although these factors had an increasing influence on GPP, their explanatory power for the spatial distribution of GPP was generally weaker than that of LAI. In the GPP model, LAI was the most critical driver input [49,50].
The dominant interaction factors were ranked, with the most dominant being the combination of the dominant single factor and another key factor influencing GPP in each corresponding year. The distribution of the strongest dominant interaction factors on the Qinghai-Tibet Plateau for the years 2001, 2006, 2011, 2016, 2022, and the entire period from 2001 to 2022 were as follows: LAI ∩ VPD, LAI ∩ Temperature, LAI ∩ Precipitation, ET ∩ LAI, ET ∩ LAI, and LAI ∩ VPD. The explanatory power of these dominant interaction factors in each of those years was 0.9032, 0.7806, 0.90.71, 0.9801, 0.9152, and 0.9051, respectively, with the explanatory power exceeding 0.50, indicating a significant synergistic effect between them. The dominant interaction factors for the six representative years exhibited some variation. For the years 2001, 2006, 2011, and the full period 2001–2022, the combinations of LAI and other factors were dominant, indicating that LAI played a key role in interactions with other factors such as VPD, air temperature, and precipitation. Following 2011, the two-way synergy between ET and LAI primarily affected the spatial variations of GPP [51].
5. Conclusions
This paper uses the MODIS-PSN model to simulate the GPP of vegetation on the Qinghai-Tibet Plateau for the period from 2001 to 2022. The simulation is based on the MODIS dataset and the ERA5-Land dataset, among others, to produce remotely sensed GPP products for the Qinghai-Tibet Plateau. The Geodetector method was employed to analyze the impact of natural factors, selecting six key factors—temperature, precipitation, radiation, saturated water vapor pressure difference, evapotranspiration, and leaf area index. These factors were used to quantitatively attribute the spatial drivers of vegetation GPP on the Qinghai-Tibet Plateau from 2001 to 2022.
On the climate change-sensitive Qinghai-Tibet Plateau, studying GPP can help assess the responsiveness of vegetation ecosystems to climate change. The development of agriculture and animal husbandry on the plateau is closely linked to the health of vegetation ecosystems. It is of great significance to study the changes in vegetation GPP and its relationship with driving factors on the Qinghai-Tibet Plateau, to quantitatively investigate the relationship between vegetation GPP changes and climatic factors in the Qinghai-Tibet Plateau, and to safeguard the ecological security of the Qinghai-Tibet Plateau while improving the ecological environment.
This study only considered factors such as evapotranspiration, leaf area index, precipitation, radiation, air temperature, and saturated water vapor pressure difference as drivers of vegetation GPP. However, elevation, vegetation cover, and anthropogenic factors also have significant influences on vegetation GPP. Future studies will integrate both natural and anthropogenic factors to more comprehensively explore the relationship between vegetation GPP and its drivers on the Qinghai-Tibet Plateau.
Author Contributions
L.Z. conceived and designed the experiments; L.Z. analyzed the data, created the tables and figures, and finished the first version of the paper; C.X., M.S. and L.Z. contributed valuable opinions during manuscript writing; C.X. and M.S. revised the whole manuscript. All authors have read and agreed to the published version of the manuscript.
Funding
This research was supported by the National Natural Science Foundation of China (42161027).
Institutional Review Board Statement
Not applicable.
Informed Consent Statement
Not applicable.
Data Availability Statement
No new data were created or analyzed in this study.
Conflicts of Interest
The authors declare no conflicts of interest.
References
- Guo, J.X.; Zhai, L.; Sang, H.Y.; Cheng, S.Y.; Li, H.W. Effects of hydrothermal factors and human activities on the vegetation coverage of the Qinghai-Tibet Plateau. Sci. Rep. 2023, 13, 12488. [Google Scholar] [CrossRef]
- Sun, H.L.; Zheng, D.; Yao, T.D.; Zhang, Y.L. Protection and construction of national ecological security barriers on the Qinghai-Tibet Plateau. J. Geogr. 2012, 67, 3–12. [Google Scholar]
- Li, R.; Wu, Q.B.; Li, X.; Sheng, Y.; Hu, G.J.; Cheng, G.D.; Zhao, L.; Jin, H.J.; Zou, D.F.; Wu, X.D. Characteristics, changes and impacts of perennial permafrost on the Qinghai-Tibet Plateau. Sci. Bull. 2019, 64, 2783–2795. [Google Scholar]
- Wang, X.; Pang, G.; Yang, M. Precipitation over the Qinghai-Tibet Plateau during recent decades: A review based on observations and simulations. Int. J. Climatol. 2018, 38, 1116–1131. [Google Scholar] [CrossRef]
- Qimei, L.; Zheng, C.; Yuan, L.H.; Wu, P.T.; Tan, K.; Shen, Q.T.; Shi, H.J. Spatial-temporal dynamics of vegetation light use efficiency and its driving factors on the Qinghai-Xizang Plateau. Arid. Zone Res. 2024, 41, 1731–1739. [Google Scholar]
- Chen, H.; Zhu, Q.; Peng, C.; Wu, N.; Wang, Y.F.; Fang, X.Q.; Gao, Y.H.; Zhu, D.; Yang, G.; Tian, J.Q. The impacts of climate change and human activities on biogeochemical cycles on the Qinghai-Qinghai-Tibet Plateau. Glob. Change Biol. 2013, 19, 2940–2955. [Google Scholar] [CrossRef]
- Seddon, A.W.R.; Macias-Fauria, M.; Long, P.R.; Benz, D.; Willis, K.L. Sensitivity of global terrestrial ecosystems to climate variability. Nature 2016, 531, 229–232. [Google Scholar] [CrossRef]
- Kuang, X.X.; Jiao, J.J. Review on climate change on the Qinghai-Tibet Plateau during the last half century. J. Geophys. Res. Atmos. 2016, 121, 3979–4007. [Google Scholar] [CrossRef]
- Li, S.C.; Zhang, Y.L.; Wang, Z.F.; Li, L.H. Mapping human influence intensity in the Qinghai-Tibet Plateau for conservation of ecological service functions. Ecosyst. Serv. 2017, 30, 276–286. [Google Scholar] [CrossRef]
- Zhang, X.Z.; Yang, Y.P.; Piao, S.L. Ecological change on the Qinghai-Tibet Plateau. Chin. J. 2015, 60, 3048. [Google Scholar]
- Yang, Y.; Dou, Y.X.; An, S.S.; Zhu, Z.L. Abiotic and biotic factors modulate plant biomass and root/shoot(R/S) ratios in grassland on the Loess Plateau, China. Sci. Total Environ. 2018, 636, 621–631. [Google Scholar] [CrossRef]
- Ding, L.; Li, Z.W.; Shen, B.B.; Wang, X.; Xu, D.W.; Yan, R.R.; Yan, Y.C.; Xin, X.P.; Xiao, J.F.; Li, M. Spatial patterns and driving factors of aboveground and belowground biomass over the eastern Eurasian steppe. Sci. Total Environ. 2022, 803, 149700. [Google Scholar] [CrossRef]
- Ge, J.; Hou, M.J.; Liang, T.G.; Feng, Q.S.; Meng, X.Y.; Liu, J.; Bao, X.Y.; Gao, H.Y. Spatiotemporal dynamics of grassland aboveground biomass and its driving factors in North China over the past 20 years. Sci. Total Environ. 2022, 826, 154226. [Google Scholar] [CrossRef] [PubMed]
- You, Y.F.; Wang, S.Y.; Ma, Y.X.; Wang, X.Y.; Liu, W.H. Improved modeling of gross primary productivity of Alpine Grasslands on the Qinghai-Tibet Plateau using the biome-BGC model. Remote Sens. 2019, 11, 1287. [Google Scholar] [CrossRef]
- Li, H.Y.; Wu, X.D.; Ma, D.J.; Wei, C.; Peng, B.Y.; Du, W.Z. Spatiotemporal variation characteristics and influencing factors analysis of the GPP in the Qinghai-Tibet Plateau. Remote Sens. Technol. Appl. 2024, 39, 727–740. [Google Scholar]
- Zheng, Z.T.; Zhang, Y.J.; Zhu, J.T.; Cong, N. Daytime temperature contributes more than night time temperature to the weakened relationshipbetween climate warming and vegetation growth in the extratropical Northern Hemisphere. Ecol. Indic. 2021, 131, 108203. [Google Scholar] [CrossRef]
- Jin, K.; Wang, F.; Han, J.Q.; Shi, S.Y.; Ding, W.B. Impacts of climate change and human activities on vegetation NDVI changes in China from 1982 to 2015. J. Geogr. 2020, 75, 961–974. [Google Scholar]
- Yang, Y.T.; Roderick, M.L.; Guo, H.; Miralles, D.G.; Zhang, L.; Fatichi, S.; Luo, X.Z.; Zhang, Y.Q.; Tim, R.; McVicar, T.R.; et al. Evapotranspiration on a greening Earth. Nat. Rev. Earth Environ. 2023, 4, 626–641. [Google Scholar] [CrossRef]
- Liu, Y.; Li, Y.; Li, S.; Motesharrei, S. Spatial and temporal patterns of global NDVI trends: Correlations with climate and human factors. Remote Sens. 2015, 7, 13233–13250. [Google Scholar] [CrossRef]
- Liu, S.H.; Yan, D.H.; Shi, X.L.; Yuan, Z. Interannual variation and correlation between vegetation NDVI and climate factors in China. Arid. Zone Geogr. 2014, 37, 480–489. [Google Scholar]
- Piao, S.L.; Yin, G.D.; Tan, J.G.; Cheng, L.; Huang, M.T.; Li, Y.; Liu, R.; Mao, J.F.; Myneni, R.B.; Peng, S.S. Detection and attribution of vegetation greening trend on the Qinghai-Tibet Plateau over the last 30 years. Glob. Change Biol. 2015, 21, 1601–1609. [Google Scholar] [CrossRef]
- Ren, Y.H.; Wang, H.; Yang, K.; Li, W.; Hu, Z.M.; Ma, Y.M.; Qiao, S.C. Vegetation productivity slowdown on the Qinghai-Tibet Plateau around the late 1990s. Geophys. Res. Lett. 2024, 51, e2023GL103865. [Google Scholar] [CrossRef]
- Guo, J.K.; Wu, X.Q.; Dong, G.H.; Li, Y.S.; Wu, R. Analysis of the relative roles of drivers of vegetation cover change in the Tarim River Basin based on MODIS/NDVI. Arid. Zone Res. 2017, 34, 621–629. [Google Scholar]
- Zhang, Y.L.; Li, B.Y.; Liu, L.S.; Zheng, D. Revisiting the extent of the Qinghai-Tibet Plateau. Geogr. Res. 2021, 40, 1543–1553. [Google Scholar]
- Miao, L.; Lu, Q.; Liu, G.L.; Wei, X.J. Temporal and spatial variation characteristics of NDVI in different vegetation types on the Qinghai-Tibet Plateau from 1999 to 2019 and its response to climatic factors. Soil Water Conserv. Res. 2023, 30, 97–105. [Google Scholar]
- Zhang, Y.; Li, B.; Zheng, D. A discussion on the boundary and area of the Qinghai-Tibet Plateau in China. Geogr. Res. 2002, 21, 1–8. [Google Scholar]
- Ding, M.J.; Li, L.H.; Nie, Y.; Chen, Q.; Zhang, Y.L. Spatio-temporal variation of spring phenology in Qinghai-Tibet Plateauand its linkage to climate change from 1982 to 2012. J. Mt. Sci. 2016, 13, 83–94. [Google Scholar] [CrossRef]
- Ly, A.; Marsman, M.; Wagenmakers, E.J. Analytic posteriors for Pearson’s correlation coefficient. Stat. Neerl. 2018, 72, 4–13. [Google Scholar] [CrossRef] [PubMed]
- Afyouni, S.; Smith, S.M.; Nichols, T.E. Effective degrees of freedom of the Pearson’s correlation coefficient under autocorrelation. NeuroImage 2019, 199, 609–625. [Google Scholar] [CrossRef] [PubMed]
- Shen, X.J.; Zhou, D.W.; Li, F.; Zhang, H.Y. Vegetation Change and Its Response to Climate Change in Grassland Region of China. Geogr. Sci. 2015, 35, 622–629. [Google Scholar]
- Menzel, A.; Fabian, P. Growing season extended in Europe. Nature 1999, 397, 659. [Google Scholar] [CrossRef]
- Monteith, J.L. Solar Radiation and Productivity in Tropical Ecosystems. J. Appl. Ecol. 1972, 9, 747–766. [Google Scholar] [CrossRef]
- Running, S.W.; Thornton, P.E.; Nemani, R.; Glassy, J.M. Global Terrestrial Gross and Net Primary Productivity from the Earth Observing System. In Methods in Ecosystem Science; Springer: New York, NY, USA, 2000; pp. 44–57. [Google Scholar]
- Huang, X.; Ma, M.; Wang, X.; Tang, X.; Yang, H. The uncertainty analysis of the MODIS GPP product in global maize croplands. Front. Earth Sci. 2018, 12, 739–749. [Google Scholar] [CrossRef]
- Wang, J.F.; Xu, C.D. Geodetector: Principle and prospective. Acta Geo-Graph. Sin. 2017, 72, 116–134. [Google Scholar]
- Song, Y.Z.; Wang, J.F.; Ge, Y.; Xu, C.D. An optimal parameters-based geographical detector model enhances geographic characteristics of explanatory variables for spatial heterogeneity analysis: Cases with different types of spatial data. GISci. Remote Sens. 2020, 57, 593–610. [Google Scholar] [CrossRef]
- Wang, F.; Chen, D.; Li, H. Research on spatial and temporal evolution of net primary productivity and driving factors of urban vegetation in mountainous areas based on geodetector--Taking Chongqing as an example. J. Guizhou Univ. (Nat. Sci. Ed.) 2024, 41, 19–27. [Google Scholar]
- Xin, P.Y.; Tian, T.; Zhang, M.L.; Han, W.Z.; Song, Y.T. Assessment of habitat quality changes and drivers in Jilin Province based on the InVEST model and geoprobes. J. Appl. Ecol. 2024, 35, 2853–2860. [Google Scholar]
- Beer, C.; Reichstein, M.; Tomelleri, E.; Ciais, P.; Jung, M.; Carvalhais, N.; Rödenbeck, C.; Arain, M.A.; Baldocchi, D.; Bonan, G.B. Terrestrial gross carbon dioxide uptake: Global distribution and covariation with climate. Science 2010, 329, 834–838. [Google Scholar] [CrossRef] [PubMed]
- Ma, M.N.; Yuan, W.P. Model Differences in Gross Primary Production on the Qinghai-Tibet Plateau. Remote Sens. Technol. Appl. 2017, 32, 406–418. [Google Scholar]
- Dong, M.Y.; Jiang, Y.; Zheng, C.T.; Zhang, D.Y. Trends in the thermal growing season throughout the Qinghai-Tibet Plateau during 1960–2009. Agric. For. Meteorol. 2012, 166–167, 201–206. [Google Scholar] [CrossRef]
- Zuo, L.; Gao, J. Quantitative attribution of NPP to karst vegetation based on geoprobes. J. Ecol. Environ. 2020, 29, 686–694. [Google Scholar]
- He, H.C.; Ma, B.X.; Jing, J.L.; Xu, Y.; Dou, S.Q.; Liu, B. Spatiotemporal Changes of NPP and Natural Factors in the Southwestern Karst Areas from 2000 to 2019. Soil Water Conserv. Res. 2022, 29, 172–178. [Google Scholar]
- Chen, D.L.; Sun, D.L.; Wen, H.J.; Gu, Q.Y. LightGBM-SHAP landslide susceptibility study based on different factor screening methods. J. Beijing Norm. Univ. (Nat. Sci. Ed.) 2024, 60, 148–158. [Google Scholar]
- Sun, Z.; Xie, S. Spatial and temporal evolution of net primary productivity and factor detection in Yunnan Province based on geoprobes. J. Ecol. 2021, 40, 3836–3848. [Google Scholar]
- Xie, J.L.; Yin, G.F.; Ma, D.J.; Chen, R.; Zhao, W.; Xie, Q.Y.; Wang, C.; Lin, S.R.; Yuan, W.Q. Climatic limitations on grassland photosynthesis over the Qinghai-Tibet Plateau shifted from temperature to water. Sci. Total Environ. 2024, 906, 167663. [Google Scholar] [CrossRef]
- Wang, Y.J.; Fu, B.J.; Liu, Y.X.; Li, Y.; Feng, X.M.; Wang, S. Response of vegetation to drought in the Qinghai-Tibet Plateau: Elevation differentiation and the dominant factors. Agric. For. Meteorol. 2021, 306, 108468. [Google Scholar] [CrossRef]
- Li, J.X.; Zhao, W.W. Variations of vegetation gross primary productivity and its driving factors in Qinghai-Tibet Plateaul. Acta Ecol. Sin. 2025, 45, 1–14. [Google Scholar]
- Wang, S.J.; Zhang, X.H.; Hou, L.L.; Sun, J.J.; Xu, M. Estimating Global Gross Primary Production Using an Improved MODIS Leaf Area Index Dataset. Remote Sens. 2024, 16, 3731. [Google Scholar] [CrossRef]
- Chen, X.; Cai, A.; Guo, R.J.; Liang, C.Z.; Li, Y.Y. Variation of gross primary productivity dominated by leaf area index in significantly greening area. J. Geogr. Sci. 2023, 33, 1747–1764. [Google Scholar] [CrossRef]
- Fang, H.; Baret, F.; Plummer, S.; Schaepman-Strub, G. An overview of global leaf area index (LAI): Methods, products, validation, and applications. Rev. Geophys. 2019, 57, 739–799. [Google Scholar] [CrossRef]
Disclaimer/Publisher’s Note: The statements, opinions and data contained in all publications are solely those of the individual author(s) and contributor(s) and not of MDPI and/or the editor(s). MDPI and/or the editor(s) disclaim responsibility for any injury to people or property resulting from any ideas, methods, instructions or products referred to in the content. |
© 2025 by the authors. Licensee MDPI, Basel, Switzerland. This article is an open access article distributed under the terms and conditions of the Creative Commons Attribution (CC BY) license (https://creativecommons.org/licenses/by/4.0/).