1. Introduction
As climate change intensifies, urban environments are becoming more vulnerable to heat stress, thermal discomfort, and environmental degradation [
1,
2,
3,
4]. While new developments can be more effectively designed according to current and projected climatic parameters, existing urban structures that represent urban heritage demand a critical evaluation of their adaptive capacity and, possibly, a revision of current protection policies. Climate-adaptive block typologies are becoming essential for ensuring public health, social resilience, and energy efficiency. This highlights the need for a more integrative planning framework—one that unites urban morphology and microclimate modeling into coherent design and decision processes. The expanding availability of simulation tools and empirical datasets [
5] enables cross-comparative studies that validate localized findings across different climatic contexts.
The microclimatic performance of urban blocks, recognized as the fundamental morphological units within a city, is profoundly dependent on their built geometry, land coverage, and integrated green spaces [
6,
7]. Various studies underscore this complexity: for instance, a simulation study by Song et al. [
8] examined 36 block configuration models, demonstrating the significant effects of building layout and block configuration on summer thermal comfort within residential street canyons. Similarly, Zhu et al. [
9] validated the impact of distinct urban block layouts on building energy consumption and outdoor thermal comfort. Further research from Seoul by Xiang, Chang, and Cheng [
10] investigated how the height and density of urban structures, along with street canyon geometry, influenced outdoor air temperature, irrespective of vegetation coverage. The findings from these studies not only reveal the complex interplay between urban morphology and outdoor thermal comfort but also emphasize their dependence on local and regional climatic conditions.
While valuable, the existing body of research in Serbia lacks a comprehensive, comparative analysis that systematically elucidates the impact of multiple urban morphological components on outdoor thermal performance across a range of urban block typologies. Published studies tend to focus either on broader city-level climate assessments, e.g., Refs. [
11,
12], or on singular characteristics or individual urban blocks, e.g., Refs. [
13,
14,
15,
16]. Consequently, a critical gap remains in understanding how the interplay between different morphological components, within varied block configurations, conditions outdoor thermal comfort in the Serbian climatic context. This study attempts to fill the identified gap by providing a targeted, comparative, and ENVI-met based analysis of urban block samples to reveal nuanced morphological impacts on outdoor thermal performance. The urgency of this endeavor is heightened by climate change predictions for Serbia. The Digital Climate, namely Atlas of Serbia (
https://atlas-klime.eko.gov.rs) (accessed on 20 July 2025), provides data for various reference and forecast periods at the municipal level, across different climatic variables. Atlas data consistently shows temperature growth as the most certain manifestation of climate change, both now and in the future. This temperature increase is accompanied by a rise in the number of tropical nights and more frequent and intense heatwaves. Given that the Urban Heat Island (UHI) effect is most pronounced in the capital city of Belgrade, the study specifically focuses on this urban environment, identifying suitable and comparable cases of urban blocks for investigation.
The primary goal of this research, therefore, is to identify the dominant urban morphological components that influence outdoor summer temperatures across nine selected urban blocks in New Belgrade, a district of the Serbian capital, Belgrade. Ideally, the initial hypothesis centers on the possibility of establishing rules for the interdependence between urban morphological components within blocks and their outdoor temperatures. Therefore, the research is designed as a two-phase process, operating under two scenarios: an “asphalt-only” environment (which allows for isolating the impacts of the built urban structure) and a “real-world” setting (which enables assessing the influence of green infrastructure (GI)).
The selected study area encompasses blocks that are protected as heritage sites. As such, their morphological characteristics inherently differ from urban blocks being constructed today. Given their significant Green Area Percentage (GAP) and a low Building Coverage Ratio (BCR)—which were fundamental design imperatives when these blocks were built—the second hypothesis posited that the rules of outdoor temperature behavior, derived from the first hypothesis, would be directly linked to these two urban parameters. The findings, however, revealed an exceptional complexity in the interdependence of morphology and outdoor temperature. The influence of BCR and GAP was unexpectedly non-linear and generally moderate to low, a phenomenon detailed in the following sections. This outcome underscores that it is, therefore, no longer sufficient to evaluate land-use efficiency without simultaneously accounting for the thermal implications of the built configuration.
2. Materials and Methods
2.1. Study Area: The Central Zone of New Belgrade
While earlier plans existed [
17], the real drive for New Belgrade’s development emerged in the aftermath of World War II. New Belgrade stands as a powerful testament to the post-war need for national reconstruction, met by the creation of mass housing complexes—blocks [
18]. The blocks of New Belgrade were built in multiple phases, spanning an expansive territory of approximately 4100 hectares. Although Le Corbusier’s concept of free-form construction largely shaped New Belgrade’s development, the influence of Socialist Realist Soviet architecture is also visible in some of the earliest blocks and structures.
The initial phase of New Belgrade’s development (1947–1950) saw young volunteers, organized into youth work brigades, participate as builders. The first blocks were largely a product of significant manual labor. During the second development phase, established construction companies took over. This period marked the introduction of modern building methods, including prefabrication—notably the innovative “IMS Žeželj system” [
19]—which allowed for faster construction. The third phase of development, which began around 1962, focused on the southern and central parts of New Belgrade, that is, on its Central Zone (
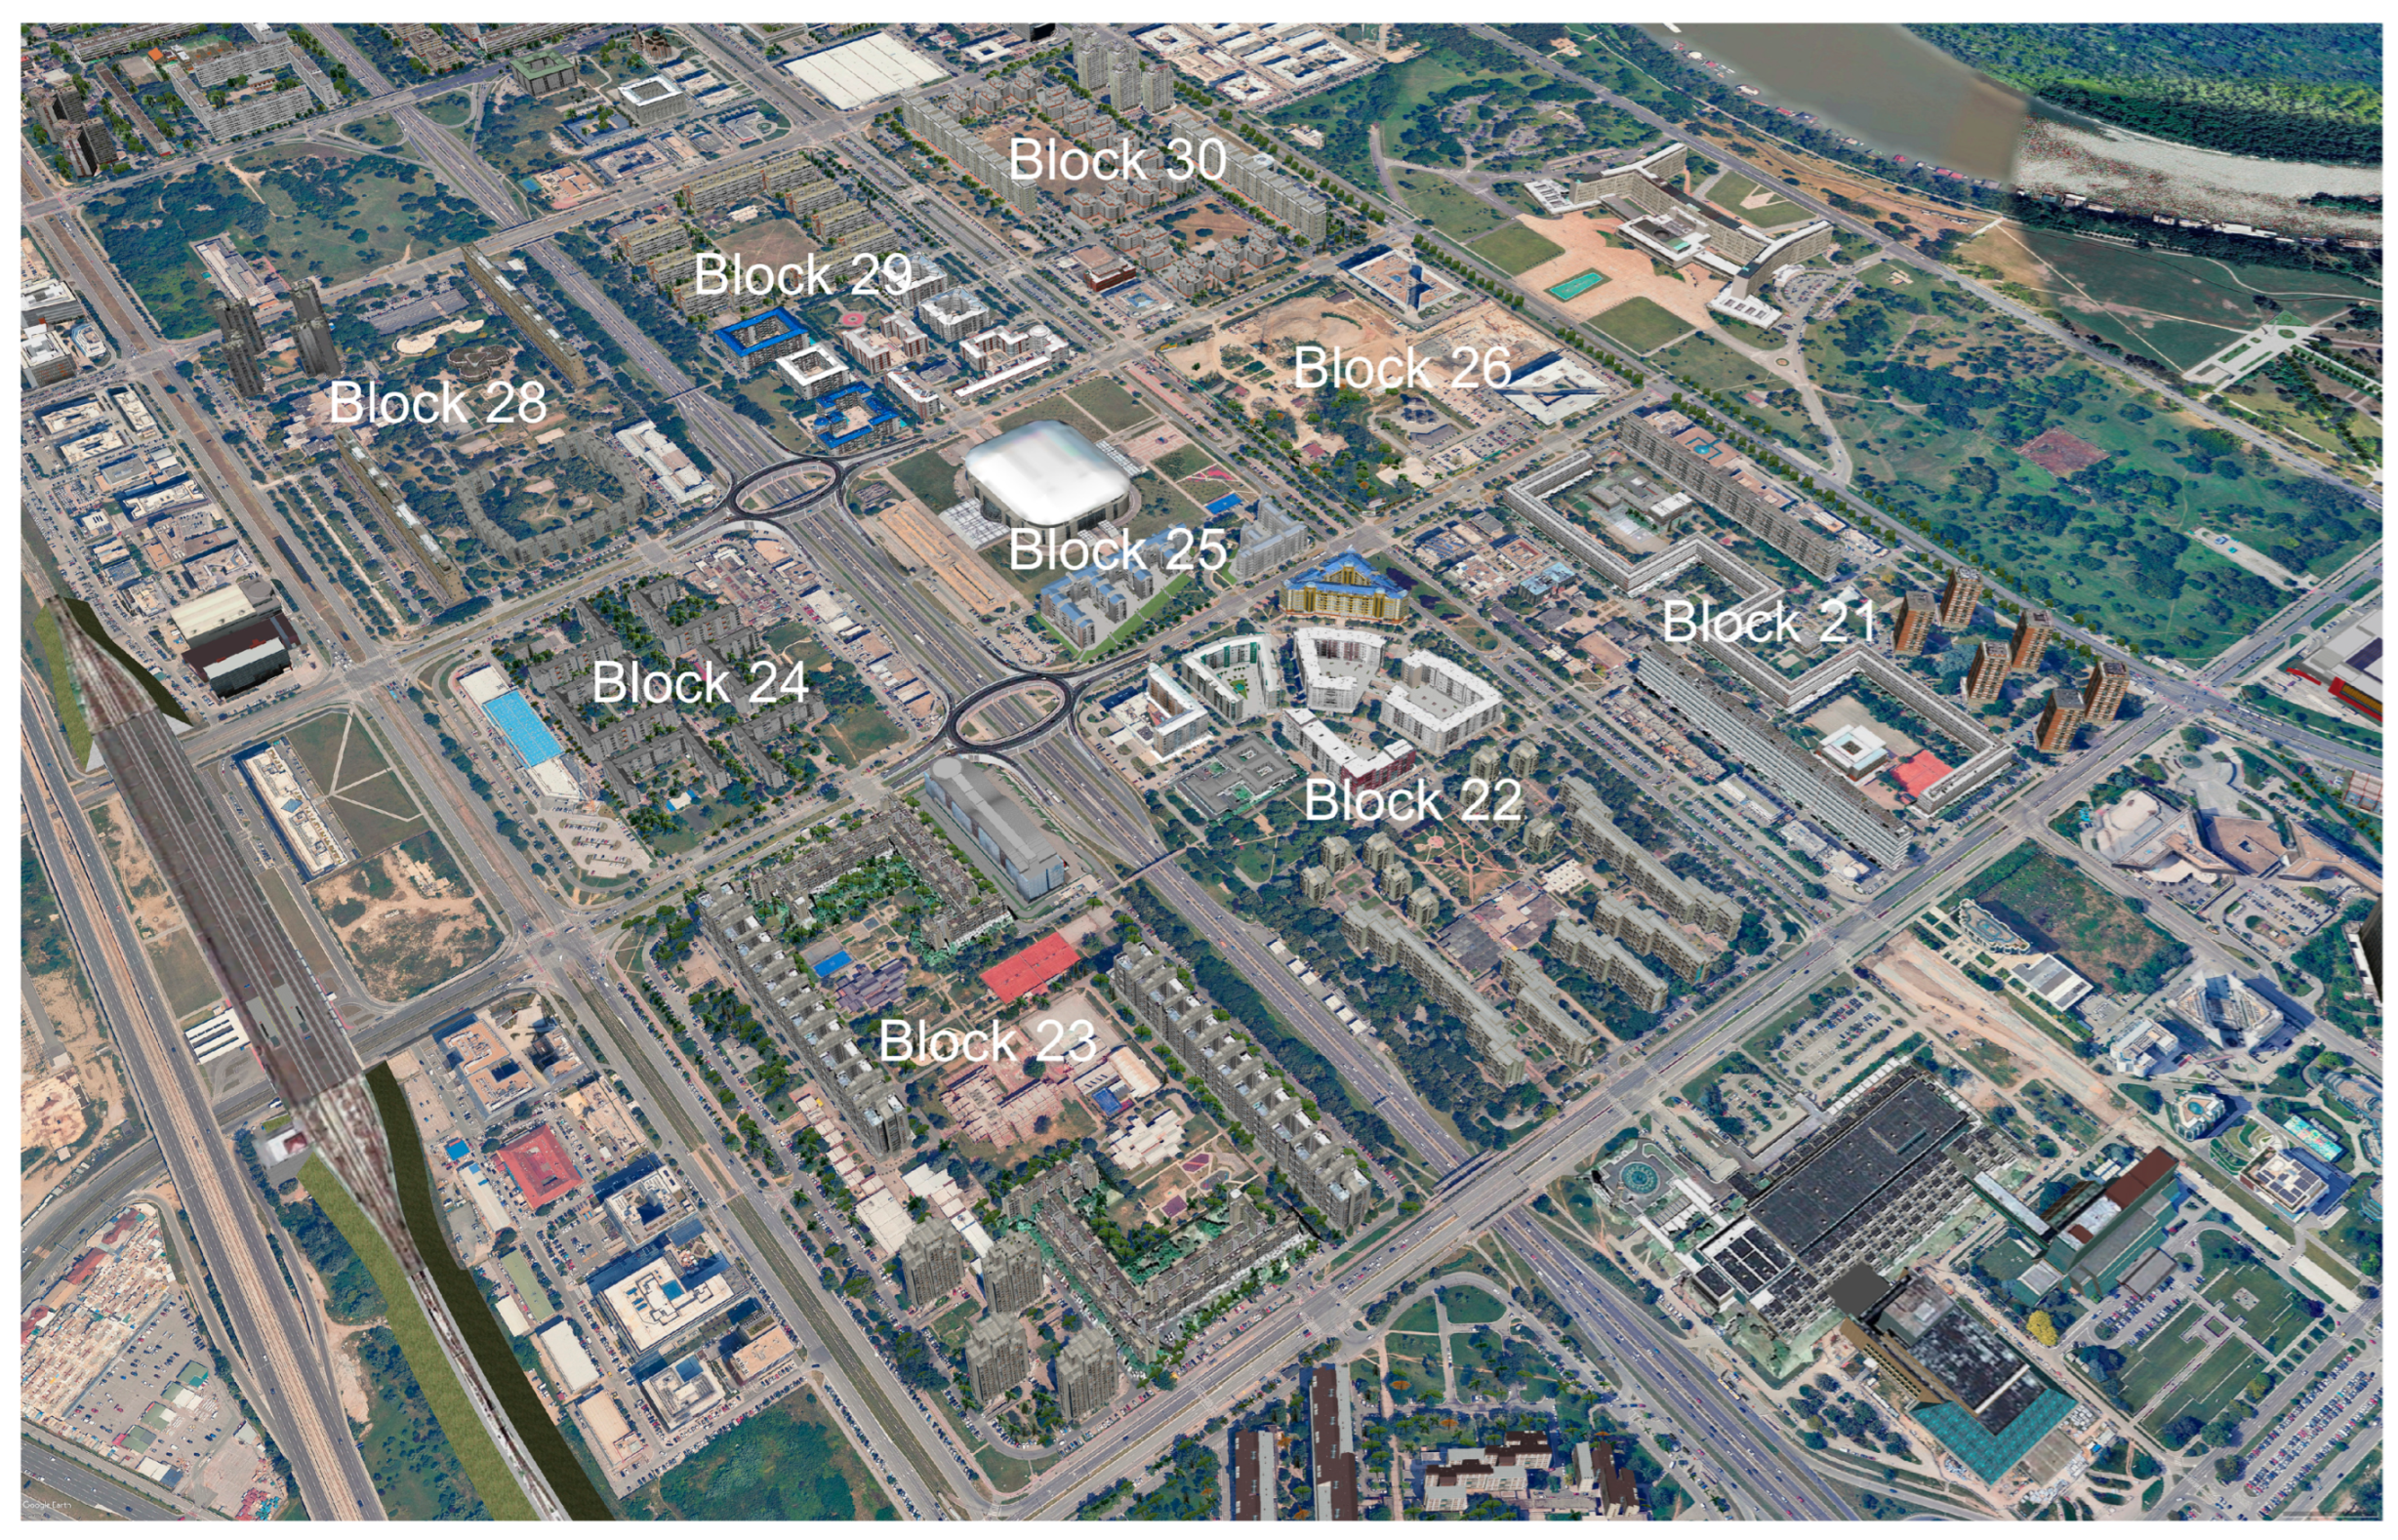
Figure 1).
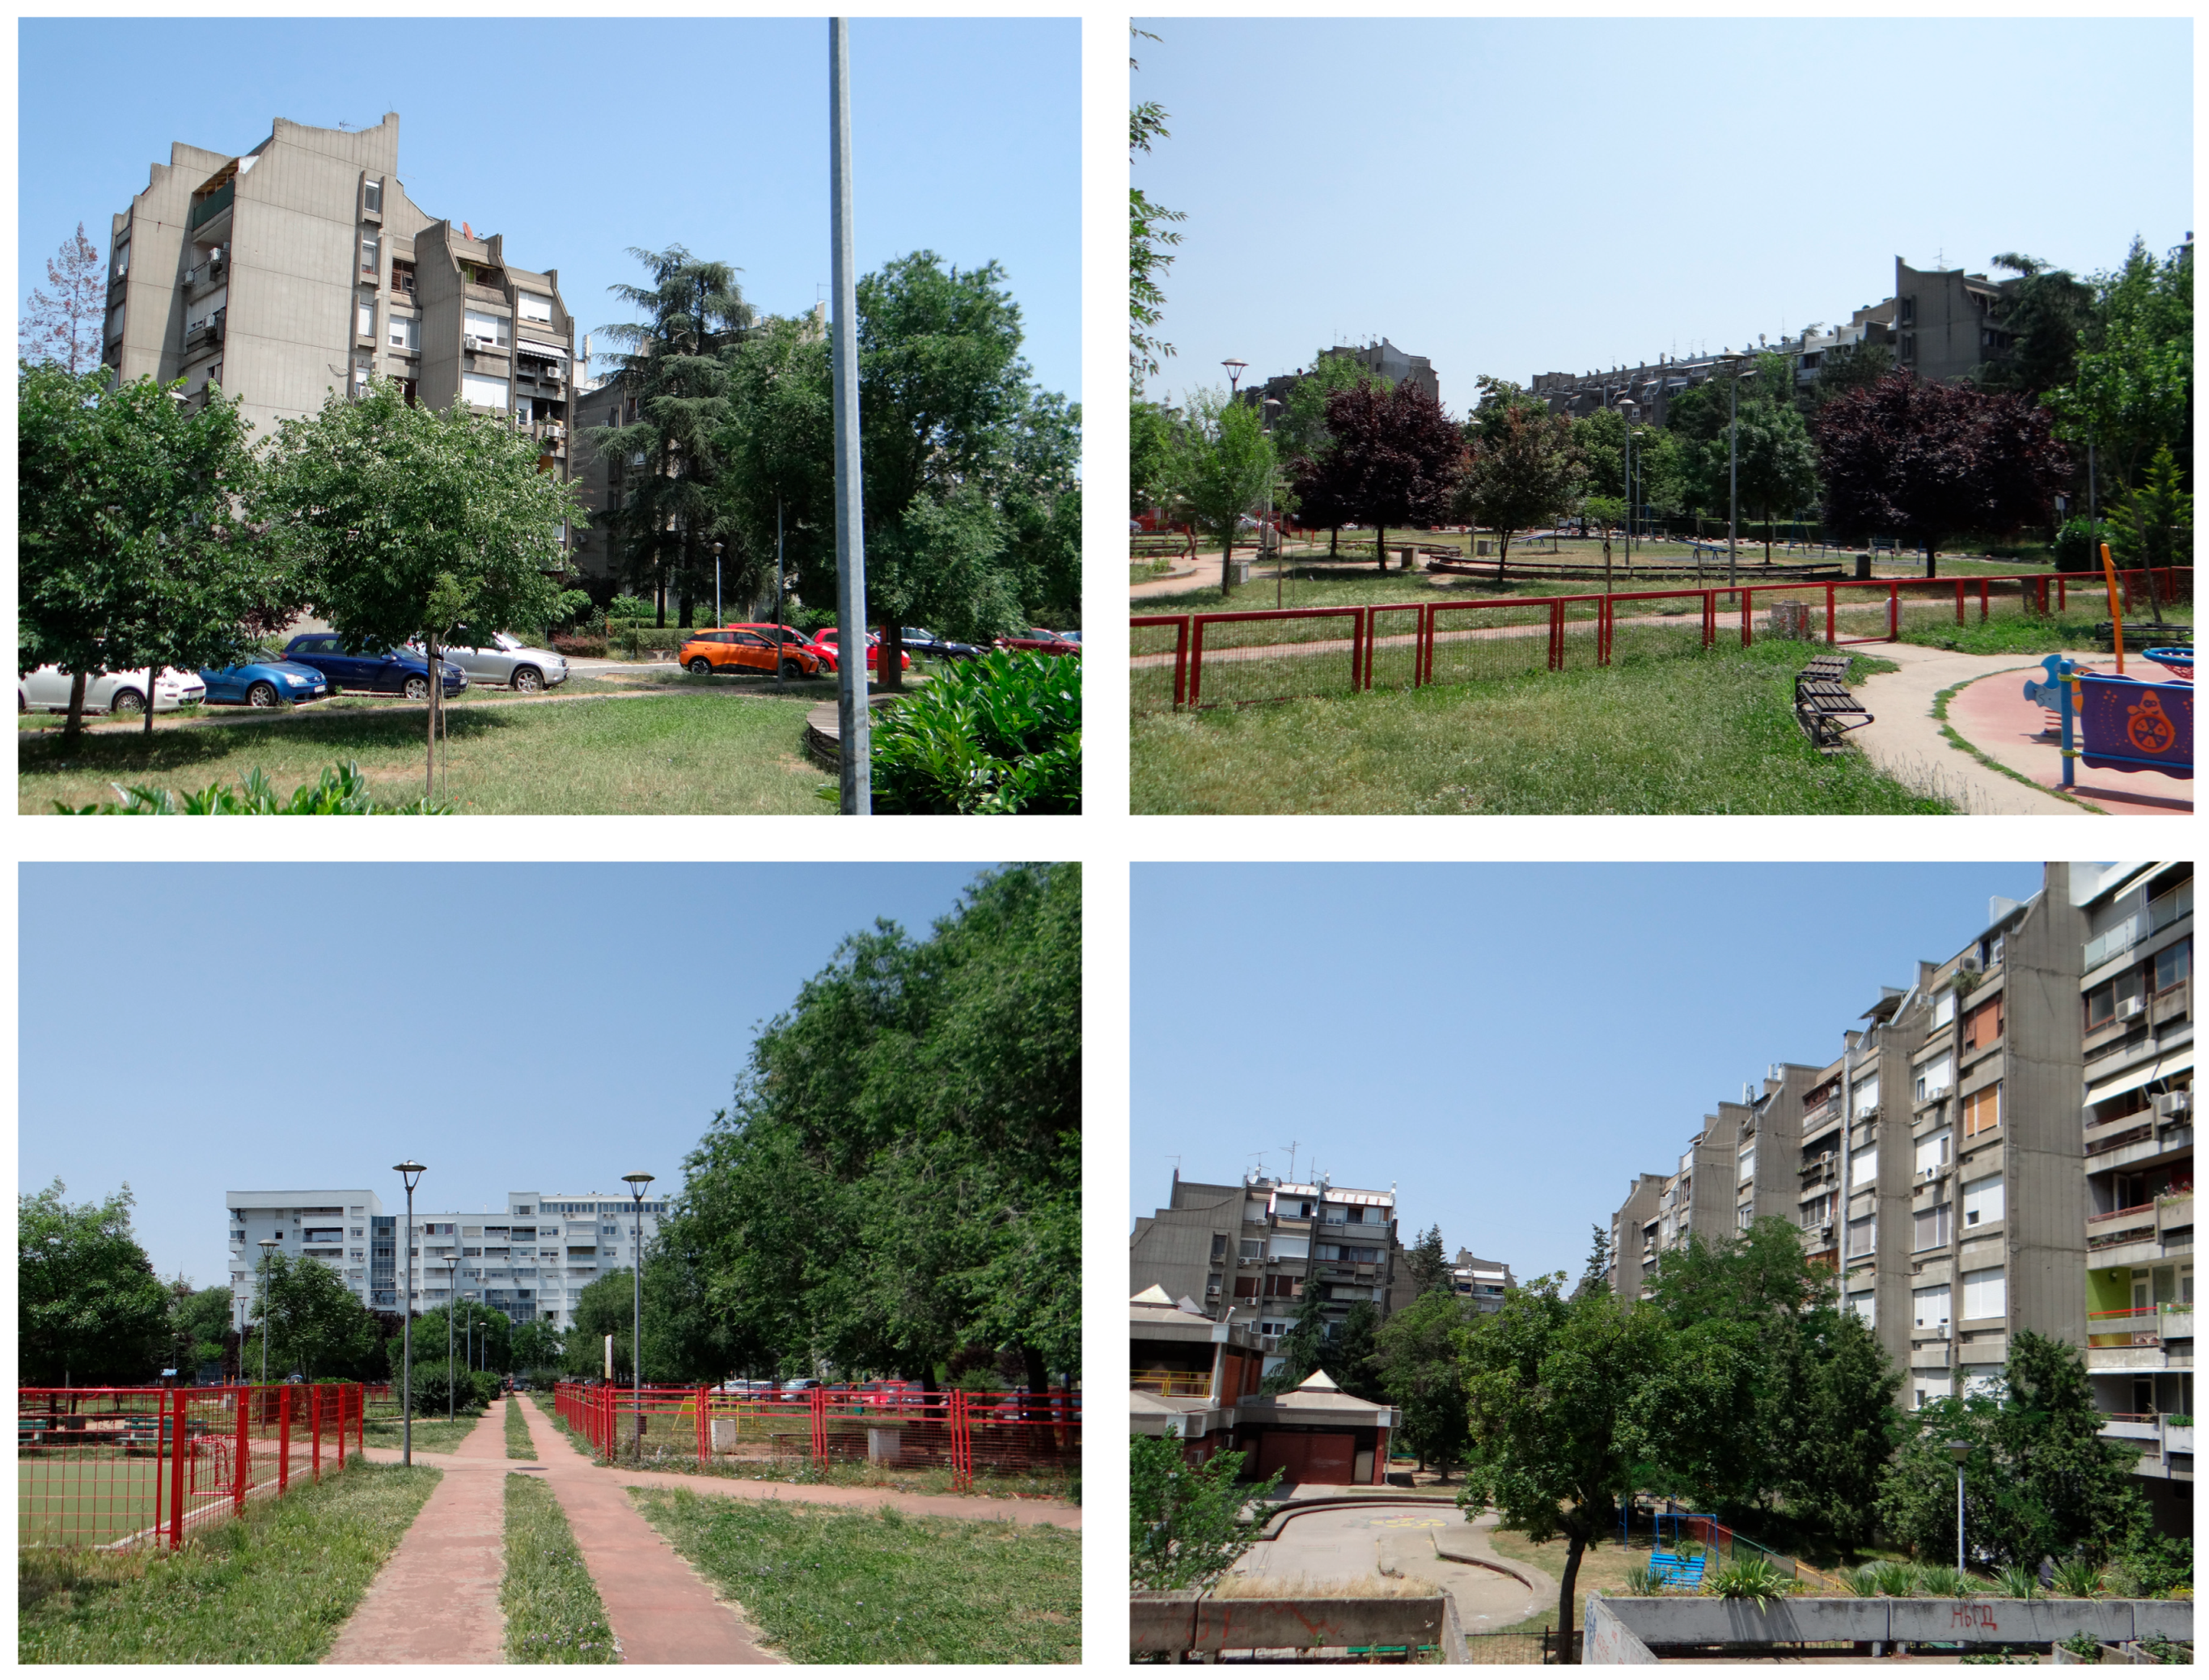
The Central Zone of New Belgrade, comprising Blocks 21, 22, 23, 24, 25, 26, 28, 29, and 30, was chosen as the study area for this research (
Figure 1 and
Figure 2). In 2021, the Government of the Republic of Serbia officially recognized the Central Zone as a cultural heritage site, designating it a ‘spatial cultural-historical unit’. Six blocks within this zone are protected, while the three central ones (Blocks 24, 25 and 26) form the ‘protected surroundings of a significant cultural-historical unit’. The three central blocks were originally conceived as New Belgrade’s main squares; however, this vision was ultimately abandoned due to economic and political circumstances, and housing became the predominant function of the Central Zone [
20].
Within the study area, Blocks 21 and 29 stand as the oldest among the nine encompassed blocks, while Blocks 25 and 26 represent the newest additions. Since the late 1980s, the blocks have undergone significant infill development, primarily along their perimeters. This has introduced new residential and non-residential buildings, contributing to an increase in urban density and a disruption of the original spatial concept. Nevertheless, the original architectural heritage within these selected blocks remains visually dominant.
All nine blocks included in this study exhibit regular, consistent shapes characteristic of New Belgrade. The three central blocks each measure 400 × 400 m, while the other six protected blocks are 600 × 400 m. Each block is defined by the presence of wide boulevards or a highway along at least one boundary. The underlying orthogonal street network aligns along northwest-southeast and northeast-southwest axes, with most buildings strategically positioned either parallel or perpendicular to these major thoroughfares.
In socio-spatial terms, encompassed blocks effectively function as residential communities. While Block 26 is currently experiencing significant residential development and Block 25 is home to Serbia’s largest multi-functional arena, the blocks collectively fulfill all criteria for neighborhood designation. They offer diverse amenities, house a large resident population, feature an appropriate urban design concept with emphasized common open spaces, and possess an area size that aligns with the definition of a self-contained urban unit.
Although densification occurred in later periods, all nine blocks maintain a low density, characterized by Building Coverage Ratios (BCR) ranging from 0.08 to 0.21. In stark contrast, each block boasts an abundance of greenery. The amount of green space exceeds national minimum standards and is notably more plentiful than in other parts of Belgrade. Green Area Percentage (GAP) per block ranges from 30% in Blocks 21 and 24 to as high as 51% in Block 28. These two combined qualities—low built density and intensive presence of green infrastructure (GI)—suggest the potential for thermally comfortable outdoor spaces within the blocks, serving as one of the primary motivations for this research.
The blocks exhibit a diverse building typology, encompassing various forms such as singular, linear, L-shaped, meander, courtyard, double linear with small inner courtyards, towers, and hybrid configurations. Complementing this, the blocks feature a mosaic of low-, mid- and high-rise buildings (
Table 1).
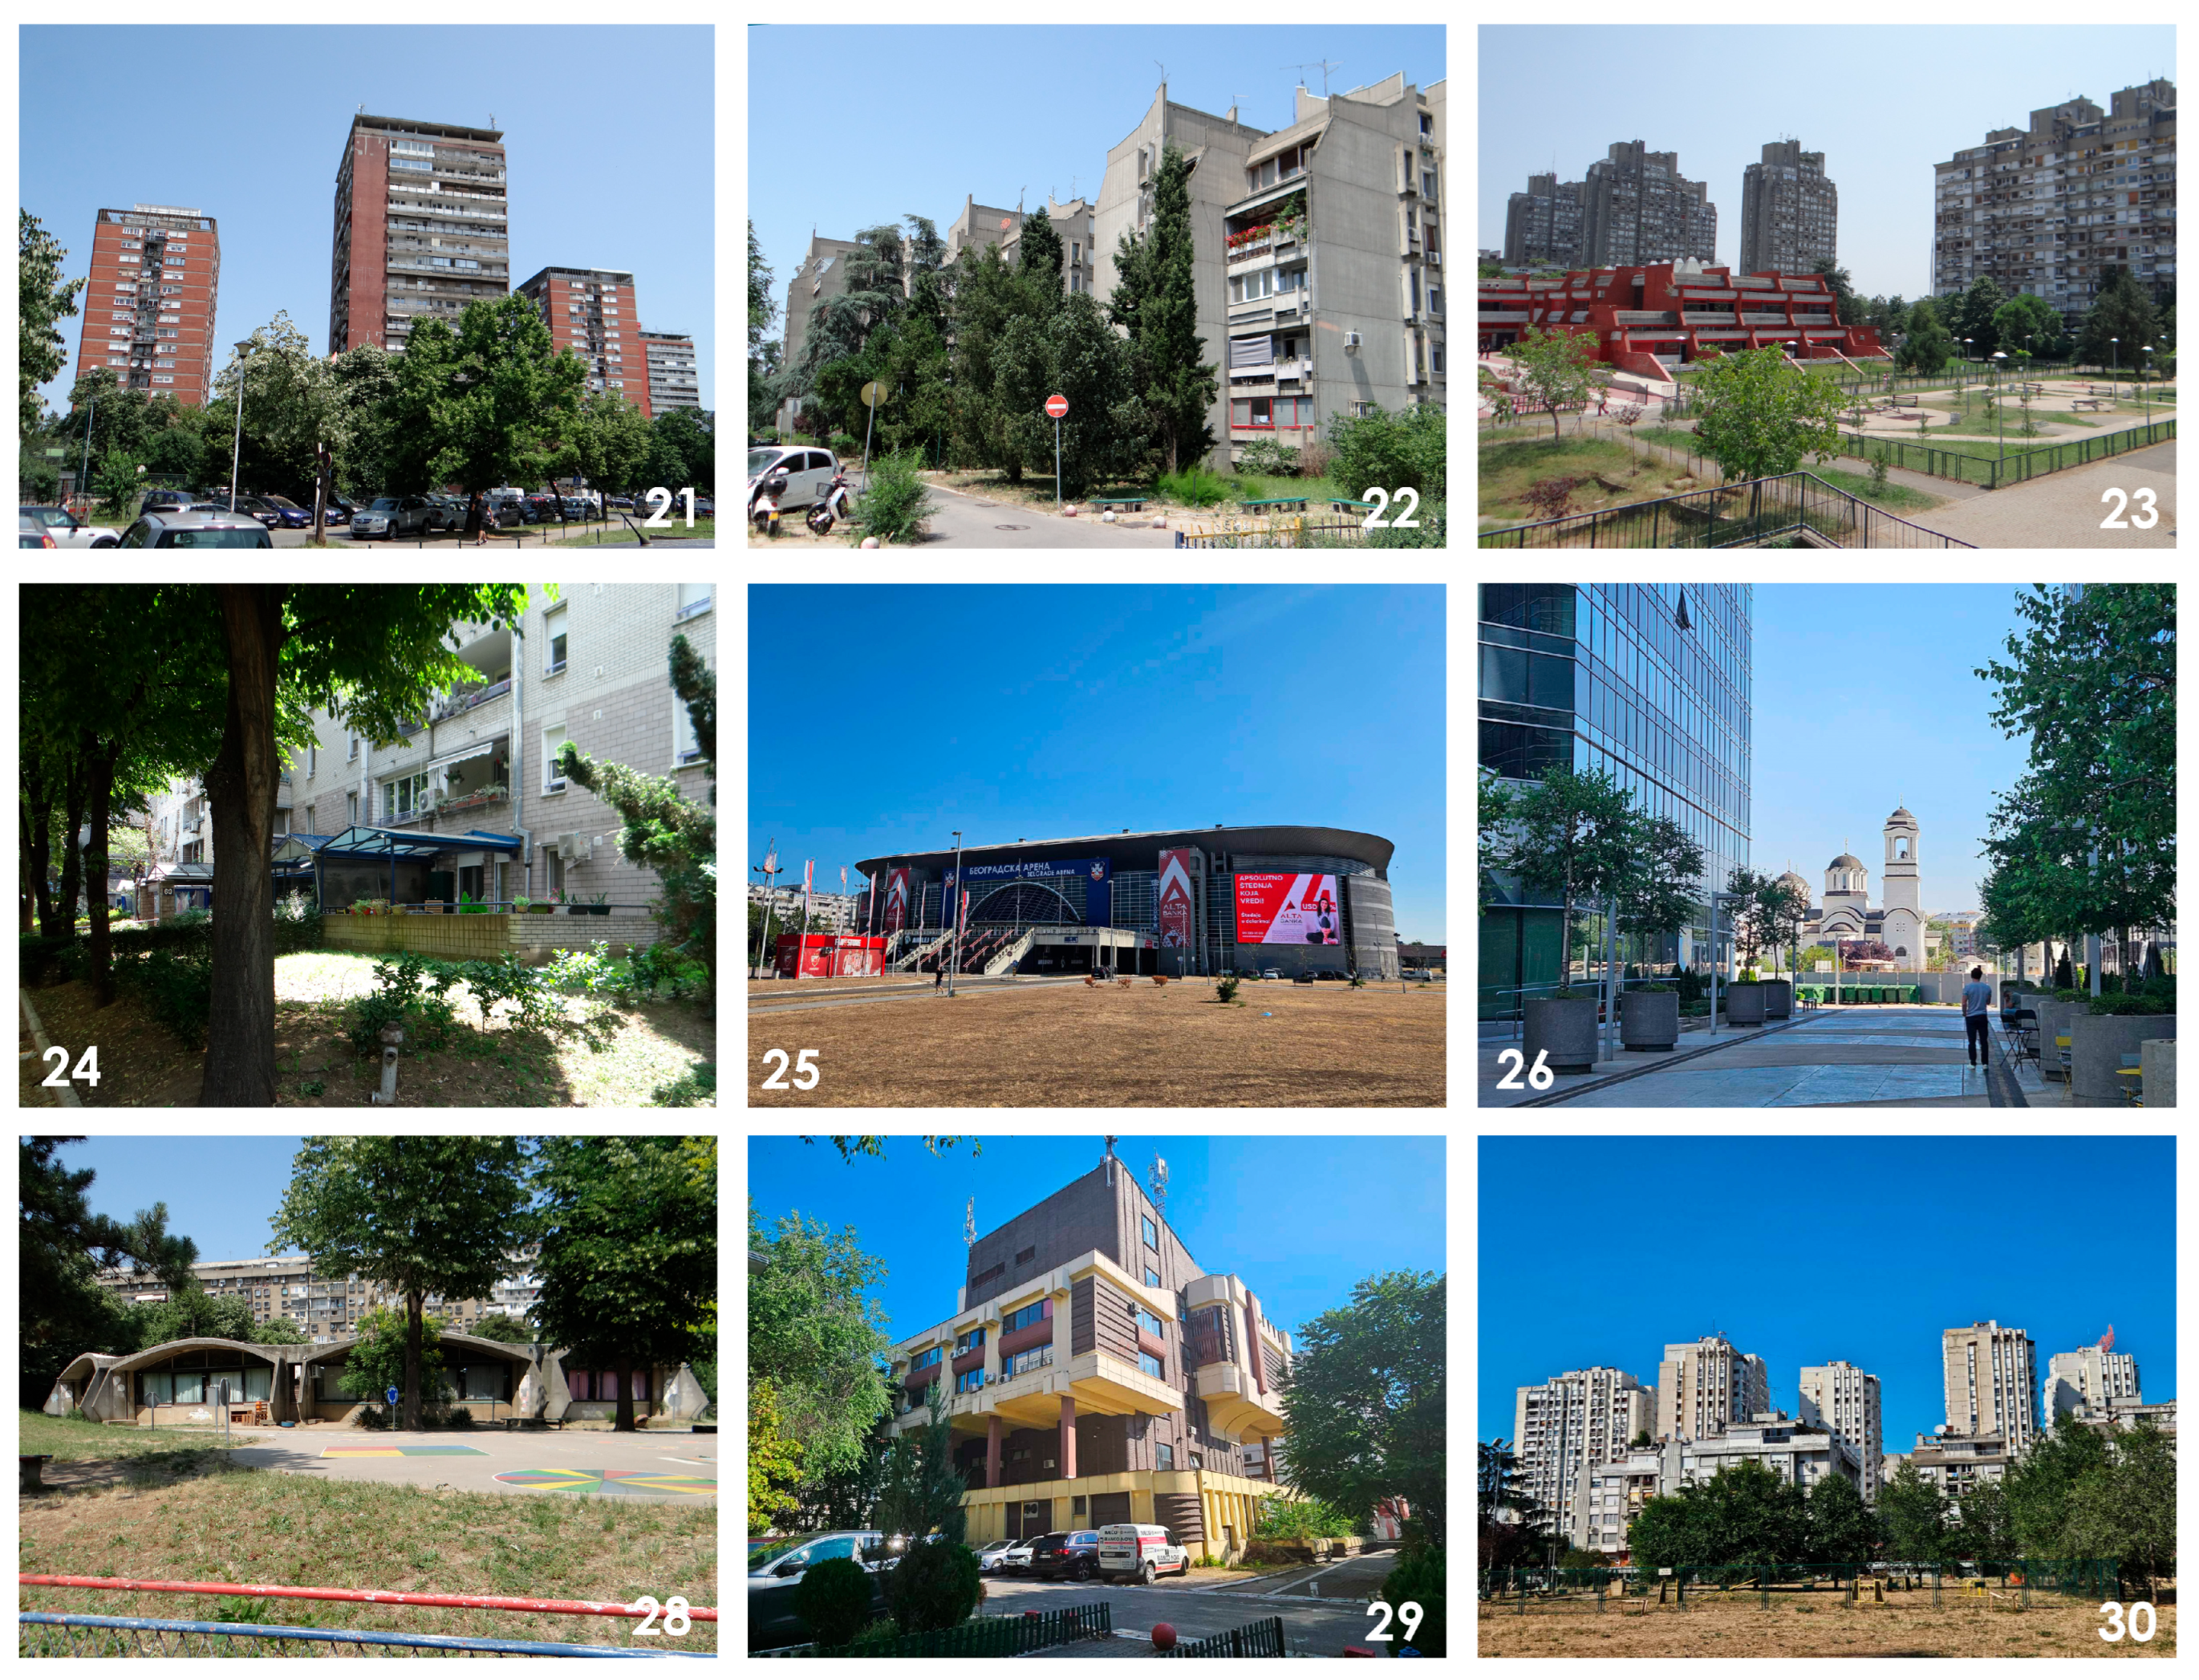
The Central Zone boasts numerous buildings internationally acclaimed as significant examples of Modern and Brutalist architecture (
Figure 3). Block 23 is particularly notable, serving as a quintessential illustration of iconic design and a spatial–functional organization that, to a certain extent, aligns with Le Corbusier’s principles for urban space. Since 2019, Block 23 has been part of the permanent collection of the Museum of Modern Art (MoMA) in New York [
21].
2.2. Methodology
This investigation commenced with an interest in exploring how urban heritage performs under current climatic conditions. To address this question, two distinct scenarios were envisioned for the selected study area (
Section 2.1). The first scenario (Simulation 1, run using ENVI-met 5) analyzed nine New Belgrade blocks, featuring only buildings and asphalt, devoid of all greenery or trees. This approach aimed to isolate the impact of urban built structure. The second ENVI-met 5 scenario (Simulation 2) depicted the actual conditions within blocks, incorporating existing green areas and trees. Both simulations were built upon a Geographic Information System (GIS) spatial model of objects in vector format.
Spatial object modeling was performed using Quantum Geographic Information System (QGIS) application, version 3.40.0 (Bratislava). OpenStreetMap databases (
https://www.openstreetmap.org, accessed on 31 July 2025) served as the primary source for spatial data, with QGIS project and layer styles sourced from NextGIS (
https://data.nextgis.com, accessed on 31 July 2025) for enhanced usability. In addition to these sources, green areas, trees, and streets were independently modeled within QGIS to ensure accurate representation of the study area’s specific features.
Simulations were prepared and executed using three-dimensional microclimate simulation software ENVI-met, Version 5, Science and Education License, One Click LCA, Helsinki, Finland (
https://oneclicklca.com, accessed on 31 July 2025). ENVI-met is a holistic and highly sophisticated numerical model widely utilized in academic research and professional practice globally. It allows, inter alia, for the precise assessment of the impact of complex urban built morphology and green infrastructure on outdoor thermal conditions.
For temperature data, 16 July 2024 was selected as the representative day. This specific date was chosen due to its recorded high maximum temperatures coupled with the highest nocturnal temperatures, providing a critical scenario for evaluating UHI effects. Hourly temperature (min 27.3 °C, max 39.6 °C, average 33.5 °C), wind (average speed of 2.67 m/s and dominant SE direction and microscale roughness length of surface of 0.01 m), and hourly air humidity data (min 19%, max 60%, average 36%) for the selected day were all retrieved from the Republic Hydrometeorological Service of Serbia website (
http://synop.meteos.rs/).
The boundary conditions for simulations were specified as follows: Key architectural attributes included roof shape (flat or sloping), building height, number of floors, and roof/façade material types. To align with ENVI-met material definitions, the following materials were assigned: 0200C5—concrete: cast dense for flat roofs; 0200R1—roofing: tile for pitched roofs; and 0200MI—default wall: moderate insulation for walls. The Digital Elevation Model (DEM) data were obtained from the NASA server using the SRTM Downloader 3.2.3 plugin. All spatial data and maps were processed using the Coordinate Reference System EPSG: 32634—WGS 84/UTM Zone 34N.
Simulation parameters within ENVI-met were then defined as follows:
Initial Soil Conditions: upper layer (0–20 cm) at a temperature of 21 °C and a relative humidity of 63%; middle layer (20–50 cm) at temperature of 20 °C and a relative of humidity 70%; deep layer (50–200 cm) at a temperature of 19 °C and a relative of humidity 75%; bedrock layer (below 200 cm) at a temperature of 18 °C and a relative of humidity 75%;
Building Indoor Temperature: 22 °C;
Initial Building Temperature: 22 °C.
The spatial resolution employed for the calculations was 3 m in all three directions (x, y, z). A telescoping option was utilized up to a height of 30 m, with a telescoping factor of 10% applied, allowing for detailed atmospheric profiling within the urban canopy layer.
For comparative analysis and validation of results, the study referenced a model presented by Marković et al. [
22]. This reference model, also simulated for 16 July 2024, is characterized by a high BCR within a central urban core, providing a valuable benchmark for understanding thermal performance in densely built environments.
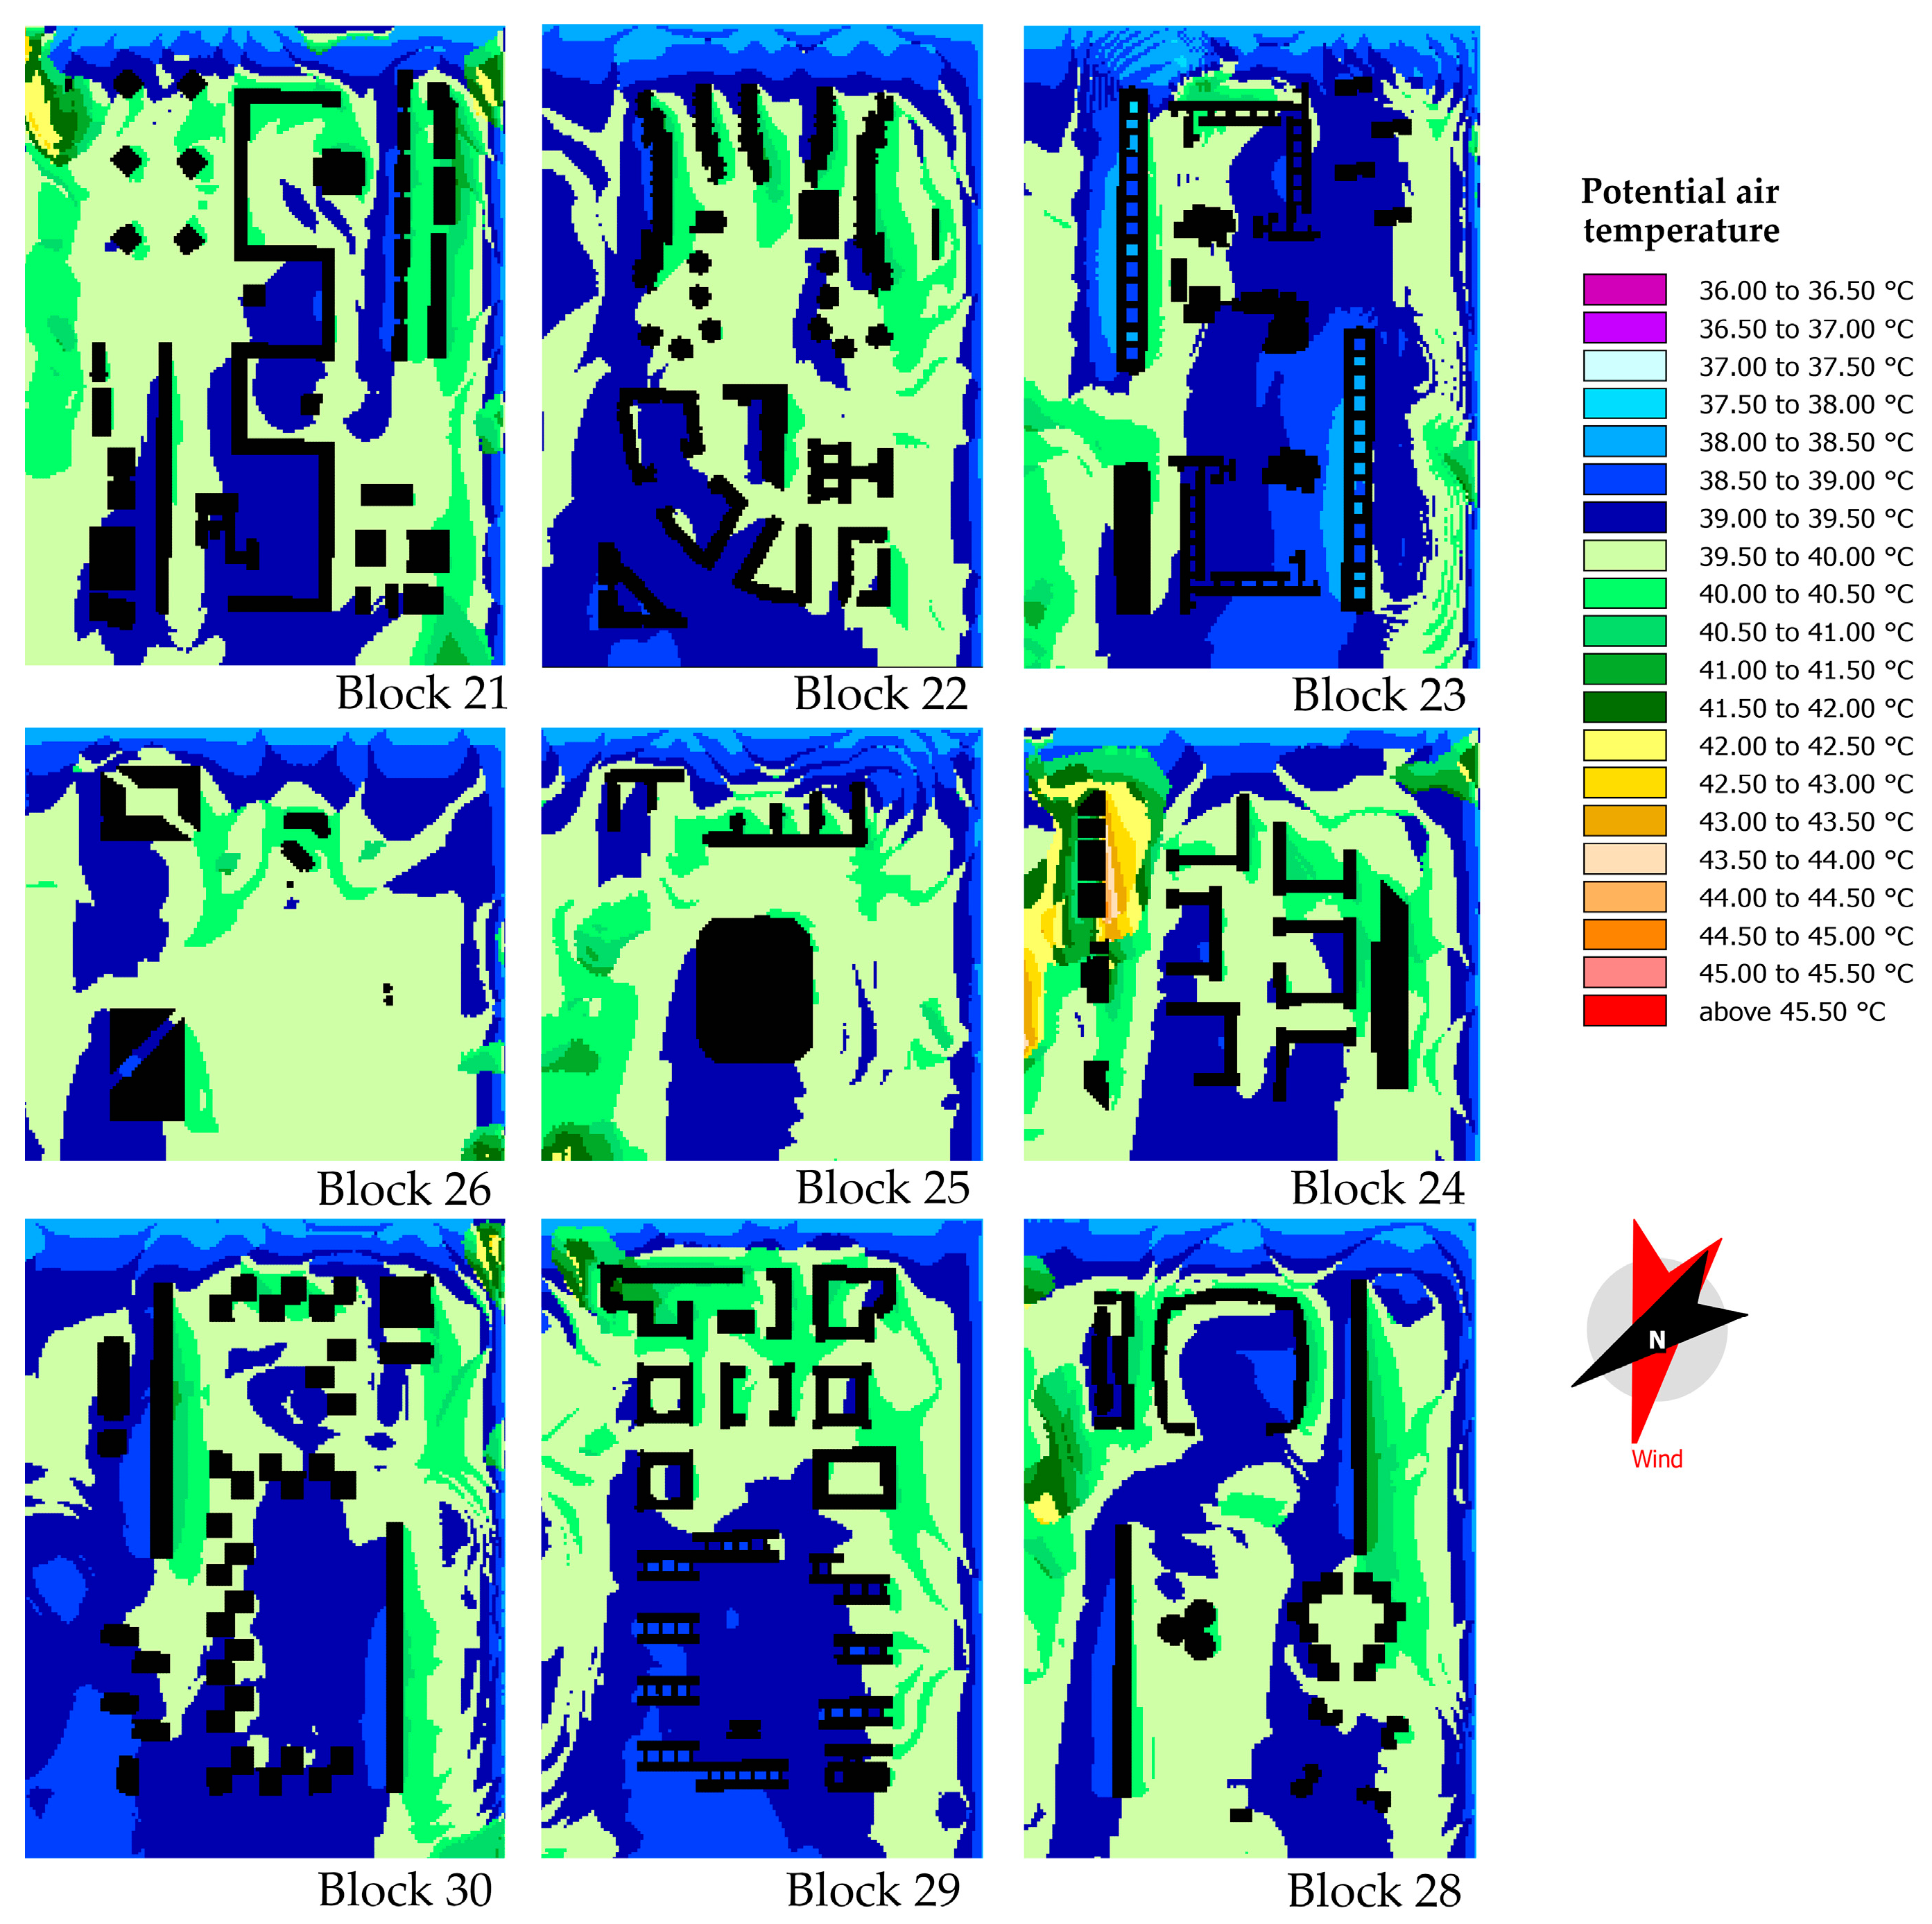
Data visualization of the simulation outputs was conducted using the Leonardo package, a module integrated within the ENVI-met software. Concretely, Leonardo enabled the creation of high-resolution two-dimensional temperature distribution maps, the extraction of temperature values from specific points, and the analysis and comparison of results from Simulation 1 and Simulation 2.
The simulation outcomes, particularly the comparison between the “asphalt-only” and “real-world” scenarios and the analysis against the reference model, revealed an intricate relationship between BCR, GAP, and outdoor temperatures at pedestrian level (1.5 m from the ground). Therefore, the thermal performance of the studied blocks—indicated by minimum and maximum daily temperatures, average 24 h temperature, and 24 h temperature change—extends beyond simple urban metrics. It reflects the complex interplay of various factors detailed in
Section 3,
Section 4 and
Section 5. These analyzed performance metrics are considered crucial as they offer a comprehensive picture of the thermal environment within the studied blocks.
Specifically, Simulation 1 subjected all nine blocks to uniform input conditions, including geographical location, climate characteristics, and consistent building envelope and ground surface properties. This methodological approach allowed for the following:
Determination of inter-block variations in minimum, maximum, and average temperatures, as well as temperature oscillations;
Analysis of the correlation between outdoor temperatures and BCR;
Examination of how building geometry and urban layout shape outdoor temperature.
Simulation 2 incorporated the existing GI within the nine researched blocks. This approach allowed for the following:
Analysis of the potential of vegetation in mitigating high summer outdoor temperatures and counteracting the potential negative effects of built urban structure;
Analysis of the correlation between outdoor temperatures and GAP.
Given the objective of predicting the maximum potential effects of built geometry and spatial organization on outdoor temperatures, the analyses primarily focused on maximum potential temperature differences. Furthermore, because the analyses involved mutual comparisons—specifically, the identification of temperature variations among blocks—the absolute temperature values obtained from Simulation 1 were not presented in the results. Instead, the pertinent findings from Simulation 1 were the observed temperature differences. Presenting absolute temperature values became relevant only when the influence of GI was included in Simulation 2.
The thermal performance of the studied blocks (both without and with GI) was mutually compared to using a ranking method. This statistical technique involved assigning numerical ranks to blocks based on their observed temperature values. For the temperature metrics of maximum temperature, 24 h temperature changes, and average 24 h temperature, a ranking weighting factor of 1 was applied, corresponding to a difference range greater than 0.5 °C. Conversely, for minimum diurnal temperature, the assigned weighting factor was 0.5, as its temperature range was less than 0.5 °C. The 0.5 °C threshold was chosen to reflect the resolution and sensitivity of the ENVI-met model in capturing microclimatic variations.
3. Results
3.1. Temperature Variations Among Blocks
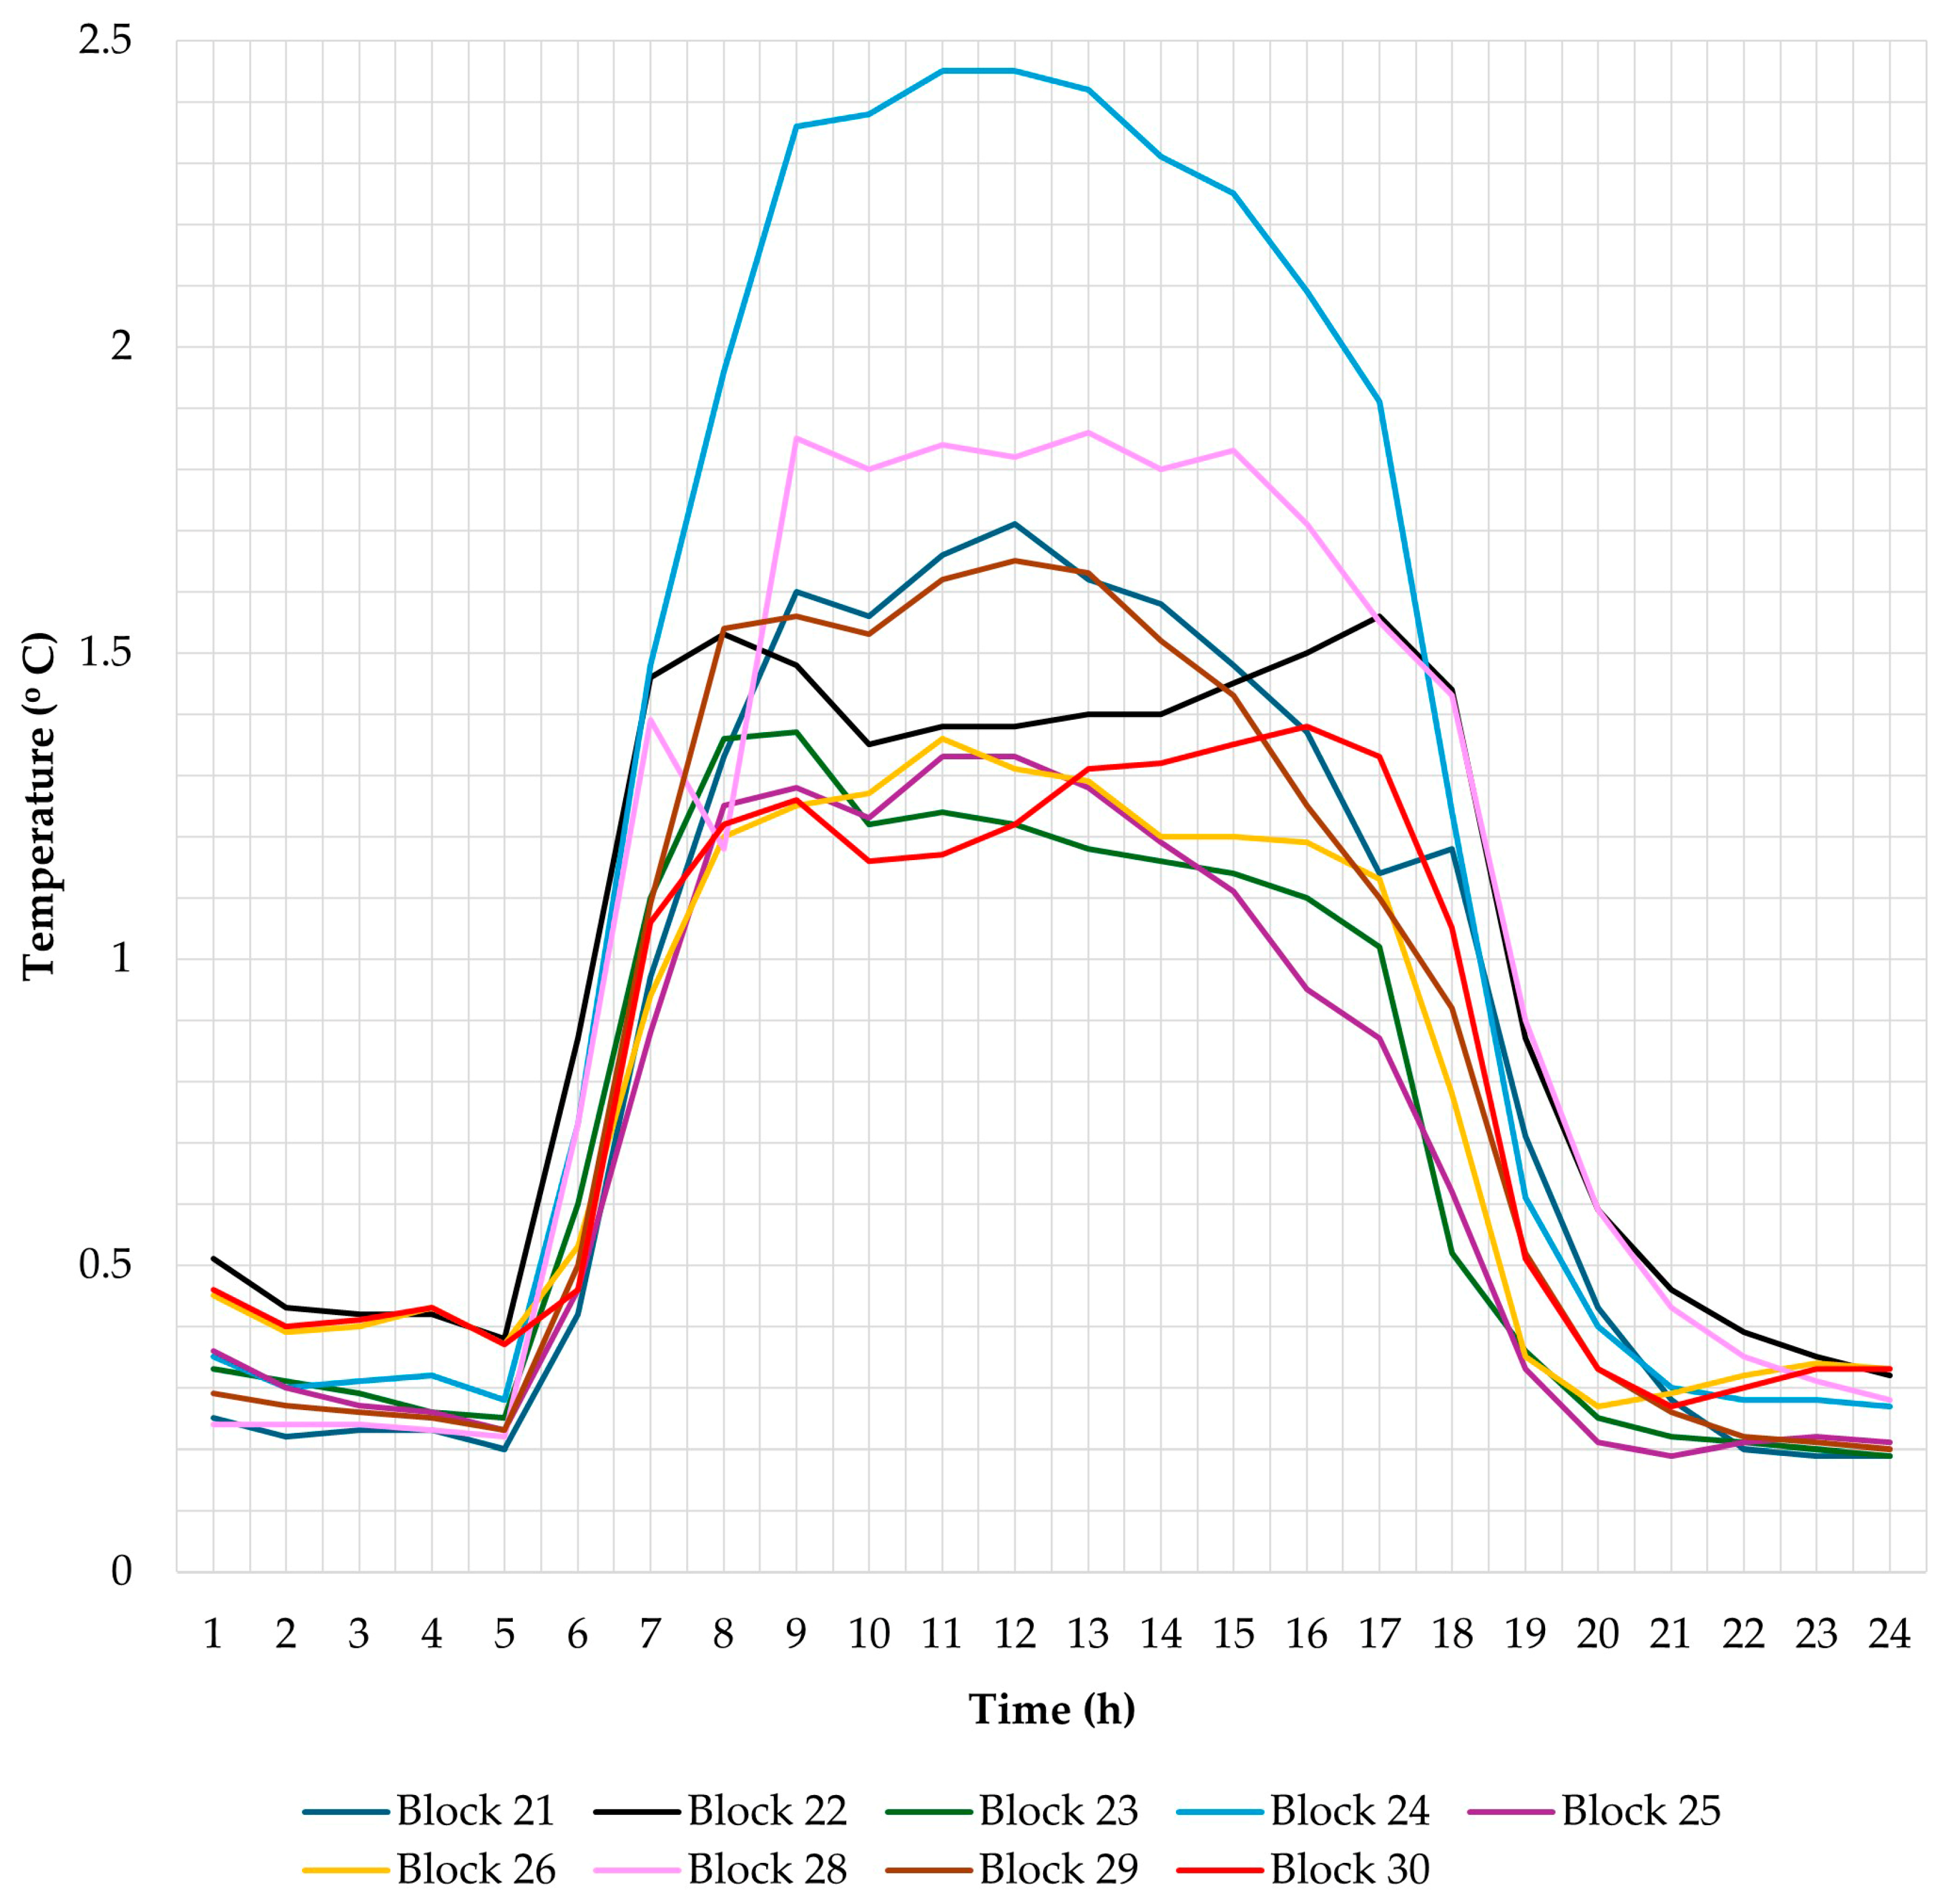
In all nine investigated blocks, the highest temperatures obtained from Simulation 1 were at 14:00 h. Conversely, the lowest temperatures were observed at 4:00 h or 5:00 h. The range of temperature differences is smallest at 5:00 h (0.36 °C) and largest at 13:00 h (3.49 °C).
The minimum temperature occurred at 4:00 h in Block 28. Accordingly, this value was set as the baseline relative temperature of 0 °C, and all other relative values were determined in relation to it to facilitate comparative analysis. The maximum temperature was recorded at 14:00 h in Block 24 (+15.04 °C). Therefore, the observed range of 24 h temperature variations across the group of investigated blocks was approximately 15 °C. (For a clearer overview, these differences are presented in
Section 3.3, alongside the corresponding results from Simulation 2).
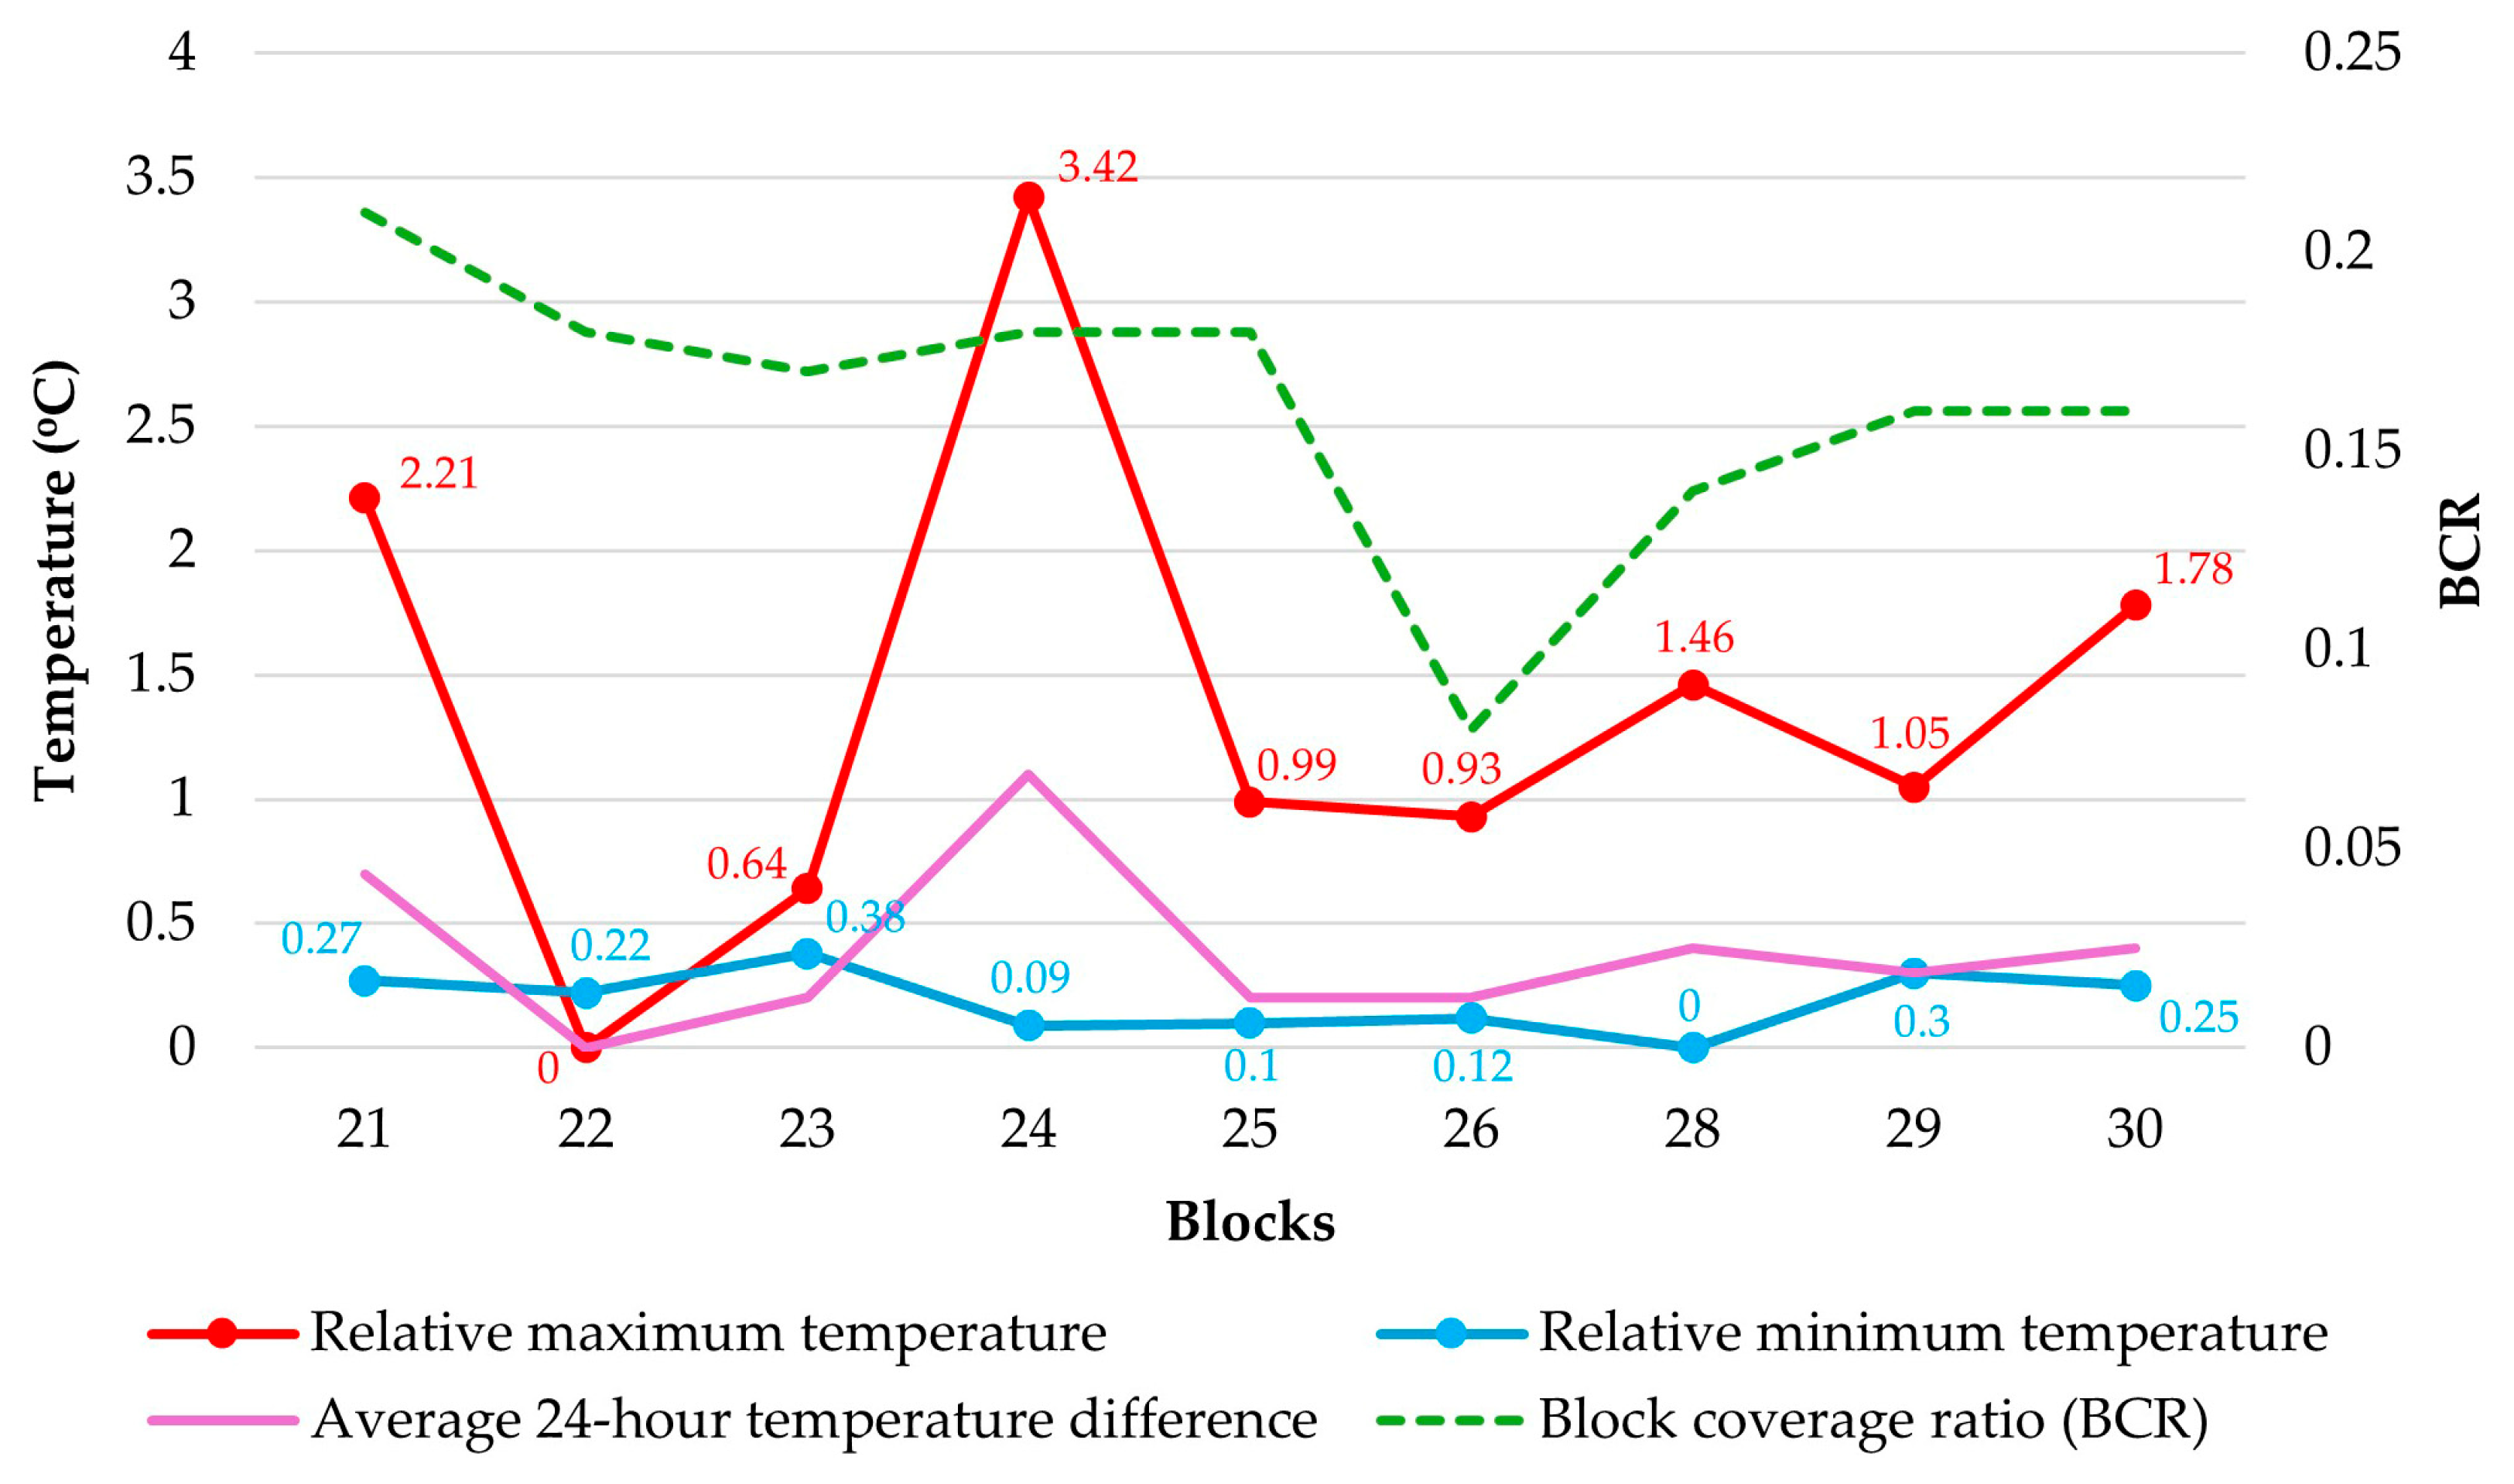
All studied blocks exhibit similar levels of heat stress during the night. Block 28 cools the most (relative 0 °C), but not significantly more than Blocks 24 (+0.09 °C), 25 (+0.1 °C), and 26 (+0.12 °C). Conversely, Block 23 cools the least overnight (relative +0.38 °C), followed by Blocks 29 (+0.3 °C), 21 (+0.27 °C), 30 (+0.25 °C), and 22 (+0.22 °C).
During the warmest period of the day—at 14:00 h—the temperature in the warmest Block 24 is 3.42 °C higher than the temperature in the coolest Block 22. For Blocks 23, 25, and 26, the temperature at 14:00 h is less than 1 °C higher compared to the coolest Block 22. In Blocks 21, 28, 29, and 30, as well as in the mentioned Block 24, the temperature at pedestrian level at 14:00 h is more than 1 °C higher than in the coolest Block 22.
The diurnal temperature range (the difference between the daily maximum temperature and the daily minimum temperature within a 24 h period), from the smallest to the largest, was 11.4 °C (Block 22), 11.88 °C (Block 23), 12.37 °C (Block 29), 12.43 °C (Block 26), 12.51 °C (Block 25), 13.08 °C (Block 28), 13.15 °C (Block 30), 13.56 °C (Block 21), and 14.95 °C (Block 24). Given that nocturnal variations among blocks are small, while variations in the highest daily temperatures are significant, this finding indicates that Blocks 22 and 23 exhibit the highest thermal stability, while Blocks 24 and 21 display the lowest.
The comparison further revealed that the average 24 h temperatures among the blocks vary by up to 1.04 °C. Block 24 is the warmest, followed in descending order by Blocks 21, 30, 28, and 29. Blocks 23, 25, and 26 exhibit similar average 24 h temperature, with mutual differences less than 0.1 °C. Block 22 is the coolest, and the difference between the warmest Block 24 and the coolest Block 22 is 1.04 °C on average over the 24 h period.
In summary, the observed blocks show notable differences in (1) maximum temperature (difference range: 3.42 °C); (2) 24 h temperature changes (difference range: 3.55 °C); and (3) average 24 h temperature (difference range: 1.04 °C). The variation in minimum potential temperatures among the blocks is less pronounced, ranging up to 0.4 °C. Consequently, (4) minimum nighttime temperatures were weighted at 0.5 when scoring block characteristics, while the other three characteristics were weighted at 1.
The rating revealed that Block 22 demonstrates the most favorable outdoor temperature conditions (29.5 points, rated 1st), whereas Block 24 demonstrates the least favorable (7 points, rated 9th). The scoring for other blocks is as follows: Block 26 (24 points, rated 2nd); Block 23 (23.5 points, rated 3rd); Block 25 (20.5 points, rated 4th); Block 29 (18 points, rated 5th); Block 28 (16.5 points, rated 6th); Block 30 (11 points, rated 7th); and Block 21 (7.5 points, rated 8th). (To provide a complete overview, scores are presented in
Section 3.3, facilitating direct comparison with those derived from Simulation 2).
3.2. Correlation Between BCR and Outdoor Temperatures
The comparative analysis of minimum, maximum, and average 24 h temperatures across the investigated blocks and their BCR indicates that the relationship between these parameters is diverse and complex.
Figure 4 illustrates the range of temperature differences among the blocks in relation to the aforementioned parameters.
Specifically, only Blocks 21 and 22 show a proportional relationship between minimum temperature and BCR. The data for other blocks reveals inconsistencies. Block 23, despite having a lower BCR than Blocks 21 and 22, exhibits a higher minimum temperature. Blocks 24 and 25, with the same BCR as Block 22, record lower minimum temperatures. Block 26 has the lowest BCR, significantly lower than other blocks, yet its minimum temperature did not decrease proportionally. In Block 28, where the lowest minimum temperature was predicted by Simulation 1, BCR is unexpectedly higher than in Block 26. Block 29 presents a contrast, showing the second highest minimum temperature despite its third lowest BCR. Finally, Block 30 shares the same BCR as Block 29 but has a lower minimum temperature value.
Concerning maximum and average temperatures, higher values in Block 21 correlate with a higher BCR. However, Block 22’s lower BCR compared to Block 21 does not proportionally reflect the smaller difference observed in its maximum and average 24 h temperatures. Block 23, despite a lower BCR than Block 22, shows higher average and maximum temperatures. Furthermore, the significant difference in BCR between Blocks 25 and 26 did not lead to significant differences in their maximum and average 24 h temperatures. Block 24 illustrates another contrast, with a lower BCR but higher maximum and average temperatures. Finally, Block 26’s lowest BCR is inconsistent with its relatively high maximum and average temperature values, which exceed those of Blocks 22 and 23 despite their higher BCR.
Therefore, it can be concluded that the relationship between temperatures at the block level and BCR within those blocks is complex and non-linear. A block’s BCR is not necessarily a reliable predictor of its temperature-related performance. Moreover, the correlation between a block’s BCR and its minimum temperature can differ significantly from its correlation with the maximum temperature. Notably, Blocks 22, 23, and 26, identified as having the most favorable temperature conditions, all exhibit diverse BCR.
3.3. The Impact of Green Infrastructure (GI)
Realistic temperature values from Simulation 2 indicate GI role in heat mitigation within the investigated blocks.
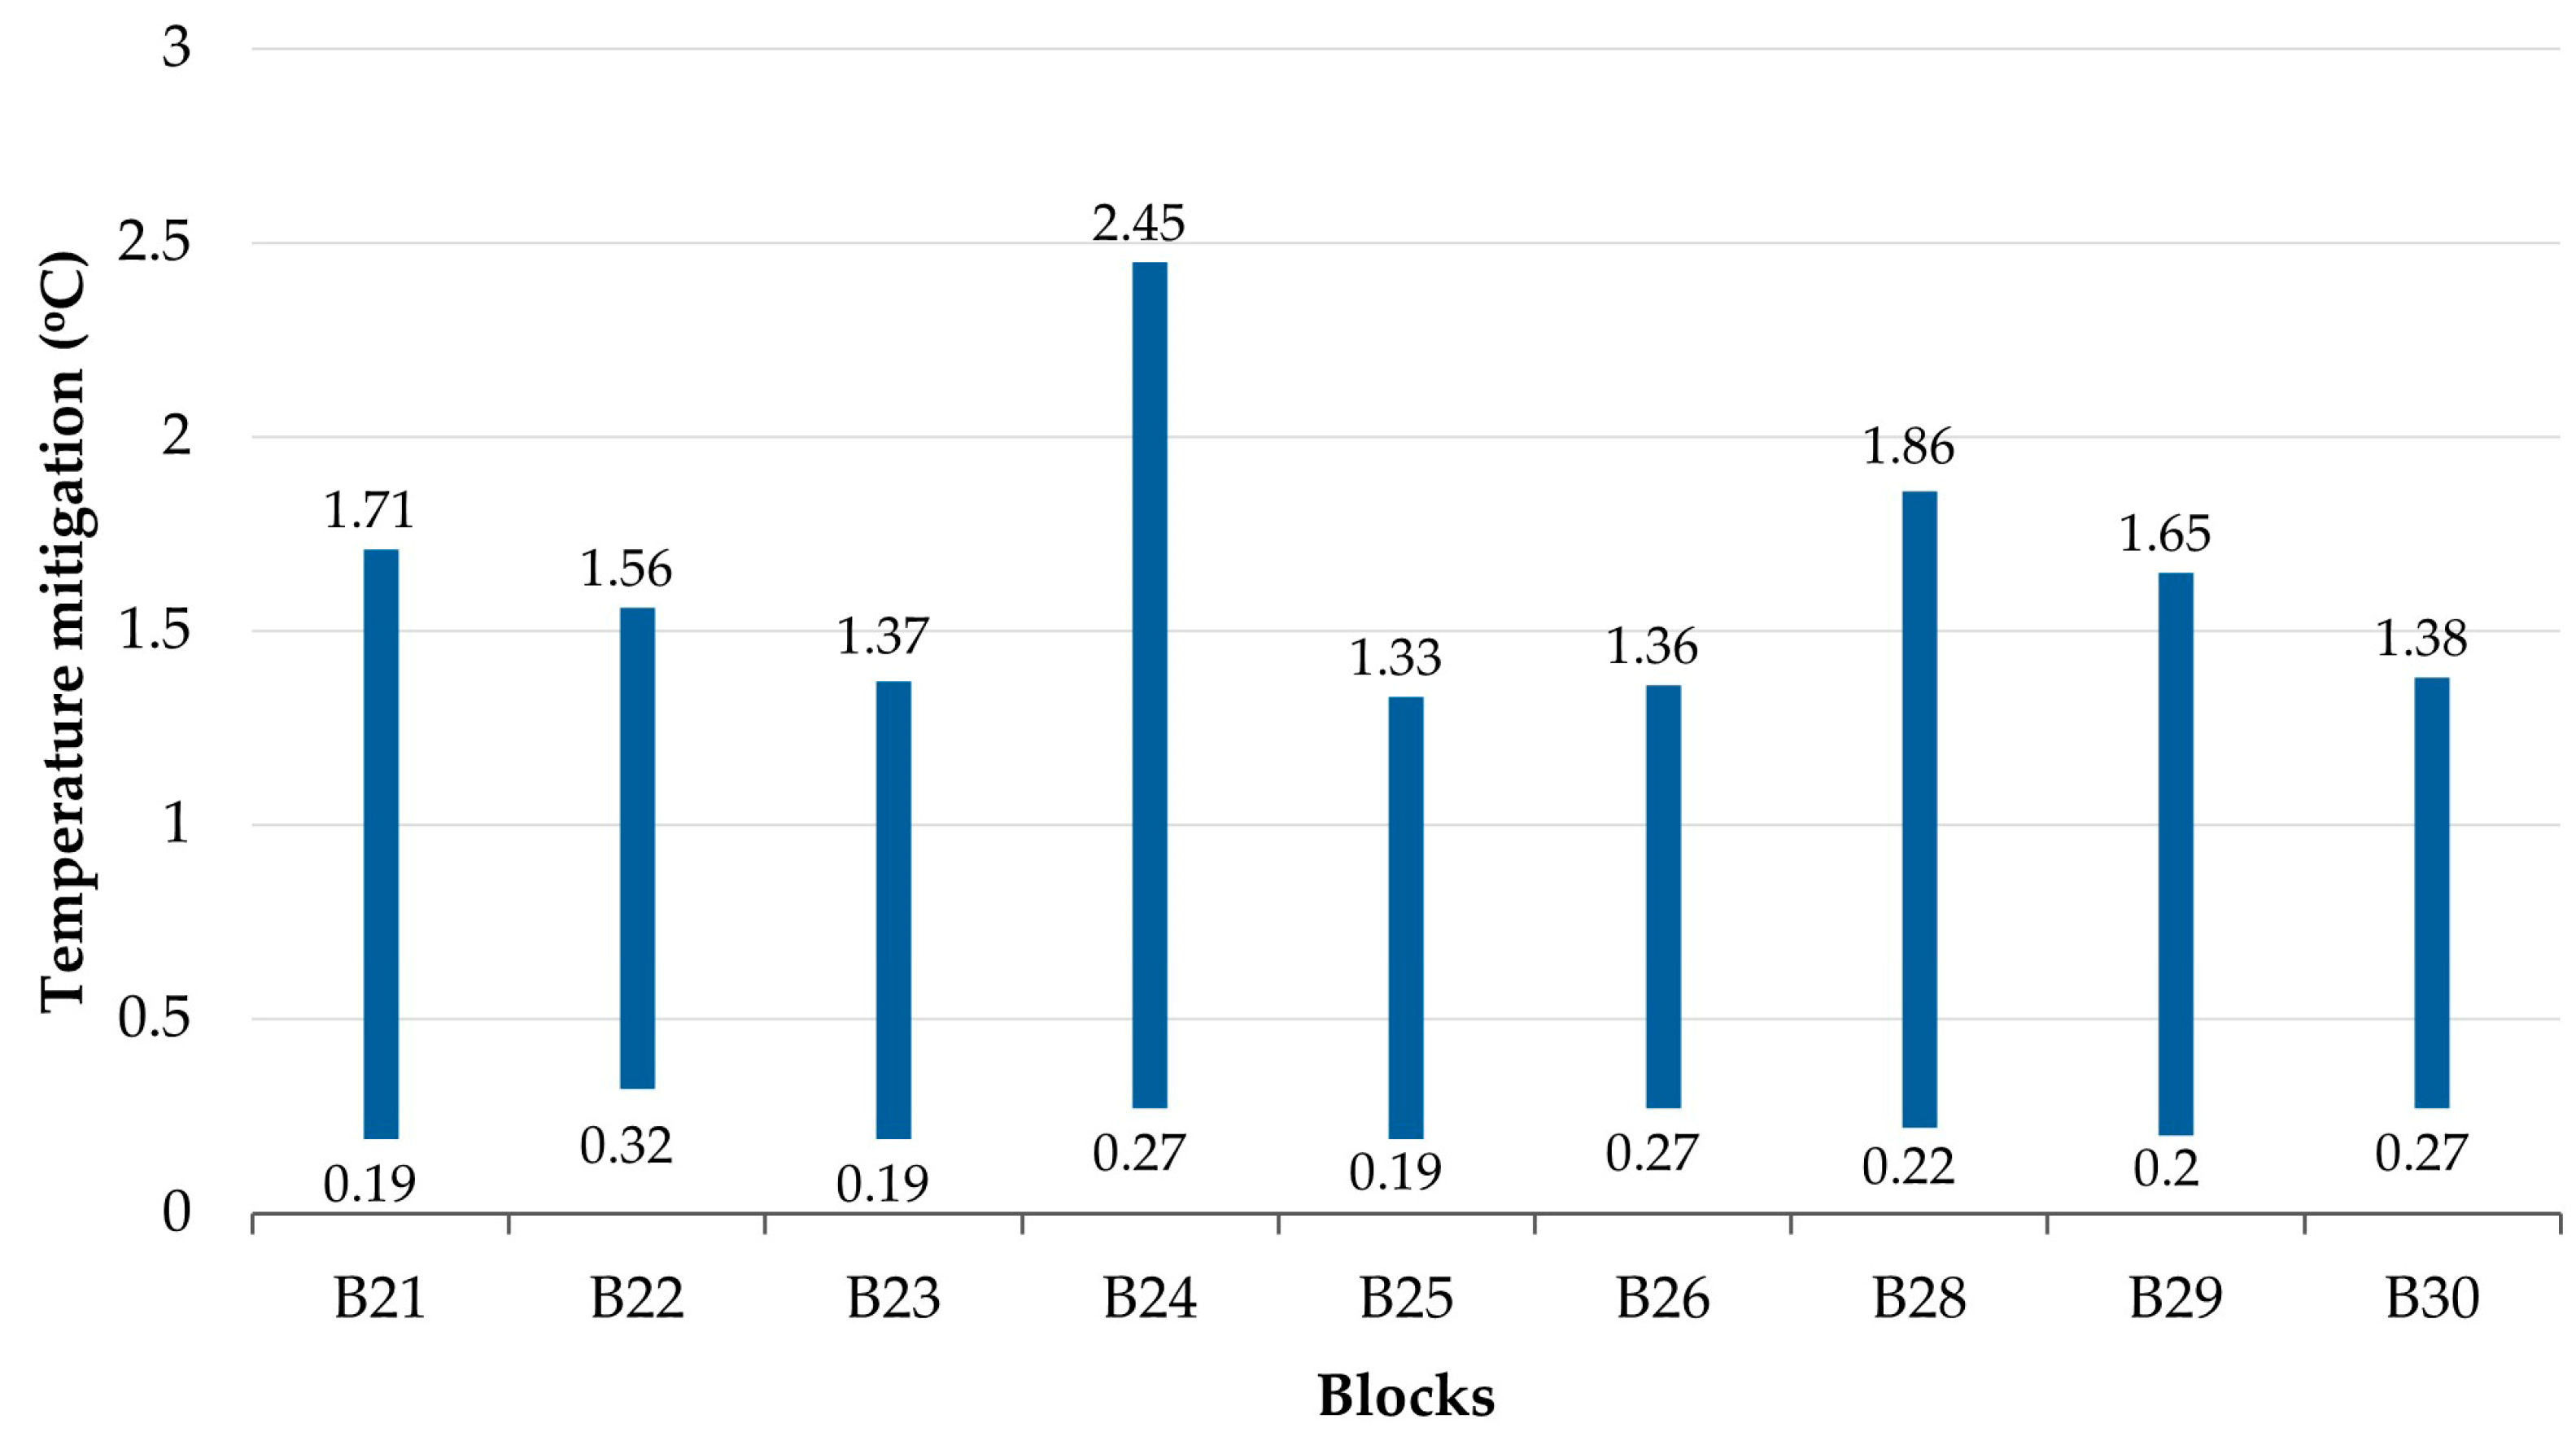
Compared to the values obtained from the Simulation 1, it is observed that GI in the blocks reduces the outdoor temperature at the pedestrian level by at least 0.19 °C and up to 2.45 °C. The impact is more pronounced during the day and significantly smaller at night. While maximum temperatures (both with and without GI) were mostly reached around 14:00 h, the maximum differences do not occur at this specific time. Instead, they have a wider range. Similarly, in both simulations, minimum temperatures were observed around 4:00 h or 5:00 h. However, maximum differences in minimum temperature also show a wider range (
Figure 5).
GI provides the most significant temperature correction in Block 24, showing a notable difference compared to all other blocks (a range of 2.18 °C). This is followed by Block 28 (1.64 °C), Block 21 (1.52 °C), Block 29 (1.45 °C), Block 22 (1.24 °C), Block 23 (1.18 °C), Block 25 (1.14 °C), and Block 30 (1.11 °C), with Block 26 (1.09 °C) being the least cooled (
Figure 6).
The 24 h temperature changes within the blocks with integrated GI are as follows: Block 22: 10.86 °C; Block 23: 11.32 °C; Block 25: 11.51 °C; Block 29: 11.71 °C; Block 26: 11.74 °C; Block 30: 12.09 °C; Block 28: 12.15 °C; Block 21: 12.81 °C; Block 24: 13.43 °C. When compared to the state from Simulation 1, it is clear that GI reduces 24 h temperature oscillations within all nine blocks. The greatest oscillation reduction was noted in Block 24 (1.52 °C), Block 30 (1.06 °C), and Block 25 (1.00 °C). Conversely, the least oscillation reduction was observed in Block 22 (0.54 °C), Block 23 (0.56 °C), and Block 29 (0.66 °C). Notably, Blocks 22 and 23 remain the most thermally stable areas, while Blocks 24 and 21 remain the least thermally stable, consistent with Simulation 1.
With GI included, Block 28 still cools the most overnight (reaching a temperature of 29.43 °C), though not significantly more than Block 24 (29.49 °C). The other blocks follow in this order: Blocks 22 and 25 (29.57 °C), Block 26 (29.60 °C), Block 30 (29.65 °C), Block 21 (29.73 °C), Block 29 (29.75 °C), and finally Block 23, which experiences the least overnight cooling at 29.83 °C. GI allowed Block 22 to improve its nocturnal cooling potential, while Block 26 saw a reduction compared to other blocks and Simulation 1.
During the warmest period of the day—at 14:00 h—the temperature is still the highest in Block 24 (42.92 °C), and still the lowest in Block 22 (40.43 °C). In other blocks, the temperature at that time is as follows: Block 21 (42.54 °C), Block 30 (42.13 °C), Block 28 (41.58 °C), Block 29 (41.46 °C), Block 26 (41.34 °C), Block 23 (41.15 °C), and Block 25 (41.08 °C).
GI reduces the maximum average 24 h temperatures in the studied blocks by 0.37–0.76 °C. Even with GI, Block 24 remains the warmest. It is followed by Blocks 21, 30, 29, 28, 27 and 23 (which share the same average value), 25, and 22, with Block 22 still being the coolest in the studied area. When compared to the first simulation, it is evident that GI altered the ranking of blocks by decreasing temperatures, especially for those in the middle range (between the warmest and coolest). Specifically, GI reduced the maximum average 24 h temperature in the blocks as follows: Block 21: by 0.48 °C; Block 22: by 0.53 °C; Block 23: by 0.41 °C; Block 24: by 0.76 °C; Block 25: by 0.52 °C; Block 26: by 0.37 °C; Block 28: by 0.57 °C; Block 29: by 0.44 °C; and Block 30: by 0.49 °C. Despite experiencing the greatest reduction, Block 24 still remained the warmest on average.
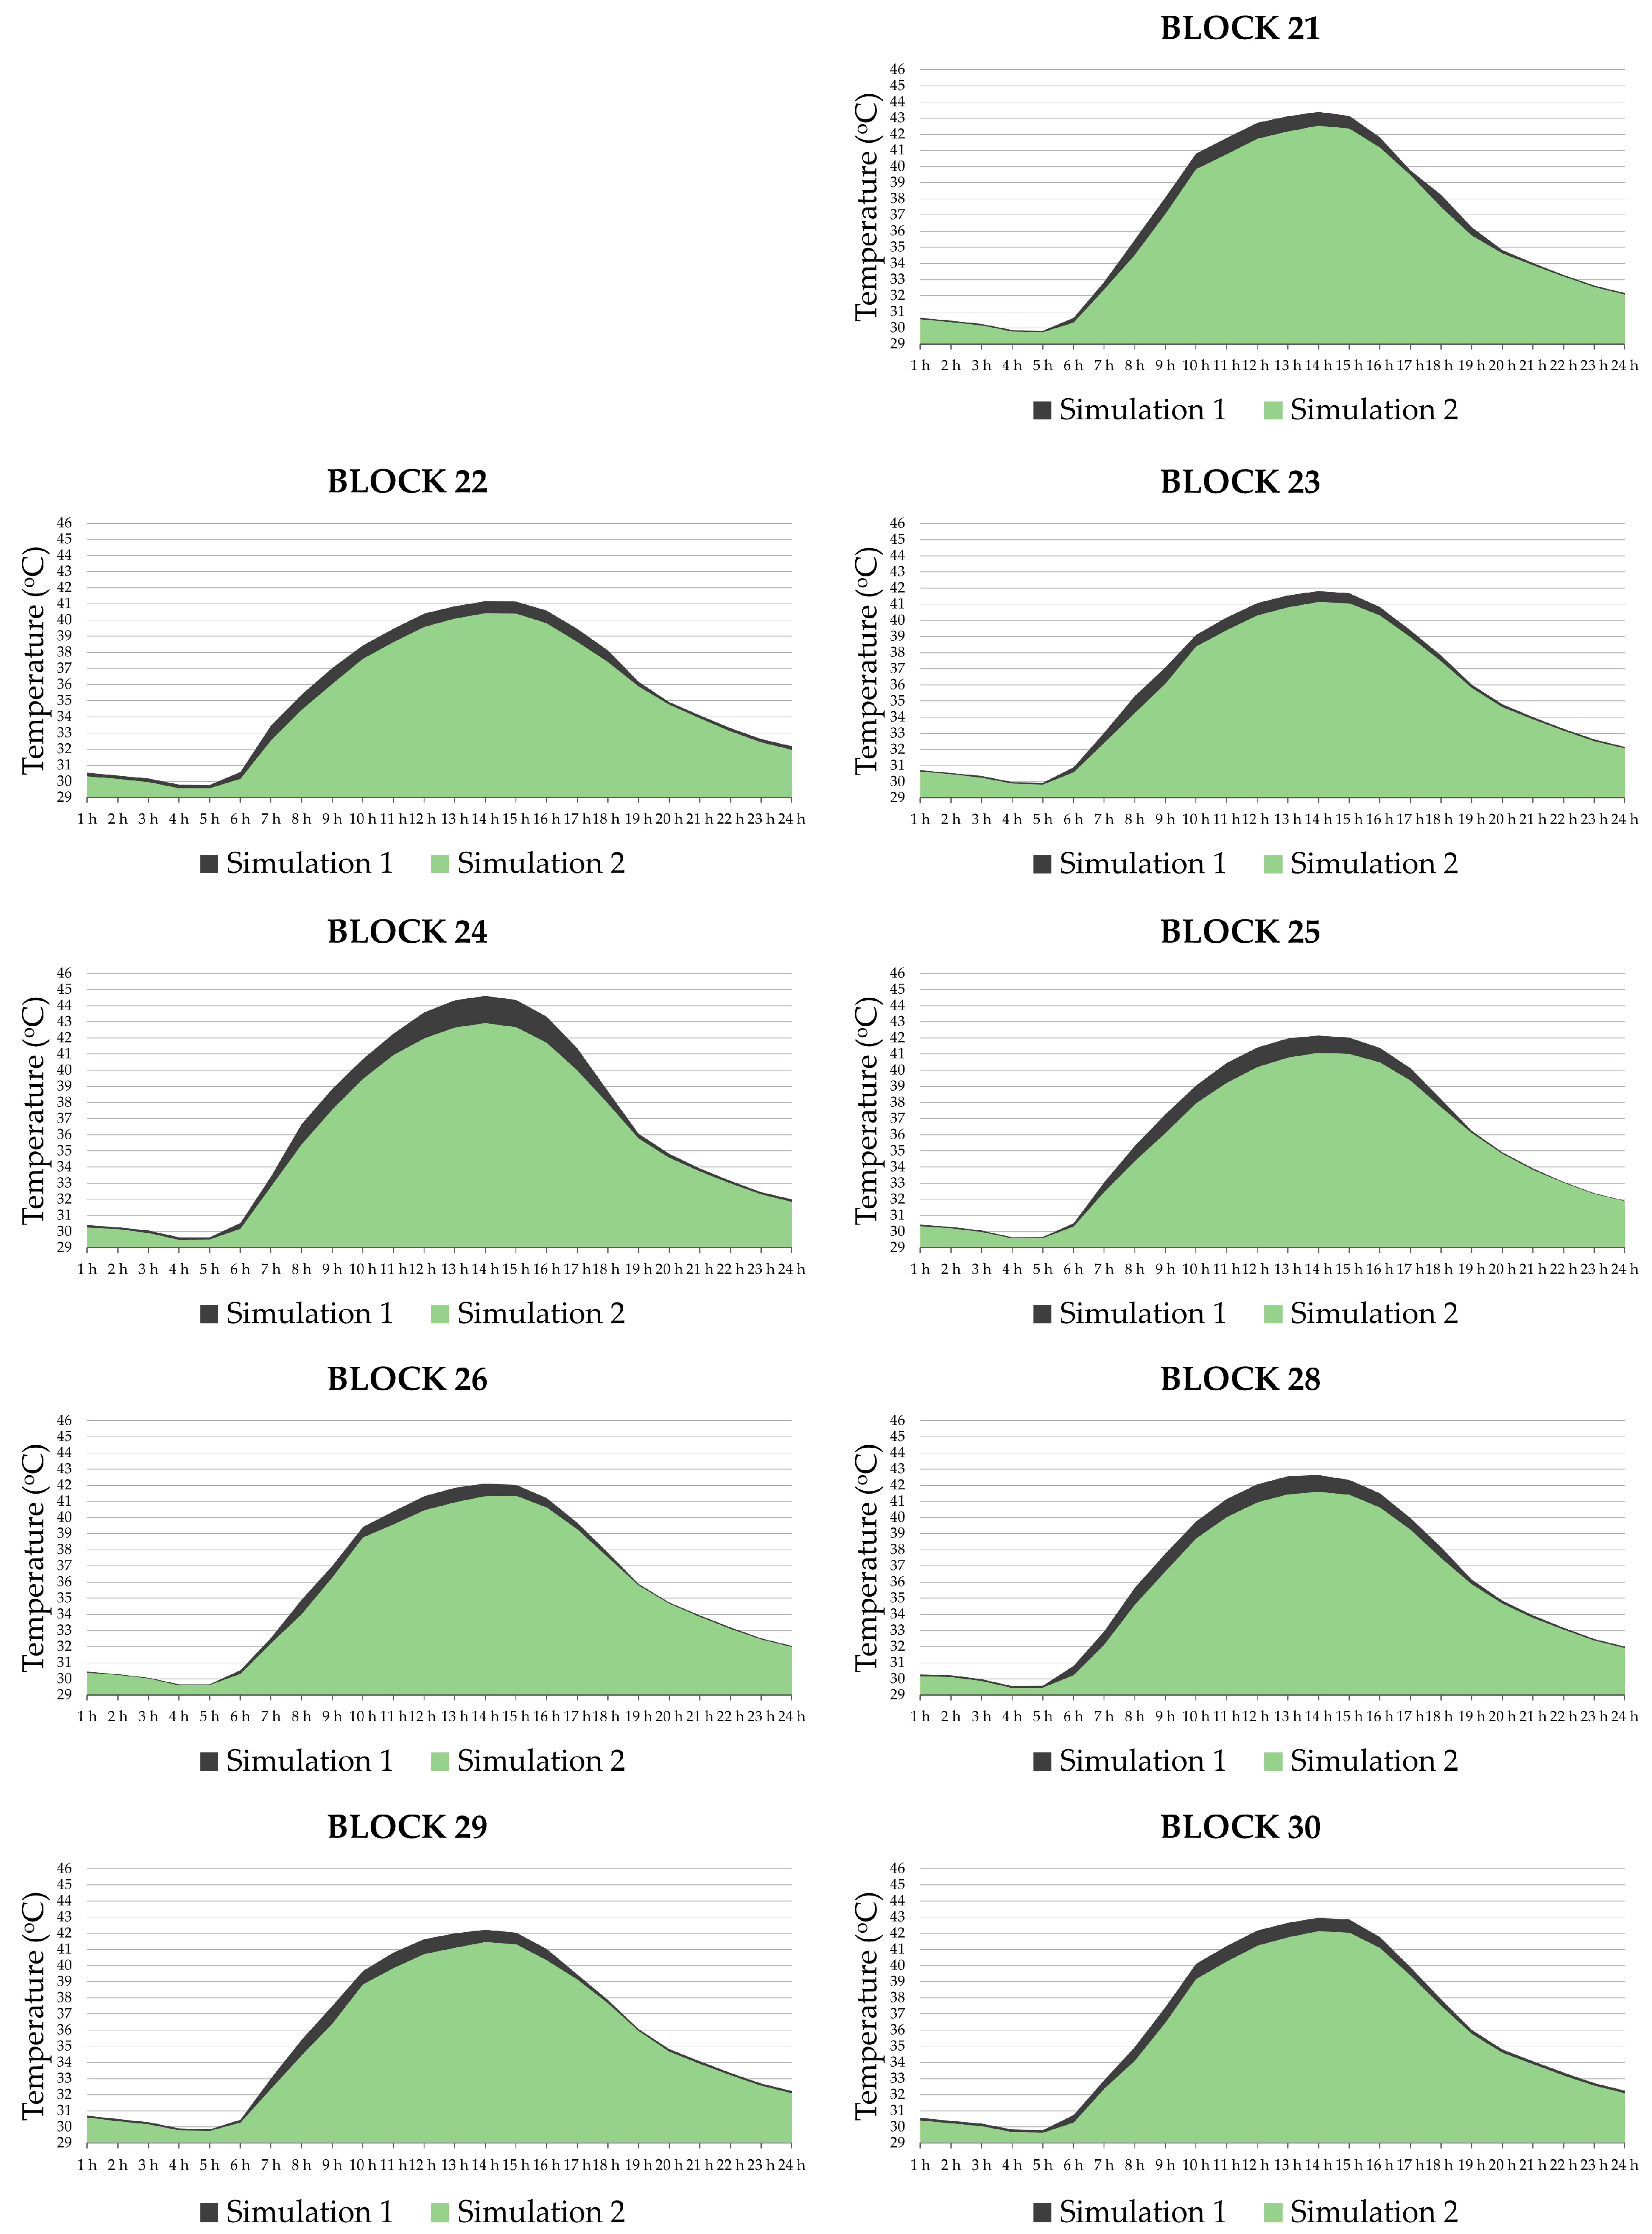
Figure 7 compares 24 temperature variations in Simulations 1 and 2.
In summary, GI mitigated the differences in maximum temperatures. While this range was up to 3.42 °C in Simulation 1, it is now 2.49 °C with greenery. Furthermore, the range of 24 h temperature changes was also reduced in Simulation 2, dropping from 3.55 °C in Simulation 1 to 2.57 °C. The range of the average 24 h temperature also decreased to 0.76 °C, as did the range of variations in the coolest temperatures (0.4 °C). Due to obtained values, minimum nighttime temperatures were weighted at 0.5 when rating block characteristics, while the other three characteristics were weighted at 1, consistent to Simulation 1.
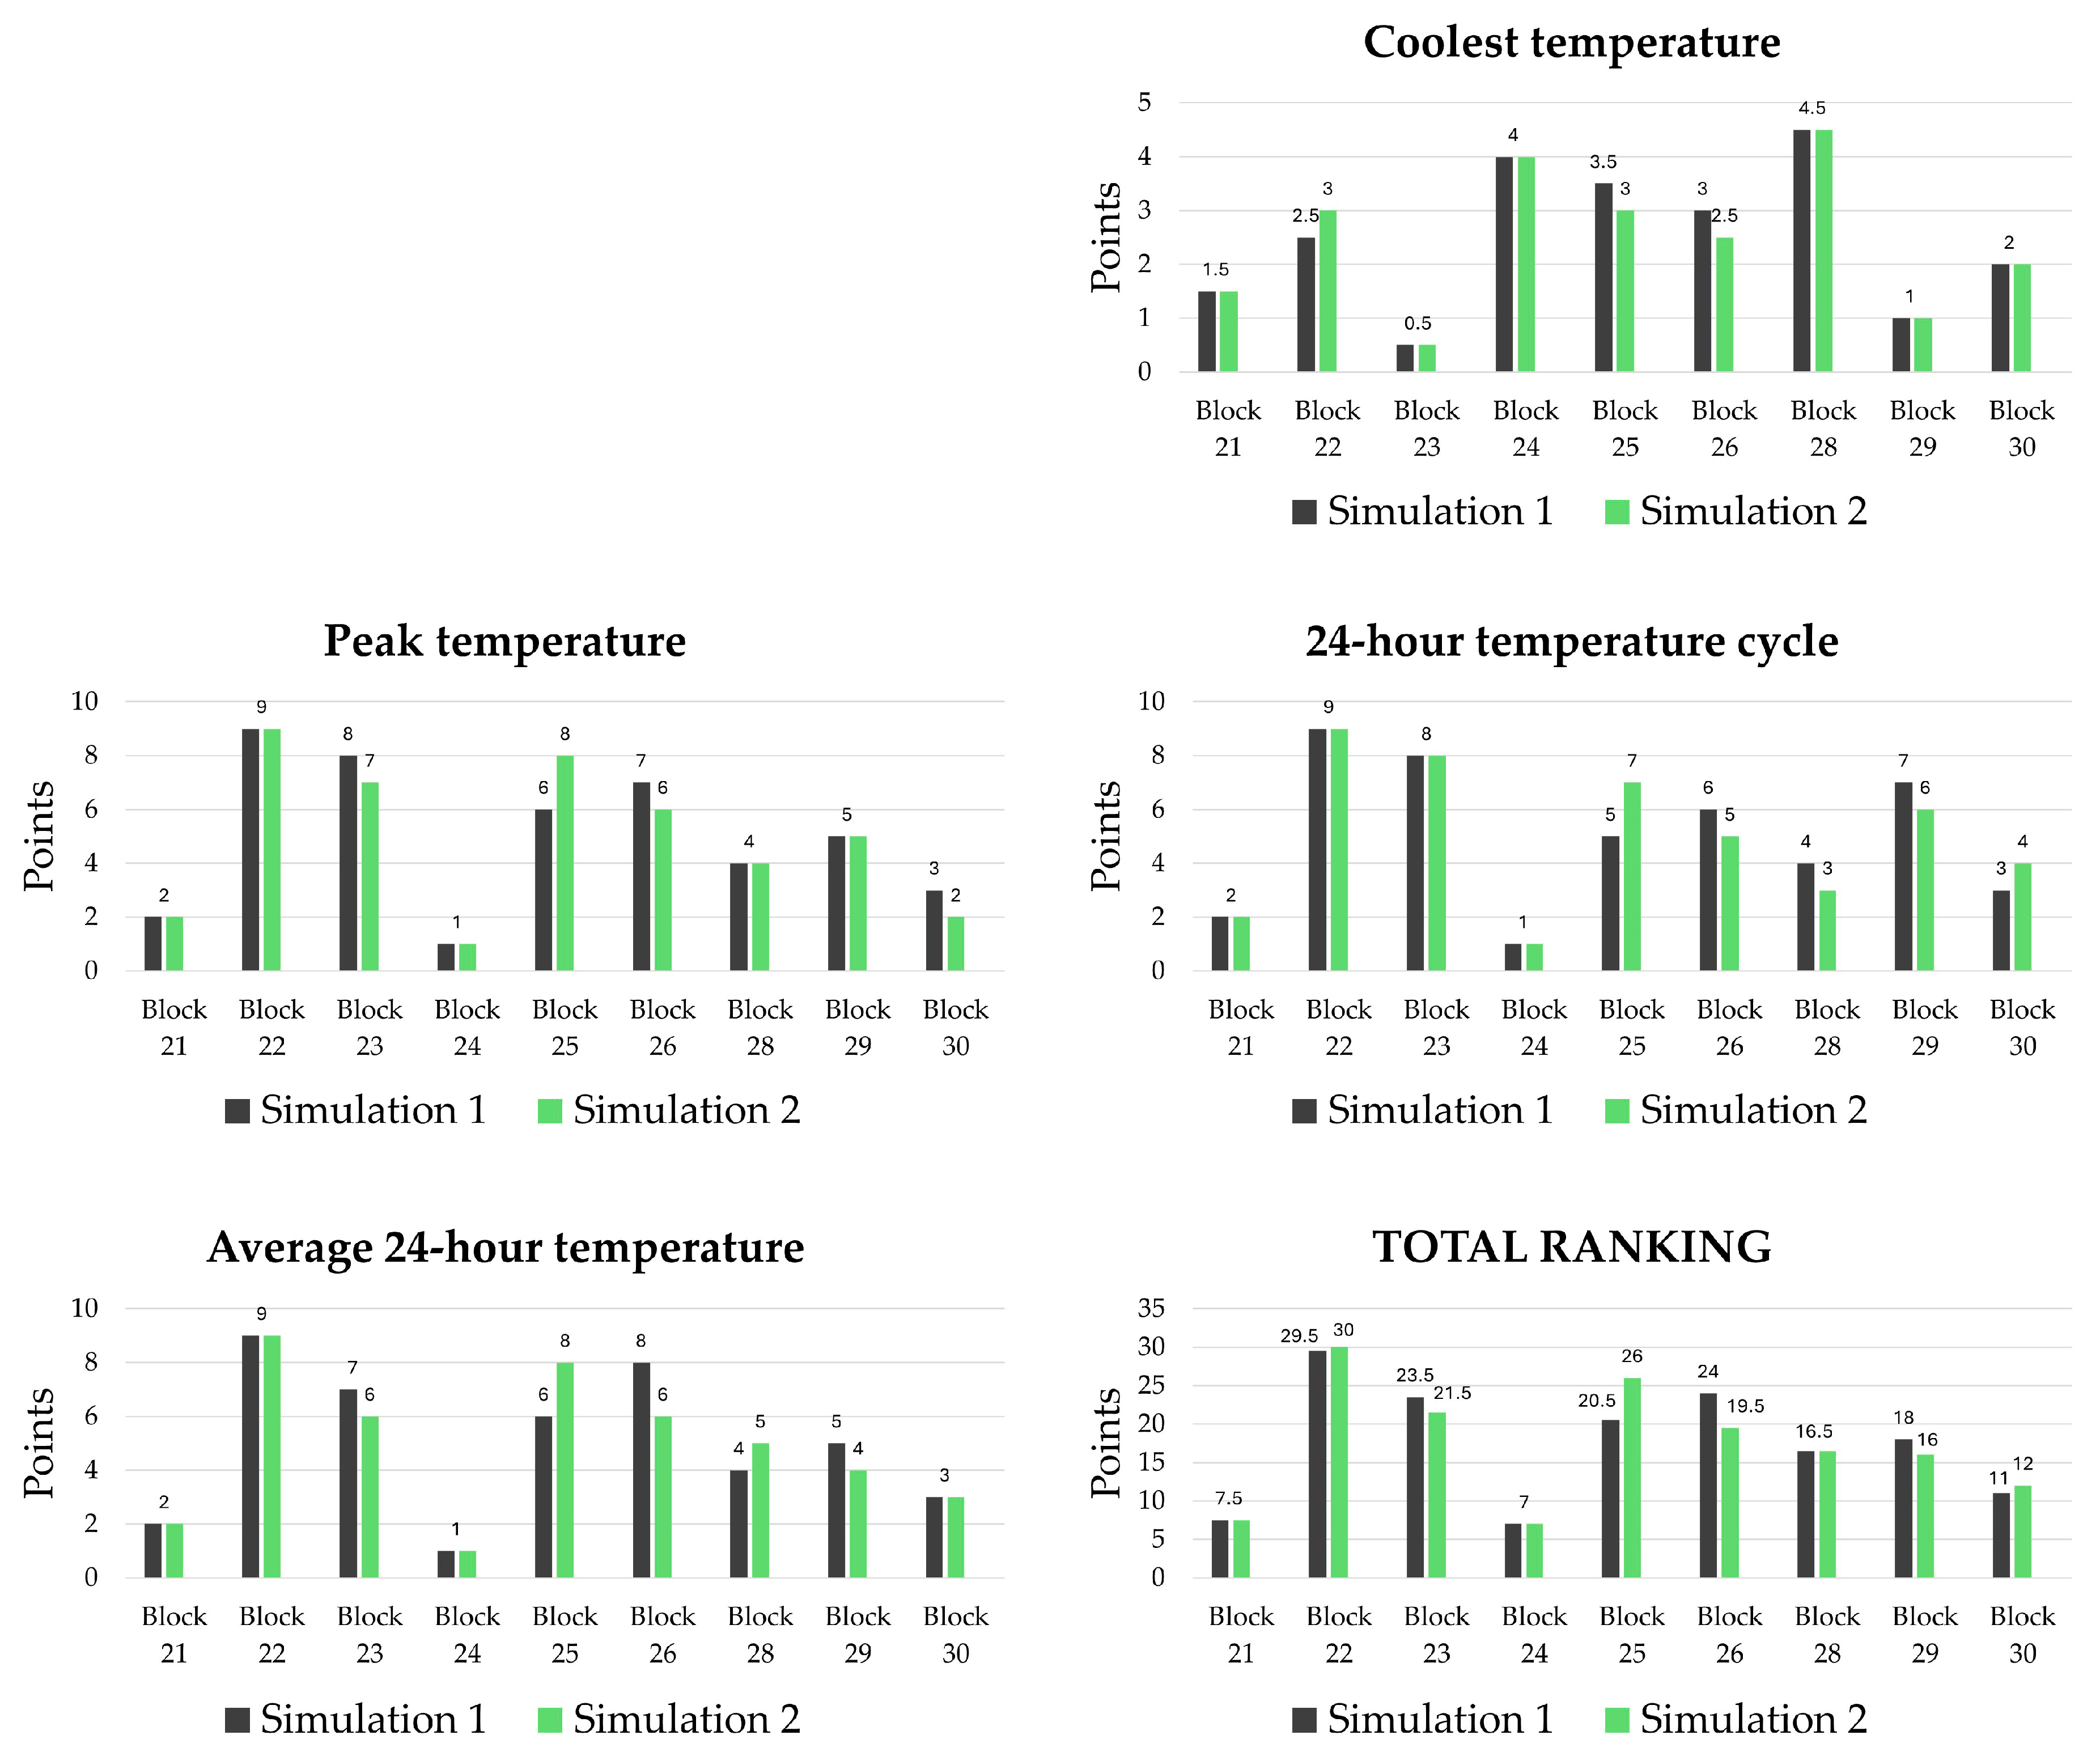
The rating (
Figure 8) indicates that Block 22 demonstrates the most favorable outdoor temperature conditions with 30 points (rated 1st), whereas Block 24 demonstrates the least favorable with 7 points (rated 9th). The scoring of other blocks is as follows: Block 25: 26 points (rated 2nd); Block 23: 21.5 points (rated 3rd); Block 26: 19.5 points (rated 4th); Block 28: 16.5 points (rated 5th); Block 29: 16 points (rated 6th); Block 30: 12 points (rated 7th), and Block 21: 7.5 points (rated 8th).
Block 22 is the best performer both with and without GI;
Blocks 24 and 21 are equally underperforming compared to other blocks, regardless of GI;
Similarly, the ranking of Blocks 23 and 30 remained unchanged compared to Simulation 1;
GI significantly improved outdoor temperature conditions in Block 25, elevating it to the second-best performing block. This shift caused Block 26 to drop in the rankings, as the two blocks essentially swapped their second and fourth positions;
Blocks 28 and 29 swapped ranks due to the GI influence, and Block 28 became marginally better;
Overall, Blocks 25 and 28 showed improvement when GI was integrated into Simulation 2.
3.4. Correlation Between GAP and Outdoor Temperatures
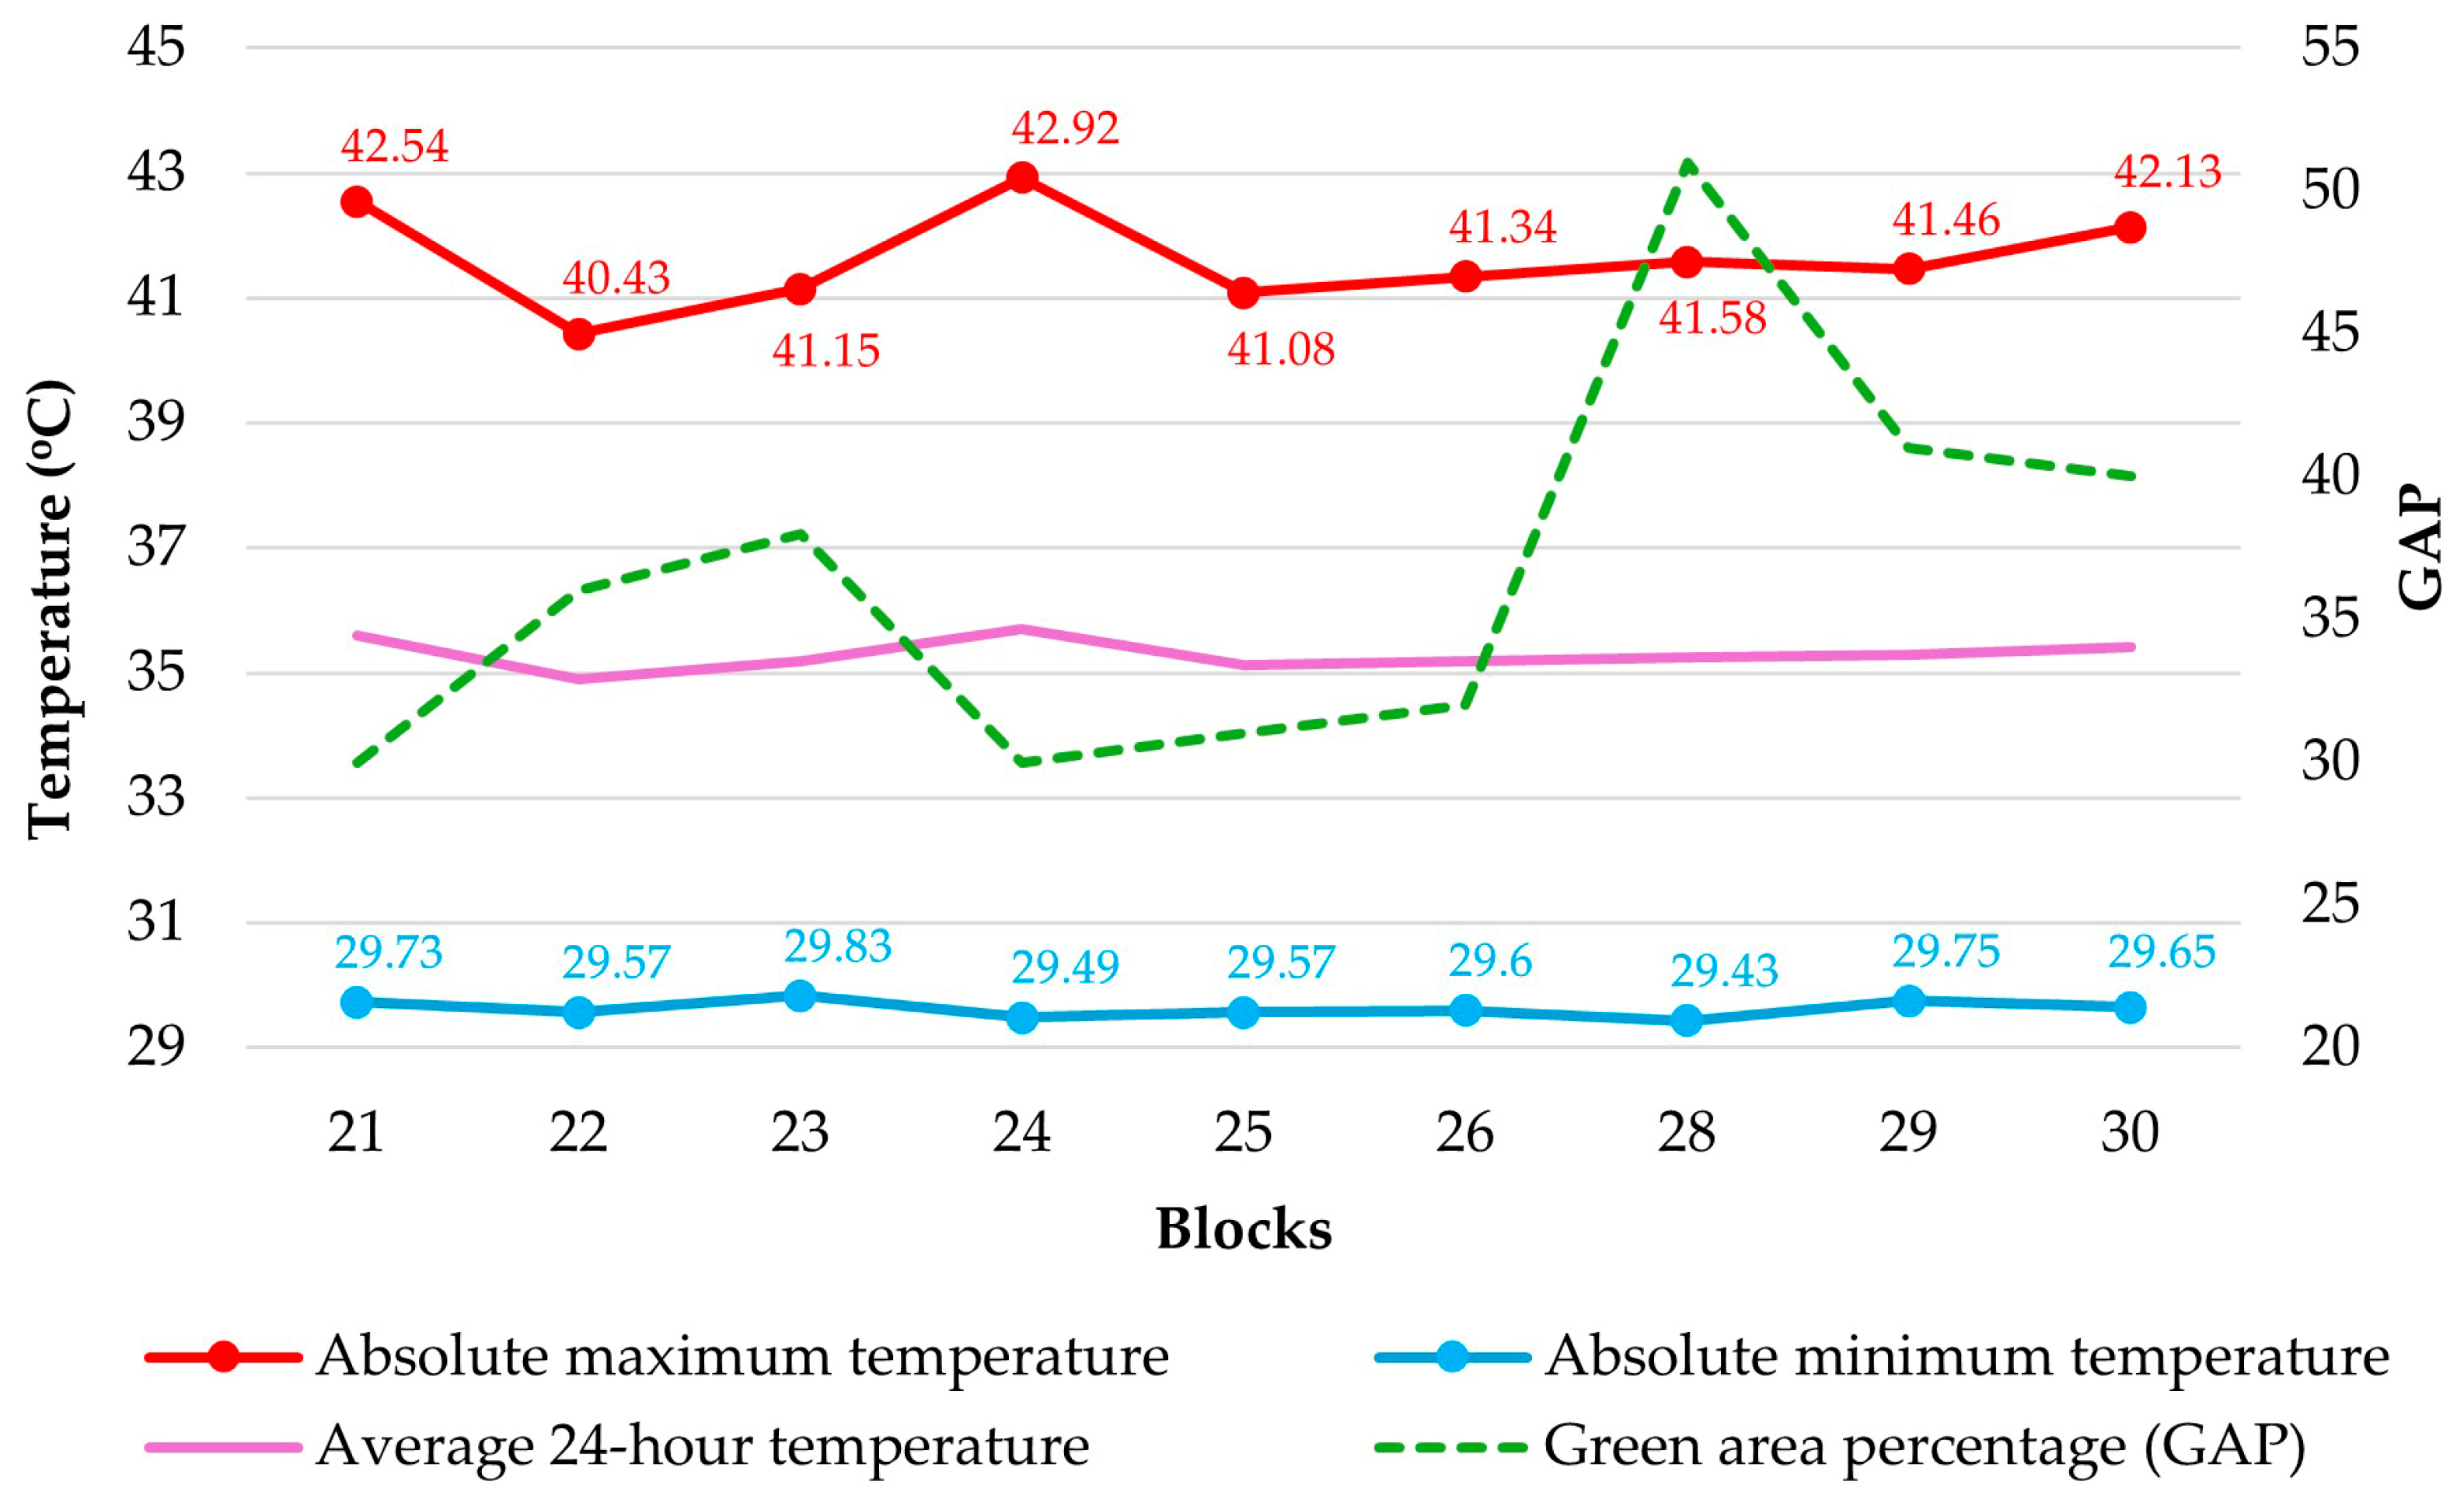
Similarly to Simulation 1, the comparative analysis of minimum, maximum, and average 24 h temperatures across the investigated blocks and their GAP values indicates that the relationship between these parameters is diverse and not reducible to a single defining rule (
Figure 9).
While changes in GAP among the blocks do not significantly impact minimal temperatures, their relationship with average 24 h temperatures, and especially with maximum outdoor temperatures, is more intriguing. Overall, results show that GAP cannot be the sole predictor of thermal performance. For instance, Block 24’s highest maximum temperature value corresponds to the lowest GAP. Conversely, Block 28, despite having the highest GAP of all blocks, does not exhibit the expected lowest maximum outdoor temperature. For comparison, GAP in Block 29 is significantly smaller, yet its maximum temperature value is, albeit slightly, lower. Additionally, Block 29 also has a higher BCR than Block 28.
4. Discussion
This research demonstrates that a block’s thermal behavior is influenced by mutually interconnected characteristics, rendering metrics like Building Coverage Ratio (BCR) or Green Area Percentage (GAP)—whether isolated or combined—insufficient for accurately determining thermal performance. The research showed that urban blocks with identical or very similar BCR and GAP can exhibit highly divergent temperature conditions (e.g.,
Figure 10 and
Figure 11). Such findings corroborate studies [
23,
24,
25], indicating that conventional indicators often fail to capture the subtle spatial and thermal behavior of diverse urban structures, especially under extreme climatic conditions. Yet, urban planning regulations, e.g., the national Rulebook on General Rules for Parceling, Regulation, and Construction [
26], continue to prioritize BCR and GAP as central parameters for urban design and evaluation.
Further discussion is needed to address these discrepancies, and to provide substantiated answers to the following questions:
Why does Block 24 (the lowest-ranked) perform significantly more poorly than Block 25, despite both having identical BCR and very similar GAP?
Why does Block 22 display the best thermal performance when its BCR is among the higher ones, but its GAP is among the lower ones in the studied area? More specifically, why does Block 22 perform better than Blocks 23, 28, 29, and 30, all of which have lower BCR and larger GAP at the same time?
Why does not Block 28 exhibit the best performance, given that it has the largest GAP relative to all other blocks, specifically larger than the best-ranked Blocks 26, 23, 25, and 22?
Finally, why did Block 26’s rating decline after the introduction of GI in the simulation (from 2nd to 4th position)? More precisely, why does Block 26 perform more poorly than Blocks 22, 23, and 25, despite having the lowest BCR?
Analyzing temperature distribution within each block allowed for the identification of specific warmest zones. These zones were consistently found in open, unshaded locations most exposed to direct sunlight. In Block 24, the warmest zone was further exacerbated by a dense row of low-rise singular buildings, which additionally trapped heat and caused the formation of a local heat island—the hottest zone in the entire analyzed area. This directly contributed to Block 24 being the hottest among all investigated blocks, despite notable night cooling due to beneficial wind impact and lower thermal mass, and the GI mitigating effect (as evidenced by Simulation 2) by as much as 2.45 °C. Although BCR and GAP values of Block 24 are highly similar to those of Block 25 (ranked 4th in Simulation 1 and 2nd in Simulation 2), the effect of the micro heat island was decisive for its low score.
Related findings by Zhang et al. reported no evident correlation between the Urban Heat Island Intensity (UHII) and BCR. However, a smaller (approximately 0.1) or larger (above 0.3) BCR can contribute to a lower UHII [
27]. In this study, only Block 26 had a BCR less than 0.1, and indeed, it was ranked second based on calculations from Simulation 1.
Further to the preceding observations, ENVI-met temperature distribution plans generally reveal that exposed, unbuilt micro-locations and areas with low building density and height experience more pronounced diurnal warming. Conversely, blocks’ sections exhibiting higher density and increased building height absorb heat more gradually during the day but release it more slowly overnight, owing to their substantial thermal mass as well as the orientation. In both instances, however, nocturnal cooling potential is influenced by the presence of windward barriers, including adjacent structures, and specific morphological arrangements. The study area offers illustrative examples of both beneficial and detrimental configurations, thereby contributing to a clearer understanding of the block ranking.
The best-performing Block 22 exemplifies the synergistic action of various aforementioned factors (
Figure 12). This block features a highly complex built structure: a dense ensemble of mid-rise, subtly looped meander buildings on the upper southeast, followed by two lateral groups of singular low- to mid-rise structures. Finally, on the northwest bottom, there is a group of more enclosed building types, including hybrid low-rise and mid-rise courtyard, L-shape, and meander buildings constructed in the 1990s as a radial addition to the original 1970s block setting.
The relatively small inter-building distances and the predominant southeast-northwest orientation of the meanders, along with their curved layout, collectively create favorable temperature conditions. This observation is supported by Sadeghian, Tahbaz, and Hakimian’s research [
28], which confirms that curved urban block configurations enhance ventilation and contribute more effectively to UHI mitigation in open spaces compared to linear and cubic forms. Although the spaces between the meanders do warm in the late morning due to their orientation, these buildings effectively shield the inter-spaces from direct solar radiation in the afternoon. Furthermore, the varying shapes and lengths of the meander buildings enhance natural nighttime cooling. Around the dense buildings in the middle of Block 22, temperatures begin to rise in the early evening as wind is channeled from the meander structures.
Simultaneously, in the lower part of this block, building density plays a crucial role, and significant daytime heating is avoided. Here too, temperatures begin to rise in the early evening with the onset of re-radiation, as wind pushes warm air from the upper zone, which then dissipates less readily. However, due to the high density and orientation, the amount of absorbed heat in this section is well-managed and can accommodate warm air from the upper zone without excessive burden.
Thus, the diverse building typologies, coupled with an urban layout that, on one hand, facilitates the penetration of cooling nighttime winds and, on the other, controls daytime heat accumulation, have rendered Block 22 the best performer. This demonstrates that neither BCR nor GAP plays a significant singular role. Concurrently, the temperature distribution across Block 22 is the most uniform, lacking spatial-temporal extremes.
Block 29 features an inverse spatial organization compared to Block 22. Its upper (southeast) boundary is defined by enclosed building forms, while the lower (northwest) section contains mid-rise double linear buildings with small inner courtyards. A large open space dominates the center of the block. Block 29’s thermal performance is inferior to that of Block 22 primarily because the buildings in its upper part have a higher thermal mass, leading to a greater heat load that must be dissipated later. This accumulated heat is subsequently channeled towards the lower zone of Block 29 where the double linear buildings, with their small courtyards, are oriented southwest-northeast. Such orientation critically obstructs wind flow, negatively impacting nighttime cooling, even though this building typology exhibits favorable daytime characteristics.
Conversely, the double linear buildings with small inner courtyards (
Figure 13), characteristic of Block 23, exhibit significantly more favorable thermal diagrams compared to Block 29. This improved performance is primarily attributed to their southeast-northwest orientation and increased height. In fact, among all building typologies across the nine blocks studied, this specific type performs best, even with its longer side exposed to the southwest. During the day, the small courtyards and their surrounding walls function effectively as reservoirs of cool air, preventing direct solar radiation from reaching them. On the warmest part of the day, temperatures within these courtyards are consistently the lowest among all simulated temperatures across the nine blocks. While heat accumulated in the thermal mass of this building type is released during the evening and nighttime, raising the courtyard temperatures, it does not exceed that of the immediate vicinity. Crucially, by as early as 03:00 h, the temperature within the courtyards once again drops below the ambient temperature of their immediate surroundings, initiating a new internal cooling cycle. Therefore, this typology proves beneficial for both indoor and outdoor thermal comfort.
Nevertheless, challenges arise within other sections of Block 23, particularly its central and upper zones. The spatial arrangement of buildings in these areas creates an impediment to the wind flow, which is essential for cooling. Consequently, Block 23 exhibits inferior performance compared to Block 26, which illustrates a direct relationship between a lower BCR and cooler temperatures, and likewise underperforms relative to the top-ranked Block 22.
Block 28, which boasts the highest GAP among all investigated blocks, is nonetheless ranked among the middle-performing blocks. This ranking is primarily due to its spatial organization and building typology. Specifically, a large meander structure defines its upper, southeast side, open towards the northwest but enclosed on the other three sides. While the positive impact of its vegetation is evident, heat accumulates within the meander’s interior, dissipating with difficulty both from the meander itself and subsequently from the block, as air movement is obstructed. Additionally, a heat island effect emerges in this block at the boundary with a major traffic intersection, further demonstrating the temperature-related consequences of high exposure.
All blocks that outperform Block 28—namely Blocks 22, 25, 23, and 26—possess more optimal spatial organization in their upper southeast sections. This implies that their building geometries and inter-building arrangements facilitate more efficient penetration of the dominant wind, leading to more effective heat dissipation. The same explanation applies to Blocks 29 and 30 in comparison to the top-ranked Block 22.
Block 26 warms more significantly during the day than Blocks 22, 23, and 25, despite having the lowest BCR of all blocks. This is precisely because it contains a large, exposed surface area not protected by the shade of surrounding buildings, a characteristic seen in other higher-ranked blocks. Furthermore, the introduction of GI in Simulation 2 worsened this block’s ranking compared to Simulation 1. This unexpected outcome is attributed to the GI’s exposed position and the limited number of trees. Conversely, like other exposed and open surfaces, the open areas in Block 26 cool more efficiently at night.
Broader Implications
When the New Belgrade blocks examined in this study were built, the application of bioclimatic principles primarily centered on appropriate orientation and establishing a balance between built and open spaces. Indicators like BCR and GAP were considered key to successful urban modeling. This approach aimed not only to control microclimatic conditions but also to enhance quality of life through the creation of third places in open spaces and abundant vegetation. At that time, climate did not pose the severe threat it does today, thus eliminating the call for specific adaptive design strategies.
However, from today’s perspective, the relatively low urban density within the analyzed New Belgrade blocks and the high temperatures recorded in Simulations 1 and 2 present challenges requiring further investigation. To address this, two supplementary simulations were conducted, drawing upon research by Marković et al. [
22]. The additional simulations focused on a block in central Belgrade (Kalenić neighborhood) featuring a significantly higher BCR (0.4) and a much lower GAP (11.35%) compared to the studied New Belgrade blocks.
Comparing the results of complementary analysis with the best-performing Block 22 revealed that the maximum potential temperature in Block 22 (without GI, recorded at 14:00 h) was 0.58 °C higher than in the Kalenić neighborhood. With integrated GI (Simulation 2), the temperature in Block 22 at 14:00 h was still 0.39 °C higher than in Kalenić neighborhood. This finding suggests that higher urban density can contribute to the reduction in high summer daytime temperatures, even with significantly less green elements. Similarly, a study by Ibrahim et al. [
29] demonstrates that compact and medium-density urban forms exhibit the best overall performance across different built typologies. Li et al. [
30], in their study for Beijing, found that the enclosed layout was the most thermally efficient configuration when compared to parallel and semi-enclosed alternatives. The same urban form was confirmed as the best thermally performing by the study of Taleghani et al. [
31] for the Netherlands’ climatic area. Furthermore, Mouada, Zemmouri, and Meziani [
32] revealed that high building density, when combined with interconnected deep streets and substantial street-level vegetation, enhances outdoor thermal comfort and walkability in hot, dry cities. Increasing density appears to be a viable strategy suitable for various climate contexts.
Conversely, nighttime temperatures in both Block 22 and the Kalenić neighborhood were similar (a difference of less than 0.1 °C), confirming a negligible influence of GI during the nocturnal period. It should be noted that this comparison did not explicitly account for UHI effects that can occur in central urban zones, including both Kalenić and the New Belgrade blocks.
Increasing density in the studied New Belgrade blocks as an adaptive strategy is debatable because this area is a protected zone, rich in architectural and urban heritage. Furthermore, the multiple significance of its green open spaces, extending beyond mere climate control, also raises questions about the advisability of increased density. For this reason, further comparisons are crucial to determine if New Belgrade’s thermal conditions can be improved through targeted GI enhancements. A particular challenge for Belgrade’s evolving climate conditions lies in identifying effective design models to reduce high nighttime temperatures, especially in the context of the accelerating trend of increasing numbers of tropical nights.
5. Conclusions
This study delves into the outdoor temperature conditions across nine blocks in central New Belgrade, Serbia. Using ENVI-met microclimate simulation software, we first simulated temperatures without green infrastructure (GI) and then with it.
Our initial simulations uncovered two key insights. First, we found significant differences in maximum, 24 h change, and average 24 h temperatures among blocks, though minimum temperatures varied less. Second, the relationship between these temperature parameters and the Building Coverage Ratio (BCR) proved highly intricate, often contradictory, and not reducible to a simple rule. This means a block’s thermal performance cannot be reliably predicted solely from its BCR.
Simulation 2 results showed that GI helps reduce maximum and minimum temperatures, as well as the average and range of 24 h temperature changes across all blocks, though with varying efficiency. Importantly, the study also revealed that an isolated Green Area Percentage (GAP) assessment is not a reliable indicator of thermal performance on its own.
The positive effect of GI is evident during the day, despite significant differences between blocks in how long this effect lasts and when peak temperature reduction occurs. After 17:00 h or 18:00 h, GI’s cooling effect notably diminishes in all studied blocks. The varying effectiveness of GI likely depends on its type, placement within the block, exposure to solar radiation and wind, connectivity, and relationship with surrounding buildings. All these factors warrant further dedicated study.
Comparing Simulations 1 and 2 based on fundamental parameters, we found that while GI does reduce temperatures, the built structure ultimately dictates the thermal conditions. This is a crucial finding for urban planners and architects. It emphasizes the critical need to carefully consider the characteristics of existing urban structure during any future development or transformation. Consequently, simulations without GI remain valuable, offering reliable predictions about how urban built structure impacts outdoor temperatures. For new developments, GI-free simulations can help identify optimal locations for greening, appropriate building forms, and ideal inter-building distances.
Diving into each block’s temperature plans allowed for detailed microclimatic observations and block-specific analyses. This led to descriptions of both exemplary and challenging building typologies and urban layouts.
During the day, solar radiation played the primary role in temperature distribution and intensity within the blocks. At night, wind, to varying degrees, provided outdoor cooling. Blocks whose spatial organization obstructed air movement relative to the dominant wind direction consistently performed worse than those with less dense buildings on the windward side or designs that did not impede wind flow. The temperature plans for 21:00 h best illustrate the relationship between outdoor temperature and unimpeded wind movement through the block.
We also identified local micro heat islands within the study area, typically in open and highly exposed locations within the blocks. These effects could be intensified by the presence of low-rise buildings. This specific scenario directly contributed to Block 24 being, on average, the hottest block. Generally, open, low-density, and low-rise areas experienced more significant daytime warming. Conversely, higher-density, taller building sections warmed more moderately during the day but cooled more slowly overnight due to their greater thermal mass.
Block 22 achieved the best thermal performance. It stands as a positive example, integrating building geometry, orientation, density, urban layout, and GI to achieve superior outdoor thermal comfort.
Regarding individual building typologies, our analysis showed that the double linear type with small inner courtyards, oriented southeast-northwest, exhibited the best thermal performance. These large structures are rarely built today, suggesting designers might reconsider their potential as models for future development. Additionally, the study revealed that the optimal building layout was elongated along the southeast–northwest axis.
Ultimately, this study highlights the need for urban regulations to move beyond simple metrics and embrace sophisticated, context-sensitive design principles for effective climate mitigation and adaptation.


