Article

Response Mechanisms of Vegetation Productivity to Water Variability in Arid and Semi-Arid Areas of China: A Decoupling Analysis of Soil Moisture and Precipitation

1
School of Geographic Sciences, Xinyang Normal University, Xinyang 464099, China
2
Henan Engineering Technology Research Center for Intelligent Perception and Analysis of Land Surface Ecosystem Health in Huaihe River Basin, Xinyang Normal University, Xinyang 464099, China
3
Key Laboratory of Environmental Change and Natural Disaster, MOE, Beijing Normal University, Beijing 100875, China
4
Institute of Disaster Risk Science, Faculty of Geographical Science, Beijing Normal University, Beijing 100875, China
*
Author to whom correspondence should be addressed.
Atmosphere 2025, 16(8), 933; https://doi.org/10.3390/atmos16080933 (registering DOI)
Submission received: 8 June 2025 / Revised: 28 July 2025 / Accepted: 31 July 2025 / Published: 3 August 2025

Abstract

Arid and semi-arid areas serve a critical regulatory function within the global carbon cycle. Understanding the response mechanisms of vegetation productivity to variations in moisture availability represents a fundamental scientific challenge in elucidating terrestrial carbon dynamics. This study systematically disentangled the respective influences of summer surface soil moisture (RSM) and precipitation (PRE) on gross primary productivity (GPP) across arid and semi-arid regions of China from 2000 to 2022. Utilizing GPP datasets alongside correlation analysis, ridge regression, and data binning techniques, the investigation yielded several key findings: (1) Both GPP and RSM exhibited significant upward trends within the study area, whereas precipitation showed no statistically significant trend; notably, GPP demonstrated the highest rate of increase at 0.455 Cg m−2 a−1. (2) Decoupling analysis indicated a coupled relationship between RSM and PRE; however, their individual effects on GPP were not merely a consequence of this coupling. Controlling for evapotranspiration and root-zone soil moisture interference, the analysis revealed that under conditions of elevated RSM, the average increase in summer–autumn GPP (SAGPP) was 0.249, significantly surpassing the increase observed under high-PRE conditions (−0.088). Areas dominated by RSM accounted for 62.13% of the total study region. Furthermore, examination of the aridity gradient demonstrated that the predominance of RSM intensified with increasing aridity, reaching its peak influence in extremely arid zones. This research provides a quantitative assessment of the differential impacts of RSM and PRE on vegetation productivity in China’s arid and semi-arid areas, thereby offering a vital theoretical foundation for improving predictions of terrestrial carbon sink dynamics under future climate change scenarios.

1. Introduction

Water is integral to maintaining the normal functioning of terrestrial ecosystems [1]. Within vegetative ecosystems, the hydrological cycle exerts a direct influence on plant physiological and ecological processes by modulating interactions among the atmosphere, soil, and vegetation components [2,3]. Specifically, water deficits inhibit vegetation growth, reduce transpiration rates, and diminish photosynthetic efficiency [4], thereby compromising the capacity for carbon sequestration. Gross primary productivity (GPP), which quantifies the amount of carbon dioxide assimilated by vegetation through photosynthesis, serves as a vital metric for assessing vegetation carbon sinks [5]. Understanding the spatiotemporal variability of GPP is essential for elucidating terrestrial carbon cycling dynamics. Variations in terrestrial carbon sinks across the Northern Hemisphere are largely attributed to climate change [6]. Adequate temperature and water availability constitute fundamental conditions for vegetation growth. Through photosynthesis, vegetation absorbs atmospheric carbon dioxide while simultaneously utilizing water via transpiration [7,8]. In the context of global climate change, temperatures have exhibited a pronounced upward trend [9], summer surface soil moisture (RSM) has shown a declining pattern [10], and precipitation displays considerable spatial heterogeneity [11]. Alterations in precipitation patterns significantly influence vegetation carbon uptake [12], particularly in arid and semi-arid areas where water availability is a limiting factor [13].
GPP is influenced by a range of environmental factors, including temperature, solar radiation, RSM, precipitation (PRE), and soil characteristics [14]. The mechanisms governing GPP regulation differ among various ecosystems. In arid and semi-arid ecosystems, despite their sparse vegetation cover and relatively low annual productivity, research has highlighted their significant role in the global carbon cycle [15,16]. This regulatory function is largely mediated by the pronounced effect of soil moisture on carbon sink capacity [17]. Notably, in these dry regions, RSM imposes a more substantial constraint on vegetation productivity than temperature [18]. This limitation manifests primarily in two ways: first, as a critical factor for plant photosynthesis, increased soil moisture markedly enhances GPP [19]; second, by influencing ecosystem water use efficiency—defined as the ratio of GPP to evapotranspiration (E)—RSM governs its spatial distribution patterns [17,20]. Within the arid and semi-arid areas of China, vegetation productivity displays distinct spatiotemporal variability. Chang’s research identified an asymmetric pattern in vegetation productivity across this area, with this asymmetry intensifying over time. RSM exerts a more pronounced effect than PRE on the spatiotemporal characteristics of this asymmetry [21]. Moreover, RSM significantly impacts both the mean values and variability of long-term net carbon and water fluxes. The dynamics of RSM are crucial in mediating the trade-off between carbon assimilation and water resource availability, while also modulating fluctuations in terrestrial PRE minus E [22]. Temporally, the most substantial influences on GPP dynamics occur during summer—the peak GPP period—and spring [23]. The association between RSM and GPP is particularly robust, as evidenced by several key observations: precipitation primarily affects GPP through its modulation of RSM [23]; interannual variations in RSM and GPP exhibit strong coherence [24]; and deficits in RSM result in disproportionately large declines in GPP [24]. This seasonal response pattern underscores the importance of RSM variability as a critical factor for elucidating the coupling mechanisms between carbon and water cycles in arid and semi-arid ecosystems.
Ecosystem GPP is fundamentally governed by the amount of absorbed photosynthetically active radiation (APAR) and the efficiency with which this radiation is utilized, known as light use efficiency (LUE) [25]. Consequently, remote sensing approaches for estimating GPP predominantly employ models based on the LUE framework [26]. Among the currently available remote sensing GPP datasets, the most extensively utilized and regularly updated are the GOSIF GPP dataset—derived from global OCO-2-based solar-induced chlorophyll fluorescence measurements—and the MODIS GPP product (MYD17A2H) from the Moderate Resolution Imaging Spectroradiometer. Empirical studies have demonstrated that the GOSIF dataset exhibits superior accuracy in GPP estimation [27]. This enhanced performance is attributed to GOSIF’s capacity to directly capture photosynthetic activity variations via solar-induced fluorescence signals, which are not discernible through conventional vegetation indices based on apparent canopy characteristics [28]. In arid and semi-arid areas where vegetation exhibits relatively uniform and indistinct apparent characteristics, the GOSIF dataset proves particularly effective for characterizing GPP variation patterns across China’s drylands.
Recent investigations into global dryland ecosystems have substantially enhanced our comprehension of the relationships between moisture availability and GPP. In Central Asia, Yu et al. utilized solar-induced fluorescence (SIF) data to demonstrate that RSM predominantly drives reductions in GPP during severe drought episodes, with pronounced effects observed in grasslands and sparsely vegetated areas [29]. Dang et al. reported that temperature exerts a greater influence than RSM on GPP across approximately 60% of global vegetated areas; however, this trend reverses in arid and semi-arid areas, where RSM assumes greater importance [18]. Xu et al. identified the vapor pressure deficit (VPD) as the principal limiting factor for GPP at 60% of global flux measurement sites, although RSM becomes the dominant constraint under extreme drought conditions [24]. Furthermore, Liu et al. established that RSM critically regulates both PRE partitioning and E processes, thereby exerting dominant control on water use efficiency across more than 60% of terrestrial ecosystems worldwide [19].
Despite these advances, significant knowledge gaps persist regarding the coupled hydrological controls on GPP within China’s distinctive arid and semi-arid ecosystems, which exhibit wetting trends contrary to the global pattern of drying. Unlike the widespread global drying observed since 2000, arid and semi-arid areas in China have experienced increasing moisture availability accompanied by concurrent rises in GPP, despite inherent variability in PRE [30,31]. This study concentrates on key water resource variables—RSM, PRE, E, and root-zone soil moisture (RUM)—within China’s arid and semi-arid areas. Employing a data binning approach to constrain variations in E and RUM, the research disentangles the interactions between RSM and PRE to assess their respective impacts on summer GPP from 2000 to 2022. To mitigate confounding effects of RUM and E, their standardized anomaly values were restricted within the range of −1 to 1.
The central hypothesis posits that if RSM predominantly governs GPP variability, elevated RSM levels would promote GPP enhancement irrespective of PRE fluctuations; conversely, if PRE primarily drives GPP changes, increased PRE would stimulate GPP growth independently of RSM conditions. The principal objectives of this research are (1) to elucidate the relationships between RSM or PRE and GPP and determine their influence on GPP variability; (2) to decouple the interdependence between RSM and PRE and examine their isolated effects on GPP; and (3) to investigate GPP dynamics across varying aridity gradients and assess the independent impacts of RSM and PRE on GPP under these differing conditions.

2. Materials and Methods
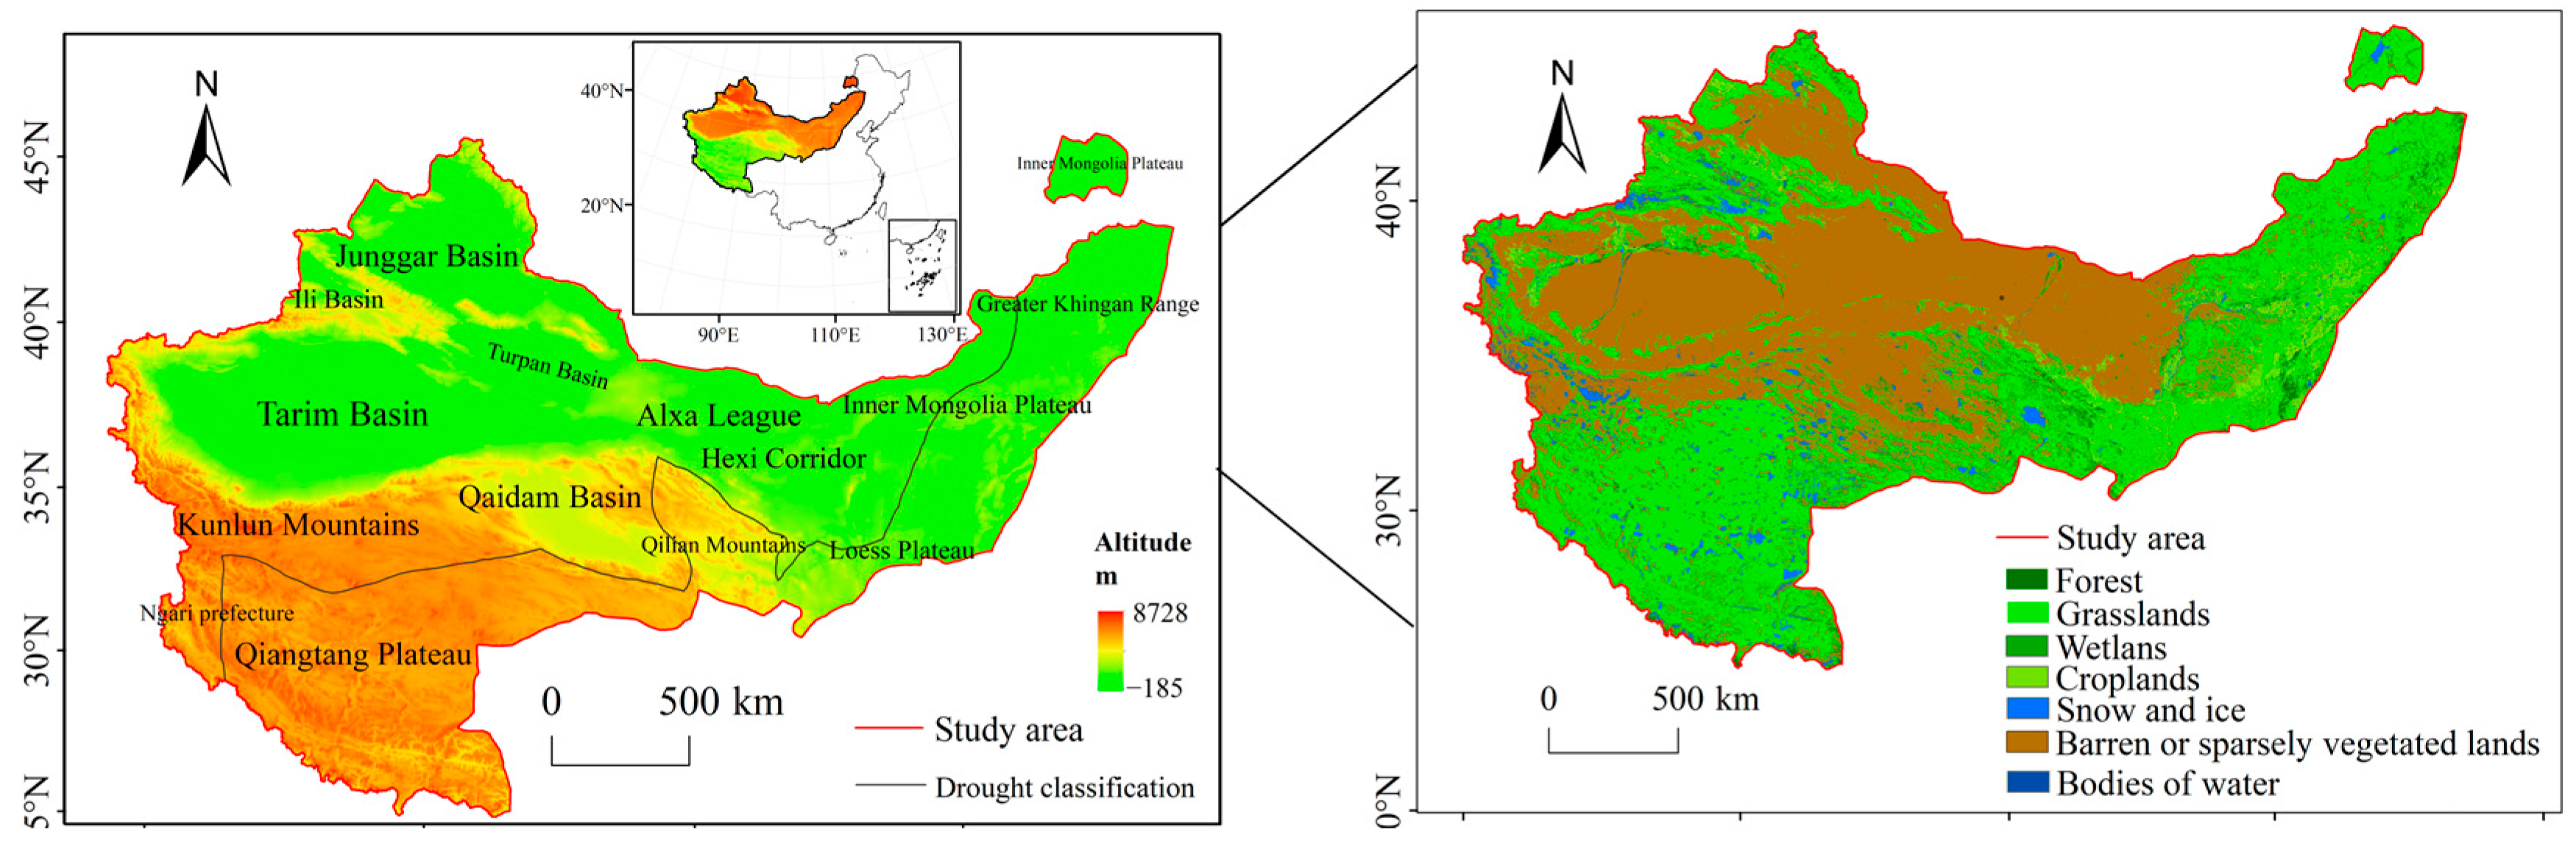
2.1. The Study Area

Based on aridity indices, scholars have delineated China’s climate into four categories: humid, semi-humid, semi-arid, and arid. Areas characterized by semi-arid and arid climates exhibit an aridity index below 0.65 [18]. This investigation concentrates on the arid and semi-arid areas of China, which encompass diverse geographical features such as basins, mountains, plateaus, and plains, with elevations spanning from −179 m to 8535 m. Grassland constitutes the predominant vegetation type within these arid and semi-arid areas (Figure 1), with the primary growing season occurring during the summer months. These areas are therefore integral to the national livestock industry. The study area is largely composed of grassland ecosystems, notably those located on the Inner Mongolia Plateau and within the Tibet Autonomous Region, where agricultural land coverage remains relatively limited. According to data from China Grassland Resources (http://grassland.china.com.cn/, accessed on 14 July 2025), these zones represent the principal natural grassland distributions in northern and western China, with the Tibet Autonomous Region possessing the largest expanse of natural grasslands nationwide, followed by the Inner Mongolia Autonomous Region. Despite prevailing water scarcity, these areas play a critical role in sustaining regional ecological stability, biodiversity conservation, and carbon sequestration processes.

2.2. Data Source

2.2.1. GPP and Land Use Data

This study employed both the GOSIF GPP dataset and the MODIS GPP dataset, spanning the years 2000 to 2022. The GOSIF GPP dataset was generated at a spatial resolution of 0.05° × 0.05° and an 8-day temporal resolution, derived from the global SIF product obtained from the Orbiting Carbon Observatory-2 (OCO-2) and the established linear relationship between SIF and GPP [32,33]. This dataset is particularly valuable for examining photosynthetic activity, carbon cycling, agricultural productivity, and ecosystem responses to climatic variations and disturbances. Additionally, it provides critical insights for ecosystem management and serves as a reference for terrestrial biosphere and Earth system modeling efforts [34,35]. The MOD17A2H Version 6.1 GPP product, distributed by NASA’s Land Processes Distributed Active Archive Center (LP DAAC) at the USGS Earth Resources Observation and Science (EROS) Center, was accessed through the Google Earth Engine platform. Grounded in the radiation use efficiency framework, this product facilitates the modeling of coupled energy, carbon, and water fluxes alongside plant biogeochemical cycles within terrestrial ecosystems. The MOD17A2H V6.1 GPP dataset represents an 8-day cumulative composite with a spatial resolution of 500 m, and the data were acquired in Tagged Image File Format (TIFF).
This research employs the 2000 China Land Cover Map, sourced from the National Tibetan Plateau Data Center (NTPDC). This dataset is derived through the integration of multiple data sources using evidence theory, including China’s 1:100,000 land use data from 2000, vegetation classifications from the 1:1,000,000 China Vegetation Atlas, the 1:100,000 China Glacier Map, the 1:1,000,000 China Wetland Marsh Map, and the MODIS 2001 Land Cover Product (MOD12Q1). The fusion of these datasets produces land cover information for China at a spatial resolution of 1 km for the year 2000 [36]. The resulting land cover dataset preserves the overall accuracy of the original land use data while incorporating detailed vegetation type and phenological information from the China Vegetation Atlas. Additionally, it updates wetland delineations and integrates the most recent glacier inventory data, thereby establishing a more comprehensive and standardized classification framework. The dataset was obtained in TIFF.

2.2.2. Auxiliary Data
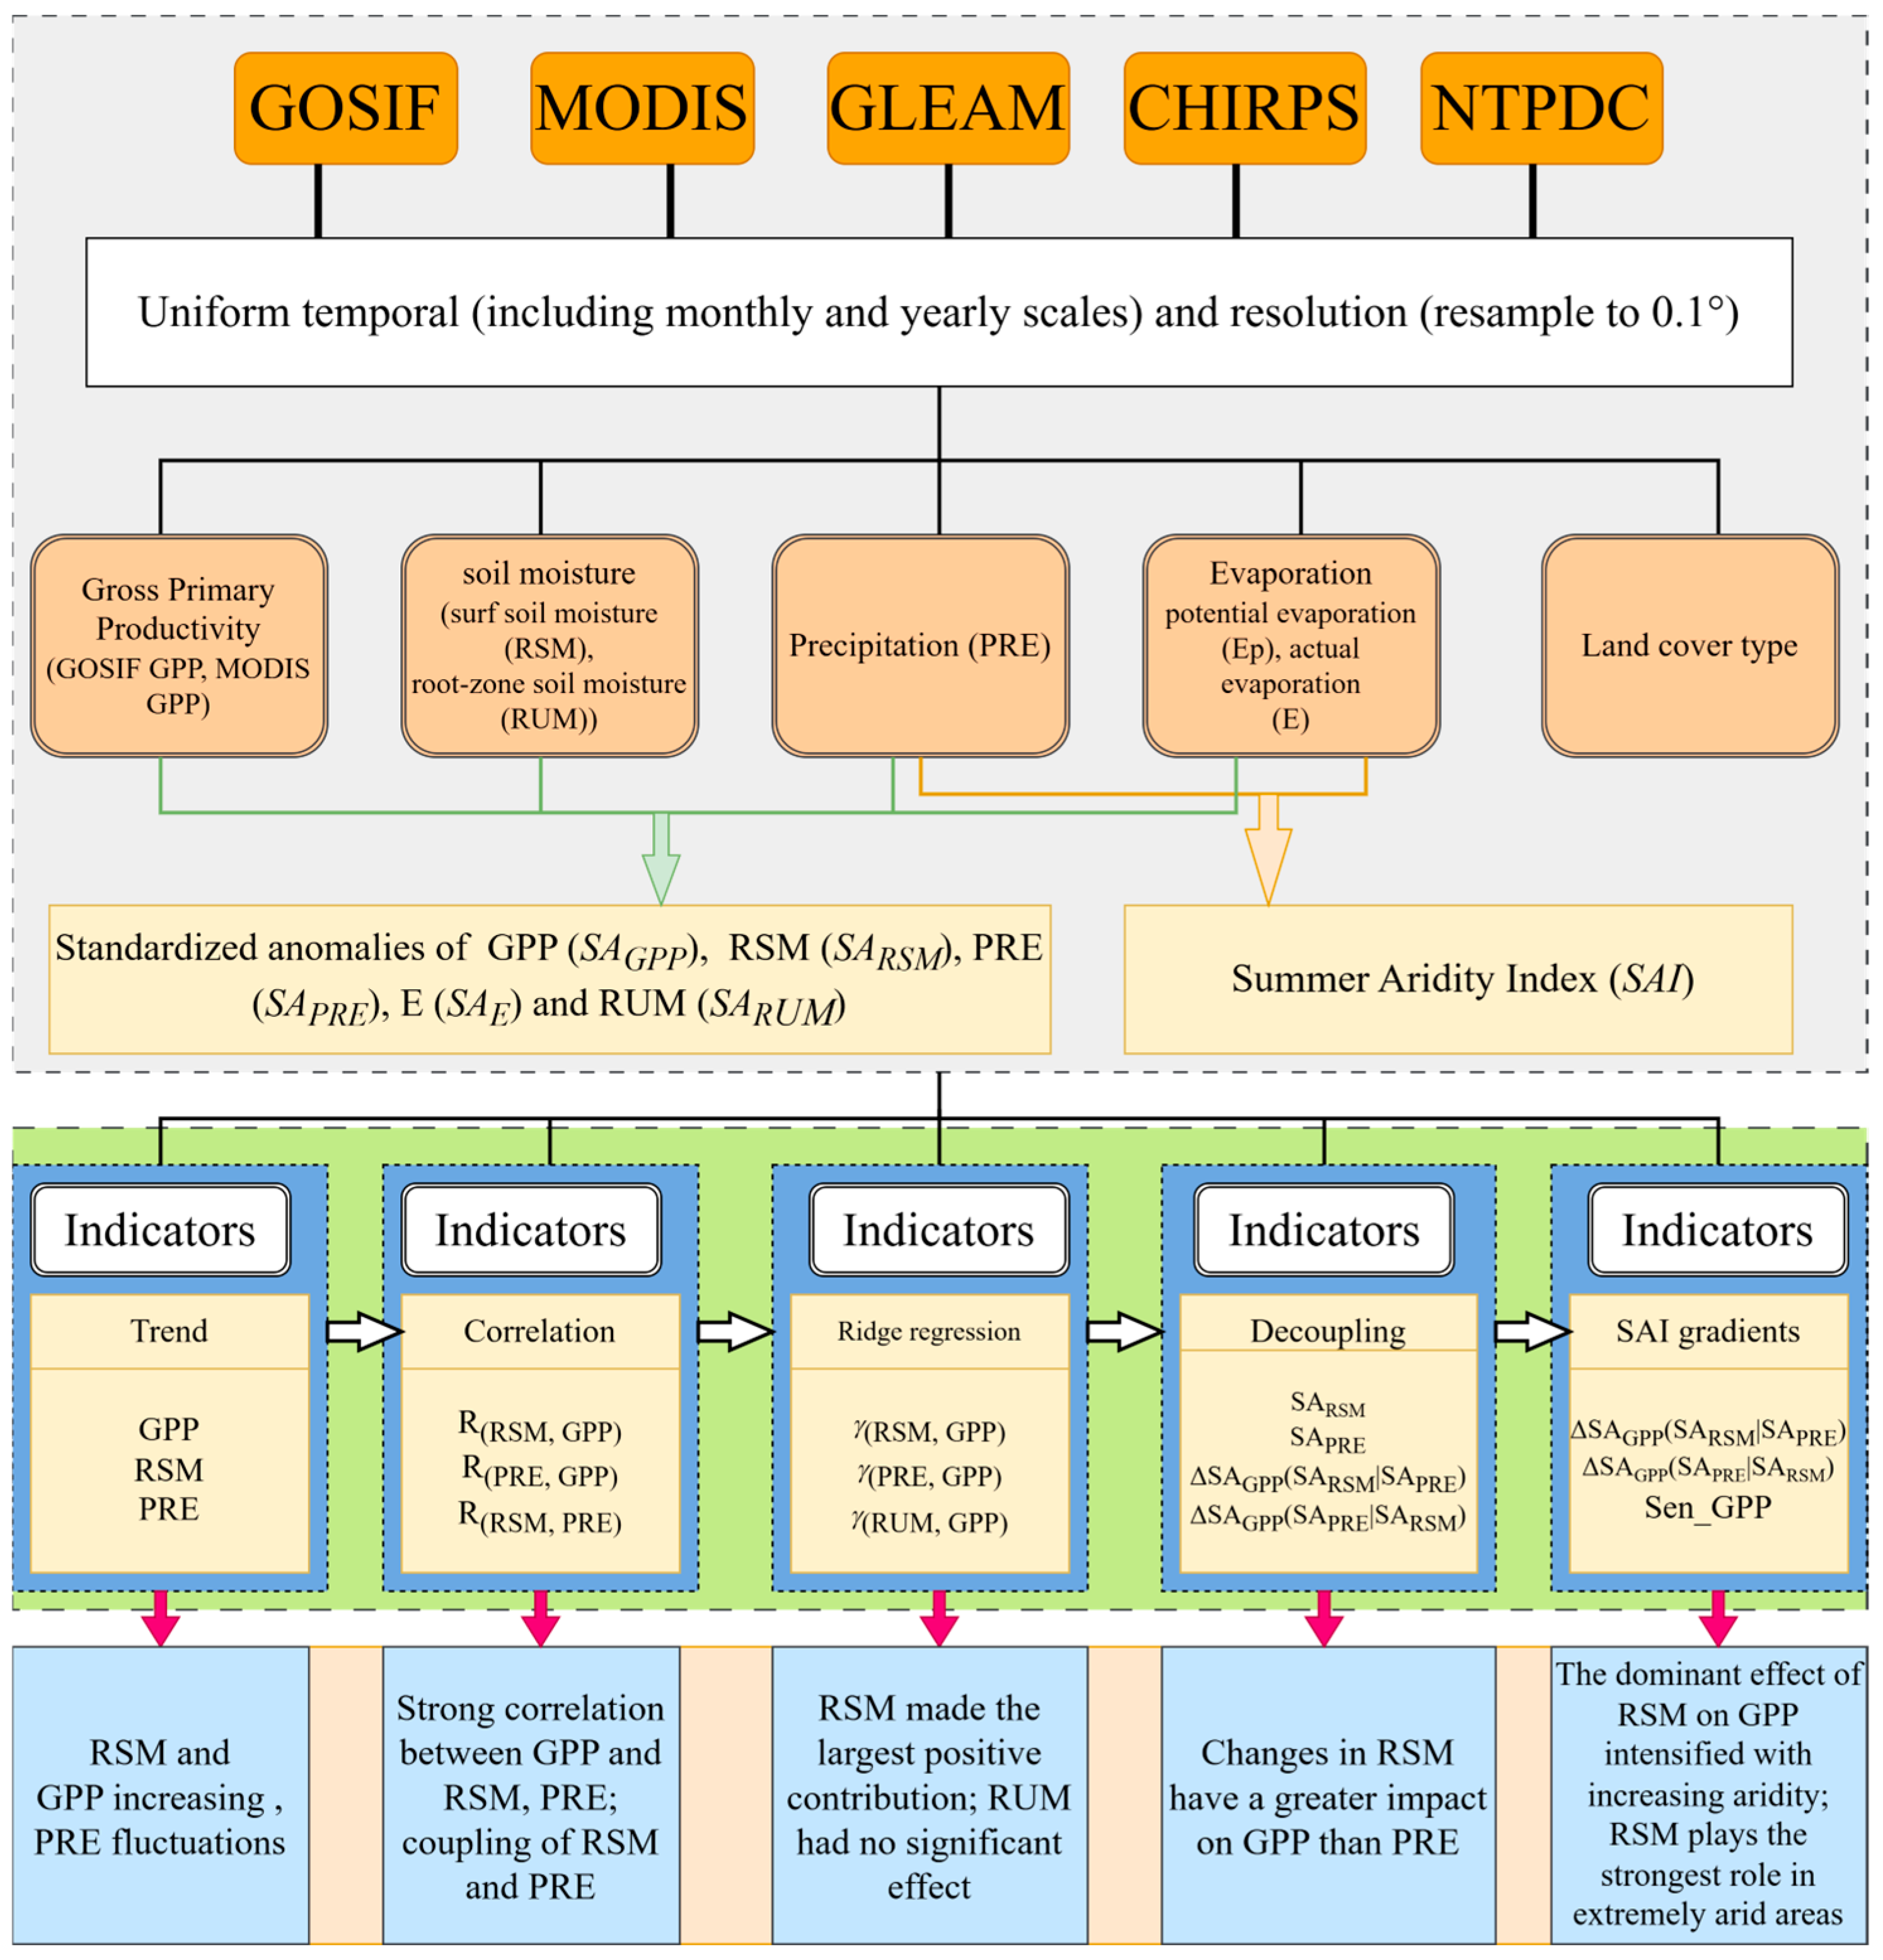
The Global Land Evaporation Amsterdam Model (GLEAM) provides estimates of various terrestrial evaporation components derived from satellite data. Its intermediate outputs include potential evaporation (Ep), actual evaporation—encompassing plant transpiration, bare soil evaporation, and open-water evaporation—RUM, and surface soil moisture. RUM is calculated using a multi-layer water balance approach, while satellite-derived surface soil moisture observations are assimilated into the soil profile to mitigate random errors in forcing data [37]. Central to the GLEAM framework is the Priestley–Taylor algorithm, which integrates diverse independent remote sensing inputs such as vegetation optical depth, soil moisture, and snow water equivalent [38]. Empirical parameters within the algorithm, including the evaporation stress factor and latent heat of evaporation, are informed by multidisciplinary research findings [37]. The GLEAM RSM dataset has been widely applied and demonstrates strong correlations with ground-based observations while maintaining minimal model bias [39]. Notably, studies have demonstrated that at the pixel scale, the GLEAM RSM product more effectively captures warm-season soil moisture dynamics on the Tibetan Plateau [40]. This investigation employs monthly datasets of RSM (0–10 cm), RUM (10–100 cm), and Ep spanning 2000 to 2022, with a spatial resolution of 0.1° × 0.1°. The data were obtained in Network Common Data Form (NetCDF) format.
The Climate Hazards Center Infrared Precipitation with Station data (CHIRPS) represents a quasi-global rainfall dataset encompassing a temporal span exceeding 30 years. By integrating satellite imagery at a spatial resolution of 0.05° with ground-based station measurements, CHIRPS generates gridded precipitation time series tailored for trend analysis and seasonal drought monitoring [41]. Validation studies indicate that CHIRPS precipitation data exhibit a coefficient of determination (R2) exceeding 0.91 when compared with in situ observations in arid and semi-arid areas of China, underscoring its high reliability [42]. The dataset effectively captures monthly precipitation variability and is particularly well-suited for drought assessment application [43]. Consequently, it has been extensively employed in agricultural drought monitoring and urban hydrological modeling contexts [44]. In the present study, CHIRPS summer precipitation data from 2000 to 2022 were utilized, featuring a monthly temporal resolution and a spatial resolution of 0.05° × 0.05°. The data were acquired in TIFF.
In the arid and semi-arid areas of China, the vegetation growing season predominantly occurs during the summer months. The concurrence of elevated temperatures, relatively stable precipitation patterns, and consistent solar radiation during this period renders it particularly conducive for examining the responses of GPP to variations in precipitation and soil moisture. To enhance the robustness of the experimental analysis, separate decoupling assessments of the effects of precipitation and RSM were performed utilizing both GOSIF-derived and MODIS-derived GPP datasets. All datasets were standardized to a monthly temporal resolution and a spatial resolution of 0.1° × 0.1°, with monthly averages for the summer months (June, July, and August) spanning the years 2000 to 2022 selected for subsequent analyses.

2.3. Methods

2.3.1. Aridity Calculation

The Aridity Index is characterized as the ratio between PRE and potential Ep [18]. Given that this research utilizes precipitation and potential evapotranspiration data solely from the summer months spanning 2000 to 2022, the resulting metric is specifically designated as the Summer Aridity Index (SAI).
S A I = i = 6 8 P R E i i = 6 8 P E T i
In the equation, PREi and PETi represent monthly values of summer precipitation and potential evapotranspiration, respectively (i = 6, 7, 8), with units in mm. A higher SAI value indicates a more humid climate. We classified SAI into four levels: hyperarid (SAI ≤ 0.4), arid (0.4 < SAI < 0.75), semi-arid (0.75 ≤ SAI < 0.9), and semi-arid to semi-humid (SAI ≥ 0.9).

2.3.2. Trend Variation and Correlation Analysis

We utilized Theil–Sen linear regression to assess the temporal trends of summer GPP, RSM, and PRE from 2000 to 2022. Theil–Sen regression is a robust method for estimating linear trends, as it calculates the median slope derived from all possible pairwise linear fits among two-dimensional data points [45]. To discern the independent contributions of PRE and RSM to variations in GPP, we implemented a pixel-level partial correlation analysis. This approach enabled us to evaluate the relationship between RSM and GPP while statistically controlling for the effect of PRE. Conversely, we assessed the association between PRE and GPP by accounting for the influence of RSM [18]. The partial correlation was computed using the following formula:
R ( α , β | γ ) = R α β R α γ × R β γ 1 R 2 α γ × 1 R 2 β γ
where R(αβ|γ) denotes the partial correlation coefficient between variables α and β after γ controlling for variable α, while Rαβ, Rαγ, and Rβγ represent the partial correlation coefficient between variables α and β, α and γ, and β and γ, respectively.

2.3.3. Standardized Anomaly

To examine the effects of RSM and PRE on GPP within the context of climate change in China’s arid and semi-arid areas, pixel-level standardized anomalies were computed for PRE, RSM, E, RUM, and GPP. These standardized anomalies quantify deviations from the long-term mean, normalized by the standard deviation derived from the period spanning 2000 to 2022 [46,47,48]. Standardized anomaly calculation:
S A ( η ) ( i , j , t ) = X ( i , j , t ) X ¯ ( i , j , m ) S D ( i , j , m )
where S A ( η ) ( i , j , t ) denotes the standardized anomaly value of variable η (representing PRE, E, RSM, or RUM) at pixel (i, j) and time t; X(i, j, t) indicates the original observed value at pixel (i, j) and time t; X ¯ ( i , j , m ) signifies the summer mean value at pixel (i, j) for year m within the 2000–2022 period; and S D ( i , j , m ) represents the summer standard deviation at pixel (i, j) for year m from 2000 to 2022.

2.3.4. Data Binning

To examine the effects of hydrological variables on GPP within the study region, we conducted data binning on the standardized anomalies of all relevant variables. These standardized anomalies were partitioned into eight intervals: [−2, −1.5), [−1.5, −1), [−1, −0.5), [−0.5, 0), [0, 0.5), [0.5, 1), [1, 1.5), and [1.5, 2]. The primary objective of this research is to assess the responsiveness of RSM and PRE to GPP, as well as to disentangle their individual effects. To reduce confounding influences from E and RUM, the standardized anomalies of SAE and SARUM were restricted to the interval [−1, 1]. Subsequently, within each SARSM bin (i = 1, 2, …, 8), SARSM values were ordered in ascending sequence according to corresponding SAPRE values. Conversely, within each SAPRE bin (j = 1, 2, …, 8), SAPRE values were sorted in ascending order based on SARSM values [18]. This methodological approach ensures accurate alignment among the standardized anomalies of RSM, PRE, and GPP, thereby enabling a rigorous investigation of the distinct influences of RSM and PRE on GPP. The effects of RSM and PRE on GPP were quantified by calculating bin means. Under conditions where RSM and PRE effects are decoupled, the constraint imposed by RSM on GPP anomalies is represented as ΔSAGPP(SARSM|SAPRE). The average variation of SAGPP anomalies from high to low SARSM within each SAPRE bin is calculated using the following formula [35]:
Δ S A G P P ( S A R S M | S A P R E ) = 1 L × ( i = 1 L S A G P P i , R S M i , max S A G P P i , R S M i , min )
where L represents the total number of SARSM bins, i denotes a specific bin number, and S A G P P i , R S M i , max and S A G P P i , R S M i , min correspond to the values of SAGPP at the maximum and minimum SARSM values within the SAPRE bin, respectively. Similarly, under decoupled RSM–PRE conditions, the constraint of PRE on GPP anomalies is denoted as ΔSAGPP(SAPRE|SARSM), representing the average variation of SAGPP anomalies from high to low SAPRE within each SARSM bin. The calculation formula is
Δ S A G P P ( S A P R E | S A R S M ) = 1 L × ( i = 1 L S A G P P i , P R E i , max S A G P P i , P R E i , min )
where L is the total number of SAPRE bins, i denotes a specific bin index, and S A G P P i , P R E i , max and S A G P P i , P R E i , min represent the values of SAGPP corresponding to the maximum and minimum SAPRE values within each SARSM bin, respectively.

2.3.5. Ridge Regression

Multiple linear regression can be used to analyze the effects of environmental variables on GPP, with the model expressed as
R S M = j = 1 p β j x j + c
where j = 1, 2, 3, … and each xj represents an independent variable, p is the number of independent variables, c is the constant term, and βj are the regression coefficients estimated using the least squares method:
β = ( X T X ) 1 X T y
where X represents the feature matrix of independent variables, and y is the dependent variable. However, in this study, interactions among variables may lead to multicollinearity, which can cause the matrix XTX to approach singularity, thereby destabilizing regression results. To address this issue, we introduced the perturbation term λI in ridge regression, which effectively mitigates multicollinearity, stabilizes regression coefficients, and reduces sensitivity to collinear predictors [13]. The ridge regression coefficient estimation formula is
η r i d g e = ( X T X + λ I ) 1 X T y
Ridge regression is a linear regression method used to address multicollinearity issues. It introduces an L2 regularization term based on ordinary least squares (OLS) regression, resulting in more stable regression coefficients [49]. Ridge regression typically requires standardization of independent variables:
X m = x min ( x ) max ( x ) min ( x )
where x is the original variable value, min(x) and max(x) represent the variable’s minimum and maximum values, respectively, and Xm is the standardized variable. The ridge regression model is formulated as
Y m = t = 1 n φ t x t m + c
where φ t represents the ridge regression coefficients, t denotes the t-th factor, x t m is the standardized influencing factor data, and Ym quantifies the impact of factors on standardized GPP. The individual factor contribution is calculated as
γ c t = φ t × X t r e n d
where X t r e n d represents the standardized trend of factors, and γ c t denotes the contribution of an individual factor t. The absolute contribution given by
γ a c t = γ c t Y n _ t r e n d × Y t r e n d Y n _ t r e n d = γ c 1 + γ c 2 + γ c 3
where γ a c t represents the absolute contribution of factor t, Y t r e n d denotes the observed GPP trend, Y n _ t r e n d is the sum of absolute contributions from all factors, and γ c 1 , γ c 2 , and γ c 3 indicate the individual contributions of RSM, PRE, and RUM to GPP, respectively. The data processing and analytical framework of this study is shown in Figure 2.

3. Results

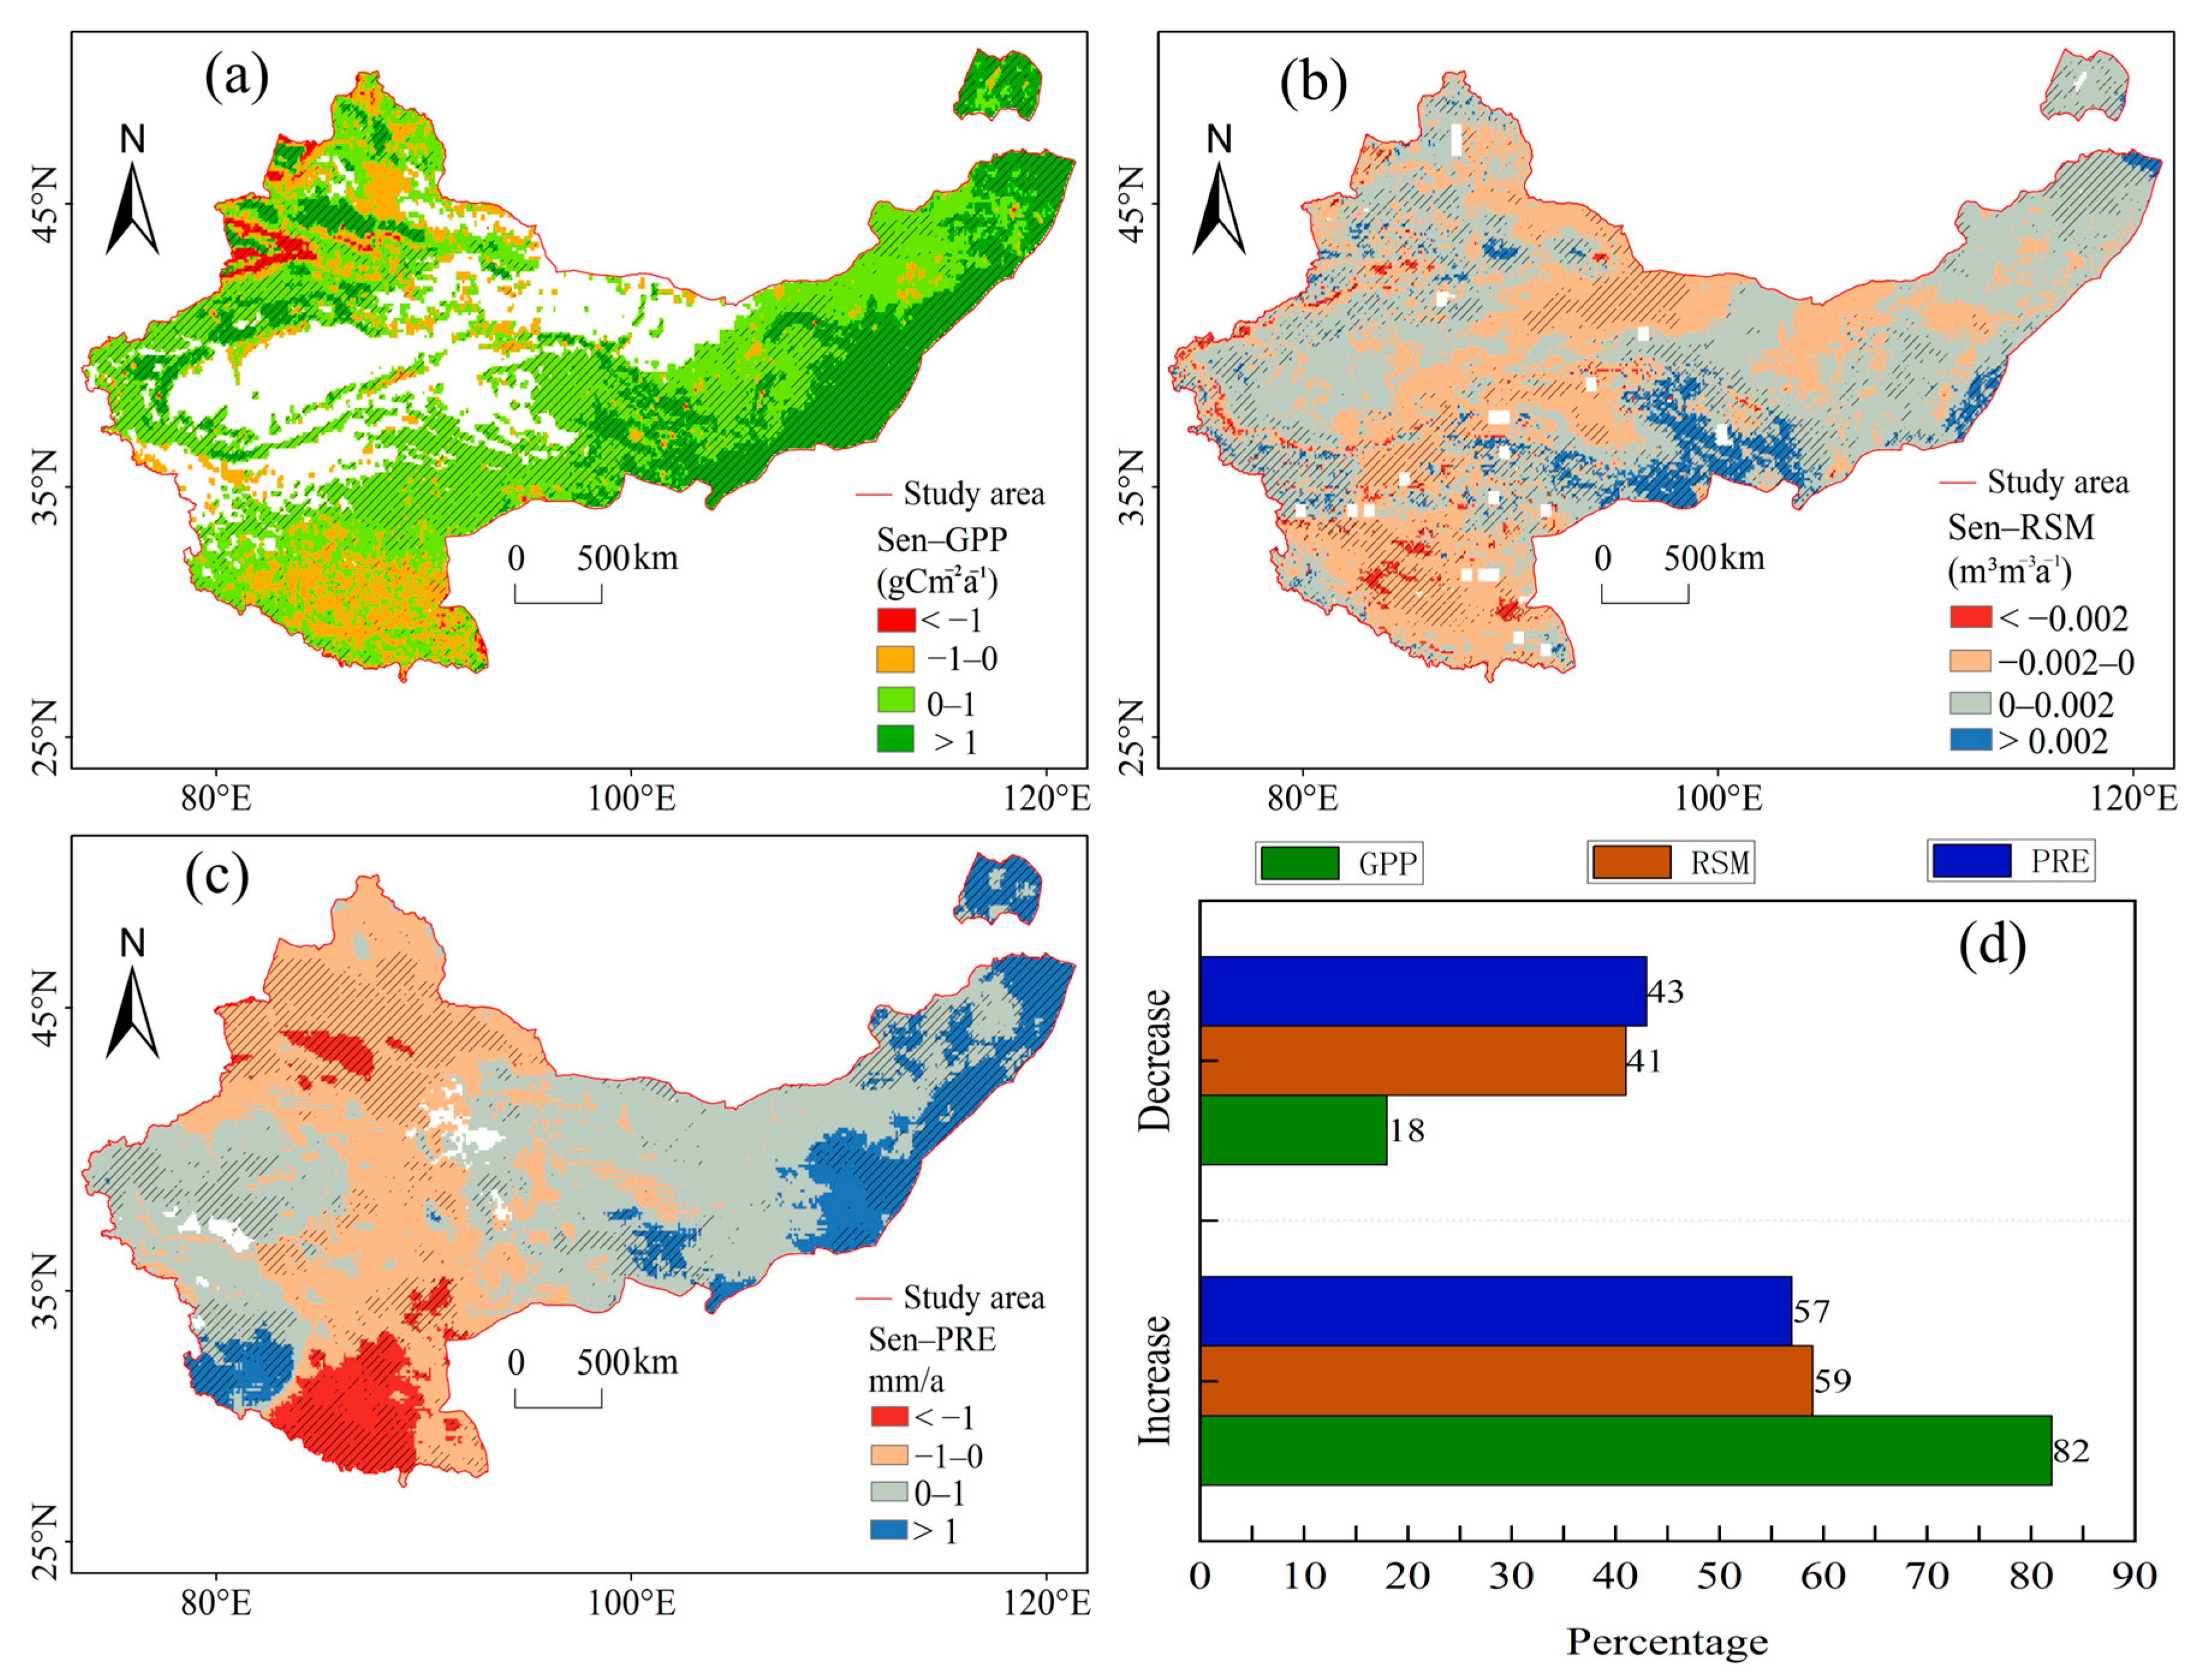
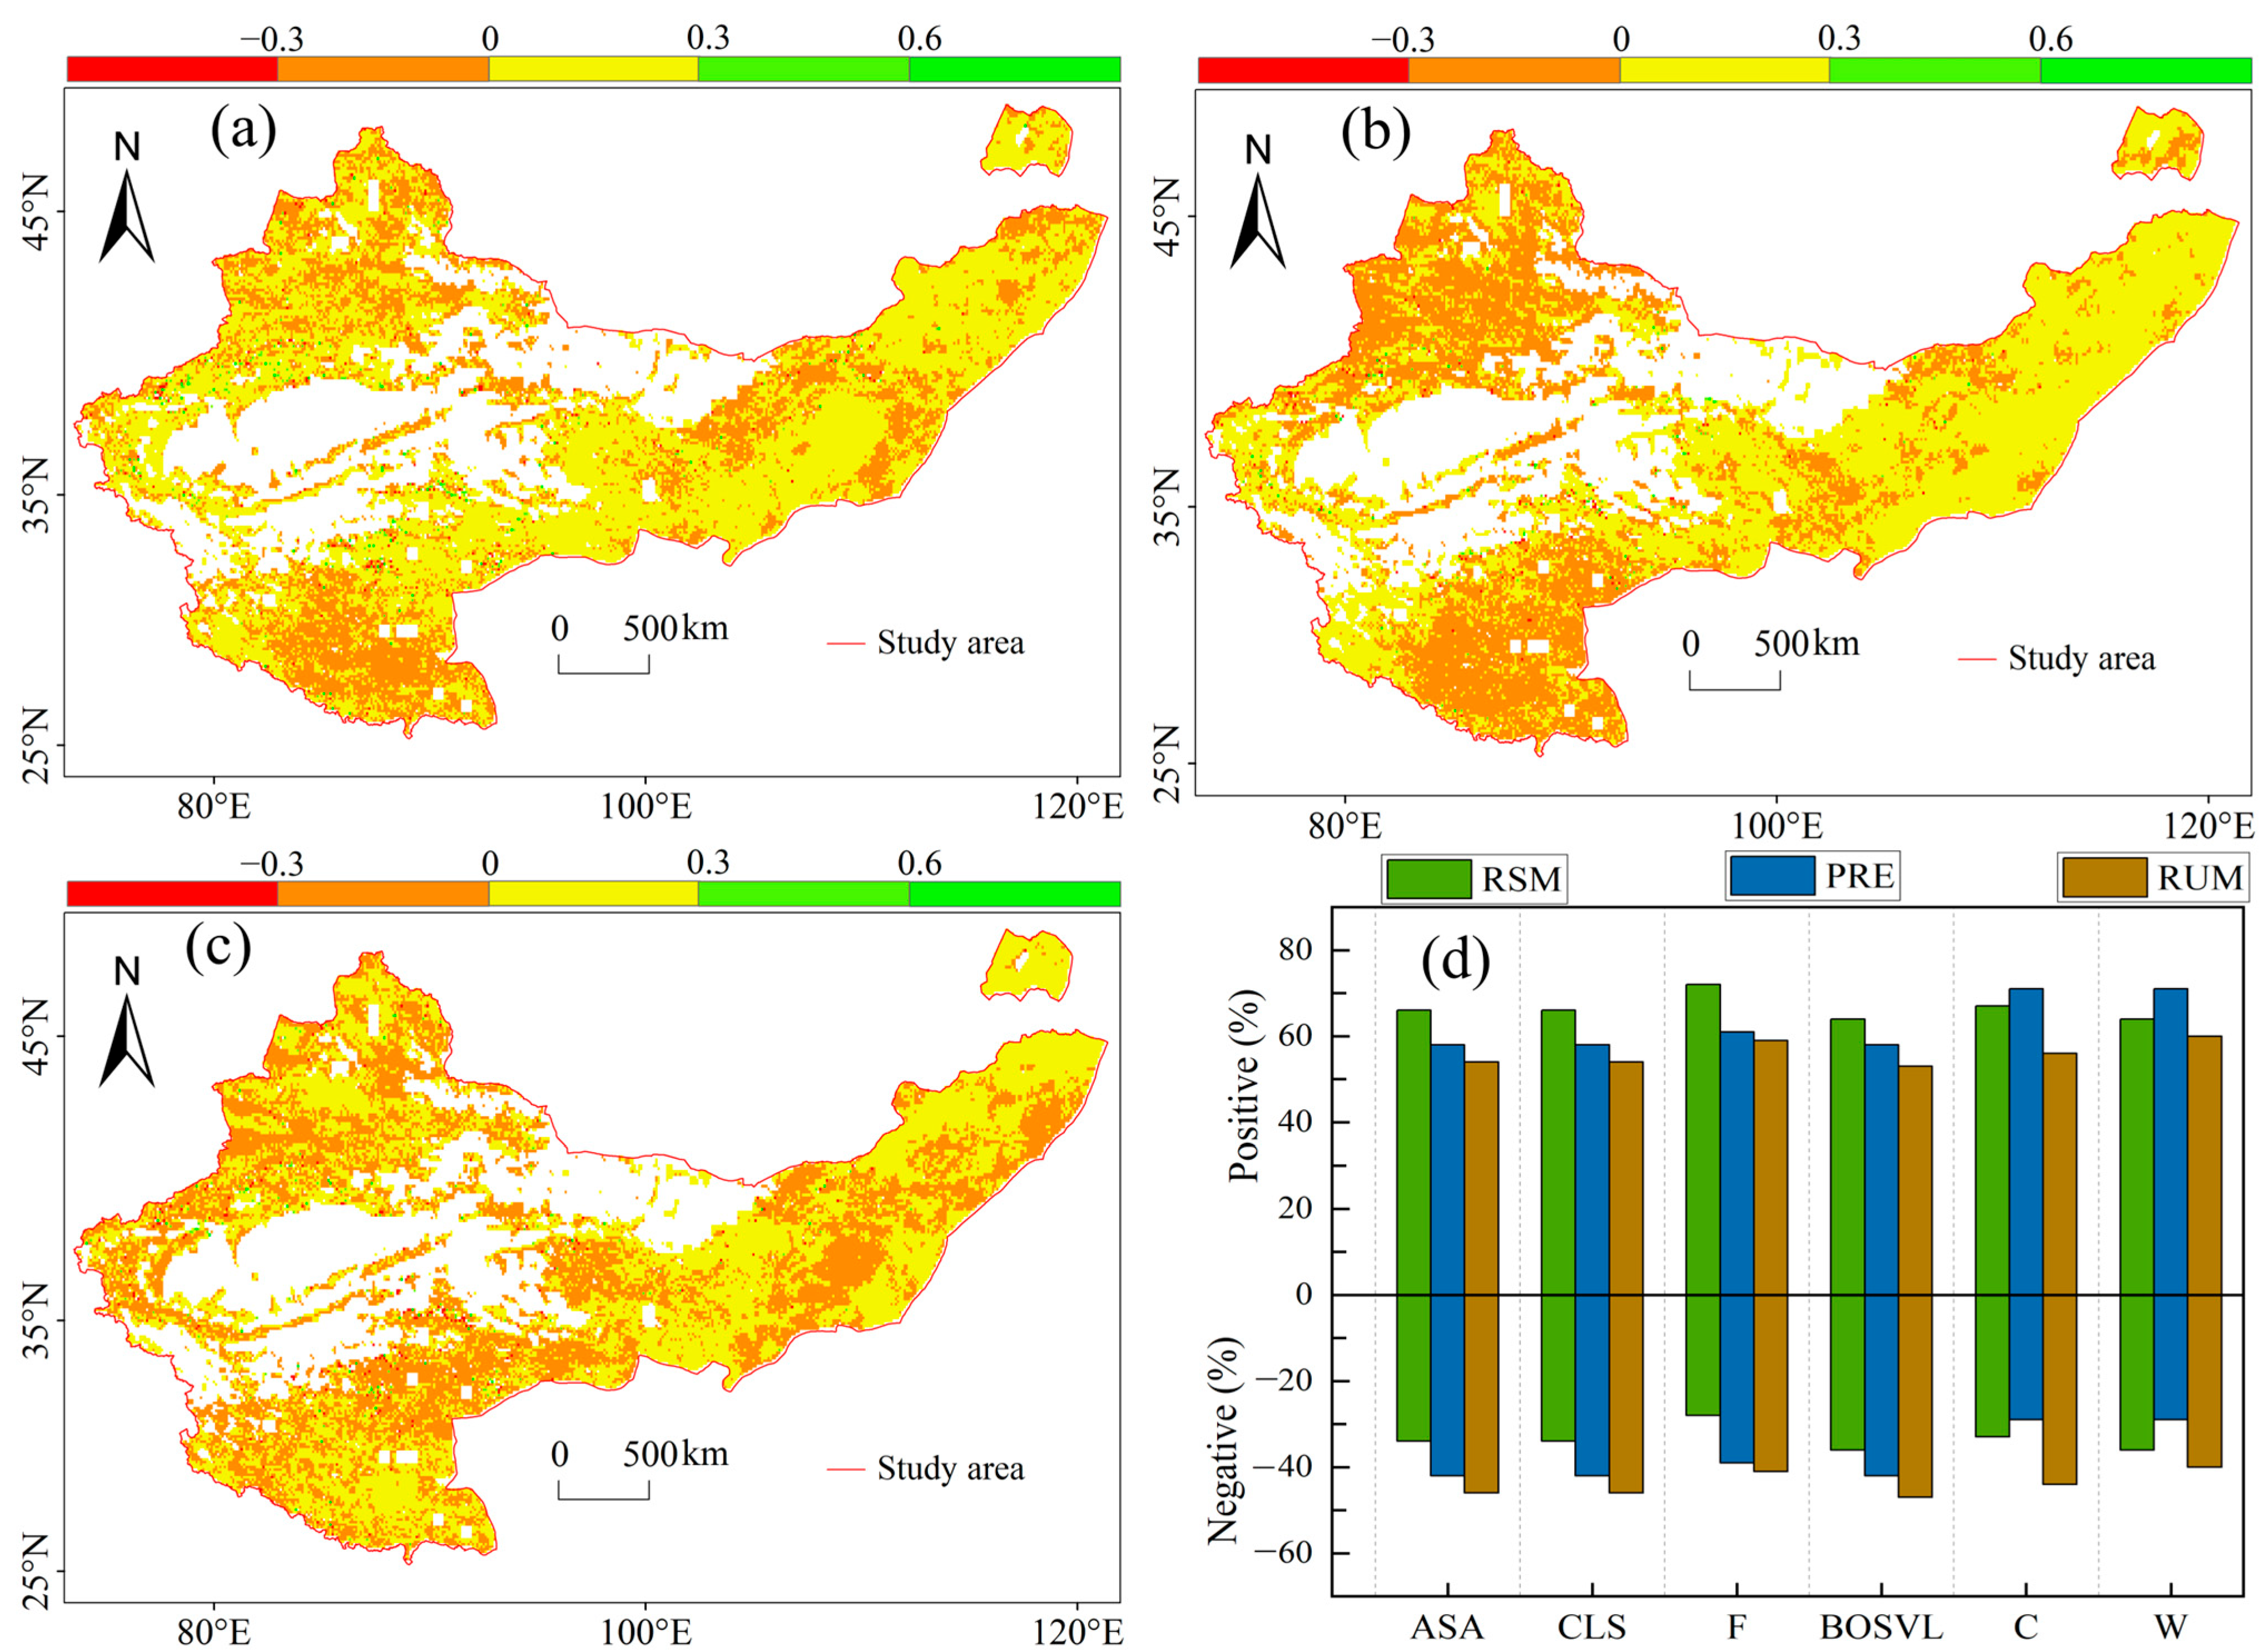
3.1. Spatiotemporal Trends of RSM, PRE, and GPP

Between 2000 and 2022, the multi-year average RSM within the study region was 0.143 m3/m3, exhibiting an overall upward trend (Figure S1). Increases in RSM were primarily observed in grassland and forested areas, whereas declines were predominantly found in bare or sparsely vegetated lands (Figure 3). Spatial heterogeneity in RSM was pronounced; grasslands and forests displayed higher annual mean values coupled with lower local variability, in contrast to bare or sparsely vegetated regions, which generally had lower RSM but greater spatial variability among adjacent locations. Notably, the southwestern sector of the study area experienced a significant downward trend in RSM, which, when considered alongside precipitation data (Figure 3b), may be linked to decreased precipitation levels. Conversely, agricultural lands exhibited a marked increase in RSM, likely attributable to anthropogenic influences such as irrigation and land management practices. Regarding PRE, 57% of the study area showed increasing trends, with particularly significant rises in the southeastern region, predominantly affecting grasslands, forests, and agricultural lands. Conversely, 43% of the area experienced decreasing PRE trends, mainly concentrated in the northwestern and southwestern zones. The most pronounced PRE decline occurred in the southwest, potentially contributing to the observed reduction in RSM in that region. Over the 2000–2022 period, average summer precipitation accumulation ranged from 42 to 67 mm, characterized by notable interannual variability. GPP during summer also demonstrated a significant upward trend across the study area, increasing at a rate of 0.455 gCm−2yr−1. Approximately 82% of the region exhibited rising GPP trends, while 18% showed declines. The most substantial increases in GPP were recorded in grasslands, forests, and agricultural lands. In contrast, bare and sparsely vegetated areas maintained consistently low GPP values due to limited vegetation cover. A notable decrease in GPP was observed in the northwestern portion of the study area, potentially linked to intensive human exploitation activities.
An analysis of the spatiotemporal patterns within the study area revealed that in grasslands, forests, and agricultural lands, both relative RSM and PRE exhibited increasing trends, accompanied by significant upward trends in GPP across these regions. These findings suggest that increases in RSM and PRE contribute to the enhancement of GPP. Conversely, in the southwestern portion of the study area, GPP demonstrated a declining trend that corresponded with decreases in both RSM and PRE, indicating that concurrent changes in RSM and PRE may either promote or inhibit variations in GPP depending on their directional trajectories. Nevertheless, the spatial distribution of GPP increases did not entirely overlap with regions experiencing increases in RSM and PRE. This partial spatial decoupling implies that the independent influences of RSM and PRE on GPP warrant further detailed investigation to elucidate their distinct roles in driving vegetation productivity dynamics.

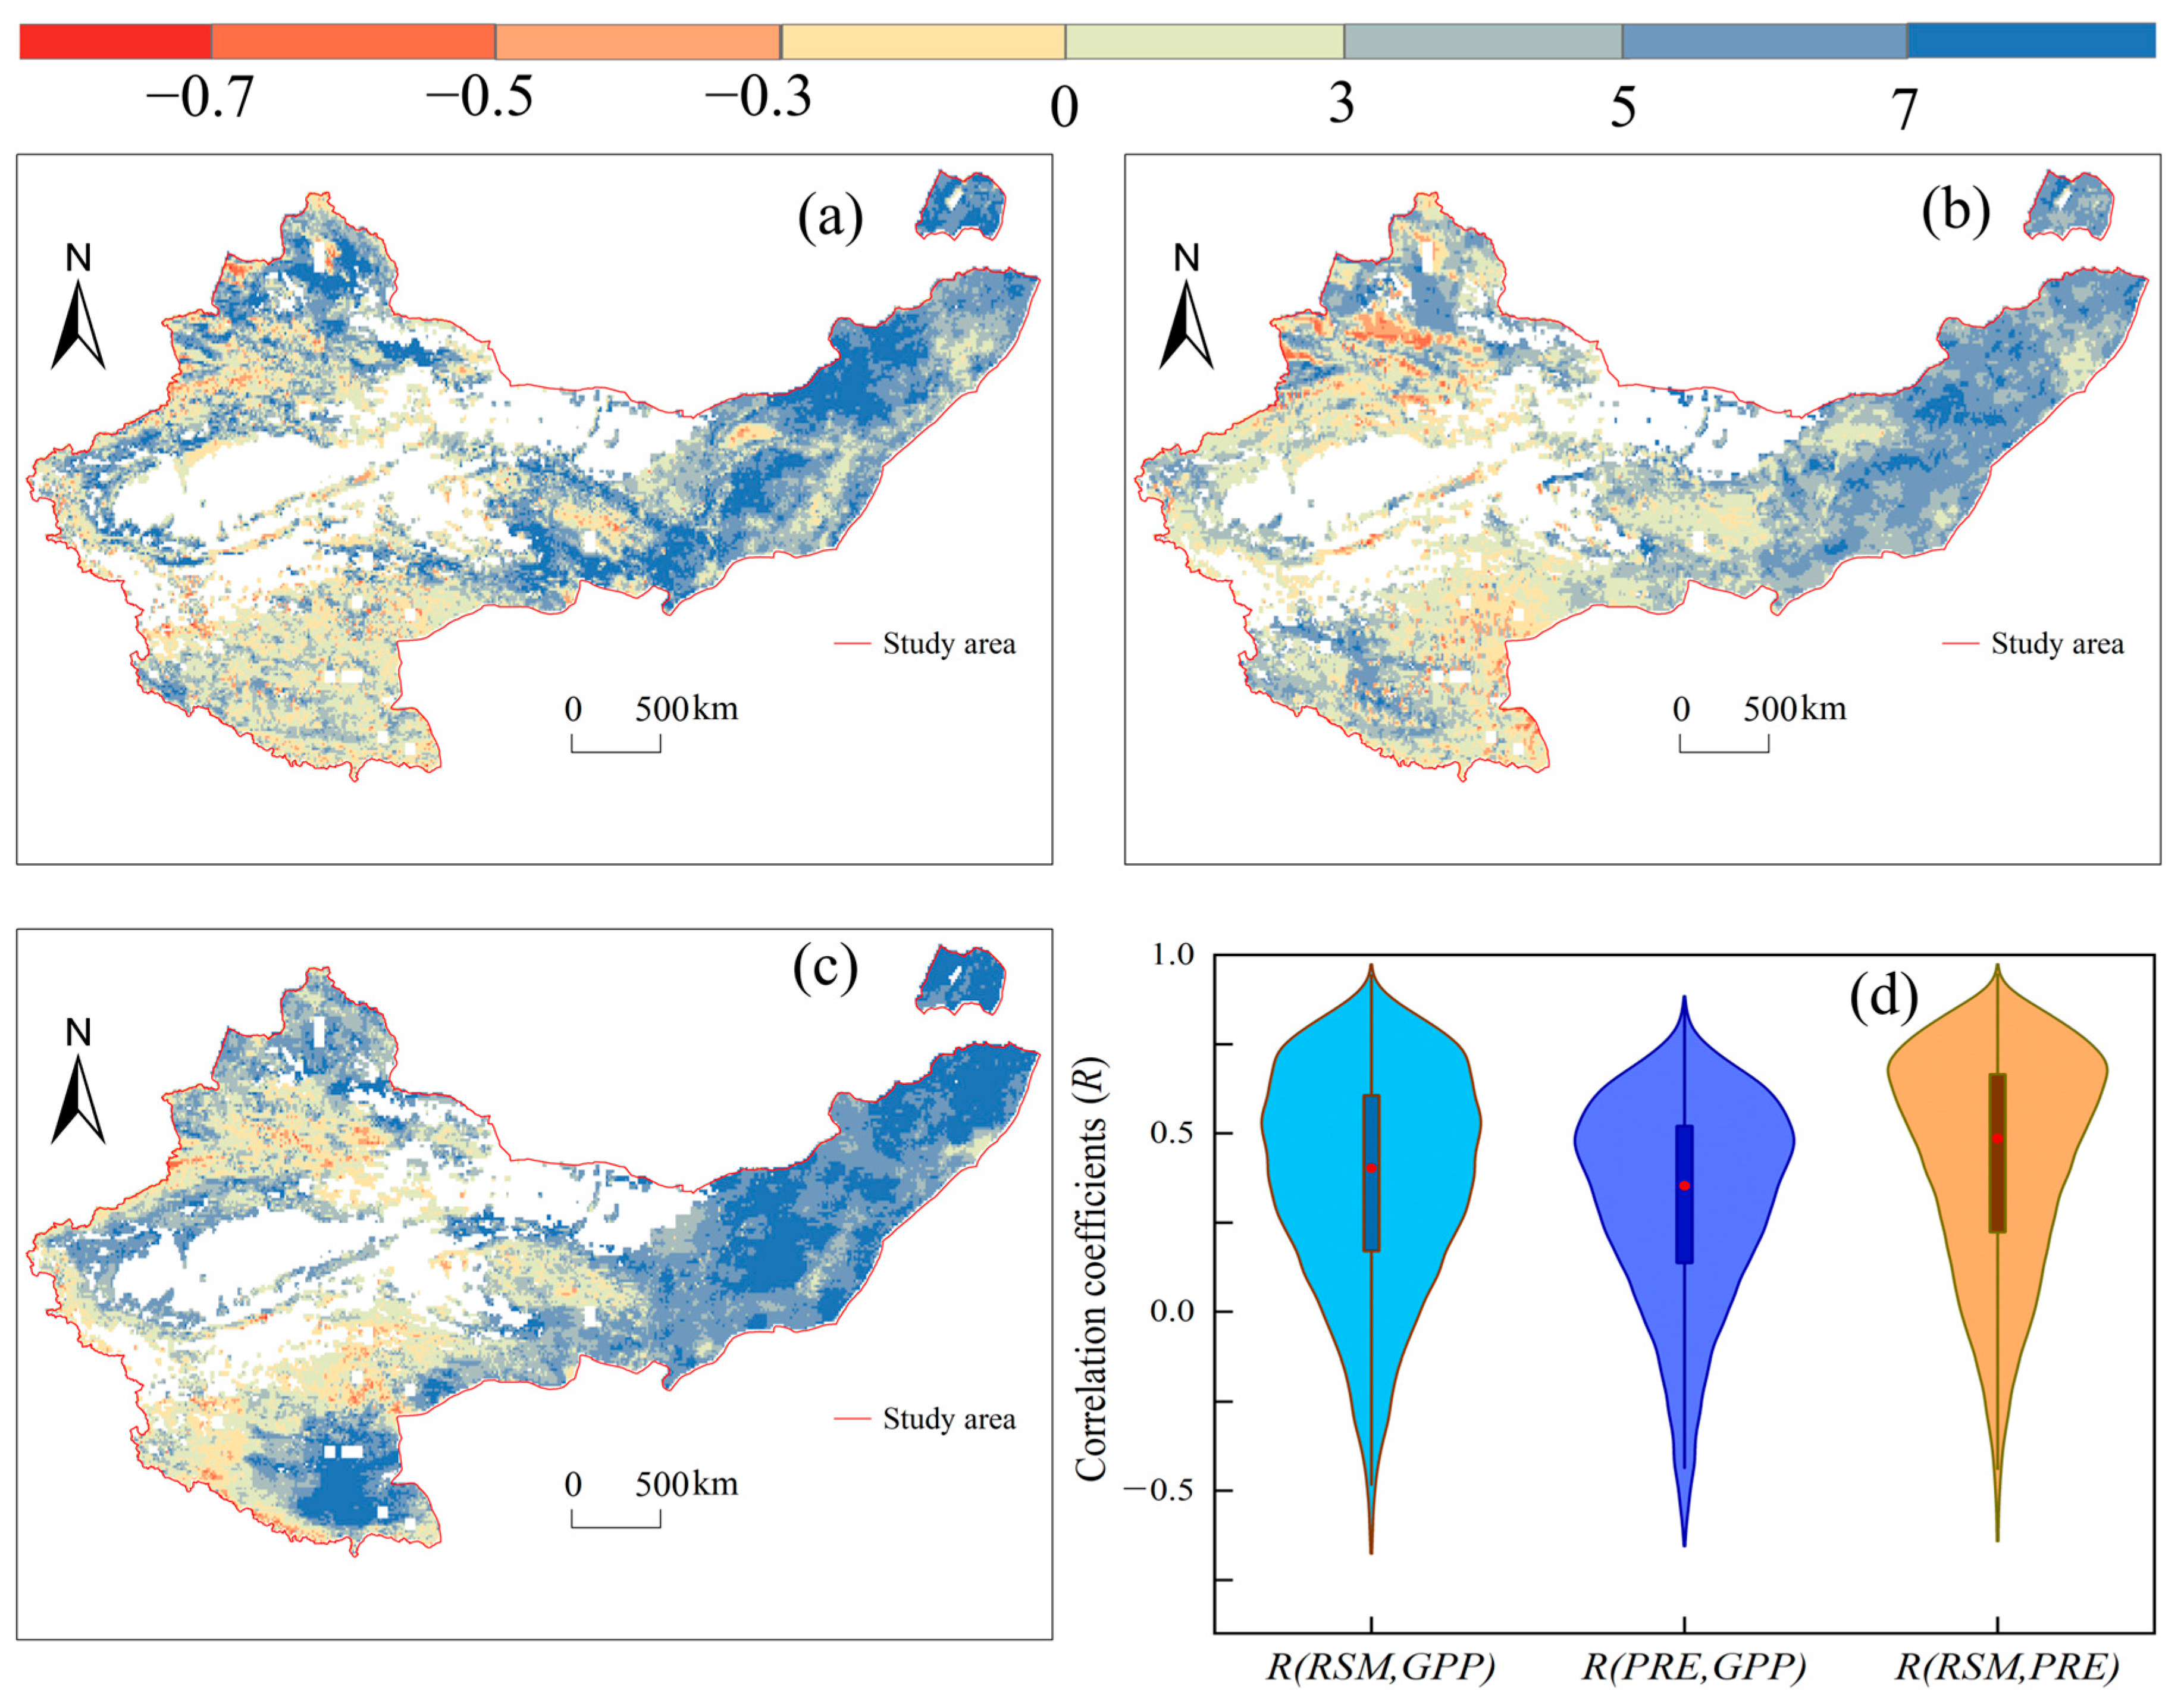
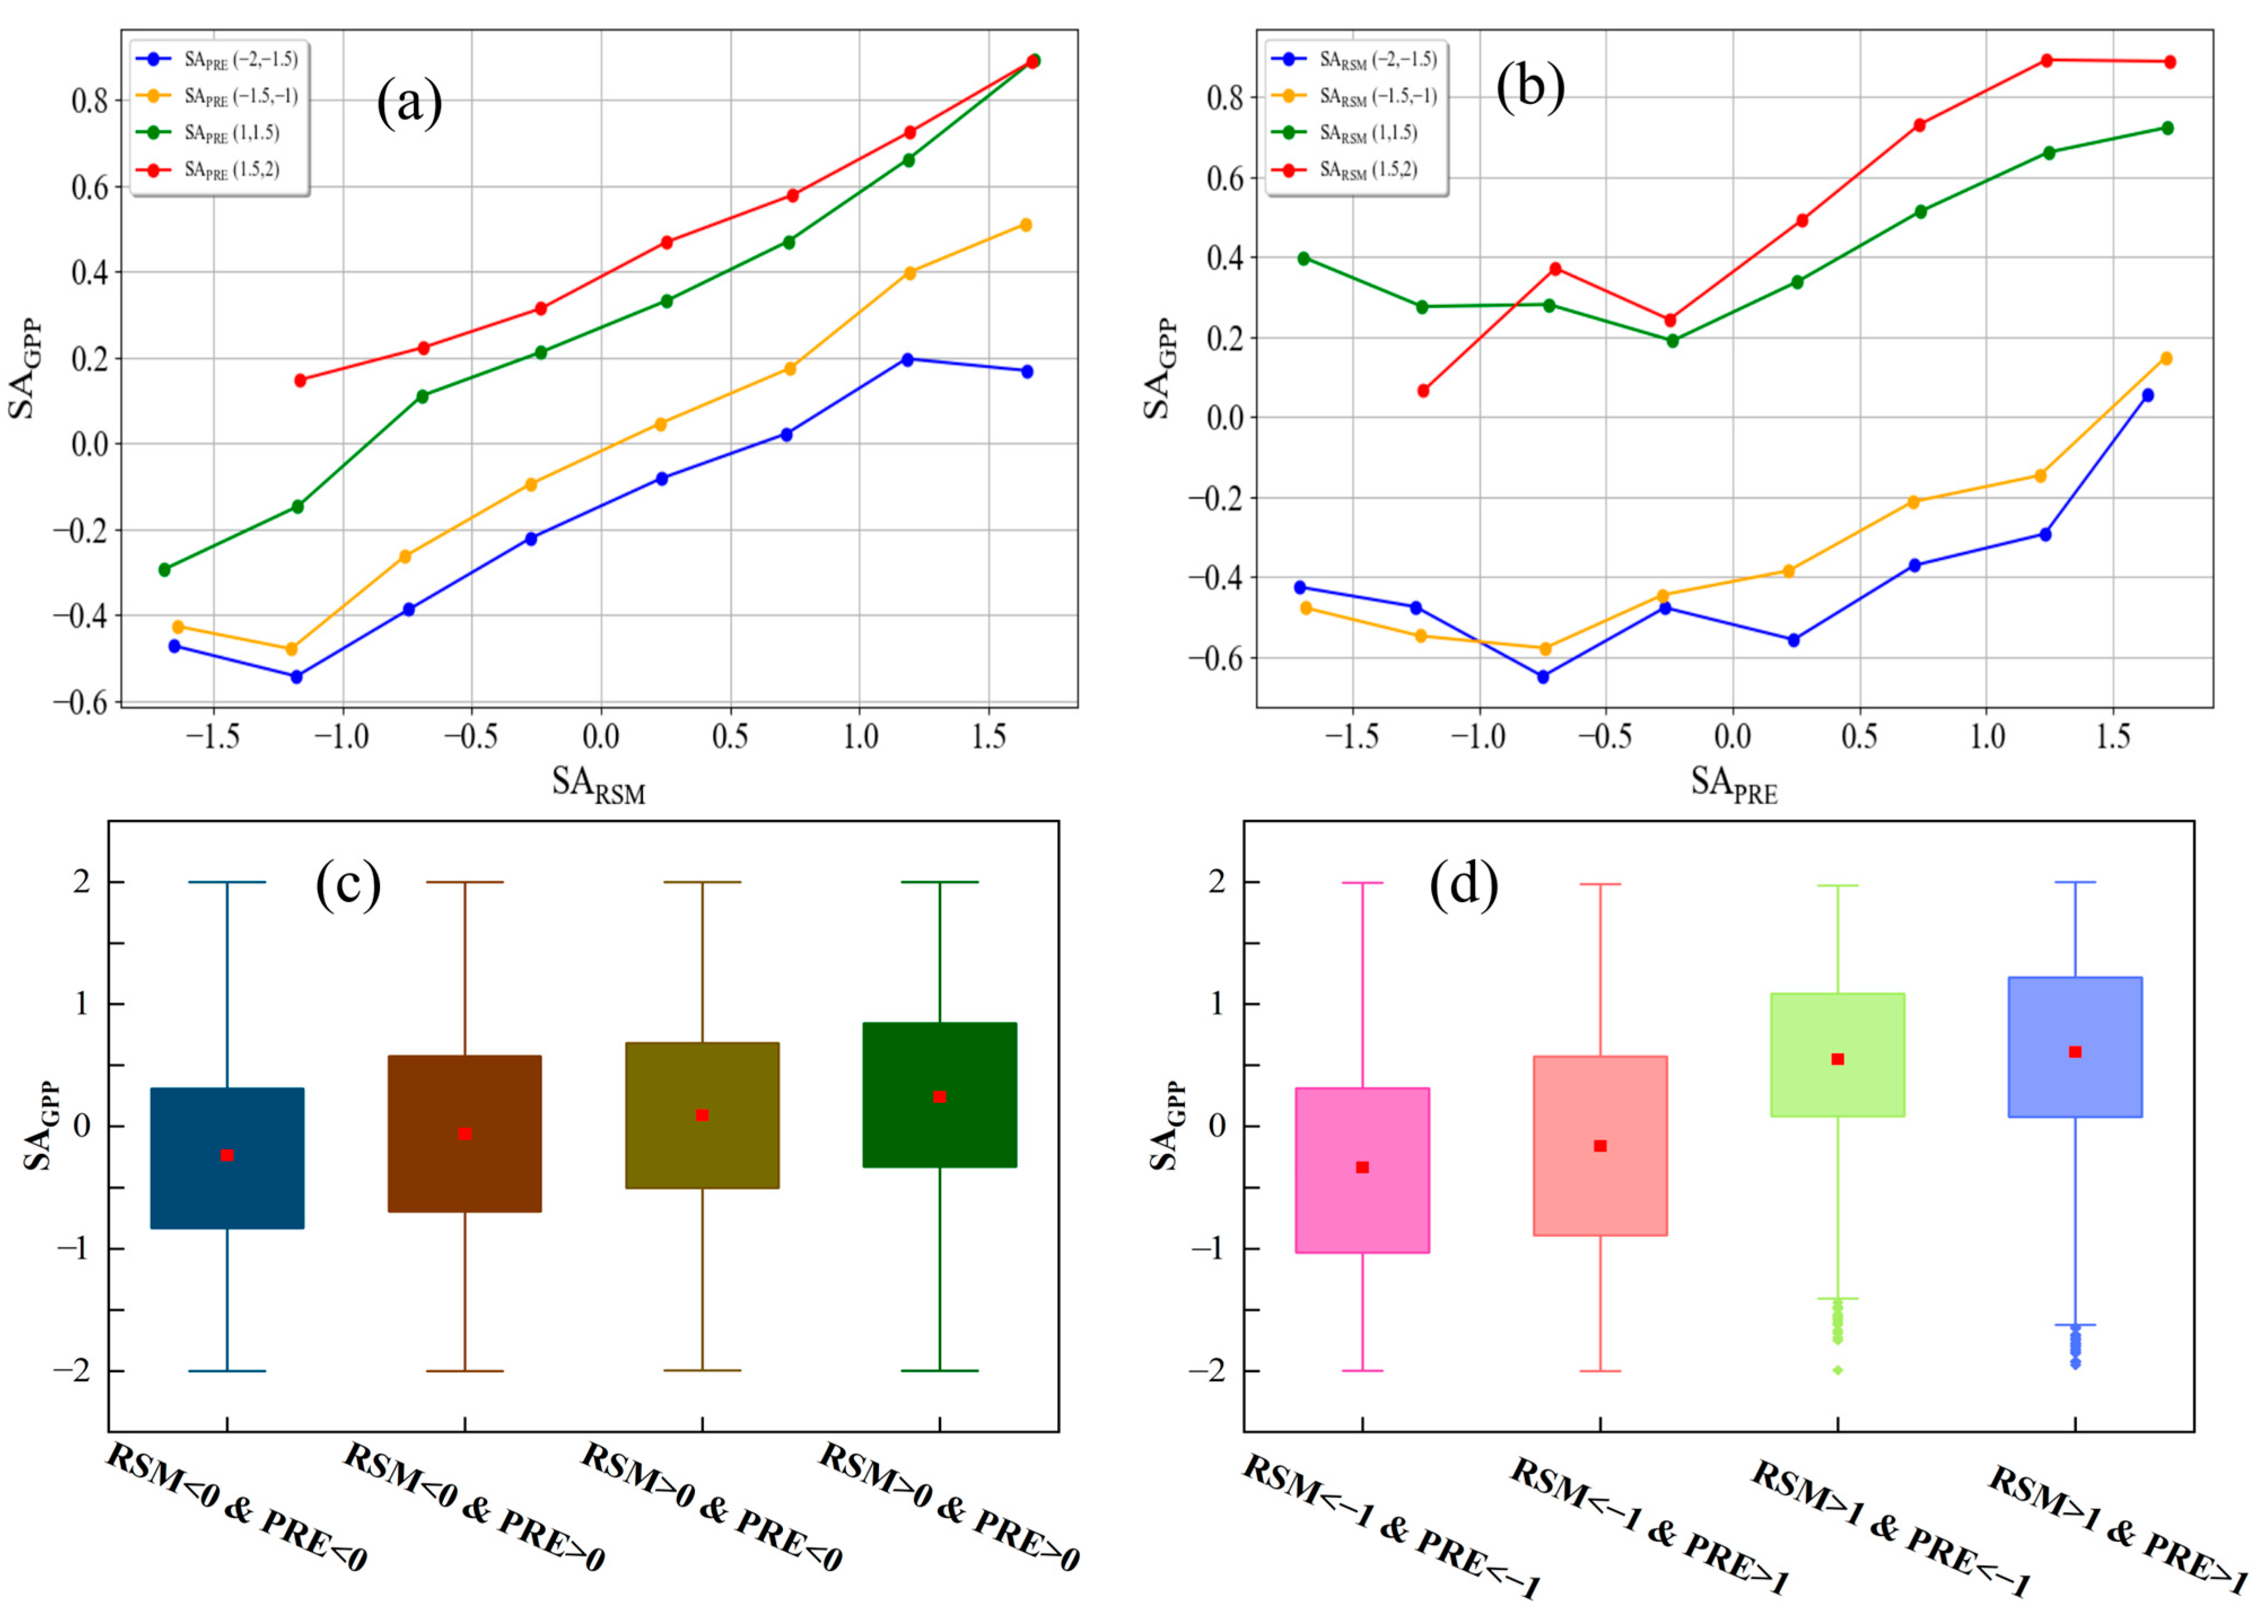
3.2. Coupling Effects of RSM and PRE on GPP

PRE and RSM functioned as the principal water sources sustaining vegetation, with PRE serving as the direct determinant of RSM. As a result, their effects on GPP were closely interlinked. An increase in PRE induced a rise in RSM, which subsequently enhanced land–atmosphere water exchange, further promoting additional PRE increments. Owing to this coupling between RSM and PRE, areas exhibiting simultaneous upward trends in both variables showed strong positive associations with GPP (Figure 3a,b). Across the study region, correlations between RSM and GPP were largely positive (Figure 4d), except in the southwestern sector where a negative correlation was identified (Figure 4a). Similarly, PRE was positively correlated with GPP in eastern grasslands but demonstrated negative correlations in western grasslands (Figure 4b).
In areas characterized by bare soil and sparse vegetation, both PRE and RSM exhibited negative correlations with GPP. Conversely, in regions where GPP showed significant increases, a strong correlation between RSM and PRE was observed (Figure 4c), suggesting a robust coupling relationship that jointly influenced variations in GPP. In zones with pronounced RSM–PRE coupling, the correlation between PRE and GPP in areas with elevated RSM and PRE values may have been confounded by the RSM–GPP relationship and vice versa. Consequently, it is essential to account for the interrelationship between RSM and PRE when assessing their respective impacts on GPP.
The ridge regression analysis revealed that RSM accounted for the largest positive influence on GPP, contributing 66%, while also exhibiting the smallest negative influence, at 34% within the study area. PRE demonstrated a higher positive contribution to GPP (58%) compared to RUM, which contributed 54%. Notably, RUM showed minimal disparity between its positive and negative effects, indicating an overall negligible impact on GPP in the region. More specifically, RSM exerted the strongest positive effect on GPP in forested ecosystems, followed by agricultural lands, whereas its influence was weakest in wetlands and in areas characterized by bare or sparse vegetation. PRE’s positive contribution was most pronounced in wetlands and agricultural lands, but least evident in grasslands and sparsely vegetated or bare areas (Figure 5). Additionally, ridge regression analyses conducted using MODIS-derived GPP datasets yielded comparable findings (Figure S2).

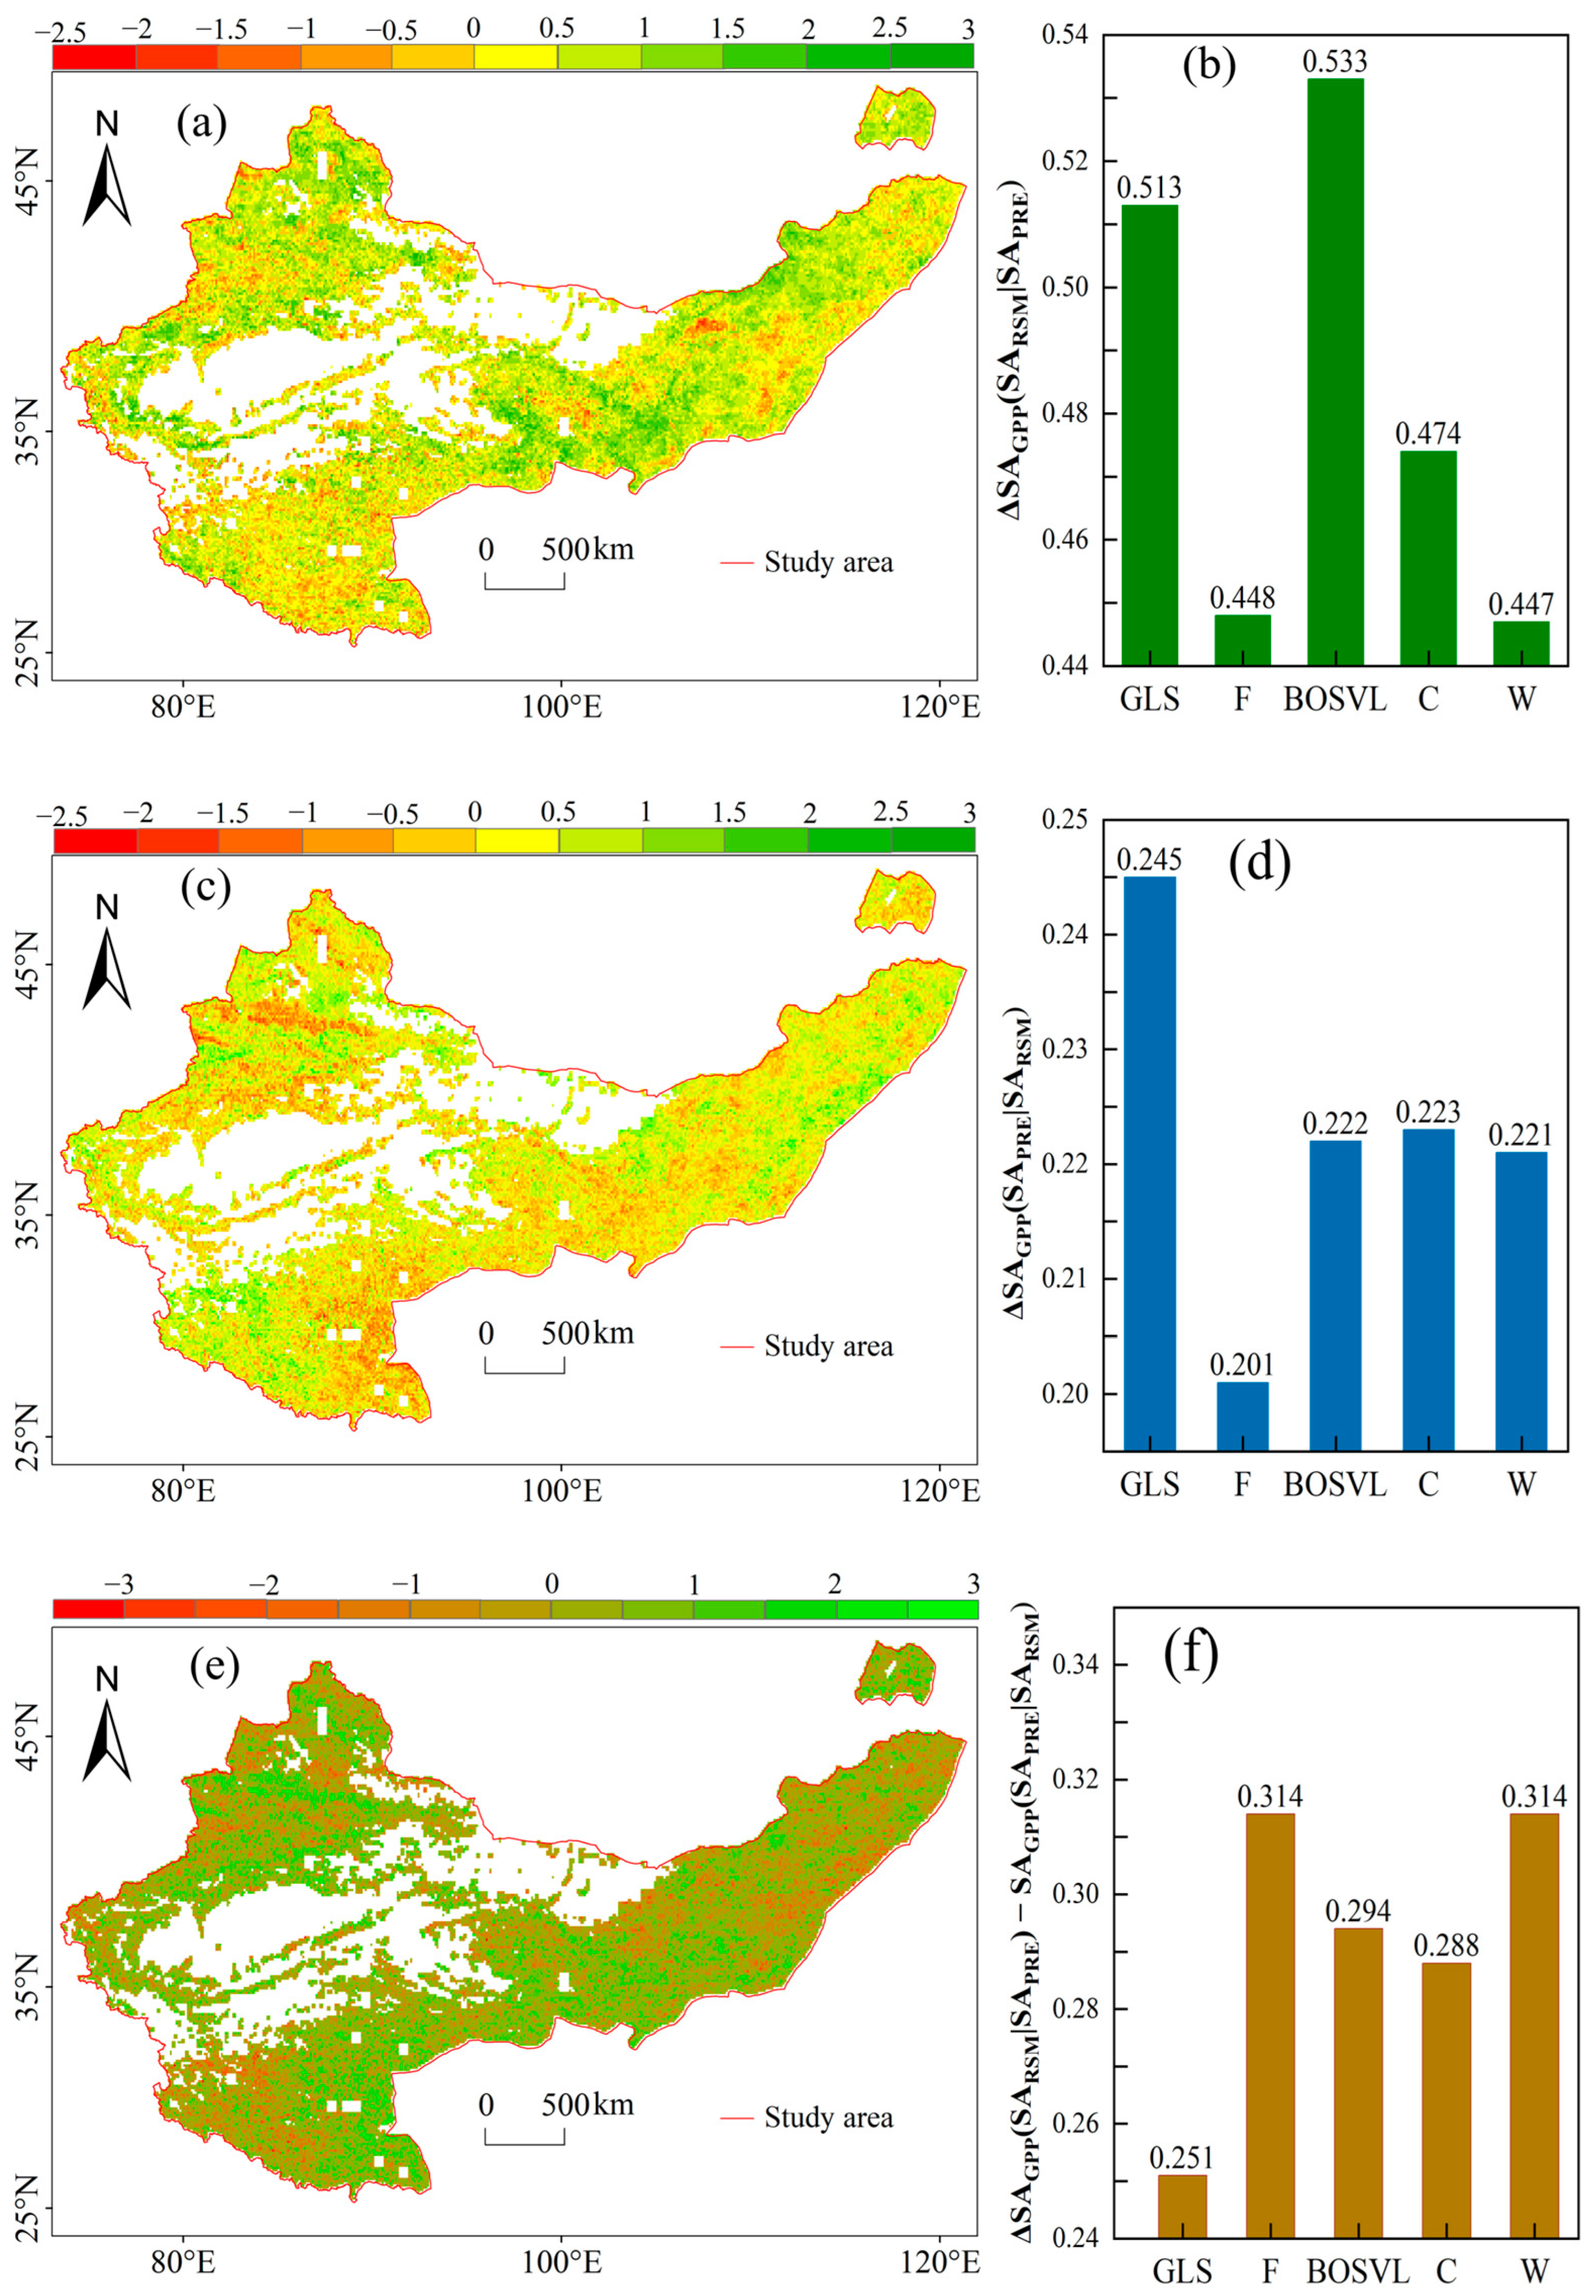
3.3. The Independent Effects of RSM and PRE on GPP

Utilizing the standardized anomalies of RSM and PRE, we partitioned the anomaly data, ranging from −2 to 2, into eight discrete intervals of 0.5 units each. From these, four intervals exhibiting greater variability—specifically, [−2, −1.5), [−1.5, −1), [1, 1.5), and [1.5, 2]—were selected for detailed analysis. Within the SAPRE intervals, characterized by the absence of coupling between RSM and PRE, the standardized anomaly of SAGPP demonstrated an increasing trend concomitant with the rising standardized anomaly of SARSM. Notably, in lower SAPRE intervals, the rate of SAGPP increase decelerated as SARSM rose, whereas in higher SAPRE intervals, the rate of SAGPP increase accelerated with increasing SARSM (Figure 6a). Examining the SARSM intervals, when SAPRE values were positive, SAGPP exhibited an upward trajectory with increasing SAPRE; however, in intervals of elevated SARSM, this growth rate either diminished or plateaued. Conversely, when SAPRE values were negative, SAGPP displayed pronounced variability without a discernible trend as SAPRE increased (Figure 6b). Collectively, these findings indicate that within the study region, in the absence of RSM–PRE coupling, elevated levels of either RSM or PRE independently contributed to enhancements in gross primary productivity. This suggests that the observed increases in SAGPP are not solely attributable to the interaction between RSM and PRE.
To assess the impacts of RSM and PRE on GPP within the study area, we independently quantified SARSM and SAPRE. As illustrated in Figure 6c, the mean SAGPP was −0.2775 when both SARSM and SAPRE were below zero; −0.0246 when SARSM was negative and SAPRE positive; −0.0036 when SARSM was positive and SAPRE negative; and 0.2749 when both SARSM and SAPRE exceeded zero. To further elucidate the predominant influences of RSM and PRE, we constrained the ranges of SARSM and SAPRE as depicted in Figure 4d. Specifically, when SARSM was less than −1 and SAPRE greater than 1, the mean SAGPP was −0.0876, whereas when SARSM exceeded 1 and SAPRE was below −1, the mean SAGPP reached 0.2492. These findings indicate that elevated levels of both RSM and PRE contribute to increases in GPP within the study area; however, SARSM exhibited a more pronounced positive effect on GPP compared to SAPRE. To validate these results, analogous analyses were conducted utilizing the MODIS GPP dataset, yielding consistent outcomes indicating that both high RSM and PRE enhance GPP. Notably, the magnitude of growth differed from that derived from GOSIF GPP data, potentially attributable to the MODIS dataset’s greater incidence of missing values and reduced sample size, which may have introduced variability (Figure S3a,b). Overall, the analysis corroborated that RSM exerts a stronger facilitative influence on GPP than PRE throughout the study region (Figure S3c,d).
We investigated the pixel-level effects of RSM and PRE on GPP. Positive values of ΔSAGPP(SARSM|SAPRE) and ΔSAGPP(SAPRE|SARSM) were observed in 78.12% and 65.53% of the total pixels, respectively, with SARSM exerting a more pronounced influence than SAPRE across 62.13% of the study area. This indicates that increased SARSM more effectively promotes GPP enhancement compared to elevated SAPRE (Table 1). Furthermore, the mean values of ΔSAGPP(SARSM|SAPRE) values consistently surpassed those of ΔSAGPP(SAPRE|SARSM) across all land use types (Figure 7b,d). Both ΔSAGPP(SARSM|SAPRE) and ΔSAGPP(SAPRE|SARSM) values were relatively low in forests and wetlands, likely because forest ecosystems exhibited greater ecological complexity where GPP resulted from multiple interacting factors, making it less sensitive to variations in either RSM or PRE. The parameter ΔSAGPP(SAPRE|SARSM) exhibited its greatest impact on grasslands, followed by bare or sparsely vegetated areas, though its mean values remained substantially lower than ΔSAGPP(SARSM|SAPRE). RSM showed greater influence on GPP in bare soil and sparsely vegetated areas than in other ecosystems. This was likely due to the harsh environmental conditions in these regions, where precipitation was extremely limited (Supplementary Figure S1) and vegetation mainly relied on RSM as its primary water source. These results indicate that while elevated SAPRE could enhance GPP growth, its promoting effect was consistently weaker than that of SARSM. A parallel analysis employing the MODIS GPP dataset corroborated these pixel-level RSM-PRE effects on GPP, yielding comparable results (Figure S4).

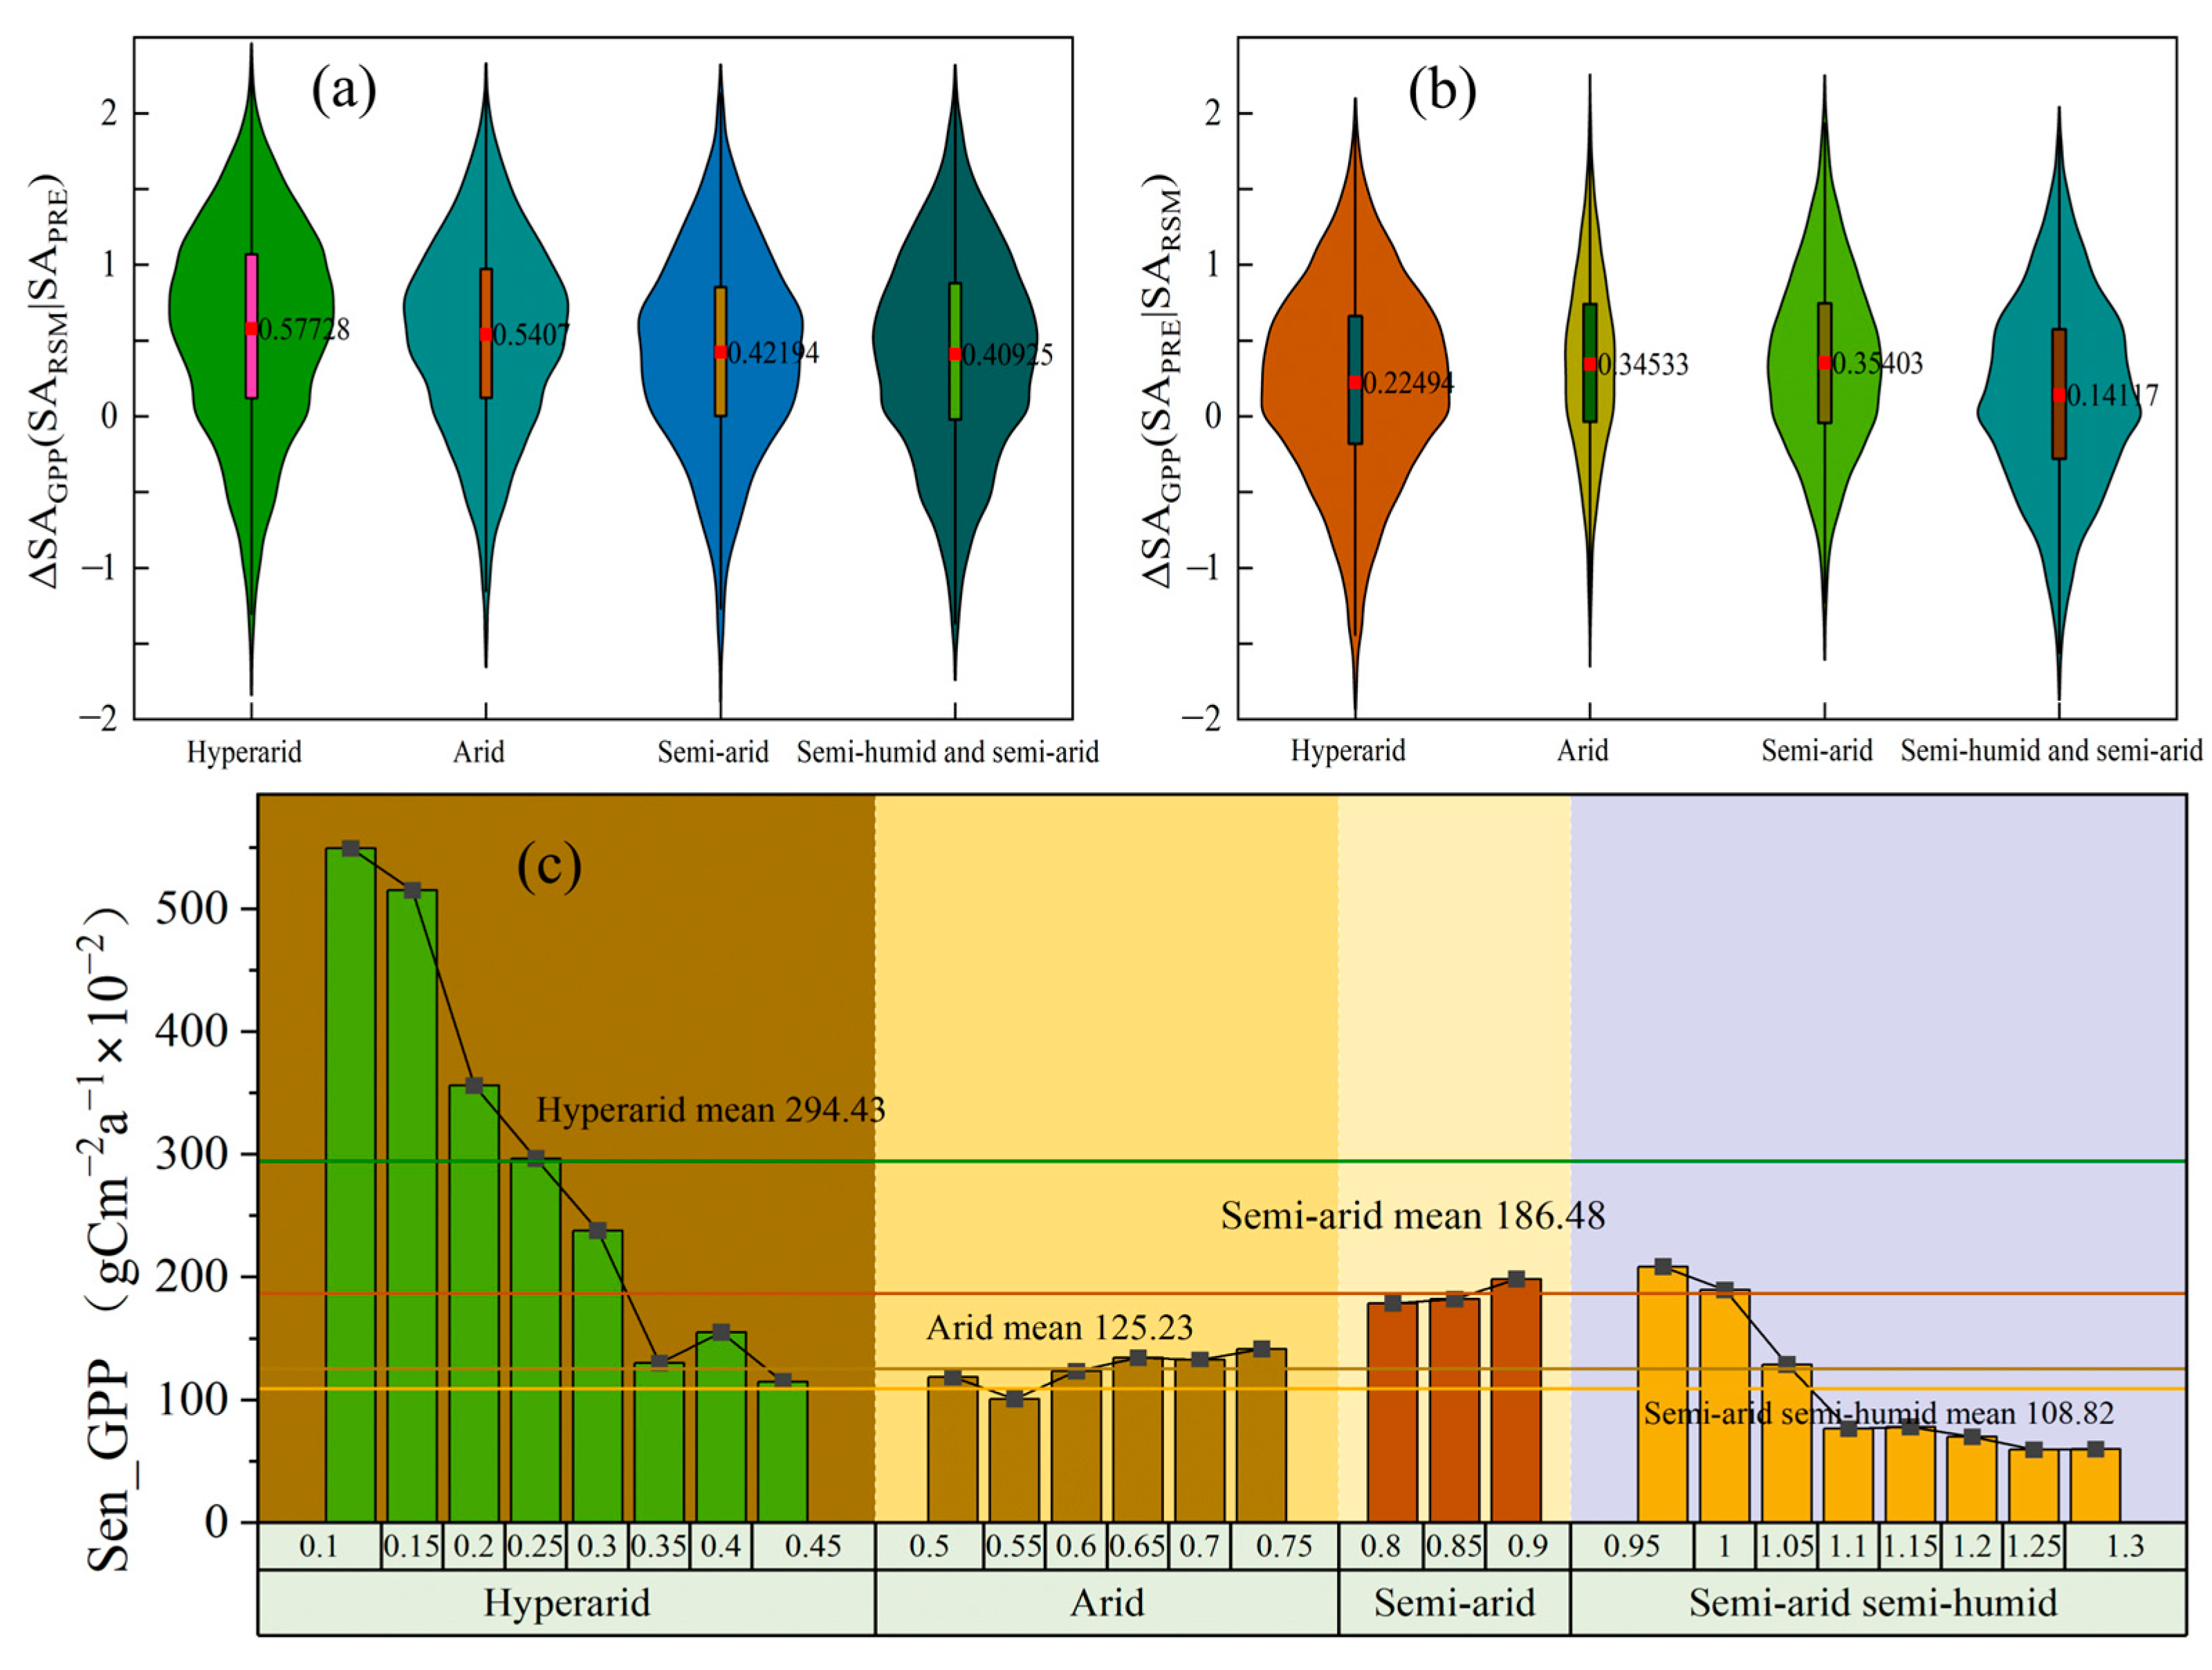
3.4. The Sensitivity of RSM and PRE to Aridity Levels

In this study, we observed that the enhancing effects on GPP varied across different ecosystem types. Integrating these findings with the data presented in Figure 6, it was evident that the rates of increase in SAGPP in response to rising SARSM differed among various SAPRE categories, with corresponding variations in saturation levels. Specifically, in hyperarid regions, the parameter ΔSAGPP(SARSM|SAPRE) exhibited the highest mean value (0.577), followed by arid regions (0.54) and semi-arid areas (0.42), whereas semi-arid to semi-humid regions showed the lowest mean value (0.409). The parameter ΔSAGPP(SARSM|SAPRE) demonstrated a trend of increasing mean values with escalating aridity, suggesting that the dominant influence of RSM on GPP intensifies under more arid conditions. Conversely, the parameter ΔSAGPP(SAPRE|SARSM) displayed progressively higher mean values across hyperarid, arid and semi-arid zones, indicating that PRE’s effect on GPP becomes more pronounced in less arid environments. Notably, this parameter attained its lowest mean value in semi-arid to semi-humid regions, which may be attributed to reduced GPP variability within these transitional climatic zones. As illustrated in Figure 8c, the semi-arid-to-semi-humid region exhibited the lowest mean rate of GPP increase, with this rate declining progressively as aridity decreased (i.e., with higher SAI values). In contrast, the hyperarid region showed the highest mean GPP increase rate, which consistently diminished with decreasing aridity. Interestingly, both arid and semi-arid regions demonstrated increasing GPP growth rates with rising SAI values, suggesting that GPP within these ecosystems is better adapted to the SAI conditions characteristic of arid and semi-arid environments.

4. Discussion

4.1. Spatiotemporal Variations and Correlations of RSM, PRE, and GPP

Over recent decades, global vegetation GPP has exhibited an upward trajectory [50], with dryland ecosystems contributing more substantially to this global GPP increase than the overall greening observed worldwide between 1982 and 2015 [51]. Specifically, from 2000 to 2022, the summer annual mean GPP in China’s arid and semi-arid regions demonstrated a significant positive trend, increasing at a rate of 0.4549 gCm−2yr−1 (Figure 3a). Between 2007 and 2021, GPP trends varied spatially: increases were observed in portions of the Northeast China Plain, North China Plain, and the transitional zone between the Loess Plateau and Qaidam Basin, whereas declines occurred on the Tibetan Plateau and in the Turpan Basin, attributable to diminished vegetation development [23]. As illustrated in Figure 3a, the eastern sector of the study area exhibited more pronounced GPP growth, while the southwestern (Tibetan Plateau) and northwestern (Turpan Basin) regions showed decreasing trends, corroborating previous findings. Amidst a global drying trend, only approximately 10% of regions experienced significant increases in RSM, predominantly located in India, Bangladesh, South Asia, East Africa, and northwestern South America [10]. These areas with rising RSM were generally situated at higher elevations within arid and semi-arid zones [52]. Within the study region, 59% of the area displayed increasing RSM trends, whereas 41% exhibited declines, albeit with smaller magnitudes, culminating in an overall upward trend in RSM across the region. Xu et al. (2018) analyzed extreme precipitation patterns in China’s arid and semi-arid zones using data from 166 meteorological stations spanning 1960 to 2018, revealing precipitation instability, particularly pronounced in semi-arid areas, primarily driven by atmospheric circulation dynamics and topographic influences [53]. Temporally, the study identified a fluctuating pattern in summer mean PRE without significant directional change (Figure S1f), consistent with these prior observations. Spatially, the eastern portion of the study area showed increasing summer PRE trends, whereas the western sector, notably the Tibetan Plateau, exhibited declining trends. Previous research has attributed the increased summer PRE in eastern Inner Mongolia to low-tropospheric moisture transport modulated by interactions between westerly winds and monsoonal flows, as well as upper-tropospheric dynamic forcing linked to variations in the westerly jet stream [54]. Furthermore, studies indicate that the southern and eastern Tibetan Plateau have experienced decreasing summer precipitation trends, potentially resulting from alterations in atmospheric circulation patterns and heterogeneous surface warming; notably, the southern plateau has undergone significantly greater warming than northern areas, thereby intensifying local circulation disparities [55].
The soil–vegetation–atmosphere system encompasses intricate and interrelated processes, necessitating a thorough elucidation of the coupling dynamics between RSM and PRE before assessing their individual influences on GPP [18,56]. Although PRE constitutes the direct source of RSM, the quantity and stability of PRE in China’s arid and semi-arid regions are limited and variable. As depicted in Figure 4d, the mean correlation coefficient between PRE and RSM was 0.42, indicating a positive yet moderate association between these variables. Fang (2010) investigated the responses of soil temperature and moisture to climatic changes across the Tibetan Plateau from 1916 to 2010, revealing that soil warming commenced around 1990, followed by increases in RSM after 2000, thereby illustrating an overall transition towards a warmer and moister soil environment [9]. Additional studies have identified vegetation and RUM as the primary drivers of RSM increases in China’s arid and semi-arid zones. Specifically, the contribution of PRE to RSM augmentation within the study area was comparatively minor, and although a coupling relationship between RSM and PRE was present, it was relatively weak. Dang et al. conducted a decoupling analysis of the combined effects of temperature and RSM on global GPP, concluding that variations in RSM exerted a more pronounced influence on vegetation productivity in arid and semi-arid regions [18]. During drought episodes, RSM was found to dominate variations in dryland GPP more significantly than other climatic factors, including VPD, PRE, temperature, and solar radiation [57]. The average correlation coefficient between RSM and GPP (0.56, p < 0.1) surpassed that between PRE and GPP (0.48, p < 0.1), indicating positive correlations of both RSM and PRE with GPP (Figure 4), with RSM demonstrating a stronger positive relationship. Due to the inherent instability of precipitation in dryland environments, the influence of PRE on GPP exhibited complex patterns: during drought years, increases in PRE positively affected dryland GPP, whereas in normal years, GPP tended to decline with rising PRE levels [58]. Furthermore, as illustrated in Figure 4b, the correlation between PRE and GPP displayed pronounced spatial heterogeneity across the study area, particularly in the western regions.

4.2. The Decoupled Effects of RSM and PRE on GPP

Dang et al. examined the independent effects of temperature and relative RSM on global GPP through data binning techniques, revealing that RSM exerted a more substantial influence on vegetation productivity than temperature in arid and semi-arid regions [18]. Similarly, investigations into the impacts of VPD and RSM on ecosystem productivity indicated that VPD predominantly governed GPP variability in humid ecosystems, whereas RSM was the primary driver of GPP fluctuations in arid and semi-arid ecosystems [24]. In the present study, statistical analyses of SAGPP under varying environmental conditions were conducted using data binning. Results demonstrated that SAGPP values were higher when RSM increased (SARSM > 0 or SARSM > 1) concurrently with decreasing PRE (SAPRE < 0 or SAPRE < −1), compared to scenarios where RSM decreased (SARSM < 0 or SARSM < −1) alongside increasing PRE (SAPRE > 0 or SAPRE > 1). These findings corroborate previous research indicating that RSM exerts a stronger influence than PRE on GPP within China’s arid and semi-arid zones. Enhanced RSM in these regions improves water availability, thereby augmenting carbon sequestration capacity [19]. Further studies focusing on PRE sensitivity and its driving factors within China’s agricultural systems identified RSM as the dominant determinant of GPP-PRE sensitivity [59]. This is likely attributable to PRE first replenishing RSM, which subsequently supplies water directly to vegetation via root–soil interactions. Wang et al. analyzed vegetation GPP dynamics across China from 1998 to 2019, elucidating drought response and recovery patterns; notably, summer exhibited the highest recovery efficiency, with 41% of recovery duration attributed to RSM replenishment [60]. As illustrated in Figure 6a,b, within data bins characterized by PRE decline (SAPRE intervals [−2, −1.5) or [−1.5, −1)), the magnitude of SAGPP increase associated with rising SARSM exceeded that observed in bins of RSM decline (SARSM intervals (−2, −1.5) or (−1.5, −1)) accompanied by increasing SAPRE. This pattern underscores the more direct role of RSM in promoting GPP variability within the study area. Moreover, SAGPP change rates within RSM increase bins (SARSM intervals (1, 1.5) or (1.5, 2)) exhibited a deceleration or stabilization trend with respect to SAPRE, whereas in precipitation increase bins (SAPRE intervals (1, 1.5) or (1.5, 2)), SAGPP change rates accelerated with SARSM. These observations provide additional evidence that increases in RSM more directly enhance regional GPP growth. In arid and semi-arid ecosystems, sparse grasslands and shrublands are predominantly influenced by RSM [24]. Under drought conditions, these vegetation types tend to adopt conservative water use strategies characterized by supportive and defensive traits, such as reduced leaf length and elevated root-to-shoot ratios [61]. In barren or sparsely vegetated landscapes, vegetation can exploit RSM for water storage, thereby diminishing reliance on PRE and maintaining photosynthetic activity even during periods of reduced PRE [61]. The metric ΔSAGPP(SARSM|SAPRE) attained its highest mean value (0.533) in barren or sparsely vegetated lands, followed by grasslands, indicating RSM had greater influence on GPP in these zones of China’s arid and semi-arid areas (Figure 7). Physiologically, RSM exerts more direct control over vegetation than PRE by regulating stomatal conductance, which in turn affects both photosynthesis and transpiration. Reduced RSM elevates land surface temperature and VPD, further inhibiting plant productivity [62]. RSM mediates the trade-off between carbon assimilation and water loss (transpiration); sufficient RSM enhances photosynthesis, whereas low RSM reduces transpiration to conserve water at the expense of carbon uptake [22]. Conversely, Figure 7b indicates relatively low ΔSAGPP(SAPRE|SARSM) values in forests and wetlands, suggesting a comparatively weaker influence of PRE on GPP in these ecosystems. Vegetation in forests and wetlands typically possesses extensive root systems capable of accessing RSM, rendering them less sensitive to short-term precipitation variability [61]. Although humid regions are more responsive to VPD, they still depend on RSM during dry spells [24]. The analysis showed that grasslands exhibited the highest ΔSAGPP(SAPRE|SARSM) values, followed by croplands, indicating that PRE exerted the most pronounced influence on GPP in these two vegetation types. Grasslands, with their relatively shallow root systems, exhibit greater sensitivity to precipitation compared to other vegetation types [61]. Additionally, grasslands experience stronger feedbacks between RSM and PRE, whereby PRE has a more immediate impact on GPP than in forests [62]. Negative correlations between precipitation and RSM were observed in northern hemisphere grasslands, sparse vegetation areas, and xerophytic shrublands [62]. As depicted in Figure 7f, ΔSAGPP(SARSM|SAPRE) − ΔSAGPP(SAPRE|SARSM) exhibited relatively low values in grassland areas, demonstrating that both RSM and PRE significantly influenced grassland GPP in the study area. This is likely attributable to vegetation utilization of RSM, which results in negative correlations between PRE and RSM.

4.3. The Sensitivity of RSM and PRE to Drought

Drought stress effects on vegetation’s CO2 photosynthetic uptake have been identified as a major source of uncertainty in forecasting future terrestrial carbon sequestration and climate change dynamics [63]. However, terrestrial ecosystem models typically employ only empirical plant-functional-type functions to capture drought stress [64]. This study examined the sensitivity of GPP to the RSM availability index (SAI), uncovering inconsistent patterns between GPP drought sensitivity and climatic gradients. Specifically, GPP sensitivity to the SAI displayed varying regional trends, with extreme arid regions exhibiting a progressive decline in GPP variability as climatic humidity increased (Figure 8c). Although GPP values in these extreme arid zones were relatively low, their variation patterns were notably distinct, reflecting the heightened sensitivity of these ecosystems to changes in climatic humidity [18]. Increases in RSM or PRE (or other factors) led to climatic moistening, consequently driving GPP variations. Arid and semi-arid ecosystems served as primary drivers of global terrestrial CO2 flux variations, where RSM’s drought response time and recovery rate proved critical in these regions [60], demonstrating RSM’s decisive role in regulating vegetation productivity across drylands. As shown in Figure 8a, the values reached their maximum in extreme arid zones and decreased with reducing drought intensity, indicating that RSM exerted greater influence on GPP in drier regions. Furthermore, given the global declining trend of RSM [10] and projected expansion of drylands [65], RSM’s impact on the global carbon cycle is expected to intensify in the future.

4.4. Uncertainty Analysis

This study conducted a systematic examination of the effects of RSM and PRE on summer GPP, although several issues remain unresolved. The hydrological cycle within the research area should encompass processes such as E, RUM dynamics, plant transpiration, and variations in terrestrial water storage. Although the data binning approach constrained variations in E and RUM, it did not adequately account for other influential factors. Changes in surface runoff have a direct impact on vegetation growth [66], and permafrost thawing similarly influences GPP [67]. Despite agricultural land constituting a small proportion of the study region, artificial irrigation contributes to GPP variability [68]. Natural grasslands predominate in the area; however, grazing and anthropogenic activities modify grassland patterns, thereby affecting GPP [69]. During the study period, vegetation-type changes in China’s arid and semi-arid regions were minimal, yet the potential effects of vegetation-type variation on the findings were not considered [29]. Future research should incorporate datasets related to water cycle components to elucidate the hydrological mechanisms within the study area, while also comprehensively addressing the impacts of vegetation type and land use changes to resolve existing uncertainties.

5. Conclusions

This research systematically disentangled the effects of RSM and PRE on GPP during the summer months from 2000 to 2022 within arid and semi-arid regions of China by employing a data binning approach. This methodological framework effectively controlled for the influence of individual variables on GPP, thereby allowing for the isolation of independent responses to variations in single factors while holding other environmental conditions constant.
The findings revealed a significant upward trend in summer GPP, quantified at 0.455 gCm−2yr−1, throughout the study region, whereas PRE did not exhibit statistically significant trends. Spatial analysis indicated that increases in GPP and RSM were primarily concentrated within grasslands, forests, and agricultural areas. Although coupled interactions between RSM and PRE were observed in China’s arid and semi-arid areas, their respective influences on GPP operated independently of this coupling mechanism. Decoupling analysis demonstrated that under conditions of elevated RSM (SARSM > 1 and SAPRE < −1), SAGPP increased on average by 0.249, after accounting for confounding effects of E and RUM, a significantly greater increment compared to the −0.088 change observed under high-PRE conditions (SAPRE > 1, SARSM < −1). Regions dominated by RSM effects comprised 62.13% of the total study area, with particularly pronounced dominance in barren or sparsely vegetated lands, grasslands, and agricultural ecosystems. Furthermore, the influence of RSM on GPP intensified with increasing aridity; in extremely arid zones (SAI ≤ 0.4), ΔSAGPP (SARSM|SAPRE) peaked at 0.577, whereas this value declined to 0.409 in semi-arid-to-semi-humid regions (SAI ≥ 0.9). These results underscore the critical role of RSM retention capacity in sustaining vegetation productivity under conditions of heightened moisture limitation.
This research delineates the distinct response mechanisms of vegetation productivity to RSM and PRE within the arid and semi-arid areas of China. It offers a theoretical foundation for the optimization of water resource management strategies aimed at ecological restoration in dryland environments. The findings indicate that RSM constitutes the principal regulatory factor influencing vegetation carbon sequestration capacity in these areas. This insight is expected to substantially improve the precision of carbon cycle modeling in arid zones under scenarios of global environmental change.

Supplementary Materials

The following supporting information can be downloaded at: https://www.mdpi.com/article/10.3390/atmos16080933/s1, Figure S1: Spatial distribution of mean values, and temporal variations of GPP, RSM, and PRE in the study area from 2000 to 2022. Figure S2: Absolute contributions of RSM, PRE, and RUM to MODIS GPP calculated via ridge regression. Figure S3: Decoupling the effects of RSM and PRE on MODIS GPP. Figure S4: The influence of RSM and PRE on MODIS GPP in the study area.

Author Contributions

Conceptualization, J.N.; methodology, J.N. and Z.L.; software, H.L. (Hao Lin) and Z.L.; validation, H.L. (Hongrui Li) and M.L.; formal analysis, P.Z.; investigation, Z.L.; resources, P.Z.; data curation, Z.L.; writing—original draft preparation, Z.L.; writing—review and editing, Z.W. and P.Z.; visualization, H.L. (Hongrui Li); supervision, J.N.; project administration, H.L. (Hao Lin); funding acquisition, P.Z. All authors have read and agreed to the published version of the manuscript.

Funding

The Faculty of Geographical Science at Beijing Normal University received funding from the National Natural Science Foundation of China (No. 42305148) to support this research.

Institutional Review Board Statement

Not applicable.

Informed Consent Statement

Not applicable.

Data Availability Statement

All data used in this study are openly accessible, with detailed data sources described in Section 2.2 of the article.

Acknowledgments

The authors would like to acknowledge the Global Ecology Group at the University of New Hampshire for providing the GOSIF GPP dataset, NASA for supplying the MODIS GPP dataset, and the Global Land Evaporation Amsterdam Model for contributing the soil moisture and evapotranspiration datasets. Finally, we sincerely appreciate the constructive suggestions and comments from the reviewers and executive editor, which have significantly improved this paper.

Conflicts of Interest

The authors declare no conflicts of interest.

References

  1. Zhou, S.; Williams, A.P.; Lintner, B.R.; Berg, A.M.; Zhang, Y.; Keenan, T.F.; Cook, B.I.; Hagemann, S.; Seneviratne, S.I.; Gentine, P. Soil moisture–atmosphere feedbacks mitigate declining water availability in drylands. Nat. Clim. Change 2021, 11, 38–44. [Google Scholar] [CrossRef]
  2. Humphrey, V.; Berg, A.; Ciais, P.; Gentine, P.; Jung, M.; Reichstein, M.; Seneviratne, S.I.; Frankenberg, C. Soil moisture-atmosphere feedback dominates land carbon uptake variability. Nature 2021, 592, 65–69. [Google Scholar] [CrossRef]
  3. Wang, L.; She, D.; Jun, X.; Meng, L.; Li, L. Revegetation affects the response of land surface henology to climate in Loess Plateau, China. Sci. Total Environ. 2023, 860, 160383. [Google Scholar] [CrossRef] [PubMed]
  4. Zhou, S.; Williams, A.P.; Lintner, B.R.; Findell, K.L.; Keenan, T.F.; Zhang, Y.; Gentine, P. Diminishing seasonality of subtropical water availability in a warmer world dominated by soil moisture-atmosphere feedbacks. Nat. Commun. 2022, 13, 5756. [Google Scholar] [CrossRef] [PubMed]
  5. Li, Z.; Liu, Y.; Chen, Y.; Gao, L.; Yuan, W.; Bryan, B.A.; He, B.; Duan, W.; Fang, G.; Li, Y.; et al. Future soil moisture will slowdown the advancement of ecosystem productivity in the Northern Hemisphere. Sci. Bull. 2025, 70, 347–350. [Google Scholar] [CrossRef]
  6. Piao, S.; Wang, X.; Park, T.; Chen, C.; Lian, X.; He, Y.; Bjerke, J.W.; Chen, A.; Ciais, P.; Tømmervik, H.; et al. Characteristics, drivers and feedbacks of global greening. Nat. Rev. Earth Environ. 2019, 1, 14–27. [Google Scholar] [CrossRef]
  7. Tang, X.; Li, H.; Desai, A.R.; Nagy, Z.; Luo, J.; Kolb, T.E.; Olioso, A.; Xu, X.; Yao, L.; Kutsch, W.; et al. How is water-use efficiency of terrestrial ecosystems distributed and changing on Earth? Sci. Rep. 2014, 4, 7483. [Google Scholar] [CrossRef]
  8. Yang, Y.; Guan, H.; Batelaan, O.; McVicar, T.R.; Long, D.; Piao, S.; Liang, W.; Liu, B.; Jin, Z.; Simmons, C.T. Contrasting responses of water use efficiency to drought across global terrestrial ecosystems. Sci. Rep. 2016, 6, 23284. [Google Scholar] [CrossRef] [PubMed]
  9. Fang, X.; Luo, S.; Lyu, S.; Cheng, C.; Li, Z.; Zhang, S. Numerical modeling of the responses of soil temperature and soil moisture to climate change over the Tibetan Plateau, 1961–2010. Int. J. Climatol. 2021, 41, 4134–4150. [Google Scholar] [CrossRef]
  10. Deng, Y.; Wang, S.; Bai, X.; Luo, G.; Wu, L.; Cao, Y.; Li, H.; Li, C.; Yang, Y.; Hu, Z.; et al. Variation trend of global soil moisture and its cause analysis. Ecol. Indic. 2020, 110, 5939. [Google Scholar] [CrossRef]
  11. Wang, R.; Li, L.; Chen, L.; Ning, L.; Yuan, L.; Lü, G. Respective contributions of precipitation and potential evapotranspiration to long—term changes in global drought duration and intensity. Int. J. Climatol. 2022, 42, 10126–10137. [Google Scholar] [CrossRef]
  12. He, Q.; Ju, W.; Li, X. Response of Global Terrestrial Carbon Fluxes to Drought from 1981 to 2016. Atmosphere 2023, 14, 229. [Google Scholar] [CrossRef]
  13. Zhao, H.; Jia, G.; Xu, X.; Zhang, A. Earlier Precipitation Enhances Dryland Annual Primary Production. J. Geophys. Res. Biogeosci. 2023, 128, e2022JG007127. [Google Scholar] [CrossRef]
  14. Fang, Q.; Wang, G.; Xue, B.; Liu, T.; Kiem, A. How and to what extent does precipitation on multi-temporal scales and soil moisture at different depths determine carbon flux responses in a water-limited grassland ecosystem? Sci. Total Environ. 2018, 635, 1255–1266. [Google Scholar] [CrossRef]
  15. Humphrey, V.; Zscheischler, J.; Ciais, P.; Gudmundsson, L.; Sitch, S.; Seneviratne, S.I. Sensitivity of atmospheric CO2 growth rate to observed changes in terrestrial water storage. Nature 2018, 560, 628–631. [Google Scholar] [CrossRef] [PubMed]
  16. Smith, W.K.; Dannenberg, M.P.; Yan, D.; Herrmann, S.; Barnes, M.L.; Barron-Gafford, G.A.; Biederman, J.A.; Ferrenberg, S.; Fox, A.M.; Hudson, A.; et al. Remote sensing of dryland ecosystem structure and function Progress, challenges, and opportunities. Remote Sens. Environ. 2019, 233, 111401. [Google Scholar] [CrossRef]
  17. Green, J.K.; Seneviratne, S.I.; Berg, A.M.; Findell, K.L.; Hagemann, S.; Lawrence, D.M.; Gentine, P. Large influence of soil moisture on long-term terrestrial carbon uptake. Nature 2019, 565, 476–479. [Google Scholar] [CrossRef]
  18. Dang, C.; Shao, Z.; Huang, X.; Qian, J.; Cheng, G.; Ding, Q.; Fan, Y. Assessment of the importance of increasing temperature and decreasing soil moisture on global ecosystem productivity using solar-induced chlorophyll fluorescence. Glob. Change Biol. 2022, 28, 2066–2080. [Google Scholar] [CrossRef]
  19. Liu, X.; Feng, X.; Fu, B. Changes in global terrestrial ecosystem water use efficiency are closely related to soil moisture. Sci. Total Environ. 2020, 698, 134165. [Google Scholar] [CrossRef]
  20. Peng, J.; Tang, J.; Xie, S.; Wang, Y.; Liao, J.; Chen, C.; Sun, C.; Mao, J.; Zhou, Q.; Niu, S. Evidence for the acclimation of ecosystem photosynthesis to soil moisture. Nat. Commun. 2024, 15, 9795. [Google Scholar] [CrossRef]
  21. Chang, Q.; He, H.; Ren, X.; Zhang, L.; Feng, L.; Lv, Y.; Zhang, M.; Xu, Q.; Liu, W.; Zhang, Y.; et al. Soil moisture drives the spatiotemporal patterns of asymmetry in vegetation productivity responses across China. Sci. Total Environ. 2023, 855, 158819. [Google Scholar] [CrossRef]
  22. Sun, W.; Zhou, S.; Yu, B.; Zhang, Y.; Keenan, T.; Fu, B. Soil moisture-atmosphere interactions drive terrestrial carbon-water trade-offs. Commun. Earth Environ. 2025, 6, 169. [Google Scholar] [CrossRef]
  23. Shi, J.; Liu, M.; Li, Y.; Guan, C. Response of total primary productivity of vegetation to meteorological drought in arid and semi-arid regions of China. J. Arid. Environ. 2025, 228, 105346. [Google Scholar] [CrossRef]
  24. Xu, S.; Gentine, P.; Li, L.; Wang, L.; Yu, Z.; Dong, N.; Ju, Q.; Zhang, Y. Response of ecosystem productivity to high vapor pressure deficit and low soil moisture: Lessons learned from the global eddy—Covariance observations. Earth’s Future 2023, 11, e2022EF003252. [Google Scholar] [CrossRef]
  25. Zhao, M.; Heinsch, F.A.; Nemani, R.R.; Running, S.W. Improvements of the MODIS terrestrial gross and net primary production global data set. Remote Sens. Environ. 2005, 95, 164–176. [Google Scholar] [CrossRef]
  26. Zhang, Y.; Ye, A. Would the obtainable gross primary productivity (GPP) products stand up? A critical assessment of 45 global GPP products. Sci. Total Environ. 2021, 783, 146965. [Google Scholar] [CrossRef]
  27. Qiu, R.; Han, G.; Ma, X.; Xu, H.; Shi, T.; Zhang, M. A Comparison of OCO-2 SIF, MODIS GPP, and GOSIF Data from Gross Primary Production (GPP) Estimation and Seasonal Cycles in North America. Remote Sens. 2020, 12, 258. [Google Scholar] [CrossRef]
  28. Frankenberg, C.; Fisher, J.B.; Worden, J.; Badgley, G.; Saatchi, S.S.; Lee, J.-E.; Toon, G.C.; Butz, A.; Jung, M.; Kuze, A.; et al. New global observations of the terrestrial carbon cycle from GOSAT: Patterns of plant fluorescence with gross primary productivity. Geophys. Res. Lett. 2011, 38, 17. [Google Scholar] [CrossRef]
  29. Cai, Y.; Zhang, F.; Duan, P.; Jim, C.Y.; Chan, N.W.; Shi, J.; Liu, C.; Wang, J.; Bahtebay, J.; Ma, X. Vegetation cover changes in China induced by ecological restoration-protection projects and land-use changes from 2000 to 2020. Catena 2022, 217, 106530. [Google Scholar] [CrossRef]
  30. Zhu, B.; Zhang, Q.; Yang, J.-H.; Li, C.-H. Response of Potential Evapotranspiration to Warming and Wetting in Northwest China. Atmosphere 2022, 13, 353. [Google Scholar] [CrossRef]
  31. Niu, J.Q.; Liu, Z.J.; Chen, F.Y.; Liu, G.J.; Zhou, J.L.; Zhou, P.; Li, H.R.; Li, M.Y. Variations of soil moisture and its influencing factors in arid and semi-arid areas, China. J. Arid. Land 2025, 17, 624–643. [Google Scholar] [CrossRef]
  32. Li, X.; Xiao, J. Mapping Photosynthesis Solely from Solar-Induced Chlorophyll Fluorescence: A Global, Fine-Resolution Dataset of Gross Primary Production Derived from OCO-2. Remote Sens. 2019, 11, 2563. [Google Scholar] [CrossRef]
  33. Xiao, J.; Li, X.; He, B.; Arain, M.A.; Beringer, J.; Desai, A.R.; Emmel, C.; Hollinger, D.Y.; Krasnova, A.; Mammarella, I.; et al. Solar-induced chlorophyll fluorescence exhibits a universal relationship with gross primary productivity across a wide variety of biomes. Glob. Change Biol. 2019, 25, e4–e6. [Google Scholar] [CrossRef]
  34. Baia, J.; Zhanga, H.; Suna, R.; Lic, X.; Xiao, J.; Wang, Y. Estimation of global GPP from GOME-2 and OCO-2 SIF by considering the dynamic variations of GPP-SIF relationship. Agric. For. Meteorol. 2022, 326, 109180. [Google Scholar] [CrossRef]
  35. Qi, G.; She, D.; Xia, J.; Song, J.; Jiao, W.; Li, J.; Liu, Z. Soil moisture plays an increasingly important role in constraining vegetation productivity in China over the past two decades. Agric. For. Meteorol. 2024, 356, 110193. [Google Scholar] [CrossRef]
  36. Ran, Y.H.; Li, X.; Lu, L.; Li, Z.Y. Large-scale land cover mapping with the integration of multi-source information based on the Dempster–Shafer theory. Int. J. Geogr. Inf. Sci. 2012, 26, 169–191. [Google Scholar] [CrossRef]
  37. Miralles, D.G.; Bonte, O.; Koppa, A.; Baez-Villanueva, O.M.; Tronquo, E.; Zhong, F.; Beck, H.E.; Hulsman, P.; Dorigo, W.; Verhoest, N.E.C.; et al. GLEAM4: Global land evaporation and soil moisture dataset at 0.1 resolution from 1980 to near present. Sci. Data 2025, 12, 416. [Google Scholar] [CrossRef]
  38. Yang, S.; Zeng, J.; Fan, W.; Cui, Y. Evaluating Root-Zone Soil Moisture Products from GLEAM, GLDAS, and ERA5 Based on In Situ Observations and Triple Collocation Method over the Tibetan Plateau. J. Hydrometeorol. 2022, 23, 1861–1878. [Google Scholar] [CrossRef]
  39. Liu, J.; Zhao, J.; He, J.; Qu, J.; Xing, Y.; Du, R.; Chen, S.; Tang, X.; Wang, L.; Yue, C. Spatiotemporal Trend and Influencing Factors of Surface Soil Moisture in Eurasian Drylands over the Past Four Decades. Forests 2025, 16, 589. [Google Scholar] [CrossRef]
  40. Li, H.; Liu, F.; Zhang, S.; Zhang, C.; Zhang, C.; Ma, W.; Luo, J. Drying–Wetting Changes of Surface Soil Moisture and the Influencing Factors in Permafrost Regions of the Qinghai-Tibet Plateau, China. Remote Sens. 2022, 14, 2915. [Google Scholar] [CrossRef]
  41. Funk, C.; Peterson, P.; Landsfeld, M.; Pedreros, D.; Verdin, J.; Shukla, S.; Husak, G.; Rowland, J.; Harrison, L.; Hoell, A.; et al. The climate hazards infrared precipitation with stations--a new environmental record for monitoring extremes. Sci. Data 2015, 2, 150066. [Google Scholar] [CrossRef]
  42. Gao, F.; Zhang, Y.; Ren, X.; Yao, Y.; Hao, Z.; Cai, W. Evaluation of CHIRPS and its application for drought monitoring over the Haihe River Basin, China. Nat. Hazards 2018, 92, 155–172. [Google Scholar] [CrossRef]
  43. Du, H.; Tan, M.L.; Zhang, F.; Chun, K.P.; Li, L.; Kabir, M.H. Evaluating the effectiveness of CHIRPS data for hydroclimatic studies. Theor. Appl. Climatol. 2023, 155, 1519–1539. [Google Scholar] [CrossRef]
  44. Ocampo-Marulanda, C.; Fernández-Álvarez, C.; Cerón, W.L.; Canchala, T.; Carvajal-Escobar, Y.; Alfonso-Morales, W. A spatiotemporal assessment of the high-resolution CHIRPS rainfall dataset in southwestern Colombia using combined principal component analysis. Ain Shams Eng. J. 2022, 13, 101739. [Google Scholar] [CrossRef]
  45. Sen, P.K. Estimates of the Regression Coefficient Based on Kendall’s Tau. J. Am. Stat. Assoc. 1968, 63, 1379–1389. [Google Scholar] [CrossRef]
  46. Ali, A.; Lebel, T. The Sahelian standardized rainfall index revisited. Int. J. Climatol. 2008, 29, 1705–1714. [Google Scholar] [CrossRef]
  47. Nguyen, H.; Wheeler, M.C.; Otkin, J.A.; Cowan, T.; Frost, A.; Stone, R. Using the evaporative stress index to monitor flash drought in Australia. Environ. Res. Lett. 2019, 14, 064016. [Google Scholar] [CrossRef]
  48. Deng, Y.; Wang, X.; Wang, K.; Ciais, P.; Tang, S.; Jin, L.; Li, L.; Piao, S. Responses of vegetation greenness and carbon cycle to extreme droughts in China. Agric. For. Meteorol. 2021, 298-299, 108307. [Google Scholar] [CrossRef]
  49. Kang, J.; Jin, R.; Li, X.; Zhang, Y.; Zhu, Z. Spatial Upscaling of Sparse Soil Moisture Observations Based on Ridge Regression. Remote Sens. 2018, 10, 192. [Google Scholar] [CrossRef]
  50. Wang, Z.; Peñuelas, J.; Tagesson, T.; Smith, W.K.; Wu, M.; He, W.; Sitch, S.; Wang, S. Evolution of Global Terrestrial Gross Primary Productivity Trend. Ecosyst. Health Sustain. 2024, 10, 0278. [Google Scholar] [CrossRef]
  51. Wang, S.; Fu, B.; Wei, F.; Piao, S.; Maestre, F.T.; Wang, L.; Jiao, W.; Liu, Y.; Li, Y.; Li, C.; et al. Drylands contribute disproportionately to observed global productivity increases. Sci. Bull. 2023, 68, 224–232. [Google Scholar] [CrossRef] [PubMed]
  52. Zhao, Y.; Shi, H. Temporal and Spatial Variation Characteristics of Soil Moisture in Spring in the Arid Regions of Northwest China in the Past 60s years. J. Geosci. Environ. Prot. 2022, 10, 273–282. [Google Scholar] [CrossRef]
  53. Xu, L.; Zheng, C.; Ma, Y. Variations in precipitation extremes in the arid and semi-arid regions of China. Int. J. Climatol. 2020, 41, 1542–1554. [Google Scholar] [CrossRef]
  54. Shang, K.; Liu, X.; Xie, X.; Sha, Y.; Zhao, X.; Liu, J.; Wang, A. Synergistic Impact of Midlatitude Westerly and East Asian Summer Monsoon on Mid-Summer Precipitation in North China. Atmosphere 2025, 16, 658. [Google Scholar] [CrossRef]
  55. Zhang, G.; Nan, Z.; Zhao, L.; Liang, Y.; Cheng, G. Qinghai-Tibet Plateau wetting reduces permafrost thermal responses to climate warming. Earth Planet. Sci. Lett. 2021, 562, 116858. [Google Scholar] [CrossRef]
  56. Sun, Y.; Zhao, G.; Zheng, Z.; Zhu, Y.; Zhu, J.; Di, Y.; Gao, J.; Cai, M.; Zhang, Y. Wetting-warming climate increases ecosystem carbon use efficiency of Chinese arid and semi-arid ecosystem. Agric. For. Meteorol. 2024, 351, 110018. [Google Scholar] [CrossRef]
  57. Yu, T.; Jiapaer, G.; Bao, A.; Yuan, Y.; Bao, J.; Van de Voorde, T. Soil moisture dominates gross primary productivity variation during severe droughts in Central Asia. Ecol. Inform. 2025, 86, 103076. [Google Scholar] [CrossRef]
  58. Zhao, H.; Jia, G.; Xu, X.; Zhang, A.; Wang, H. Divergent effects of intensified precipitation on primary production in global drylands. Sci. Total Environ. 2023, 892, 164736. [Google Scholar] [CrossRef] [PubMed]
  59. Zhao, Y.; Wang, L.; Jiang, Q.; Wang, Z. Sensitivity of gross primary production to precipitation and the driving factors in China’s agricultural ecosystems. Sci. Total Environ. 2024, 948, 174938. [Google Scholar] [CrossRef] [PubMed]
  60. Wang, C.; Chen, J.; Lee, S.-C.; Xiong, L.; Su, T.; Lin, Q.; Xu, C.-Y. Response and recovery times of vegetation productivity under drought stress: Dominant factors and relationships. J. Hydrol. 2025, 655, 132945. [Google Scholar] [CrossRef]
  61. Xu, S.; Ji, X.; Jin, B.; Zhang, J. Root distribution of three dominant desert shrubs and their water uptake dynamics. J. Plant Ecol. 2016, 10, 780–790. [Google Scholar] [CrossRef]
  62. Xue, S.; Wu, G. A Study of the Dependence between Soil Moisture and Precipitation in different Ecoregions of the Northern Hemisphere. EGUsphere 2025, 2025, 1–39. [Google Scholar]
  63. Prudhomme, C.; Giuntoli, I.; Robinson, E.L.; Clark, D.B.; Arnell, N.W.; Dankers, R.; Fekete, B.M.; Franssen, W.; Gerten, D.; Gosling, S.N.; et al. Hydrological droughts in the 21st century, hotspots and uncertainties from a global multimodel ensemble experiment. Proc. Natl. Acad. Sci. USA 2014, 111, 3262–3267. [Google Scholar] [CrossRef]
  64. Dai, Y.; Zeng, X.; Dickinson, R.E.; Baker, I.; Bonan, G.B.; Bosilovich, M.G.; Denning, A.S.; Dirmeyer, P.A.; Houser, P.R.; Niu, G. The common land model. Bull. Am. Meteorol. Soc. 2003, 84, 1013–1024. [Google Scholar] [CrossRef]
  65. Huang, J.; Yu, H.; Guan, X.; Wang, G.; Guo, R. Accelerated dryland expansion under climate change. Nat. Clim. Change 2015, 6, 166–171. [Google Scholar] [CrossRef]
  66. Yang, S.; Chen, K.; Zhu, B.; Tian, Y.; Zeng, Z.; Liu, M.; Zheng, C. How does irrigation alter the water, carbon, and nitrogen budgets in a large endorheic river basin? J. Hydrol. 2022, 613, 128317. [Google Scholar] [CrossRef]
  67. Wang, X.; Chen, G.; Wu, Q.; Cao, L.; Awange, J.; Song, Y.; Wu, M. Spatio-temporal patterns and drivers of carbon–water coupling in frozen soil zones across the gradients of freezing over the Qinghai-Tibet Plateau. J. Hydrol. 2023, 621, 129674. [Google Scholar] [CrossRef]
  68. Liao, D.; Niu, J.; Ciais, P.; Du, T.; Zhang, B.; Kang, S. Changing Climate Threatens Irrigation Benefits of Maize Gross Primary Productivity in China. Earth’s Future 2024, 12, e2022EF003474. [Google Scholar] [CrossRef]
  69. Zhou, T.; Yang, H.; Qiu, X.; Sun, H.; Song, P.; Yang, W. China’s grassland ecological compensation policy achieves win-win goals in Inner Mongolia. Environ. Res. Commun. 2023, 5, 031007. [Google Scholar] [CrossRef]
Figure 1. Overview of the study area.
Atmosphere 16 00933 g001
Figure 2. Conceptual framework of data processing and analytical methods.
Atmosphere 16 00933 g002
Figure 3. (a), (b), and (c), respectively, show the spatial trends of GPP, RSM, and PRE in the study area from 2000 to 2022, while (d) presents statistics on pixel-level changes in GPP, RSM, and PRE. The hatched areas indicate regions where the results passed statistical significance tests (p < 0.05).
Atmosphere 16 00933 g003
Figure 4. (a) shows the spatial distribution of partial correlation coefficients between RSM and GPP. (b) displays the spatial distribution of partial correlation coefficients between PRE and GPP. (c) presents the spatial distribution of partial correlation coefficients between RSM and PRE. (d) The violin plots depict the correlation coefficients between RSM and GPP, PRE and GPP, and RSM and PRE. The red dots indicate the median, the boxes represent the interquartile range, and the thin lines extend to the 5th and 95th percentiles.
Atmosphere 16 00933 g004
Figure 5. Absolute contributions of RSM, PRE, and RUM to GPP calculated via ridge regression; (a) spatial distribution of RSM’s absolute contribution to GPP; (b) spatial distribution of PRE’s absolute contribution to GPP; (c) spatial distribution of RUM’s absolute contribution to GPP; (d) pixel-level statistics of absolute contributions from RSM, PRE, and RUM to GPP across different land cover types.
Atmosphere 16 00933 g005
Figure 6. Decoupling the effects of RSM and PRE on GPP. (a) Summer mean standardized anomalies of RSM and GPP, grouped by PRE standardized anomalies. Circles indicate the mean GPP-standardized anomalies within each PRE anomaly bin; (b) summer mean standardized anomalies of PRE and GPP, grouped by RSM standardized anomalies. Circles represent the mean GPP-standardized anomalies within each RSM anomaly bin, (c,d) boxplot distributions of GPP-standardized anomalies corresponding to different RSM and PRE anomaly conditions. Red squares denote the respective mean values, while circles show individual GPP-standardized anomaly values for each condition.
Atmosphere 16 00933 g006
Figure 7. The influence of RSM and PRE on ecosystem productivity in the study area, where panels (a,c,e), display the spatial distribution of GPP under high-RSM conditions (ΔSAGPP(SARSM|SAPRE)), high-PRE conditions (ΔSAGPP(SAPRE|SARSM)), and their absolute difference (ΔSAGPP(SARSM|SAPRE) − ΔSAGPP(SAPRE|SARSM)), while panels (b,d,f), reveal the effects of RSM and PRE on GPP across different vegetation types.
Atmosphere 16 00933 g007
Figure 8. The sensitivity of RSM and PRE to aridity gradients, with (a) illustrating the impact of RSM (ΔSAGPP(SARSM|SAPRE)) along aridity gradients, (b) showing the influence of PRE (ΔSAGPP(SAPRE|SARSM)) across aridity gradients, and (c) displaying GPP variations under different drought conditions.
Atmosphere 16 00933 g008
Table 1. The effects of standardized anomalies of RSM and PRE on GPP-standardized anomalies under different conditions across various vegetation types.
IndexInfluenceASAGLSFBOSVLCW
ΔSAGPP(SARSM|SAPRE)Positive78.1279.1974.6977.9176.7475.54
Negative21.8820.8125.3122.0923.2624.46
ΔSAGPP(SAPRE|SARSM)Positive65.5366.2862.2264.4864.2361.16
Negative34.4733.7237.7835.5235.7738.84
ΔSAGPP(SARSM|SAPRE) − ΔSAGPP(SAPRE|SARSM)Positive62.1361.2465.1162.9761.7966.97
Negative37.8738.7634.8937.2138.2133.03
Note: ASA, arid and semi-arid areas of China; GLS, grasslands; F, forest; BOSVL, barren or sparsely vegetated lands; C, croplands; W, wetlands. The abbreviations are the same in the following tables and figures.
Disclaimer/Publisher’s Note: The statements, opinions and data contained in all publications are solely those of the individual author(s) and contributor(s) and not of MDPI and/or the editor(s). MDPI and/or the editor(s) disclaim responsibility for any injury to people or property resulting from any ideas, methods, instructions or products referred to in the content.

