Article

Quantifying Ozone-Driven Forest Losses in Southwestern China (2019–2023)

1
Yunnan Key Laboratory of Meteorological Disasters and Climate Resources in the Greater Mekong Subregion, Yunnan University, Kunming 650500, China
2
State Key Laboratory of Atmospheric Environment and Extreme Meteorology, Institute of Atmospheric Physics, Chinese Academy of Sciences, Beijing 100029, China
*
Author to whom correspondence should be addressed.
Atmosphere 2025, 16(8), 927; https://doi.org/10.3390/atmos16080927 (registering DOI)
Submission received: 21 June 2025 / Revised: 14 July 2025 / Accepted: 28 July 2025 / Published: 31 July 2025
(This article belongs to the Special Issue Coordinated Control of PM2.5 and O3 and Its Impacts in China)

Abstract

As a key tropospheric photochemical pollutant, ground-level ozone (O3) poses significant threats to ecosystems through its strong oxidative capacity. With China’s rapid industrialization and urbanization, worsening O3 pollution has emerged as a critical environmental concern. This study examines O3’s impacts on forest ecosystems in Southwestern China (Yunnan, Guizhou, Sichuan, and Chongqing), which harbors crucial forest resources. We analyzed high-resolution monitoring data from over 200 stations (2019–2023), employing spatial interpolation to derive the regional maximum daily 8 h average O3 (MDA8-O3, ppb) and accumulated O3 exposure over 40 ppb (AOT40) metrics. Through AOT40-based exposure–response modeling, we quantified the forest relative yield losses (RYL), economic losses (ECL) and ECL/GDP (GDP: gross domestic product) ratios in this region. Our findings reveal alarming O3 increases across the region, with a mean annual MDA8-O3 anomaly trend of 2.4% year−1 (p < 0.05). Provincial MDA8-O3 anomaly trends varied from 1.4% year−1 (Yunnan, p = 0.059) to 4.3% year−1 (Guizhou, p < 0.001). Strong correlations (r > 0.85) between annual RYL and annual MDA8-O3 anomalies demonstrate the detrimental effects of O3 on forest biomass. The RYL trajectory showed an initial decline during 2019–2020 and accelerated losses during 2020–2023, peaking at 13.8 ± 6.4% in 2023. Provincial variations showed a 5-year averaged RYL ranging from 7.10% (Chongqing) to 15.85% (Yunnan). O3 exposure caused annual ECL/GDP averaging 4.44% for Southwestern China, with Yunnan suffering the most severe consequences (ECL/GDP averaging 8.20%, ECL averaging CNY 29.8 billion). These results suggest that O3-driven forest degradation may intensify, potentially undermining the regional carbon sequestration capacity, highlighting the urgent need for policy interventions. We recommend enhanced monitoring networks and stricter control methods to address these challenges.

1. Introduction

Ozone (O3) is a key secondary pollutant in the troposphere, forming through photochemical reactions involving nitrogen oxides (NOx) and volatile organic compounds (VOCs) under favorable meteorological conditions [1]. While emission controls have successfully reduced the peak O3 levels in some regions [2], background concentrations continue to rise significantly, particularly in rapidly developing urban and industrial areas, where exceedances occur with increasing frequency [2,3,4]. This concerning pattern extends to Southwestern China, where monitoring data reveal steadily rising O3 concentrations, attributed to the synergistic effects of local emissions and long-range transport [5,6,7].
Elevated O3 concentrations pose serious threats to terrestrial ecosystems, e.g., suppressing photosynthetic activity, reducing crop productivity, decreasing forest biomass, and impairing the carbon sequestration capacity [8,9,10,11,12,13]. O3 pollution has significantly reduced global forest productivity, with China’s annual forest biomass growth declining by 11–13% [14]. Deciduous broadleaf forests show greater O3 sensitivity than evergreen coniferous forests [15,16], exhibiting biomass losses of up to 22.5% in temperate/continental regions, compared to <5% in boreal/subtropical evergreens.
Forests, as the principal components of terrestrial ecosystems, play an irreplaceable role in global carbon cycling, biodiversity conservation, and climate regulation. The four provinces in Southwestern China (Yunnan, Guizhou, Sichuan, and Chongqing) possess abundant forest resources. According to the latest data from provincial forestry departments, Yunnan Province ranks first in the nation for its living tree stock volume, while Sichuan Province has the largest forest area. These forests serve as key carbon sinks for achieving China’s “Dual Carbon” goals [17]. Current research on the impact of O3 pollution on forests primarily focuses on nationwide analyses [14,18], leaving a noticeable gap in systematic studies of the southwestern region during 2019–2023.
Therefore, this study aims to answer the following questions: whether the O3 concentrations in Southwest China exhibited a significant increasing trend from 2019 to 2023 and whether this increase has resulted in substantial losses of both biomass and economic value in the region’s forest ecosystems. By examining these aspects, we seek to provide a comprehensive assessment of the impacts of O3 on the forest ecosystems of this critical region. This study integrates O3 monitoring data with forest distribution characteristics, using O3 exposure metrics and exposure–response equations, to quantify changes in forest biomass caused by O3 over the past five years. Economic losses are also considered and evaluated. The findings will provide a valuable reference for formulating regional environmental protection policies and contribute significantly to achieving ecological civilization objectives.

2. Materials and Methods

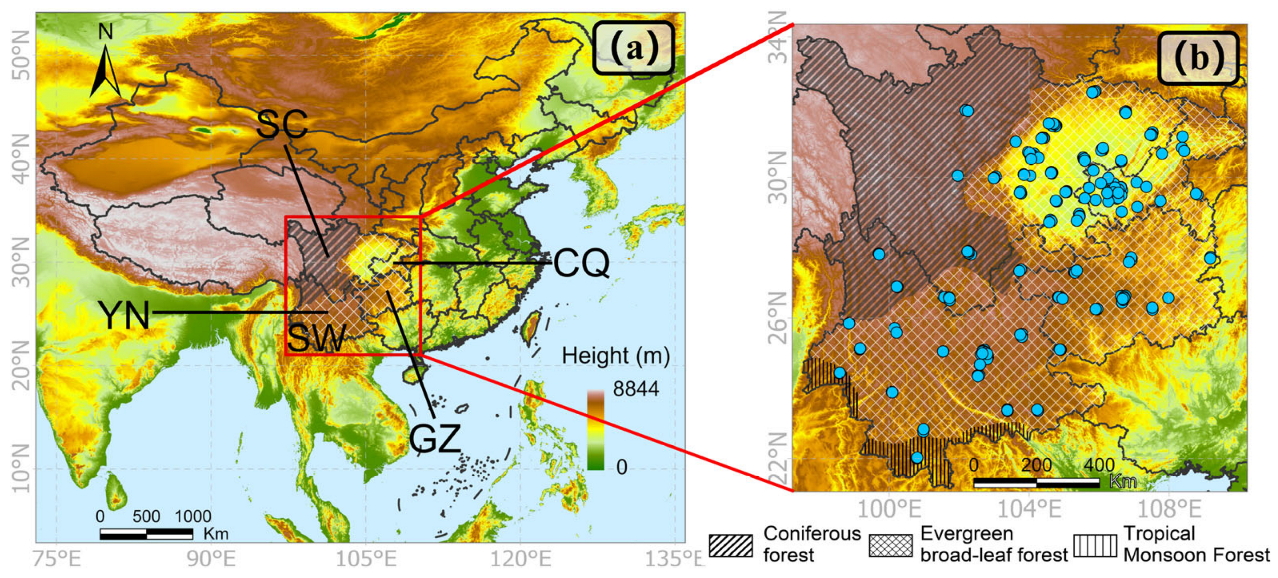
2.1. O3 Monitoring Data and Forest Type Distribution

This study analyzes ground-level O3 concentrations across Southwestern China from 2019 to 2023, utilizing data from over 200 monitoring stations (Figure 1b). These data were collected from the China National Environmental Monitoring Centre (https://quotsoft.net/air/, last access on 21 June 2025), based on a data completeness criterion (<20% missing rate). Following the study of Wang et al. [19], we implemented a rigorous quality control protocol involving (1) outlier removal using the three standard deviations (3σ) criterion, applied to daily O3 variation patterns to exclude observations exceeding 3σ deviations from the daily mean, and (2) a tiered missing data treatment where stations with 10–20% missing data were gap-filled using annual mean substitution, while those with <10% missing data underwent linear time-series interpolation, thereby preserving temporal consistency while minimizing interpolation errors.
Southwestern China’s forests comprise three main types (Figure 1b): coniferous forests (northwest), evergreen broadleaf forests (eastern/central/southern regions), and tropical rainforests (Southern Yunnan) [20]. Different forest types exhibit varying responses to O3 exposure, as detailed in Section 2.2.

2.2. O3 Metrics

2.2.1. MDA8-O3

The maximum daily 8 h average O3 concentration (MDA8-O3, ppb), the internationally established metric for the evaluation of O3 pollution [21], is calculated using Equation (1) for day i. In Southwestern China, observational data demonstrate distinct diurnal patterns, with peak O3 concentrations consistently occurring between 12:00 and 20:00, exhibiting a characteristic daytime elevation and nighttime depression:
[ M D A 8 O 3 ] i = 1 8 × 12 : 00 20 : 00 [ O 3 ] i
where [ M D A 8 O 3 ] i is the calculated 8 h average O3 concentration for day i, and [ O 3 ] i is the hourly O3 concentration from 12:00 to 20:00 on that day.

2.2.2. MDA8-O3 Anomaly

To better quantify monthly and interannual variations in O3 pollution, this study adopts the maximum daily 8 h average O3 (MDA8-O3) anomaly metric (2) suggested by Lu et al. [22]. The monthly anomaly for a certain year ( A y , m ) is calculated as the percentage deviation between the observed MDA8-O3 concentration ( M y , m ) and the corresponding 5-year reference mean for that month ( M ¯ m ):
A y , m = M y , m M ¯ m M ¯ m × 100 %  
where M y , m represents the MDA8-O3 concentration in month m of year y, while M ¯ m denotes the arithmetic mean of the MDA8-O3 concentrations for month m of all five years. This metric effectively quantifies the deviation in O3 pollution in a specific month relative to its average state.

2.2.3. AOT40

The accumulated O3 exposure over 40 ppb (AOT40) is a standard metric for assessing vegetation O3 exposure. It calculates the cumulative sum of hourly O3 concentrations exceeding 40 ppb during daylight hours (subtracting 40 ppb from each measurement) over a specified period (3), typically measured at canopy height. For vegetation risk assessment, AOT40 is computed during the growing season using daylight hours [23]. The accumulated AOT40 values during the growing season are typically large when expressed in ppb·h. Therefore, standard practice requires unit conversion (1 ppm = 1000 ppb), achieved by dividing the ppb·h value by 1000 to obtain ppm·h:
A O T 40   p p m · h = i = 1 n O 3 i 40 1000 ,   O 3 i > 40   p p b
where [O3]i represents the hourly O3 concentration, and n denotes the number of daylight hours exceeding 40 ppb during the growing season. This study defines the daylight period for AOT40 calculation as 07:00–20:00 (UTC-8). To characterize the growing season, we employed the comprehensive phenological dataset for Asian vegetation developed by Marco et al. [24], which includes detailed growing season parameters encompassing the Southwestern China region considered in this study.

2.3. Loss Metrics

2.3.1. Relative Yield Loss (RYL) and Exposure–Response Function

The forest relative yield loss (RYL) is calculated as
R Y L = 1.0 R Y × 100 %
where RY (relative yield) denotes the biomass ratio between O3-exposed and O3-free conditions [25]. Southwestern China’s natural forests were classified into six distinct ecological regions [20]. To streamline our analysis, we consolidated all subtropical evergreen broadleaf forest types into a single category and employed a unified exposure–response function, while combining tropical and subtropical forests as an integrated biome. These treatments were performed in accordance with the methods described by Marco et al. [24] and Feng et al. [14]. Consequently, the forest types in Figure 1 could be simplified into two categories for calculation: coniferous forests and evergreen broadleaf forests.
For coniferous forests, we use the following O3 exposure–response function (5), which was proposed by Buker et al. [26] and adopted by Feng et al. [14] for national evaluation in China:
R Y   ( c o n i f e r o u s   f o r e s t s ) = 1 0.0021 × A O T 40
For subtropical/tropical evergreen broadleaf forests, we developed a comprehensive O3 response Equation (6) based on an analysis of 15 native broadleaf species summarized by Feng and Peng [27]. The model is statistically robust (p < 0.01, R2 = 0.41) and provides better regional applicability than previous coefficients (−0.0061) derived from non-native species studies from Europe [26], with a difference of less than 15%.
R Y   e v e r g r e e n   b r o a d l e a f   f o r e s t s = 1.028 0.0053 × A O T 40

2.3.2. Economic Losses (ECL)

Based on the economic loss assessment methodology developed by Ren et al. [25], this study quantifies O3-induced economic losses by integrating the relative yield loss (RYL) with the annual gross output value of the forestry–grassland industry (FGO) from the China Forestry and Grassland Statistical Yearbook (https://www.forestry.gov.cn/c/www/tjnj.jhtml, last access on 21 June 2025), which includes the primary industrial output values from 2019 to 2022 (the 2023 data have not been released yet). The primary industry gross domestic product (GDP) data were collected from the China Statistical Yearbook (https://www.stats.gov.cn/sj/ndsj/, last access on 21 June 2025) for comprehensive damage ratio analysis (ECL/GDP). The formula for ECL is
E C L = R Y L × F G O 1.0 R Y L

2.4. Cartographic Analysis Methodology

This study developed a Python-based (version 3.11.5) spatial analysis framework, built upon the scientific computing capabilities of NumPy (v1.26.4), Pandas (v2.2.1), SciPy (v1.12.0), and MetPy (v1.6.2), to characterize the O3 pollution distribution and ecological impacts in Southwestern China, explicitly accounting for the region’s uneven monitoring network. The methodology incorporated radial basis function interpolation for MDA8-O3 mapping, followed by a multi-step aggregation process: initial interpolation at monitoring stations and conversion to standardized 500 × 500 grids (0.026° × 0.026°) for annual AOT40 and RYL analysis and 80 × 80 grids (0.163° × 0.166°) for daily MDA8-O3 assessment. The grid-based approach, combined with provincial-level spatial averaging, effectively minimized sampling bias while maintaining spatial representativeness across the region.

3. Results and Discussion

3.1. Distributions of O3 Metrics and RYLs

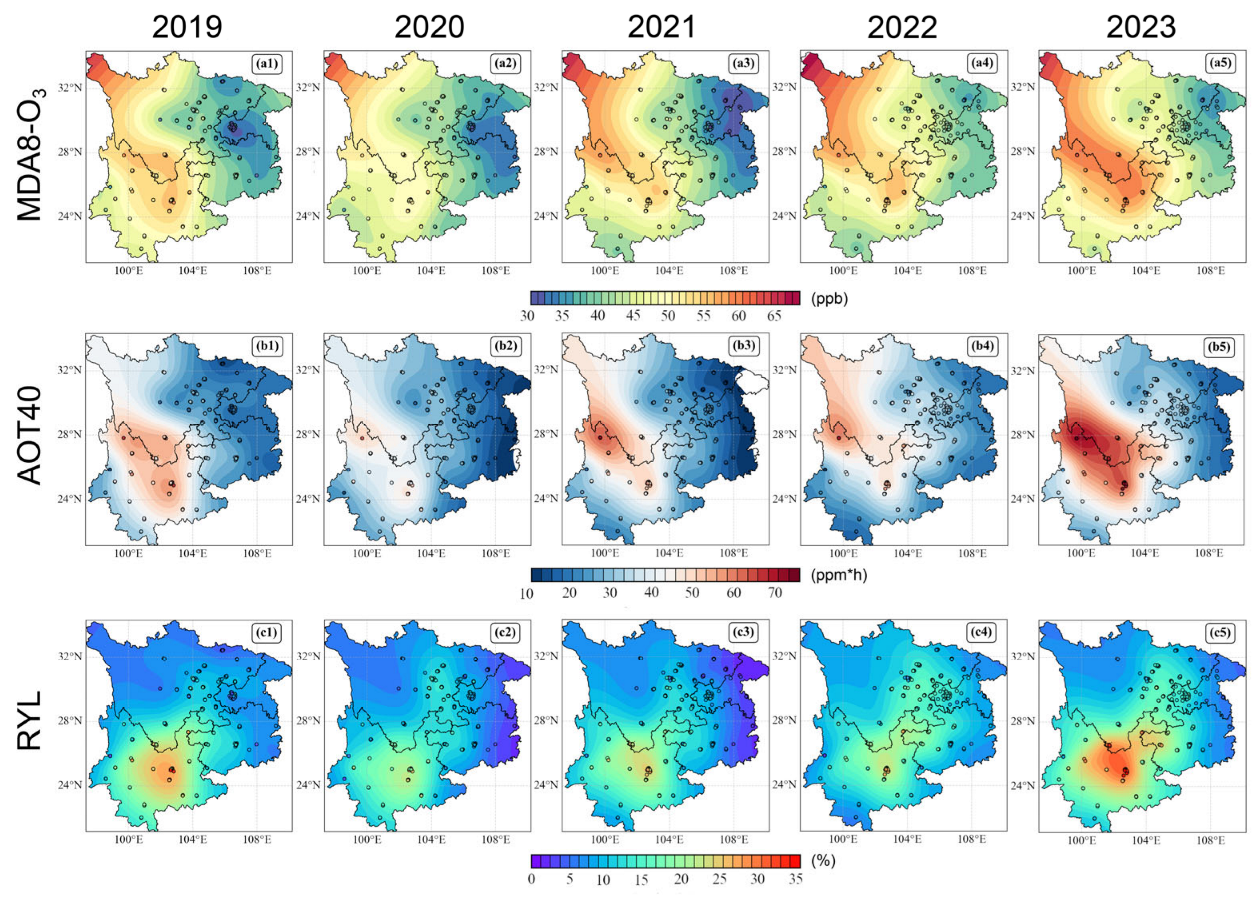
3.1.1. Spatial and Temporal Characteristics

For MDA8-O3, the overall pattern shows that high values in the southwestern region primarily occur in Western Sichuan and Central Yunnan, reaching 55–60 ppb, with the maximum value observed in Northwestern Sichuan at 65 ppb (Figure 2a). Low values are mainly concentrated in Chongqing and its surrounding areas, with annual averages typically ranging between 30 and 40 ppb. Regarding interannual variations in O3, a notable decline in concentrations was observed in 2020 compared to other years, likely attributable to significant anthropogenic emission reductions during the COVID-19 pandemic. For instance, in North–Central Yunnan, levels decreased from approximately 55 ppb in 2019 to 50 ppb in 2020. The data also reveal that the O3 concentrations in 2022 and 2023 were significantly higher (~5–10 ppb) than in other years (Figure 2a).
Using the hourly O3 concentrations during the growing season, the AOT40 values across the region were calculated (Figure 2b). Their spatial distribution exhibits similarities with that of MDA8-O3, wherein areas with higher O3 concentrations generally correspond to larger AOT40 values. However, due to variations in growing season length, the two metrics are not entirely consistent—longer growing seasons result in greater cumulative O3 exposure (Figure 2b). Additionally, the 40 ppb threshold amplifies the exposure differential between regions with higher and lower MDA8-O3 values. In eastern parts of the southwestern region, the AOT40 values typically range between 10 and 30 ppm h, whereas, in the border area between Yunnan and Sichuan, they can reach 50–60 ppm h (Figure 2b).
Upon applying exposure–response functions to the AOT40 data, the RYL of forests in the southwestern region demonstrates pronounced spatial heterogeneity (Figure 2c). The lowest RYL values (1–2%) occur in the evergreen broadleaf forests of Northeastern Chongqing and Eastern Guizhou (Figure 2c), corresponding to areas with lower O3 exposure. Conversely, the highest RYL (20–30%) is observed in Central Yunnan, characterized by both elevated O3 exposure and extended growing seasons. Temporally, a marked decline occurred from 2019 to 2020, followed by a year-on-year increasing trend from 2020 to 2023 (a detailed interannual analysis is presented in the following section).
Although the Yunnan–Sichuan border and Western Sichuan exhibit high AOT40 values, coniferous forests in these regions demonstrate relatively lower sensitivity to O3 exposure. Overall, the RYL across Southwestern China displays a south–high/north–low gradient, with the most severe impacts concentrated in Central Yunnan—a region combining high O3 concentrations with O3-sensitive evergreen broadleaf forests.
It should be noted that insufficient O3 monitoring stations in Northwestern Sichuan may lead to the potential overestimation of the MDA8-O3 and AOT40 values derived from radial basis function interpolation. Broadly, the southwestern region shows a west–high/east–low pattern for both AOT40 and MDA8-O3, whereas the RYL exhibits a south–high/north–low distribution.

3.1.2. O3 Monitoring Heterogeneity Effects on Estimation

The spatial distribution of O3 monitoring stations in the study area is markedly heterogeneous, with a high concentration in densely populated urban areas and sparse coverage in remote, forested regions. This disparity is evident in the 2023 monitoring densities, which were 1.12, 1.81, 1.82, and 4.39 stations per 104 km2 for Yunnan, Sichuan, Guizhou, and Chongqing, respectively. As illustrated in Figure 1b and Figure 2, while Yunnan’s network is relatively uniform, Sichuan’s stations are heavily clustered in the eastern part of the province. Consequently, vast forested areas in Western Sichuan (e.g., Aba and Ganzi) are severely underrepresented, with monitoring densities below 0.2 stations per 104 km2 and some areas lacking any coverage. Although coniferous forests, which are prevalent in this region, exhibit greater O3 resistance compared to broadleaf forests, as evidenced by their shallower exposure–response slopes [26], the significant lack of in situ data can still lead to substantial estimation errors. For instance, the high O3 concentrations reported for Northwestern Sichuan may be an artifact of overestimation stemming from the interpolation method used in data-sparse conditions [28]. Therefore, findings related to this region must be interpreted with caution.
To improve data representativeness and reliability while minimizing uncertainties inherent to spatial interpolation techniques, this study proposes the targeted expansion of O3 monitoring stations in forested areas as a critical enhancement to the current monitoring infrastructure.

3.2. Trends in O3 Metrics, RYL, and ECL

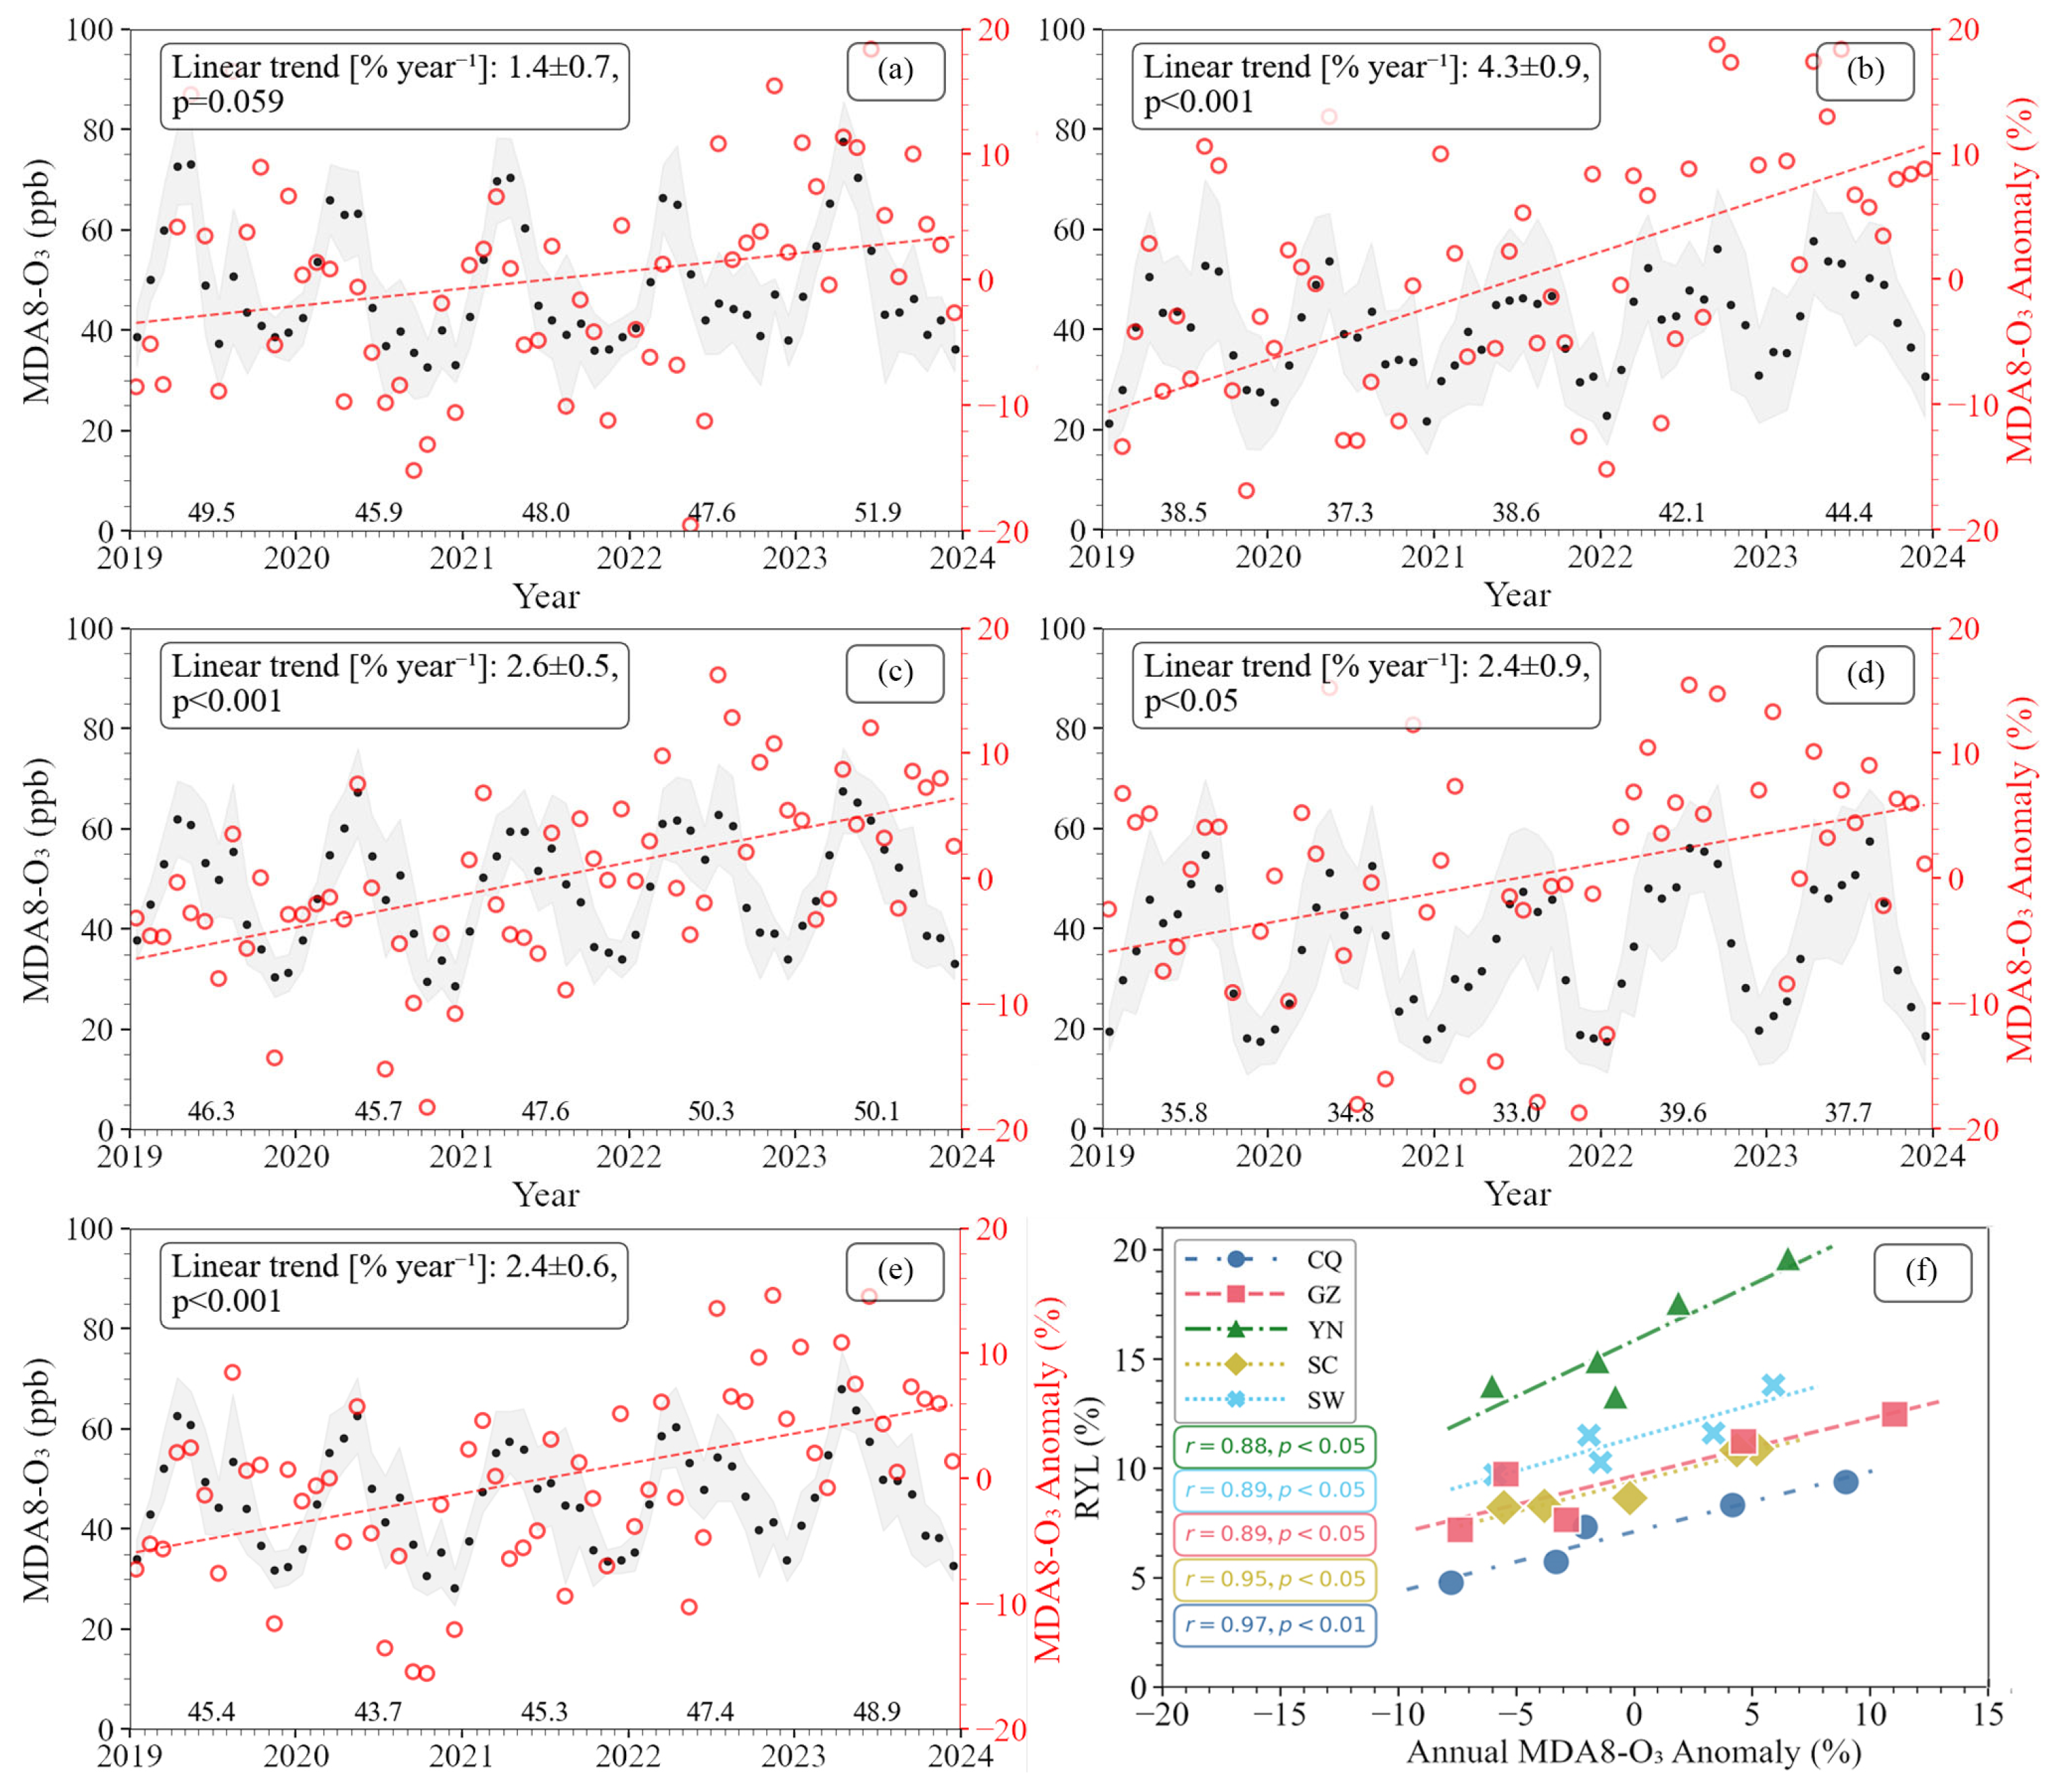
3.2.1. Trends in MDA8-O3 and MDA8-O3 Anomalies

This study utilized spatially interpolated gridded data to address the uneven distribution of monitoring sites, allowing for the calculation of representative provincial averages for both the MDA8-O3 concentrations and related RYL values. An analysis of monthly MDA8-O3 anomalies from 2019 to 2023 revealed consistent increasing trends across Southwestern China (Figure 3a–e). Most provinces exhibited statistically significant upward trends (p < 0.05), with annual increases of 4.3 ± 0.9% in Guizhou, 2.6 ± 0.5% in Sichuan, and 2.4 ± 0.9% in Chongqing. The regional average increase for Southwestern China was 2.4 ± 0.6%, indicating a clear decline in O3 pollution levels across the region, while Yunnan Province showed a slightly weaker upward trend (1.4 ± 0.7%) that narrowly missed statistical significance (p = 0.059).
The borderline statistical significance of Yunnan’s O3 concentration trend, although not meeting the conventional threshold of 0.05, still demonstrates a notable upward tendency in MDA8-O3 levels. This pattern aligns with the statistically significant increases observed in neighboring provinces, implying that Yunnan may be experiencing similar O3 pollution pressures. To better understand these trends, future research should enhance the monitoring density and extend the observation periods. Such improvements would help to clarify the long-term O3 pollution trajectory in Yunnan and provide more robust data for the assessment of ecological risks. The consistent regional pattern underscores the need for coordinated air pollution control measures across Southwestern China.
Strong positive correlations between the RYL values and annual MDA8-O3 anomalies (r > 0.85, p < 0.05; Figure 3f) further confirm O3 pollution as a significant driver of vegetation stress. The combination of rising O3 trends and established dose–response relationships suggests the likely intensification of O3-induced forest biomass loss. These findings point to potentially serious ecological consequences, including a reduced carbon sequestration capacity and timber productivity, underscoring the need for targeted air quality management strategies in the region.
It should be noted that MDA8-O3 anomalies effectively quantify the deviation in O3 pollution in a specific month relative to its average state. This process effectively deseasonalizes the data by removing the mean annual cycle and accounts for statistical non-stationarity induced by annual cycles when calculating correlations. By correlating with these anomalies, we ensure that the results reflect the true interannual relationships between variables.

3.2.2. Trends in ATO40, RYLs, and ECLs

An analysis of the interannual variations in AOT40 and RYL across Southwestern China from 2019 to 2023 reveals a distinct trend: an initial decline followed by a significant increase (Figure 4a,b). Both metrics decreased slightly, from 33.61 ppm·h (AOT40) and 11.5% (RYL) in 2019 to 29.28 ppm·h and 9.7% in 2020, before steadily rising to peak at 38.57 ppm·h and 13.8% by 2023. This pattern likely reflects the interplay between O3 levels and anthropogenic emissions, with the temporary decrease potentially linked to reduced industrial and transportation activity during COVID-19 lockdowns, followed by a rebound as economic activity resumed [29]. Regional disparities were evident, with Yunnan experiencing the highest five-year average forest biomass loss (15.85%), more than double that of Chongqing (7.10%) (Figure 4b).
The anomalous decline in forest biomass loss between 2019 and 2020 aligns with pandemic-induced reductions in O3 precursor emissions (NOx and VOCs). Studies confirm that China’s NO2 levels dropped by ~40% in early 2020 due to lockdown measures, with similar declines observed globally [30]. This suggests that suppressed O3 formation during this period may have temporarily mitigated forest damage. However, the subsequent rise in both AOT40 and the RYL after 2020 underscores the need for further analysis integrating NOx/VOC emission data to clarify how O3 suppression mechanisms influence forest biomass trends.
An interesting question is whether regions beyond Southwestern China also exhibited decreased O3 levels in 2020. Indeed, some studies have reported lower O3 concentrations in China [31,32] and globally [33] for that year. However, other regions showed either negligible changes [34] or even increasing trends [35]. Such divergent findings across monitoring areas likely reflect localized variations in O3 sensitivity induced by pandemic-related emission reductions in 2020.
Economically, O3 exposure caused annual ECL/GDP values averaging 4.44% for Southwestern China (ECLs of CNY 49.9–74.9 billion annually). Yunnan suffered the most severe consequences, with the annual ECL/GDP averaging 8.20% (ECLs of CNY 29.8 billion on average), reflecting its high forest biomass vulnerability. Guizhou followed a similar pattern (annual ECL/GDP averaging 3.95%, ECL of ~CNY 10 billion). While Sichuan’s larger economy experienced a relatively modest ECL/GDP of 2.83%, its absolute economic losses remained high, with the ECL reaching CNY 15.6 billion. Chongqing’s limited land area contributes to a lower forest output value, and its relatively low O3 levels further minimize environmental losses, with the mean annual ECL/GDP estimated at 2.53% (ECL of CNY 4.6 billion) (Figure 4c,d). These findings underscore O3 pollution’s severe threat to ecological stability and sustainable development, particularly in forest-dependent regions. Strengthened monitoring and targeted mitigation strategies are urgently needed to curb these cascading environmental and economic damages.

3.3. Limitations and Implications

3.3.1. Exposure–Response Function

The exposure–response function employed in this study has certain limitations, primarily stemming from the scarcity of species-specific O3 exposure–response data for forest trees. Compared to food crops, the available data on the O3 sensitivity of trees remain limited, introducing substantial uncertainty in determining the function coefficients. The coefficient for evergreen broadleaf forests (−0.0053) used in our study was found to be smaller than the value (−0.0061) reported in previous European studies by Buker et al. [26]. When compared with Feng et al. [14], who applied Buker’s formula to estimate forest biomass loss in China, our results may present an approximately 13% underestimation. This discrepancy is particularly pronounced in evergreen broadleaf forest regions outside Western Sichuan.
However, it should be clarified that our current formula was adapted from Feng’s methodology [27], incorporating experimental data primarily from domestic broadleaf species. To further refine the accuracy of O3 impact assessments, we recommend two key research directions: (1) conducting controlled O3 exposure experiments using more native tree species to establish region-specific dose–response relationships and (2) systematically screening tree species for O3 tolerance to inform species selection in afforestation programs. For example, the O3 tolerance of major plantation tree species currently cultivated in Southern China, including Eucalyptus [36] and Betula alnoides (Yunnan birch) [37], still requires more systematic experimental verification. Such targeted research would not only improve the precision of impact predictions but also provide practical guidance for the development of O3-resilient forest ecosystems in Southwestern China.

3.3.2. Limitations of Single-Factor O3 Impact Assessment and Period Duration

This study focused exclusively on O3 pollution as a single stressor affecting forest biomass. However, real-world forest ecosystems are regulated by multiple interacting environmental factors. For instance, pests and pathogens alone cause millions of tree deaths annually [38], while interspecific interactions among tree species can significantly alter ecosystem dynamics [39]. While O3 adversely affects forest biomass, climate-driven stressors such as drought and heatwaves are likely to exacerbate these impacts [40,41]. A striking example occurred in spring 2023, when Southwestern China experienced its most severe vegetation productivity decline in two decades, directly linked to compound heatwave–drought events [41]. Future research should employ earth system modeling that integrates O3 effects with climate extremes (e.g., drought, heatwaves) to holistically assess forest growth trends and risks, thereby advancing our mechanistic understanding of biomass loss drivers.
Another limitation of this study is the relatively short time span (five years), which may not have been sufficient to capture long-term trends or establish robust statistical significance. Future research with extended observation periods would help to validate these findings.

3.3.3. Comparison Between Forests and Crops in Terms of Yield and Economic Losses

Extensive research has been conducted on the impact of O3 on agricultural crops, and comparing our findings on forests to this well-established field is highly informative. Similarly to forests, staple crops such as wheat, rice, and corn suffer from reduced photosynthetic rates and accelerated senescence when exposed to high O3 concentrations, leading to significant productivity declines [3,13,42]. However, critical differences exist in both the ecological and economic dimensions.
The primary ecological distinction lies in the temporal scale of the damage. For annual crops, the impact is largely confined to a single growing season. In contrast, for long-lived forest ecosystems, the damage from O3 is cumulative [3,13,42]. Years of chronic exposure can progressively weaken a forest’s carbon sink capacity, disrupt nutrient cycling, and diminish its overall resilience—a threat that single-season crop assessments cannot capture [11].
The valuation of economic losses also differs substantially. For crops, losses are typically calculated based on quantifiable yield reductions and prevailing market prices [13,42]. The economic losses in forests, however, are far more complex. They encompass not only the commercial value of timber but also the immense, and often non-market, value of ecosystem services, such as carbon sequestration, water regulation, biodiversity conservation, and recreation. While current studies primarily focus on crop impacts (primary industry), there is an urgent requirement to expand investigations to include broader ecological impacts and secondary/tertiary economic sector evaluations.
Compared to agricultural systems, forests have been relatively understudied in O3 impact assessments [14,42], particularly in China. Our findings demonstrate substantial O3-induced productivity reductions and significant economic losses in forest ecosystems, highlighting the critical need for more comprehensive research.

4. Conclusions

This study presents findings from a comprehensive analysis of O3 pollution impacts in Southwestern China (2019–2023), based on data from over 200 monitoring stations. The results show that forest productivity loss peaked at 13.8% in 2023, with a strong correlation with O3 levels (r > 0.85), and a worsening trend in O3 pollution was observed. Regional variations were significant, with Yunnan experiencing the highest five-year average relative yield loss (15.85%) and Chongqing the lowest (7.10%). The economic impact totaled CNY 60.2 billion annually, corresponding to 4.44% of the region’s primary industry GDP. The findings underscore the urgent need for enhanced O3 pollution controls, expanded air quality monitoring, and adaptive forestry measures. Without intervention, O3 pollution may cause persistent ecosystem degradation, threatening regional ecological security and undermining carbon neutrality objectives.

Author Contributions

Conceptualization, Q.X., J.Z., X.T. and H.L.; Data curation, Q.X., J.Z., Z.L. and D.W.; Formal analysis, Q.X., J.Z., Z.L. and D.W.; Funding acquisition, J.Z., X.T. and H.L.; Investigation, Q.X., J.Z., Z.L. and D.W.; Methodology, Q.X., J.Z., Z.L., D.W., X.T. and H.L.; Project administration, J.Z., X.T. and H.L.; Resources, Q.X., J.Z., X.T. and H.L.; Software, Q.X., J.Z., Z.L., D.W. and X.T.; Supervision, J.Z., X.T. and H.L.; Validation, Q.X., J.Z., Z.L., D.W. and X.T.; Visualization, Q.X., J.Z., Z.L. and D.W.; Writing—original draft, Q.X., Z.L. and D.W.; Writing—review and editing, J.Z., X.T. and H.L. All authors have read and agreed to the published version of the manuscript.

Funding

This research was partially supported by the National Natural Science Foundation of China (Grant No. 42107124, 42175132) and the Yunnan Fundamental Research Projects (202401CF070180, 202401BC070004, 202302AN360006).

Institutional Review Board Statement

Not applicable.

Informed Consent Statement

Not applicable.

Data Availability Statement

Data are available on reasonable request to the corresponding author.

Conflicts of Interest

The authors declare no conflicts of interest.

References

  1. Monks, P.S.; Archibald, A.T.; Colette, A.; Cooper, O.; Coyle, M.; Derwent, R.; Fowler, D.; Granier, C.; Law, K.S.; Mills, G.E.; et al. Tropospheric ozone and its precursors from the urban to the global scale from air quality to short-lived climate forcer. Atmos. Chem. Phys. 2015, 15, 8889–8973. [Google Scholar] [CrossRef]
  2. Wang, Y.; Zhao, Y.; Liu, Y.; Jiang, Y.; Zheng, B.; Xing, J.; Liu, Y.; Wang, S.; Nielsen, C.P. Sustained emission reductions have restrained the ozone pollution over China. Nat. Geosci. 2023, 16, 967–974. [Google Scholar] [CrossRef]
  3. Mao, J.; Tai, A.P.K.; Yung, D.H.Y.; Yuan, T.; Chau, K.T.; Feng, Z. Multidecadal ozone trends in China and implications for human health and crop yields: A hybrid approach combining a chemical transport model and machine learning. Atmos. Chem. Phys. 2024, 24, 345–366. [Google Scholar] [CrossRef]
  4. Yang, Z.; Li, Z.; Cheng, F.; Lv, Q.; Li, K.; Zhang, T.; Zhou, Y.; Zhao, B.; Xue, W.; Wei, J. Two-decade surface ozone (O3) pollution in China: Enhanced fine-scale estimations and environmental health implications. Remote Sens. Environ. 2025, 317, 114459. [Google Scholar] [CrossRef]
  5. Wu, K.; Wang, Y.; Qiao, Y.; Liu, Y.; Wang, S.; Yang, X.; Wang, H.; Lu, Y.; Zhang, X.; Lei, Y. Drivers of 2013–2020 ozone trends in the Sichuan Basin, China: Impacts of meteorology and precursor emission changes. Environ. Pollut. 2022, 300, 118914. [Google Scholar] [CrossRef] [PubMed]
  6. Chen, Y.; Han, H.; Zhang, M.; Zhao, Y.; Huang, Y.; Zhou, M.; Wang, C.; He, G.; Huang, R.; Luo, B.; et al. Trends and Variability of Ozone Pollution over the Mountain-Basin Areas in Sichuan Province during 2013–2020: Synoptic Impacts and Formation Regimes. Atmosphere 2021, 12, 1557. [Google Scholar] [CrossRef]
  7. Shi, J.; Wang, Z.; Zhao, C.; Han, X.; Wang, J.; Yang, X.; Xie, H.; Zhao, P.; Ning, P. Characteristics and Causes of Ozone Pollution in 16 Cities of Yunnan Plateau. Atmosphere 2022, 13, 1177. [Google Scholar] [CrossRef]
  8. Wittig, V.E.; Ainsworth, E.A.; Naidu, S.L.; Karnosky, D.F.; Long, S.P. Quantifying the impact of current and future tropospheric ozone on tree biomass, growth, physiology and biochemistry: A quantitative meta-analysis. Glob. Change Biol. 2009, 15, 396–424. [Google Scholar] [CrossRef]
  9. Peng, J.; Shang, B.; Xu, Y.; Feng, Z.; Pleijel, H.; Calatayud, V. Ozone exposure- and flux-yield response relationships for maize. Environ. Pollut. 2019, 252 Pt A, 1–7. [Google Scholar] [CrossRef]
  10. Zhao, H.; Zheng, Y.; Zhang, Y.; Li, T. Evaluating the effects of surface O3 on three main food crops across China during 2015–2018. Environ. Pollut. 2020, 258, 113794. [Google Scholar] [CrossRef]
  11. Agathokleous, E.; Saitanis, C.J.; Agathokleous, S.; Savvides, C.; Calatayud, V.; Sicard, P. isoAOT40: An improved ozone exposure index based on the Annual Ozone Spectrum Profile (AO3SP). J. For. Res. 2022, 33, 1949–1955. [Google Scholar] [CrossRef]
  12. Li, S.; Leakey, A.D.B.; Moller, C.A.; Montes, C.M.; Sacks, E.J.; Lee, D.; Ainsworth, E.A. Similar photosynthetic but different yield responses of C3 and C4 crops to elevated O3. Proc. Natl. Acad. Sci. USA 2023, 120, e2313591120. [Google Scholar] [CrossRef] [PubMed]
  13. Zhao, H.; Zhang, Y.; Qi, Q.; Zhang, H. Evaluating the Impacts of Ground-Level O3 on Crops in China. Curr. Pollut. Rep. 2021, 7, 565–578. [Google Scholar] [CrossRef]
  14. Feng, Z.; De Marco, A.; Anav, A.; Gualtieri, M.; Sicard, P.; Tian, H.; Fornasier, F.; Tao, F.; Guo, A.; Paoletti, E. Economic losses due to ozone impacts on human health, forest productivity and crop yield across China. Environ. Int. 2019, 131, 104966. [Google Scholar] [CrossRef] [PubMed]
  15. Wang, Q.; Huang, M.; Wang, S.; Chen, B.; Liu, Z.; Wang, Z.; Chen, S.; Li, H.; Zhu, T.; Li, D.; et al. Evaluation of the impacts of ozone on the vegetation productivity of woodland and grassland ecosystems in China. Ecol. Model. 2023, 483, 110426. [Google Scholar] [CrossRef]
  16. Sorrentino, B.; Anav, A.; Calatayud, V.; Collalti, A.; Sicard, P.; Leca, S.; Fornasier, F.; Paoletti, E.; De Marco, A. Inconsistency between process-based model and dose-response function in estimating biomass losses in Northern Hemisphere due to elevated O3. Environ. Pollut. 2025, 364 Pt 2, 125379. [Google Scholar] [CrossRef]
  17. Piao, S.; Wang, X.; Park, T.; Chen, C.; Lian, X.; He, Y.; Bjerke, J.W.; Chen, A.; Ciais, P.; Tømmervik, H.; et al. Characteristics, drivers and feedbacks of global greening. Nat. Rev. Earth Environ. 2019, 1, 14–27. [Google Scholar] [CrossRef]
  18. Qiao, X.; Wang, P.; Zhang, J.; Zhang, H.L.; Tang, Y.; Hu, J.L.; Ying, Q. Spatial-temporal variations and source contributions to forest ozone exposure in China. Sci. Total Environ. 2019, 674, 189–199. [Google Scholar] [CrossRef]
  19. Wang, H.; Zhang, Y.; Luo, Z.; Wang, Y.; Dai, Q.; Bi, X.; Wu, J.; Feng, Y. Spatial-temporal Variation and DriVing Factors of Ozone in China from 2019 to 2021Based on EOF Technique and KZ Filter. Environ. Sci. 2023, 44, 1811–1820. [Google Scholar]
  20. Zhou, B. Resources Dynamics and Restoration Strategy of Natural Forests in Southwest China. Ph.D. Thesis, Chinese Academy of Forestry, Beijing, China, 2011. [Google Scholar]
  21. Wang, H.; Zeng, X.; Kou, W.; Ma, M.; Gao, Y. Characteristics of ozone pollution and effects of biogenic emissions based on numerical modeling in the Yangtze River Delta. J. Mar. Meteorol. 2022, 42, 67–76. [Google Scholar]
  22. Lu, X.; Zhang, L.; Wang, X.; Gao, M.; Li, K.; Zhang, Y.; Yue, X.; Zhang, Y. Rapid Increases in Warm-Season Surface Ozone and Resulting Health Impact in China Since 2013. Environ. Sci. Technol. Lett. 2020, 7, 240–247. [Google Scholar] [CrossRef]
  23. Lefohn, A.S.; Malley, C.S.; Smith, L.; Wells, B.; Hazucha, M.; Simon, H.; Naik, V.; Mills, G.; Schultz, M.G.; Paoletti, E.; et al. Tropospheric ozone assessment report: Global ozone metrics for climate change, human health, and crop/ecosystem research. Elem. Sci. Anthr. 2018, 6, 27. [Google Scholar] [CrossRef]
  24. Marco, A.D.; Anav, A.; Sicard, P.; Feng, Z.; Paoletti, E. High spatial resolution ozone risk-assessment for Asian forests. Environ. Res. Lett. 2020, 15, 104095. [Google Scholar] [CrossRef]
  25. Ren, X.; Shang, B.; Feng, Z.; Calatayud, V. Yield and economic losses of winter wheat and rice due to ozone in the Yangtze River Delta during 2014-2019. Sci. Total Environ. 2020, 745, 140847. [Google Scholar] [CrossRef]
  26. Buker, P.; Feng, Z.; Uddling, J.; Briolat, A.; Alonso, R.; Braun, S.; Elvira, S.; Gerosa, G.; Karlsson, P.E.; Le Thiec, D.; et al. New flux based dose-response relationships for ozone for European forest tree species. Environ. Pollut. 2015, 206, 163–174. [Google Scholar] [CrossRef]
  27. Feng, Z.; Peng, J. Relationship Between RelatiVe Crop Yield/Woody Plant Biomass and Ground-level OZone Pollution in China. Environ. Int. 2021, 42, 3084–3090. [Google Scholar]
  28. Majdisova, Z.; Skala, V. Radial basis function approximations: Comparison and applications. Appl. Math. Model. 2017, 51, 728–743. [Google Scholar] [CrossRef]
  29. Yue, X.; Lei, Y.; Zhou, H.; Liu, Z.; Letu, H.; Cai, Z.; Lin, J.; Jiang, Z.; Liao, H. Changes of anthropogenic carbon emissions and air pollutants during the COVID-19 epidemic in China. Trans. Atmos. Sci. 2020, 43, 265–274. [Google Scholar]
  30. Bauwens, M.; Compernolle, S.; Stavrakou, T.; Muller, J.F.; van Gent, J.; Eskes, H.; Levelt, P.F.; van der A, R.; Veefkind, J.P.; Vlietinck, J.; et al. Impact of Coronavirus Outbreak on NO2 Pollution Assessed Using TROPOMI and OMI Observations. Geophys. Res. Lett. 2020, 47, e2020GL087978. [Google Scholar] [CrossRef]
  31. Wang, W.; Parrish, D.D.; Wang, S.; Bao, F.; Ni, R.; Li, X.; Yang, S.; Wang, H.; Cheng, Y.; Su, H. Long-term trend of ozone pollution in China during 2014–2020: Distinct seasonal and spatial characteristics and ozone sensitivity. Atmos. Chem. Phys. 2022, 22, 8935–8949. [Google Scholar] [CrossRef]
  32. Kang, M.; Zhang, J.; Zhang, H.; Ying, Q. On the Relevancy of Observed Ozone Increase during COVID-19 Lockdown to Summertime Ozone and PM2.5 Control Policies in China. Environ. Sci. Technol. Lett. 2021, 8, 289–294. [Google Scholar] [CrossRef]
  33. Miyazaki, K.; Bowman, K.; Sekiya, T.; Takigawa, M.; Neu, J.L.; Sudo, K.; Osterman, G.; Eskes, H. Global tropospheric ozone responses to reduced NOx emissions linked to the COVID-19 worldwide lockdowns. Sci. Adv. 2021, 7, eabf7460. [Google Scholar] [CrossRef]
  34. Peralta, O.; Ortínez-Alvarez, A.; Torres-Jardón, R.; Suárez-Lastra, M.; Castro, T.; Ruíz-Suárez, L.G. Ozone over Mexico City during the COVID-19 pandemic. Sci. Total Environ. 2021, 761, 143183. [Google Scholar] [CrossRef]
  35. Sicard, P.; De Marco, A.; Agathokleous, E.; Feng, Z.; Xu, X.; Paoletti, E.; Rodriguez, J.J.D.; Calatayud, V. Amplified ozone pollution in cities during the COVID-19 lockdown. Sci. Total Environ. 2020, 735, 139542. [Google Scholar] [CrossRef]
  36. Luo, Y.; Tan, X.; Zou, X.; Rao, X.; Lin, Y.; Shen, W. Understory Plant Diversity Characteristics and Influencing Factors of Four Common Plantations in South China. J. Trop. Subtrop. Bot. 2022, 30, 1–10. [Google Scholar]
  37. Li, M.; Liu, P.; Wen, Q.; Huang, Y.; Liu, J. Biomass and Its Allocation Characteristics of Betula alnoides Plantations at Different Stand Ages. J. West China For. Sci. 2024, 53, 91–98. [Google Scholar]
  38. Balla, A.; Silini, A.; Cherif-Silini, H.; Chenari Bouket, A.; Moser, W.K.; Nowakowska, J.A.; Oszako, T.; Benia, F.; Belbahri, L. The Threat of Pests and Pathogens and the Potential for Biological Control in Forest Ecosystems. Forests 2021, 12, 1579. [Google Scholar] [CrossRef]
  39. Trogisch, S.; Liu, X.; Rutten, G.; Xue, K.; Bauhus, J.; Brose, U.; Bu, W.; Cesarz, S.; Chesters, D.; Connolly, J.; et al. The significance of tree-tree interactions for forest ecosystem functioning. Basic Appl. Ecol. 2021, 55, 33–52. [Google Scholar] [CrossRef]
  40. Hou, Y.; Li, X.; Hu, Y.; Lu, X.; Ma, Y.; Li, W.; Lü, X.; Li, Z.; Bai, Y.; Wang, C.; et al. Drought weakens the positive effect of plant diversity on community biomass. J. Plant Ecol. 2024, 17, rtae059. [Google Scholar] [CrossRef]
  41. Wang, Z.; Chen, W.; Piao, J.; Cai, Q.; Chen, S.; Xue, X.; Ma, T. Synergistic effects of high atmospheric and soil dryness on record-breaking decreases in vegetation productivity over Southwest China in 2023. npj Clim. Atmos. Sci. 2025, 8, 6. [Google Scholar] [CrossRef]
  42. Feng, Z.; Xu, Y.; Kobayashi, K.; Dai, L.; Zhang, T.; Agathokleous, E.; Calatayud, V.; Paoletti, E.; Mukherjee, A.; Agrawal, M.; et al. Ozone pollution threatens the production of major staple crops in East Asia. Nat. Food 2022, 3, 47–56. [Google Scholar] [CrossRef] [PubMed]
Figure 1. Location of Southwestern (SW) China, including Yunnan (YN), Guizhou (GZ), Sichuan (SC), and Chongqing (CQ) (a); forest type distribution and O3 monitoring sites (b).
Atmosphere 16 00927 g001
Figure 2. Spatial distributions of O3 pollution-related indicators in Southwestern China from 2019 to 2023, including annual mean MDA8-O3 concentrations (a1a5); AOT40 (b1b5); and RYL (c1c5). The maps were generated using the radial basis function interpolation method, with scatter points indicating monitoring sites and their corresponding values.
Atmosphere 16 00927 g002
Figure 3. Monthly MDA8-O3 variations (black dots, left axis) and anomalies from 2019 to 2023 (red circles, right axis) for Yunnan (a), Guizhou (b), Sichuan (c), Chongqing (d), and Southwestern China (e), with gray shading indicating ±1σ and red dashed lines showing trends in MDA8-O3 anomalies, with their statistical values given in the top-left corners of panels (ae), and the correlations between annual MDA8-O3 anomalies and RYL (f).
Atmosphere 16 00927 g003
Figure 4. Interannual variations in provincial AOT40 (a), RYL (b), ECL (c), and ECL/GDP (d) during the study period (2019–2023). In panels (a,b), the error bars represent interannual variations within ±1σ for each province. In panel (c,d), since publicly available forestry economic statistics are only provided up to 2022, the results for 2023 are unavailable.
Atmosphere 16 00927 g004
Disclaimer/Publisher’s Note: The statements, opinions and data contained in all publications are solely those of the individual author(s) and contributor(s) and not of MDPI and/or the editor(s). MDPI and/or the editor(s) disclaim responsibility for any injury to people or property resulting from any ideas, methods, instructions or products referred to in the content.

