Article

The Role of Air Conditioning Adaptation in Mitigating Compound Day–Night Heatwave Exposure in China Under Climate Change

1
School of Hydrology and Water Resources, Nanjing University of Information Science and Technology, Nanjing 210044, China
2
Key Laboratory of Hydrometeorological Disaster Mechanism and Warning of Ministry of Water Resources, Nanjing University of Information Science and Technology, Nanjing 210044, China
*
Author to whom correspondence should be addressed.
Atmosphere 2025, 16(8), 912; https://doi.org/10.3390/atmos16080912
Submission received: 30 May 2025 / Revised: 22 July 2025 / Accepted: 24 July 2025 / Published: 28 July 2025

Abstract

Global warming and rapid urbanization have increased population exposure to heatwaves, with compound day- and night-time heatwaves (CDNH) posing greater health risks than individual heatwave events. Although air conditioning (AC) adaptation effectively mitigates heat-related impacts, its role in reducing CDNH exposure under climate change remains unknown. Using meteorological and socioeconomic data, this study quantified population exposure to CDNHs and the impacts that could be avoided through AC adaptation across China and its regional variations. Results show that CDNH exposure risks were particularly high in the middle–lower Yangtze–Huaihe Basin and south China, with an increasing trend observed over the period of 2001–2022. AC adaptation has reduced the exposure risk and its upward trend by 5.85% and 37.87%, respectively, with higher mitigating effects in urban areas. By breaking down the total exposure changes into climatic, demographic, and AC-driven changes, this study reveals that increased AC contributes 10.16% to exposure reduction, less than the effect of climate warming (59.80%) on the exposure increases. These findings demonstrate that expanding AC adaptation alone is insufficient to offset climate-driven increases in exposure, highlighting the urgent need for more effective adaptation measures to address climate change and thereby alleviate its adverse impacts on human beings.

1. Introduction

Driven by global warming, the frequency, duration, and intensity of extreme weather and climate events, such as heatwaves, droughts, and floods, have significantly increased [1], posing substantial threats to ecological systems and socio-economic activities [2]. Among them, heatwaves are more sensitive to the warming, which can affect human health and further trigger secondary disasters like droughts and wildfires, garnering widespread attention from various sectors [3]. For instance, an unprecedented heatwave in Shanghai in 2013 has caused approximately 160 deaths in the Pudong New Area alone [4]. In July 2022, the Yangtze River Basin in China experienced a record-breaking heatwave event since meteorological records began in 1961, resulting in severe droughts that affected 4.99 million people [5]. Recently, observations and projections have provided compelling evidence that the heat-related population exposure, mortality, and morbidity are increasing substantially [6,7,8,9]. For example, in China, the heat-related deaths reached 14,500 in 2020, exceeding the 1986–2005 baseline average by 92% [10]. This underscores the urgent need for adaptive measures to reduce the heat-related impacts. The 2023 China report of the Lancet Countdown on health and climate change pointed out that AC was an effective adaptation measure for reducing the adverse health impacts during heatwaves [11]. Several studies have demonstrated the potential role of AC adaptation in reducing heat-related exposure, mortality, and morbidity [12,13,14]. Walkowiak et al. [15] revealed that greater affordability of AC could significantly improve heat tolerance capacity. Han et al. [16] also found that compared to no-adaptation scenarios, the use of AC would reduce the heat-related population exposure by approximately 65.8% during the period of 2081–2100 under a high emission scenario.
Previous studies were primarily focused on the mitigating effects of AC adaptation in terms of individual daytime heatwaves identified by maximum air temperature. Recently, attention has been given to CDNHs [17,18,19]. Compared to individual heatwaves, CDNHs could hinder the recovery of the human body from high temperatures experienced on the previous day, potentially resulting in more severe impacts on human health [20,21,22]. Yang et al. [21] further revealed that the mortality risk associated with CDNH (8.86%) was significantly higher than that of individual daytime (2.82%) or nighttime heatwaves (1.16%). In addition, some studies also found that CDNHs and the corresponding exposure and mortality risk exhibited a more significantly increasing trend than individual daytime heatwaves [23,24]. For example, Liu et al. [24] demonstrated that under medium-to-high emission scenarios, by the end of the 21st century, mortality associated with CDNHs was projected to be 4.0–7.6 times higher than that in the 2010s, which was much larger than the increases in nighttime heatwave (0.7–1.9 times) and daytime heatwave-induced mortality (0.3–0.8 times). However, the contribution of the AC adaptation in reducing the impact of CDNHs on heat-related risk remains unclear.
In addition, recent studies have revealed that climate warming played a dominant role in the increased heat-related population exposure [7,25]. Population changes and urbanization also played important roles [26,27,28,29]. For example, increasing concrete surfaces [30] and decreasing open/green areas [31] in cites can enhance the urban heat islands and thereby increase the frequency and severity of heat events. In addition, the size, geometry [32,33], and heat capacity [34] of the buildings were also critical factors. Once the mitigating effects of AC adaptation have been considered, it is still a question as to whether climate warming will still dominate the increase in the heat-related exposure and whether the increase in AC units could offset the adverse effects of climate warming. Despite increasing AC availability, its distribution exhibited significant regional inequality, with higher AC usage among high-income households and urban areas [13,35,36]. This could lead to a lower prevalence in urban areas than in their suburban counterparts [37,38]. Extreme heat risks were also unequally distributed, which were constrained by household-level differences in income and adaptive capacity [39,40]. However, fewer studies have systematically examined the urban–rural disparities in AC’s mitigating effects on compound extreme heat risks. Therefore, this study aims to quantify the impacts of AC adaptation on the population exposure to CDNHs across both urban and rural areas in China, and then compare its contribution with climate change and population dynamics (Figure 1). This gap is particularly critical for developing equitable heat mitigating strategies and improving the overall resilience of communities to extreme heat events.

2. Materials and Methods

2.1. Dataset

The daily 2 m air temperature, including maximum temperature (Tx), minimum temperature (Tn), and mean temperature (Tm), were from CN05.1 with a spatial resolution of 0.25° × 0.25°. The gridded dataset was provided by the China Meteorological Administration, which has been interpolated from 2416 meteorological stations [41,42]. To classify the urban and rural areas, the Global Artificial Impervious Areas (GAIA) data with a spatial resolution of 30 m from the Department of Earth System Science at Tsinghua University [43] was used. The dataset was generated based on the Landsat images, combined with nighttime light data and Sentinel-1 Synthetic Aperture Radar data.
The population data with a spatial resolution of 1 km was obtained from the LandScan Global Population database [44,45]. The number of ACs per 100 households, average household size, gross domestic product (GDP) per capita, disposable income per capita, and Consumer Price Index (CPI) at province-level were provided by the China Statistical Yearbook [46]. Among them, the disposable income, number of AC units, and household size in both urban and rural areas for each province were also provided. To calculate AC availability at grid scale, the gridded GDP per capita dataset from Aalto University was utilized, which was downscaled from province-level data to a 1 km resolution using machine learning algorithms by considering urbanization level, travel time to the closest city, and income inequality [47]. To address the inconsistency in currency units, Purchasing Power Parity (PPP) data from the World Bank was further gathered to convert GDP from US dollars to Chinese Yuan (CNY) [48]. Since GDP per capita can be impacted by inflation and thus affects the purchasing power of AC units, all GDP per capita were converted to 2010 RMB prices through CPI to eliminate inflation’s impacts [16]. Given the data availability, this study focused on the period of 2001–2022. Notably, some datasets, such as GDP per capita, disposable income per capita, number of AC units per 100 households, were available from 2015 to 2022. The China–Taiwan region was not focused on in this study due to data unavailability. Detailed data information can be found in Table 1. The population and GDP per capita data were further aggregated to 0.25° grid, and were consistent with temperature data.

2.2. Definition of CDNH

This study employed the excess heat factor (EHF) methodology derived from the daily Tx and Tn to identify CDNHs [49]. The EHF method could capture both short-term and long-term temperature anomalies and incorporate local human acclimatization to heat [50], which has been widely adopted for reliable detection of the characteristics of heatwaves [9,51,52] and heat-related health risks [53,54,55,56]. In addition, the EHF showed a strong relationship with daily mortality during heatwaves and can be used to indicate heatwave-related morbidity [54]. Traditionally, the EHF method [57,58] was used to define individual daytime heatwaves, which was expressed as follows:
E H I s i g = ( T i + T i + 1 + T i + 2 ) / 3 T 95
where EHIsig is a significance index to determine whether a heatwave occurs. A heatwave occurs if EHIsig > 0 and lasts for at least three days [57,58,59,60]. T is the daily temperature, and i represents i-th day. T95 denotes the 95th percentile temperature threshold, which was estimated by ranking the temperature across 1961–2022 from lowest to highest [57,58]. Here, the EHIsig was calculated for both the maximum temperature and minimum temperature (i.e., EHIsig-day and EHIsig-night). When the EHIsig-day and EHIsig-night are simultaneously greater than 0 and last for at least 3 days, a CDNH event occurs [49]. In addition, previous studies have shown that when the maximum temperature reaches or exceeds 35 °C, the human body begins to experience increased heat stress, leading to various health risks [61,62,63]. Given the impact of heatwaves on human health, the maximum temperature should exceed 35 °C during CDNHs to eliminate the heatwaves that have smaller impact. Therefore, some high-altitude and high-latitude regions, including the Tibetan Plateau, Inner Mongolia, and the Northeast Plain, are not focused on in this study. The annual CDNH days were then calculated as the total number of heatwave days during summer in a year.

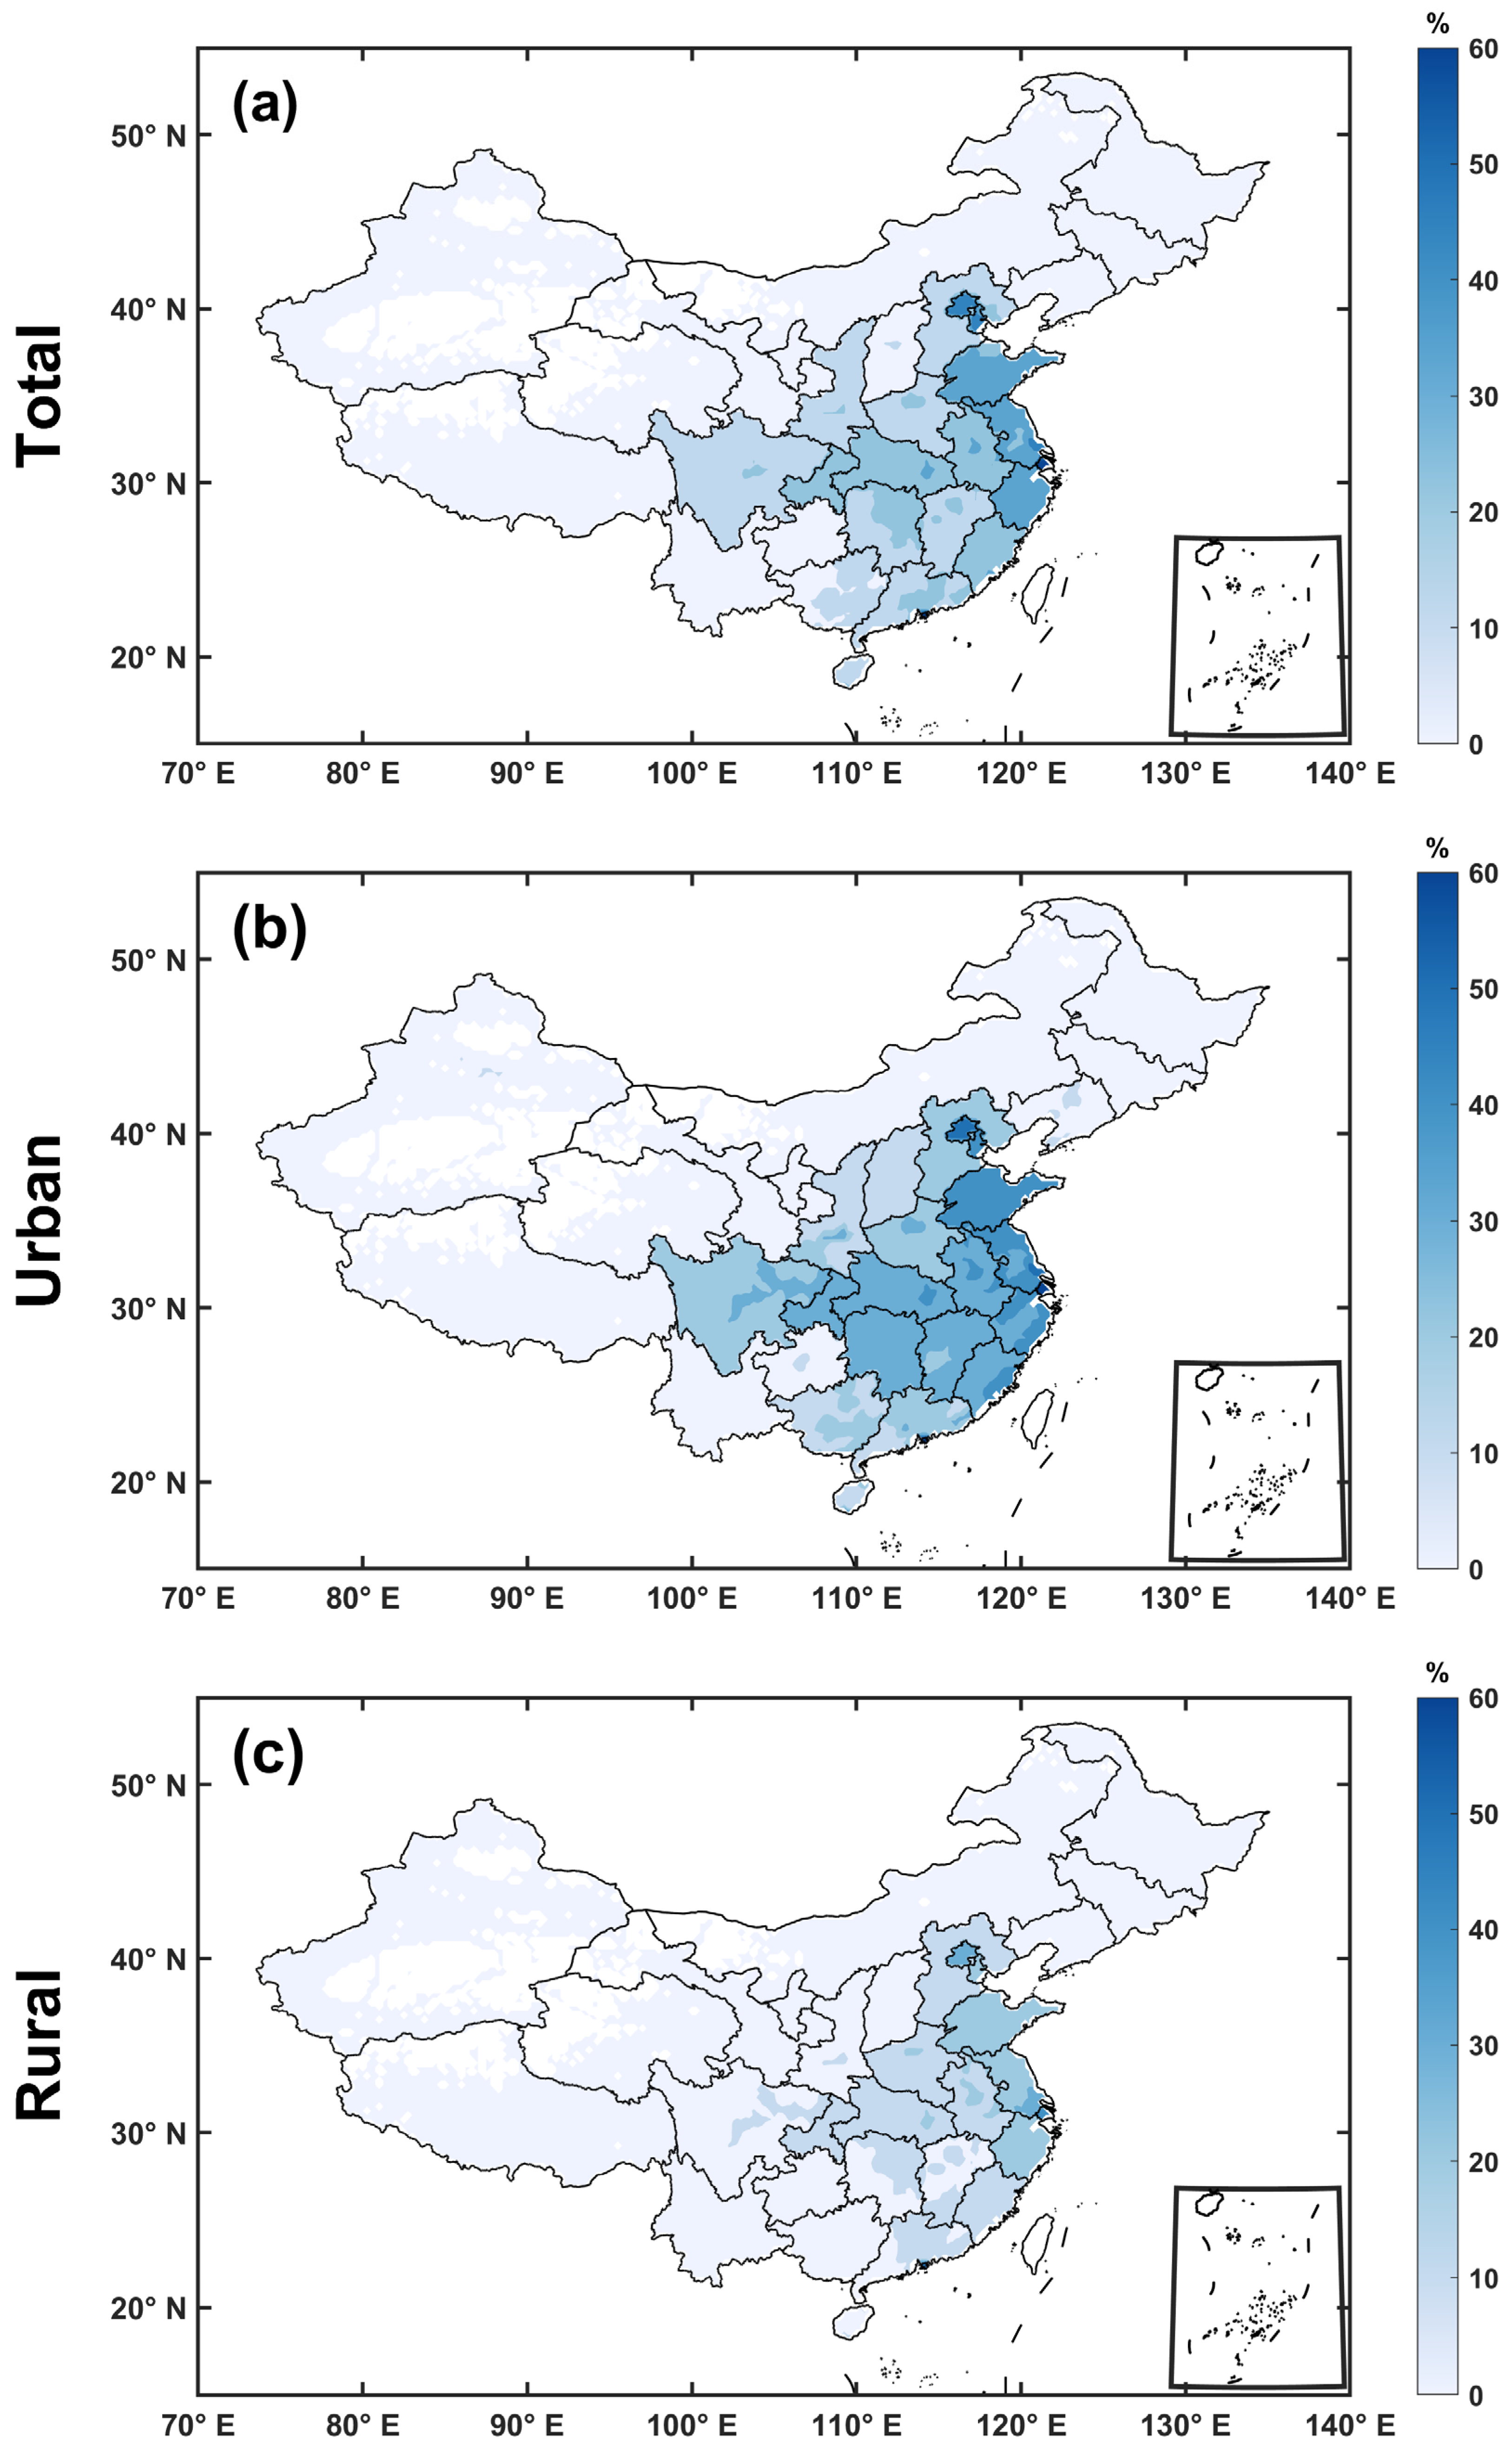
2.3. Air Conditioning (AC) Penetration

AC penetration that considers both local climate and AC availability has been regarded as an effective metric for assessing the impact of AC [64,65]. The AC penetration [65] can be estimated as:
P = S × A
where P is the AC penetration, and where S and A denote the climate maximum saturation and AC availability, respectively. The S is determined by local climate [66], representing the maximum cooling demand, which can be described as follows:
S = 1 0.949 × e 0.00187 C
where C is cooling degree days (CDDs), which was calculated as follows [67]:
C = i 92 ( T i T 0 )
where Ti is the average temperature on the i-th day, and T0 is the threshold of CDDs, denoting the upper limit of a comfortable temperature. According to the Chinese National Standard of Civil Building Design and the actual cooling demand of residents, 26 °C was used as the threshold [16,68].
The availability (A) relates to the local economic level, which can be estimated by GDP per capita, as shown in Equation (5) [16]:
A = 1 1 + e ( a + b × G 1000 )
where G is the GDP per capita (CNY), and a and b denote availability parameters, which are related to the local economic level and the availability of AC in different regions, respectively [16]. Here, parameters a and b were determined at province level by fitting the relationship (Equation (5)) between the observed GDP per capita and the number of AC units per 100 households (i.e., A) from 2015 to 2022. The coefficient of determination (R2) between observations and simulations was above 0.8 for most provinces (Figure A1), indicating the reliability of the fitting function. Figure 2 shows the spatial distribution of a and b values. It is found that provinces with higher AC availability, such as Beijing, Shanghai, Shandong, Jiangsu, and Chongqing, exhibited smaller a values. The spatial variations in b value were relatively smaller. The results are consistent with Han et al. [16], which also showed lower a values in eastern and southern China. Based on the fitted parameters and gridded GDP per capita data, the AC availability at a 0.25° grid scale for the period of 2001–2022 was then estimated by Equation (5). Here, the parameters kept constant across all the 0.25° grid cells within a province. Figure A2 shows the spatial distributions of the AC availability, which exhibited clear spatial heterogeneity within provinces, corresponding to intra-provincial economic disparities.
Finally, the annual AC penetration at a 0.25° × 0.25° resolution for the period of 2001–2022 was calculated by Equation (2). The spatial distributions of the AC penetration, in comparison to the actual number of AC units, are shown in Figure 3. The penetration showed significant spatial differences, with higher values in central and eastern China, especially in the Pearl River Delta (30–40%) and Yangtze River Delta (~20%) (Figure 3a), due to both higher income levels and larger cooling demand (Figure A2a and Figure A3). The distributions were similar to the observed number of ACs, with larger numbers in eastern and southern China (Figure 3d). In addition, due to the large difference in income levels, urban and rural areas also exhibited large differences in the AC penetration, with lower penetration (generally <5%) in rural areas (Figure 3b,c). The rural–urban differences were particularly large in the central China and Sichuan regions, with a difference of approximately 10%.

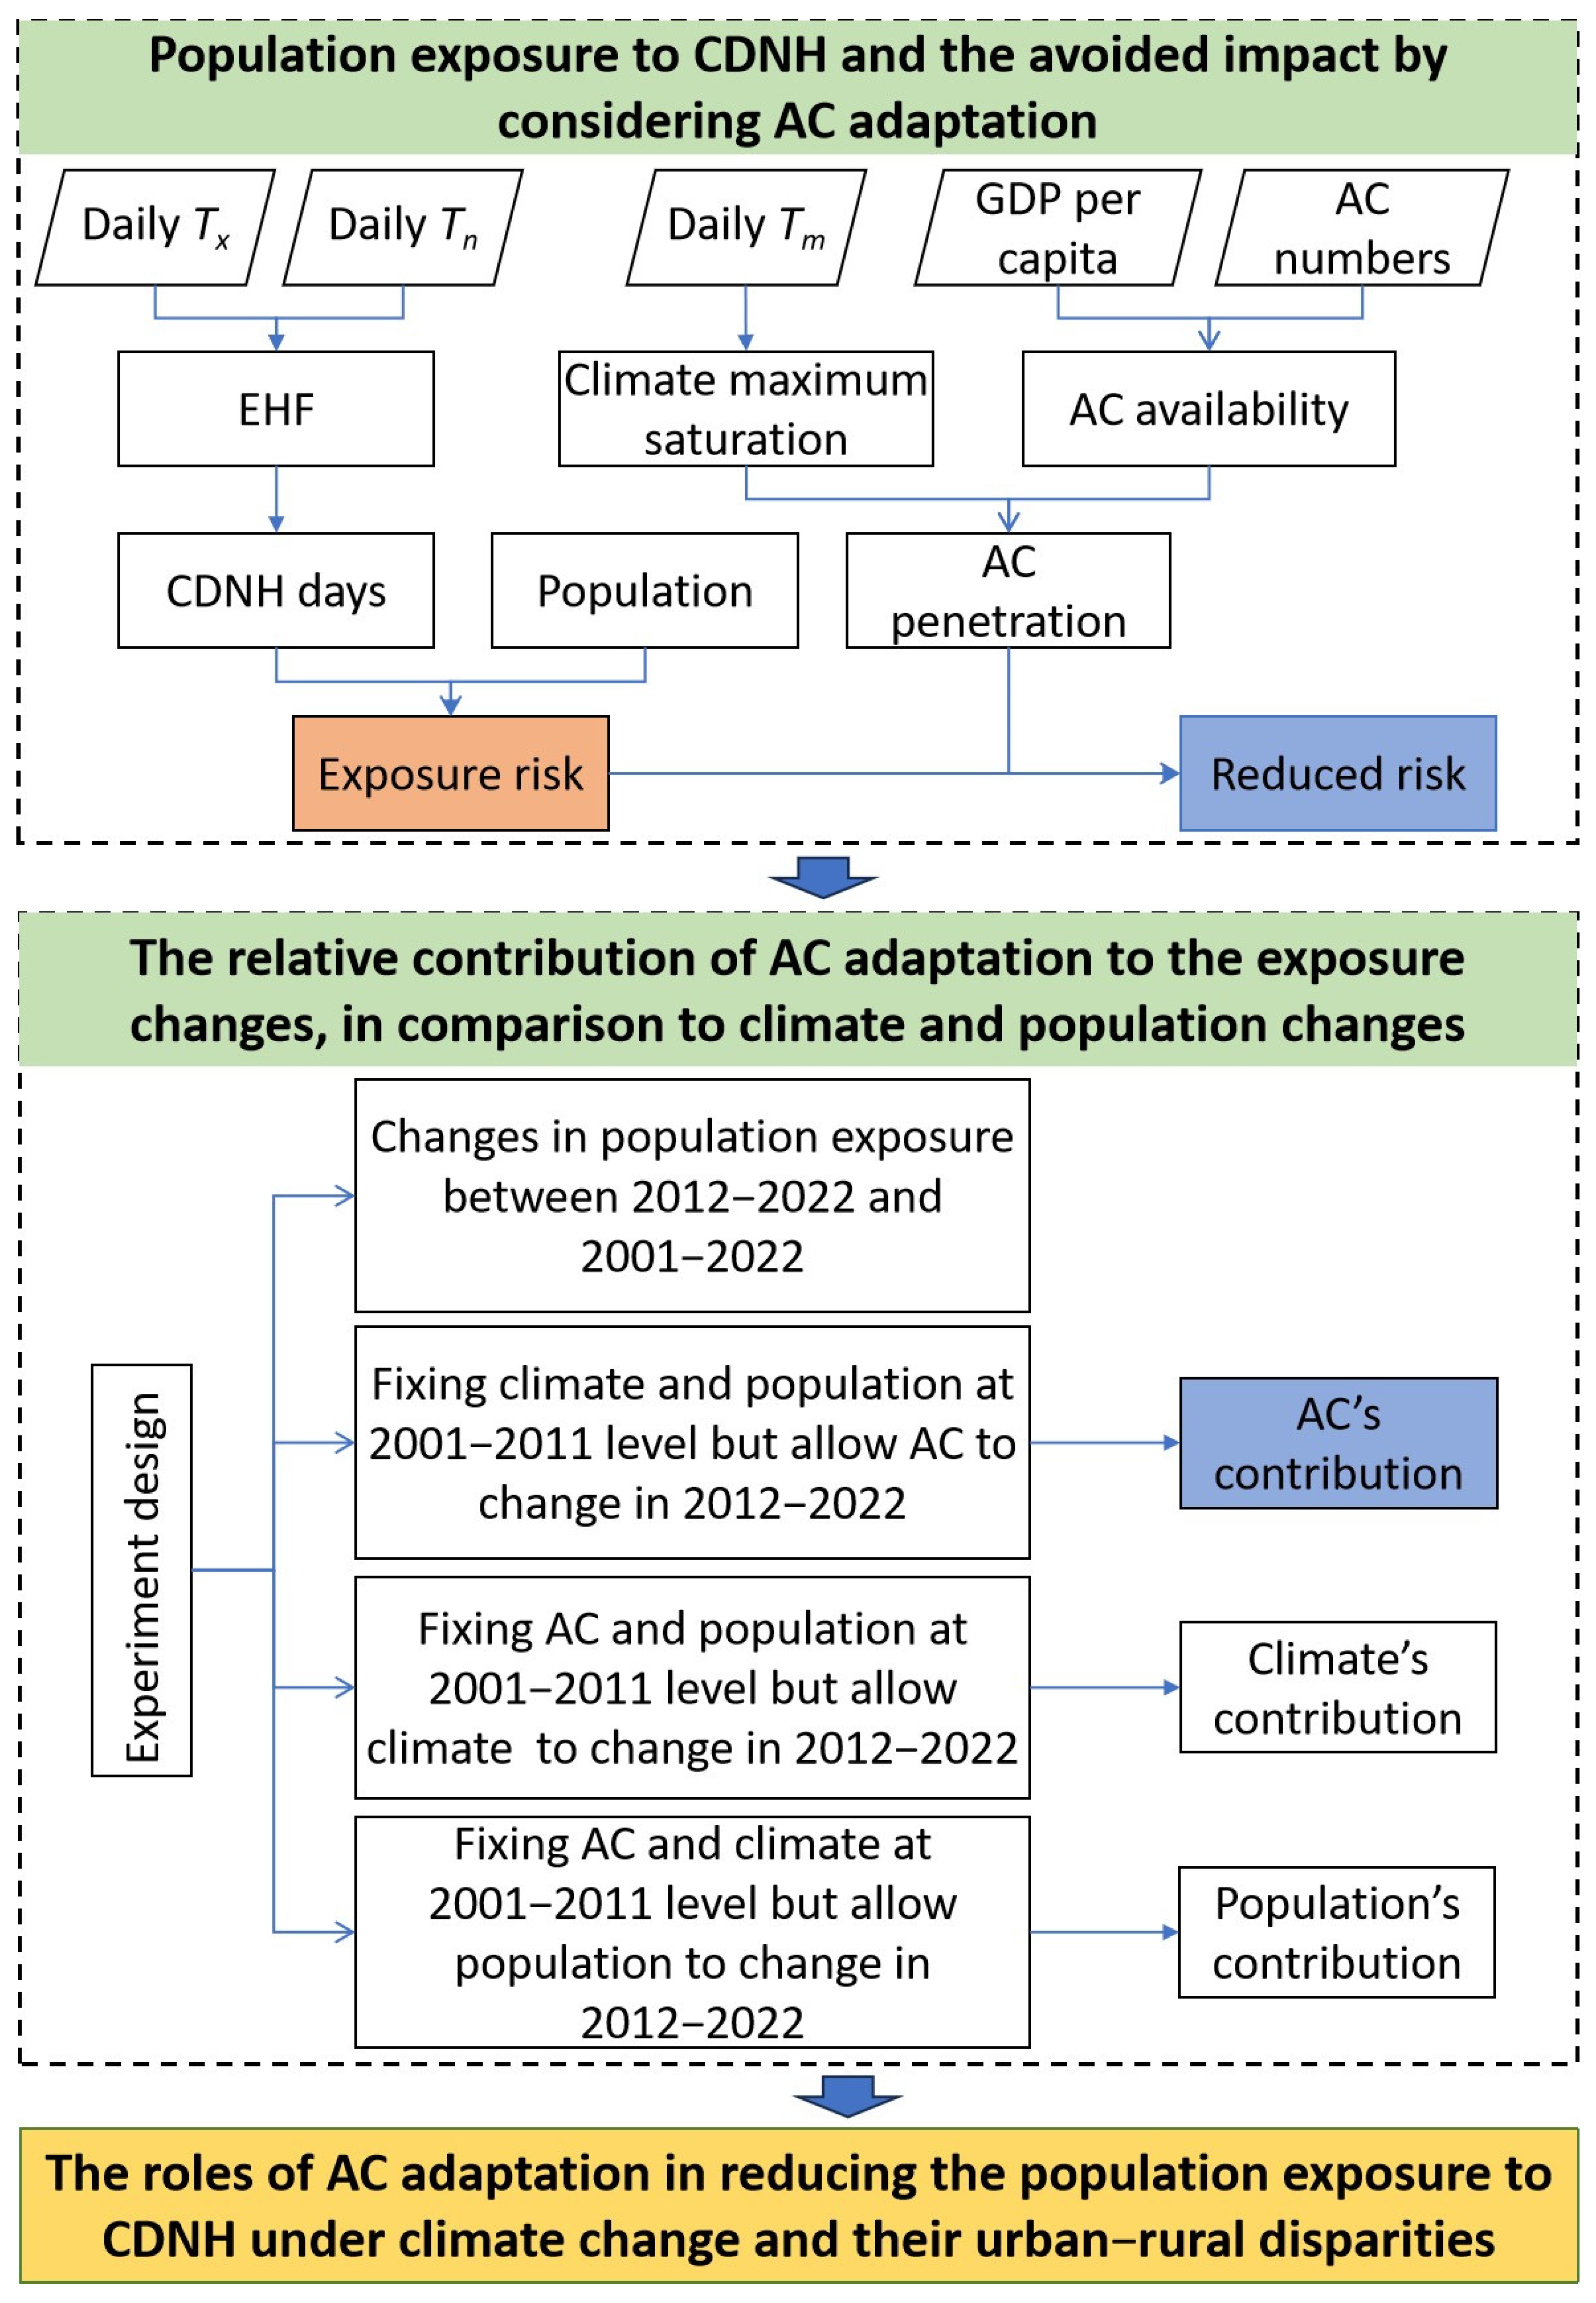
2.4. Population Exposure to CDNH and Effects of AC Adaptation

Population exposure to heatwaves, defined as the product of population size and the number of heat days, has been widely used as a critical metric for assessing the impacts of heatwaves on human health [69]. The population exposure without considering AC (Ena) was directly quantified by multiplying the annual CDNH days and population at a 0.25° × 0.25° resolution (i.e., D × Pop). Following Han et al. [16], the population exposure considering AC adaptation (Ea) was calculated as follows:
E a = D × ( 1 P ) × P o p
where D is the annual CDNH days, P is the AC penetration, and Pop is the population. The reduced population exposure by considering AC adaptation (i.e., mitigating effect, ME) can thus be computed as follows [16]:
M E = ( E n a E a ) / E n a × 100 %
Here, we assume that the AC can provide a complete elimination of heat-related risks without considering its usage rates and underlying mechanisms.

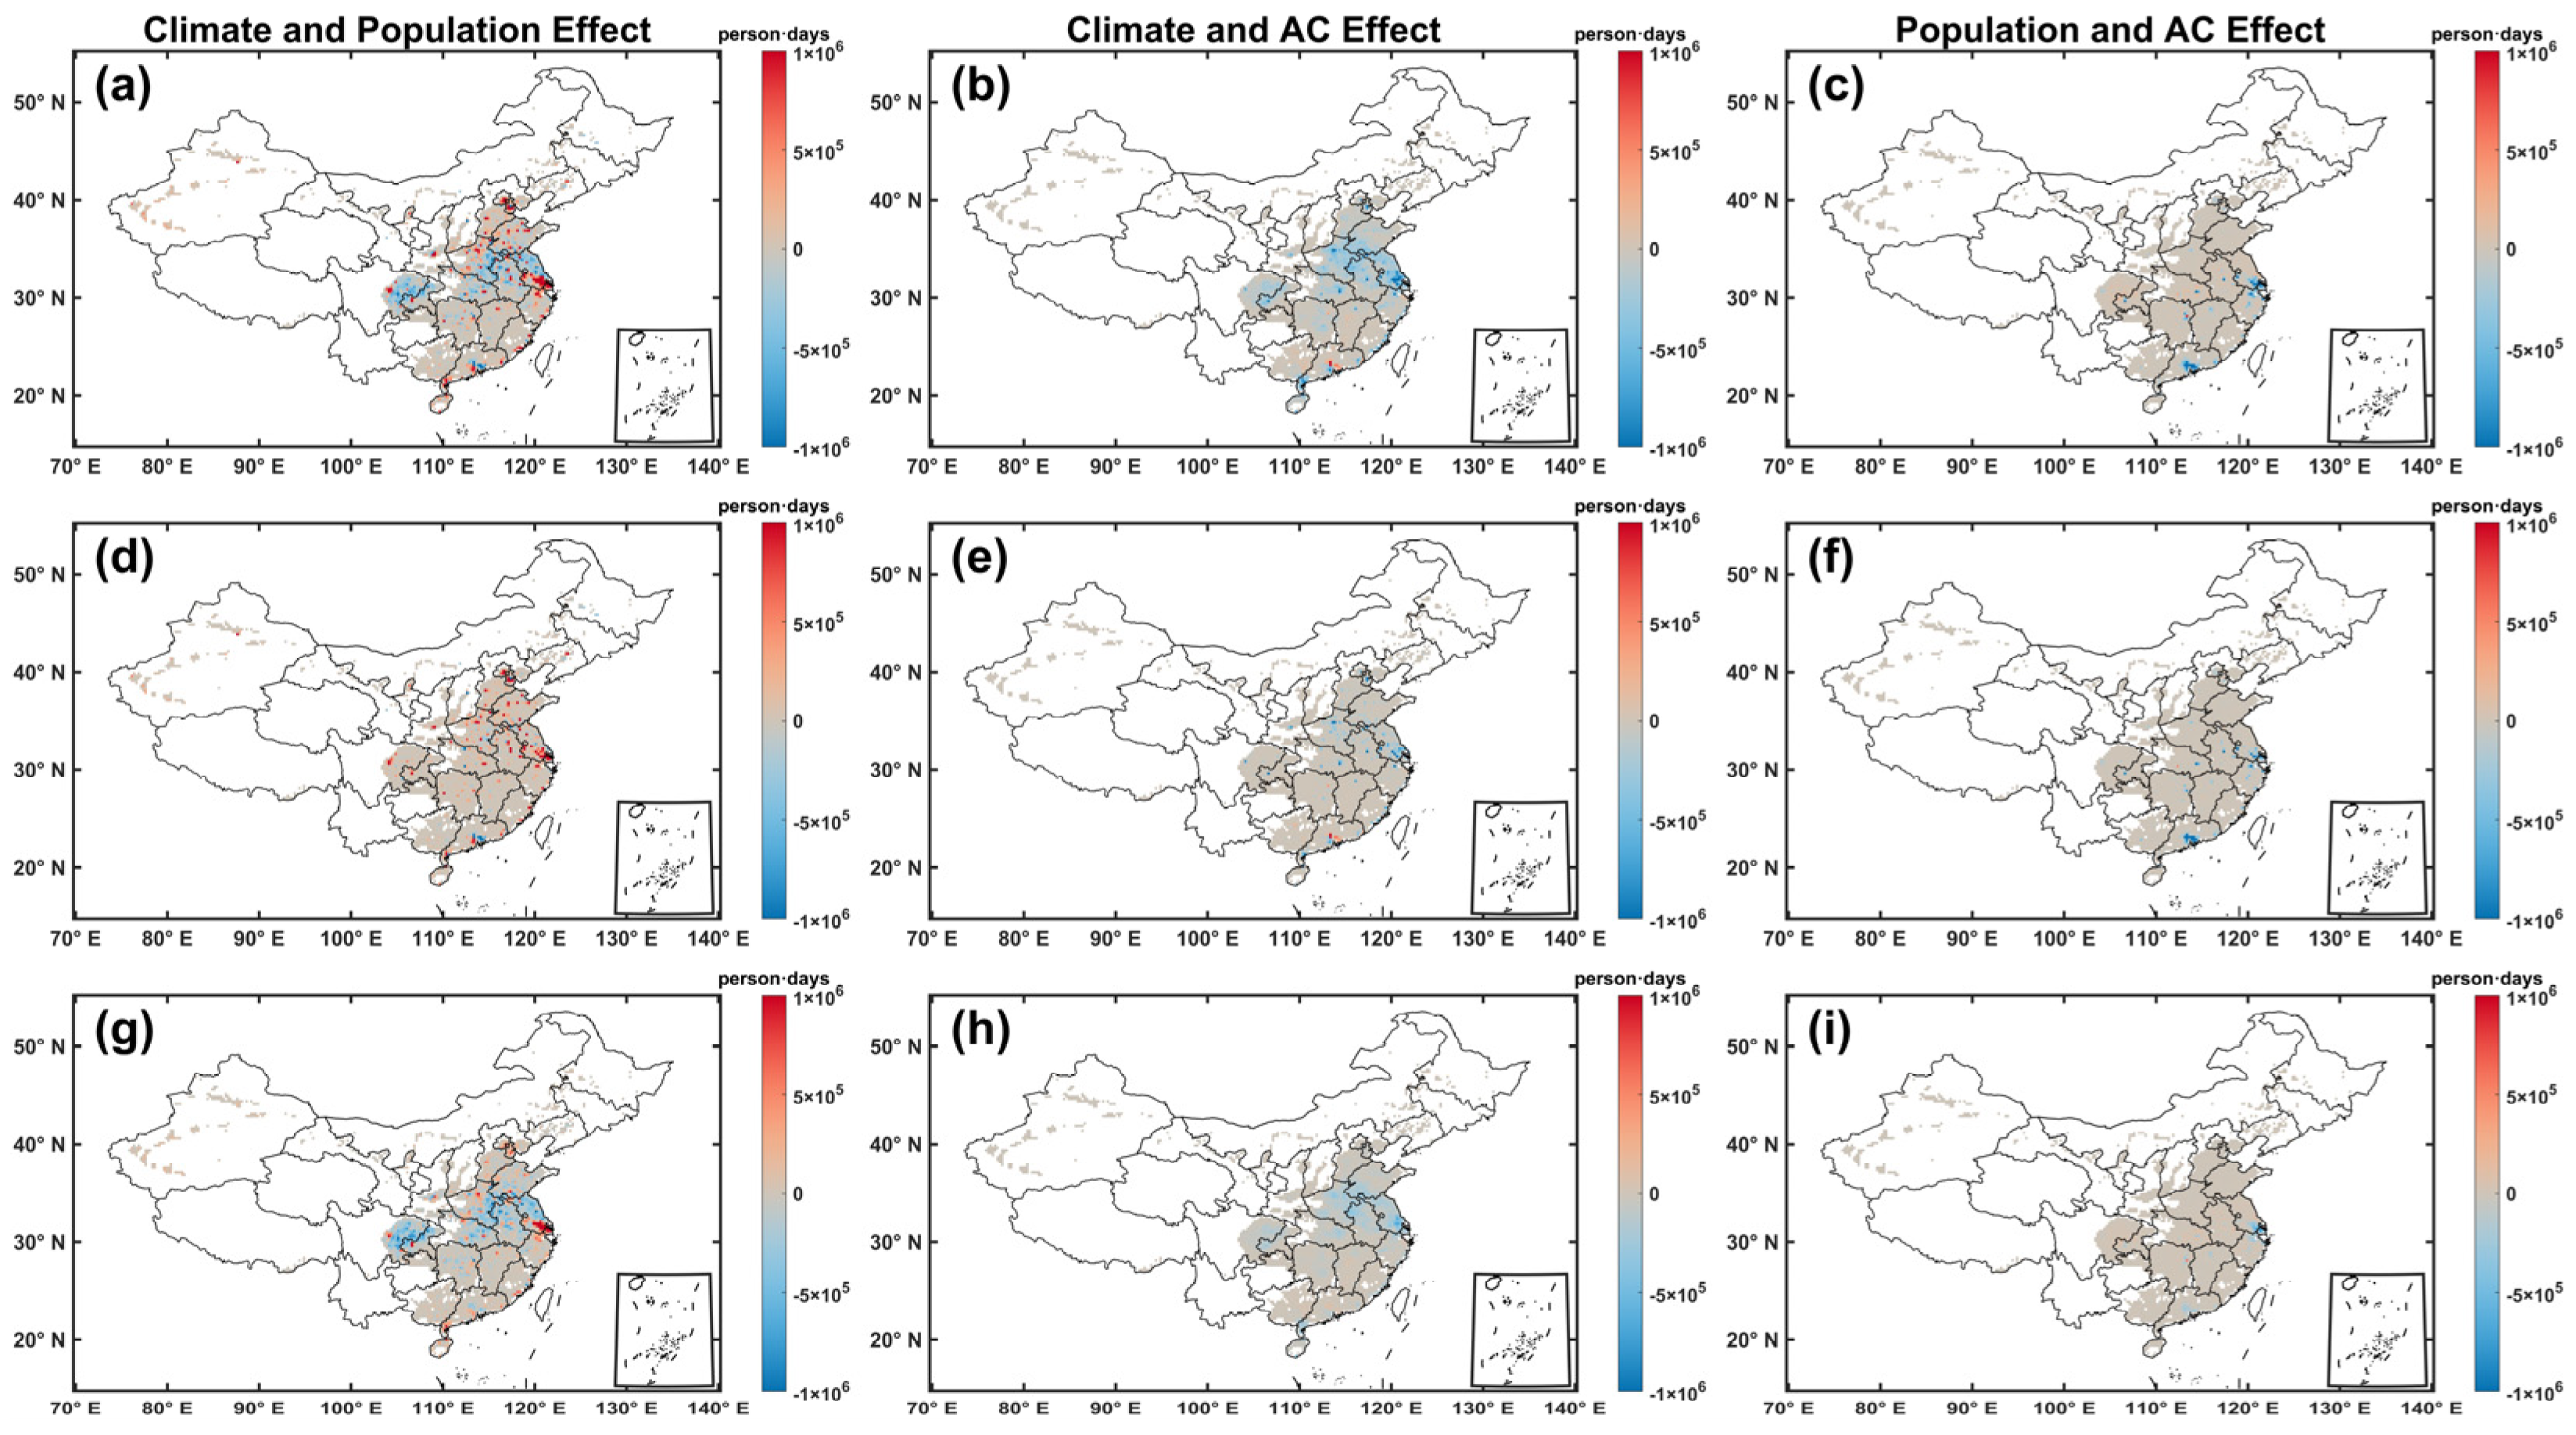
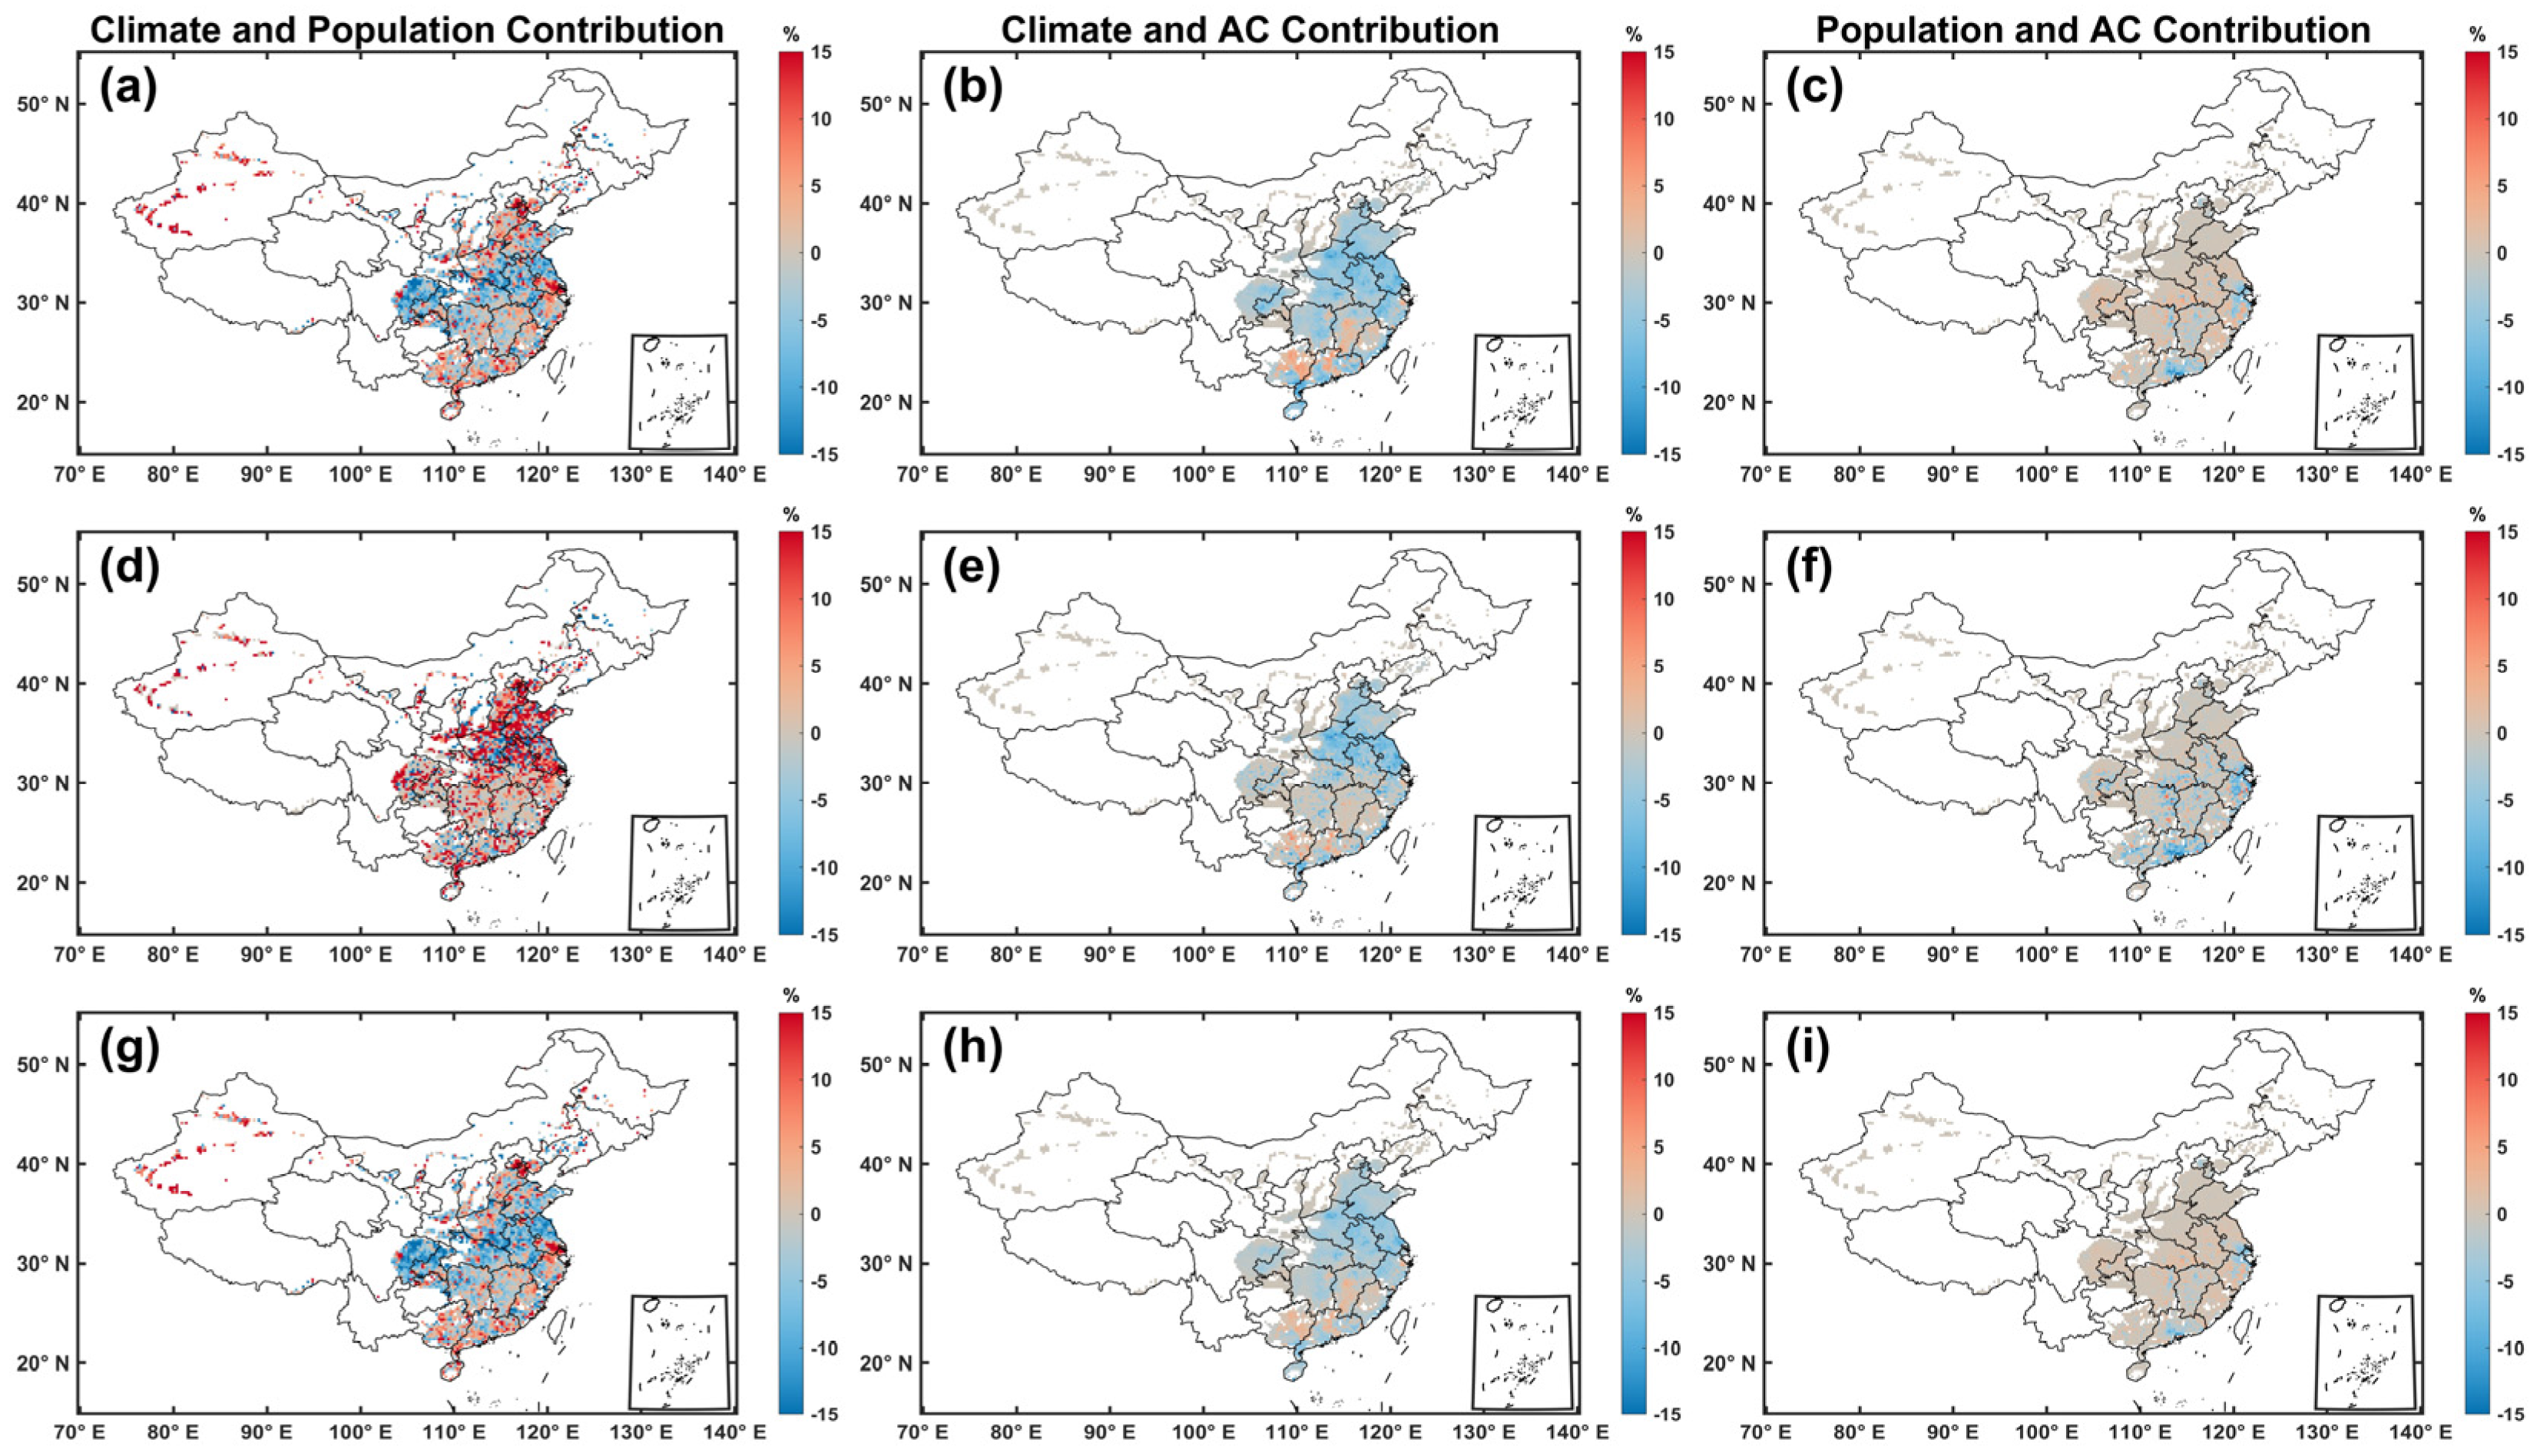
2.5. Comparing the Contribution of AC, Climate, and Population to the Exposure Changes

Previous studies have shown that changes in population exposure were also influenced by climate warming and population change [7,25,26,70]. Upon considering AC adaptation, the drivers of the exposure changes remain unknown. Therefore, the contribution of AC changes to the exposure changes was further quantified and compared to that of climate and population changes. Here, the historical period was divided into two sub-periods, i.e., 2001–2011 and 2012–2022. The total changes in population exposure (∆E) between the two sub-periods can be expressed as follows:
E = D f × 1 P f × P o p f D h × 1 P h × P o p h
where D is the number of CDNH days, P is the AC penetration, and Pop is the population. The subscript h and f for each variable on the right-hand side denote the corresponding values during 2001–2011 and 2012–2022, respectively. To break down the relative contribution of different influencing factors, several experiments were conducted. The first experiment (E1) is to fix the AC penetration and population at the 2001–2011 level but allow the climate to change during 2012–2022, indicating the effect of climate change (i.e., ∆E1 = Df × (1 − Ph) × Poph − Dh × (1 − Ph) × Poph). The second experiment (E2) is to fix climate and AC penetration at the 2001–2011 level but allow the population to change during 2012–2022, indicating the effect of population change (i.e., ∆E2 = Dh × (1 − Pf) × Poph − Dh × (1 − Ph) × Poph). The third experiment (E3) is to fix climate and population at the 2001–2011 level but allow the AC penetration to change during 2012–2022, indicating the effect of AC changes (i.e., ∆E3 = Dh × (1 − Pf) × Poph − Dh × (1 − Ph) × Poph). The difference between total exposure and the summation of the effects of the three factors was considered as their interaction effects (∆Einter = ∆E − (∆E1 + ∆E2 + ∆E3)). Then, the relative contributions of changes in climate, population, and AC units can be estimated as ∆E1/(|∆E1| + |∆E2| + |∆E3| + |∆Einter|), ∆E2/(|∆E1| + |∆E2| + |∆E3| + |∆Einter|) and ∆E3/(|∆E1| + |∆E2| + |∆E3| + |∆Einter|), respectively. In addition, the synergetic effects of two factors were conducted by allowing the two variables to change during 2012–2022 but fixing the remaining variable at the 2001–2011 level. For example, the synergetic effects of climate and AC changes were to allow climate and AC to change during 2012–2022 but to fix population at the 2001–2011 level.

2.6. Identification of Urban and Rural Areas

Here, the urban and rural areas were identified with a 0.25° × 0.25° grid for each. In order to investigate the urban–rural differences, the urban and rural areas were firstly identified at 1 km scale based on the 30 m GAIA data, in alignment with the population and GDP datasets. Specifically, for each 1 km pixel, the proportion of impervious area was calculated, and the pixels with the proportion exceeding 20% were then categorized as urban areas; otherwise, the pixel was categorized as a rural area [43,71]. Given the process of urbanization, the proportion of impervious areas was updated annually to identify urban and rural areas more accurately. Based on the identified 1 km urban/rural pixels, urbanization and non-urbanization (rural) rates for each 0.25° × 0.25° grid were then determined. For each 0.25° × 0.25° grid, the urban and rural population were obtained by multiplying the total population with the corresponding urbanization and non-urbanization rates. The GDP per capita in urban and rural areas can be calculated by Equations (9) and (10) based on 1 km population and 1 km GDP per capita data [47,71]:
G D P p ( u r b a n ) = i n ( G D P i × c i t y i ) i n ( P o p i × c i t y i )
G D P p ( r u r a l ) = i n ( G D P i × r u r a l i ) i n ( P o p i × r u r a l i )
where GDPp is GDP per capita in urban or rural areas at a 0.25° × 0.25° grid, i and n denote the i-th and total number of 1 km pixels within the 0.25° × 0.25° grid, city and rural indicate whether the 1 km pixel is urban or rural, with city = 1 (rural = 0) for urban pixels and rural = 1 (city = 0) for rural pixels. Finally, based on the GDP per capita and population in urban and rural areas, population exposure to CDNH and the impacts of AC adaptation in both urban and rural areas were estimated by the methods described in Section 2.3, Section 2.4 and Section 2.5, respectively.

3. Results

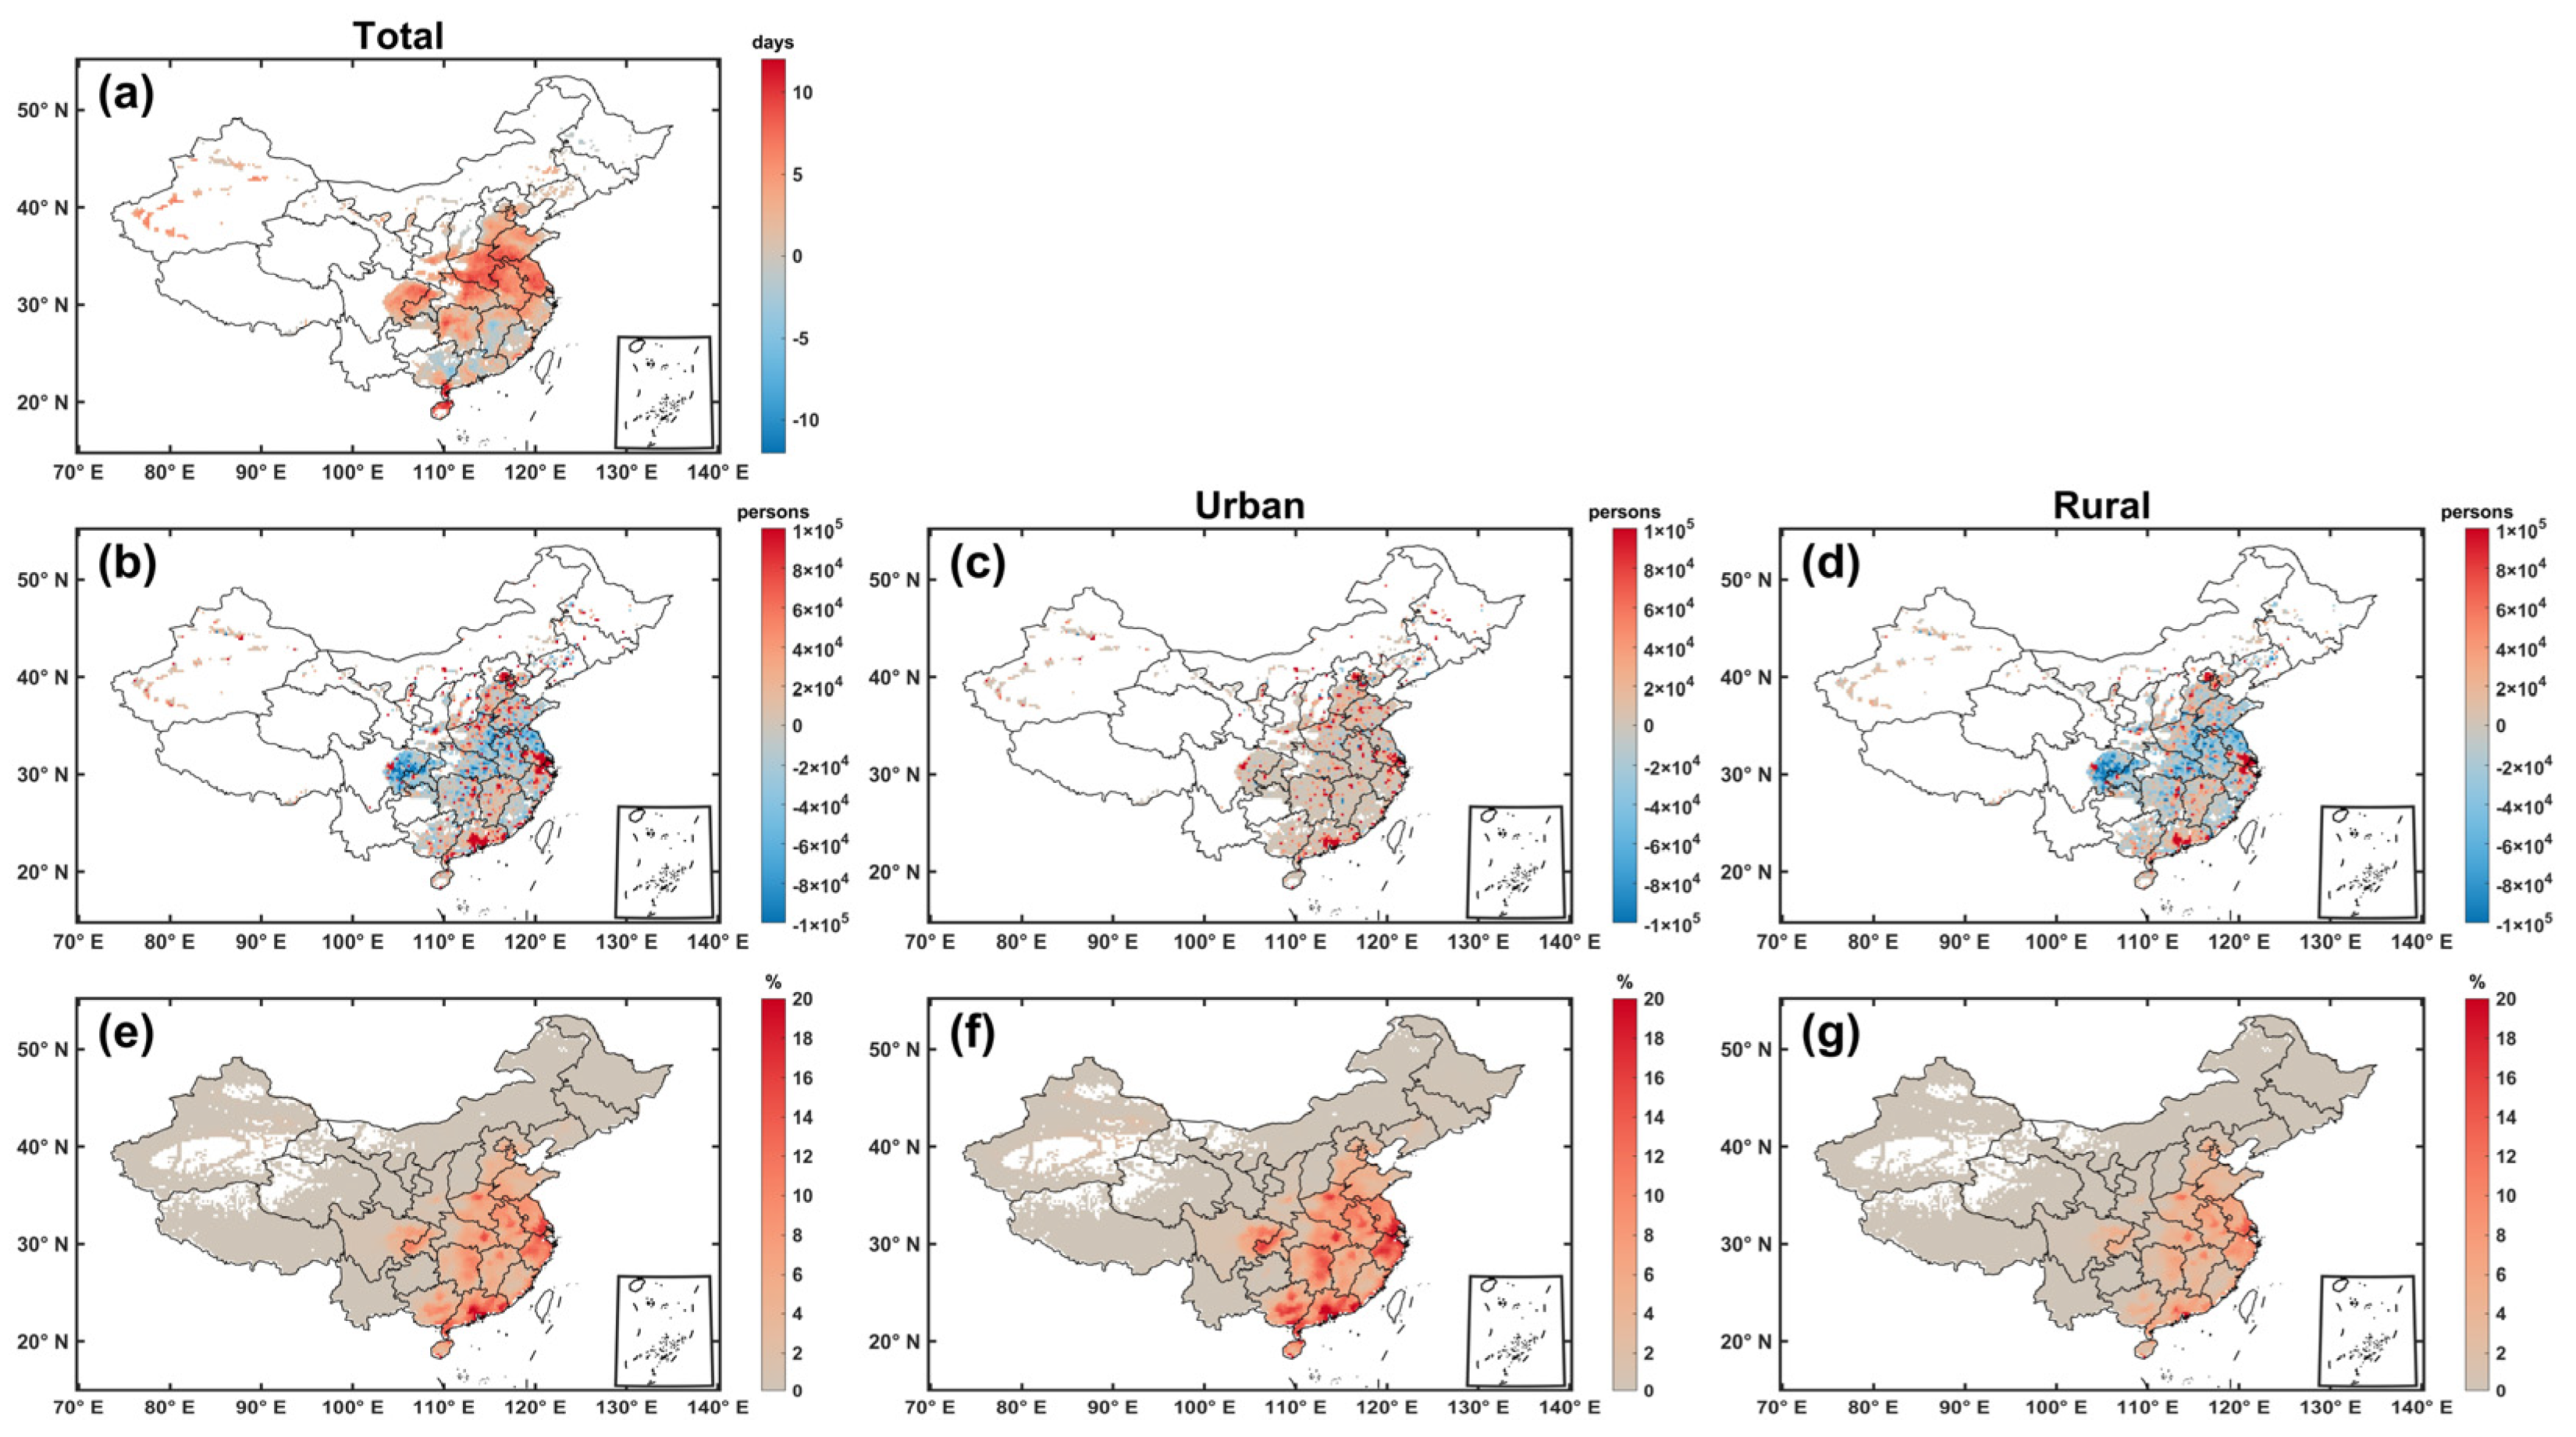
3.1. The Spatio-Temporal Characteristics of CDNH

Figure 4a shows the spatial distributions of summertime CDNH days averaged over the period of 2001–2022. The duration exhibited significant spatial discrepancy, with more CDNH days in central and southern China, such as in the Sichuan Basin, the middle and lower reaches of the Yangtze River, the Huai River Basin, and the Pearl River Delta. The spatial distribution of the CDNH days was similar to the climate maximum saturation (Figure A3), with a higher cooling demand in southern China and the Sichuan region. Despite higher CDNH frequency in some parts of Xinjiang, they were not focused on in this study due to lower population density. Therefore, the middle and lower reaches of the Yangtze–Huai River basin (Region I), Sichuan Basin (Region II), and south China (Region III) were detected as CDNH hotspots in this study. The average durations in the three regions are 8.71, 9.24, and 5.96 days/year, respectively, which were much higher than the duration averaged over the Chinese mainland (2.77 days/year). Figure 4b further shows the temporal trends of the CDNH days averaged over the three regions from 2001 to 2022. The CDNH days in the three regions exhibited inapparent upward trends, with increase rates of 0.313, 0.383, and 0.197 days/year in Region I, II, and III, respectively. Notably, Region I and II experienced a severe CDNH event in 2022, which has been confirmed in previous studies [72,73]. The statistically non-significant increasing trends may be due to small samples (22 years). Notably, Region II (Sichuan Basin) emerged as a critical area requiring prioritized implementation of heatwave-mitigating measures in terms of larger increases in CDNH days.

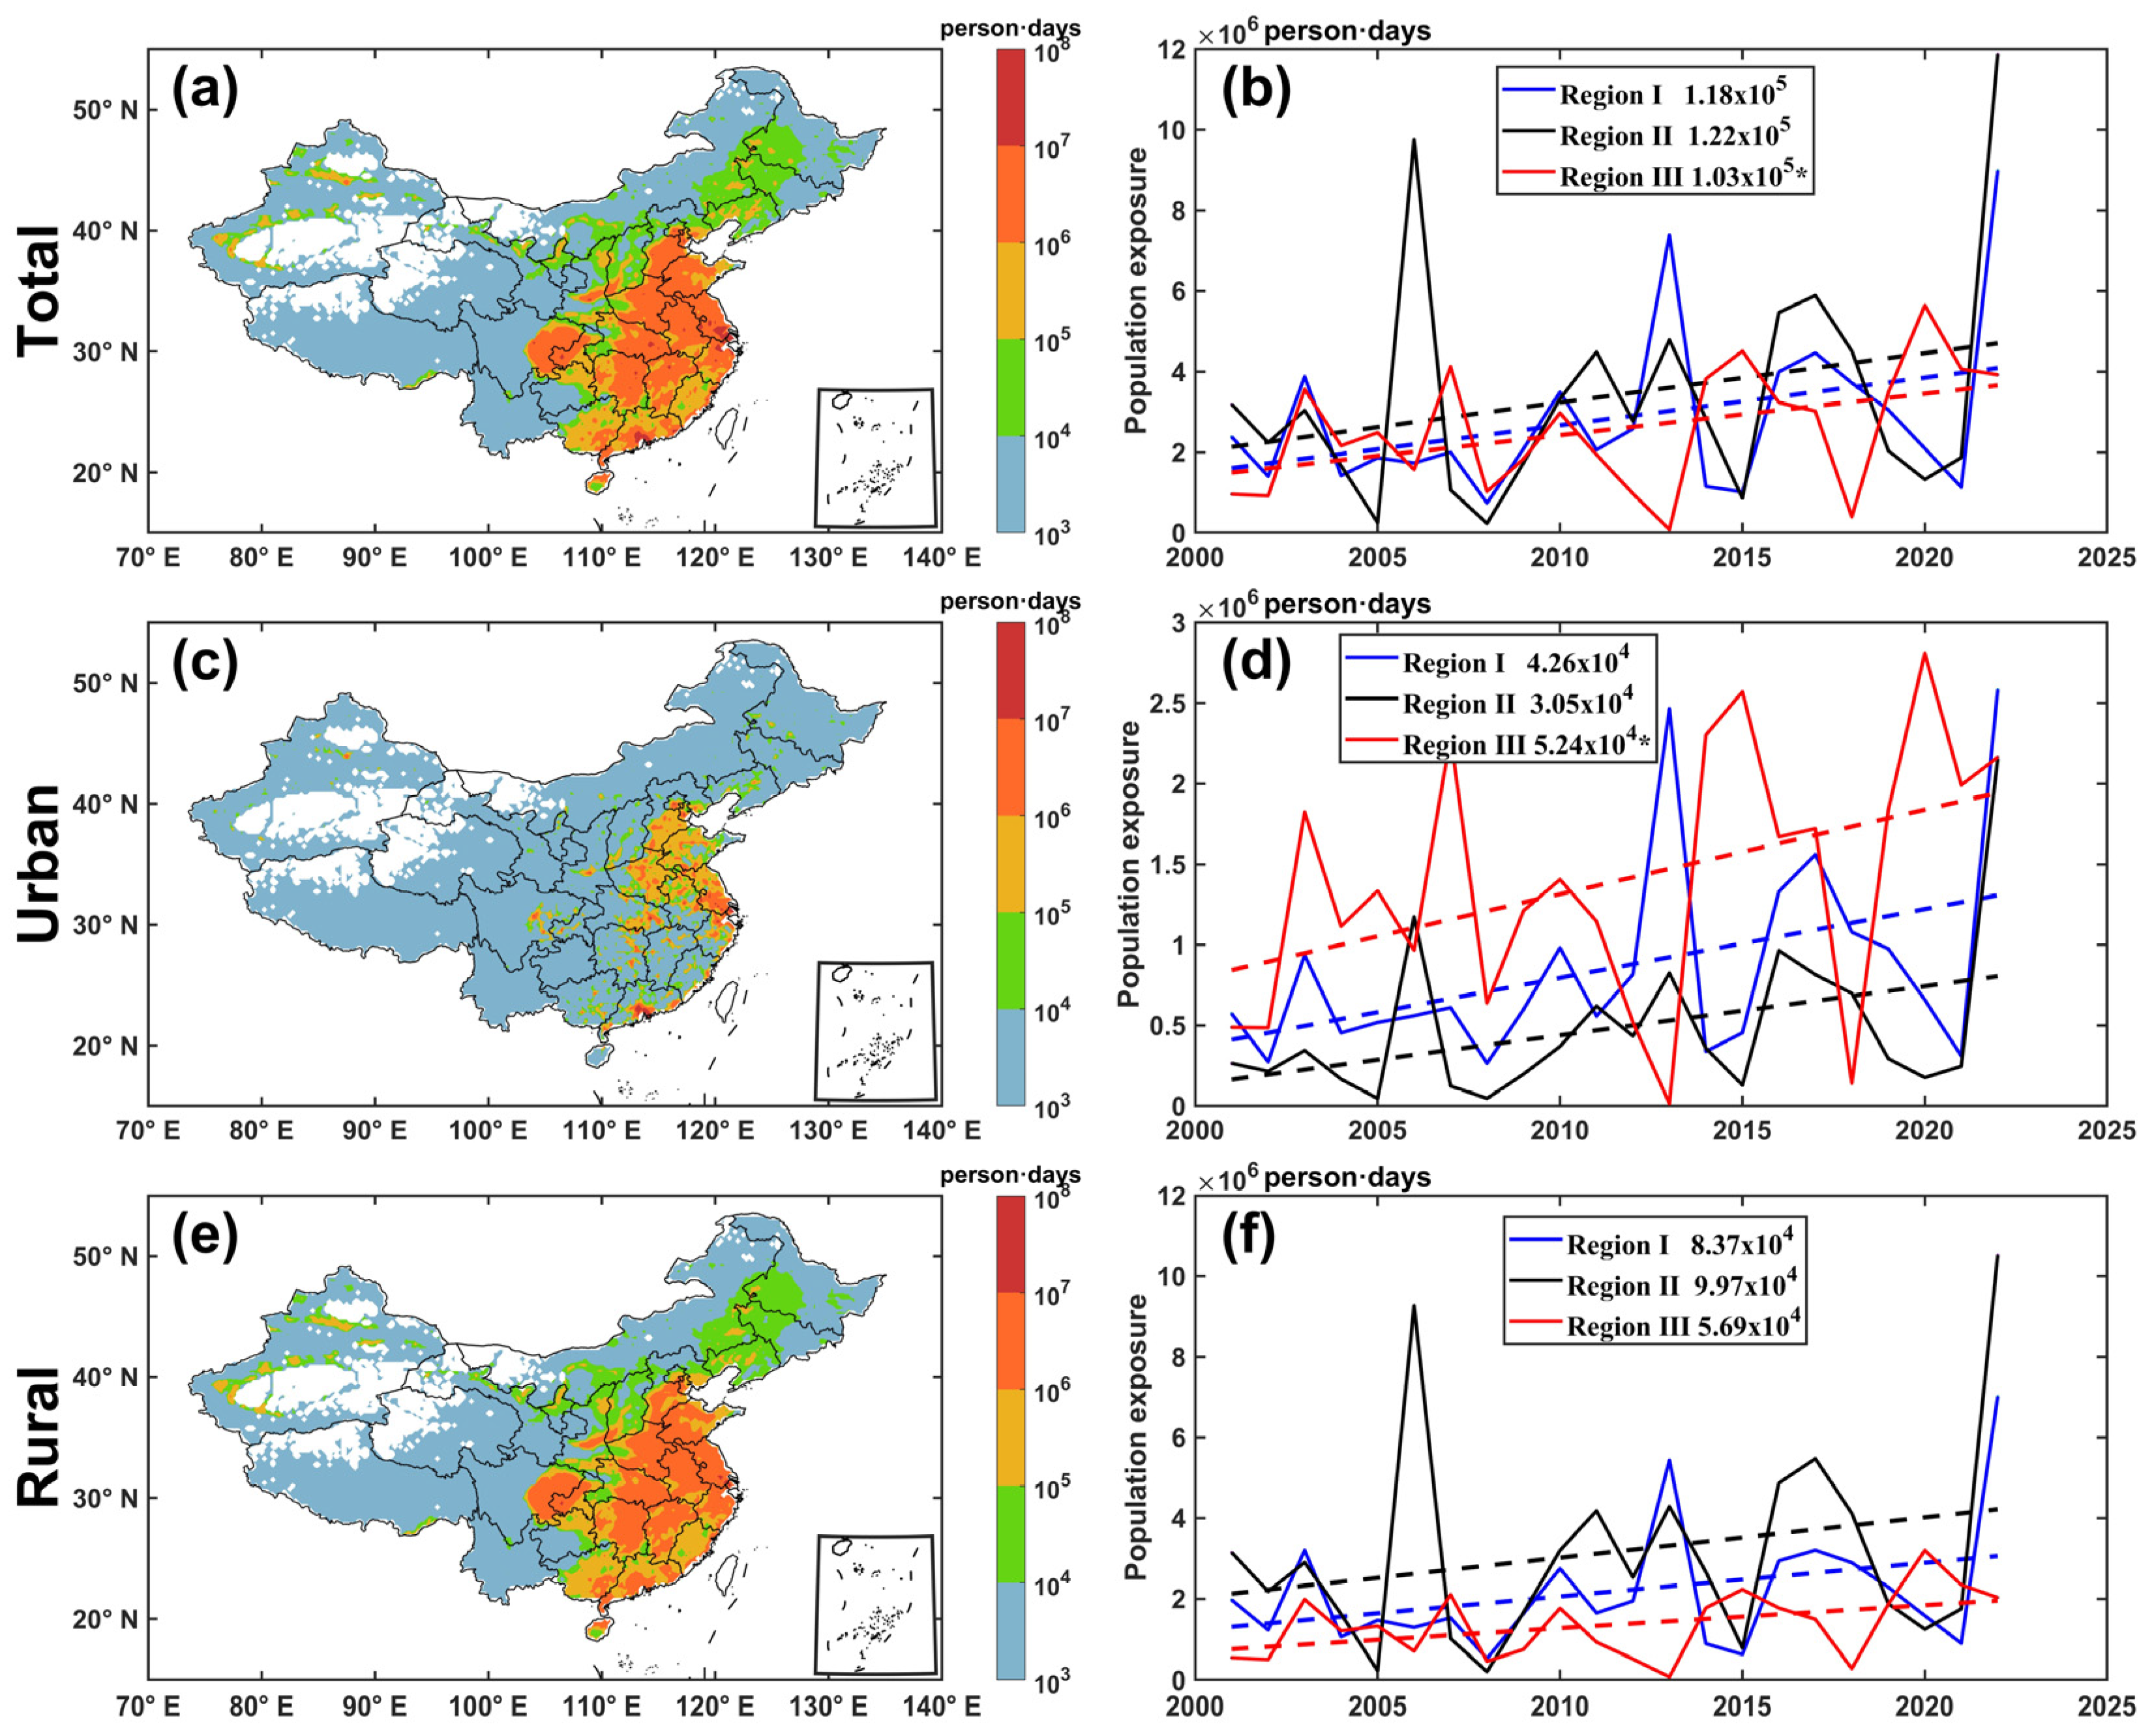
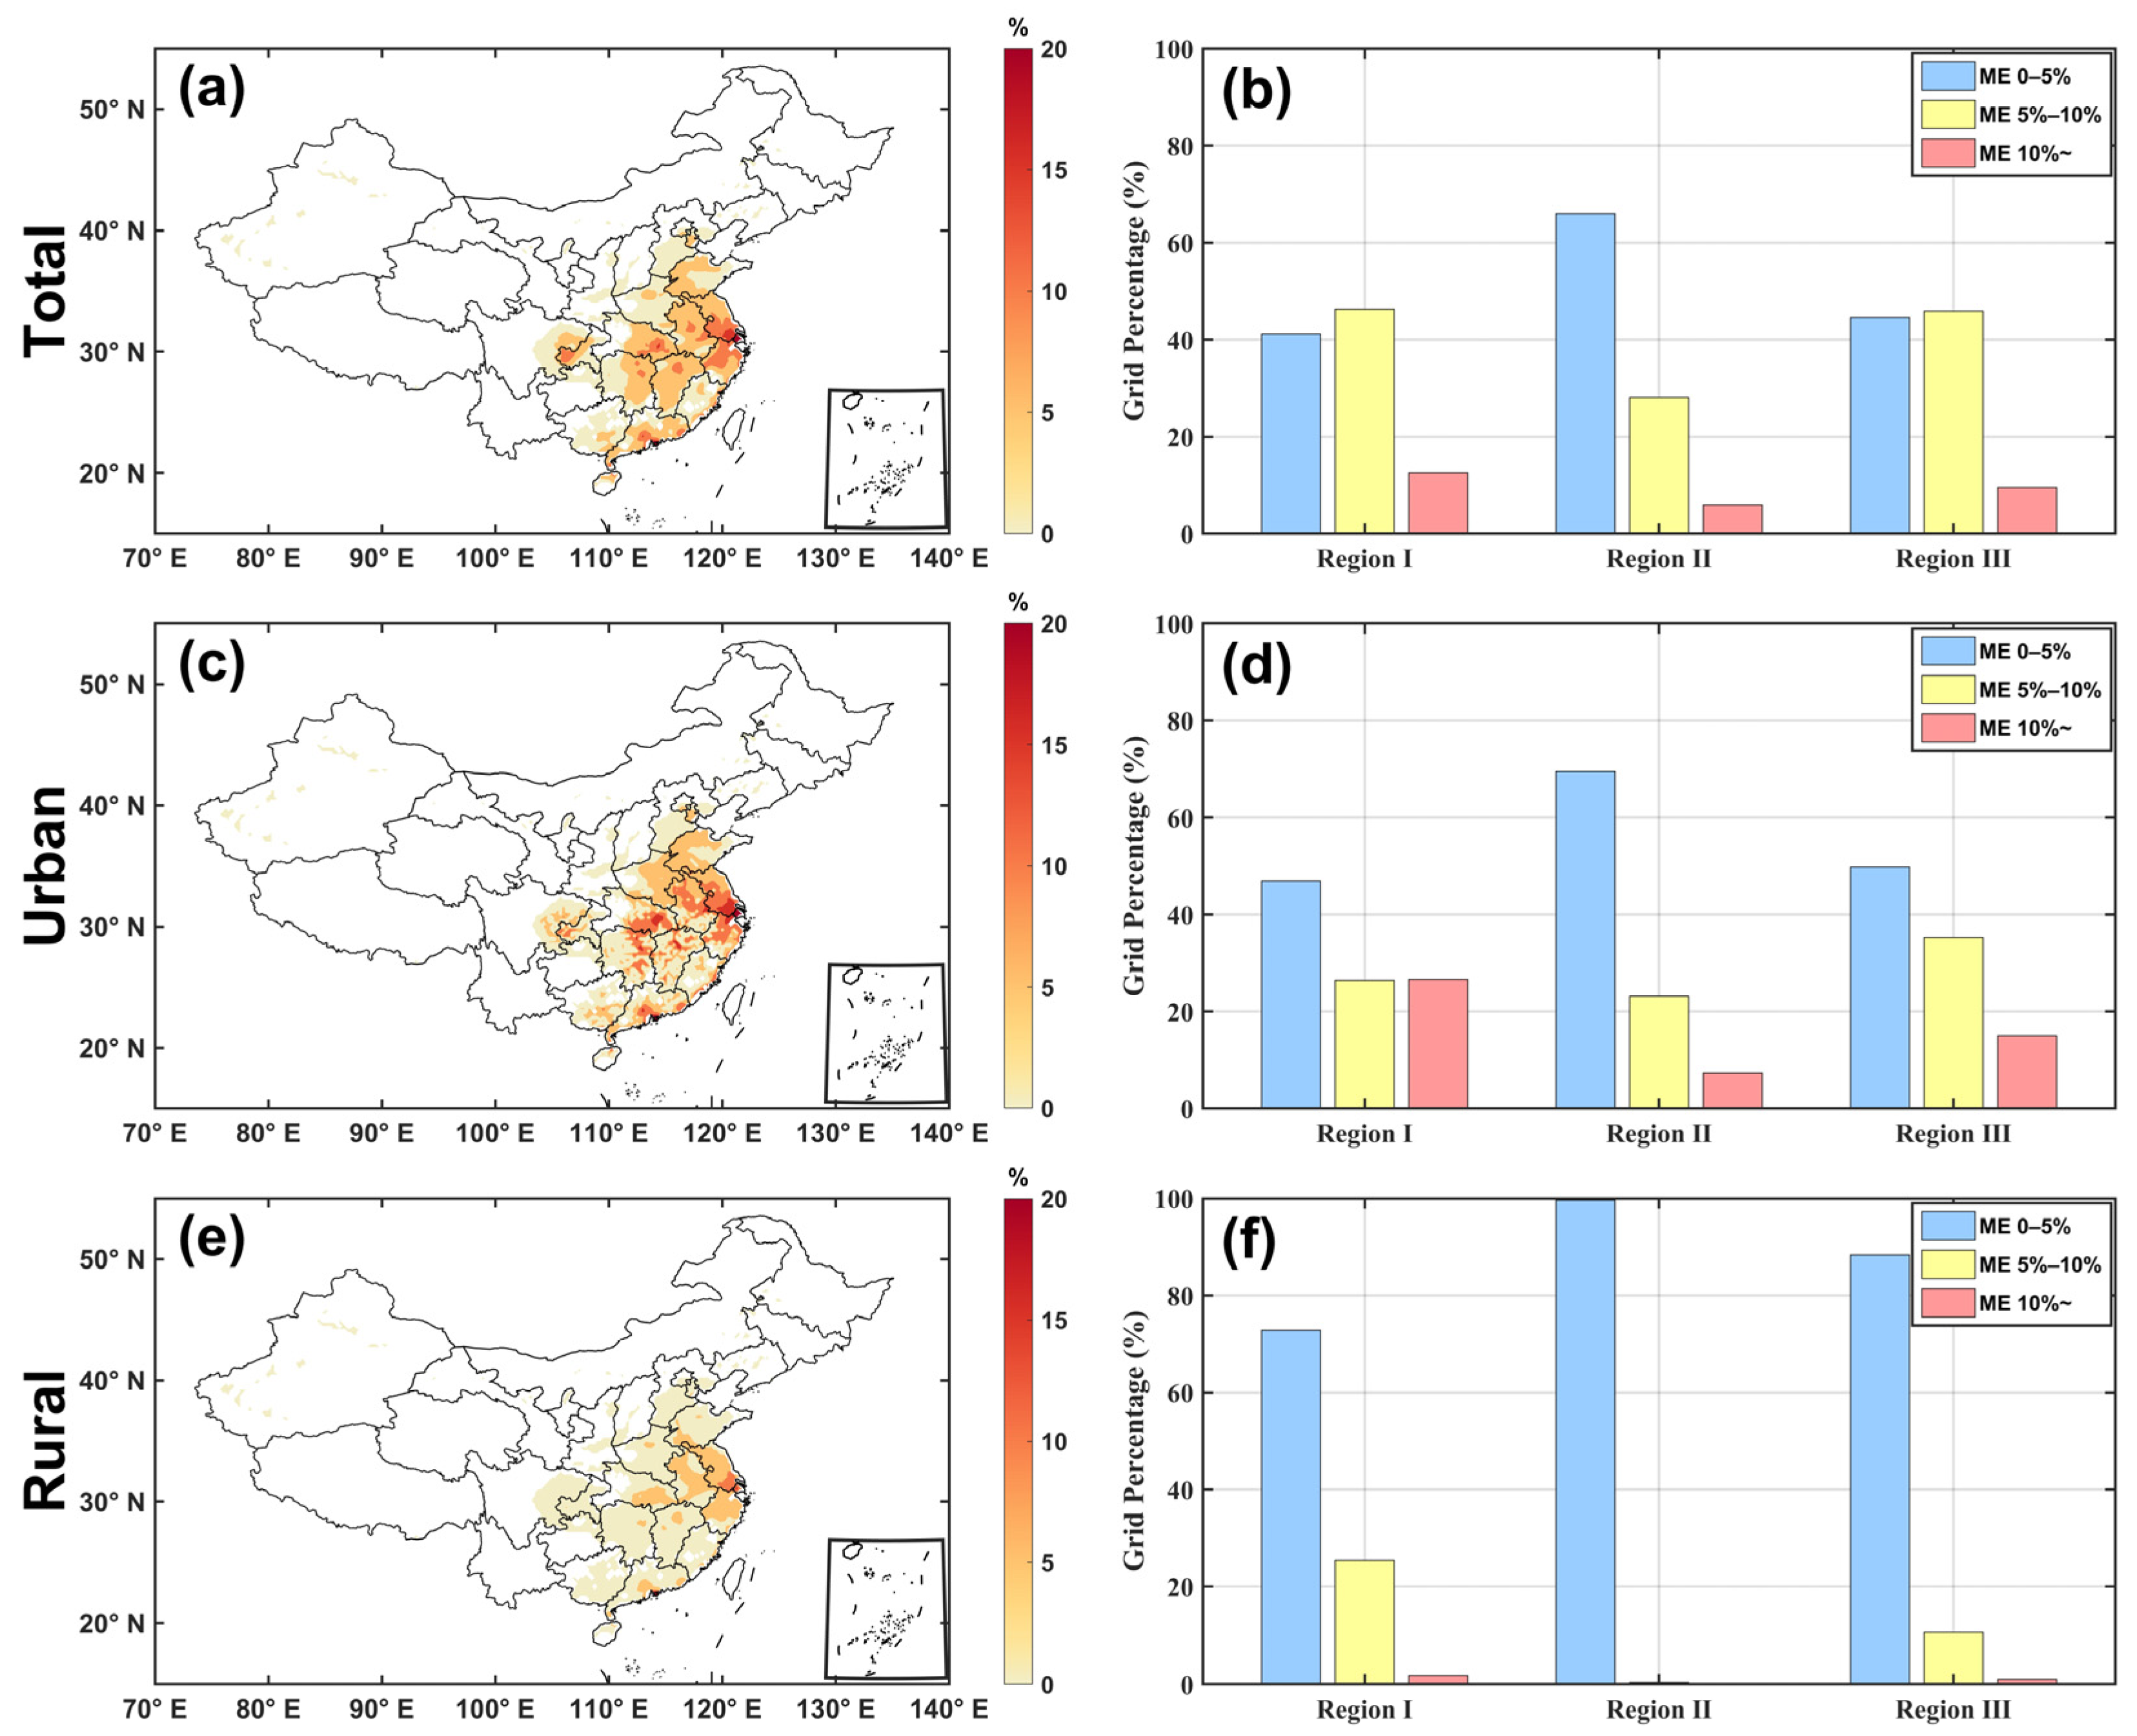
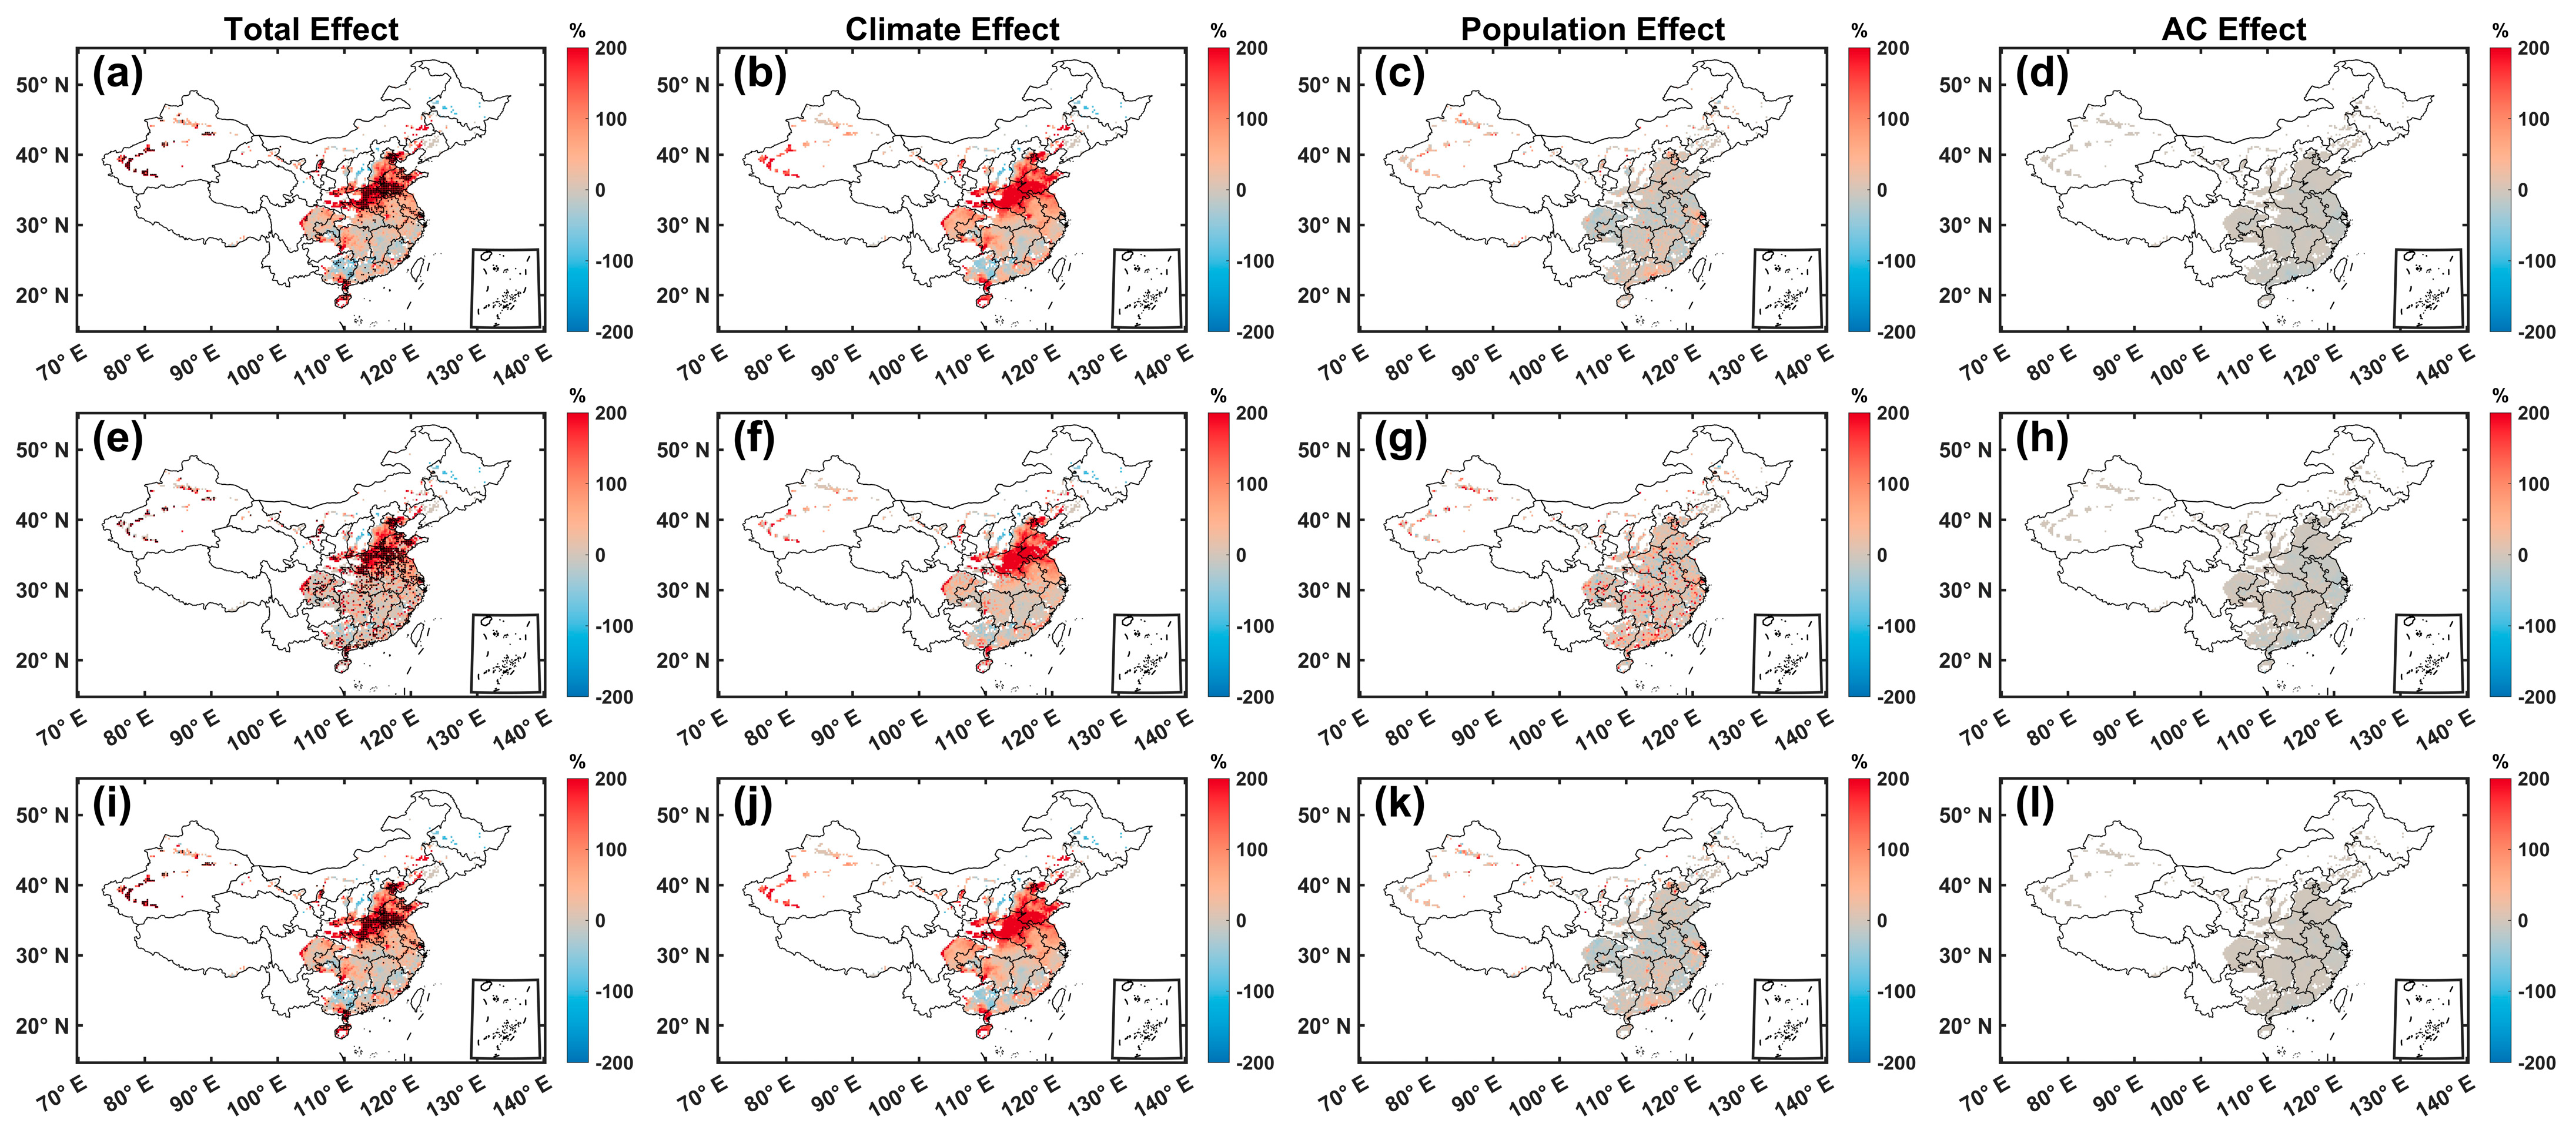
3.2. Population Exposure to CDNH and the Effect of AC Adaptation

The spatial distributions of population exposure to CDNHs without considering AC adaptation are shown in Figure 5a,c,e. The population exposure exhibited a higher level in eastern China and lower levels in western China, which was consistent with the spatial patterns of both CDNH days and the population density across China. Specifically, regions with high population exposure were mainly located in north China, central China, east China, south China, and southwest China, with exposure spanning from 35,000 person-days/year to 116 million person-days/year. Among these regions, urban areas exhibited more concentrated exposures, with particularly high exposures (10–100 million person-days/year) in big cities, such as Beijing, Shanghai, Nanjing, Guangzhou, Shenzhen, Wuhan, and Chengdu (Figure 5c). In rural areas, the distribution of exposure was more dispersed and consistent with the distribution of the total exposure, with higher levels in the Sichuan Basin, south China, central China, east China, and the North China Plain (Figure 5e). Figure 5b,d,f further show the temporal trends of the population exposure averaged across the three CDNH hotspots from 2001 to 2022. It can be found that the total exposure in the three regions exhibited increasing trends, especially in Region III (p < 0.05), with an increase rate of 103,000 person-days/year (Figure 5b). In these regions, the increases in urban areas were more significant than that in rural areas, indicating higher heatwave exposure risk in urban areas. Among these regions, urban areas exhibited more pronounced increases compared to their rural counterparts, indicating larger heatwave exposure risks in urbanized zones.
The population exposure to CDNHs considering AC adaptation is shown in Figure 6. Figure 7 further displays the relative changes in the exposure by considering AC adaptation. The spatial patterns of the exposure considering AC adaptation were similar to that without AC adaptation, but with lower exposure levels (Figure 6a,c,e). Higher exposure was still concentrated in north China, central China, east China, south China, and southwest China, with exposure spanning from 32,000 to 85 million person-days/year (Figure 6a), which is smaller than that without considering AC adaptation (Figure 5a). The AC adaptation has reduced the exposure over most study regions, especially in eastern and southern China (Figure 7a), with a mean reduction rate of 5.85%, which is calculated by the difference in exposure between the scenarios without and with AC adaptation divided by the exposure without AC adaptation (see Equation (7)). Among these regions, Region I exhibited the highest percentage of grid points (12.54%) with AC-mitigating effects exceeding 10%, larger than Region II (5.69%) and Region III (9.58%) (Figure 7b). These regional disparities can be partially attributed to the relatively higher economic level in the middle and lower Yangtze River Basin. Moreover, the mitigating effects of the AC adaptation were more significant in urban areas, such as Shenzhen and Hong Kong, with a mean reduction rate of 28–35% (Figure 7c). The reduction was much smaller in rural areas, with more than 70% of the rural areas showing a reduction rate less than 5% (Figure 7e,f).
In addition, upon considering AC adaptation, the increase trends of the exposure also reduced, especially in urban areas. For example, in urban areas of Region III, the mean increase rate in exposure was 12,500 person-days/year, much smaller than that without considering AC adaptation (52,400 person-days/year) (Figure 5d and Figure 6d). The AC adaptation has slowed down the increasing trend of urban population exposure over the three hotspot regions by about 47.45% (Figure 5d and Figure 6d). The reduction was the largest in Region III (76.15%), followed by Region I (41.08%) and Region II (35.08%) (Figure 5d and Figure 6d). In contrast, the impact of AC adaptation on rural areas was relatively weaker, with an average reduction of 24.86%, only half of the reduction rate observed in urban areas (Figure 5f and Figure 6f). Specifically, exposure trends in rural areas of Region I, II, and III were reduced by 25.57%, 18.96%, and 25.31%, respectively (Figure 5f and Figure 6f). The above results consistently indicate that the AC adaptation could significantly reduce the population exposure risk to CDNHs and their increasing trends, with more considerable reductions in eastern and southern China and urban areas while lower reductions in rural areas. These findings indicate the critical role of AC as a viable heatwave adaptation measure, with important implications for climate resilience planning.

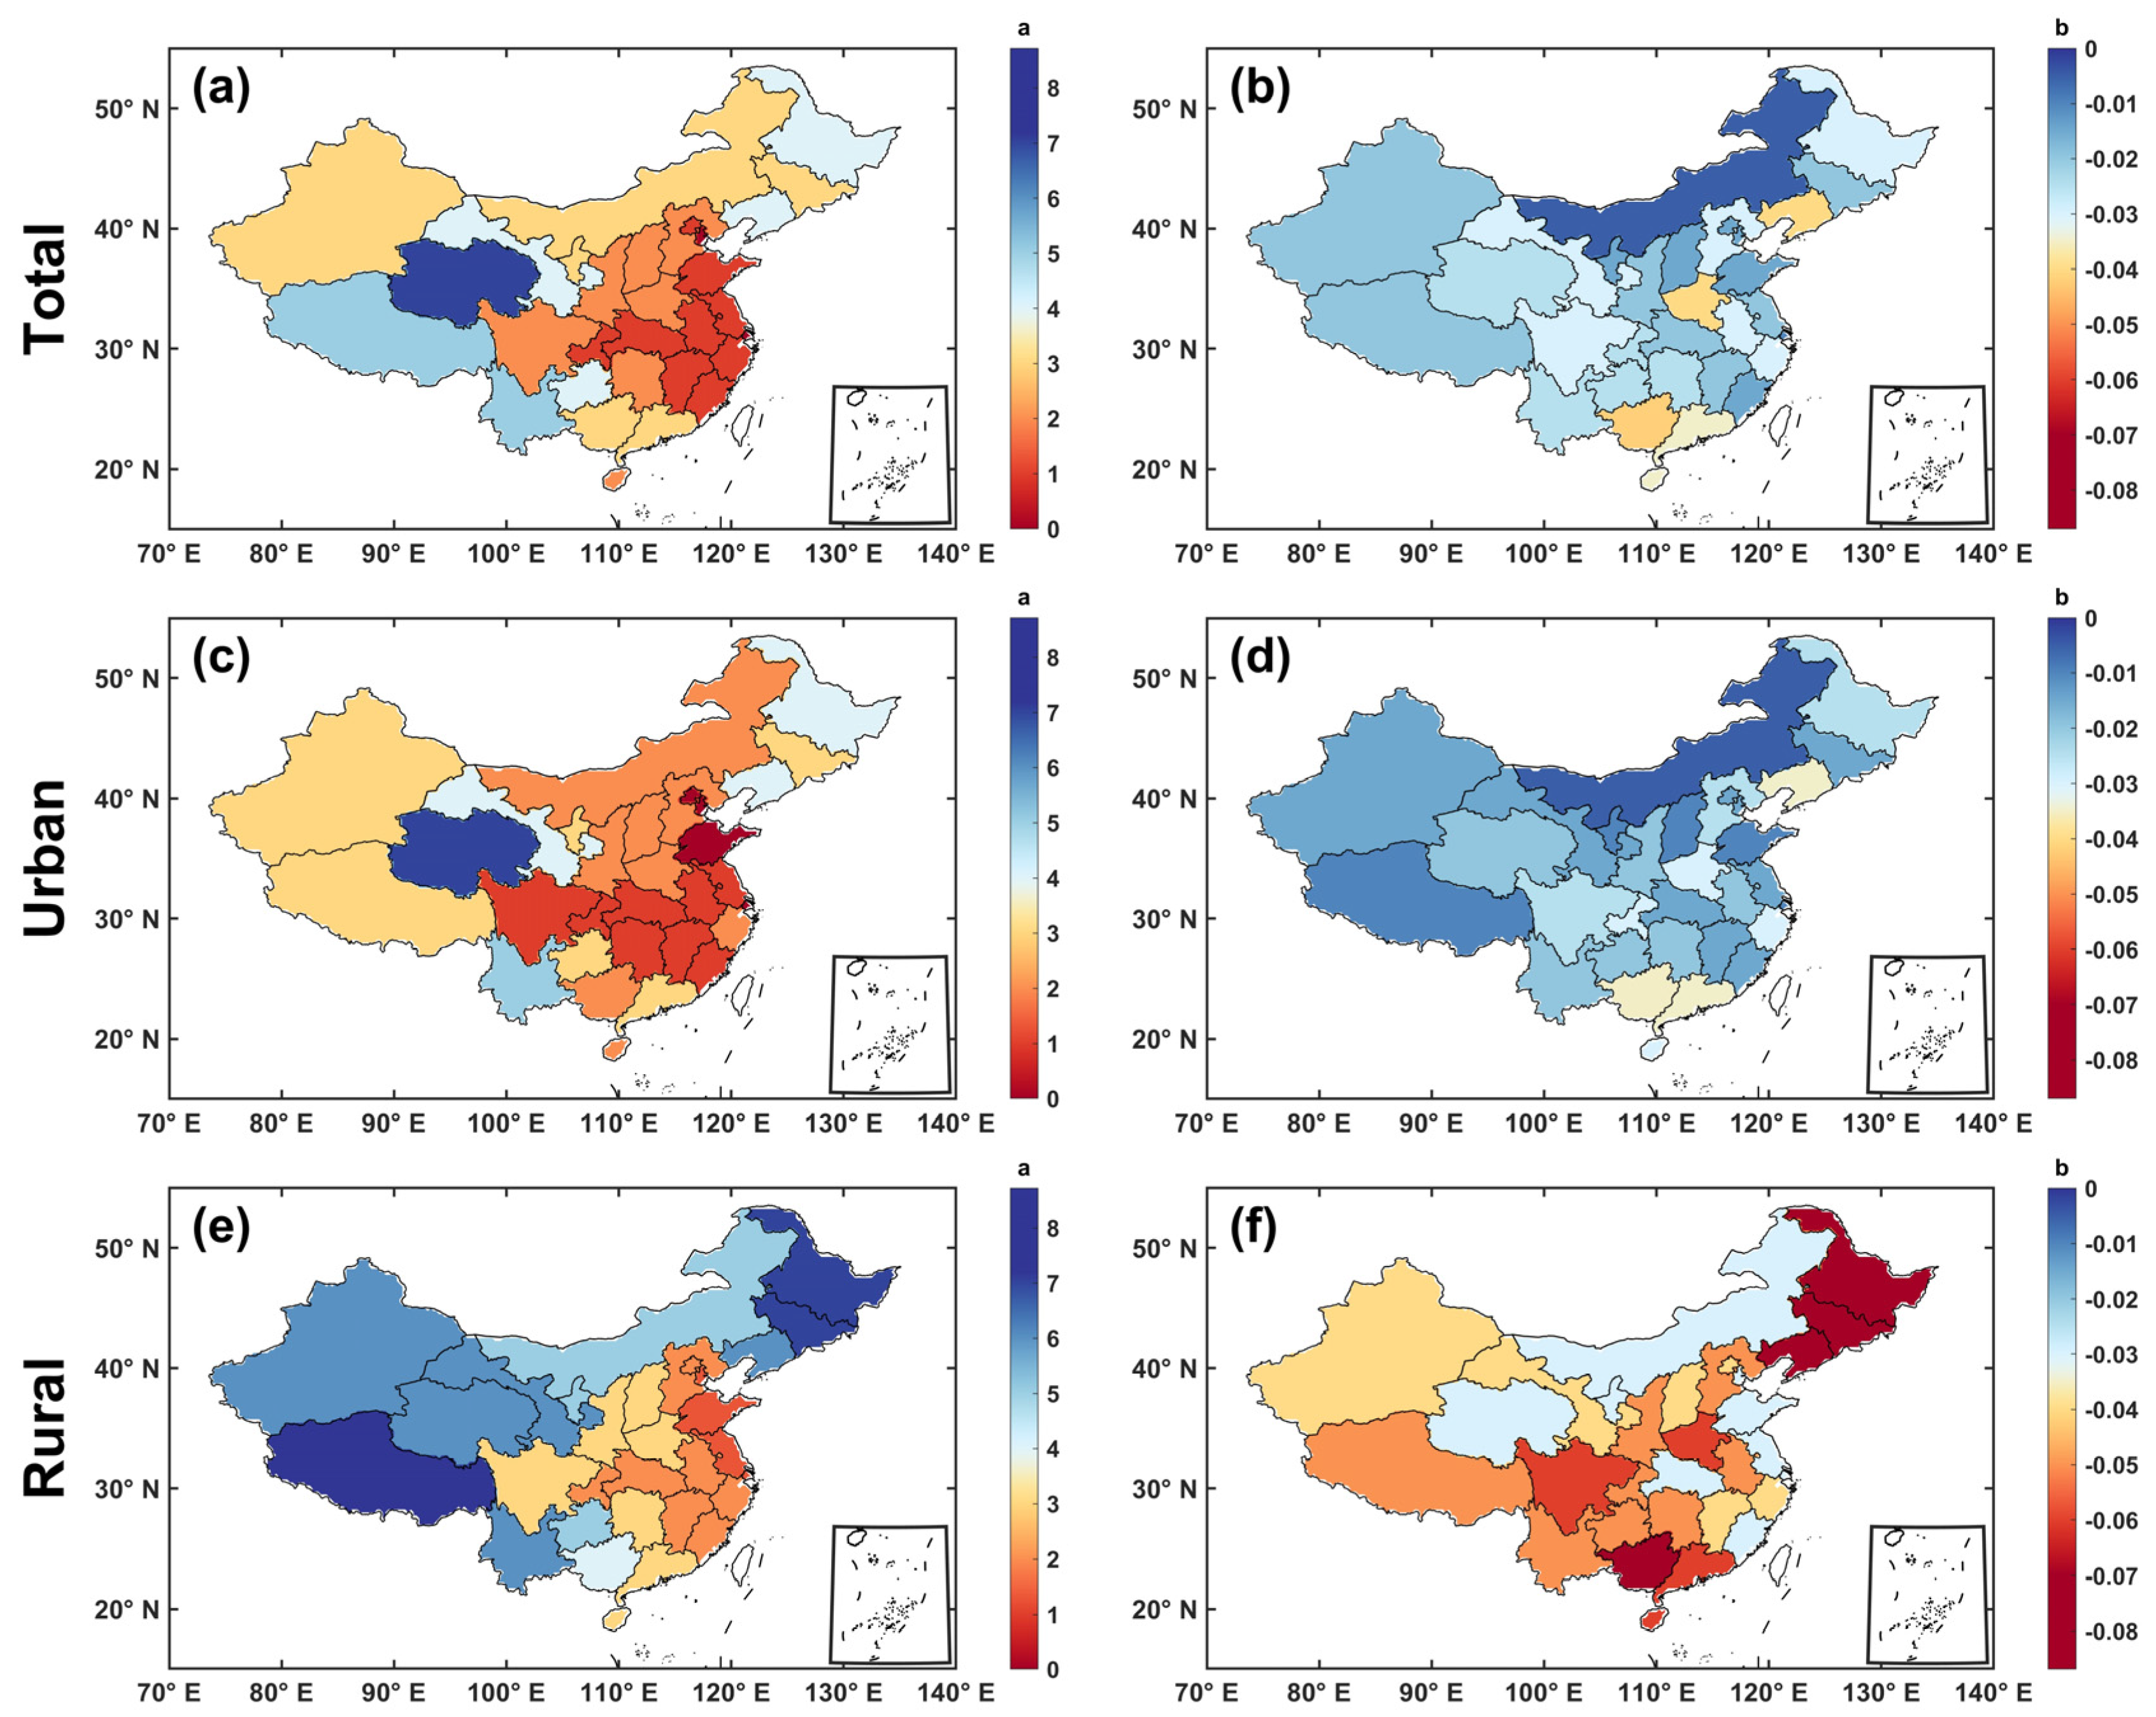
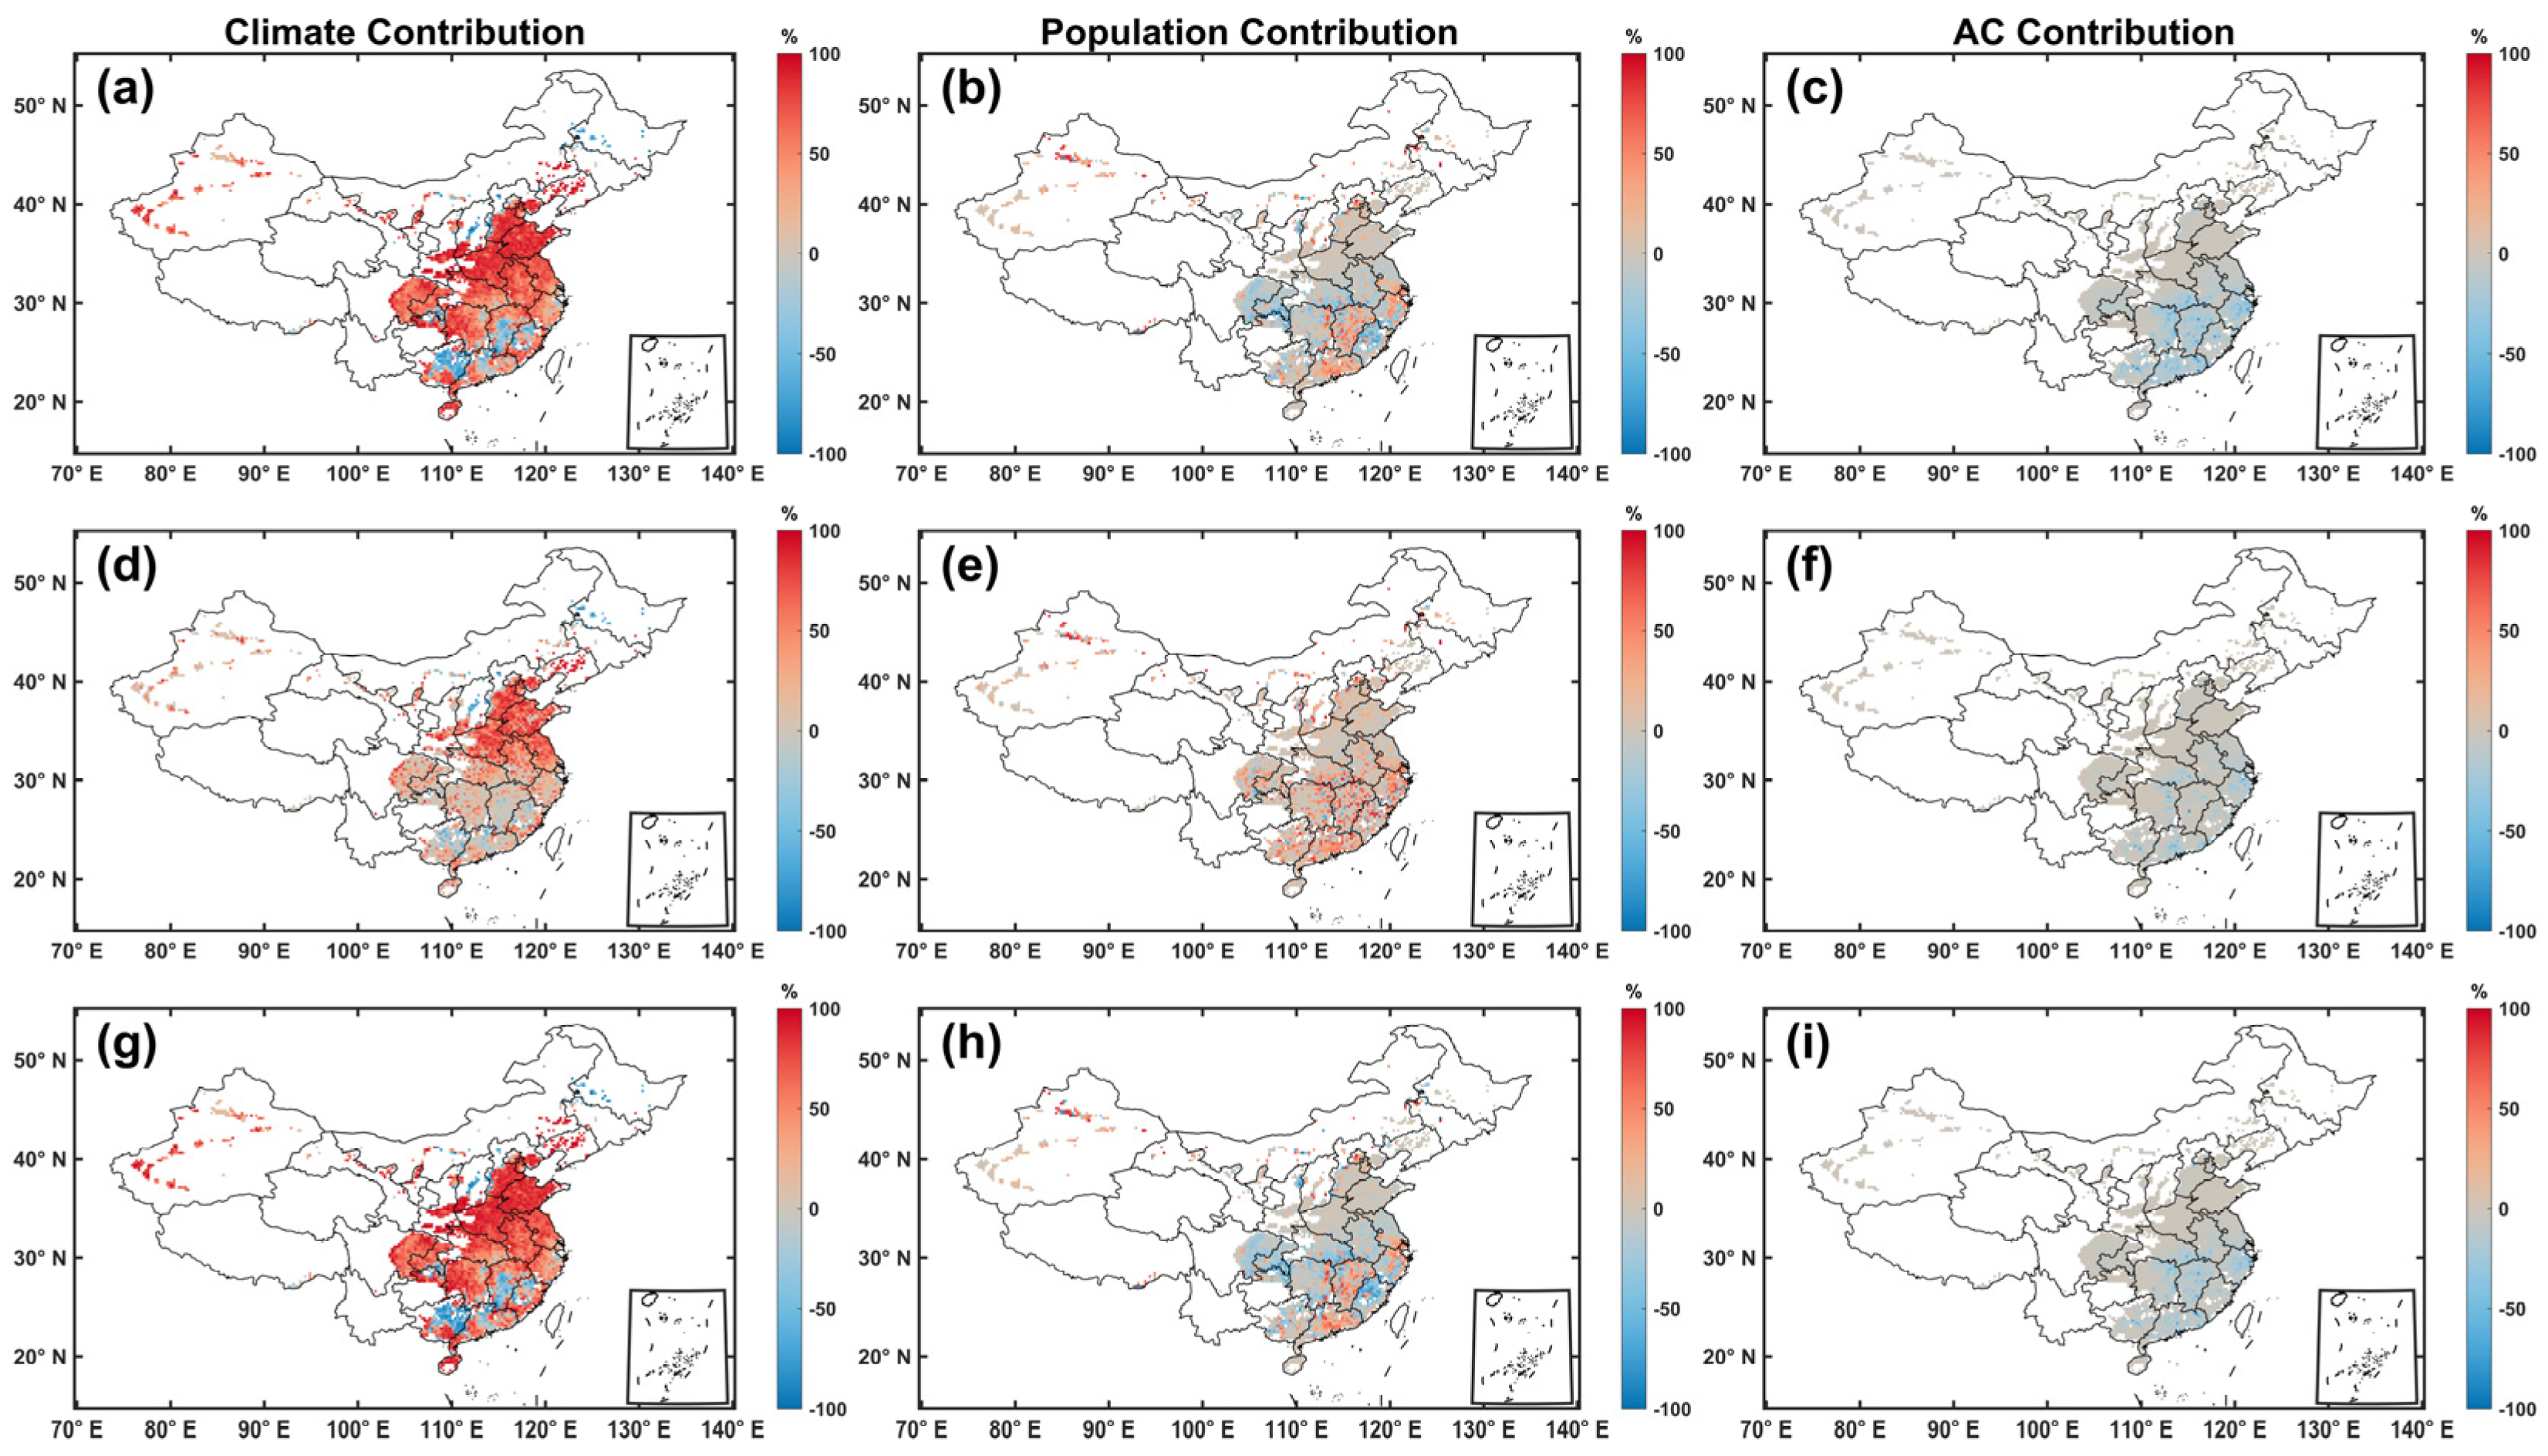
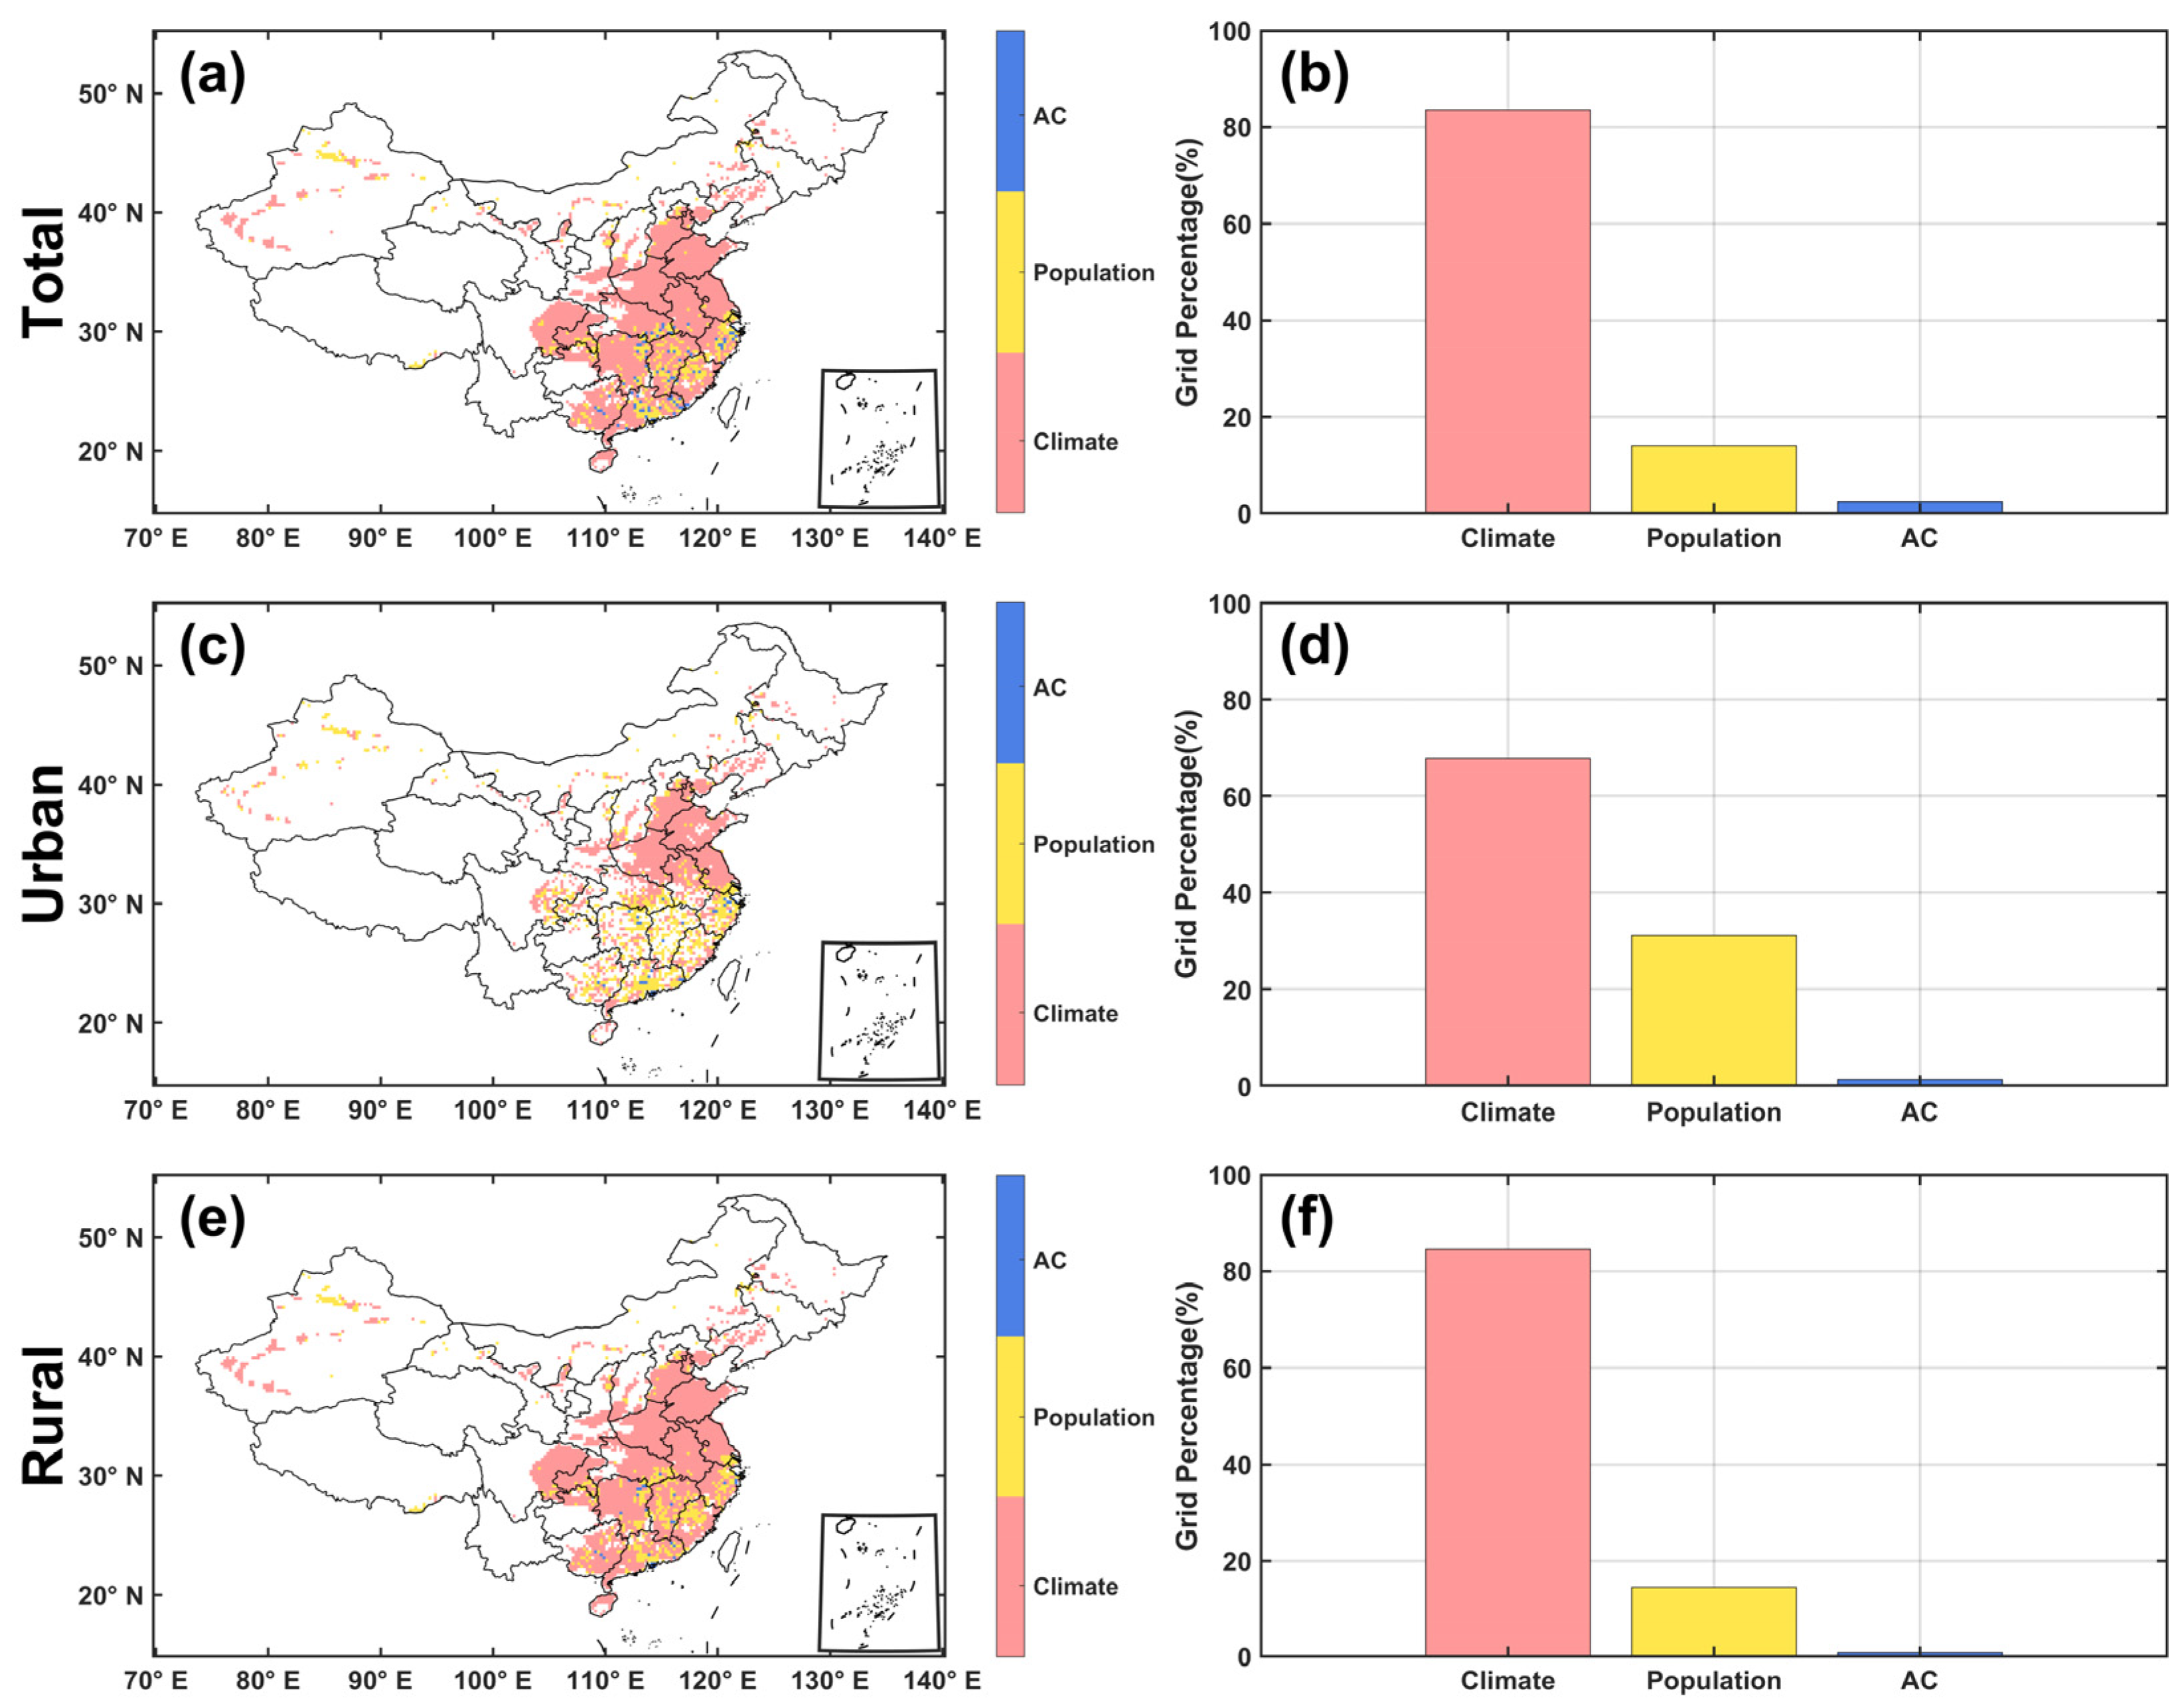
3.3. The Contribution of AC, Climate, and Population to the Changes in Exposure

The changes in population exposure to CDNHs over time and the contribution of AC changes were further investigated in comparison to the contribution of climate and population changes. Here, the study period was divided into two sub-periods, i.e., 2001–2011 and 2012–2022. The changes were defined as the differences in the corresponding variables between the two sub-periods. Then, the contribution can be estimated with the methods described in Section 2.6. Considering the effects of heatwaves on human beings and the cooling demand, regions with the mean population exposure exceeding 100,000 person-days/year were focused on in the following analysis.
The total changes in population exposure between the two sub-periods and their explanations are displayed in Figure 8 and Figure 9. Figure 10 further shows the relative contribution of climate, population, and AC changes to the changes in the exposure. On average, the total population exposure across the three hotspot regions exhibited a significant increase from 2001–2011 to 2012–2022 (Figure 9), with an increase rate of 60.47%, which was calculated by the difference in exposure between the two sub-periods divided by the exposure in 2001–2011 (see Equation (8)). At regional scale, the changes in population exposure showed significant spatial disparities. In most regions of central and eastern China, the changes in population exposure were positive, indicating an increasing exposure in these regions (Figure 9a). The increases were more significant in the northern and southern parts of the North China Plain, eastern east China, the Sichuan Basin, and southern south China. It was also noted that large cities usually exhibited greater increases in the exposure compared to rural regions (Figure 8e,i). For example, in cities including Chengdu, Chongqing, Wuhan, Hefei, Nanjing, and Shanghai, the increases in the exposure from 2001–2011 to 2012–2022 could reach up to 20 million person-days, equivalent to a 124% rise relative to the 2001–2011 level (Figure 8a). In contrast, some regions of south China exhibited reduced exposure risks, with a mean decrease in 15 million person-days, about 33% below the 2001–2011 level (Figure 8a).
The changes in population exposure were mainly driven by climate change, followed by population and AC changes. Specifically, relative to the period of 2001–2011, climate change alone (population and AC fixed at the 2001–2011 level) drove a 74.43% increase in the population exposure during 2012–2022 (Figure 9b), which accounts for 59.80% of the total changes (see Section 2.5) (Figure 9a). The population change alone (climate and AC fixed at the 2001–2011 level) contributed 17.37% to the total changes in exposure (Figure 9c and Figure 10b). The smaller changes averaged over the CDNH hotspots due to population change may primarily result from the counterbalanced effects between urban population growth and rural population decline (Figure A4c,d). Although AC significantly mitigated the health impacts of heatwaves, its relative contribution to the total exposure changes was comparatively small, with a net negative effect of 10.16% (Figure 10c).
At regional scale, climate change remained the dominant driver of the changes in the exposure over more than 60% of the study area (Figure 11b), though with spatial variations in its relative contribution (Figure 10). The effects of climate change were particularly pronounced in the North China Plain and Sichuan Basin, with a positive contribution exceeding 60% (Figure 9a and Figure 10a). It was also noted that reduced exposure in parts of southern China, such as some rural areas in northeastern Guangxi and southern Jiangxi, was also primarily related to the decreased CDNH days (Figure A4a), with a negative contribution spanning from 40% to 86% (Figure 10g). Compared to urban areas, rural areas generally exhibited larger climate change impacts (Figure 8f,j, Figure 10d,g and Figure 11d,f). Population change was the second dominant driver of the total exposure changes over most regions. It dominated the exposure changes over more than 15% of the study area, especially in southern China (Figure 11a,b). Urban areas like the Pearl River Delta and Yangtze River Delta showed especially larger population-driven contribution (20% to 80%) (Figure 8g, Figure 9d and Figure 10e), which was consistent with observed population growth in these regions. However, in many rural regions of Sichuan and Fujian, the contribution of population change was negative, which may be related to the population migration driven by urbanization (Figure 10e,h and Figure A4c,d). While AC unit contribution was smaller in most grids, it became significant (55–87%) in some large cities, such as Wuhan, Guangzhou, and Shenzhen, and some rural regions of southern China (Figure 10f,i). It was also observed that the changes attributed to AC units and their contributions were relatively larger in some rural areas of southern China, probably due to increased income levels and more AC availability in these regions in recent decades.

4. Discussion

This study quantified the effects of AC adaptation on the population exposure to summer CDNHs during 2001–2022 across urban and rural areas in the Chinese mainland. Results show that regions including the middle and lower reaches of the Yangtze–Huai Rivers, the Sichuan Basin, and the Pearl River Delta exhibited higher population exposure due to both more heatwave days and higher population density. AC adaptation measures have significantly mitigated the population exposure, reducing its increasing trend by 37.87% across the three hotspot regions. The results were consistent with previous studies. For instance, Chen [19] reported higher frequency and longer duration of CDNHs in southwestern China, the middle-lower Yangtze River basin and coastal regions of southern China. However, the observed mitigating effect of AC was lower than the results reported by Han et al. [16], which projected that by the end of the 21st century, AC would reduce the population exposure to individual daytime heatwaves by 62.6–65.8% under medium-to-high emission scenarios. This discrepancy was primarily related to the lower AC penetration rate in the historical period compared to the future periods. Furthermore, differences between the compound and individual heatwave days that were identified by different measures may also contribute to the differences in the quantitative results. Our analysis also revealed that the urban–rural disparities in the contribution of AC adaptation to the heat exposure were significant, with greater AC-mitigating effects in urban areas.
In addition, the relative contribution of changes in AC to the total population exposure changes was further estimated, in comparison to the effects of climate and population changes. Although AC played an effective role in reducing heat-related impacts, the population exposure risk was still increasing, primarily driven by climate warming, with a relative contribution rate of 59.80%. The results were consistent with previous studies on the attribution analysis without considering AC adaptation, but with a smaller contribution from climate change [7,25,26,70]. For example, Wang et al. [70] showed that climate warming played a dominant role in the increased population exposure to CDNHs. The increasing AC could reduce climate-warming-induced increases in the exposure risks to some extent. However, the impacts of AC changes were relatively small over most regions, contributing 10.16% to the decreased exposure risks. At the regional scale, the contribution of AC adaptation was more significant in central and eastern China, which was similar to Han et al. [16] that also projected larger effects of AC adaptation on individual heatwaves over these regions. In fact, the changes in the exposure can also be affected by the interactions of climate, population, and AC dynamics, which are shown in Figure A5 and Figure A6. It can be found that the contribution of interactions between climate and population changes was larger, followed by the interactions of climate and AC changes. Nevertheless, their impacts were smaller than the isolated impact of climate and population. Notably, in some regions such as the Sichuan Basin, where the contribution of AC was negligible (Figure 10c), the interaction of climate and AC changes contributed over 15% to the total changes (Figure A6a), further indicating the dominant role of climate change.
Overall, our analysis underscored AC as a useful measure for reducing population exposure risk to CDNH events, especially in urban areas. However, reliance on AC also raised equity concerns, as disparities in access may exacerbate health inequalities during heatwaves. Higher-income households usually have greater access to AC [36], while lower-income populations endure disproportionate heat exposure [74,75]. This inequity in thermal adaptation capacity leads to markedly elevated health risks among socioeconomically disadvantaged groups, manifesting in increased hospitalization rates [76] and higher mortality risk [77]. This highlights that socioeconomic level serves as a critical influencing factor of climate vulnerability and resilience, mediated primarily through different access to cooling technologies. Policymakers should prioritize strategies such as subsidizing energy costs for disadvantaged groups, promoting energy-efficient AC technologies, and integrating cooling centers into urban heat action plans. In fact, the efficiency of AC is intrinsically linked to a building’s architectural and structural characteristics [78,79,80,81,82,83]. Key factors such as thermal insulation quality [78], window-to-wall ratio [79,80], glazing properties [81], and air-tightness [82] directly determine cooling load demands. Buildings with poor insulation or excessive solar-heat gain through glazing require significantly higher cooling energy consumption, often rendering even high-efficiency AC systems ineffective [78,83]. Conversely, passive design strategies—including thermal mass utilization, reflective surfaces, and strategic shading—can significantly reduce AC loads by more than 70% [84]. This interdependence underscores the effectiveness of optimizing building envelopes to reduce energy consumption and achieve sustainable thermal comfort [85], especially in low-income groups and regions with insufficient energy supply. However, increasing AC could not offset the warming-induced substantial increases in heat-related exposure risk. Therefore, more effective mitigation and adaptation strategies [86,87], including optimizing building orientation [88,89], reducing the use of heat-absorbing materials like asphalt and concrete while expanding urban green spaces [90,91,92], strengthening healthcare infrastructure [93], and establishing robust heat monitoring systems [94,95], are needed to reduce the adverse effect of climate warming.
Despite these efforts, this study has several limitations that need attention. Firstly, the population exposure only considered the differences in the population and economic levels between urban and rural areas, without considering the urban–rural differences in the characteristics of heatwaves. Previous studies have shown that urban areas usually experience more heatwave events, leading to additional population exposure [7,71,93,96]. Therefore, this study may underestimate the population exposure to CDNHs and the contribution of AC adaptation in urban areas. More high-resolution temperature datasets are recommended to quantify the heat-island effect and the different characteristics of heatwaves between urban and rural areas. Secondly, this study assumed that the AC could provide a complete elimination of local heat-related risks without considering its actual usage rates across different income groups [36,97] and power outages during peak periods in hot weather, which may lead to an overestimation of its roles particularly in low-income groups. In addition, given the limitation of AC data, the parameters for calculating the AC availability at grid-scale were kept the same within each province. To enhance the accuracy for assessing AC’s impacts, future studies should incorporate more county-level AC data.

5. Conclusions

Previous studies have shown that AC was an effective adaptation measure to reduce heat-related impacts. However, its contribution to the exposure to CDNHs, which has more severe impacts on human health, remains unknown. This study investigated the spatial-temporal characteristics of population exposure to CDNHs and quantified the avoided impacts through AC adaptation across urban and rural areas in China. Here, CDNHs were identified by an enhanced EHF method, which could consider local human acclimatization to heat. Additionally, the relative contributions of AC changes to the total exposure changes were also compared to the impacts of climate and population changes. Results show that in the summer, the middle and lower reaches of the Yangtze–Huaihe River, the Sichuan basin, and southern China experienced a significantly higher frequency of CDNHs, with mean durations of 8.71, 9.24, and 5.96 days/year, respectively. The duration of CDNHs has increased significantly in the three regions, particularly across southern China. Higher exposure risks were also observed in eastern and southern China, resulting from both higher frequencies of compound heatwaves and population density. Although AC adaptation did not modify the spatial patterns of exposure risks, it reduced the magnitude and growth rate of the exposure by 6.39% and 37.87%, respectively. The reductions in urban areas, particularly in the Yangtze and Pearl River Delta, were significantly larger than those in rural areas. Despite AC unit effectiveness in reducing heat-related impacts, climate warming remained the dominant driver of increased population exposure, contributing 59.8% to the increases. Population change was the secondary contributing factor in most regions, while AC played a relatively minor role (10.16%) in reducing the climate-warming-induced increases in exposure risk. The framework developed in this study can extend globally, with its AC mitigation quantification and exposure attribution methods offering universal value for climate adaptation research.

Author Contributions

Methodology, Y.W.; data curation, Y.W.; formal analysis, Y.W.; writing—original draft, Y.W.; writing—review and editing, F.M.; project administration, F.M. All authors have read and agreed to the published version of the manuscript.

Funding

This research was funded by the National Natural Science Foundation of China (Project no. 42471034), the Qing Lan Project.

Institutional Review Board Statement

Not applicable.

Informed Consent Statement

Not applicable.

Data Availability Statement

The daily temperature data can be obtained from the China Meteorological Administration (https://data.cma.cn/en, accessed on 18 April 2024). The LandScan high-resolution population data is accessible at https://landscan.ornl.gov/ (accessed on 2 October 2024). The GAIA land use/cover data is available through the iEarth Data Sharing Platform (https://data-starcloud.pcl.ac.cn/iearthdata/, accessed on 30 July 2024). The gridded GDP per capita data can be downloaded from Zenodo (https://zenodo.org/records/13943886, accessed on 24 October 2024). Additional province-level socioeconomic data (GDP per capita, disposable income per capita, number of AC units etc.) were acquired from the China Statistical Yearbook database (https://data.stats.gov.cn/english/publish.htm?sort=1, accessed on 9 September 2024).

Conflicts of Interest

The authors declare no conflicts of interest.

Abbreviations

The following abbreviations are used in this manuscript:
CDNHCompound day- and night-time heatwaves
ACAir conditioning
GAIAGlobal Artificial Impervious Areas
GDPGross domestic product
USDUnited States Dollar
CNYChinese Yuan
CPIConsumer Price Index
PPPPurchasing Power Parity
EHFExcess Heat Factor
MEMitigating effect

Appendix A

Figure A1. Scatter plot with fitted curve illustrating the relationships between GDP per capita and air conditioning (AC) availability in (a) Beijing, (b) Shanghai, (c) Guangdong, (d) Guizhou, (e) Chongqing, and (f) Henan. a and b are the parameters for fitting AC availability (see Equation (5) in the main text). R2 denotes the coefficient of determination for the fitted curve.
Atmosphere 16 00912 g0a1
Figure A2. The air conditioning availability averaged over 2001–2022 (a) at each 0.25-degree grid, and (b) urban and (c) rural areas in each 0.25-degree grid.
Atmosphere 16 00912 g0a2
Figure A3. Spatial distribution of the climate maximum saturation averaged over 2001–2022.
Atmosphere 16 00912 g0a3
Figure A4. Changes in heatwaves, population, and air conditioning between 2012–2022 and 2001–2011. Spatial distributions of the changes in (a) compound heatwave (CDNH) days, (bd) population, and (eg) air conditioning penetration. (a,b,e) Total area, (c,f) urban area, and (d,g) rural area.
Atmosphere 16 00912 g0a4
Figure A5. Changes in the population exposure to compound heatwaves (CDNH) driven by synergetic effects of different factors between 2012–2022 and 2001–2011. Changes in the exposure driven by (a,d,g) the synergetic effects of climate and population changes (i.e., fixing air conditioning (AC) at the 2001–2011 level but allowing climate and population changes during 2012–2022), (b,e,h) the synergetic effects of climate and AC changes (i.e., fixing population at the 2001–2011 level but allowing climate and AC changes), and (c,f,i) the synergetic effects of population and AC changes (i.e., fixing climate at the 2001–2011 level but allowing population and AC changes). (ac) Total areas, (df) urban areas, and (gi) rural areas. Regions with population exposure exceeding 100,000 person-days/year were considered.
Atmosphere 16 00912 g0a5
Figure A6. Relative contributions (%) of synergetic effects of different factors to the changes in population exposure to compound heatwaves (CDNH). Spatial distributions of the relative contribution of the synergetic effects of (a,d,g) climate and population changes, (b,e,h) climate and air conditioning (AC) changes, and (c,f,i) population and AC changes to the total changes in the exposure. (ac) Total areas, (df) urban areas, and (gi) rural areas. Regions with population exposure exceeding 100,000 person-days/year were considered.
Atmosphere 16 00912 g0a6

References

  1. Chen, J.; Liu, Y.; Pan, T.; Liu, Y.; Sun, F.; Ge, Q. Population Exposure to Droughts in China under the 1.5 °C Global Warming Target. Earth Syst. Dyn. 2018, 9, 1097–1106. [Google Scholar] [CrossRef]
  2. IPCC. Summary for Policymakers. In Climate Change 2021: The Physical Science Basis. Contribution of Working Group I to the Sixth Assessment Report of the Intergovernmental Panel on Climate Change; IPCC: Geneva, Switzerland; Cambridge University Press: Cambridge, UK; New York, NY, USA, 2021; pp. 3–32. [Google Scholar]
  3. World Meteorological Organization (WMO); World Health Organization (WHO). Heatwaves and Health: Guidance on Warning-System Development; WMO & WHO: Geneva, Switzerland, 2015. [Google Scholar]
  4. Sun, Q.; Miao, C.; AghaKouchak, A.; Duan, Q. Unraveling Anthropogenic Influence on the Changing Risk of Heatwaves in China. Geophys. Res. Lett. 2017, 44, 5078–5085. [Google Scholar] [CrossRef]
  5. Xia, J.; Chen, J.; She, D. Impacts and countermeasures of extreme drought in the Yangtze River Basin in 2022. J. Hydraul. Eng. 2022, 53, 1143–1153. [Google Scholar] [CrossRef]
  6. Arbuthnott, K.; Hajat, S.; Heaviside, C.; Vardoulakis, S. Changes in population susceptibility to heat and cold over time: Assessing adaptation to climate change. Environ. Health 2016, 15, S33. [Google Scholar] [CrossRef] [PubMed]
  7. Jones, B.; Tebaldi, C.; O’Neill, B.C.; Oleson, K.; Gao, J. Avoiding population exposure to heat-related extremes: Demographic change vs climate change. Clim. Change 2018, 146, 423–437. [Google Scholar] [CrossRef]
  8. Chambers, J. Global and cross-country analysis of exposure of vulnerable populations to heatwaves from 1980 to 2018. Clim. Change 2020, 163, 539–558. [Google Scholar] [CrossRef]
  9. Zhou, Y.; Gu, S.; Yang, H.; Li, Y.; Zhao, Y.; Li, Y.; Yang, Q. Spatiotemporal variation in heatwaves and elderly population exposure across China. Sci. Total Environ. 2024, 917, 170245. [Google Scholar] [CrossRef]
  10. Cai, W.; Zhang, C.; Zhang, S.; Ai, S.; Bai, Y.; Bao, J.; Chen, B.; Chang, N.; Chen, H.; Cheng, L.; et al. The 2021 China report of the Lancet Countdown on health and climate change: Seizing the window of opportunity. Lancet Public Health 2021, 6, 932–947. [Google Scholar] [CrossRef]
  11. Zhang, S.; Zhang, C.; Cai, W.; Bai, Y.; Callaghan, M.; Chang, N. The 2023 China report of the Lancet Countdown on health and climate change: Taking stock for a thriving future. Lancet Public Health 2023, 8, 978–995. [Google Scholar] [CrossRef]
  12. Barreca, A.; Clay, K.; Deschenes, O.; Greenstone, M.; Shapiro, J.S. Adapting to climate change: The remarkable decline in the US temperature-mortality relationship over the twentieth century. J. Polit. Econ. 2016, 124, 105–159. [Google Scholar] [CrossRef]
  13. Biardeau, L.T.; Davis, L.W.; Gertler, P.; Wolfram, C. Heat exposure and global air conditioning. Nat. Sustain. 2020, 3, 25–28. [Google Scholar] [CrossRef]
  14. Bobb, J.F.; Peng, R.D.; Bell, M.L.; Dominici, F. Heat-related mortality and adaptation to heat in the United States. Environ. Health Perspect. 2014, 122, 811–816. [Google Scholar] [CrossRef]
  15. Walkowiak, M.P.; Bandurski, K.; Walkowiak, J.; Walkowiak, D. Outpacing climate change: Adaptation to heatwaves in Europe. Int. J. Biometeorol. 2025, 69, 989–1002. [Google Scholar] [CrossRef] [PubMed]
  16. Han, Q.; Chao, Q.; Sun, S.; Shi, P. Role of adaptation measures in addressing heatwave exposure in China. Adv. Clim. Change Res. 2024, 15, 148–157. [Google Scholar] [CrossRef]
  17. Ma, F.; Yuan, X.; Wu, P.; Zeng, Z. A moderate mitigation can significantly delay the emergence of compound hot extremes. J. Geophys. Res. Atmos. 2022, 127, e2021JD035427. [Google Scholar] [CrossRef]
  18. Gao, S.; Chen, Y.; Li, K.; He, B.; Cui, Y.; Peng, H. Changes in day–night dominance of combined day and night heatwave events in China during 1979–2018. Environ. Res. Lett. 2022, 17, 114058. [Google Scholar] [CrossRef]
  19. Chen, X. Significant Increases in Wet Nighttime and Daytime–Nighttime Compound Heat Waves in China from 1961 to 2020. Atmosphere 2023, 14, 178. [Google Scholar] [CrossRef]
  20. Li, Z.; Hu, J.; Meng, R.; He, G.; Xu, X.; Liu, T.; Zeng, W.; Li, X.; Xiao, J.; Huang, C.; et al. The association of compound hot extreme with mortality risk and vulnerability assessment at fine-spatial scale. Environ. Res. 2021, 198, 111213. [Google Scholar] [CrossRef]
  21. Yang, J.; Zhou, M.; Guo, C.; Zhu, S.; Sakhvidi, M.J.Z.; Requia, W.J.; Sun, Q.; Tong, S.; Li, M.; Liu, Q. Drivers of associations between daytime-nighttime compound temperature extremes and mortality in China. Commun. Med. 2024, 4, 125. [Google Scholar] [CrossRef]
  22. Liu, J.; Kim, H.; Hashizume, M.; Lee, W.; Honda, Y.; Kim, S.E.; He, C.; Kan, H.; Chen, R. Nonlinear exposure-response associations of daytime, nighttime, and day-night compound heatwaves with mortality amid climate change. Nat. Commun. 2025, 16, 635. [Google Scholar] [CrossRef]
  23. Wang, J.; Feng, J.; Yan, Z.; Chen, Y. Future risks of unprecedented compound heatwaves over three vast urban agglomerations in China. Earths Future 2020, 8, e2020EF001716. [Google Scholar] [CrossRef]
  24. Liu, J.; Qi, J.; Yin, P.; Liu, W.; He, C.; Gao, Y.; Zhou, L.; Zhu, Y.; Kan, H.; Chen, R.; et al. Rising cause-specific mortality risk and burden of compound heatwaves amid climate change. Nat. Clim. Change 2024, 14, 1201–1209. [Google Scholar] [CrossRef]
  25. Wang, L.; Rohli, R.V.; Lin, Q.; Jin, S.; Yan, X. Impact of Extreme Heatwaves on Population Exposure in China Due to Additional Warming. Sustainability 2022, 14, 11458. [Google Scholar] [CrossRef]
  26. Liu, Z.; Anderson, B.; Yan, K.; Dong, W.; Liao, H.; Shi, P. Global and regional changes in exposure to extreme heat and the relative contributions of climate and population change. Sci. Rep. 2017, 7, 43909. [Google Scholar] [CrossRef]
  27. Ma, F.; Yuan, X. Impact of climate and population changes on the increasing exposure to summertime compound hot extremes. Sci. Total Environ. 2021, 772, 145004. [Google Scholar] [CrossRef]
  28. Wei, C.; Wan, Y.; Huang, G.; Zhou, L.; Chang, Y. Spatial and Temporal Characteristics and Population Exposure of Heat Waves in China’s Coastal Regions. Remote Sens. Technol. Appl. 2024, 39, 679–689. (In Chinese). Available online: http://www.rsta.ac.cn/EN/10.11873/j.issn.1004-0323.2024.3.0679 (accessed on 15 November 2024).
  29. Moazzam, M.F.U.; Lee, B.G.; Kim, S. Impact of Sea Surface Temperature on City Temperature near Warm and Cold Ocean Currents in Summer Season for Northern Hemisphere. Atmosphere 2025, 16, 54. [Google Scholar] [CrossRef]
  30. Zhang, M.; Yiğit, İ.; Adigüzel, F.; Hu, C.; Chen, E.; Siyavuş, A.E.; Elmastaş, N.; Ustuner, M.; Kaya, A.Y. Impact of Urban Surfaces on Microclimatic Conditions and Thermal Comfort in Burdur, Türkiye. Atmosphere 2024, 15, 1375. [Google Scholar] [CrossRef]
  31. Xue, X.; He, T.; Xu, L.; Tong, C.; Ye, Y.; Liu, H.; Xu, D.; Zheng, X. Quantifying the spatial pattern of urban heat islands and the associated cooling effect of blue–green landscapes using multisource remote sensing data. Sci. Total Environ. 2022, 843, 156829. [Google Scholar] [CrossRef]
  32. Liu, D.; Zhou, R.; Ma, Q.; He, T.; Fang, X.; Xiao, L.; Hu, Y.; Li, J.; Shao, L.; Gao, J. Spatio-temporal patterns and population exposure risks of urban heat island in megacity Shanghai, China. Sustain. Cities Soc. 2024, 108, 105500. [Google Scholar] [CrossRef]
  33. Ge, M.; Xiong, Z.; Li, Y.; Li, L.; Xie, F.; Gong, Y.; Sun, Y. Research on Thermal Environment Influencing Mechanism and Cooling Model Based on Local Climate Zones: A Case Study of the Changsha–Zhuzhou–Xiangtan Urban Agglomeration. Remote Sens. 2025, 17, 2391. [Google Scholar] [CrossRef]
  34. Bavarsad, F.S.; Mohajerani, M.; Tywoniak, J.; Jiao, Z.; Yuan, J. Future Climate Impacts on Urban Office Buildings: Energy, Comfort, and Passive Solutions in Osaka, Japan. J. Therm. Biol. 2025, 131, 104212. [Google Scholar] [CrossRef]
  35. Chen, M.; Ban-Weiss, G.A.; Sanders, K.T. Utilizing smart-meter data to project impacts of urban warming on residential electricity use for vulnerable populations in Southern California. Environ. Res. Lett. 2020, 15, 064001. [Google Scholar] [CrossRef]
  36. Davis, L.; Gertler, P.; Jarvis, S.; Wolfram, C. Air conditioning and global inequality. Glob. Environ. Change 2021, 69, 102299. [Google Scholar] [CrossRef]
  37. Su, X.; Wang, F.; Zhou, D.; Zhang, H. Heat Health Risk and Adaptability Assessments at the Subdistrict Scale in Metropolitan Beijing. Int. J. Disaster Risk Sci. 2022, 13, 987–1003. [Google Scholar] [CrossRef]
  38. Romitti, Y.; Sue Wing, I.; Spangler, K.R.; Wellenius, G.A. Inequality in the availability of residential air conditioning across 115 US metropolitan areas. PNAS Nexus 2022, 1, pgac210. [Google Scholar] [CrossRef]
  39. Shi, H.; Wang, B.; Qiu, Y.L.; Deng, N.; Xie, B.C.; Zhang, B.; Ma, S.J. The unequal impacts of extremely high temperatures on households’ adaptive behaviors: Empirical evidence from fine-grained electricity consumption data. Energy Policy 2024, 190, 114170. [Google Scholar] [CrossRef]
  40. Falchetta, G.; Cian, E.D.; Pavanello, F.; Wing, I.S. Inequalities in global residential cooling energy use to 2050. Nat. Commun. 2024, 15, 7874. [Google Scholar] [CrossRef] [PubMed]
  41. Wu, J.; Gao, X. A gridded daily observation dataset over China region and comparison with the other datasets. Chin. J. Geophys. 2013, 56, 1102–1111. (In Chinese) [Google Scholar] [CrossRef]
  42. Yang, Y.; Tang, J.; Xiong, Z.; Dong, X. Evaluation of high-resolution gridded precipitation data in arid and semiarid regions: Heihe River Basin, Northwest China. J. Hydrometeorol. 2017, 18, 3075–3101. [Google Scholar] [CrossRef]
  43. Gong, P.; Li, X.; Wang, J.; Bai, Y.; Chen, B.; Hu, T.; Liu, X.; Xu, B.; Yang, J.; Zhang, W.; et al. Annual maps of global artificial impervious area (GAIA) between 1985 and 2018. Remote Sens. Environ. 2020, 236, 111510. [Google Scholar] [CrossRef]
  44. Bhaduri, B.; Bright, E.; Coleman, P.; Urban, M.L. LandScan USA: A high-resolution geospatial and temporal modeling approach for population distribution and dynamics. GeoJournal 2007, 69, 103–117. [Google Scholar] [CrossRef]
  45. Sims, K.; Reith, A.; Bright, E.; Kaufman, J.; Pyle, J.; Epting, J.; Gonzales, J.; Adams, D.; Powell, E.; Urban, M.; et al. LandScan Global 2022 [Data Set]; Oak Ridge National Laboratory: Oak Ridge, TN, USA, 2023. [Google Scholar] [CrossRef]
  46. China Statistical Yearbook 2022 [Data Set]. National Bureau of Statistics of China. 2022. Available online: https://www.stats.gov.cn/sj/ndsj/2022/indexeh.htm (accessed on 9 September 2024).
  47. Kummu, M.; Kosonen, M.; Sayyar, S.M. Downscaled gridded global dataset for gross domestic product (GDP) per capita PPP over 1990–2022. Sci. Data 2024, 12, 178. [Google Scholar] [CrossRef] [PubMed]
  48. World Bank. World Development Indicators [Data Set]. World Bank. 2023. Available online: https://databank.worldbank.org/source/world-development-indicators (accessed on 6 October 2024).
  49. Pan, X.; Wang, W.; Shao, Q.; Wei, J.; Li, H.; Zhang, F.; Cao, M.; Yang, L. Compound drought and heat waves variation and association with SST modes across China. Sci. Total Environ. 2024, 907, 167934. [Google Scholar] [CrossRef]
  50. Guo, E.; Wang, Y.; Bao, Y. Assessing spatiotemporal variation of heat waves during 1961–2016 across mainland China. Int. J. Climatol. 2020, 40, 3036–3051. [Google Scholar] [CrossRef]
  51. Nairn, J.; Ostendorf, B.; Bi, P. Performance of excess heat factor severity as a global heatwave health impact index. Int. J. Environ. Res. Public Health 2018, 15, 2494. [Google Scholar] [CrossRef]
  52. Mason, H.; King, J.C.; Peden, A.E.; Franklin, R.C. Systematic review of the impact of heatwaves on health service demand in Australia. BMC Health Serv. Res. 2022, 22, 960. [Google Scholar] [CrossRef]
  53. Langlois, N.; Herbst, J.; Mason, K.; Nairn, J.; Byard, R.W. Using the Excess Heat Factor (EHF) to predict the risk of heat related deaths. J. Forensic Legal Med. 2013, 20, 408–411. [Google Scholar] [CrossRef]
  54. Hatvani-Kovacs, G.; Belusko, M.; Pockett, J.; Boland, J. Can the Excess Heat Factor Indicate Heatwave-Related Morbidity? A Case Study in Adelaide, South Australia. EcoHealth 2016, 13, 100–110. [Google Scholar] [CrossRef] [PubMed]
  55. Çulpan, H.C.; Şahin, Ü.; Can, G. A Step to Develop Heat-Health Action Plan: Assessing Heat Waves’ Impacts on Mortality. Atmosphere 2022, 13, 2126. [Google Scholar] [CrossRef]
  56. Culpan, H.C.; Dogan, T.R.; Can, G. Effects of heat waves determined by different definitions on mortality rate in Southeast Türkiye, 2010–2019. Int. J. Glob. Warm. 2024, 32, 213–225. [Google Scholar] [CrossRef]
  57. Nairn, J.; Fawcett, R.; Ray, D. Defining and Predicting Excessive Heat Events: A National System; CAWCR Technical Report No. 017; Centre for Australian Weather and Climate Research: Melbourne, Australia, 2009. Available online: https://www.cawcr.gov.au/technical-reports/CTR_017.pdf (accessed on 15 March 2024).
  58. Nairn, J.R.; Fawcett, R.J.B. The Excess Heat Factor: A Metric for Heatwave Intensity and Its Use in Classifying Heatwave Severity. Int. J. Environ. Res. Public Health 2015, 12, 227–253. [Google Scholar] [CrossRef]
  59. Oliveira, A.; Lopes, A.; Soares, A. Excess heat factor climatology, trends, and exposure across European functional urban areas. Weather. Clim. Extrem. 2022, 36, 100455. [Google Scholar] [CrossRef]
  60. Zhou, J.; Teuling, A.J.; Seneviratne, S.I.; Hirsch, A.L. Soil moisture-temperature coupling increases population exposure to future heatwaves. Earths Future 2024, 12, e2024EF004697. [Google Scholar] [CrossRef]
  61. Nitschke, M.; Tucker, G.R.; Hansen, A.L.; Williams, S.; Zhang, Y.; Bi, P. Impact of two recent extreme heat episodes on morbidity and mortality in Adelaide, South Australia: A case-series analysis. Environ. Health 2011, 10, 42. [Google Scholar] [CrossRef]
  62. Intergovernmental Panel on Climate Change (IPCC). Weather and Climate Extreme Events in a Changing Climate. In Climate Change 2021—The Physical Science Basis: Working Group I Contribution to the Sixth Assessment Report of the Intergovernmental Panel on Climate Change; University of Cambridge: Cambridge, UK, 2023; pp. 1513–1766. [Google Scholar] [CrossRef]
  63. Vanos, J.; Guzman-Echavarria, G.; Baldwin, J.W.; Bongers, C.; Ebi, K.L.; Jay, O. A physiological approach for assessing human survivability and liveability to heat in a changing climate. Nat. Commun. 2023, 14, 7653. [Google Scholar] [CrossRef] [PubMed]
  64. McNeil, M.A.; Letschert, V.E. Future air conditioning energy consumption in developing countries and what can be done about it: The potential of efficiency in the residential sector. Proc. Eur. Counc. Energy Coeff. Econ. 2007, 6, 1311–1322. [Google Scholar]
  65. Isaac, M.; van Vuuren, D.P. Modeling global residential sector energy demand for heating and air conditioning in the context of climate change. Energy Policy 2009, 37, 507–521. [Google Scholar] [CrossRef]
  66. Wang, X.; Purohit, P.; Höglund-Isaksson, L.; Zhang, S.; Fang, H. Co-benefits of Energy-Efficient Air Conditioners in the Residential Building Sector of China. Environ. Sci. Technol. 2020, 54, 13217–13227. [Google Scholar] [CrossRef]
  67. You, Q.; Fraedrich, K.; Sielmann, F.; Min, J.; Kang, S.; Ji, Z.; Zhu, X.; Ren, G. Present and projected degree days in China from observation, reanalysis and simulations. Clim. Dyn. 2014, 43, 1449–1462. [Google Scholar] [CrossRef]
  68. Zhang, N.; Zhou, Y. Climate-driven changes in CO2 emissions associated with residential heating and cooling demand by end-century in China. Environ. Res. Lett. 2019, 14, 084043. [Google Scholar] [CrossRef]
  69. Turner, B.L.; Kasperson, R.E.; Matson, P.A.; Schiller, A. A framework for vulnerability analysis in sustainability science. Proc. Natl. Acad. Sci. USA 2003, 100, 8074–8079. [Google Scholar] [CrossRef] [PubMed]
  70. Wang, Y.; Zhao, N.; Yin, X.; Wu, C.; Chen, M.; Jiao, Y.; Yue, T. Global future population exposure to heatwaves. Environ. Int. 2023, 178, 108049. [Google Scholar] [CrossRef]
  71. Shi, Z.; Jia, G. Changes in urban heat island intensity during heatwaves in China. Environ. Res. Lett. 2024, 19, 074061. [Google Scholar] [CrossRef]
  72. Ma, F.; Yuan, X. When will the unprecedented 2022 summer heat waves in Yangtze River basin become normal in a warming climate? Geophys. Res. Lett. 2023, 50, e2022GL101946. [Google Scholar] [CrossRef]
  73. Sun, Z.; Zhang, Q.; Sun, R.; Deng, B. Characteristics of the extreme high temperature and drought and their main impacts in southwestern China of 2022. J. Arid Meteorol. 2022, 40, 764–770. (In Chinese) [Google Scholar] [CrossRef]
  74. Osberghaus, D.; Abeling, T. Heat Vulnerability and Adaptation of Low-Income Households in Germany. Glob. Environ. Change 2022, 72, 102446. [Google Scholar] [CrossRef]
  75. Grislain-Letrémy, C.; Sixou, J.; Sotura, A. Urban Heat Islands and Income Inequalities: Evidence from French Cities. Ecol. Econ. 2025, 235, 108624. [Google Scholar] [CrossRef]
  76. Liao, S.; Pan, W.; Wen, L.; Chen, R.; Pan, D.; Wang, R.; Hu, C.; Duan, H.; Weng, H.; Tian, C.; et al. Temperature-Related Hospitalization Burden under Climate Change. Nature, 2025; online ahead of print. [Google Scholar] [CrossRef]
  77. Yu, X.; Lei, X.; Wang, M. Temperature Effects on Mortality and Household Adaptation: Evidence from China. J. Environ. Econ. Manag. 2019, 96, 195–212. [Google Scholar] [CrossRef]
  78. Mohamed, M.; Almarshadi, M. Energy Saving in Air Conditioning of Buildings. MATEC Web Conf. 2018, 162, 05024. [Google Scholar] [CrossRef]
  79. Al-Yasiri, Q.; Alktranee, M.; Szabó, M.; Arıcı, M. Building envelope-enhanced phase change material and night ventilation: Effect of window orientation and window-to-wall ratio on indoor temperature. Renew. Energy 2023, 218, 119263. [Google Scholar] [CrossRef]
  80. Xie, X.; Xu, B.; Fei, Y.; Chen, X.-N.; Pei, G.; Ji, J. Passive energy-saving design strategy and realization on high window-wall ratio buildings in subtropical regions. Renew. Energy 2024, 229, 120709. [Google Scholar] [CrossRef]
  81. Kadi, Y.; Korichi, A.; Maalouf, C. Improving Building Energy Efficiency and Thermal Comfort with Natural Fibre Insulation. Proc. Inst. Civ. Eng. Eng. Sustain. 2024, 177, 230–241. [Google Scholar] [CrossRef]
  82. Houssainy, S.; Taylor, L.; Torcellini, P.; Ramaraj, S. Decarbonizing Building Thermal Systems: A How-to Guide for Heat Pump Systems and Beyond; Technical Report No. BK-5500-87812; National Renewable Energy Laboratory: Golden, CO, USA, 2024. Available online: https://www.nrel.gov/docs/fy24osti/87812.pdf (accessed on 22 July 2025).
  83. Liu, M.; Sun, J.; Jiang, X. A Simulation-Based Sensitivity Analysis for Thermally Activated Building Systems. In Proceedings of the 2024 11th International Conference on Geological and Civil Engineering (ICGCE 2024), Matsue, Japan, 15–17 March 2024; Huang, G., Ed.; Springer Series in Geomechanics and Geoengineering. Springer: Cham, Switzerland, 2024. Chapter 4. pp. 44–53. [Google Scholar] [CrossRef]
  84. Rempel, A.R.; Danis, J.; Rempel, A.W.; Fowler, M.; Mishra, S. Improving the Passive Survivability of Residential Buildings during Extreme Heat Events in the Pacific Northwest. Appl. Energy 2022, 321, 119323. [Google Scholar] [CrossRef]
  85. Yu, Y.; Xiang, T.; Wang, D.; Yang, L. Optimization control strategy for mixed-mode buildings based on thermal comfort model: A case study of office buildings. Appl. Energy 2024, 358, 122627. [Google Scholar] [CrossRef]
  86. Adnan, M.S.G.; Dewan, A.; Botje, D.; Shahid, S.; Hassan, Q.K. Vulnerability of Australia to heatwaves: A systematic review on influencing factors, impacts, and mitigation options. Environ. Res. 2022, 213, 113703. [Google Scholar] [CrossRef] [PubMed]
  87. Ahmed, I.; van Esch, M.; van der Hoeven, F. Heatwave vulnerability across different spatial scales: Insights from the Dutch built environment. Urban Clim. 2023, 51, 101614. [Google Scholar] [CrossRef]
  88. Abdollahzadeh, N.; Biloria, N. Outdoor thermal comfort: Analyzing the impact of urban configurations on the thermal performance of street canyons in the humid subtropical climate of Sydney. Front. Archit. Res. 2021, 10, 394–409. [Google Scholar] [CrossRef]
  89. Ma, H.; Zhou, X. Analysis of forced convective heat transfer at the facades of street canyon: Effect of wind direction and tree planting. Energy Build. 2025, 344, 115918. [Google Scholar] [CrossRef]
  90. Bartesaghi-Koc, C.; Haddad, S.; Pignatta, G. Can urban heat be mitigated in a single urban street? Monitoring, strategies, and performance results from a real scale redevelopment project. Sol. Energy 2021, 216, 564–588. [Google Scholar] [CrossRef]
  91. Sadeghi, M.; Chaston, T.; Hanigan, I.; de Dear, R.; Santamouris, M.; Jalaludin, B.; Morgan, G.G. The health benefits of greening strategies to cool urban environments—A heat health impact method. Build. Environ. 2022, 207, 108546. [Google Scholar] [CrossRef]
  92. Chaston, T.B.; Broome, R.A.; Cooper, N. Mortality Burden of Heatwaves in Sydney, Australia Is Exacerbated by the Urban Heat Island and Climate Change: Can Tree Cover Help Mitigate the Health Impacts? Atmosphere 2022, 13, 714. [Google Scholar] [CrossRef]
  93. Zhang, P.; Ren, G.; Qin, Y.; Zhai, Y.; Zhai, T.; Tysa, S.K.; Xue, X.; Yang, G.; Sun, X. Urbanization Effects on Estimates of Global Trends in Mean and Extreme Air Temperature. J. Clim. 2021, 34, 1923–1945. [Google Scholar] [CrossRef]
  94. Toloo, G.; FitzGerald, G.; Aitken, P.; Verrall, K.; Tong, S. Evaluating the effectiveness of heat warning systems: Systematic review of epidemiological evidence. Int. J. Public Health 2013, 58, 667–681. [Google Scholar] [CrossRef] [PubMed]
  95. Gan, C.C.R.; Oktari, R.S.; Nguyen, H.X.; Yuan, L.; Yu, X.; KC, A.; Hanh, T.T.T.; Phung, D.T.; Dwirahmadi, F.; Liu, T.; et al. A scoping review of climate-related disasters in China, Indonesia and Vietnam: Disasters, health impacts, vulnerable populations and adaptation measures. Int. J. Disaster Risk Reduct. 2021, 66, 102608. [Google Scholar] [CrossRef]
  96. Igun, E.; Xu, X.; Shi, Z.; Jia, G. Enhanced nighttime heatwaves over African urban clusters. Environ. Res. Lett. 2023, 18, 014001. [Google Scholar] [CrossRef]
  97. Randazzo, T.; Cian, E.D.; Mistry, M.N. Air conditioning and electricity expenditure: The role of climate in temperate countries. Econ. Model. 2020, 90, 273–287. [Google Scholar] [CrossRef]
Figure 1. Flowchart of this study. Here, AC denotes the air conditioning, Tx, Tn, and Tm represent maximum, minimum, and average air temperatures, respectively.
Atmosphere 16 00912 g001
Figure 2. Air conditioning (AC) availability parameters across different provinces in China. (a,c,e) parameter a and (b,d,f) parameter b for (a,b) each province, and (c,d) urban and (e,f) rural areas in each province. The parameters a and b were determined by local GDP per capita (G) and number of AC units (A) according to A = 1/(1 + e(a + b×G/1000)).
Atmosphere 16 00912 g002
Figure 3. Spatial patterns of simulated air conditioning (AC) penetration and observed number of AC units in China. (a) Mean AC penetration for each province, and AC penetration for (b) urban and (c) rural areas in each province. (d) The number of AC units per 100 households. Note that the blank areas denote regions with zero population or GDP.
Atmosphere 16 00912 g003
Figure 4. Spatial patterns and temporal trends of compound heatwave (CDNH) days. (a) Spatial distribution of the summertime CDNH days (days/year) averaged over 2001–2022. (b) Temporal evolution and trend of the CDNH days averaged across the three heatwave hotspots (boxed regions in panel (a) from 2001 to 2022. Solid and dotted lines in (b) denote the CDNH days and their trends; the numbers are the slopes of the trend lines (days/year), respectively.
Atmosphere 16 00912 g004
Figure 5. Spatial patterns and temporal evolution of compound heatwave (CDNH) exposure risk without considering air conditioning (AC) adaptation. (a) The total population exposure to CDNHs (person-days/year) averaged over 2001–2022 at each 0.25-degree grid, and its decompositions in (c) urban and (e) rural areas; (b) The temporal trends of the total exposure averaged across the three CDNH hotspots (boxed in Figure 4a) from 2001 to 2022, and its decompositions in (d) urban and (f) rural areas. In (b,d,f), the solid and dotted lines denote the exposures and their trends, the numbers are the slopes of the trend lines (person-days/year), and * denotes that the trend is significant at the 95% confidence level based on the non-parametric Mann–Kendall test.
Atmosphere 16 00912 g005
Figure 6. Spatial patterns and temporal evolution of compound heatwave (CDNH) exposure risk considering air conditioning (AC) adaptation. (a) The total population exposure to CDNHs (person-days/year) averaged over 2001–2022 at each 0.25–degree grid, and its decompositions in (c) urban and (e) rural areas. The bar charts in (a,c,e) denote the mean population exposure across the three heatwave hotspots (boxed in Figure 4a), with orange and blue bars indicating the exposure without and with AC adaptation, respectively. (b) The temporal trends of the total exposure averaged across the three CDNH hotspots (boxed in Figure 4a) from 2001 to 2022, and its decompositions in (d) urban and (f) rural areas. In (b,d,f), the solid and dotted lines denote the exposures and their trends, the numbers are the slopes of the trend lines (person-days/year).
Atmosphere 16 00912 g006
Figure 7. Reduced rates (%) of population exposure to compound heatwaves (CDNH) by air conditioning (AC) adaptation relative to the scenario without AC (i.e., AC’s mitigating effect, ME) averaged over 2001–2022. (a,c,e) The spatial distribution of the reduced rates, and (b,d,f) percentage of grids with different levels of the ME in the three CDNH hotspots (boxed in Figure 4a). (a,b) Total areas, (c,d) urban areas, and (e,f) rural areas. Regions with population exposure exceeding 100,000 person-days/year were considered.
Atmosphere 16 00912 g007
Figure 8. Changes in the population exposure to compound heatwaves (CDNH) driven by different factors between 2012–2022 and 2001–2011. (a,e,i) Total changes in the exposure, and their decompositions that were driven by (b,f,j) climate change (i.e., fixing air conditioning and population at the 2001–2011 level but allowing climate changes during 2012–2022), (c,g,k) population change (i.e., fixing climate and air conditioning at the 2001–2011 level but allowing population changes), and (d,h,l) air conditioning (AC) change (i.e., fixing climate and population at the 2001–2011 level but allowing AC changes). (ad) Total areas, (eh) urban areas, and (il) rural areas. Regions with population exposure exceeding 100,000 person-days/year were considered.
Atmosphere 16 00912 g008
Figure 9. Relative changes (%) of the population exposure to compound heatwaves (CDNH) driven by different factors. (a,e,i) Total relative changes in the exposure, and their decompositions that were driven by (b,f,j) climate change, (c,g,k) population change, and (d,h,l) air conditioning (AC) change. (ad) Total areas, (eh) urban areas, and (il) rural areas. Regions with population exposure exceeding 100,000 person-days/year were considered. Here, the relative change rates were calculated by the differences in exposure between 2012–2022 and 2001–2011 divided by the exposure in 2001–2011.
Atmosphere 16 00912 g009
Figure 10. Relative contributions (%) of climate, population, and air conditioning (AC) changes to the changes in population exposure to compound heatwaves (CDNH). Spatial distributions of the relative contribution of (a,d,g) climate change, (b,e,h) population change, and (c,f,i) air conditioning change to the total changes in the exposure. (ac) Total areas, (df) urban areas, and (gi) rural areas. Regions with population exposure exceeding 100,000 person-days/year were considered.
Atmosphere 16 00912 g010
Figure 11. Dominant drivers of the changes in population exposure to compound heatwaves (CDNH). (a) The dominant driving factors of the changes in total population exposure at each 0.25-degree grid and their (c) urban and (e) rural areas. (b,d,f) The percentages of grid cells dominated by different driving factors for (b) total areas, (d) urban, and (f) rural areas. Regions with population exposure exceeding 100,000 person-days/year were considered.
Atmosphere 16 00912 g011
Table 1. Data used in this study.
TypeDataSpatial ResolutionTemporal ResolutionPeriodSource
Meteorological data2 m temperature (°C)0.25° × 0.25°day1961–2022China Meteorological Administration [41]
Land use dataGAIA30 myear2001–2018Tsinghua University
[43]
Socioeconomic datapopulation1 kmyear2001–2022Oak Ridge National Laboratory [45]
GDP per capita
(USD)
1 kmyear2001–2022Aalto University
[47]
GDP per capita
(CNY)
province
-level
year2015–2022China Statistical Yearbook
[46]
disposable income per capita (CNY)province
-level
year2015–2022
number of ACs per 100 householdsprovince
-level
year2015–2022
average household sizeprovince
-level
year2015–2022
CPIprovince
-level
year2001–2022
PPPnational
-level
year2001–2022World Bank [48]
Notes: GAIA (Global Artificial Impervious Areas), GDP (Gridded Gross Domestic Product), AC (Air Conditioning), CPI (Consumer Price Index), PPP (Purchasing Power Parity), USD (United States Dollar), and CNY (Chinese Yuan).
Disclaimer/Publisher’s Note: The statements, opinions and data contained in all publications are solely those of the individual author(s) and contributor(s) and not of MDPI and/or the editor(s). MDPI and/or the editor(s) disclaim responsibility for any injury to people or property resulting from any ideas, methods, instructions or products referred to in the content.

