Abstract
Soil fugitive dust (SFD) emissions pose a significant threat to both human health and the environment, highlighting the need for accurate and reliable estimation and assessment in the desert regions of northwest China. This study used climate, soil, and vegetation data from Bayingolin Prefecture (2001–2022) and applied the WEQ model to analyze temporal and spatial variations in total suspended particulate (TSP), PM10, and PM2.5 emissions and their driving factors. The region exhibited high emission factors for TSP, PM10, and PM2.5, averaging 55.46 t km−2 a−1, 27.73 t km−2 a−1, and 4.14 t km−2 a−1, respectively, with pronounced spatial heterogeneity and the highest values observed in Yuli, Qiemo, and Ruoqiang. The annual average emissions of TSP, PM10, and PM2.5 were 3.23 × 10⁷ t, 1.61 × 10⁷ t, and 2.41 × 10⁶ t, respectively. Bare land was the dominant source, contributing 72.55% of TSP emissions. Both total emissions and emission factors showed an overall upward trend, reaching their lowest point around 2012, followed by significant increases in most counties during 2012–2022. Annual precipitation, wind speed, and temperature were identified as the primary climatic drivers of soil dust emissions across all counties, and their influences exhibited pronounced spatial heterogeneity in Bazhou. In Ruoqiang, Bohu, Korla, and Qiemo, dust emissions are mainly limited by precipitation, although dry conditions and sparse vegetation can amplify the role of wind. In Heshuo, Hejing, and Yanqi, stable vegetation helps to lessen wind’s impact. In Yuli, wind speed and temperature are the main drivers, whereas in Luntai, precipitation and temperature are both important constraints. These findings highlight the need to consider emission intensity, land use, or surface condition changes, and the potential benefits of increasing vegetation cover in severely desertified areas when formulating regional dust mitigation strategies.
1. Introduction
Soil wind erosion is a significant source of atmospheric particulate matter (PM), especially in arid and semi-arid regions [1,2,3,4]. These soil-derived particulates, referred to as soil fugitive dust (SFD), have far-reaching impacts on air quality, human health, and climate systems [5,6,7,8]. Among global dust source regions, western China stands out due to the extensive deserts of Taklimakan and Gobi, which together contribute substantially to transboundary dust transport in East and Central Asia [9,10].The Taklimakan Desert emits approximately 70 Tg of dust annually [11,12]. During dust episodes, cities influenced by Taklimakan emissions may experience PM10 concentrations rising by 11–173% above background levels [13]. Xinjiang’s desert regions, particularly the Bayingolin Mongol Autonomous Prefecture (Bazhou), are highly susceptible to wind erosion. Located between the Taklimakan Desert and the Tianshan Mountains, Bazhou is characterized by severe land degradation, extensive bare land, frequent sandstorms, and intense land use change. These environmental conditions make Bazhou one of China’s most significant potential SFD source areas [14,15]. However, there is limited understanding of this region’s long-term dynamics and driving factors of dust emissions.
Previous studies have demonstrated that wind erosion is governed by a complex interplay of natural and anthropogenic factors, including wind speed, precipitation, soil texture, vegetation cover, and land use changes [16,17,18,19,20,21,22]. Wind speed is typically the primary driver [23,24], while precipitation and vegetation suppress factors by increasing surface stability [20]. On the other hand, temperature has shown positive and negative associations with dust events depending on local conditions [25]. However, many existing studies are based on low-resolution data or short-term correlation analyses, which limits their ability to capture fine-scale spatiotemporal variations and to distinguish the relative contributions of different driving factors.
In recent years, integrating remote sensing, field measurements, and empirical or process-based models has improved the spatial and temporal resolution of dust emission assessments [15,23,26]. The wind erosion equation (WEQ) and its revised versions have been widely used due to their operational feasibility and adaptability [27,28,29,30,31,32,33]. In China, the WEQ model was officially recommended by the Ministry of Ecology and Environment of the People’s Republic of China in 2014 for compiling SFD emission inventories [34] and has since been improved to reflect better local environmental conditions [35]. Recent efforts have enhanced the WEQ framework by incorporating high-resolution data such as vegetation indices (NDVI) and regional meteorological data, enabling its application in national key regions such as the Beijing–Tianjin–Hebei region (BTH), the “2 + 26” cities, and parts of northwestern China [29,36,37,38].
Nevertheless, significant knowledge gaps remain. Notably, high-resolution and long-term assessments of SFD emissions in Bazhou remain scarce. Furthermore, few studies have systematically quantified the relative contributions of various driving factors over extended periods. To enable robust analysis of both interannual variability and long-term trends in dust emissions and their driving factors in the region, this study applies the WEQ model within a high-resolution (1 km × 1 km) top-down framework to estimate PM10 and PM2.5 emissions from soil wind erosion across Bazhou during the period 2001–2022. We compile gridded environmental inputs, including land cover, soil properties, meteorological data, and vegetation indices, and reconstruct a 22-year emission dataset. This enables the analysis of spatiotemporal emission trends and identifies dominant environmental and anthropogenic drivers shaping dust emission dynamics. The results of this study offer important insights into the long-term variability in soil-derived particulate matter in one of China’s most erosion-prone regions and provide a scientific basis for air quality management and climate adaptation strategies in arid environments.
2. Materials and Methods
2.1. Study Area and Data Sources
This study focuses on the Bayingol Mongolian Autonomous Prefecture in the southeastern part of Xinjiang Uygur Autonomous Region, China. Geographically, the study area extends approximately from 35°38′ to 43°36′ N latitude and 82°38′ to 93°45′ E longitude, encompassing an area of about 471,500 km2, which represents roughly a quarter of Xinjiang’s total territory (Figure 1). Deserts and Gobi terrains dominate approximately 143,000 km2 of the region, accounting for about 30.3% of the total prefecture area. The local climate is semi-arid desert–steppe, with low annual precipitation and frequent strong winds. This region administratively comprises nine counties and cities: Korla, Yuli, Qiemo, Ruoqiang, Luntai, Bohu, Yanqi, Hejing, and Heshuo.
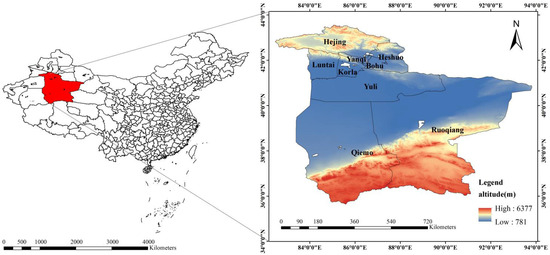
Figure 1.
The geographical location of the study area (red area), with respective altitude (m).
Considering the above wind erosion equation’s key parameters, the required data are bare soil area, soil texture, wind speed, precipitation, and vegetation cover factor. Their corresponding sources are as follows:
The soil texture data utilized in this study were acquired from the National Cryosphere Desert Data Center (http://www.ncdc.ac.cn/ (accessed on 17 October 2024)) Harmonized World Soil Database version 1.1 (HWSD) of the World Soil Database, with a spatial resolution of 1 km.
The Normalized Difference Vegetation Index (NDVI) data from 2001 to 2022 were derived from the MODIS MOD13A2 product, which features a spatial resolution of 1 km. By processing the original monthly NDVI data, the average NDVI values for grid cells within Bazhou were computed to generate annual NDVI datasets.
The land use data for 2001, 2005, 2010, 2015, and 2020 were obtained from the Resource and Environmental Science and Data Center of the Chinese Academy of Sciences (http://www.resdc.cn/ (accessed on 29 October 2024)), with a spatial resolution of 1 km [39]. To address the mismatch in temporal resolution between the annual meteorological and emission data and the multi-year land use data, linear interpolation was applied to estimate the annual land use values for each category between these years. This approach provided a continuous annual land use dataset from 2001 to 2022, which was used in the correlation analysis.
Meteorological station data regarding temperature, wind speed, and precipitation for Bazhou were sourced from the National Centers for Environmental Information (NCEI) of the National Oceanic and Atmospheric Administration (NOAA) at https://www.ncei.noaa.gov/access/search/data-search/global-summary-of-the-day (accessed on 20 October 2024). Daily data from all meteorological stations in Bazhou were collected for the period 2001–2022. For each station, the annual mean values of wind speed and temperature were calculated by averaging daily observations, while the monthly and annual precipitation totals were obtained by summing the daily precipitation records. These station-based data were subsequently interpolated into 1 km spatial raster datasets using the inverse distance weighting (IDW) method in ArcGIS.
2.2. Computational Model
The WEQ model is a classical model for calculating soil wind erosion. According to the technical guideline on city-level air pollutant emission inventory development (https://www.ttbz.org.cn/Pdfs/Index/?ftype=st&pms=108461 (accessed on 5 August 2024)), the WEQ was used as the soil dust algorithm, which comprehensively accounts for particle size distribution in the surface layer, soil texture, surface roughness, vegetation coverage, surrounding shielding conditions, and meteorological factors. The calculation is expressed as follows:
Wsi = EFi × Asi
In the Equation (1), Wsi represents the total emissions of PMi (particulate matter with an aerodynamic diameter between 0 and i µm, the same hereinafter) from SFD, in tons per year (t/a). EFi is the emission factor of PMi from soil dust sources, in tons per square meter per year, t/(104 m2 a−1). Asi is the area of bare soil sources in square meters (m2).
EFi = ki × Iew × f × L × V × C × (1 − η) × 10−4
In the Equation (2), ki represents the percentage content of particles (PMi) of a specific size fraction within the total suspended particulate (TSP) emissions from soil dust, the differentiated wind erosion indices for various particle sizes. When particle emissions for specific sizes are directly calculated using Equation (2), the parameter ki is omitted. Iew indicates the soil wind erosion index. Wind erosion indices for various soil texture types are presented in Table 1 [40]. f represents the soil roughness factor with a dimensionless uniform value of 1. L represents the unobstructed width factor, indicating the openness of the research area, specifically the most considerable distance free from significant obstructions (such as buildings or tall trees). For unobstructed widths ≤ 300 m, L = 0.7; for widths between 300 m and 600 m, L = 0.85 [40]; and for widths ≥ 600 m, L = 1.0; hence, 0.85 was used for the calculation. V is the vegetation cover factor, which is defined as the proportion of exposed area in the soil/unit area. η denotes the dust removal efficiency (%) associated with pollution control technologies.
C = 3.86 × u3/PE2

Table 1.
The reference value of the soil wind erosion index (t hm−2 a−1).
In the Equation (3), C represents the climate factor [35,41] (dimensionless), characterizing meteorological influences on soil dust emissions. It is determined by the average annual wind speed, precipitation, evaporation, and temperature. u is the annual average wind speed (m·s−1), PE is the Thorn Thwaite precipitation–evaporation index (dimensionless), and Pi is the monthly precipitation (mm). When Pi < 12.7 mm, it is calculated as 12.7 mm. Ti is the monthly average temperature (°C), and when Ti < 1.7 °C, it is calculated as −1.7 °C [28,42].
V = 1 − VC
VC = (NDVI − NDVIsoil)/(NDVIveg − NDVIsoil)
In the equation, VC represents the vegetation cover of a pixel, where NDVI and NDVIsoil refer to the NDVI values of the pixel and non-vegetated land, respectively, with the latter corresponding to the minimum NDVI value. NDVIveg denotes the NDVI value of vegetated land, which is typically considered the maximum NDVI value. This study defined the upper and lower NDVI thresholds as NDVIveg and NDVIsoil, respectively, based on the 5% confidence level.
3. Results and Discussion
3.1. Key Parameter Values
3.1.1. Wind Speed, Temperature, and Precipitation
Figure 2 presents the annual mean wind speed, mean temperature, and total precipitation in Bazhou from 2001 to 2022. Trends in temperature, precipitation, and wind speed were analyzed using linear regression over the study period. The average annual temperature was 9.06 ± 0.37 °C, with a maximum of 9.71 °C in 2007 and a minimum of 8.40 °C in 2022. Over the 20 years, the temperature exhibited a slight downward trend (−0.02 °C per year), although this change was not statistically significant (p > 0.05). Annual precipitation averaged 83.18 mm, ranging from a high of 103.11 mm in 2007 to a low of 64.10 mm in 2020. Precipitation also showed a minor decreasing trend (−0.04 mm per year), which was not significant (p > 0.05). The average annual wind speed was 2.95 m/s, displaying a marginal upward trend (0.45 × 10⁻² m/s per year) that was likewise not statistically significant (p > 0.05).
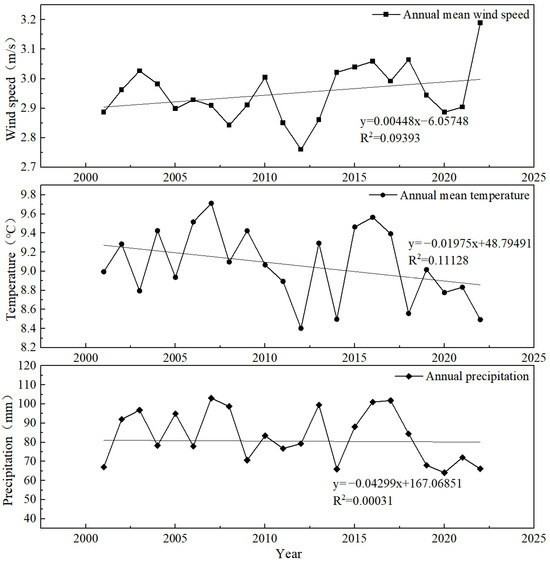
Figure 2.
Changes in annual mean wind speed, temperature, and annual precipitation in Bazhou from 2001 to 2022.
3.1.2. Vegetation Coverage Factor
Figure 3 shows the Normalized Difference Vegetation Index (NDVI) for various counties in Bazhou from 2001 to 2022. Marked differences in NDVI coverage were observed across these regions. Hejing exhibited the highest vegetation growth, whereas Qiemo, Yuli, and Ruoqiang had lower NDVI values. All counties demonstrated an upward trend in the NDVI over the study period, with a mean value of 0.12. The lowest annual mean NDVI was 0.17 in 2001, while the highest reached 0.24 in 2021.
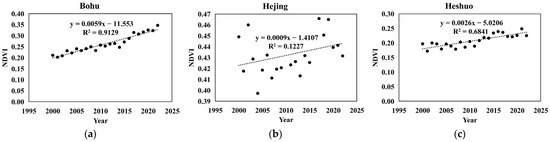
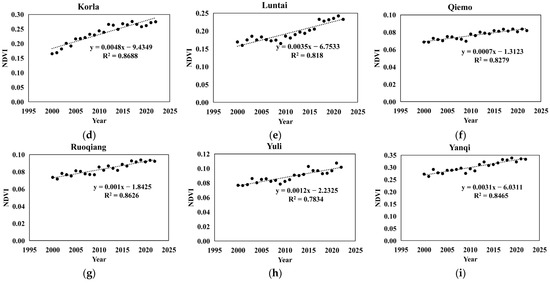
Figure 3.
Changes in NDVI in Bazhou, 2001–2022.
From 2001 to 2022, the annual mean NDVI in Bazhou showed a clear increasing trend. The rates of increase across the counties, ranked in descending order, were as follows: Bohu (0.0059) > Korla (0.0048) > Luntai (0.0035) > Yanqi (0.0031) > Heshuo (0.0026) > Yuli (0.0012) > Ruoqiang (0.0010) > Hejing (0.0009) > Qiemo (0.0007), with an overall average rate of 0.22 × 10⁻² per year. Although these results indicate an overall improvement in vegetation growth across the region over the past two decades, the magnitude of change has remained relatively modest.
3.1.3. Climate Factor and Thorn Thwaite Precipitation–Evaporation Index
The temporal variations in the climate factor and the Thorn Thwaite precipitation–evaporation index in Bazhou from 2001 to 2022 are shown in Figure 4. The climate factor is critical in calculating particulate emission coefficients from soil dust sources. From 2001 to 2022, the climate factor in Bazhou exhibited an increasing trend; however, this trend was not statistically significant (p > 0.05). The highest value was recorded in 2003 (0.37), while the lowest occurred in 2012 (0.18). The Thorn Thwaite precipitation–evaporation index—calculated based on the annual mean temperature and precipitation—is an important component of the climate factor. In Bazhou, the Thorn Thwaite precipitation–evaporation index also showed an upward trend during 2001–2022, but this increase was likewise not statistically significant (p > 0.05). These results indicate that, despite notable interannual fluctuations, the long-term climate drivers of wind erosion in Bazhou have remained relatively stable over the past two decades.
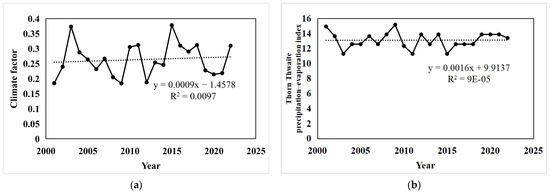
Figure 4.
Changes in climate factor and Thorn Thwaite index in Bazhou from 2001 to 2022: (a) climate factor, (b) Thorn Thwaite index.
3.1.4. Soil Types in Bazhou
According to our analysis, nine distinct soil texture types are present across the studied cities. The spatial distribution of soil wind erosion index (SWEI) values in Bazhou is illustrated in Table A1 and Figure 5. The identified soil texture types include sand, loamy sand, sandy loam, loam, silt loam, sandy clay loam, clay loam, and clay. The SWEI values vary significantly among different soil textures, generally following the order of loam > sand > clay. Sandy and sandy loam soils, which are characterized by a higher potential for wind erosion, dominate the region and account for 79.86% of the total area. In contrast, clay soils, which are more resistant to wind erosion, occupy only 7.36% of the area. Based on soil texture alone, these results indicate that Bazhou is highly susceptible to wind erosion and may experience elevated particulate matter emissions. Loam soils, which are most vulnerable to wind erosion, are primarily distributed along the edges of the Taklamakan Desert. The average SWEI value for TSP in Bazhou is 5.67 t/ha⋅a. Due to the prevalence of sandy soils in Bazhou, the overall SWEI is higher than that observed in the BTH region (3.28–5.01 t/ha⋅a) [40]. Nevertheless, Yanqi recorded the highest SWEI within the region (7.10 t/ha⋅a), while Qiemo recorded the lowest (5.12 t/ha⋅a). Each county exhibits distinct spatial distributions of soil texture types, indicating considerable heterogeneity in wind erosion potential across the region.
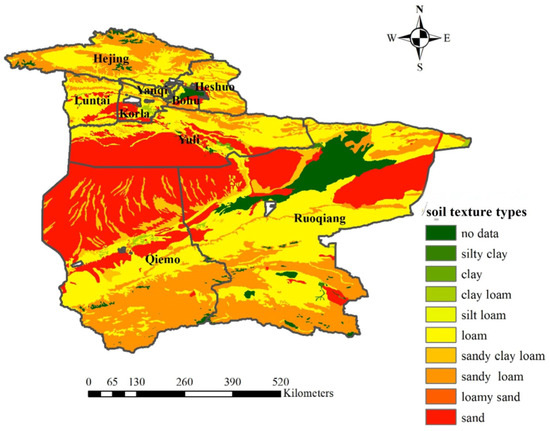
Figure 5.
Spatial distribution of soil texture types in Bazhou.
3.2. The Characteristic of the Emission Factor
3.2.1. Spatial Distribution Characteristic
The average PM10 emission factors (EFs) from soil wind erosion sources in Bazhou counties from 2001 to 2022 are shown in Table 2. The mean EFs for TSP, PM10, and PM2.5 from soil wind erosion sources in Bazhou were 55.46 t km−2 a−1, 27.73 t km−2 a−1, and 4.14 t km−2 a−1, respectively. Among the counties, Yuli had the highest emission factors, followed by Qiemo and Ruoqiang, with their TSP EFs being 2.3, 1.3, and 1.2 times higher than the Bazhou average, respectively. In contrast, Hejing exhibited a much lower average EF of 6.03 t km−2 a−1.
Table 2.
The average PM10 EF from soil wind erosion sources in Bazhou counties from 2001 to 2022.
Since TSP, PM10, and PM2.5 emissions are proportional, we used PM10 as a representative example for analysis and discussion; its 1 km × 1 km grid spatial distribution is shown in Figure 6. In 2021, the average PM10 EFs from soil wind erosion sources in Bazhou was approximately 27.9 t km−2 a−1, with values ranging from 0.92 to 68.4 t km−2 a−1. Spatially, the PM10 EFs were lowest in the northern region, moderate in the south, and highest in the central areas. This pattern primarily reflects variations in regional climate conditions and surface cover types. The highest emission intensities were observed in the Taklimakan Desert and its surrounding areas, consistent with previous findings on dust emissions in northern China [27,43]. As shown in Table A2, several adjacent or ecologically similar county pairs (e.g., Luntai–Yanqi, Ruoqiang–Luntai, Bohu–Luntai, Yanqi–Heshuo) showed no significant differences in the NDVI, PM10 EF, annual mean temperature, or annual precipitation; however, most of the remaining county pairs exhibited significant differences across these indicators.
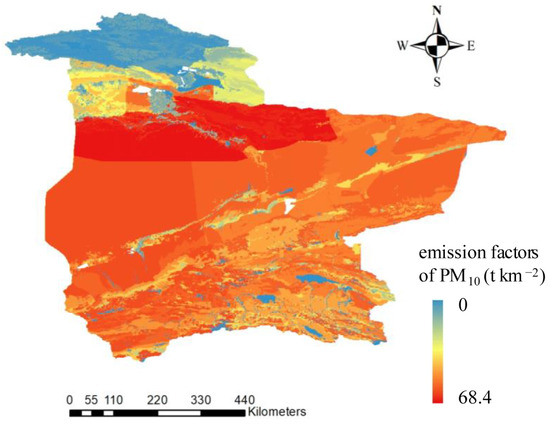
Figure 6.
The spatial distribution characteristic of PM10 EFs in 2021.
3.2.2. Temporal Variation Characteristics
Figure 7 and Table 3 compare the average annual rates of change in EFs for each county across different periods. From 2001 to 2022, the EFs for TSP, PM10, and PM2.5 from SFD sources in all counties exhibited an overall increasing trend, with the lowest values observed in 2012. This pattern is consistent with findings from the Tarim Basin, where a notable inflection in annual dust emission intensity was recorded around 2012 [16]. However, the overall increase rates were relatively low and did not reach statistical significance (p > 0.05). Notably, the TSP EFs in Ruoqiang, Luntai, Qiemo, and Yuli counties increased more rapidly, exceeding the average growth rate for Bazhou (0.31 t km−2 a−1).
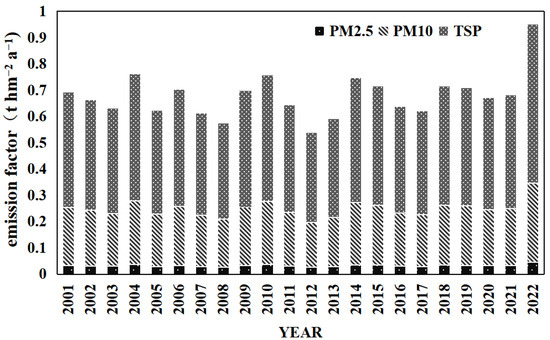
Figure 7.
Changes in the emission factor of TSP, PM10, and PM2.5 of soil dust sources in Bazhou from 2001 to 2022.
Table 3.
Change in TSP, PM10, and PM2.5 EFs from soil dust sources in Bazhou counties from 2001 to 2022.
A more detailed temporal analysis for 2001–2012 and 2012–2022 reveals a clear contrast in the magnitude and statistical significance of EF changes between the two decades. The results show that from 2001 to 2012, the annual EF change rates in all regions were relatively minor, with no statistically significant trends detected in any county (p > 0.05). In contrast, from 2012 to 2022, most counties experienced a general shift toward favorable annual change rates. Several counties—notably Ruoqiang, Bohu, Korla, and Bazhou—exhibited statistically significant upward trends in EF (p < 0.05). These findings indicate that soil dust emissions have become more pronounced over the past decade.
3.3. The Characteristic of SFD Emissions
Using the multi-layer parameter nesting calculation in GIS, the SFD emissions for each county are summarized in Table 4. The average annual emissions of TSP, PM10, and PM2.5 from soil dust sources in Bazhou during this period were 3.23 × 10⁷ t/a, 1.61 × 10⁷ t/a, and 2.41 × 10⁶ t/a, respectively. Ruoqiang recorded the highest average annual TSP emissions at 1.27 × 10⁷ t/a, accounting for 39.21% of the total emissions in Bazhou, followed by Qiemo and Yuli, with emissions of 1.01 × 10⁷ t/a (31.28%) and 7.66 × 10⁶ t/a (23.73%), respectively. Bohu had the lowest average annual TSP emissions at 1.27 × 10⁵ t/a, representing only 0.39% of the total emissions, followed by Hejing and Korla, with 1.88 × 10⁵ t/a (0.58%) and 3.47 × 10⁵ t/a (1.07%), respectively.
Table 4.
Change in TSP, PM10, and PM2.5 emissions from soil dust sources in Bazhou counties from 2001 to 2022.
The temporal analysis of PM10 emissions in Bazhou and its constituent counties reveals distinct differences in the magnitude and statistical significance of trends between 2001–2012 and 2012–2022, consistent with the observed patterns in EF changes. From 2001 to 2012, the annual rates of change in PM10 emissions across all regions were minimal, with some counties even exhibiting negative trends. Importantly, none of these changes reached statistical significance (all p > 0.05), indicating relatively stable or slightly declining PM10 emissions during the first decade. From 2012 to 2022, all counties experienced pronounced and statistically significant increases in PM10 emissions (all p < 0.05), with the largest annual growth rates observed in Ruoqiang, Qiemo, and Yuli. Although both the emission factors and total emissions in Bazhou have increased significantly over the past decade, it is important to note that significant rises in EFs were limited to only a few counties, such as Ruoqiang, Bohu, and Korla. In contrast, the increase in all counties’ total soil dust emissions was statistically significant. This apparent discrepancy arises from the fundamental difference between EFs and total emissions. EFs indicate the intensity of dust emissions per unit area or activity. In contrast, the EF and the extent of susceptible land, such as bare soil, influence the total emissions. In certain counties, significant increases in total emissions were observed even with modest or statistically insignificant changes in EF; this primarily resulted from the expansion of bare land or other surfaces prone to erosion over the past decade. Thus, even when the emission intensity remained stable, the increase in vulnerable land areas contributed to notable rises in the total emissions. This distinction highlights the importance of considering both the emission intensity and changes in land use or surface conditions when evaluating regional trends in soil dust emissions.
During 2001–2022, PM10 emissions from wind-induced soil dust erosion across different land use types in Bazhou were as follows: cropland (2.14 × 10³ t a−1), forest land (1.75 × 10³ t a−1), grassland (4.56 × 10⁴ t a−1), and unused land (1.31 × 10⁵ t a−1). Unused land contributed the most, accounting for 72.55% of total emissions in Bazhou, making it a critical target for particulate matter emission control. Grassland ranked second, contributing 25.29%, followed by cropland (1.19%) and forest land (0.97%). However, in regions such as Yinchuan, the BTH, and Daxing, cropland has been identified as the dominant source of wind-eroded dust emissions [44,45,46], primarily due to the larger proportion of cropland relative. A similar pattern to the present study was observed in Yizhou District, Hami, Xinjiang, adjacent to the Taklimakan Desert [47].
Due to the influence of regional areas on total emissions, emission intensity is commonly used as an indicator to compare the strength of soil dust emissions across different areas. In this study, PM2.5 emission intensity was selected as a representative metric to compare the study area with other cities, as shown in Table 5.
In 2021, the total PM2.5 emissions from soil dust in Bazhou were 2.4 × 10⁶ t, with a corresponding emission intensity of 5.15 t·km−2. As shown in Table 3, the emission intensity in Bazhou is 1.2 to 257.5 times higher than those in the other study areas. These results indicate that Bazhou exhibits significantly higher emission intensities than the other regions examined, except Yizhou District. This is primarily due to two factors. Firstly, these areas are situated along the margins of central deserts, including the Taklamakan Desert, with Bazhou characterized mainly by sandy and loam soils highly susceptible to wind erosion. Secondly, these regions are subject to persistently high wind speeds throughout the year, resulting in elevated meteorological variables that promote dust emissions.
Compared with other Chinese study areas, the order-of-magnitude difference in soil wind erosion emission intensity can be partly attributed to the modified wind erosion emission model: by imposing a lower bound on precipitation (treating any p < 12.7 mm as 12.7 mm), the model prevents the climatic coefficient (C) from becoming unreasonably large in arid climates (as the PE index approaches zero, C would otherwise approach infinity) [42]. However, wind erosion is negligible during continuous snow and ice cover periods; thus, relying solely on the PE index may lead to overestimating winter wind erosion. Overall, the estimates of soil dust emissions in Bazhou obtained in this study are reasonable.
Table 5.
Comparison of soil dust emission intensity between the study cities and other cities.
Table 5.
Comparison of soil dust emission intensity between the study cities and other cities.
| Study Area | Year | Soil Dust Emission Intensity (t·km−2) | Source |
|---|---|---|---|
| Bazhou | 2021 | 5.15 | This study |
| Yizhou District | 2021 | 4.27 | [47] |
| Hami | 2021 | 0.74 | [47] |
| Kashgar | 2021 | 1.39 | [47] |
| BTH | 2019 | 0.04 | [45] |
| “2 + 26” | 2018 | 0.54 | [40] |
| Xining | 2018 | 0.17 | [48] |
| Beijing | 2017 | 0.14 | [35] |
| Tianjin | 2017 | 0.22 | [49] |
| Daxing | 2021 | 0.02 | [46] |
3.4. Correlation Analysis
According to the WEQ, soil dust emissions are governed by various factors, including climatic conditions, soil texture, surface roughness, ground cover, and vegetation coverage. In this study, PM10 was used as a representative pollutant (with TSP and PM2.5 assumed to vary proportionally with PM10).
Figure 8 illustrates the Pearson correlation analysis between soil dust emissions and several variables, including areas of different land use types, vegetation coverage factor (NDVI), annual average wind speed, annual average temperature, and annual precipitation. PM10 emissions were significantly correlated with climate factor (p < 0.01), underscoring the dominant influence of climate on regional particulate matter emissions. Among these variables, annual precipitation showed a consistently strong negative correlation with PM10 emissions across most counties (p < 0.01).
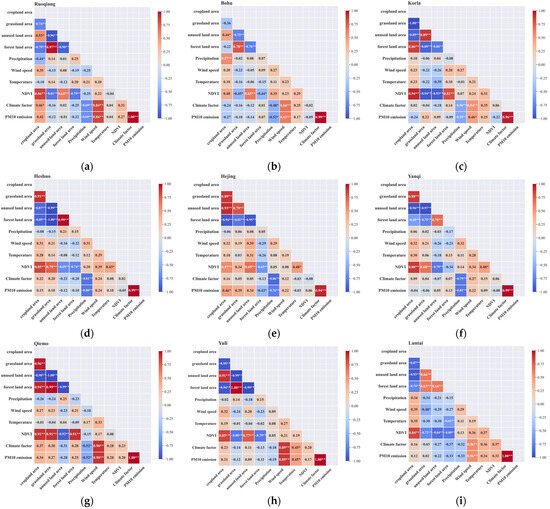
Figure 8.
Heatmap of the correlation between emissions of PM10 and other factors across counties in Bazhou: (a) Ruoqiang; (b) Bohu; (c) Korla; (d) Heshuo; (e) Hejing; (f) Yanqi; (g) Qiemo; (h) Yuli; (i) Luntai. * p < 0.05, ** p < 0.01.
In particular, cropland and unused land areas generally show positive correlations with PM10 emissions, indicating that anthropogenic land use changes, such as agricultural expansion and land abandonment, contribute to elevated dust emissions. In contrast, grassland and forest land areas are typically associated with lower PM10 emissions, underscoring the role of vegetation cover in mitigating wind erosion.
In Ruoqiang, Bohu, Korla, and Qiemo, precipitation emerges as the primary suppressive factor for PM10 emissions. Ruoqiang and Qiemo counties in the heart of the Taklamakan Desert experience high wind speeds and limited vegetation coverage, inherently facilitating intense wind erosion. In contrast, Korla and Bohu exhibit a higher SWEI, rendering these areas particularly sensitive to precipitation and wind speed variations. This sensitivity likely arises because increased precipitation enhances soil moisture content, thus increasing particle mass and inter-particle cohesion, subsequently reducing surface susceptibility to wind erosion [50]. Concurrently, these counties also exhibit a significant positive correlation between wind speed and dust emissions, underscoring the crucial role of wind erosion in regions characterized by insufficient rainfall. Wind speed effectively overcomes inter-particle cohesion within the soil, directly influencing the intensity and spatial extent of erosion events [51].
In contrast, Heshuo, Hejing, and Yanqi counties display distinctly different driving characteristics. The correlation between wind speed and PM10 emissions in these counties is markedly weaker, likely attributable to the predominance of stable vegetation cover that enhances soil surface resistance to erosion. Previous studies corroborate that increased soil aggregate stability and vegetation coverage in agricultural areas significantly reduce soil susceptibility to wind erosion [52]. Yuli and Luntai counties exhibit unique dust emission driving mechanisms. In Yuli, wind speed is the dominant driver of dust emissions, with temperature as the secondary factor. This condition arises due to Yuli’s proximity to the desert interior, extensive bare soil distribution, and extreme soil aridity; elevated temperatures further accelerate moisture loss, diminishing soil erosion resistance [53]. Conversely, in Luntai County, precipitation remains the primary factor limiting dust emissions, while temperature notably differs in its impact from other counties. This difference is likely due to freeze–thaw cycles prevalent in cold, arid regions, which alter soil particle size and composition, reducing sand content while increasing clay and silt fractions, making the soil more susceptible to wind erosion [54].
The correlation matrices across different counties consistently indicate that land use patterns influence PM10 emissions, although the strength of this influence varies by region. Notably, only in Hejing does cropland area exhibit a significant positive correlation with PM10 emissions (p < 0.05), whereas forest land area is significantly negatively correlated (p < 0.05). Given that Hejing also demonstrates the lowest soil wind erosion emission intensity among the counties studied, this implies that anthropogenic activities—particularly agricultural expansion—can notably alter dust emissions, even in areas with relatively low baseline erosion rates.
Research has confirmed that the sensitivity of dust emissions to factors such as wind speed, soil moisture, and vegetation cover can vary significantly across different geographic regions [55]. Furthermore, the pronounced spatial variability in dust emission drivers among Bazhou counties underscores the necessity for precise, localized dust control strategies tailored to each county’s specific climatic conditions, land use patterns, and soil characteristics.
3.5. Uncertainty Analysis
In this study, the uncertainty of the emission inventory primarily arises from the calculation and selection of activity levels and emission factors. In this study, the primary sources of uncertainty in the emission inventory include the following aspects: Due to the large spatial extent of the study area and limitations in both the algorithm and remote sensing resolution, unavoidable errors in bare land extraction may lead to deviations in the vegetation coverage factor. The unshielded width factor (L), which accounts for the impact of obstacles on soil dust emissions, inherently ignores variations in bare land area. Due to the unavailability of high-resolution spatial data for this factor, a fixed value of 0.85 was adopted in this study. This assumption may lead to overestimating emissions over large bare land areas, potentially causing emission estimates to fluctuate within a ±10% range. Moreover, dust removal efficiency by pollution control technologies (η) relies on recommended empirical values, introducing further uncertainty and potential error into the calculations. The particle size multiplier, representing the proportion of particles of different sizes in the soil, was derived from the literature-recommended values. Since no local soil sample analysis was conducted, additional uncertainty was introduced into the emission estimates.
4. Conclusions
- (1)
- This study reveals that Bazhou experiences high emission factors from soil wind erosion, with mean values for TSP, PM10, and PM2.5 of 55.46 t km−2 a−1, 27.73 t km−2 a−1, and 4.14 t km−2 a−1, respectively, during 2001–2022. Counties such as Yuli, Qiemo, and Ruoqiang consistently exhibited elevated emission factors. Substantial spatial heterogeneity was observed, with the highest values concentrated in central areas and around the Taklimakan Desert. Over time, soil dust emission factors showed a general upward trend, reaching their lowest levels around 2012, followed by a marked and statistically significant increase in most counties from 2012 to 2022.
- (2)
- From 2001 to 2022, the annual average emissions of TSP, PM10, and PM2.5 from soil sources in Bazhou were 3.23 × 10⁷ t, 1.61 × 10⁷ t, and 2.41 × 10⁶ t, respectively. Emissions were highest in Ruoqiang, Qiemo, and Yuli, and lowest in Bohu, Hejing, and Korla. Bare land was the predominant source of TSP emissions, accounting for 72.55% of the total in Bazhou. Grasslands contributed 25.29%, while cropland and forest land accounted for 1.19% and 0.97% of the total, respectively. Both total emissions and emission factors in Bazhou have generally increased over the past decade, with significant rises in soil dust emissions observed across all counties—primarily driven by desert regions such as Ruoqiang, Qiemo, and Yuli.
- (3)
- Over the past two decades, TSP, PM10, and PM2.5 emissions from soil dust sources in Bazhou have been primarily regulated by meteorological variables, with precipitation exerting the most decisive influence. The analysis demonstrates substantial spatial heterogeneity in the drivers of soil wind erosion and PM10 emissions throughout Bazhou. In Ruoqiang, Bohu, Korla, and Qiemo, precipitation is the principal limiting factor, but arid conditions and sparse vegetation amplify the role of wind speed in dust emissions. In Heshuo, Hejing, and Yanqi, the impact of wind speed is greatly diminished due to stable vegetation cover, which enhances soil resistance to erosion. Yuli is distinguished by wind speed and temperature, reflecting the county’s extensive bare soils and severe aridity. In Luntai, precipitation remains the primary constraint on PM10 emissions. However, temperature also plays a substantial role.
- (4)
- The impact of anthropogenic activities on soil wind erosion and dust emissions in Bazhou was most evident in Hejing, where cropland expansion significantly increased PM10 emissions, while the presence of forested areas effectively mitigated these emissions.
These findings underscore the importance of both meteorological conditions and land surface characteristics in shaping regional dust emission dynamics. A key limitation of this study is the reliance on the annual mean values required by the WEQ model, which may obscure short-term variability and peak dust emission events. Consequently, our analysis focuses on long-term trends and may underestimate the impact of extreme episodes. Future studies utilizing higher-frequency data could provide a more detailed understanding of short-term dust emission dynamics.
In addition to climatic conditions, soil wind erosion and dust emissions are also influenced by anthropogenic activities and other natural drivers. In the context of ongoing climate change, future research in Bazhou should emphasize elucidating the interactions between natural environmental conditions and human activities. Moreover, scenario-based projections assessing the potential impacts of climate change and human activities on these interactions are warranted to inform effective mitigation strategies.
Author Contributions
Conceptualization, S.Z.; data curation, S.Z. and T.M.; investigation, F.L. and Y.Y.; methodology, F.L. and Y.Y.; project administration, T.M.; software, S.Z.; visualization, J.C.; writing—original draft, S.Z.; writing—review and editing, T.M. and J.C.; All authors have read and agreed to the published version of the manuscript.
Funding
This work was supported by the Major Science and Technology Project of the Xinjiang Uygur Autonomous Region (2024A03012) and the National Key Research and Development Program of China (2024YFC3713500).
Institutional Review Board Statement
Not applicable.
Informed Consent Statement
Not applicable.
Data Availability Statement
The data developed in this study will be made available upon request to the corresponding author. Due to privacy concerns, the data are not publicly available.
Acknowledgments
Special thanks to Yuqing Dai, whose support greatly contributed to the completion of this manuscript.
Conflicts of Interest
Author Fang Li was employed by the company Tianjin He Pu Science and Technology Ltd. The remaining authors declare that the research was conducted in the absence of any commercial or financial relationships that could be construed as a potential conflict of interest.
Abbreviations
The following abbreviations are used in this manuscript:
| Bazhou | Bayingolin Mongol Autonomous Prefecture |
| BTH | Beijing–Tianjin–Hebei |
| EFs | Emission factors |
| SFD | Soil fugitive dust |
| SWEI | Soil wind erosion index |
| WEQ | Wind erosion equation |
Appendix A
Table A1.
The area proportion of each soil texture type in Bazhou counties.
Table A1.
The area proportion of each soil texture type in Bazhou counties.
| County | Loam | Sandy Loam | Silt Loam | Loamy Sand | Clay | Sandy Clay Loam | Sand | Clay Loam | Silty Clay | SUM |
|---|---|---|---|---|---|---|---|---|---|---|
| Luntai | 67.19% | 11.97% | 0.49% | 0.96% | 0.37% | 1.78% | 15.81% | 1.36% | 0.07% | 100.00% |
| Yuli | 37.27% | 7.86% | 0.04% | 0.03% | 0.59% | 2.04% | 51.79% | 0.25% | 0.13% | 100.00% |
| Ruoqiang | 44.52% | 24.16% | 0.15% | 0.18% | 0.09% | 3.96% | 26.25% | 0.43% | 0.27% | 100.00% |
| Qiemo | 19.62% | 28.28% | 0.10% | 0.11% | 0.06% | 8.41% | 42.83% | 0.56% | 0.02% | 100.00% |
| Yanqi | 73.61% | 18.54% | 0.79% | 0.54% | 1.37% | 0.33% | 2.99% | 1.83% | 0.00% | 100.00% |
| Hejing | 45.87% | 52.08% | 0.57% | 0.30% | 0.12% | 0.14% | 0.57% | 0.33% | 0.02% | 100.00% |
| Heshuo | 62.37% | 29.35% | 0.42% | 0.57% | 0.10% | 0.41% | 6.00% | 0.78% | 0.00% | 100.00% |
| Bohu | 44.53% | 26.24% | 0.22% | 0.18% | 0.26% | 0.48% | 26.68% | 1.40% | 0.00% | 100.00% |
| Korla | 51.40% | 9.41% | 0.51% | 0.47% | 0.53% | 0.24% | 30.49% | 6.84% | 0.09% | 100.00% |
Table A2.
Comparing any two counties in Bazhou in pairs, the significant difference analysis results of each parameter are as follows:.
Table A2.
Comparing any two counties in Bazhou in pairs, the significant difference analysis results of each parameter are as follows:.
| Parameter | Test Methods | County 1-County 2 | p | Results |
|---|---|---|---|---|
| Annual mean NDVI | The Kruskal–Wallis test, with confidence of 95% | Qiemo–Ruoqiang | 0.336 | Non-significant differences |
| Heshuo–Luntai | 0.054 | Non-significant differences | ||
| All the rest of the counties | 0 | Significant difference | ||
| EF of PM10 | The Kruskal–Wallis test, with confidence of 95% | Luntai–Yanqi | 0.058 | Non-significant differences |
| Luntai–Heshuo | 0.959 | |||
| Luntai–Bohu | 0.223 | |||
| Ruoqiang–Qiemo | 0.093 | |||
| Yanqi–Heshuo | 1 | |||
| Bohu–Korla | 1 | |||
| All the rest of the counties | 0 | Significant difference | ||
| Emission of PM50 | The Kruskal–Wallis test, with confidence of 95% | All the rest of the counties | 0 | Significant difference |
| Emission of PM10 | All the rest of the counties | 0 | Significant difference | |
| Emission of PM2.5 | All the rest of the counties | 0 | Significant difference | |
| Annual mean temperature | The Freedman test, with confidence of 95% | Bohu–Qiemo | 1 | Non-significant differences |
| All the rest of the counties | 0 | Significant difference | ||
| Annual | The Freedman test, with confidence of 95% | Yanqi–Heshuo | 0.905 | Non-significant differences |
| All the rest of the counties | 0 | Significant difference | ||
| Annual mean wind speed | The Freedman test, with confidence of 95% | All the rest of the counties | 0 | Significant difference |
References
- Huang, J.; Wang, T.; Wang, W.; Li, Z.; Yan, H. Climate Effects of Dust Aerosols over East Asian Arid and Semiarid Regions. J. Geophys. Res. Atmos. 2014, 119, 11398–11416. [Google Scholar] [CrossRef]
- Meng, H.; Wang, F.; Bai, G.; Li, H. A Study on Dust Storm Pollution and Source Identification in Northwestern China. Toxics 2025, 13, 33. [Google Scholar] [CrossRef]
- Gao, S.; Liu, Y.; Zhang, J.; Yu, J.; Chen, L.; Sun, Y.; Mao, J.; Zhang, H.; Ma, Z.; Yang, W.; et al. Soil-Derived Dust PM10 and PM2.5 Fractions in Southern Xinjiang, China, Using an Artificial Neural Network Model. Atmosphere 2023, 14, 1644. [Google Scholar] [CrossRef]
- Chen, S.; Zhao, D.; Huang, J.; He, J.; Chen, Y.; Chen, J.; Bi, H.; Lou, G.; Du, S.; Zhang, Y. Mongolia Contributed More than 42% of the Dust Concentrations in Northern China in March and April 2023. Adv. Atmos. Sci. 2023, 40, 1549–1557. [Google Scholar] [CrossRef]
- Li, J.; He, Q.; Wang, Y.; Ma, X.; Zhang, X.; Li, Y. Three-Dimensional Structure and Transport Properties of Dust Aerosols in Central Asia—New Insights from CALIOP Observations, 2007–2022. Remote Sens. 2024, 16, 2049. [Google Scholar] [CrossRef]
- Chen, S.; Huang, J.; Li, J.; Jia, R.; Jiang, N.; Kang, L.; Ma, X.; Xie, T. Comparison of Dust Emissions, Transport, and Deposition between the Taklimakan Desert and Gobi Desert from 2007 to 2011. Sci. China Earth Sci. 2017, 60, 1338–1355. [Google Scholar] [CrossRef]
- Zhang, X.-X.; Yang, X.-H.; Yang, F.; Lei, J.-Q.; Ali, M.; Li, S.-Y.; Liu, L.-Y.; Xue, Y.-B.; Wang, Z.-F.; Tian, W.-J. Windblown Dust in the Tarim Basin, Northwest China. Sci. Rep. 2025, 15, 11209. [Google Scholar] [CrossRef] [PubMed]
- Aghababaeian, H.; Ostadtaghizadeh, A.; Ardalan, A.; Asgary, A.; Akbary, M.; Yekaninejad, M.S.; Stephens, C. Global Health Impacts of Dust Storms: A Systematic Review. Environ. Health Insights 2021, 15, 1–28. [Google Scholar] [CrossRef]
- Chen, S.; Zhang, X.; Lin, J.; Huang, J.; Zhao, D.; Yuan, T.; Huang, K.; Luo, Y.; Jia, Z.; Zang, Z.; et al. Fugitive Road Dust PM2.5 Emissions and Their Potential Health Impacts. Environ. Sci. Technol. 2019, 53, 8455–8465. [Google Scholar] [CrossRef]
- Guo, J.; Yin, Y.; Wang, Y.; Kang, H.; Xiao, H.; Chen, K.; Hao, J. Numerical Study of the Dust Distribution, Source and Sink, and Transport Features over East Asia. China Environ. Sci. 2017, 3, 801–812. [Google Scholar]
- Xing, Y.; Chen, Y.; Yan, S.; Cao, X.; Zhou, Y.; Zhang, X.; Shi, T.; Niu, X.; Wu, D.; Cui, J. Dust Storms from the Taklamakan Desert Significantly Darken Snow Surface on Surrounding Mountains. Atmos. Chem. Phys. 2024, 24, 5199–5219. [Google Scholar] [CrossRef]
- Liu, J.; Ding, J.; Rexiding, M.; Li, X.; Zhang, J.; Ran, S.; Bao, Q.; Ge, X. Characteristics of Dust Aerosols and Identification of Dust Sources in Xinjiang, China. Atmos. Environ. 2021, 262, 118651. [Google Scholar] [CrossRef]
- Li, X.; Liu, X.; Yin, Z.-Y. The Impacts of Taklimakan Dust Events on Chinese Urban Air Quality in 2015. Atmosphere 2018, 9, 281. [Google Scholar] [CrossRef]
- Gao, C.; Liu, M. The Impact of Local Environment and Neighboring Pollution on the Spatial Variation of Particulate Matter in Chinese Mainland. Atmosphere 2023, 14, 186. [Google Scholar] [CrossRef]
- Liu, Y.; Teng, Y.; Liang, S.; Li, X.; Zhao, J.; Shan, M.; Chen, L.; Yu, H.; Mao, J.; Zhang, H.; et al. Establishment of PM10 and PM2.5 Emission Inventories from Wind Erosion Source and Simulation of Its Environmental Impact Based on WEPS-Models3 in Southern Xinjiang, China. Atmos. Environ. 2021, 248, 118222. [Google Scholar] [CrossRef]
- Zhou, Y.; Gao, X.; Lei, J. Characteristics of Dust Weather in the Tarim Basin from 1989 to 2021 and Its Impact on the Atmospheric Environment. Remote Sens. 2023, 15, 1804. [Google Scholar] [CrossRef]
- Zhang, G.; Azorin-Molina, C.; Shi, P.; Lin, D.; Guijarro, J.A.; Kong, F.; Chen, D. Impact of Near-Surface Wind Speed Variability on Wind Erosion in the Eastern Agro-Pastoral Transitional Zone of Northern China, 1982–2016. Agric. For. Meteorol. 2019, 271, 102–115. [Google Scholar] [CrossRef]
- Chappell, A.; Webb, N.P.; Guerschman, J.P.; Thomas, D.T.; Mata, G.; Handcock, R.N.; Leys, J.F.; Butler, H.J. Improving Ground Cover Monitoring for Wind Erosion Assessment Using MODIS BRDF Parameters. Remote Sens. Environ. 2018, 204, 756–768. [Google Scholar] [CrossRef]
- Chappell, A.; Webb, N.P.; Leys, J.F.; Waters, C.M.; Orgill, S.; Eyres, M.J. Minimising Soil Organic Carbon Erosion by Wind Is Critical for Land Degradation Neutrality. Environ. Sci. Policy 2019, 93, 43–52. [Google Scholar] [CrossRef]
- Okin, G.S.; Gillette, D.A. Distribution of Vegetation in Wind-dominated Landscapes: Implications for Wind Erosion Modeling and Landscape Processes. J. Geophys. Res. Atmos. 2001, 106, 9673–9683. [Google Scholar] [CrossRef]
- Aili, A.; Oanh, N.T.K.; Abuduwaili, J. Variation Trends of Dust Storms in Relation to Meteorological Conditions and Anthropogenic Impacts in the Northeast Edge of the Taklimakan Desert, China. Open J. Air Pollut. 2016, 5, 127. [Google Scholar] [CrossRef]
- An, L.; Che, H.; Xue, M.; Zhang, T.; Wang, H.; Wang, Y.; Zhou, C.; Zhao, H.; Gui, K.; Zheng, Y. Temporal and Spatial Variations in Sand and Dust Storm Events in East Asia from 2007 to 2016: Relationships with Surface Conditions and Climate Change. Sci. Total Environ. 2018, 633, 452–462. [Google Scholar] [CrossRef]
- Wu, C.; Lin, Z.; Liu, X.; Li, Y.; Lu, Z.; Wu, M. Can Climate Models Reproduce the Decadal Change of Dust Aerosol in East Asia? Geophys. Res. Lett. 2018, 45, 9953–9962. [Google Scholar] [CrossRef]
- Rashki, A.; Kaskaoutis, D.G.; Sepehr, A. Statistical Evaluation of the Dust Events at Selected Stations in Southwest Asia: From the Caspian Sea to the Arabian Sea. Catena 2018, 165, 590–603. [Google Scholar] [CrossRef]
- Song, H.; Zhang, K.; Piao, S.; Wan, S. Spatial and Temporal Variations of Spring Dust Emissions in Northern China over the Last 30 Years. Atmos. Environ. 2016, 126, 117–127. [Google Scholar] [CrossRef]
- Chen, X.; Wang, X. Loss and Conservation of Soil Organic Carbon and Nutrients in Arid and Semiarid China during Aeolian Dust Emissions. Soil Tillage Res. 2024, 235, 105910. [Google Scholar] [CrossRef]
- Xuan, J.; Liu, G.; Du, K. Dust Emission Inventory in Northern China. Atmos. Environ. 2000, 34, 4565–4570. [Google Scholar] [CrossRef]
- Panebianco, J.; Buschiazzo, D.E. Erosion Predictions with the Wind Erosion Equation (WEQ) Using Different Climatic Factors. Land Degrad. Dev. 2008, 19, 36–44. [Google Scholar] [CrossRef]
- Mandakh, N.; Tsogtbaatar, J.; Dash, D.; Khudulmur, S. Spatial Assessment of Soil Wind Erosion Using WEQ Approach in Mongolia. J. Geogr. Sci. 2016, 26, 473–483. [Google Scholar] [CrossRef]
- Xu, Y.; Jiang, N.; Yan, Q.; Zhang, R.; Chen, L.; Li, S. Research on Emission Inventory of Bareness Wind Erosion Dust in Zhengzhou. Environ. Pollut. Control 2016, 38, 22–27. [Google Scholar]
- Woodruff, N.P.; Siddoway, F. A Wind Erosion Equation. Soil Sci. Soc. Am. J. 1965, 29, 602–608. [Google Scholar] [CrossRef]
- NP, S.E.W. Wind Erosion Forces in the United States and Their Use in Predicting Soil Loss. In Agriculture Handbook; Agricultural Research Service: Beltsville, MD, USA, 1968. [Google Scholar]
- Fryrear, D.; Sutherland, P.; Davis, G.; Hardee, G.; Dollar, M. Wind Erosion Estimates with RWEQ and WEQ. In Proceedings of the Conference Sustaining the Global Farm, 10th International Soil Conservation Organization Meeting; Purdue University and the USDA-ARS National Soil Erosion Research Laboratory, West Lafayette, IN, USA, 24–29 May 1999. [Google Scholar]
- Ministry of Environmental Protection. Available online: https://www.mee.gov.cn/gkml/hbb/bgg/201501/t20150107_293955.htm (accessed on 16 May 2024).
- Li, B.; Huang, Y.; Bi, X.; Liu, L.; Qin, J. Localization of Soil Wind Erosion Dust Emission Factor in Beijing. Environ. Sci. 2020, 41, 2609–2616. [Google Scholar] [CrossRef]
- Zhou, Y.; Guo, B.; Wang, S.; Tao, H. An Estimation Method of Soil Wind Erosion in Inner Mongolia of China Based on Geographic Information System and Remote Sensing. J. Arid. Land 2015, 7, 304–317. [Google Scholar] [CrossRef]
- Li, T.; Dong, W.; Dai, Q.; Feng, Y.; Bi, X.; Zhang, Y.; Wu, J. Application and Validation of the Fugitive Dust Source Emission Inventory Compilation Method in Xiong’an New Area, China. Sci. Total Environ. 2021, 798, 149114. [Google Scholar] [CrossRef]
- Wang, P.; Chen, M.; An, W.; Liu, Y.; Pan, F. Research on the Fugitive Soil Dust Emission Inventory in Western China Based on Wind Erosion Equation Parameter Optimization. Front. Environ. Sci. 2023, 11, 1301934. [Google Scholar] [CrossRef]
- Resource and Environmental Science Data Platform. Available online: https://www.resdc.cn/ (accessed on 29 October 2024).
- Li, T.; Bi, X.; Dai, Q.; Wu, J.; Zhang, Y.; Feng, Y. Optimized Approach for Developing Soil Fugitive Dust Emission Inventory in “2+26” Chinese Cities. Environ. Pollut. 2021, 285, 117521. [Google Scholar] [CrossRef]
- Thornthwaite, C.W. The Climates of North America: According to a New Classification. Geogr. Rev. 1931, 21, 633–655. [Google Scholar] [CrossRef]
- Lyles, L. Erosive Wind Energy Distributions and Climatic Factors for the West. J. Soil Water Conserv. 1983, 38, 106–109. [Google Scholar] [CrossRef]
- Xuan, J. Dust Emission Factors for Environment of Northern China. Atmos. Environ. 1999, 33, 1767–1776. [Google Scholar] [CrossRef]
- Tian, M.; Gao, J.; Zhang, L.; Zhang, H.; Feng, C.; Jia, X. Effects of Dust Emissions from Wind Erosion of Soil on Ambient Air Quality. Atmos. Pollut. Res. 2021, 12, 101108. [Google Scholar] [CrossRef]
- Zhao, Z.; Qi, Y.; Han, R.; Xiao, N.; Li, J. Changes in the Emission of Dust Particles from Soil in the Beijing-Tianjin-Hebei Region in the Past 20 Years. Acta Ecol. Sin. 2022, 42, 7910–7920. [Google Scholar] [CrossRef]
- Liu, Q.; Liu, Y.; Liu, S.; Zhao, J.; Zhao, B.; Zhou, F.; Zhu, D.; Wang, D.; Yu, L.; Yi, L.; et al. Emission Inventory of Soil Fugitive Dust Sources with High Spatiotemporal Resolution: A Case Study of Daxing District, Beijing, China. Land 2024, 13, 1991. [Google Scholar] [CrossRef]
- Bai, W.; Li, X.; Zhang, H.; Wang, J.; Zhao, X.; Lai, X.; Hong, W.; Jiang, Y. Construction of Emission Inventory and Temporal-Spatial Distribution of Soil Fugitive Dust in Typical Oasis Cities. Acta Sci. Nat. Univ. Pekin. 2025, 61, 217–226. [Google Scholar] [CrossRef]
- Lin, Y.; Ji, Y.; Lin, Z.; Gao, Y.; Yang, Y.; Xu, X. Construction of Emission Inventory and Temporal-Spatial Distribution of Soil Fugitive Dust in Xining, China. Environ. Chem. 2022, 41, 4006–4015. [Google Scholar] [CrossRef]
- Li, T.; Bi, X.; Dai, Q.; Liu, B.; Han, Y.; You, H.; Wang, L.; Zhang, J.; Cheng, Y.; Zhang, Y. Improving Spatial Resolution of Soil Fugitive Dust Emission Inventory Using RS-GIS Technology: An Application Case in Tianjin, China. Atmos. Environ. 2018, 191, 46–54. [Google Scholar] [CrossRef]
- He, J.; Cai, Q.; Cao, W. Wind Tunnel Study of Multiple Factors Affecting Wind Erosion from Cropland in Agro-Pastoral Area of Inner Mongolia, China. J. Mt. Sci. 2013, 10, 68–74. [Google Scholar] [CrossRef]
- Yu, H.; Wang, Y.; Yuan, L.; Kong, R.; Han, S.; Han, W.; Li, J. Longer Dust Events over Northwest China from 2015 to 2022. Atmos. Res. 2024, 304, 107365. [Google Scholar] [CrossRef]
- Pajouhesh, M.; Gharahi, N.; Iranmanesh, M.; Cornelis, W.M. Effects of Vegetation Pattern and of Biochar and Powdery Soil Amendments on Soil Loss by Wind in a Semi-arid Region. Soil Use Manag. 2020, 36, 704–713. [Google Scholar] [CrossRef]
- Ebrahimi-Khusfi, Z.; Soleimani Sardoo, M. Recent Changes in Physical Properties of the Land Surface and Their Effects on Dust Events in Different Climatic Regions of Iran. Arab. J. Geosci. 2021, 14, 287. [Google Scholar] [CrossRef]
- Xu, C.; Zhang, Z.; Zhang, S.; Jin, D.; Yang, C.; Melnikov, A.; Zhai, J. Self-Weighting of the Overlying Soil Horizon Catalyzed by Freeze–Thaw Cycles Leads to Silt Particle Enrichment in the Soil Profile. Catena 2024, 237, 107815. [Google Scholar] [CrossRef]
- Wang, X.; Zhang, C. Sensitivity of Soil Dust Emissions to Driving Factor Variability in Earth’s Main Drylands. Geoderma 2024, 445, 116876. [Google Scholar] [CrossRef]
Disclaimer/Publisher’s Note: The statements, opinions and data contained in all publications are solely those of the individual author(s) and contributor(s) and not of MDPI and/or the editor(s). MDPI and/or the editor(s) disclaim responsibility for any injury to people or property resulting from any ideas, methods, instructions or products referred to in the content. |
© 2025 by the authors. Licensee MDPI, Basel, Switzerland. This article is an open access article distributed under the terms and conditions of the Creative Commons Attribution (CC BY) license (https://creativecommons.org/licenses/by/4.0/).