
A Factorial-Clustered Copula Covariate Analysis for Interaction Effects of Multiple Climate Factors on Vegetation Cover in China


Abstract
1. Introduction
2. Data Source and Methods
2.1. Dataset
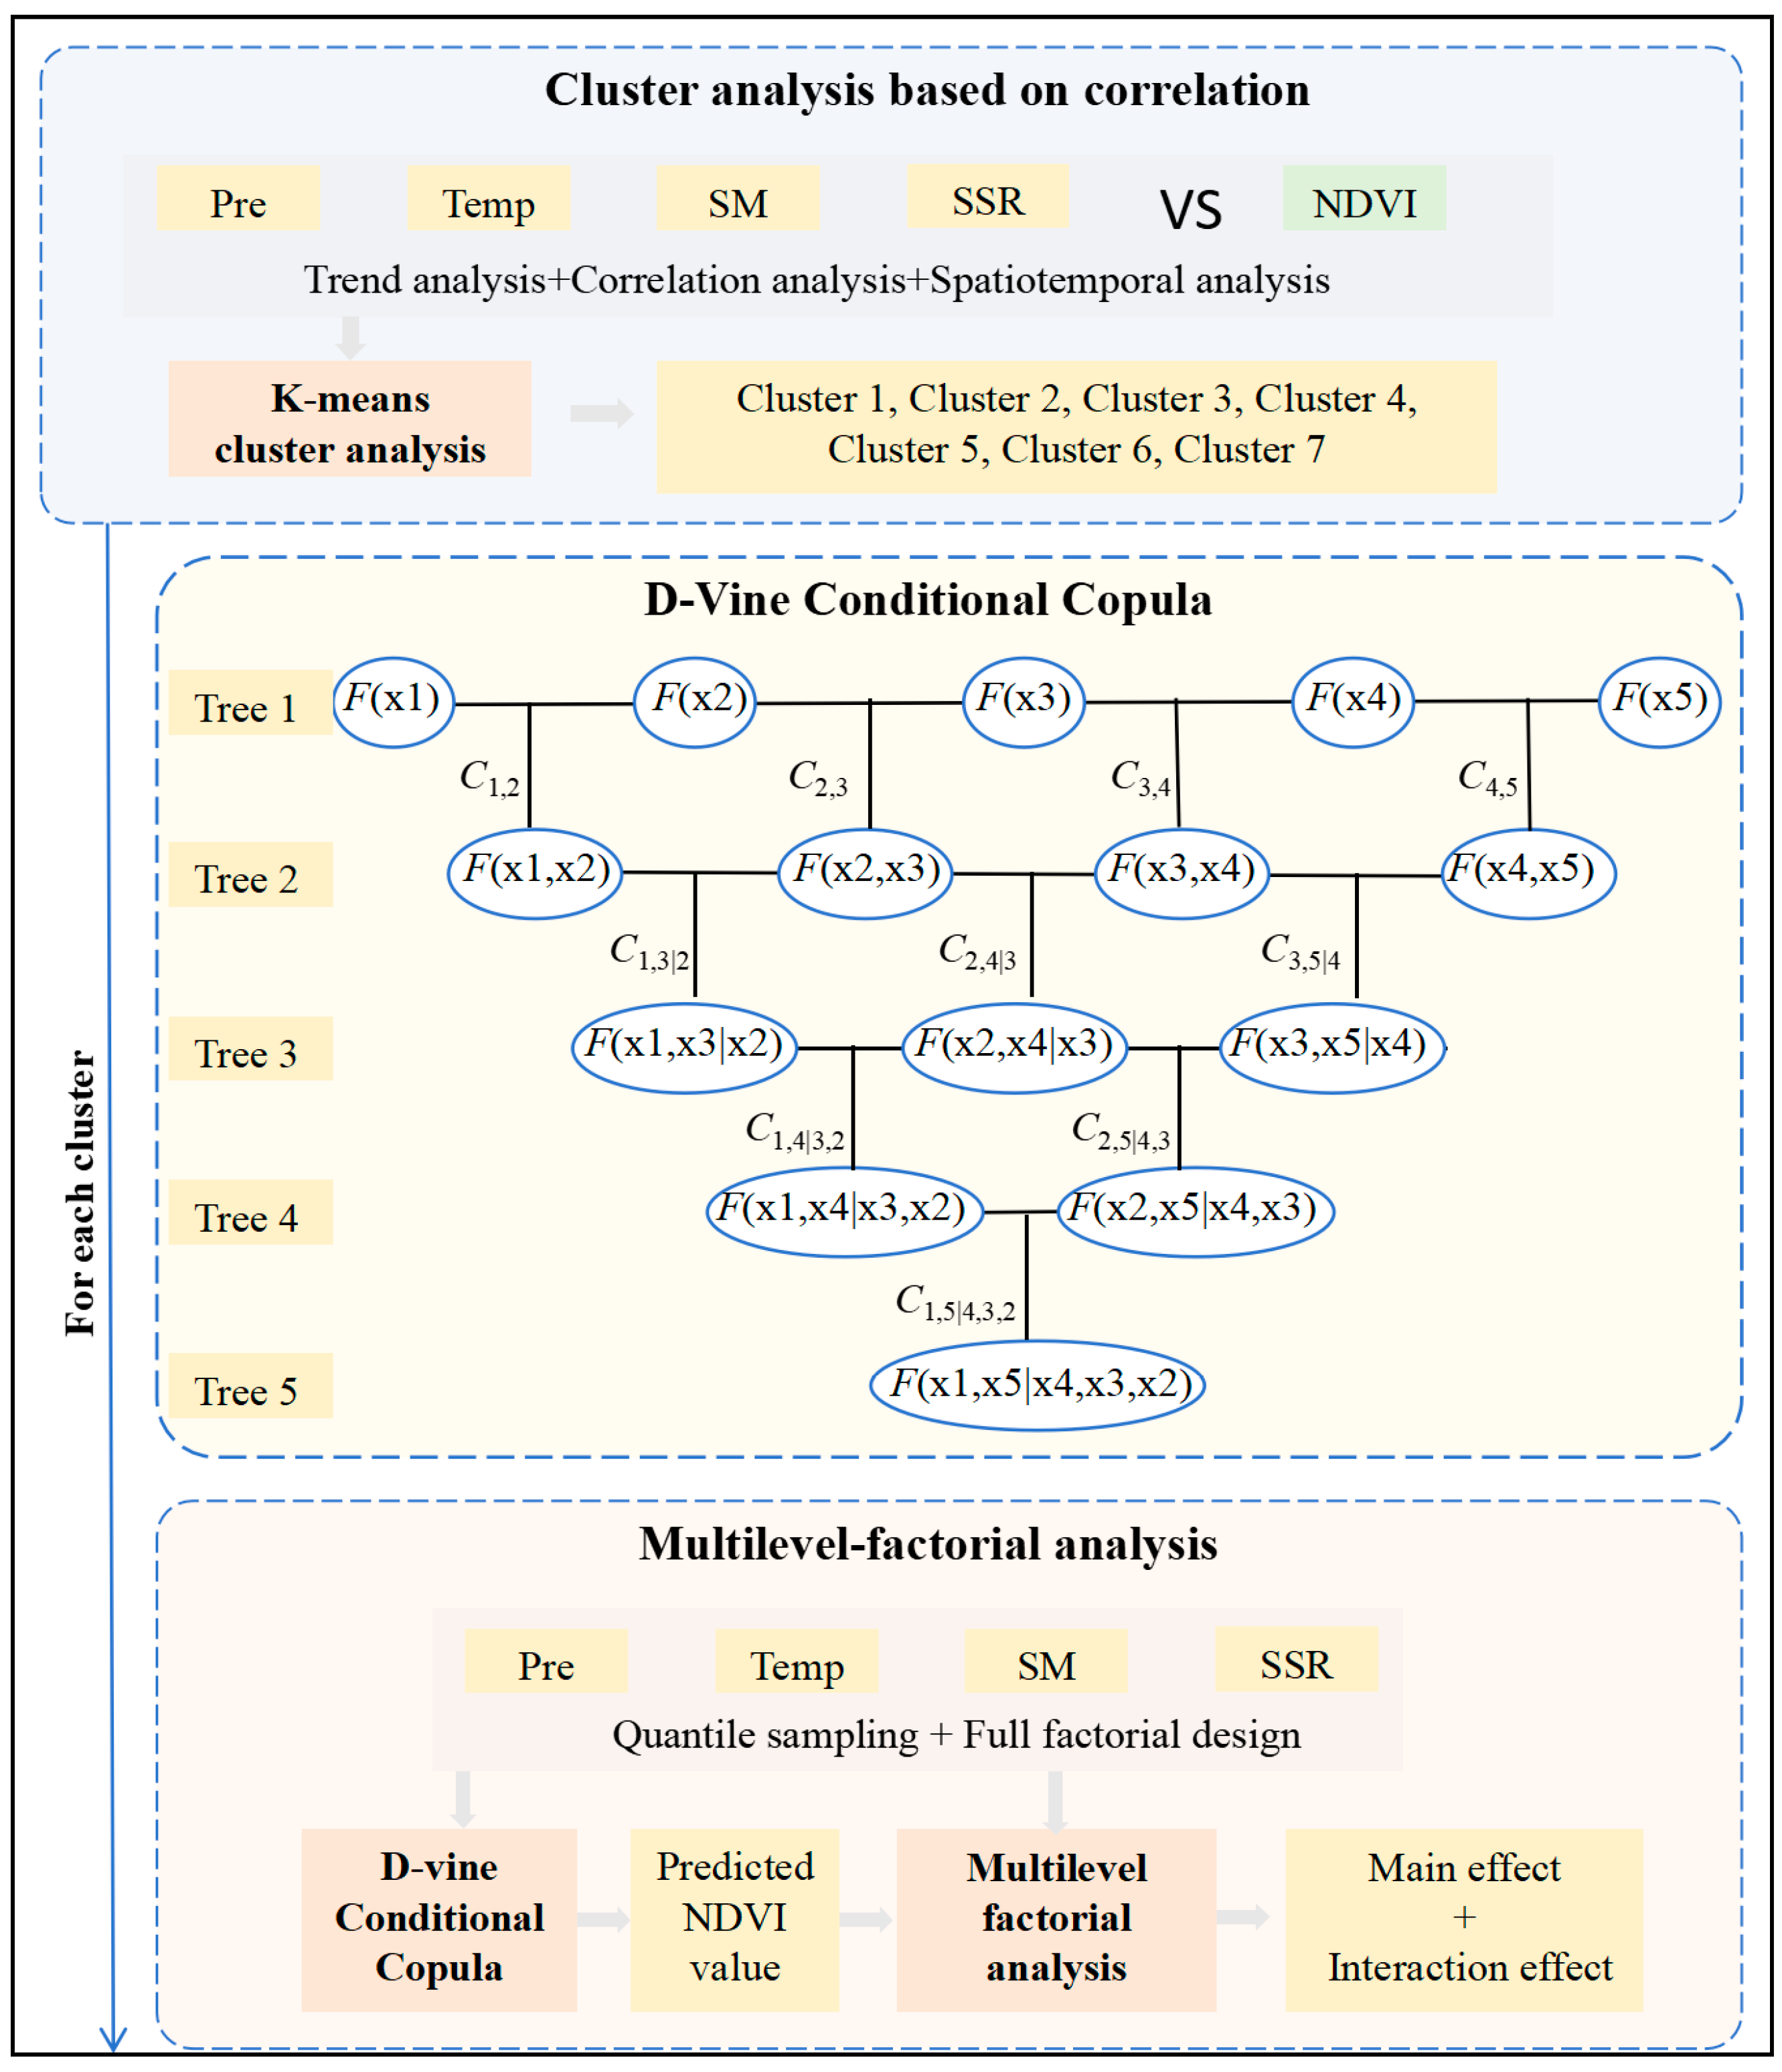
2.2. Methods
- (1)
- Theil-Sen trend analysis
- (2)
- Pearson correlation analysis
- (3)
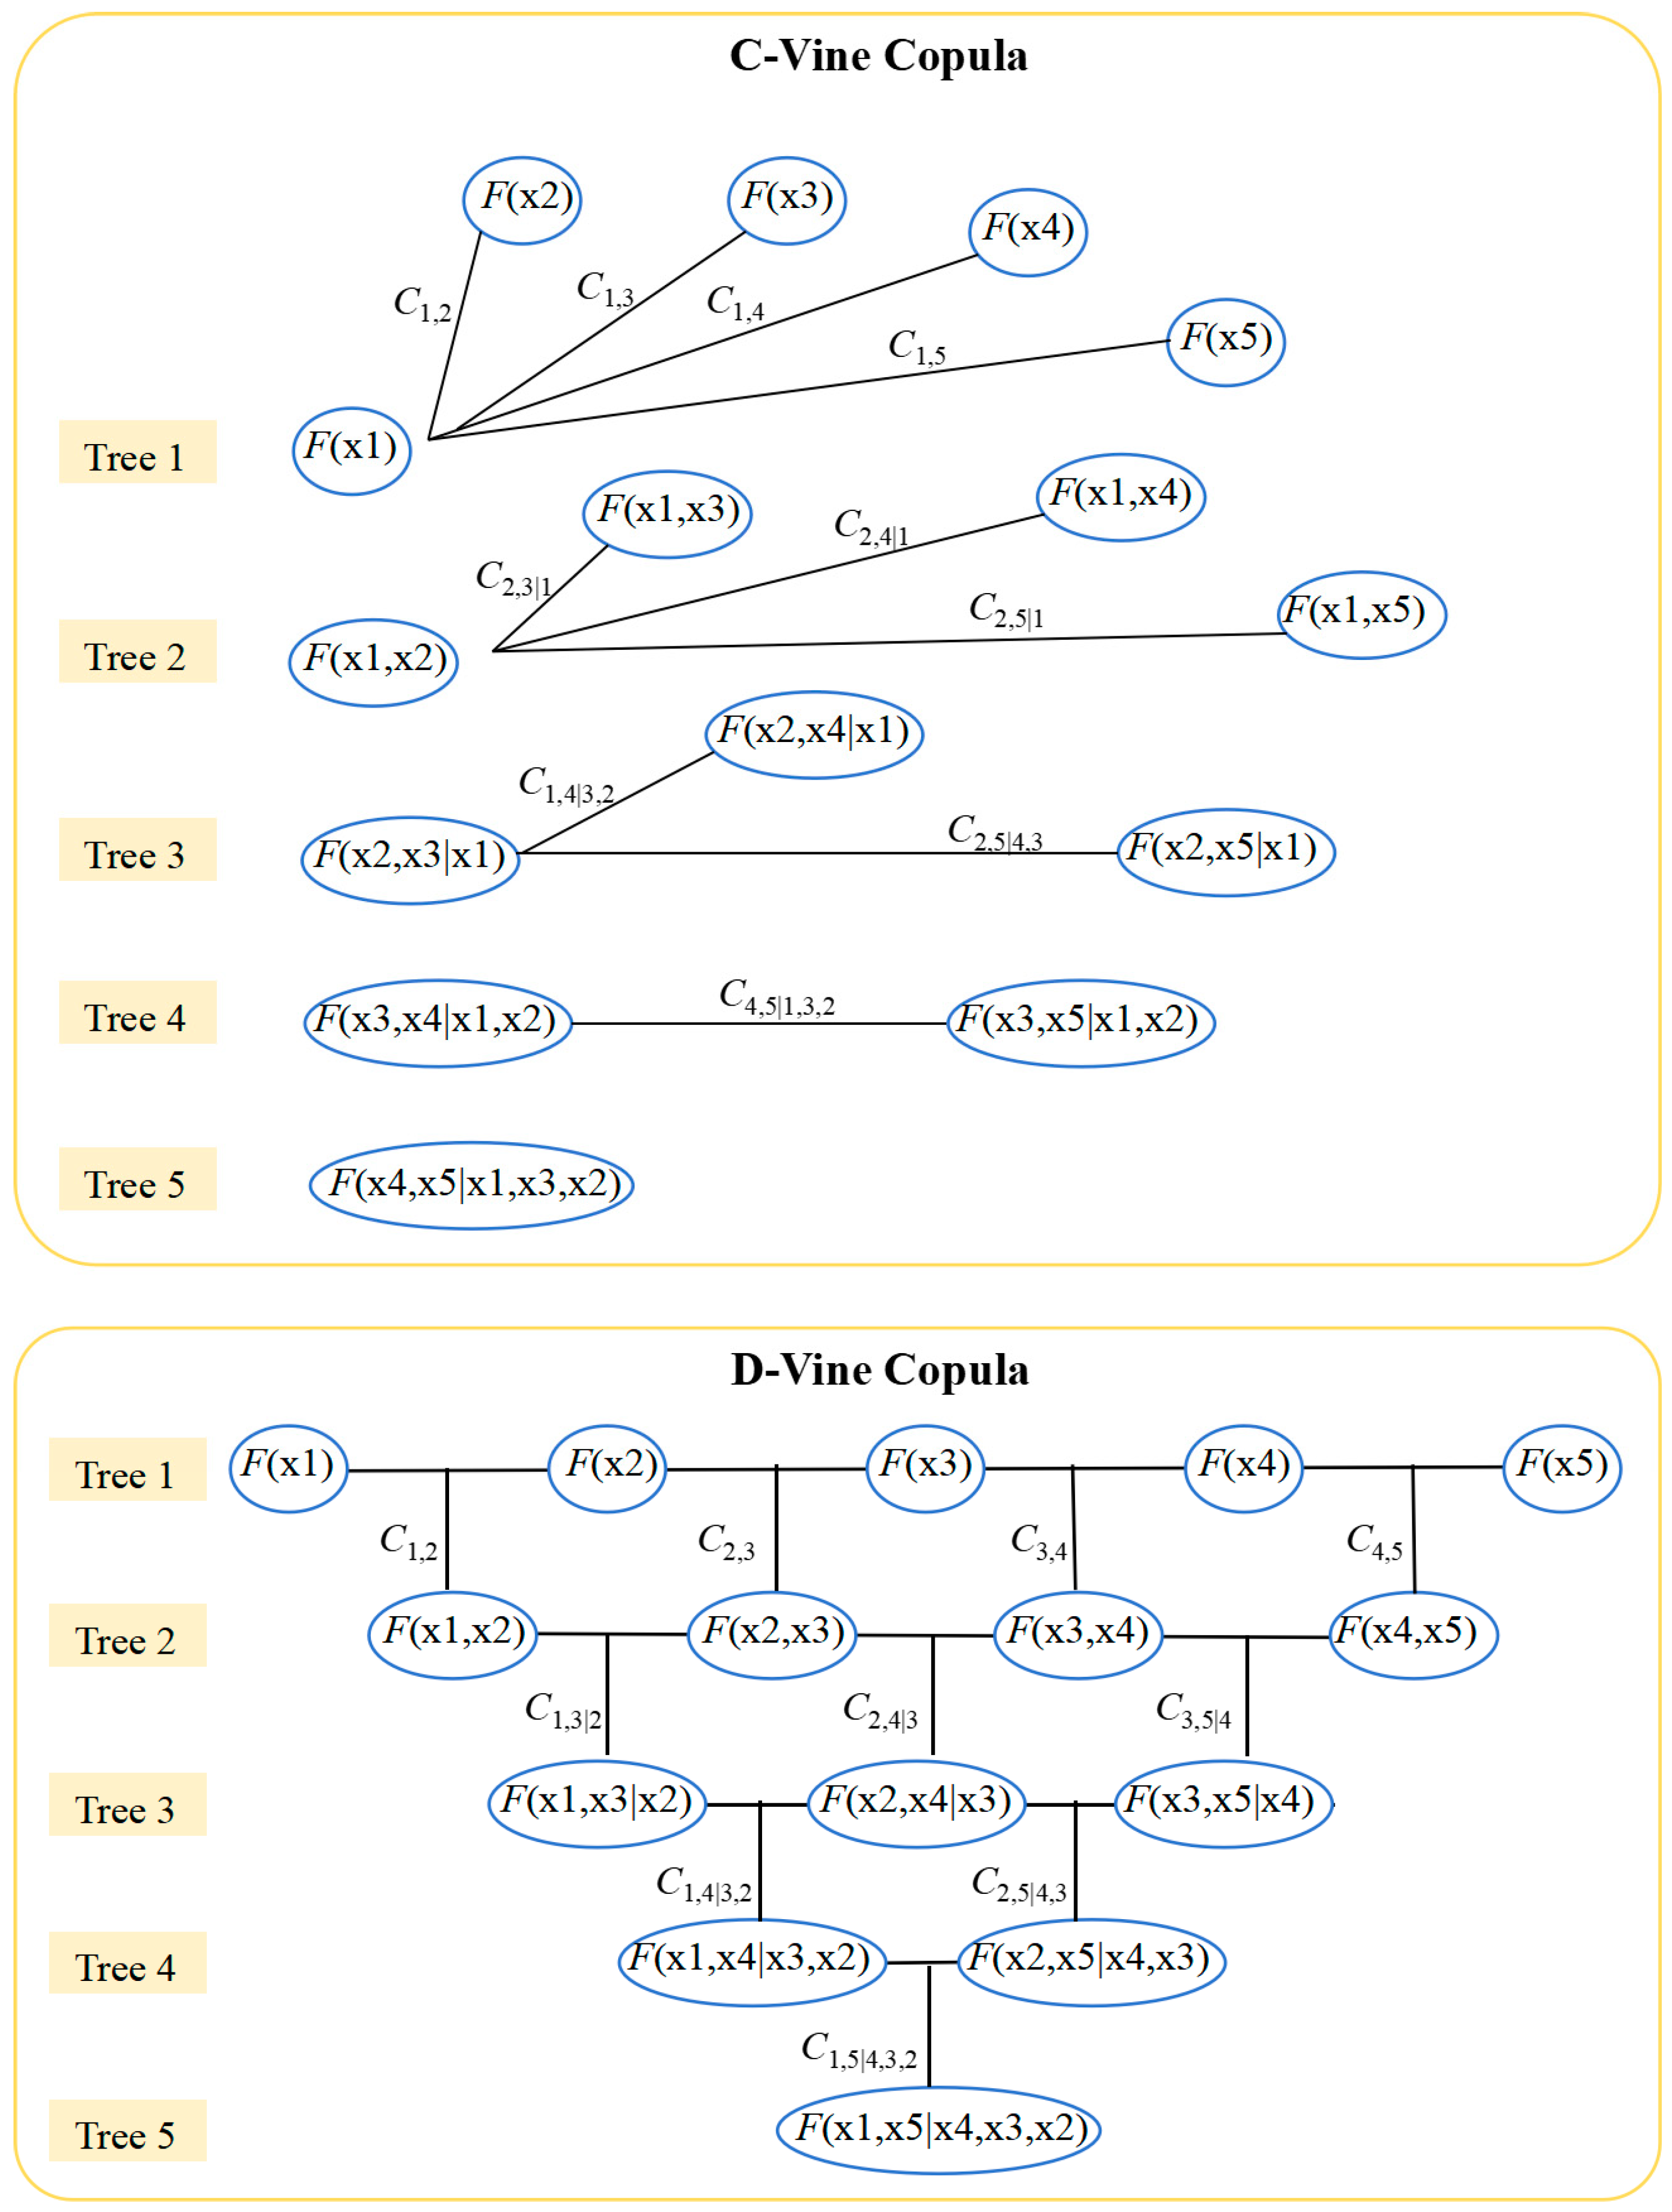
- Vine Copula-based multivariate covariate analysis
- (i)
- Marginal Distribution Fitting.
- (ii)
- Vine Copula Structure Selection.
- (4)
- Multilevel Factorial Analysis.
3. Results
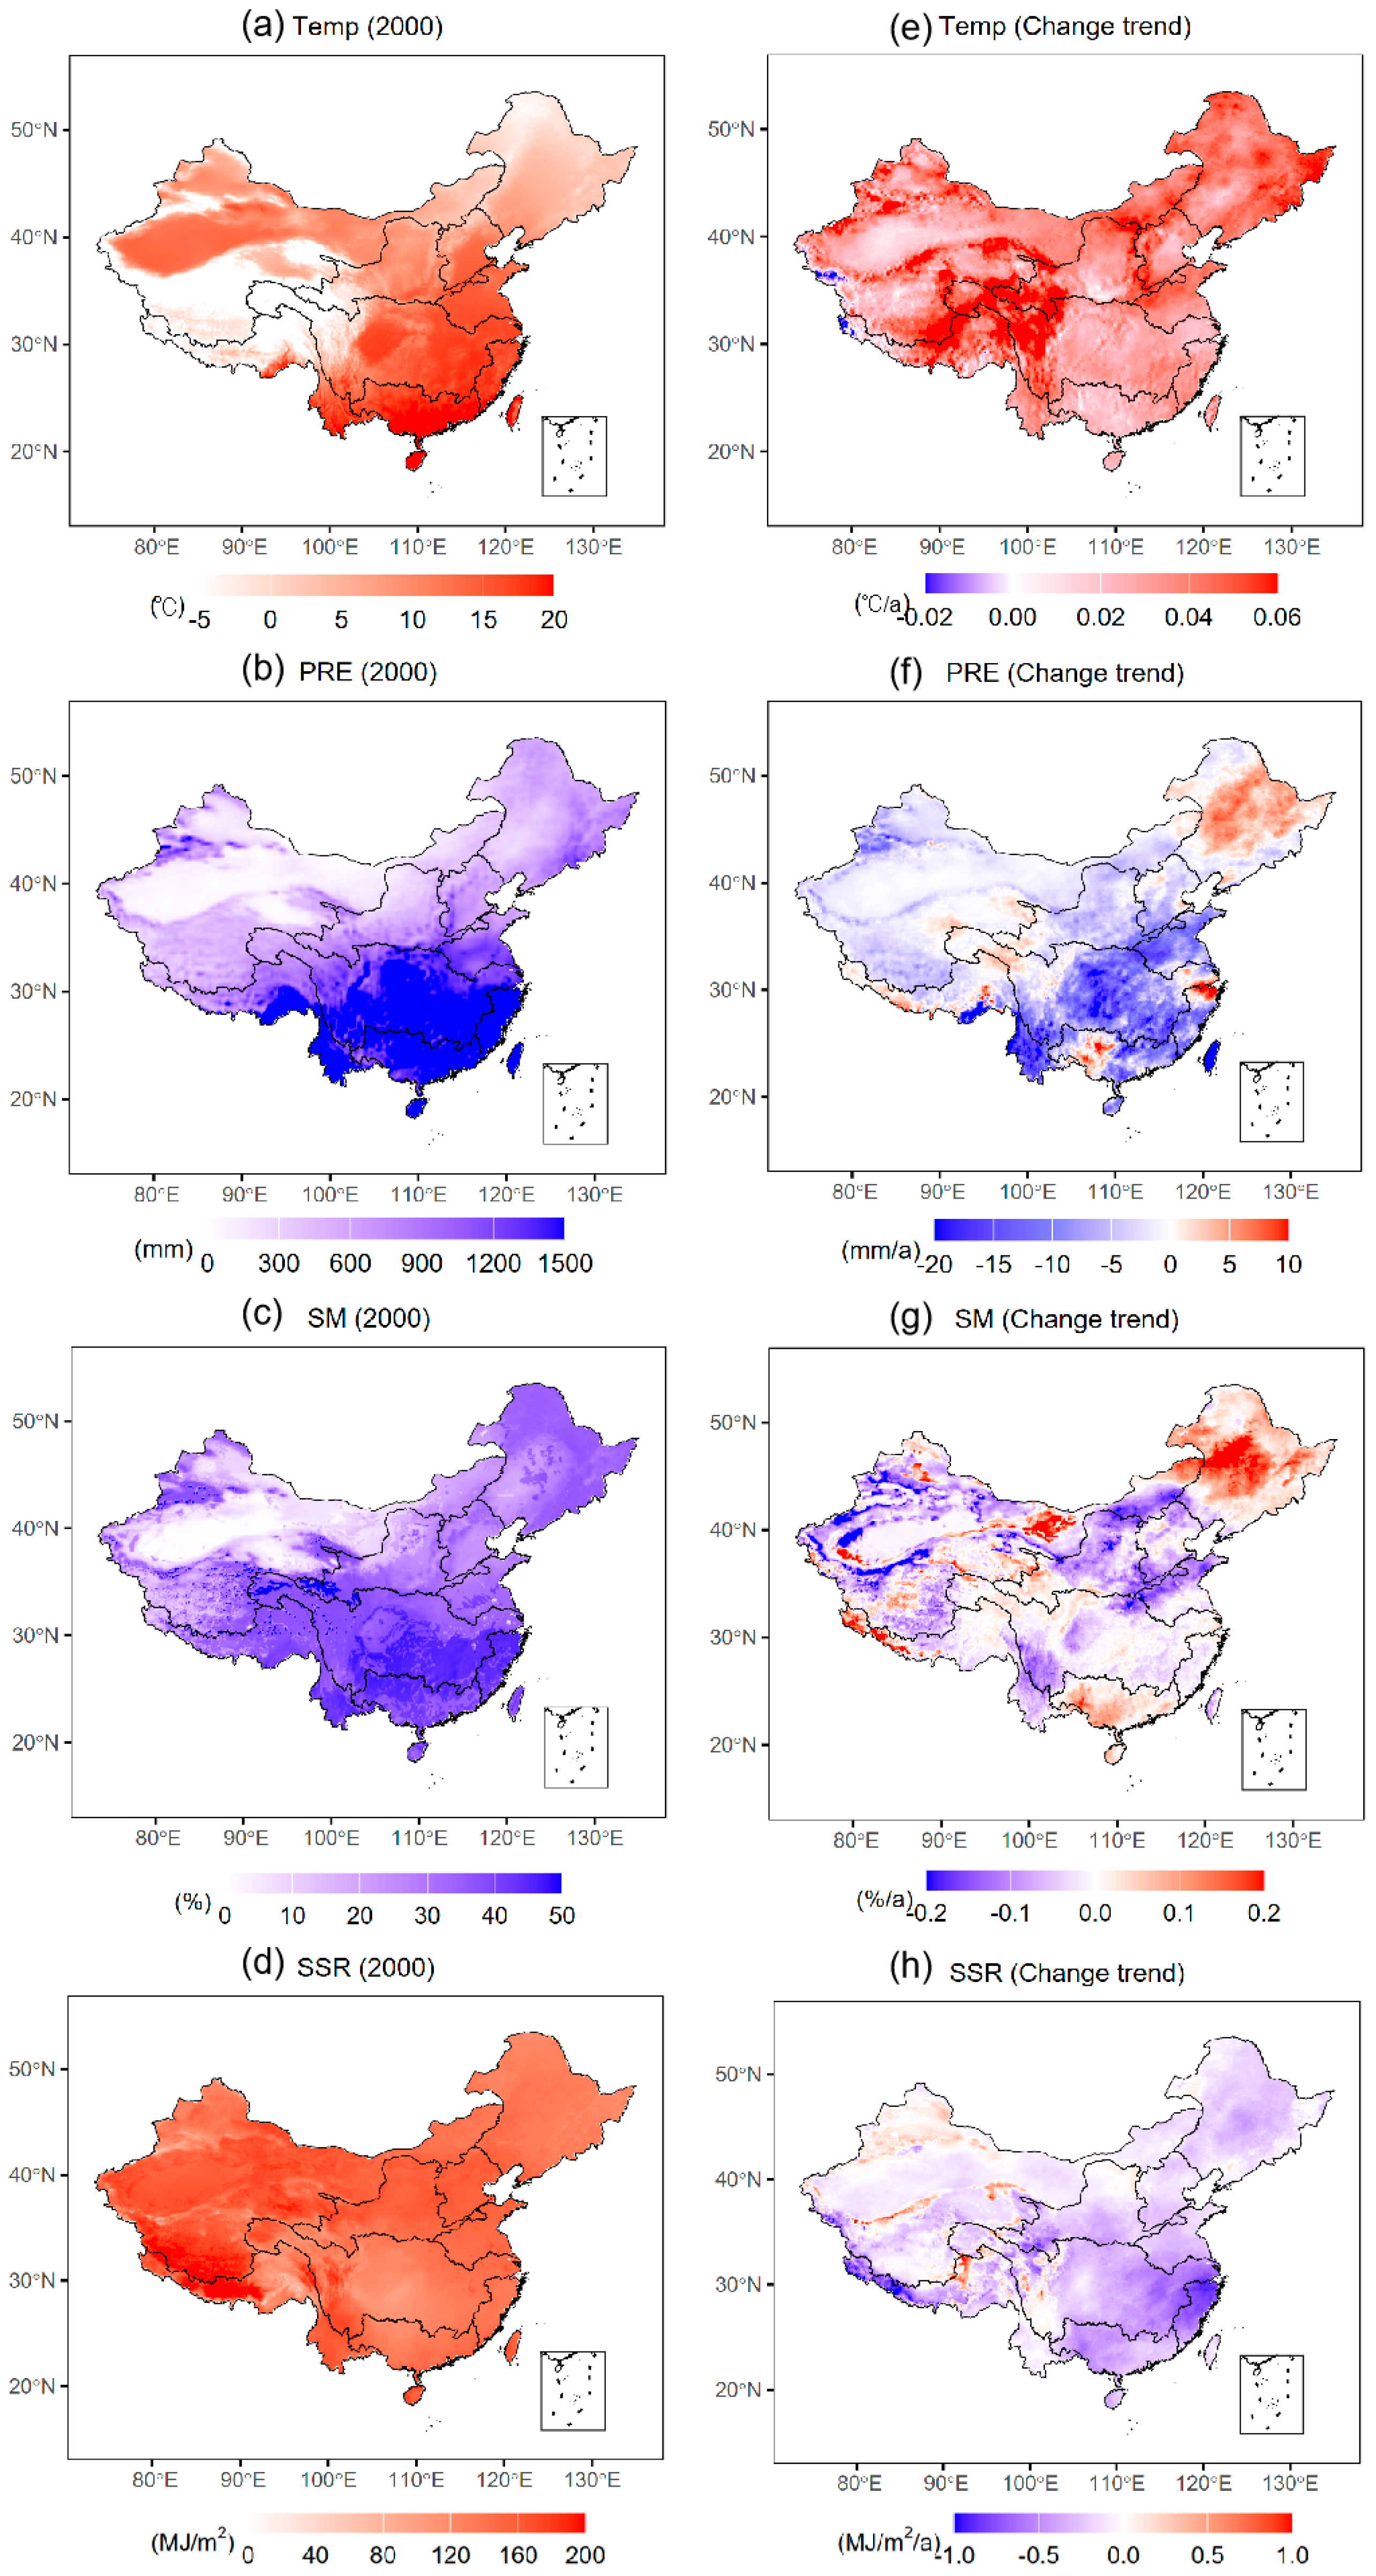
3.1. The Spatiotemporal Variability of NDVI
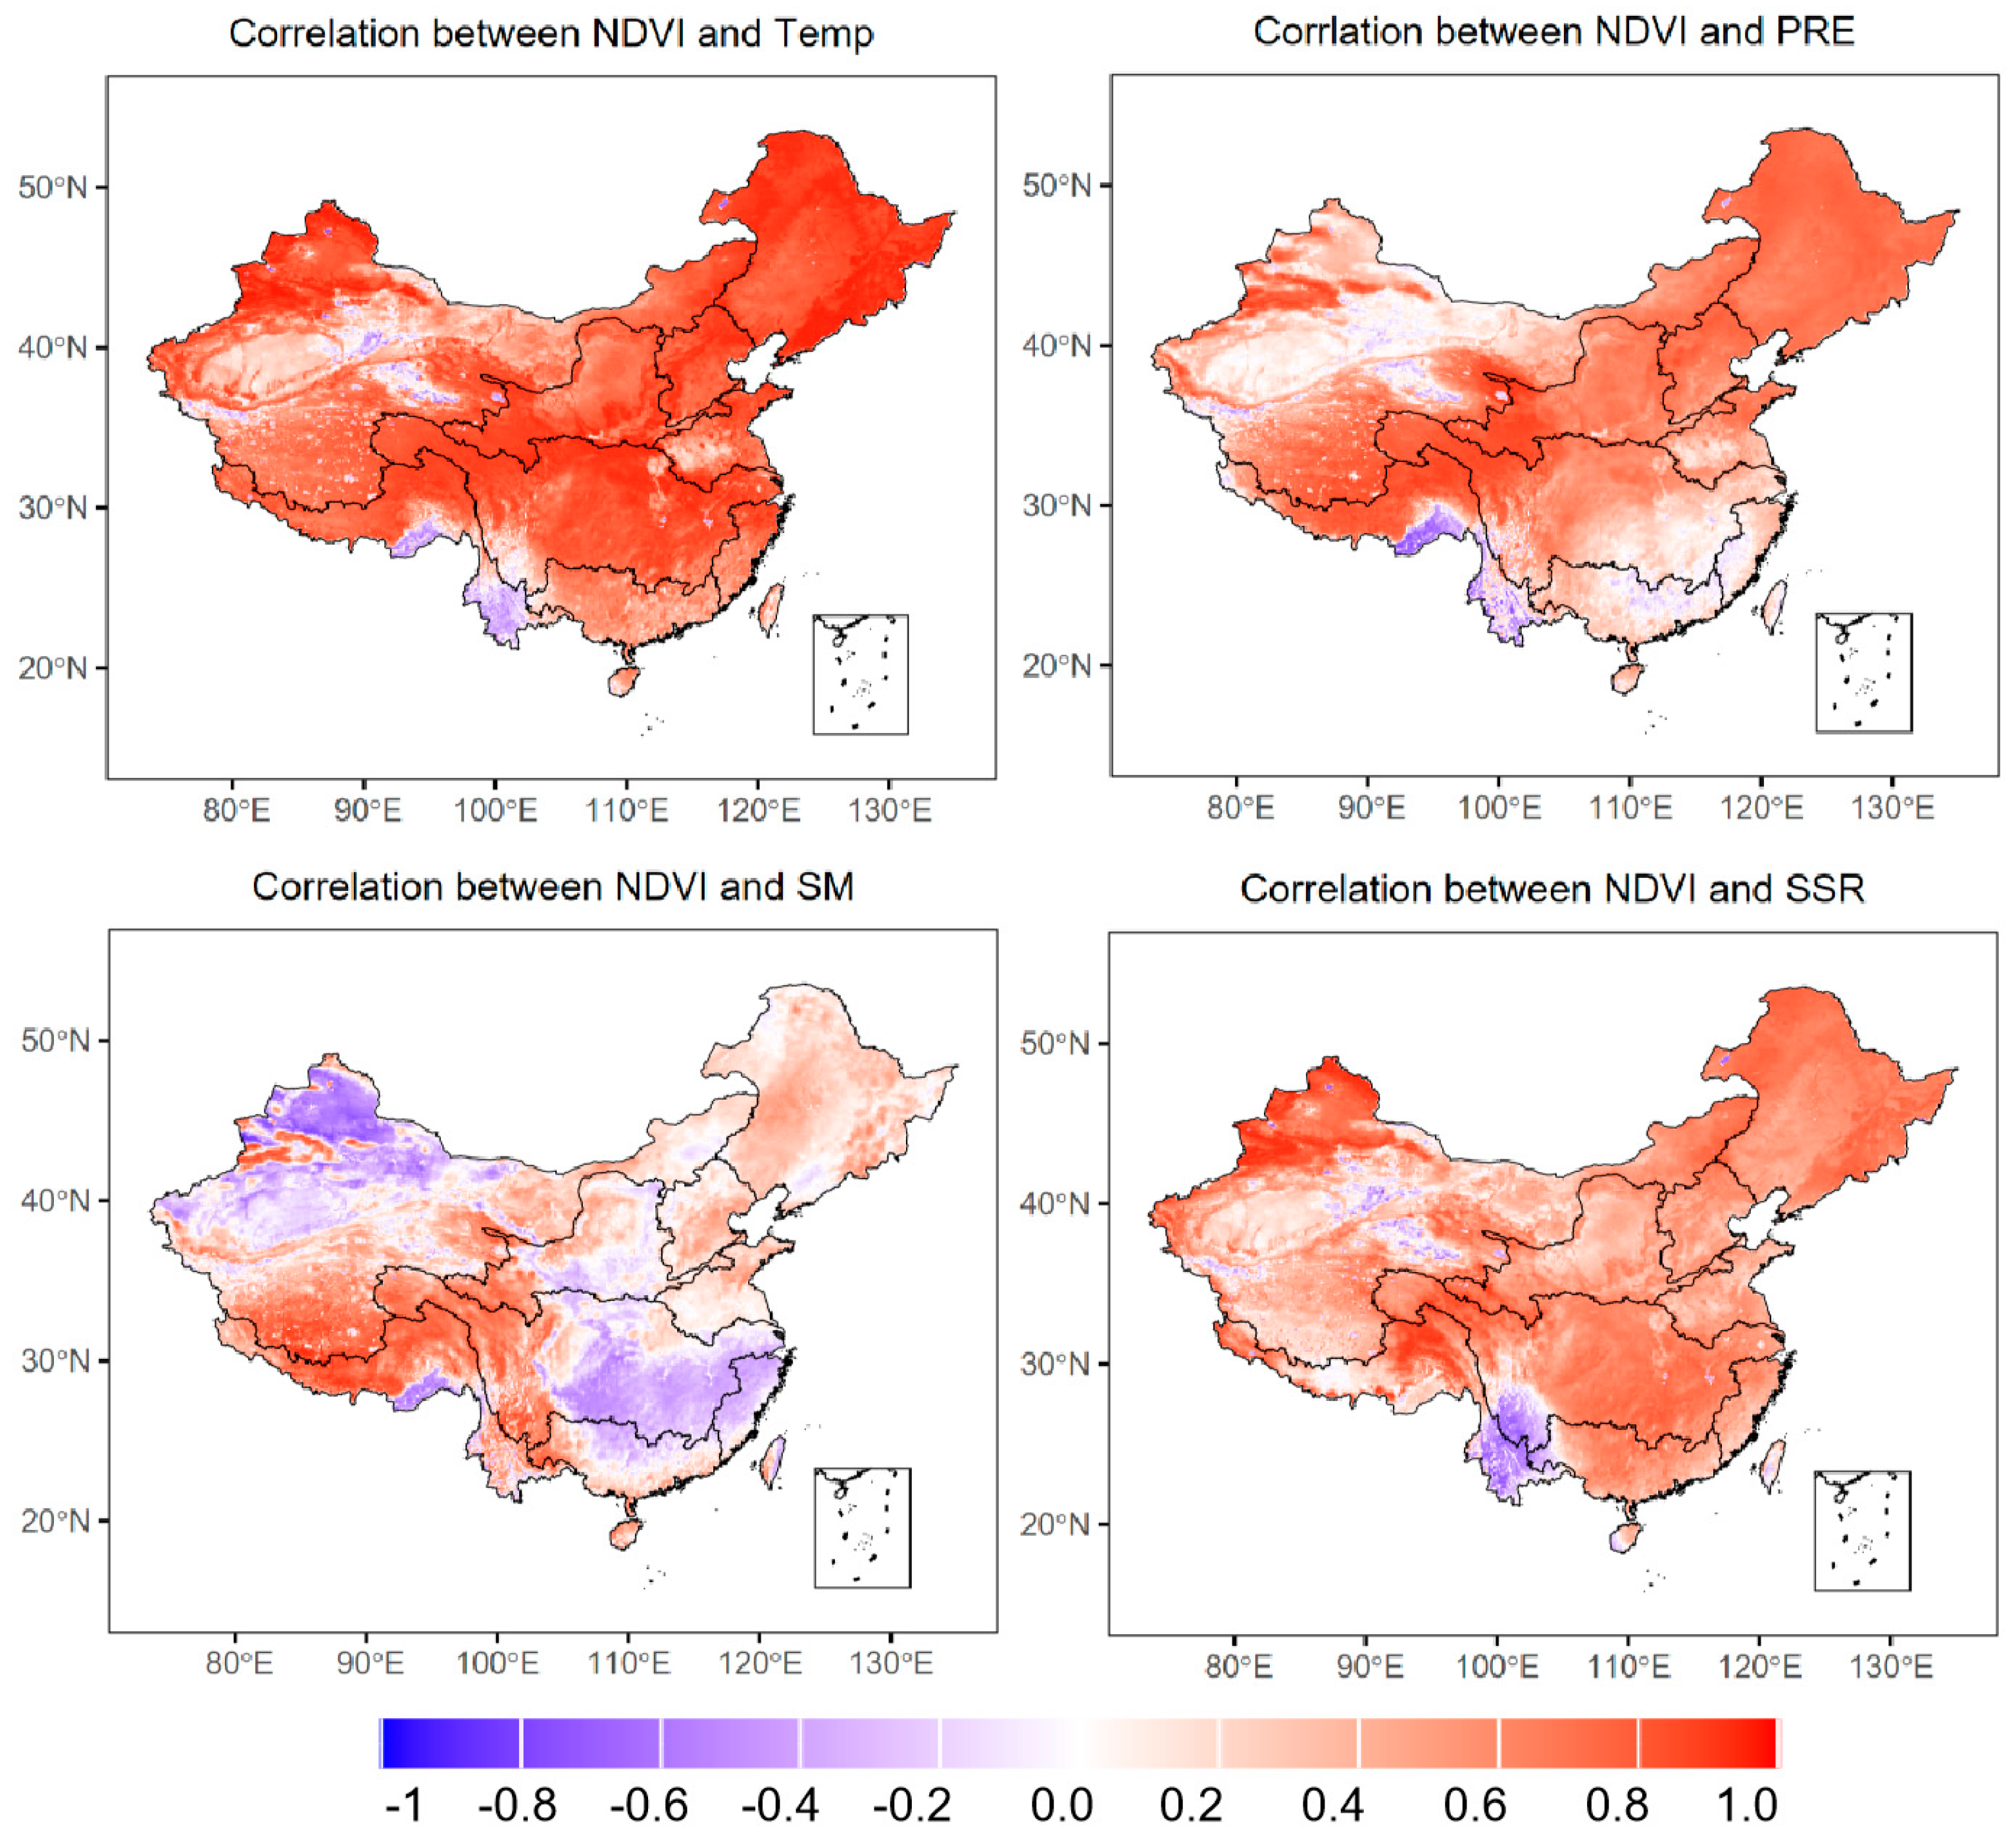
3.2. Correlation Between Climatic Factors and NDVI
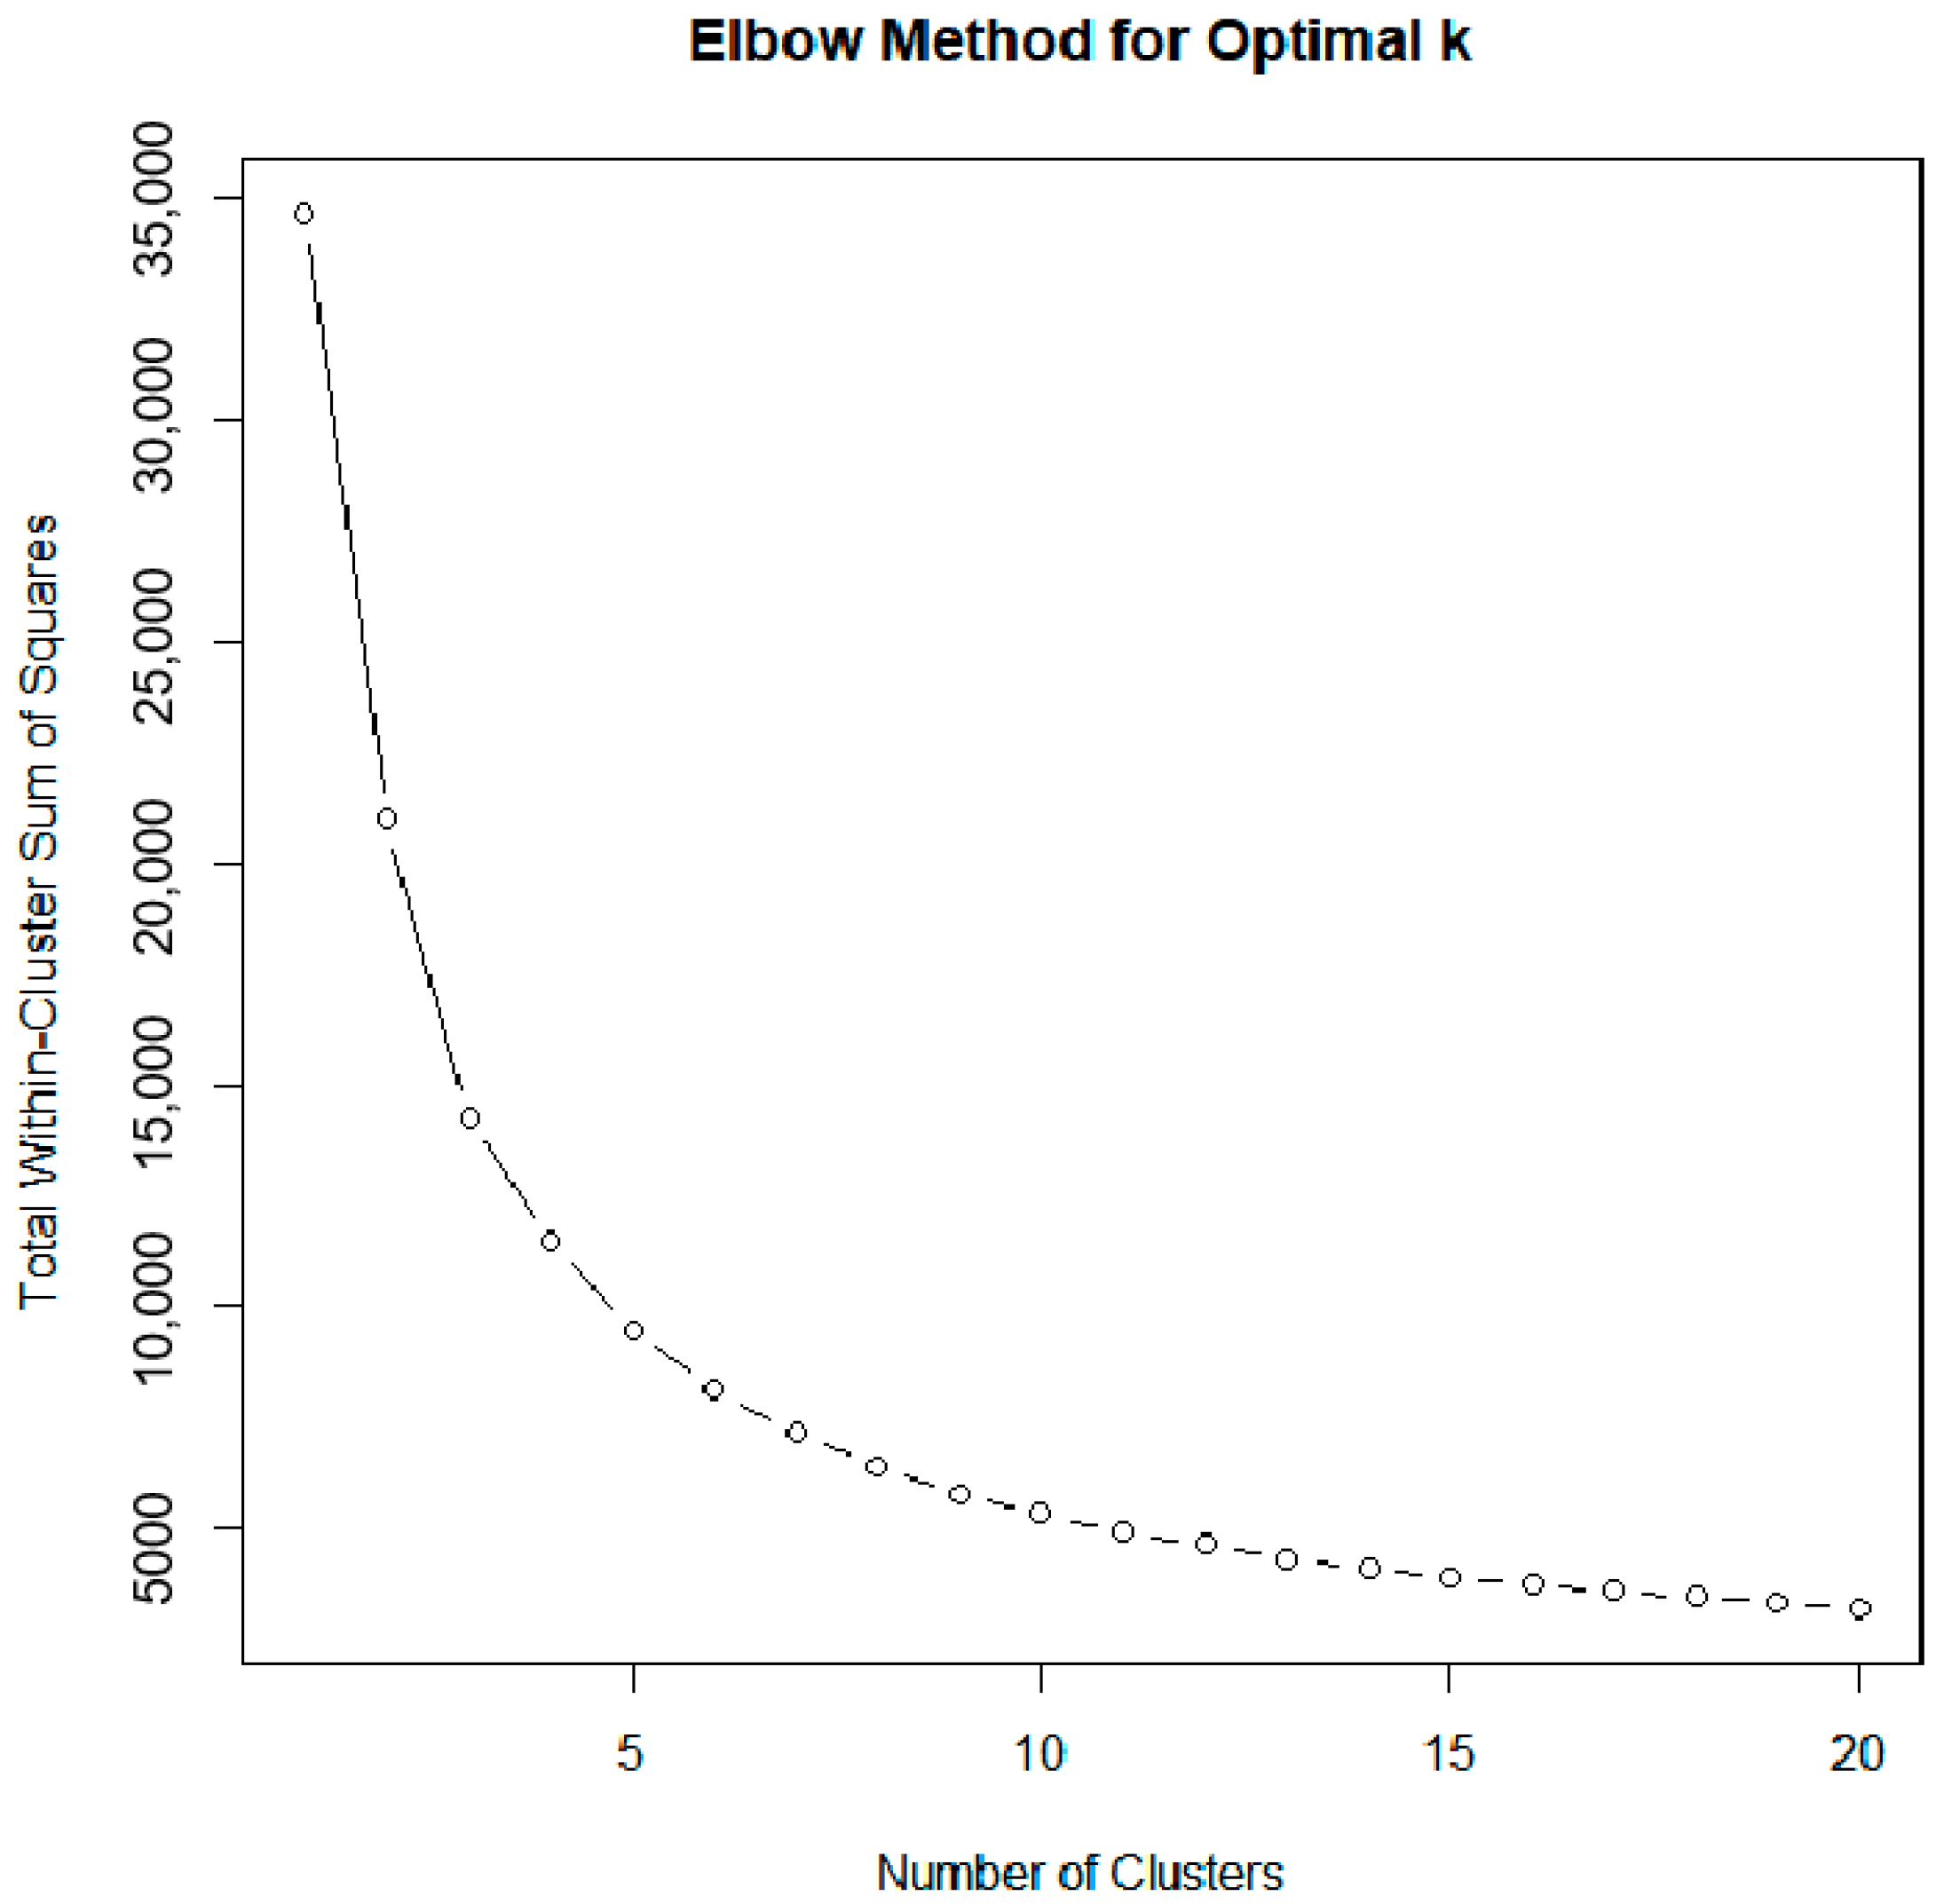
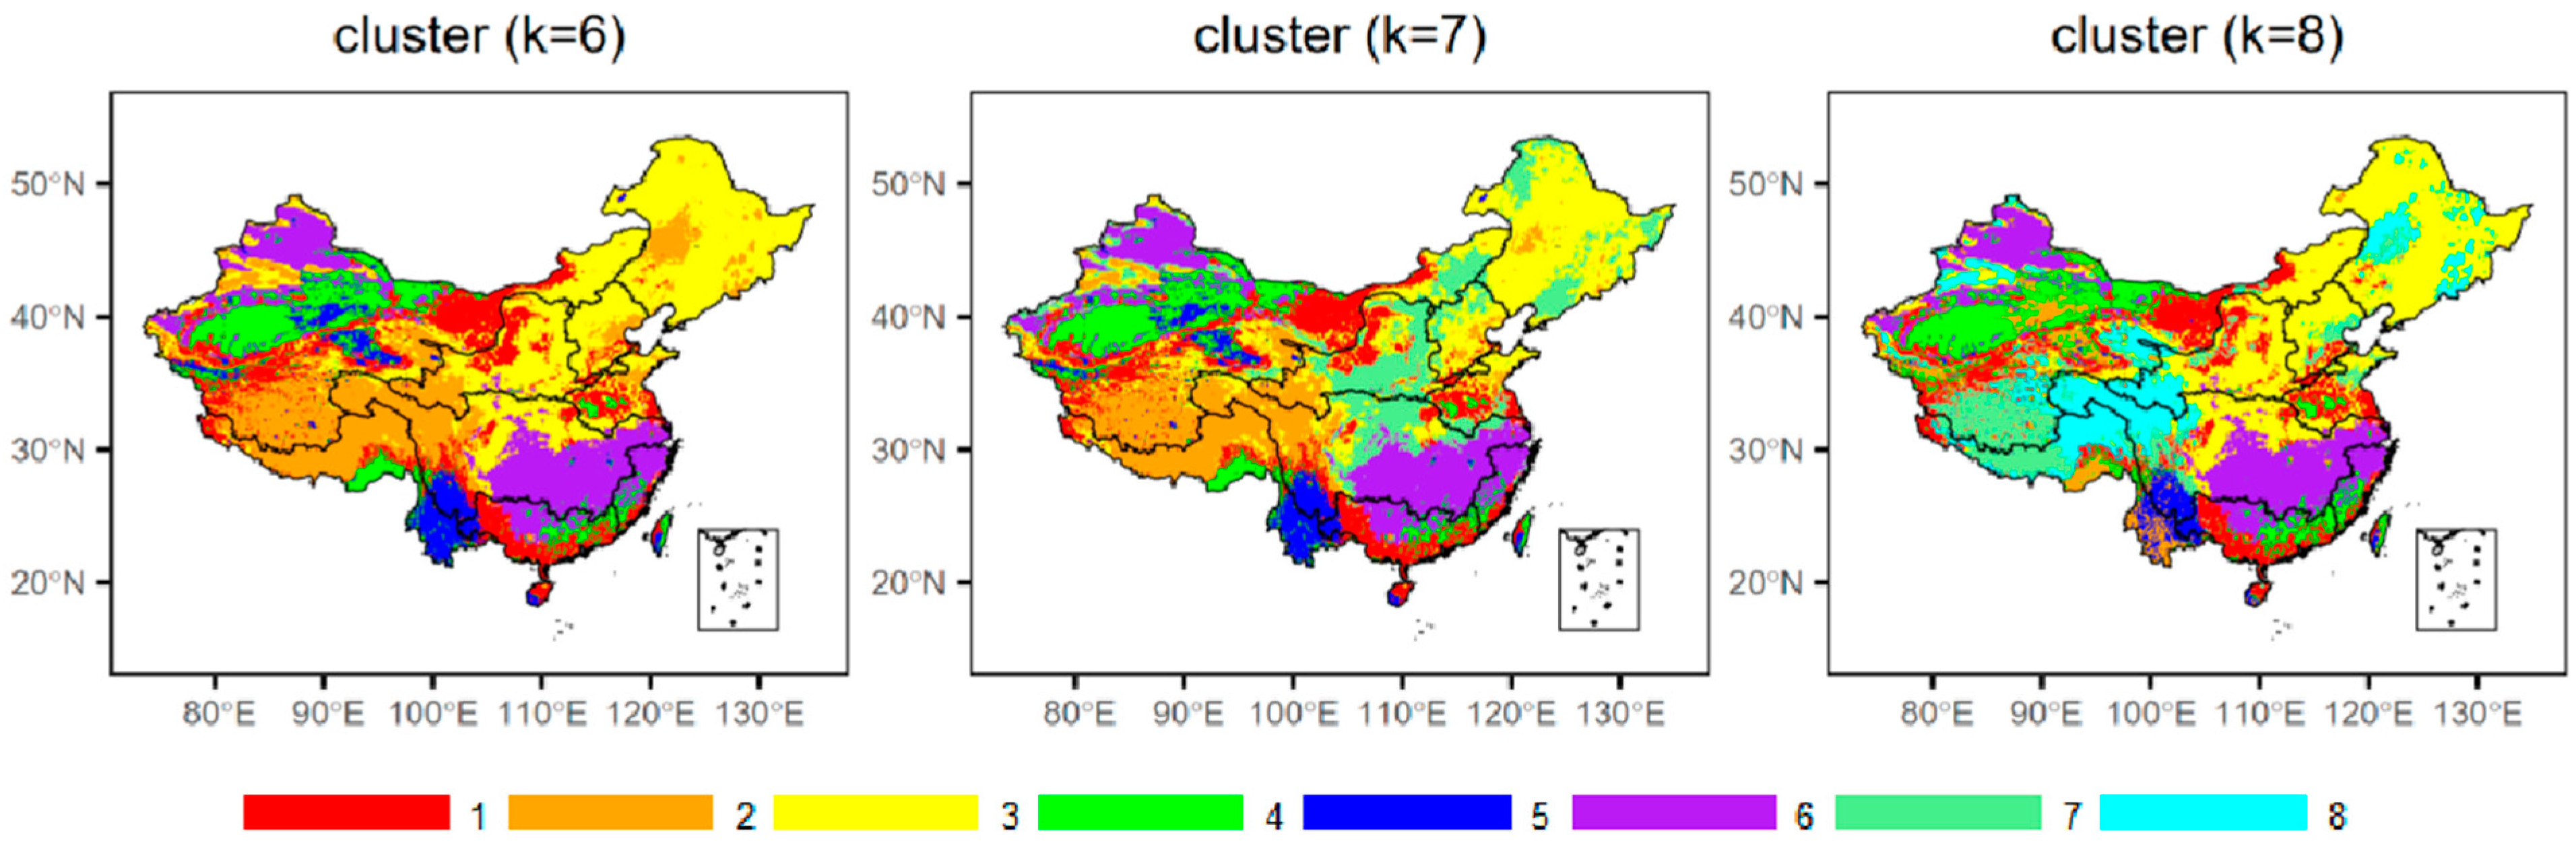
3.3. Clustering Analysis
3.4. Multivariate Joint Probability Analysis
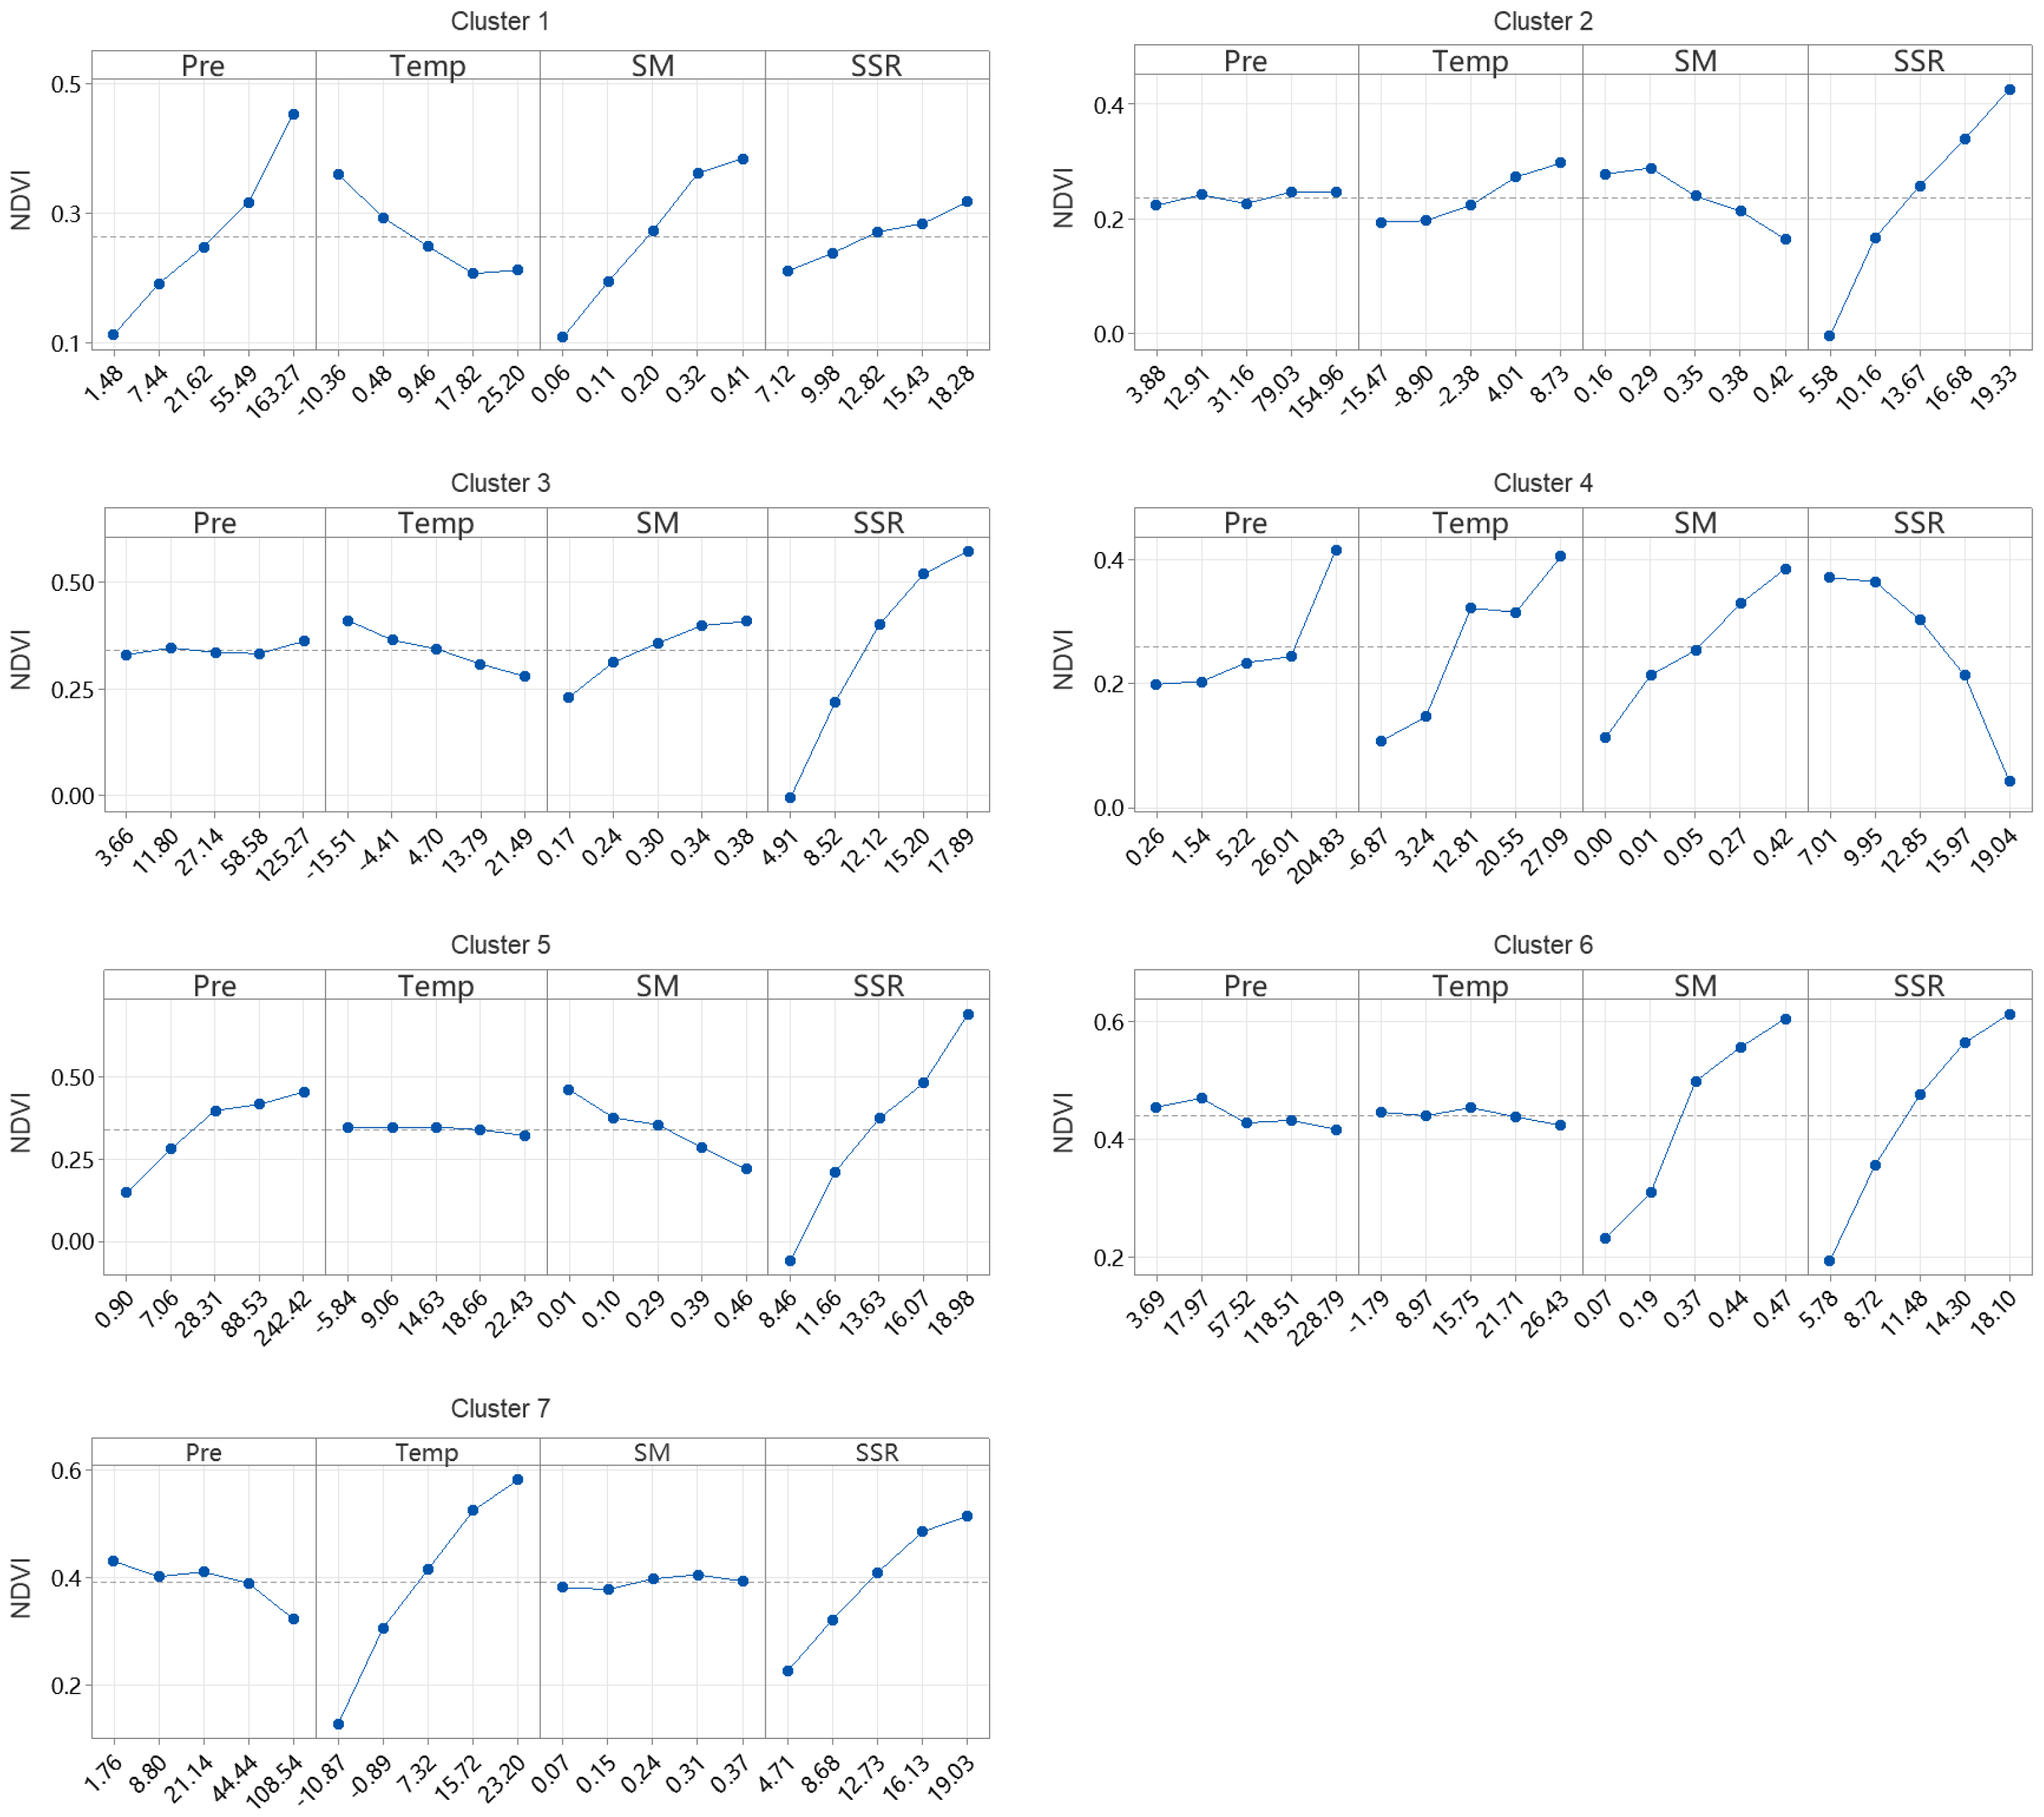
3.5. Main and Interactive Impacts of Climate Factors on NDVI
4. Conclusions
- (1)
- From 2000 to 2023, NDVI in China showed significant spatial variability, with low values (<0.1) covering 17.6% and high values (>0.8) covering 12.7% of the area. Rising temperatures impacted 99.2% of the regions, with 38.1% showing increases above 0.04 °C/year. NDVI improved significantly in 2.8% of the areas (e.g., Pearl River and Yangtze basins), while 1.4% showed a decline. Temperature had the strongest correlation with NDVI (0.66), followed by precipitation (0.46), net radiation (0.46), and soil moisture (0.14).
- (2)
- NDVI responses to climatic factors exhibit distinct spatial heterogeneity. Temperature emerges as the dominant driver in Clusters 2, 3, 6, and 7, primarily located in the Qinghai-Tibet Plateau, Songliao and Haihe River Basins, the middle and lower Yangtze River, and central China, respectively, where correlations with precipitation and solar radiation are also notable. In contrast, Clusters 4 (Tarim Basin and southern Qinghai-Tibet Plateau) and 5 (Yunnan-Guizhou Plateau) show weak or negative correlations with climatic variables, suggesting that non-climatic factors, such as land use, play a more significant role in these areas. This highlights the complex interplay between climatic and non-climatic factors influencing vegetation dynamics across diverse regions.
- (3)
- The analysis of joint probability distributions between NDVI and climate factors reveals significant spatial heterogeneity in dependency structures across clusters. Strong correlations are observed in Clusters 5 and 7, particularly between NDVI and precipitation (tau = 0.60 and tau = 0.52, respectively), while weaker dependencies are evident in Clusters 4 and 6. The types of copulas and correlation strengths highlight distinct interaction patterns, with Clusters 1, 3, and 5 showing more complex and varied dependency structures compared to the others. This underscores the diverse climatic influences on vegetation dynamics across regions.
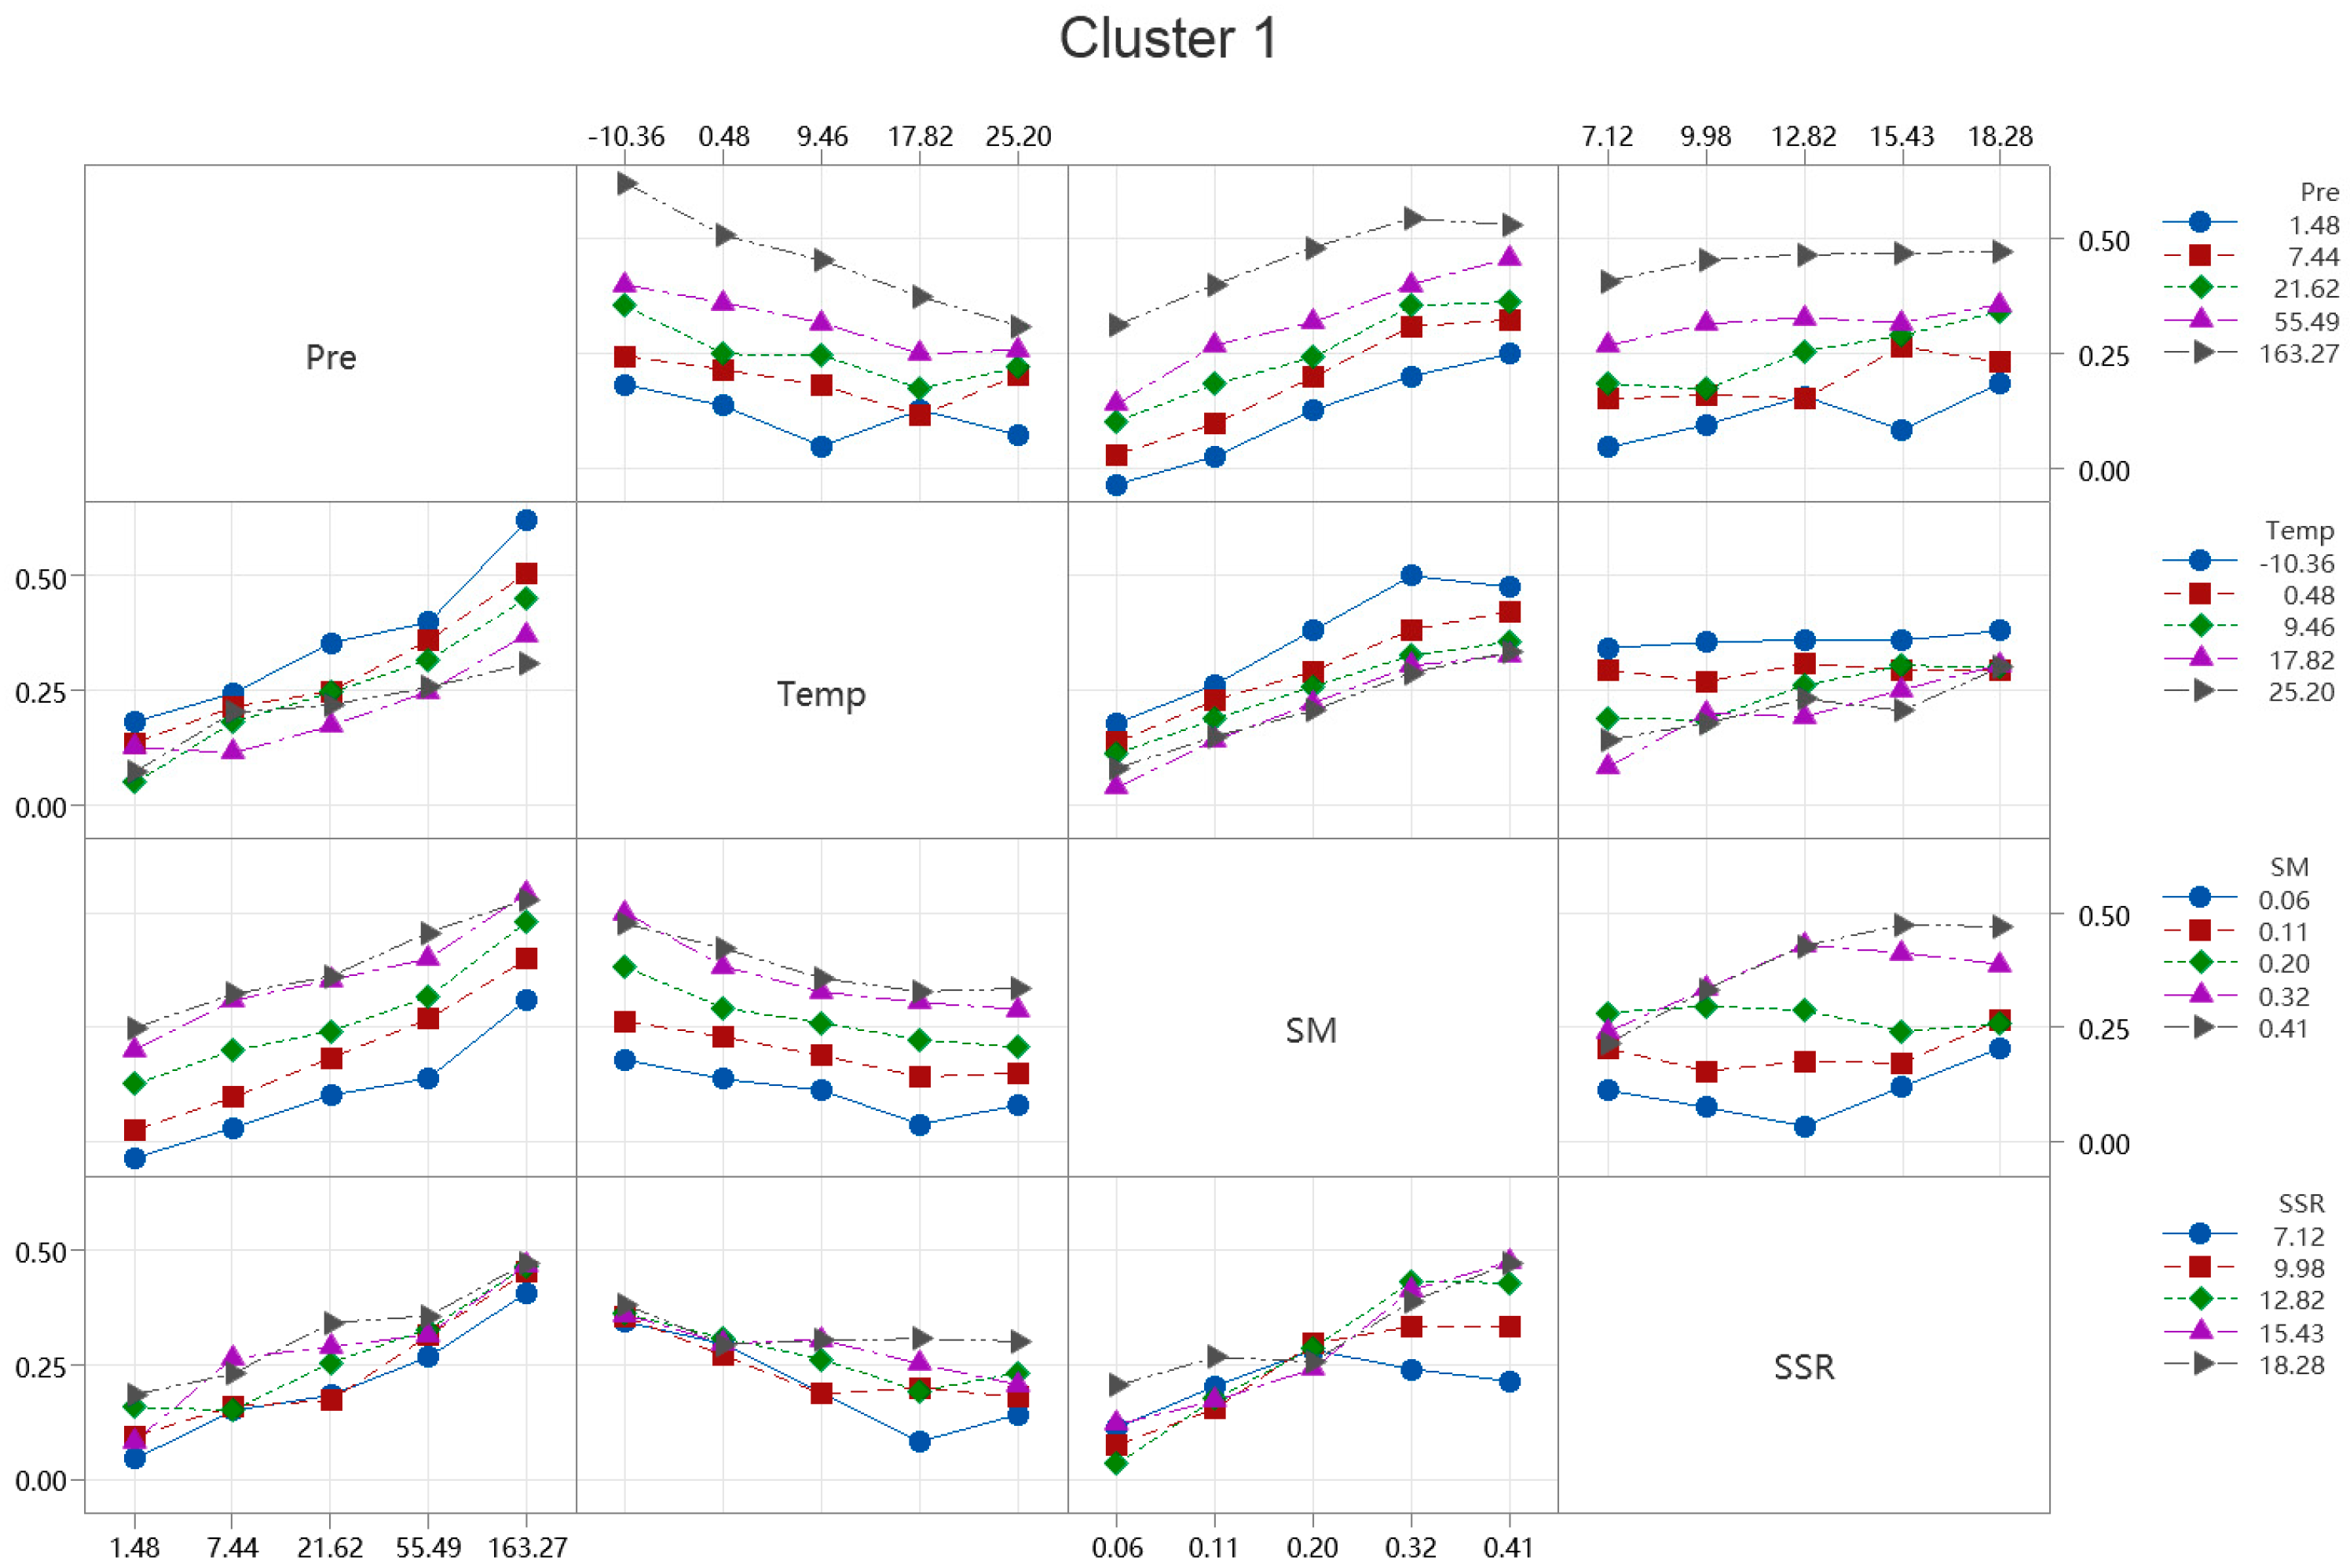
- (4)
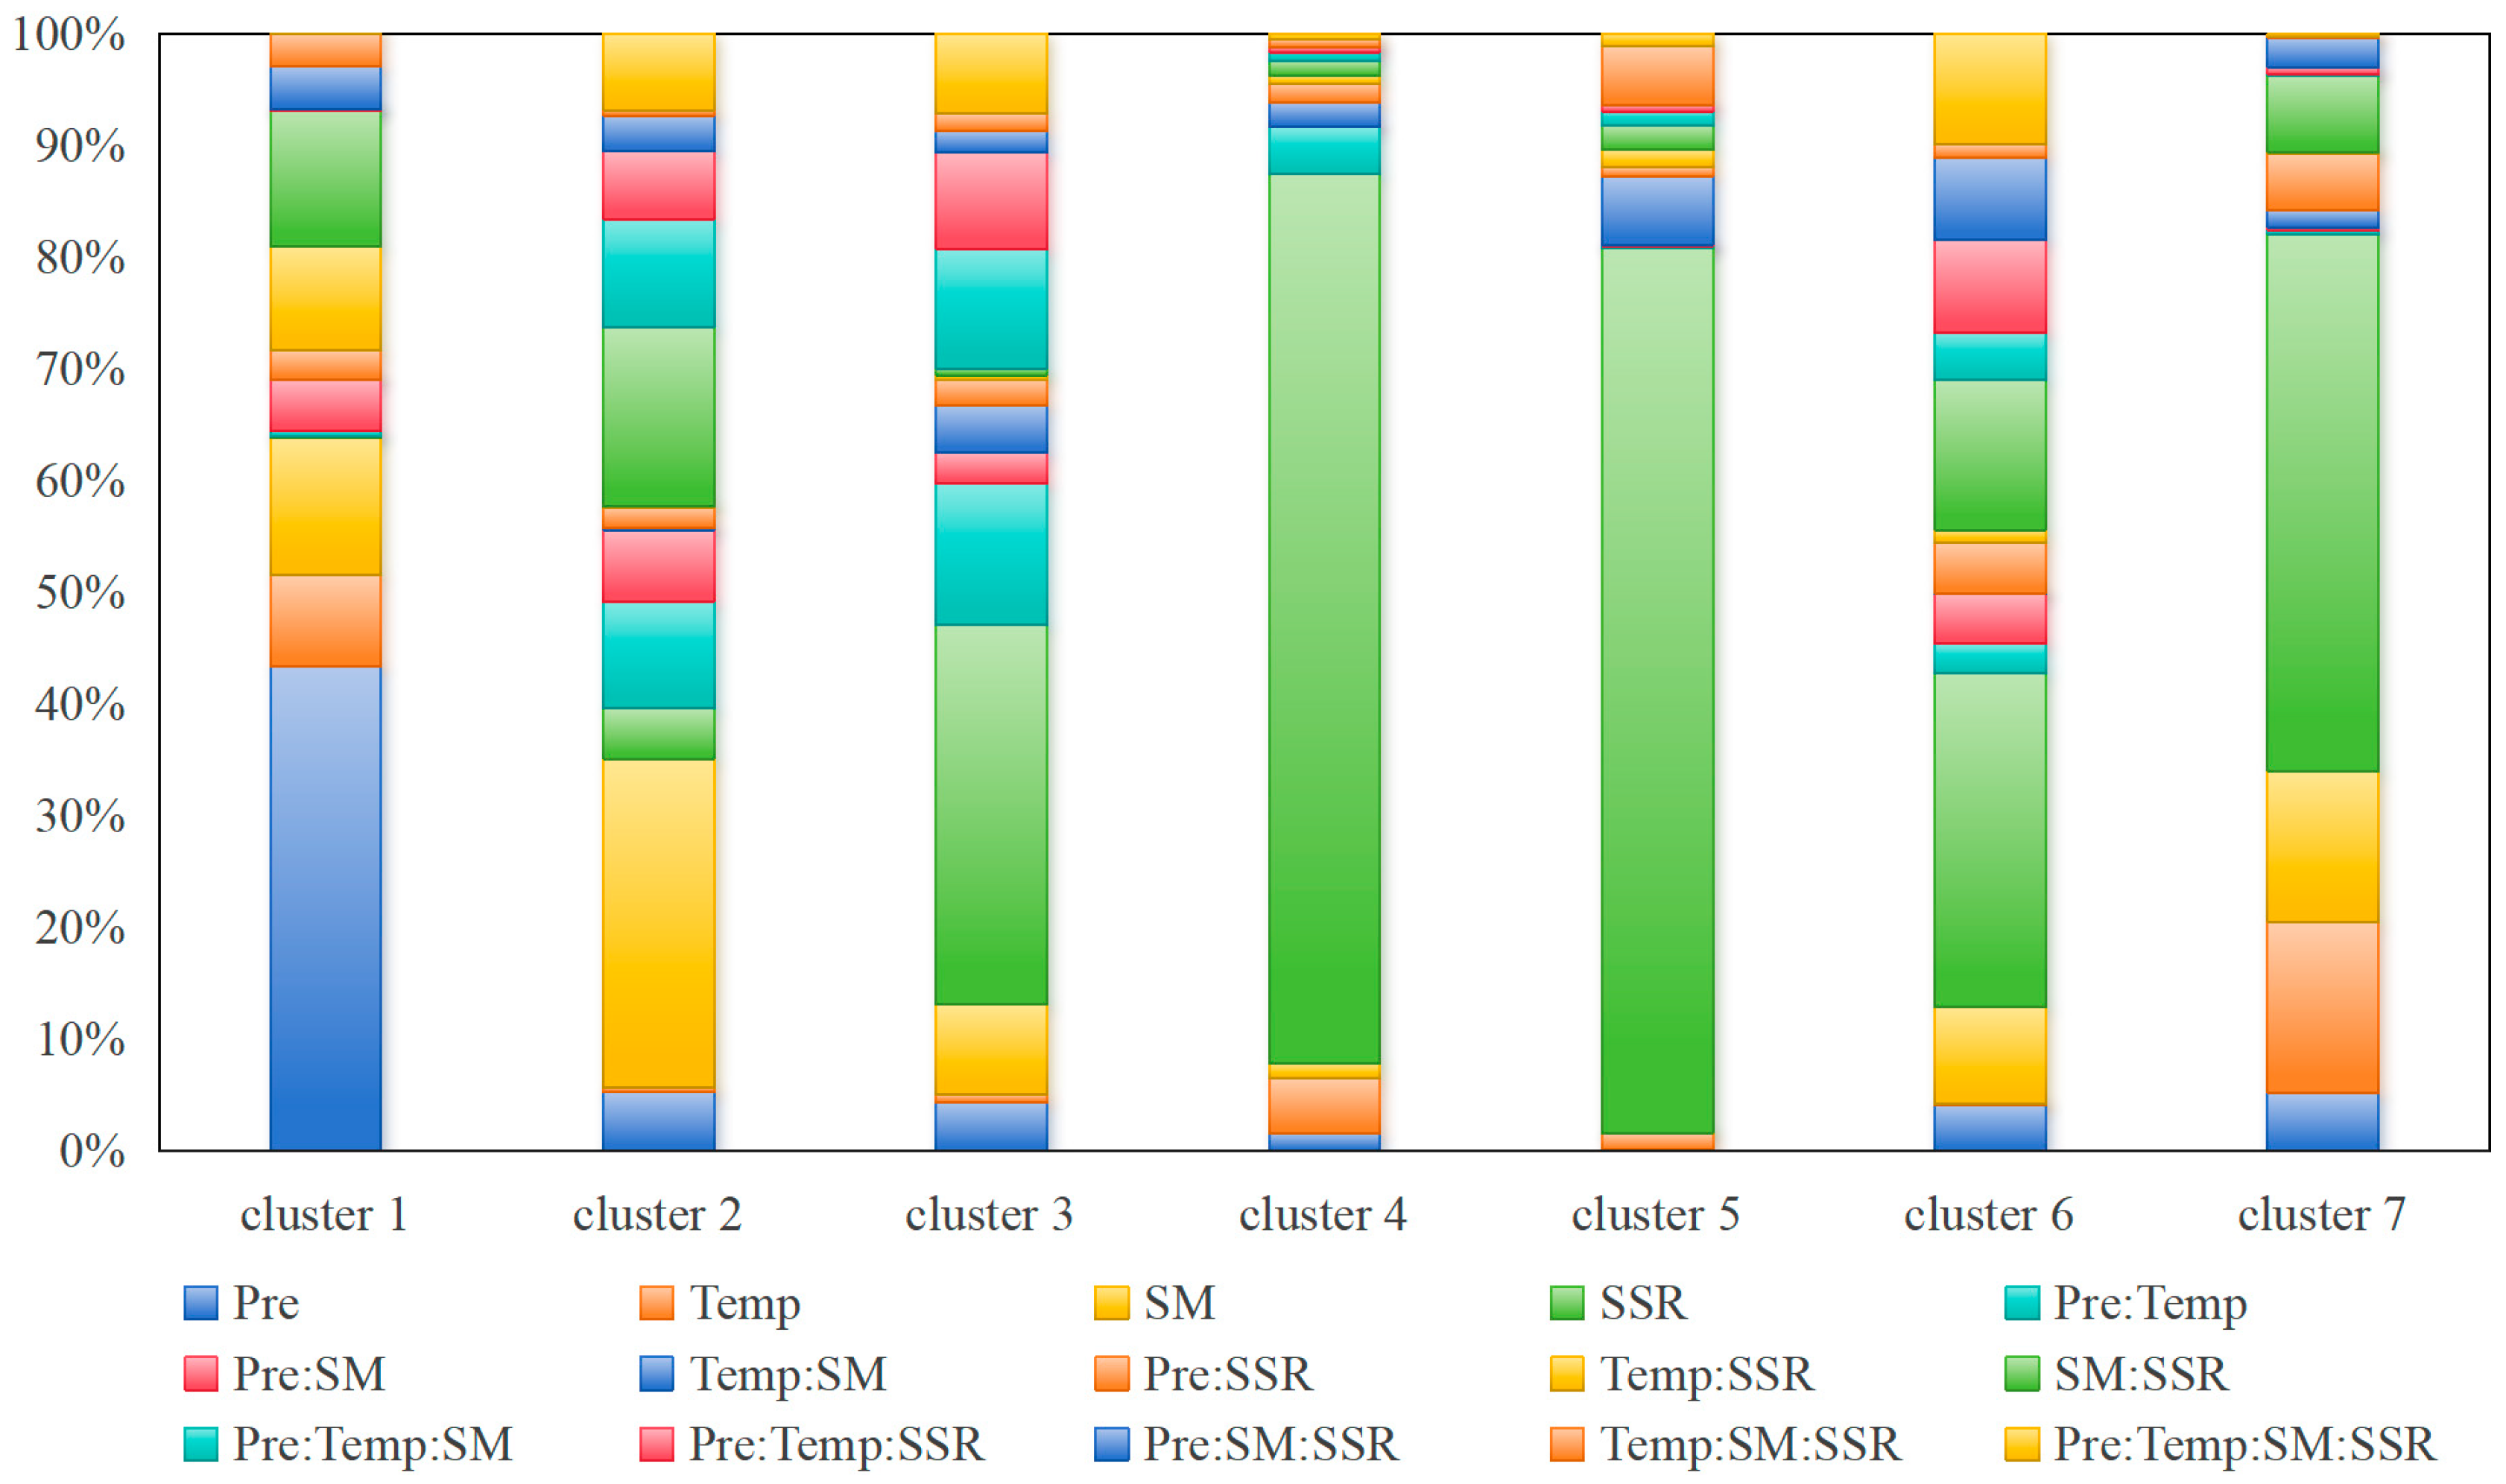
- The results of the multilevel factorial analysis reveal significant regional variations in the climate factors driving NDVI changes. In Cluster 1, precipitation is the dominant factor, contributing 43%, while in Cluster 7, its contribution is only 5%. Solar radiation is the primary driver in Clusters 4 and 5, contributing 80% and 79%, respectively. Soil moisture plays a key role in Cluster 2, with a contribution of 29%. Additionally, interactions between climate factors, such as Pre:Temp and Pre:Temp:SM, significantly influence NDVI variations, emphasizing the need for tailored regional management strategies.
Supplementary Materials
Author Contributions
Funding
Institutional Review Board Statement
Informed Consent Statement
Data Availability Statement
Conflicts of Interest
References
- Zhu, L.; Sun, S.; Li, Y.; Liu, X.; Hu, K. Effects of climate change and anthropogenic activity on the vegetation greening in the Liaohe River Basin of northeastern China. Ecol. Indic. 2023, 148, 110105. [Google Scholar] [CrossRef]
- Lawley, V.; Lewis, M.; Clarke, K.; Ostendorf, B. Site-based and remote sensing methods for monitoring indicators of vegetation condition: An Australian review. Ecol. Indic. 2016, 60, 1273–1283. [Google Scholar] [CrossRef]
- Shen, X.; Xue, Z.; Jiang, M.; Lu, X. Spatiotemporal Change of Vegetation Coverage and its Relationship with Climate Change in Freshwater Marshes of Northeast China. Wetlands 2019, 39, 429–439. [Google Scholar] [CrossRef]
- He, B.; Chen, A.; Wang, H.; Wang, Q. Dynamic Response of Satellite-Derived Vegetation Growth to Climate Change in the Three North Shelter Forest Region in China. Remote Sens. 2015, 7, 9998–10016. [Google Scholar] [CrossRef]
- Jiapaer, G.; Liang, S.; Yi, Q.; Liu, J. Vegetation dynamics and responses to recent climate change in Xinjiang using leaf area index as an indicator. Ecol. Indic. 2015, 58, 64–76. [Google Scholar] [CrossRef]
- Gao, Q.; Guo, Y.; Xu, H.; Ganjurjav, H.; Li, Y.; Wan, Y.; Qin, X.; Ma, X.; Liu, S. Climate change and its impacts on vegetation distribution and net primary productivity of the alpine ecosystem in the Qinghai-Tibetan Plateau. Sci. Total. Environ. 2016, 554, 34–41. [Google Scholar] [CrossRef]
- Riihimaki, H.; Heiskanen, J.; Luoto, M. The effect of topography on arctic-alpine aboveground biomass and NDVI patterns. Int. J. Appl. Earth Obs. Geoinf. 2017, 56, 44–53. [Google Scholar] [CrossRef]
- Guo, B.; Xu, M.; Zhang, R.; Luo, W.; Yang, J. What Are the Variation Patterns of Vegetation and Its Influencing Factors in China from 2000–2020 from the Partition Perspective? Forests 2024, 15, 1409. [Google Scholar] [CrossRef]
- Fan, J.; Zhao, Y.; Wang, D.; Zhou, X.; Li, Y.; Zhang, W.; Xu, F.; Wei, S. A Stepwise Multifactor Regression Analysis of the Interactive Effects of Multiple Climate Factors on the Response of Vegetation Recovery to Drought. Atmosphere 2024, 15, 1094. [Google Scholar] [CrossRef]
- Lamchin, M.; Park, T.; Lee, J.-Y.; Lee, W.-K. Monitoring of Vegetation Dynamics in the Mongolia Using MODIS NDVIs and their Relationship to Rainfall by Natural Zone. J. Indian Soc. Remote Sens. 2015, 43, 325–337. [Google Scholar] [CrossRef]
- Pettorelli, N.; Vik, J.O.; Mysterud, A.; Gaillard, J.-M.; Tucker, C.J.; Stenseth, N.C. Using the satellite-derived NDVI to assess ecological responses to environmental change. Trends Ecol. Evol. 2005, 20, 503–510. [Google Scholar] [CrossRef] [PubMed]
- Sun, W.; Wang, Y.; Fu, Y.H.; Xue, B.; Wang, G.; Yu, J.; Zuo, D.; Xu, Z. Spatial heterogeneity of changes in vegetation growth and their driving forces based on satellite observations of the Yarlung Zangbo River Basin in the Tibetan Plateau. J. Hydrol. 2019, 574, 324–332. [Google Scholar] [CrossRef]
- Yuan, X.; Li, L.; Chen, X. Increased grass NDVI under contrasting trends of precipitation change over North China during 1982–2011. Remote Sens. Lett. 2015, 6, 69–77. [Google Scholar] [CrossRef]
- Peng, J.; Dong, W.; Yuan, W.; Zhang, Y. Responses of grassland and forest to temperature and precipitation changes in Northeast China. Adv. Atmos. Sci. 2012, 29, 1063–1077. [Google Scholar] [CrossRef]
- Wang, H.; Li, Z.; Cao, L.; Feng, R.; Pan, Y. Response of NDVI of natural vegetation to climate changes and drought in China. Land 2021, 10, 966. [Google Scholar] [CrossRef]
- Feng, X.; Tian, J.; Wang, Y.; Wu, J.; Liu, J.; Ya, Q.; Li, Z. Spatio-Temporal Variation and Climatic Driving Factors of Vegetation Coverage in the Yellow River Basin from 2001 to 2020 Based on kNDVI. Forests 2023, 14, 620. [Google Scholar] [CrossRef]
- Deng, Q.; Zhang, C.; Dong, J.; Li, Y.; Li, Y.; Huang, Y.; Zhang, H.; Fan, J. Variations over 20 Years in Vegetation Dynamics and Its Coupled Responses to Individual and Compound Meteorological Drivers in Sichuan Province, China. Atmosphere 2024, 15, 1384. [Google Scholar] [CrossRef]
- Kushwaha, A.; Bhatnagar, R.; Kumar, P.; Zucca, C.; Srivastava, S. Ajai Long Term Monitoring of Ecological Status of Major Deserts of the World. J. Indian Soc. Remote Sens. 2024, 52, 1819–1839. [Google Scholar] [CrossRef]
- Guo, J.; Wang, K.; Wang, T.; Bai, N.; Zhang, H.; Cao, Y.; Liu, H. Spatiotemporal Variation of Vegetation NDVI and Its Climatic Driving Forces in Global Land Surface. Pol. J. Environ. Stud. 2022, 31, 3541–3549. [Google Scholar] [CrossRef]
- Ichii, K.; Kawabata, A.; Yamaguchi, Y. Global correlation analysis for NDVI and climatic variables and NDVI trends: 1982-1990. Int. J. Remote Sens. 2002, 23, 3873–3878. [Google Scholar] [CrossRef]
- Bao, Z.; Zhang, J.; Wang, G.; Guan, T.; Jin, J.; Liu, Y.; Li, M.; Ma, T. The sensitivity of vegetation cover to climate change in multiple climatic zones using machine learning algorithms. Ecol. Indic. 2021, 124, 107443. [Google Scholar] [CrossRef]
- Xu, Y.; Yang, J.; Chen, Y. NDVI-based vegetation responses to climate change in an arid area of China. Theor. Appl. Climatol. 2016, 126, 213–222. [Google Scholar] [CrossRef]
- Fensholt, R.; Proud, S.R. Evaluation of Earth Observation based global long term vegetation trends—Comparing GIMMS and MODIS global NDVI time series. Remote Sens. Environ. 2012, 119, 131–147. [Google Scholar] [CrossRef]
- Liu, L.; Niu, Q.; Heng, J.; Li, H.; Xu, Z. Transition Characteristics of the Dry-Wet Regime and Vegetation Dynamic Responses over the Yarlung Zangbo River Basin, Southeast Qinghai-Tibet Plateau. Remote Sens. 2019, 11, 1254. [Google Scholar] [CrossRef]
- Wang, F.; Huang, G.; Cheng, G.; Li, Y. Impacts of climate variations on non-stationarity of streamflow over Canada. Environ. Res. 2021, 197, 111118. [Google Scholar] [CrossRef]
- Peng, J.; Liu, Z.; Liu, Y.; Wu, J.; Han, Y. Trend analysis of vegetation dynamics in Qinghai bet Plateau using Hurst Exponent. Ecol. Indic. 2012, 14, 28–39. [Google Scholar] [CrossRef]
- Mann, H.B. Nonparametric tests against trend. Econom. J. Econom. Soc. 1945, 13, 245–259. [Google Scholar] [CrossRef]
- Shi, P.; Hou, P.; Gao, J.; Wan, H.; Wang, Y.; Sun, C. Spatial-Temporal Variation Characteristics and Influencing Factors of Vegetation in the Yellow River Basin from 2000 to 2019. Atmosphere 2021, 12, 1576. [Google Scholar] [CrossRef]
- Ahlgren, P.; Jarneving, B.; Rousseau, R. Requirements for a cocitation similarity measure, with special reference to Pearson’s correlation coefficient. J. Am. Soc. Inf. Sci. Technol. 2003, 54, 550–560. [Google Scholar] [CrossRef]
- Chen, L.; Qiu, H.; Zhang, J.; Singh, V.P.; Zhou, J.; Huang, K. Copula-based method for stochastic daily streamflow simulation considering lag-2 autocorrelation. J. Hydrol. 2019, 578, 123938. [Google Scholar] [CrossRef]
- Sklar, M. Fonctions de Répartition à n Dimensions et Leurs Marges; Publications de l’Institut de Statistique de l’Université de Paris: Paris, France, 1959; Volume 8, pp. 229–231. Available online: https://hal.science/hal-04094463/document (accessed on 30 December 2024).
- Brechmann, E.C.; Schepsmeier, U. Modeling dependence with C-and D-vine copulas: The R package CDVine. J. Stat. Softw. 2013, 52, 1–27. [Google Scholar] [CrossRef]
- Nelsen, R.B. An Introduction to Copulas; Springer: Berlin/Heidelberg, Germany, 2006. [Google Scholar]
- Aas, K.; Czado, C.; Frigessi, A.; Bakken, H. Pair-copula constructions of multiple dependence. Insur. Math. Econ. 2009, 44, 182–198. [Google Scholar] [CrossRef]
- Wang, F.; Huang, G.; Cheng, G.; Li, Y. Multi-level factorial analysis for ensemble data-driven hydrological prediction. Adv. Water Resour. 2021, 153, 103948. [Google Scholar] [CrossRef]
- Zhang, J.; Li, Y.; Huang, G.; Chen, X.; Bao, A. Assessment of parameter uncertainty in hydrological model using a Markov-Chain-Monte-Carlo-based multilevel-factorial-analysis method. J. Hydrol. 2016, 538, 471–486. [Google Scholar] [CrossRef]
- Liu, J.; Li, Y.; Huang, G.; Fu, H.; Zhang, J.; Cheng, G. Identification of water quality management policy of watershed system with multiple uncertain interactions using a multi-level-factorial risk-inference-based possibilistic-probabilistic programming approach. Environ. Sci. Pollut. Res. 2017, 24, 14980–15000. [Google Scholar] [CrossRef]
- Jin, H.; Chen, X.; Wang, Y.; Zhong, R.; Zhao, T.; Liu, Z.; Tu, X. Spatio-temporal distribution of NDVI and its influencing factors in China. J. Hydrol. 2021, 603, 127129. [Google Scholar] [CrossRef]
- Chen, S.; Zhu, Z.; Liu, X.; Yang, L. Variation in Vegetation and Its Driving Force in the Pearl River Delta Region of China. Int. J. Environ. Res. Public Health 2022, 19, 10343. [Google Scholar] [CrossRef]
- Wang, Y.; Yang, J.; Chen, Y.; Wang, A.; De Maeyer, P. The spatiotemporal response of soil moisture to precipitation and temperature changes in an arid region, China. Remote Sens. 2018, 10, 468. [Google Scholar] [CrossRef]
- Adhikari, S.; Zhou, W.; Dou, Z.; Sakib, N.; Ma, R.; Chaudhari, B.; Liu, B. Analysis of Flash Drought and Its Impact on Forest Normalized Difference Vegetation Index (NDVI) in Northeast China from 2000 to 2020. Atmosphere 2024, 15, 818. [Google Scholar] [CrossRef]
- Liang, J.; Marino, A.; Ji, Y. Spatial and Temporal Change Characteristics and Climatic Drivers of Vegetation Productivity and Greenness during the 2001–2020 Growing Seasons on the Qinghai–Tibet Plateau. Land 2024, 13, 1230. [Google Scholar] [CrossRef]
- Liu, B.; Tang, Q.; Zhou, Y.; Zeng, T.; Zhou, T. The sensitivity of vegetation dynamics to climate change across the Tibetan Plateau. Atmosphere 2022, 13, 1112. [Google Scholar] [CrossRef]
- Tuoku, L.; Wu, Z.; Men, B. Impacts of climate factors and human activities on NDVI change in China. Ecol. Inform. 2024, 81, 102555. [Google Scholar] [CrossRef]


| Cluster | Grids | Correlation | |||
|---|---|---|---|---|---|
| NDVI_PRE | NDVI_temp | NDVI_SM | NDVI_SSR | ||
| 1 | 13,861 | 0.34 | 0.53 | 0.25 | 0.34 |
| 2 | 14,816 | 0.75 | 0.78 | 0.66 | 0.50 |
| 3 | 22,368 | 0.67 | 0.83 | 0.26 | 0.58 |
| 4 | 9951 | −0.02 | 0.22 | −0.16 | 0.19 |
| 5 | 4351 | 0.02 | −0.08 | 0.29 | −0.34 |
| 6 | 13,550 | 0.21 | 0.76 | −0.35 | 0.63 |
| 7 | 15,452 | 0.63 | 0.85 | −0.05 | 0.60 |
| Variable | Cluster | Best Distribution | ||||
|---|---|---|---|---|---|---|
| Distribution | Parameter 1 | Parameter 2 | Parameter 3 | AIC | ||
| Pre | 1 | weibull | 0.66 | 41.38 | 38,690,562 | |
| 2 | weibull | 0.84 | 54.46 | 43,191,866 | ||
| 3 | weibull | 0.86 | 45.32 | 62,787,189 | ||
| 4 | lnorm | 1.84 | 2.46 | 23,837,431 | ||
| 5 | gamma | 0.46 | 0.01 | 12,739,921 | ||
| 6 | gamma | 0.69 | 0.01 | 42,593,873 | ||
| 7 | weibull | 0.92 | 57.61 | 45,257,797 | ||
| Temp | 1 | norm | 8.26 | 13.30 | 31,988,424 | |
| 2 | norm | −2.48 | 9.78 | 31,571,090 | ||
| 3 | norm | 3.98 | 13.63 | 51,940,211 | ||
| 4 | norm | 11.20 | 12.91 | 22,793,974 | ||
| 5 | norm | 11.75 | 11.03 | 9,572,931 | ||
| 6 | norm | 14.01 | 10.89 | 29,714,144 | ||
| 7 | norm | 7.43 | 12.42 | 35,034,085 | ||
| SM | 1 | gev | 0.16 | 0.12 | −0.15 | −4,794,577 |
| 2 | norm | 0.33 | 0.11 | −6,838,286 | ||
| 3 | weibull | 3.81 | 0.32 | −13,644,125 | ||
| 4 | gev | 0.02 | 0.03 | 1.54 | −5,617,783 | |
| 5 | gev | 0.19 | 0.17 | −0.35 | −967,188 | |
| 6 | gev | 0.26 | 0.15 | −0.41 | −3,850,709 | |
| 7 | norm | 0.30 | 0.08 | −9,587,875 | ||
| SSR | 1 | weibull | 3.40 | 14,261,850 | 133,042,777 | |
| 2 | weibull | 2.90 | 14,750,970 | 143,785,235 | ||
| 3 | weibull | 2.71 | 13,394,100 | 216,392,921 | ||
| 4 | weibull | 3.19 | 14,508,090 | 95,899,561 | ||
| 5 | weibull | 3.95 | 15,196,820 | 41,596,235 | ||
| 6 | weibull | 2.79 | 13,110,040 | 130,645,643 | ||
| 7 | weibull | 2.80 | 13,487,380 | 149,190,738 | ||
| NDVI | 1 | norm | 2719 | 2565 | 73,998,890 | |
| 2 | norm | 2458 | 1919 | 76,622,522 | ||
| 3 | norm | 3479 | 2462 | 118,890,433 | ||
| 4 | norm | 2285 | 2904 | 53,837,734 | ||
| 5 | norm | 3897 | 3173 | 23,762,261 | ||
| 6 | norm | 4315 | 2681 | 72,684,188 | ||
| 7 | norm | 3963 | 2454 | 80,442,517 | ||
| Tree | Edge | Copula | Par1 | Par2 | Tau | |
|---|---|---|---|---|---|---|
| Cluster 1 | 1 | 1, 2 | t | 0.66 | 27.95 | 0.46 |
| 1 | 2, 4 | t | 0.75 | 29.84 | 0.54 | |
| 1 | 4, 5 | C270 | −0.28 | 0.00 | −0.12 | |
| 1 | 5, 3 | N | 0.55 | 0.00 | 0.37 | |
| 2 | 1, 4; 2 | F | 3.56 | 0.00 | 0.35 | |
| 2 | 2, 5; 4 | F | 3.11 | 0.00 | 0.32 | |
| 2 | 4, 3; 5 | SC | 0.71 | 0.00 | 0.26 | |
| 3 | 1, 5; 2, 4 | SG | 1.04 | 0.00 | 0.04 | |
| 3 | 2, 3; 4, 5 | G | 1.26 | 0.00 | 0.21 | |
| 4 | 1, 3; 2, 4, 5 | N | 0.56 | 0.00 | 0.38 | |
| Cluster 2 | 1 | 1, 3 | N | 0.58 | 0.00 | 0.39 |
| 1 | 3, 5 | SG | 1.86 | 0.00 | 0.46 | |
| 1 | 5, 4 | C90 | −0.23 | 0.00 | −0.10 | |
| 1 | 4, 2 | F | 3.08 | 0.00 | 0.31 | |
| 2 | 1, 5; 3 | C270 | −0.83 | 0.00 | −0.29 | |
| 2 | 3, 4; 5 | C | 0.46 | 0.00 | 0.19 | |
| 2 | 5, 2; 4 | F | 3.71 | 0.00 | 0.37 | |
| 3 | 1, 4; 3, 5 | F | 2.71 | 0.00 | 0.28 | |
| 3 | 3, 2; 5, 4 | F | 4.90 | 0.00 | 0.45 | |
| 4 | 1, 2; 3, 5, 4 | F | 0.48 | 0.00 | 0.05 | |
| Cluster 3 | 1 | 1, 3 | SG | 1.95 | 0.00 | 0.49 |
| 1 | 3, 4 | C90 | −0.07 | 0.00 | −0.04 | |
| 1 | 4, 5 | C270 | −0.17 | 0.00 | −0.08 | |
| 1 | 5, 2 | F | 3.32 | 0.00 | 0.33 | |
| 2 | 1, 4; 3 | SG | 1.47 | 0.00 | 0.32 | |
| 2 | 3, 5; 4 | SG | 2.02 | 0.00 | 0.51 | |
| 2 | 4, 2; 5 | F | 4.02 | 0.00 | 0.39 | |
| 3 | 1, 5; 3, 4 | C270 | −0.41 | 0.00 | −0.17 | |
| 3 | 3, 2; 4, 5 | G | 1.65 | 0.00 | 0.39 | |
| 4 | 1, 2; 3, 4, 5 | t | 0.06 | 20.72 | 0.04 | |
| Cluster 4 | 1 | 1, 5 | C270 | −0.41 | 0.00 | −0.17 |
| 1 | 5, 3 | t | 0.74 | 7.43 | 0.53 | |
| 1 | 3, 2 | F | 1.02 | 0.00 | 0.11 | |
| 1 | 2, 4 | SC | 2.37 | 0.00 | 0.54 | |
| 2 | 1, 3; 5 | N | 0.43 | 0.00 | 0.29 | |
| 2 | 5, 2; 3 | C270 | −0.42 | 0.00 | −0.17 | |
| 2 | 3, 4; 2 | G270 | −1.46 | 0.00 | −0.31 | |
| 3 | 1, 2; 5, 3 | F | 5.70 | 0.00 | 0.50 | |
| 3 | 5, 4; 3, 2 | C | 0.20 | 0.00 | 0.09 | |
| 4 | 1, 4; 5, 3, 2 | SC | 0.26 | 0.00 | 0.11 | |
| Cluster 5 | 1 | 1, 4 | t | 0.81 | 2.61 | 0.60 |
| 1 | 4, 2 | t | 0.82 | 5.46 | 0.61 | |
| 1 | 2, 5 | C | 0.30 | 0.00 | 0.13 | |
| 1 | 5, 3 | t | 0.56 | 30.00 | 0.37 | |
| 2 | 1, 2; 4 | t | −0.13 | 5.75 | −0.08 | |
| 2 | 4, 5; 2 | C270 | −0.56 | 0.00 | −0.22 | |
| 2 | 2, 3; 5 | SC | 0.99 | 0.00 | 0.33 | |
| 3 | 1, 5; 4, 2 | t | 0.21 | 12.01 | 0.13 | |
| 3 | 4, 3; 2, 5 | F | 1.28 | 0.00 | 0.14 | |
| 4 | 1, 3; 4, 2, 5 | C | 0.58 | 0.00 | 0.22 | |
| Cluster 6 | 1 | 1, 4 | C | 1.82 | 0.00 | 0.48 |
| 1 | 4, 3 | C | 0.23 | 0.00 | 0.10 | |
| 1 | 3, 2 | N | 0.41 | 0.00 | 0.27 | |
| 1 | 2, 5 | C | 0.08 | 0.00 | 0.04 | |
| 2 | 1, 3; 4 | t | 0.70 | 13.99 | 0.49 | |
| 2 | 4, 2; 3 | N | 0.82 | 0.00 | 0.61 | |
| 2 | 3, 5; 2 | t | 0.82 | 9.39 | 0.61 | |
| 3 | 1, 2; 4, 3 | F | −0.50 | 0.00 | −0.05 | |
| 3 | 4, 5; 3, 2 | t | −0.40 | 15.74 | −0.27 | |
| 4 | 1, 5; 4, 3, 2 | G90 | −1.04 | 0.00 | −0.04 | |
| Cluster 7 | 1 | 1, 4 | N | 0.40 | 0.00 | 0.27 |
| 1 | 4, 2 | N | 0.47 | 0.00 | 0.31 | |
| 1 | 2, 3 | F | 5.62 | 0.00 | 0.49 | |
| 1 | 3, 5 | t | 0.73 | 30.00 | 0.52 | |
| 2 | 1, 2; 4 | F | 4.76 | 0.00 | 0.44 | |
| 2 | 4, 3; 2 | G90 | −1.45 | 0.00 | −0.31 | |
| 2 | 2, 5; 3 | C90 | −0.36 | 0.00 | −0.15 | |
| 3 | 1, 3; 4, 2 | N | 0.56 | 0.00 | 0.38 | |
| 3 | 4, 5; 2, 3 | t | −0.29 | 18.50 | −0.19 | |
| 4 | 1, 5; 4, 2, 3 | C270 | −0.19 | 0.00 | −0.09 |
Disclaimer/Publisher’s Note: The statements, opinions and data contained in all publications are solely those of the individual author(s) and contributor(s) and not of MDPI and/or the editor(s). MDPI and/or the editor(s) disclaim responsibility for any injury to people or property resulting from any ideas, methods, instructions or products referred to in the content. |
© 2025 by the authors. Licensee MDPI, Basel, Switzerland. This article is an open access article distributed under the terms and conditions of the Creative Commons Attribution (CC BY) license (https://creativecommons.org/licenses/by/4.0/).
Share and Cite
Wang, F.; Wei, Y.; Duan, R.; Zhang, J.; Zhou, X. A Factorial-Clustered Copula Covariate Analysis for Interaction Effects of Multiple Climate Factors on Vegetation Cover in China. Atmosphere 2025, 16, 185. https://doi.org/10.3390/atmos16020185
Wang F, Wei Y, Duan R, Zhang J, Zhou X. A Factorial-Clustered Copula Covariate Analysis for Interaction Effects of Multiple Climate Factors on Vegetation Cover in China. Atmosphere. 2025; 16(2):185. https://doi.org/10.3390/atmos16020185
Chicago/Turabian StyleWang, Feng, Yiting Wei, Ruixin Duan, Jiannan Zhang, and Xiong Zhou. 2025. "A Factorial-Clustered Copula Covariate Analysis for Interaction Effects of Multiple Climate Factors on Vegetation Cover in China" Atmosphere 16, no. 2: 185. https://doi.org/10.3390/atmos16020185
APA StyleWang, F., Wei, Y., Duan, R., Zhang, J., & Zhou, X. (2025). A Factorial-Clustered Copula Covariate Analysis for Interaction Effects of Multiple Climate Factors on Vegetation Cover in China. Atmosphere, 16(2), 185. https://doi.org/10.3390/atmos16020185