Abstract
The Brazilian savanna, South America’s second-largest biome, is vital to Brazil’s economy but has suffered from environmental degradation due to unregulated agricultural and urban expansion. This study assesses climate change in the biome from 1961 to 2021 using the Köppen climate classification, drought indices, historical trend analyses, and the climatological water balance. Fourteen municipalities across the biome were analyzed. According to the Köppen classification, most municipalities were identified as Aw (tropical with dry winters) and Am (tropical monsoon), with Dourados, MS, and Sapezal, MT, alternating between Am and Aw. The standardized precipitation index (SPI) revealed changes in rainfall distribution. The Mann–Kendall test detected rising air temperatures in 13 of the 14 municipalities, with Sen’s slope ranging from 0.0156 to 0.0605 °C per year. Rainfall decreased in seven municipalities, with decreases from −4.54 to −12.77 mm per year. The climatological water balance supported the observed decrease in precipitation. The results indicated a clear warming trend and declining rainfall in most of the Brazilian savanna, highlighting potential challenges for water availability in the face of ongoing climate change.
1. Introduction
The Brazilian savanna, or Cerrado, is the second-largest biome in South America and covers a large part of central Brazil [1]. It features a mosaic of savanna vegetation and woody formations, exhibiting high biodiversity and endemism [2], and plays a critical hydrological role, serving as a water source for eight of Brazil’s twelve main river basins. The climate is tropical seasonal, predominantly classified as Aw (tropical savanna with dry winters) according to the Köppen system [3]. The Cerrado is economically important, producing over 60% of Brazil’s grains and contributing substantially to national food security [4].
However, intense agricultural expansion and urbanization have driven extensive environmental degradation, leading to biodiversity loss, increased water scarcity, and altered regional climate dynamics [5]. From 1985 to 2021, nearly 28 million hectares of native vegetation were converted to anthropogenic land, amplifying ecological pressures [6]. The climate records from 1961 to 2019 reveal an increase in dry-season mean temperatures between 2.2 and 4 °C, coupled with a 15% reduction in relative humidity [7], which has increased the water demand and fire risk [8]. Precipitation decreased by an average of 15.41 mm year−1, while potential evapotranspiration increased by 14.91 mm year−1, from 2000 to 2019 [9]. These trends align with global climate models projecting temperature rises of 1.5–4.4 °C by 2100 [10], with regional scenarios indicating increases of up to 6.58 °C for the Cerrado under high-emission pathways [11].
Climate changes pose risks to agricultural productivity by reducing water availability and increasing pest pressures [12,13] while threatening native biodiversity that relies on stable climatic regimes [14]. Precipitation is a key determinant of crop yield, and water deficits are a primary constraint in this major agricultural zone, which is vulnerable to climate extremes [15,16]. Understanding these dynamics is recommended for adaptive management strategies.
Since its creation in 1900, the Köppen classification has been widely adopted and refined for climatological and agrometeorological studies due to its robustness and simplicity [17,18,19,20]. It effectively tracks regional climate shifts and facilitates the analysis of climate impacts. Studies applying the Köppen classification in Brazil have documented warming trends, shifts from subtropical to tropical climate types, and increased extreme events, emphasizing the urgency of climate adaptation policies [20]. Anthropogenic global warming is accelerating changes in global climate conditions, leading to an expansion of hot tropical and arid climates, particularly in mid- and high-latitude regions [21]. The changes have occurred in climate types A (tropical), B (arid), and D (continental), with tropical climates, especially the savanna subtype (Aw), expanding by 1.0 to 3.3%, primarily over areas previously classified as type C (temperate) climates [21].
Coupling the Köppen classification with drought indices, trend tests, and water balance assessments offers a comprehensive approach to characterize climate change impacts. This study tests the hypothesis that climatic characteristics in the Cerrado have shifted between 1961 and 2021, marked by rising temperatures and altered precipitation regimes. The work aims to assess climate change using the Köppen classification, the standardized precipitation index, trend analyses, and climatological water balance, providing insights into climate impacts on water availability in the biome.
2. Materials and Methods
2.1. Study Area
The selected locations across the Cerrado correspond to the following municipalities and states of Brazil: Alto Parnaíba, MA; Aragarças, GO; Balsas, MA; Conceição do Araguaia, PA; Dourados, MS; Formosa, GO; Jataí, GO; João Pinheiro, MG; Peixe, TO; Posse, GO; Poxoréu, MT; Sapezal, MT; Tapurah, MT; and Uberaba, MG (Figure 1). The 14 municipalities selected to assess climate change in the Cerrado using the Köppen climate classification were chosen because they cover different regions of this biome. This selection provides a comprehensive sampling of the characteristics and phytophysiognomies present in the territory, allowing for a representative analysis of the climatic transformations affecting the Cerrado biome.
2.2. Climate Data
Daily-scale data on the minimum and maximum air temperature and precipitation were collected for the period of 1961 to 2021. For the period of 1961 to 2016, climate data were obtained from the National Institute of Meteorology [22]. For the subsequent years, air temperature data were obtained from the National Aeronautics and Space Administration/Prediction of Worldwide Energy Resources [23,24], while precipitation data were provided by the National Water and Basic Sanitation Agency [25].
To fill data gaps (representing less than 20% of the total data) [26], the average between the previous and subsequent days was used for one-day air temperature gaps. For precipitation and multi-day gaps, data from the nearest meteorological station were used, applying linear correlation methods for temperature and precipitation values.
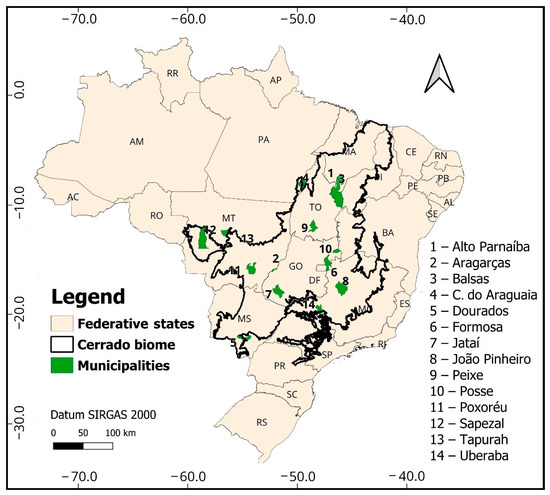
Figure 1.
Municipalities included in the study to assess climate change using the Köppen classification. Source: adapted from [27].
2.3. Köppen Climate Classification
Climate data were organized using Microsoft® Excel® software version 2506, applying the Köppen classification. Daily temperature and precipitation data were aggregated on a monthly scale. Mean air temperature was calculated as the average of daily maximum and minimum temperatures, including annual averages. Monthly and annual precipitation totals were also calculated. Climate classification followed the threshold definitions of Köppen [3]. A threshold of 60 mm for the driest month’s precipitation was adopted [18]. For arid and semi-arid climates, the precipitation threshold was adjusted according to the seasonal precipitation distribution [28]. The classification was applied to 30-year moving windows starting in 1961. Each subsequent year added one year to the period (e.g., 1961–1990, 1962–1991, up to 1992–2021), resulting in 32 climatological periods for each of the 14 municipalities, totaling 448 climate classifications.
2.4. Standardized Precipitation Index (SPI)
The standardized precipitation index (SPI) was calculated based on historical precipitation data, which were fitted to a gamma distribution, then transformed into a normal distribution with a mean of zero and variance of one [29,30]. The SPI was computed over a 12-month scale using the SPI function of the SPEI package in RStudio version 2024.09.0. The results were visually assessed for drought duration between 1961 and 2021.
2.5. Mann–Kendall Test and Sen’s Slope
The Mann–Kendall test [31,32] and Sen’s slope estimator [33] were used to detect significant trends and quantify their magnitude in precipitation and air temperature. Analyses were performed using R software version 4.4.1, adopting a 5% significance level (95% confidence interval) [34]. The Mann–Kendall test evaluates the null hypothesis of no trend in the time series (1961–2021), while the Z-score indicates trend direction when significant. Sen’s slope estimates the rate of change, indicating increasing (positive values) or decreasing (negative values) trends [30].
2.6. Climatic Water Balance
The climatic water balance was computed using the Thornthwaite and Mather method [35] to assess soil water availability under climatic conditions. The available water capacity was set at 100 mm. Monthly averages of air temperature and precipitation were used for the climatological normal in 1961–1990 and 1992–2021 to compare water availability differences between these periods. The analysis was conducted in Microsoft® Excel® software version 2506 that incorporated the Thornthwaite method to calculate potential evapotranspiration [36].
2.7. Data Analysis
Following data processing, the Köppen climate classification was presented for 14 municipalities and their respective 32 climatological periods, highlighting changes in annual rainfall and mean air temperature, and annual averages across the 32 periods for each municipality. SPI results included a time series from 1961 to 2021 with drought intensity for each location. Mann–Kendall and Sen’s slope test results were shown for air temperature and precipitation, including significance and trend direction over the 60-year period. Climatic water balance was presented graphically, showing water deficit and surplus comparative analysis between the 1961–1990 and 1992–2021 periods.
3. Results
3.1. Köppen Classification
The Köppen climate classification showed no changes in the climate type throughout the assessed climatological normal in 12 of the 14 municipalities analyzed. These municipalities consistently maintained the classification of a tropical savanna climate with a dry winter season (Aw). Changes in classification were identified only in the municipalities of Dourados, MS, and Sapezal, MT, which alternated between Aw and a tropical monsoon climate (Am). In Dourados, MS, the Am type was recorded in the climatological normals from 1961–1990 to 1971–2000, and from 1981–2010 to 1989–2018. In Sapezal, MT, this classification occurred only from the 1985–2014 to 1986–2015 climatological periods.
3.2. Standardized Precipitation Index (SPI)
SPI revealed intensified dry periods in most locations, becoming particularly evident after 2010 (Figure 2). A prolonged drought period was identified in the municipalities of Alto Parnaíba, MA (Figure 2a); Peixe, TO (Figure 2i); and Posse, GO (Figure 2j), between 2014 and 2021. Conversely, longer periods of positive SPI were observed in João Pinheiro, MG, from 2003 to 2012 (Figure 2h), and in Sapezal, MT, from 2004 to 2013 (Figure 2l).
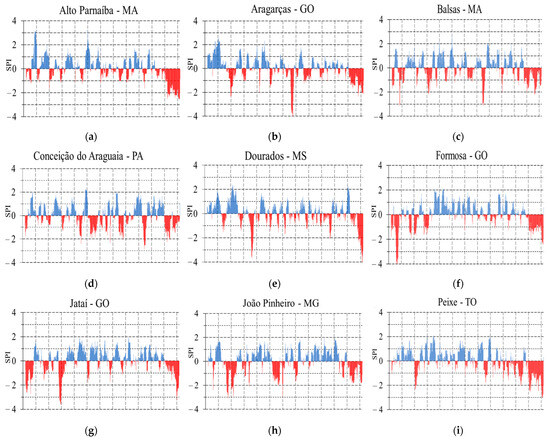
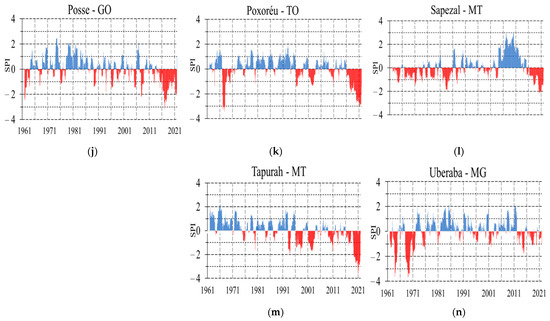
Figure 2.
Standardized precipitation index (SPI) evaluated on a 12-month scale between 1961 and 2021 for the locations of Alto Parnaíba, MA (a); Aragarças, GO (b); Balsas, MA (c); Conceição do Araguaia, PA (d); Dourados, MS (e); Formosa, GO (f); Jataí, GO (g); João Pinheiro, MG (h); Peixe, TO (i); Posse, GO (j); Poxoréu, MT (k); Sapezal, MT (l); Tapurah, MT (m); and Uberaba, MG (n).
3.3. Mann–Kendall Test and Sen’s Slope
The Mann–Kendall test identified a statistically significant trend (p < 0.05) in air temperature for 13 of the 14 municipalities (Table 1), all showing positive Z-values. The municipalities of Alto Parnaíba, MA; Aragarças, GO; Balsas, MA; Conceição do Araguaia, PA; Dourados, MS; Formosa, GO; Jataí, GO; João Pinheiro, MG; Peixe, TO; Posse, GO; Poxoréu, MT; Tapurah, MT; and Uberaba, MG, exhibited positive Sen’s slope values, indicating an increase in air temperature. In contrast, Sapezal, MT, was the only municipality that did not show a significant trend in air temperature.

Table 1.
The Mann–Kendall test (Z-value), Sen’s slope estimator, and significance level based on the p-Value for the historical air temperature series in 14 municipalities of the Cerrado biome from 1961 to 2021.
Sen’s slope values ranged from 0.0156 to 0.0605 °C year−1 (Table 1). The highest average increase was observed in Conceição do Araguaia, PA (0.0605 °C year−1), followed by João Pinheiro, MG (0.0475 °C year−1), and Formosa, GO (0.0362 °C year−1). The regions of Dourados, MS; Tapurah, MT; and Posse, GO showed similar increases, around 0.03 °C year−1. Municipalities of Peixe, TO; Uberaba, MG; Balsas, MA; Aragarças, GO; and Jataí, GO recorded increases of approximately 0.02 °C year−1, while Poxoréu, MT had the lowest rate, at 0.0156 °C year−1.
Regarding precipitation, 7 out of the 14 municipalities analyzed showed a statistically significant decreasing trend, with p-values of <0.05 and negative Sen’s slope values, indicating a reduction in rainfall amounts (Table 2). These municipalities included Alto Parnaíba, MA; Aragarças, GO; Dourados, MS; Peixe, TO; Posse, GO; Poxoréu, MT; and Tapurah, MT. Tapurah, MT, exhibited the largest reduction, with a decline of 12.77 mm year−1. Poxoréu, MT, and Aragarças, GO, showed considerable reductions of 7.53 mm year−1 and 7.19 mm year−1, respectively. Peixe, TO, and Alto Parnaíba, MA, experienced decreases of 6.24 mm year−1 and 6.20 mm year−1, respectively. Posse, GO, showed a reduction of 5.62 mm year−1, and Dourados, MS, showed a reduction of 4.54 mm year−1. Meanwhile, Balsas, MA; Conceição do Araguaia, PA; Formosa, GO; Jataí, GO; João Pinheiro, MG; Sapezal, MT; and Uberaba, MG, did not exhibit statistically significant trends in precipitation (Table 2).
Table 2.
Mann–Kendall test (Z-value), Sen’s slope estimator, and significance level based on the p-value for the historical rainfall series in 14 municipalities of the Cerrado biome from 1961 to 2021.
3.4. Climate Normal Series
The climate normal was compared between the first (1961–1990) and the most recent (1992–2021) period (Table 3), along with the difference between these periods. The municipality that registered the greatest reduction in rainfall was Tapurah, MT, with a total decrease of 400 mm year−1. Conversely, Sapezal, MT, showed the largest increase in precipitation, with a total increment of 414 mm year−1. Regarding air temperature, Conceição do Araguaia, PA, stood out with the highest increase in mean annual temperature, reaching 1.9 °C. For the other municipalities, the increase exceeded 0.7 °C, except for Sapezal, MT, which showed a slight decrease of 0.1 °C.
Table 3.
Climate normal for the first (1961–1990) and most recent (1992–2021) periods, with the difference between periods in 14 municipalities of the Cerrado biome.
3.5. Climatic Water Balance
The results obtained from the climatological water balance for the first (1961–1990) and most recent (1992–2021) climatological normal indicated that, in 13 of the 14 analyzed municipalities, the water deficit was greater in the 1992–2021 normal compared to the 1961–1990 period (Table 4). For example, in Balsas, MA, the water deficit for the 1961–1990 normal was 558 mm year−1, whereas in 1992–2021, it increased to 671 mm year−1. Conversely, only the municipality of Sapezal, MT, showed a reduction in water deficit, decreasing from 292 mm year−1 in the 1961–1990 normal to 265 mm year−1 in the 1992–2021 normal (Table 4), but increasing the water surplus from 489 mm year−1 to 880 mm year−1.
Table 4.
Water deficit and surplus from water balance for the climatological normals of 1961–1990 and 1992–2021 in the 14 municipalities of the Cerrado biome.
In the 1992–2021 climatological normal, there is an advance in the period of soil water withdrawal and water deficit compared to the 1961–1990 normal, as highlighted in the municipalities of Alto Parnaíba, MA (Figure 3a,b). April showed a slight surplus in the 1961–1990 normal but shifted to soil water withdrawal in the 1992–2021 period, with the onset of the water deficit advancing by one month.
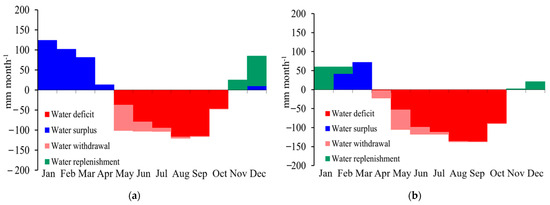
Figure 3.
Comparative climatological water balance between the climatological normals of 1961–1990 (a) and 1992–2021 (b) for the municipality of Alto Parnaíba, MA.
The water surplus increased in the 1992–2021 climatological normal in only three municipalities compared to the 1961–1990 normal (Table 4), those municipalities being João Pinheiro, MG; Sapezal, MT; and Uberaba, MG. In João Pinheiro, MG, values increased from 346.38 mm year−1 to 387.17 mm year−1. However, no increase in the number of surplus months was observed, with 11 municipalities experiencing a reduction in the number of months with a water surplus between 1961–1990 and 1992–2021. As shown in Figure 3a,b, Alto Parnaíba, MA, recorded a reduction of three surplus months.
4. Discussion
The persistence of the Aw climate classification in most regions analyzed can be attributed to the inherent stability of its defining characteristics. The Aw climate, tropical savanna with a dry winter, is marked by consistently high temperatures and a pronounced dry season, with minimal thermal amplitude throughout the year [37]. There has been an expansion of tropical Aw climates in southern Africa, Brazil, and northern India since the 1980s, often at the expense of temperate zones [38]. This climatic regime, situated at the transitional boundary of tropical climates in the Köppen system, represents a threshold in terms of both thermal and precipitation criteria. Notable shifts in climate classification (e.g., toward semi-arid [BSh] or arid [BWh]) would require substantial and sustained reductions in annual precipitation, typically below 800 mm [39], and increases in temperature.
According to climate projections, changes are increasingly plausible, with trends of rising air temperatures and decreasing rainfall in various Brazilian regions [17], which documented a decadal expansion of semi-arid zones in Brazil exceeding 75,000 km2 [40]. The first classification of an arid zone in northern Bahia was observed between 1990 and 2020, indicating a nationwide tendency toward aridification, with implications for other transitional regions, such as the Cerrado.
The municipalities of Dourados, MS, and Sapezal, MT, exemplify climatic transition zones, where local and regional climate interactions promote alternating climate classification. Dourados, located near the boundary between Aw and Am (tropical monsoon) climates, is influenced by interactions between the Atlantic Forest and Cerrado biomes, and by dynamic air mass exchanges [41,42]. Similarly, Sapezal lies in a transitional area influenced by the Cerrado and the Amazon Rainforest. Changes in Amazonian precipitation patterns, modulated by land-use change and global warming, have affected moisture transport toward Sapezal [43], potentially indicating a positive anomaly of increasing rainfall. Climate change scenarios indicate a consistent change in the climate type Am to Aw on the border of Cerrado [44], where Sapezal and Dourados are located.
In this study, long-term water availability was assessed using the standardized precipitation index (SPI) at a 12-month scale, reflecting cumulative precipitation effects on hydrological systems, including streamflow, reservoir levels, and groundwater [45]. The results showed longer negative SPI values after 2010, indicating intensifying drought conditions [7,9]. This intensification aligns with global climate drivers, particularly the increase in air temperature, which alters the climate system and affects El Niño Southern Oscillation phenomena [46]. Additionally, regional land-use changes, especially deforestation, have played a key role on climate. For example, in scenarios without deforestation, rainfall amounts between 2011 and 2020 would have been 12% to 41% higher in the central-northern region of Brazil [47]. Although several municipalities did not exhibit statistically significant trends in annual precipitation, this could be attributed to high interannual variability obscuring longer-term trends [48]. However, increased precipitation in recent years in Sapezal is consistent with prior findings by [49], who documented a peak in annual rainfall in 2009 (3600 mm) and a minimum in 1988 (1500 mm).
A warming trend in mean air temperature was observed across most municipalities analyzed, corroborating global and regional projections [10]. In the Cerrado biome, this warming is associated with projected decreases in rainfall and greater irregularity in distribution [7,50]. The climatological water balance supports evidence of intensifying water stress, characterized by an earlier onset of soil moisture depletion and increased annual water deficit in the recent normal period, reducing the available growing period under rainfed agriculture.
Shifts in climate classification have important consequences on biodiversity and agriculture [51]. The observed temperature increase and rainfall reduction threaten the conservation of species in Cerrado by reducing climate stability [52], and threaten agriculture by reducing yield [53,54], requiring adaptation strategies in both sectors [52,54,55].
5. Conclusions
This study reveals three key shifts in the climate system of the Cerrado region through a multicriteria analysis. In Dourados, MS, and Sapezal, MT, the Köppen classification alternated between Am and Aw, while other municipalities remained Aw but showed a trend toward drier conditions due to rising temperatures and declining rainfall. The Mann–Kendall and Sen’s slope tests revealed significant temperature increases in 13 of the 14 municipalities, and reduced rainfall trends in 7 of the 14. SPI analysis showed more frequent and intense droughts after 1990, thus increasing vulnerability to climate extremes. The climatological water balance confirmed greater water deficits in the 1992–2021 period compared to the 1961–1990 period in most locations. These findings suggest the Cerrado is undergoing climate transformation, posing risks to water availability. The potential for climate risk may increase in the future due to climate change scenarios not considered in this study. Adaptation strategies need to consider biodiversity conservation through land-use laws, while agriculture must improve resilient crop systems. Investments in climate monitoring, farmer training, and supportive public policies will be key to mitigating the environmental and socio-economic impacts of these changes.
Author Contributions
Conceptualization, R.B.; methodology, K.W.d.S.S., R.B., and F.P.D.; formal analysis, K.W.d.S.S., A.P.M.d.C., M.V.d.S., and F.P.D.; investigation, R.B.; resources, R.B., J.L.B.d.S., H.F.E.d.O., and M.M.; writing—original draft preparation, K.W.d.S.S. and R.B.; writing—review and editing, R.B., A.P.M.d.C., J.L.B.d.S., H.F.E.d.O., M.V.d.S., and M.M.; supervision, R.B.; funding acquisition, R.B. and M.M. All authors have read and agreed to the published version of the manuscript.
Funding
This work was supported by the Coordenação de Aperfeiçoamento de Pessoal de Nível Superior (CAPES) through scholarship for the 1st author, and by Conselho Nacional de Desenvolvimento Científico e Tecnológico (CNPQ), grant number 302834/2022–2 (2nd author), 165096/2021–7 (3rd author) and 312854/2023–4 (8th author).
Institutional Review Board Statement
Not applicable.
Informed Consent Statement
Not applicable.
Data Availability Statement
The original data presented in the study are publicly available in [22,23,25].
Acknowledgments
We would like to thank the Instituto Nacional de Meteorologia, Agência Nacional de Águas e Saneamento Básico and NASAPOWER for making the weather data available with continuous records across Brazil.
Conflicts of Interest
The authors declare no conflicts of interest.
References
- Ribeiro, J.F.; Walter, B.M.T. As principais fitofisionomias do bioma Cerrado. In Cerrado: Ecologia e Flora, 1st ed.; Sano, S.M., Almeida, S.P., Ribeiro, J.F., Eds.; Embrapa Informação Tecnológica: Brasília, Brazil, 2008; pp. 151–212. [Google Scholar]
- Mamede, J.S.S.; Pasa, M.C. Diversidade e uso de plantas do Cerrado na comunidade São Miguel, Várzea Grande, MT, Brasil. Interações 2019, 20, 1087–1098. [Google Scholar] [CrossRef]
- Alvares, C.A.; Stape, J.L.; Sentelhas, P.C.; Gonçalves, J.L.M.; Sparovek, G. Köppen’s climate classification map for Brazil. Meteorol. Z. 2013, 22, 711–728. [Google Scholar] [CrossRef] [PubMed]
- Assad, E.D.; Victoria, D.D.C.; Cuadra, S.V.; Pugliero, V.S.; Zanetti, M.R. Efeito das mudanças climáticas na agricultura do Cerrado. In Dinâmica Agrícola no Cerrado: Análises e Projeções; Bolfe, E.L., Sano, E.E., Campos, S.K., Eds.; Embrapa: Brasília, Brazil, 2020; pp. 213–228. [Google Scholar]
- Joly, C.A.; Scarano, F.R.; Seixas, C.S.; Metzger, J.P.; Ometto, J.P.; Bustamante, M.M.C.; Padgurschi, M.C.G.; Pires, A.P.F.; Castro, P.F.D.; Gadda, T.; et al. 1° Diagnóstico Brasileiro de Biodiversidade e Serviços Ecossistêmicos, 1st ed.; Editora Cubo: São Carlos, Brazil, 2019; pp. 93–213. [Google Scholar]
- MapBiomas. Projeto MapBiomas—Mapeamento Anual de Cobertura e Uso da Terra no Cerrado—Coleção 7. 2022. Available online: https://brasil.mapbiomas.org/destaques-de-colecoes-anteriores/ (accessed on 3 December 2024).
- Hofmann, G.S.; Cardoso, M.F.; Alves, R.J.V.; Weber, E.J.; Barbosa, A.A.; de Toledo, P.M.; Pontual, F.B.; Salles, L.D.O.; Hasenack, H.; Cordeiro, J.L.P.; et al. The Brazilian Cerrado is becoming hotter and drier. Glob. Change Biol. 2021, 27, 4060–4073. [Google Scholar] [CrossRef]
- Teodoro, P.E.; Silva Junior, C.A.; Delgado, R.C.; Lima, M.; Teodoro, L.P.R.; Baio, F.H.R.; Azevedo, G.B.; Azevedo, G.T.O.S.; Pantaleão, A.A.; Capristo-Silva, G.F.; et al. Twenty-year impact of fire foci and its relationship with climate variables in Brazilian regions. Environ. Mont. Assess. 2022, 194, e90. [Google Scholar] [CrossRef]
- Silva, A.S.A.; Menezes, R.S.C.; Stosic, T. Multifractal analysis of standardized precipitation index in Northeast Brazil. Chaos Solitons Fractals 2023, 172, 113600. [Google Scholar] [CrossRef]
- IPCC. Synthesis Report. Contribution of Working Groups I, II and III to the Sixth Assessment Report of the Intergovernmental Panel on Climate Change; Lee, H., Romero, J., Eds.; IPCC: Geneva, Switzerland, 2023; p. 184. [Google Scholar]
- Ferreira, F.L.V.; Rodrigues, L.N.; Silva, F.B. Performance evaluation of climate models in the simulation of precipitation and average temperature in the Brazilian Cerrado. Theor. Appl. Climatol. 2024, 155, 845–857. [Google Scholar] [CrossRef]
- Feng, X.; Tian, H.; Cong, J.; Zhao, C. A method review of the climate change impact on crop yield. Front. For. Glob. Change 2023, 6, 1198186. [Google Scholar] [CrossRef]
- Carley, D.S.; Cook, J.; Emerine, S. Agricultural issues with climate change—Case studies with 3 soybean pests: Johnsongrass, kudzu bug, and charcoal rot. J. Integr. Pest Manag. 2024, 15, 3. [Google Scholar] [CrossRef]
- Oliveira, H.R.; Cassemiro, F.A.S. Potenciais efeitos das mudanças climáticas futuras sobre a distribuição de um anuro da Caatinga Rhinella granulosa (Anura, Bufonidae). Iheringia Série Zool. 2013, 103, 272–279. [Google Scholar] [CrossRef]
- Silva, L.P.; Battisti, R.; Knapp, F.M.; Santos, T.G.; Junior, J.A. Estimativa da produtividade de soja usando irrigação na época das chuvas no bioma Cerrado. Agrometeoros 2020, 28, e026702. [Google Scholar] [CrossRef]
- Gupta, A.; Rico-Medina, A.; Caño-Delgado, A.I. The physiology of plant responses to drought. Science 2020, 368, 266–269. [Google Scholar] [CrossRef] [PubMed]
- Hanberry, B.B. Global climate classification and comparison to Mid-Holocene and Last Glacial Maximum climates, with added aridity information and a hypertropical class. Earth 2023, 4, 552–569. [Google Scholar] [CrossRef]
- Martins, F.B.; Gonzaga, G.; dos Santos, D.F.; Reboita, M.S. Classificação climática de Köppen e de Thornthwaite para Minas Gerais: Cenário atual e projeções futuras. Rev. Bras. Climatol. 2018, 14, 129–156. [Google Scholar] [CrossRef]
- Rolim, G.S.; Aparecido, L.E. Köppen and Thornthwaite climate classification systems in defining climatical regions of the state of São Paulo, Brazil. Int. J. Climatol. 2016, 36, 636–643. [Google Scholar] [CrossRef]
- Alvares, C.A.; Stape, J.L.; Sentelhas, P.C.; de Moraes Gonçalves, J.L.; Sparovek, G. Southeastern Brazil inland tropicalization: Köppen system applied for detecting climate change throughout 100 years of meteorological observed datas. Theor. Appl. Climatol. 2022, 149, 1431–1450. [Google Scholar] [CrossRef]
- Cui, D.; Liang, S.; Wang, D. Observed and projected changes in global climate zones based on Köppen climate classification. Wiley Interdiscip. Rev. Clim. Change 2021, 12, e707. [Google Scholar] [CrossRef]
- Instituto Nacional de Meteorologia (INMET). Banco de Dados Meteorológicos do INMET. Available online: https://bdmep.inmet.gov.br/ (accessed on 9 July 2024).
- National Aeronautics and Space Administration (NASA) POWER. Prediction of Worldwide Energy Resources. Available online: https://power.larc.nasa.gov/data-access-viewer/ (accessed on 16 August 2023).
- Battisti, R.; da Silva, O.C.C.; Knapp, F.M.; Alves Júnior, J.; Mesquita, M.; Monteiro, L.A. Assessment of the reliability to use NASAPOWER gridded weather applied to irrigation planning and management in Brazil. Theor. Appl. Climatol. 2024, 155, 8287–8297. [Google Scholar] [CrossRef]
- Agência Nacional de Águas e Saneamento Básico (ANA). Hidroweb: Sistemas de Informações Hidrológicas. Available online: https://www.snirh.gov.br/hidroweb/apresentacao (accessed on 6 April 2024).
- Battisti, R.; Bender, F.D.; Sentelhas, P.C. Assessment of different gridded weather data for soybean yield simulations in Brazil. Theor. Appl. Climatol. 2019, 135, 237–247. [Google Scholar] [CrossRef]
- Instituto Brasileiro de Geografia e Estatística (IBGE). Mapas Interativos: Solos. Available online: http://mapas.ibge.gov.br/ (accessed on 4 August 2023).
- Kottek, M.; Grieser, J.; Beck, C.; Rudolf, B.; Rubel, F. World Map of the Köppen-Geiger climate classification updated. Meteorol. Z. 2006, 15, 259–263. [Google Scholar] [CrossRef]
- McKee, T.B.; Doesken, N.J.; Kleist, J. The Relationship of Drought Frequency and Duration to Time Scales. In Proceedings of the 8th Conference on Applied Climatology, Anaheim, CA, USA, 17–22 January 1993; pp. 179–184. [Google Scholar]
- Battisti, R.; Dapper, F.P.; da Silva, A.C.S.; Mesquita, M.; da Silva, M.V.; Andrade, R.R.; Lopes, A.G.C. Assessing Precipitation Trends Between 1960 and 2021 Using Multiple Trend Indexes in the Goiás State and Federal District, Brazil. Int. J. Climatol. 2025, 45, e8750. [Google Scholar] [CrossRef]
- Mann, H.B. Non-Parametric Tests Against Trend. Econometrica 1945, 13, 245–259. [Google Scholar] [CrossRef]
- Kendall, M.G. Rank Correlation Methods, 4th ed.; Charles Griffin: London, UK, 1975. [Google Scholar]
- Sen, P.K. Estimates of the Regression Coefficient Based on Kendall’s Tau. J. Am. Stat. Assoc. 1968, 63, 1379–1389. [Google Scholar] [CrossRef]
- Cabral, J.B., Jr.; Lucena, R.L. Análises das precipitações pelos testes não paramétricos de Mann-Kendall e Kruskal-Wallis. Mercator 2020, 19, e19001. [Google Scholar] [CrossRef]
- Thornthwaite, C.W.; Mather, J.R. The Water Balance; Drexel Institute of Technology, Laboratory of Climatology: Centerton, NJ, USA, 1955; Volume 8, pp. 1–104. [Google Scholar]
- Rolim, G.S.; Sentelhas, P.C.; Barbieri, V. Planilhas no ambiente EXCEL™ para os cálculos de balanços hídricos: Normal, sequencial, de cultura e de produtividade real e potencial. Rev. Bras. Agrometeorol. 1998, 6, 133–137. [Google Scholar]
- Köppen, W. Das geographische System der Klimate. In Handbuch der Klimatologie; Köppen, W., Geiger, R., Eds.; Gebrüder Bornträger: Berlin, Germany, 1936; Volume 1, pp. 1–44. [Google Scholar]
- Moura, M.S.B.; Galvincio, J.D.; Brito, L.T.L.; Souza, L.S.B.; Sá, I.I.S.; Silva, T.G.F. Clima e água de chuva no semiárido. In Potencialidades da Água de Chuva no Semiárido Brasileiro; Embrapa Semiárido: Petrolina, PE, USA, 2007; pp. 37–59. [Google Scholar]
- Tomasella, J.; Cunha, A.P.A.; Marengo, J.A. Nota Técnica: Elaboração dos Mapas de Índice de Aridez e Precipitação Total Acumulada para o Brasil; Ministério da Ciência, Tecnologia e Inovação: Brasília, Brazil, 2023. [Google Scholar]
- Jardim, C.H.; Galvani, E.; Silva, M.R.; Garcia, R.A. O clima em áreas limítrofes ao planalto meridional do Espinhaço: Belo Horizonte, Sete Lagoas e Conceição do Mato Dentro, Minas Gerais-Brasil. Rev. Bras. Climatol. 2019, 25, 549–570. [Google Scholar] [CrossRef]
- Muylaert, L.R.; Vancine, H.M.; Bernardo, R.; Oshima, J.E.F.; Souza, T.S.; Tonetti, V.R.; Niebuhr, B.B.; Ribeiro, M.C. Uma nota sobre os limites territoriais da Mata Atlântica. Oecol. Aust. 2018, 22, 302–311. [Google Scholar] [CrossRef]
- Malvestio, L.M.; Teixeira Nery, J. A importância da Amazônia para o regime pluviométrico da região sudeste do Brasil. Rev. Geonorte 2012, 3, 786–795. [Google Scholar]
- Silva, G.K.; Marcos Júnior, A.D.; Lima, C.E.S.; Silva, M.V.M.; Silveira, C.S.; Silva, E.M.; Lima, I.R. Análise da Variabilidade Espaço-Temporal do SPI: Um Estudo de Caso para a Sub-Bacia Choró, Ceará, Brasil. Rev. Bras. Meteorol. 2021, 36, 539–549. [Google Scholar] [CrossRef]
- Lima, R.F.; Aparecido, L.E.O.; Torsoni, G.B.; Rolim, G.S. Climate change assessment in Brazil: Utilizing the Köppen-Geiger (1936) climate classification. Rev. Bras. Metorol. 2023, 38, e38230001. [Google Scholar] [CrossRef]
- Penereiro, J.C.; Meschiatti, M.C. Tendências em séries anuais de precipitação e temperaturas no Brasil. Eng. Sanit. Ambient. 2018, 23, 319–331. [Google Scholar] [CrossRef]
- Tarmizi, A.H.A.; Rahmat, S.N.; Karim, A.T.A.; Tukimat, N.N.A. Climate change and its impact on rainfall. Int. J. Integr. Eng. 2019, 11, 170–177. Available online: https://publisher.uthm.edu.my/ojs/index.php/ijie/article/view/4288/2227 (accessed on 3 July 2024).
- Batista, F.S.; Duku, C.; Hein, L. Deforestation-induced changes in rainfall decrease soybean-maize yields in Brazil. Ecol. Model. 2023, 486, 110533. [Google Scholar] [CrossRef]
- Silva, E.S.; Zavislak, F.; Dallacort, R.; Carvalho, M.A.; Araújo, D. Distribuição da probabilidade de chuva no município de Sapezal, MT. Enciclop. Biosf. 2013, 9, 1112. [Google Scholar]
- Hofmann, G.S.; Silva, R.C.; Weber, E.J.; Barbosa, A.A.; Oliveira, L.F.B.; Alves, R.J.V.; Cardoso, M.F. Changes in atmospheric circulation and evapotranspiration are reducing rainfall in the Brazilian Cerrado. Sci. Rep. 2023, 13, 11236. [Google Scholar] [CrossRef]
- Battisti, R.; Sentelhas, P.C.; Pilau, F.G.; Wollmann, C.A. Eficiência climática para as culturas da soja e do trigo no estado do Rio Grande do Sul em diferentes datas de semeadura. Ciênc. Rural. 2013, 43, 390–396. [Google Scholar] [CrossRef]
- Fernandes, R.D.M.; de Melo, D.M.; Elli, E.F.; Battisti, R. Climate change impacts on rainfed and irrigated soybean yield in Brazil’s new agricultural frontier. Theor. Appl. Climatol. 2022, 147, 803–816. [Google Scholar] [CrossRef]
- Velasko, S.J.W.; Villalobos, F.; Galvão, F.; Marco Júnior, P.D. A dark scenario for Cerrado plant species: Effects of future climate, land use and protected areas ineffectiveness. Bio. Res. 2019, 25, 660–673. [Google Scholar] [CrossRef]
- Battisti, R.; Sentelhas, P.C.; Boote, K.J. Sensitivity and requirement of improvements of four soybean crop simulation models for climate change studies in Southern Brazil. Int. J. Biometeorol. 2017, 62, 823–832. [Google Scholar] [CrossRef]
- Battisti, R.; Sentelhas, P.C. New agroclimatic approach for soybean sowing dates recommendation: A case study. Rev. Bras. Eng. Agríc. Ambient. 2014, 18, 1149–1156. [Google Scholar] [CrossRef]
- Battisti, R.; Silva Neto, W.A.; Costa, R.M.; Dapper, F.P.; Elli, E.F. Irrigation demand for fruit trees under a climate change scenario using artificial intelligence. Pesqui. Agropecu. Trop. 2024, 54, e77917. [Google Scholar] [CrossRef]
Disclaimer/Publisher’s Note: The statements, opinions and data contained in all publications are solely those of the individual author(s) and contributor(s) and not of MDPI and/or the editor(s). MDPI and/or the editor(s) disclaim responsibility for any injury to people or property resulting from any ideas, methods, instructions or products referred to in the content. |
© 2025 by the authors. Licensee MDPI, Basel, Switzerland. This article is an open access article distributed under the terms and conditions of the Creative Commons Attribution (CC BY) license (https://creativecommons.org/licenses/by/4.0/).