Article

From Target Prediction to Mechanistic Insights: Revealing Air Pollution-Driven Mechanisms in Endometrial Cancer via Interpretable Machine Learning and Molecular Docking

1
Shanghai Key Laboratory of Maternal Fetal Medicine, Shanghai Institute of Maternal-Fetal Medicine and Gynecologic Oncology, Shanghai First Maternity and Infant Hospital, School of Medicine, Tongji University, Shanghai 200092, China
2
Department of Business Administration, Zhejiang Institute of Administration, Hangzhou 311121, China
3
Zhejiang Province “Eight-Eight Strategy” Innovation Development Institute, Zhejiang Institute of Administration, Hangzhou 311121, China
*
Author to whom correspondence should be addressed.
Atmosphere 2025, 16(7), 841; https://doi.org/10.3390/atmos16070841
Submission received: 20 May 2025 / Revised: 4 July 2025 / Accepted: 8 July 2025 / Published: 10 July 2025
(This article belongs to the Special Issue Urban Air Pollution, Meteorological Conditions and Human Health)

Abstract

Air pollution is a known contributor to cancer risk, although its specific impact on endometrial cancer (EC) remains unclear. This study integrates network toxicology, transcriptomics, molecular docking, and machine learning to investigate pollutant–gene interactions in EC. We identify 83 air pollution-associated EC genes (APECGs), with TNF, ESR1, IL1B, NFKB1, and PTGS2 as the hub genes. A 13-gene RSF-SuperPC model, including CCNE1, SLC2A1, AHCY, and CDC25C, shows effective prognostic stratification. Molecular docking reveals strong binding between pollutants (e.g., benzene, toluene, and ethylbenzene) and key APECGs. The enrichment and SHAP analyses suggest that pollutant-driven EC progression involves DNA damage, metabolic reprogramming, epigenetic dysregulation, immune suppression, and inflammation. These findings reveal potential mechanisms linking air pollution to EC and support the development of biomarkers for high-exposure populations. Further experimental and epidemiological validation is needed to enable clinical translation.

1. Introduction

In recent years, the accelerated pace of industrialization and urbanization has elevated air pollution to a major global public health concern. Air pollution impacts multiple organ systems and is associated with a wide range of diseases [1,2]. Several studies have shown that air pollutants contribute to carcinogenesis through DNA damage, epigenetic dysregulation, oxidative stress, inflammation, and microRNA disruption [3,4,5,6,7]. These mechanisms disturb cellular homeostasis and facilitate tumor progression.
Endometrial cancer (EC) is a common gynecologic malignancy with rising global incidence [8,9,10]. Besides established risk factors such as obesity [11,12,13], hormonal imbalance [9,14,15], and genetic predisposition [16,17], emerging evidence indicates that air pollution may influence EC risk through complex molecular pathways. For example, NO2 exposure is associated with an increased risk of EC in Mendelian randomization and cohort studies [18,19,20], while PM2.5 and suspended particulate matter (SPM) may act as endocrine disruptors [21].
However, current research lacks in-depth mechanistic insights and often evaluates pollutants in isolation. Most studies either focus on single pollutants or rely solely on association analyses, without incorporating target prediction, gene expression profiling, or functional validation.
To address these gaps, we systematically evaluate nine representative air pollutants—benzene, toluene, ethylbenzene, sulfur dioxide, nitric oxide, carbon monoxide, nitrogen dioxide, ozone, and formaldehyde—using a comprehensive computational framework. Our study uniquely integrates multi-source toxicogenomic screening, transcriptomic profiling from TCGA-UCEC, PPI network analysis, interpretable machine learning (SHAP), and molecular docking to identify pollutant-associated EC genes and pathways. Notably, we define a novel set of air pollutant-associated EC genes by intersecting predicted pollutant targets, EC-related genes, and differentially expressed genes from tumor tissue. We further apply 117 machine learning algorithms to identify a robust prognostic signature and examine its underlying mechanisms using SHAP. This is the first study to link environmental toxicants, gene regulation, and EC prognosis within a unified framework, providing novel insights into risk stratification and mechanistic understanding in gynecologic oncology.

2. Materials and Methods

2.1. Data Source and Processing

2.1.1. Collection of Air Pollutant-Related Target Genes

Potential human target genes for the nine air pollutants were collected from five databases: ChEMBL (https://www.ebi.ac.uk/chembl/, accessed on 10 March 2025), STITCH (http://stitch.embl.de/, accessed on 10 March 2025), SwissTargetPrediction (http://www.swisstargetprediction.ch/, accessed on 10 March 2025), Super-PRED (https://prediction.charite.de/, accessed on 10 March 2025), and TargetNet (http://targetnet.scbdd.com/calcnet/index/, accessed on 10 March 2025). Gene lists from these databases were combined, and duplicates were removed. The final target gene set includes the remaining unique genes.

2.1.2. Collection of EC-Related Genes

EC-related genes were collected from the GeneCards database (https://www.genecards.org/, accessed on 10 March 2025), OMIM database (https://omim.org/, accessed on 10 March 2025), and Therapeutic Target database (http://idrblab.net/ttd/, accessed on 10 March 2025) using the keyword “endometrial cancer”. In the GeneCards database, genes with a relevance score > 10 were retained to ensure the selection of genes with strong relevance to EC [22,23]. Gene lists from all three databases were merged, and duplicates were removed to obtain a final set of EC-related genes.

2.1.3. TCGA Dataset Acquisition and Preprocessing

RNA-sequencing expression matrix and corresponding clinical data for EC and normal endometrial tissues were obtained from the TCGA (The Cancer Genome Atlas) via the GDC portal (https://portal.gdc.cancer.gov/, accessed on 10 March 2025) and the UCSC Xena platform (https://xena.ucsc.edu/, accessed on 10 March 2025). For differential expression analysis, raw count data were used. Genes expressed in over 50% of the samples were retained, resulting in 554 tumor samples and 35 normal samples for subsequent analysis. For prognostic model construction, raw count data from the tumor samples were used. Genes with an expression > 10 in more than 50% of the tumor samples were retained to reduce noise and ensure the inclusion of biologically meaningful genes. The filtered count data were then normalized and transformed into a log2(CPM + 1) format. To ensure the completeness of the survival analysis and avoid bias from early mortality unrelated to disease progression, samples with missing survival data, or with overall survival (OS) times < 30 days were excluded, leaving a total of 523 tumor samples. These samples were randomly split into a training set (n = 367) and a test set (n = 156) using a 7:3 ratio using the “caret” R package (version 7.0.1) with a fixed random seed (12345679).

2.2. Toxicity Evaluation of Air Pollutants

Chemical structures and related molecular information for nine air pollutants were obtained from the PubChem database (https://pubchem.ncbi.nlm.nih.gov). Carcinogenicity and toxicity profiles were predicted using the ADMETLAB 3.0 database (https://admetlab3.scbdd.com, accessed on 12 March 2025), ProTox3 database (https://tox.charite.de/protox3, accessed on 12 March 2025), and the admetSAR2 database (https://lmmd.ecust.edu.cn/admetsar2, accessed on 12 March 2025).

2.3. Identification of DEGs in EC

The “limma“ R package (version 3.62.2) was used to identify the DEGs between EC tumors and normal samples using RNA sequencing data. Genes with adjusted p-values < 0.05 and |fold change (FC)| > 1.5 are considered differentially expressed. Visualization was performed using the “tinyarray” R package (version 2.4.3).

2.4. Screening of APECGs and Construction of PPI Network

Air pollutant-related target genes, EC-related genes, and EC-DEGs overlap to screen air pollutant–endometrial cancer-associated genes (APECGs). These genes reflect pollutant relevance, disease linkage, and expression alterations, which increase the biological importance of candidate genes. Protein–protein interaction (PPI) analysis of the APECGs was conducted using the STRING database (https://cn.string-db.org/, accessed on 12 March 2025). A confidence score threshold of ≥ 0.4 is used in STRING to retain interactions of medium or higher confidence, as recommended by the STRING database for exploratory PPI network analyses. The result was visualized as a PPI network using Cytoscape (version 3.10.3, https://cytoscape.org/, accessed on 12 March 2025).

2.5. Functional Enrichment Analysis

2.5.1. Gene Set Enrichment Analysis (GSEA)

GSEA evaluates if predefined gene sets show up significantly at the top or bottom of a ranked gene list based on differential expression. This analysis runs with the “clusterProfiler” R package (version 4.14.6) using Hallmark gene sets (category “H”) from the “msigdbr” R package (version 7.5.1) for Homo sapiens. Genes were ranked by log2 fold change (log2FC) from the DEGs. Gene symbols were linked to ENTREZ IDs through the “org.Hs.eg.db” R package (version 3.20.0). Gene sets with adjusted p-values < 0.05 qualify as significantly enriched. Results were visualized with the “enrichplot” (version 1.26.6) and “ggplot2” (version 3.5.1) R packages.

2.5.2. Overrepresentation Analysis (ORA)

ORA was conducted to evaluate whether predefined gene sets are statistically overrepresented in a specific gene list compared to a background set. In this study, the predefined gene sets include Gene Ontology (GO) categories—namely, Biological Process (BP), Molecular Function (MF), and Cellular Component (CC)—along with Kyoto Encyclopedia of Genes and Genomes (KEGG) pathways. These annotations were obtained from the “org.Hs.eg.db” (version 3.20.0) and “clusterProfiler” (version 4.14.6) R packages. The background gene set was defined as all genes retained after preprocessing of the TCGA-UCEC transcriptome data—that is, genes with expression levels greater than 10 in more than 50% of the tumor samples. Pathways with an adjusted p-value < 0.05 are considered significantly enriched. Results were visualized using the “enrichplot” (version 1.26.6) and “ggplot2” (version 3.5.1) R packages.

2.6. Development and Evaluation of the Optimal Prognostic Model Using 117 Machine Learning Combinations

The “Mime” R package (version 0.12) leads the process with these steps. First, a univariate Cox p-value threshold of <0.05 was used to preselect genes with prognostic significance, enabling efficient downstream model construction and reducing overfitting risk. Second, these genes were input into a machine learning framework consisting of ten algorithms: random forest (RSF), elastic network (Enet), stepwise Cox (StepCox), CoxBoost, Cox partial least squares regression (plsRcox), supervised principal component (superpc), generalized boosted regression model (GBM), survival support vector machine (survivalsvm), Ridge, and least absolute shrinkage and selection operator (Lasso). A total of 117 machine learning model combinations were trained on the training dataset. To account for prediction uncertainty, internal validation was conducted using 10-fold cross-validation. Third, the model with the highest mean C-index in the testing set was selected as optimal [24]. Model performance was assessed by Receiver Operating Characteristic (ROC) curves and corresponding Area Under the Curve (AUC) values. Performance metrics, including the C-index and time-dependent AUC, were used to evaluate model robustness and minimize overfitting.

2.7. Construction and Validation of the Risk Score Model

A risk score model was built using hub genes from the optimal prognostic model. The risk score for each patient comes from a linear combination of gene expression values multiplied by weights obtained from the optimal prognostic model, following the formula: Risk Score = Σ (gene expression × weight). To define high- and low-risk groups, the surv_cutpoint function from the “survminer” R package (version 0.5.0) was applied. This method uses maximally selected rank statistics to determine the optimal cutoff that best separates patients based on overall survival. Patients with risk scores above the threshold were classified into the high-risk group, while those below the cutoff were assigned to the low-risk group. Since the hub genes included in the prognostic model are systematically selected based on both their association with air pollutants and prognostic value, the gene expression profiles of high-risk patients likely reflect biological responses to environmental pollutant exposure. Kaplan–Meier survival analysis, time-dependent ROC curves, and AUCs at 1-, 3-, and 5-year points were used to assess model performance. The analyses used the “survival” (version 3.8.3), “survminer” (version 0.5.0), “timeROC” (version 0.4), and “ggplot2” (version 3.5.1) R packages.

2.8. Molecular Docking

Protein structure files (PDB format) for seventeen key APECGs and three non-target control proteins—CRYAB, RPS27A, and MYL6, which encode a small heat shock protein (CRYAB), a ribosomal protein (RPS27A), and a myosin light chain (MYL6), respectively—were obtained from the RCSB Protein Data Bank (https://www.rcsb.org/, accessed on 20 March 2025). These control proteins were selected based on the following criteria: no known association with EC, air pollution, or key pollutant-related mechanisms, and the availability of resolved 3D structures suitable for docking. Molecular structures of the nine representative air pollutants were retrieved from the PubChem database (https://pubchem.ncbi.nlm.nih.gov/, accessed on 20 March 2025). Molecular docking was conducted using the CB-Dock2 platform (https://cadd.labshare.cn/cb-dock2/php/blinddock.php, accessed on 20 March 2025), which performs blind docking and identifies the optimal binding pockets for each ligand–protein pair. Binding energy values (ΔG) were used to evaluate interaction strength. Interactions with ΔG values less than –5 kcal/mol are considered to reflect stable binding affinity [24]. To determine whether pollutants bind significantly more strongly to target proteins than to non-target controls (p < 0.05), Wilcoxon’s rank-sum tests were performed for each pollutant. Results were visualized using the “pheatmap” (version 1.0.12) and “ggplot2” (version 3.5.1) R packages.

2.9. Pathway Enrichment Analysis Between Risk Groups

To explore the molecular mechanisms underlying prognostic differences, gene set variation analysis (GSVA) was performed using the “GSVA” R package (version 2.0.5) on KEGG and Hallmark gene sets obtained from the MSigDB database. KEGG gene sets (C2:CP:KEGG) provide insights into biochemical and metabolic processes, while Hallmark gene sets (H) represent well-defined biological states relevant to cancer. Differential pathway enrichment between the high- and low-risk groups was assessed using the “limma” R package (version 3.62.2) with empirical Bayes moderation. Pathways are considered robustly enriched only if they meet two criteria—adjusted p < 0.05 in the test cohort and consistent log-fold change direction with the training cohort—thereby ensuring reproducibility and biological consistency. Results were visualized using the “ggplot2” (version 3.5.1) and “tinyarray” (version 2.4.3) R packages.

2.10. Construction of Random Forest Models for Risk-Associated Pathways

To find key pathways driving risk stratification, a random forest model was constructed using the KEGG and Hallmark pathways that showed a statistically significant and directionally consistent log2FC direction in both the training and test cohorts. Models were built using the “caret” R package (version 7.0.1) with standardized enrichment scores and 10-fold cross-validation. Model performance on the test set was evaluated by confusion matrices (accuracy, sensitivity, precision, F1 score) using the “caret” R package (version 7.0.1), and ROC-AUC values using the “pROC” R package (version 1.18.5). Confusion matrix heatmaps were generated with the “cvms” R package (version 1.7.0), and ROC curves and pathway importance (MeanDecreaseGini) were visualized with the “ggplot2” R package (version 3.5.1).

2.11. SHAP-Based Interpretation of Pathway Contributions

SHAP (SHapley Additive exPlanations) analysis quantifies each feature’s contribution to the predictions of the random forest model, offering both local (individual-level) and global (feature-level) interpretability. SHAP values were calculated using the “fastshap” R package (version 0.1.1) with the default baseline set as the average prediction across all samples in the test cohort, which serves as a reference point for evaluating feature effects. The analysis was applied to the enrichment scores of the KEGG and Hallmark pathways. A positive SHAP value means that the pathway increases the predicted risk—i.e., it pushes the prediction toward the high-risk classification—suggesting a potential pro-tumorigenic role; conversely, a negative SHAP value indicates that the pathway lowers the predicted risk—i.e., it pulls the prediction toward the low-risk group—implying a potentially protective or suppressive effect. This directional interpretation enables the identification of pathways that may promote or inhibit EC progression under pollutant exposure. The SHAP outputs were visualized using the “shapviz” R package (version 0.9.7) with beeswarm plots, bar charts, and waterfall plots to display feature importance, effect direction, and individual-level prediction impact.

2.12. Statistical Analyses

Statistical analyses were performed in R (version 4.4.3). Comparisons between the two groups used linear models with empirical Bayes adjustment, the nonparametric Kruskal–Wallis test, or Wilcoxon’s signed-rank test based on the data traits and group counts. For comparisons with more than two groups, the Kruskal–Wallis test was applied. Survival differences were checked with Kaplan–Meier analysis and the log-rank test. Correlations were assessed using Pearson’s correlation coefficient. All tests were two-tailed, and statistical significance was defined as p < 0.05. Significance levels are represented as follows: ns (p > 0.05), * (p < 0.05), ** (p < 0.01), *** (p < 0.001), and **** (p < 0.0001).

3. Results

3.1. Toxicity Assessment of Air Pollutants

We evaluated the toxicity of nine air pollutants using the ADMETLAB 3.0, ProTox3, and admetSAR2 databases. We classified a pollutant as toxic if any of these databases predicted it to be carcinogenic. All nine pollutants were identified as toxic based on the assessment results (Table 1).

3.2. Overview of Air Pollutant-Related Target Genes Identified

We collected air pollutant-related target gene data from the ChEMBL, STITCH, SwissTargetPrediction, Super-PRED, and TargetNet databases. The number of predicted target genes was 188 for benzene, 177 for toluene, 238 for SO2, 202 for NO, 174 for NO2, 183 for CO, 159 for O3, 162 for ethylbenzene, and 199 for formaldehyde. After removing duplicates, we identified 484 unique target genes associated with these pollutants (Supplementary Table S1).

3.3. Overview of EC-Related Genes Identified

We retrieved EC-related genes from the GeneCards, OMIM, and the Therapeutic Targets database. This yielded 1869 genes from GeneCards, 504 from OMIM, and 17 from the Therapeutic Targets database. To enhance data reliability, we included only genes from GeneCards with a relevance score greater than 10. After removing duplicates, we compiled a final set of 2771 EC-related genes (Supplementary Table S2). This gene set covers disease-related information, including genetic factors (e.g., mutations and susceptibility), functional roles (e.g., key pathways and cellular dysfunction), and clinical relevance (e.g., therapeutic targets and phenotypic associations).

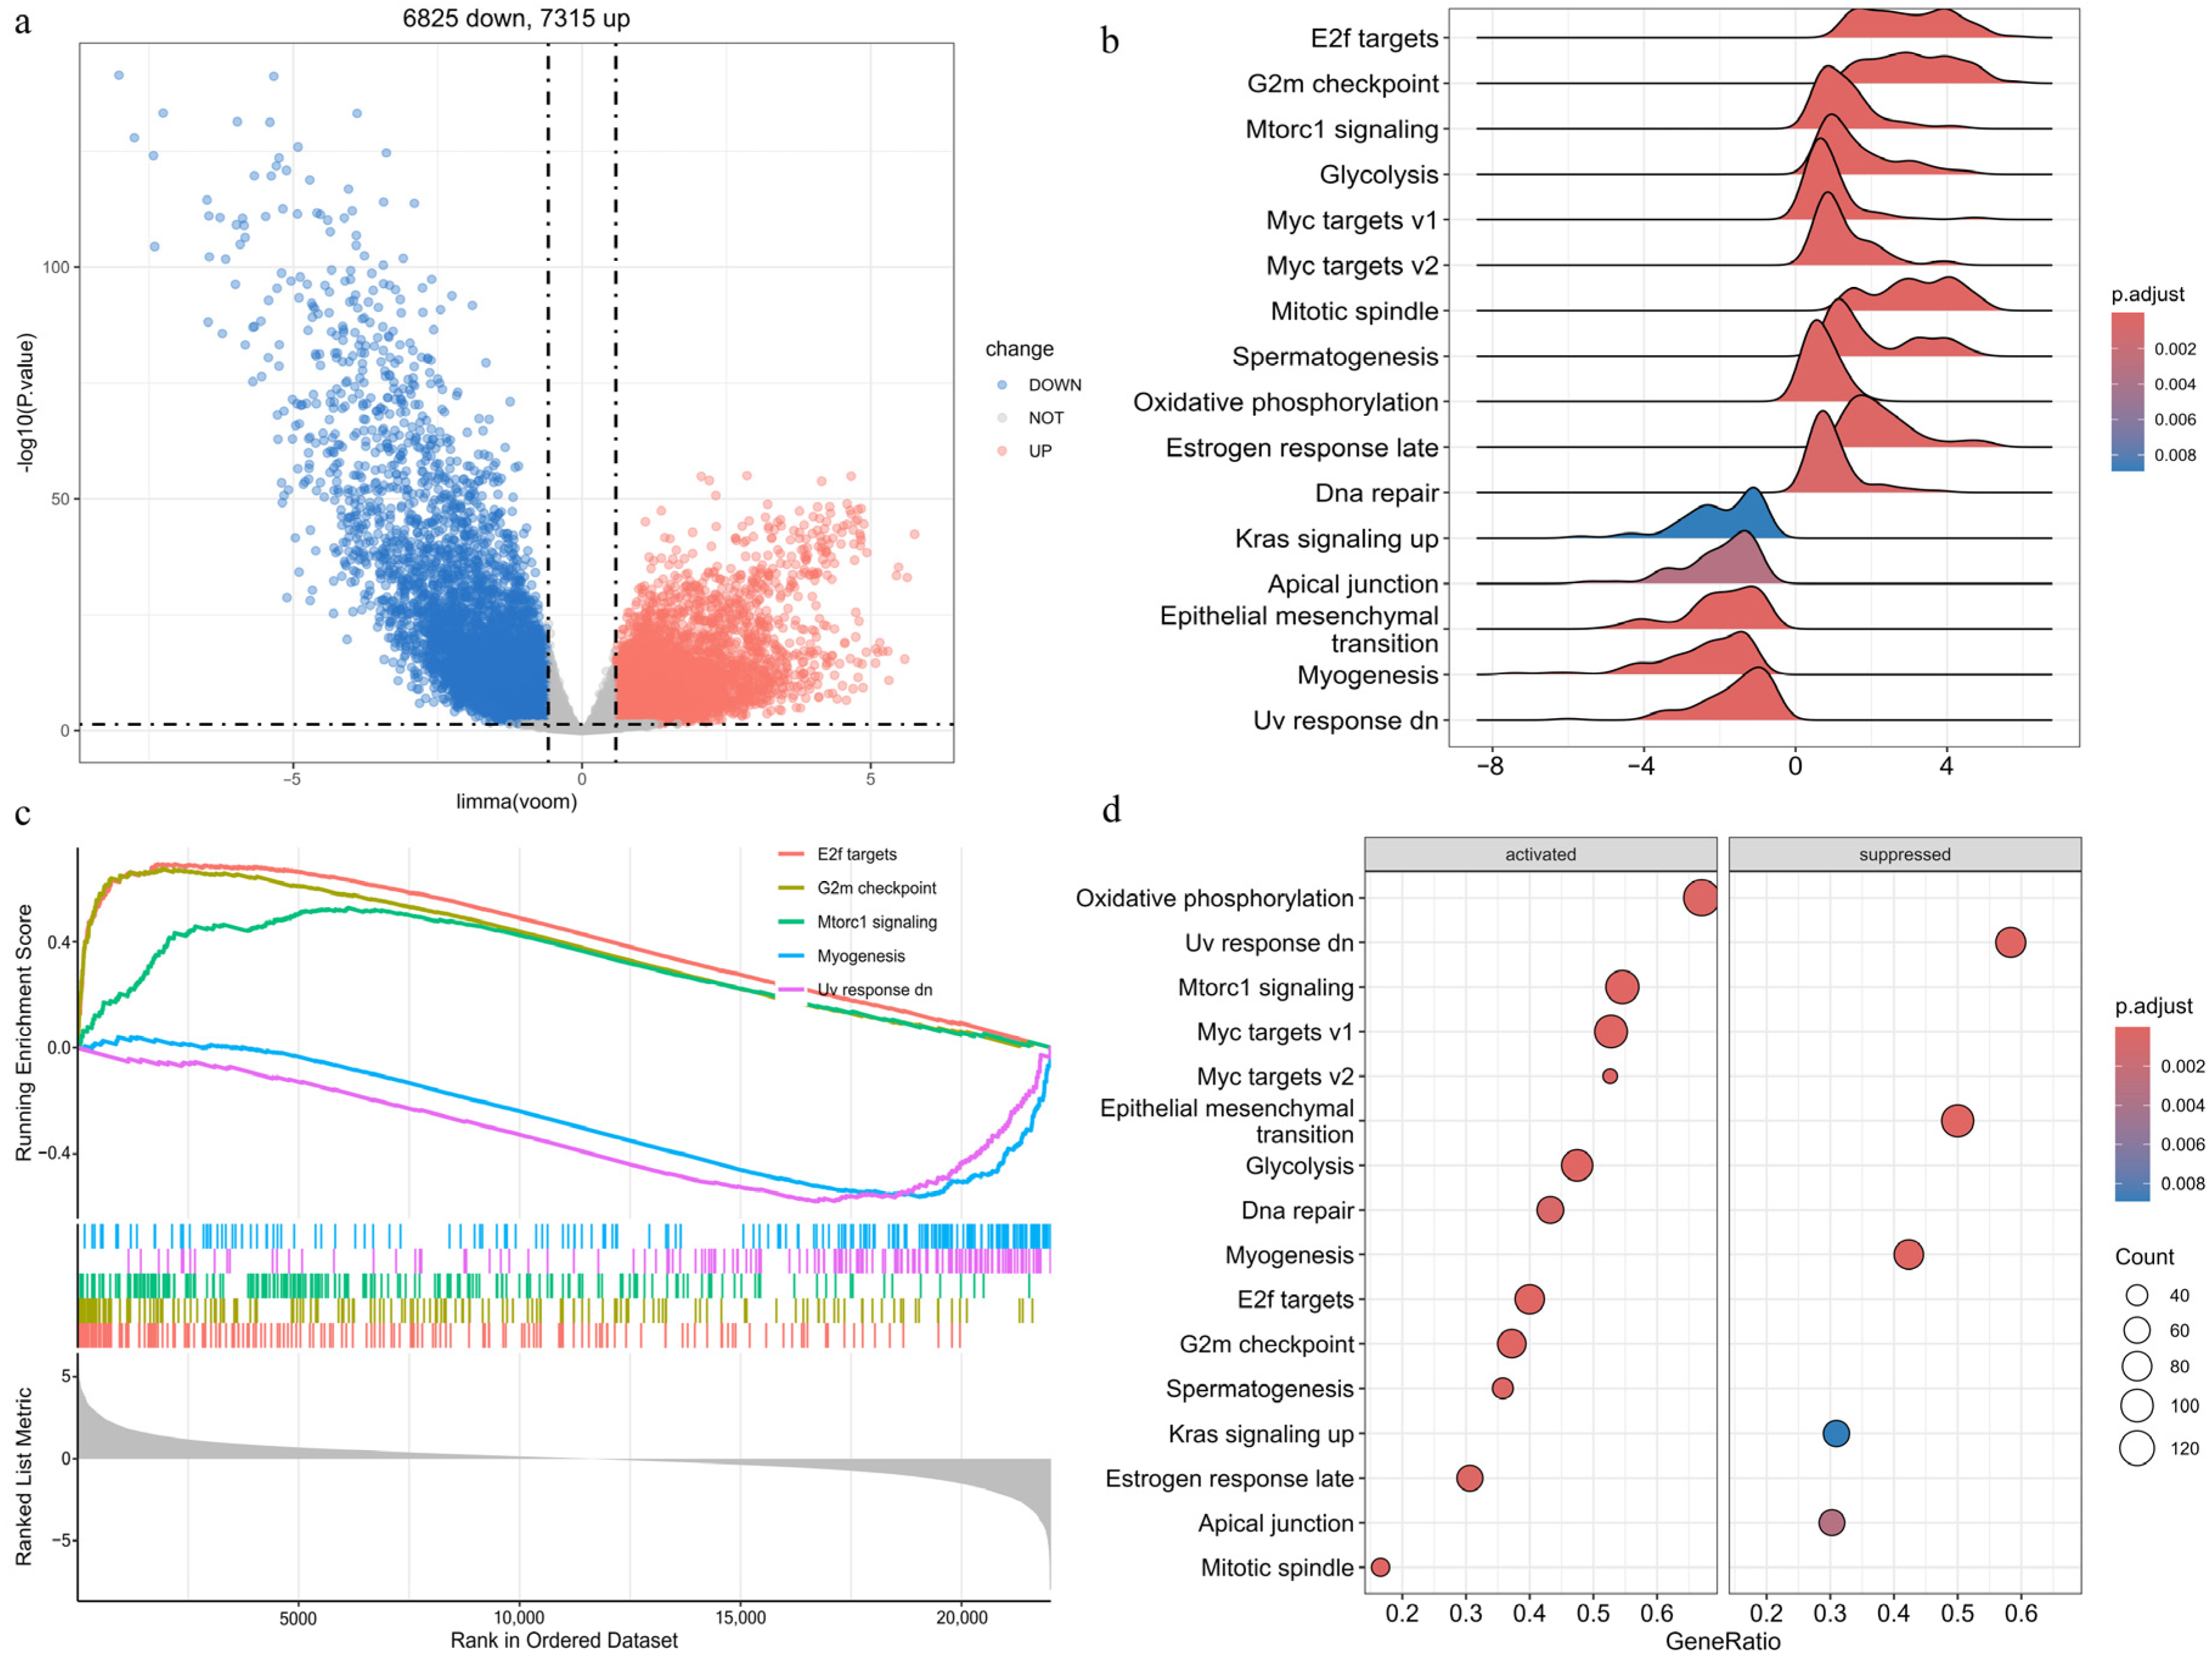
3.4. Differential Expression and Enrichment Analyses in EC

We analyzed gene expression profiles from 554 EC samples and 35 normal controls in the TCGA dataset. Using a cutoff of |FC| > 1.5 and an adjusted p-value < 0.05, we identified 14,140 DEGs (Supplementary Table S3). As shown in Figure 1a, 7315 genes are upregulated and 6825 are downregulated in the cancer samples. These DEGs reflect global gene expression alterations in EC.
We performed GSEA on the DEGs using the Hallmark pathway gene sets. The analysis identified 16 significantly enriched pathways (adjusted p < 0.05) (Figure 1b). The top five enriched pathways include E2F targets, G2M checkpoint, myogenesis, UV response downregulated, and MTORC1 signaling (Figure 1c). Figure 1d shows that 11 pathways are activated, while 5 are suppressed. Activated pathways—such as E2F targets, the G2M checkpoint, and MTORC1 signaling—are associated with cell cycle progression, metabolism, and energy production, thereby promoting tumor growth. The activation of DNA repair pathways indicates a cellular response to genomic instability. Suppressed pathways—such as estrogen response late, KRAS signaling up, and apical junction—suggest disruptions in hormone regulation, cell adhesion, and cellular stress responses. Downregulation of myogenesis and the UV response pathways reflects impaired cell differentiation and diminished stress defense mechanisms.

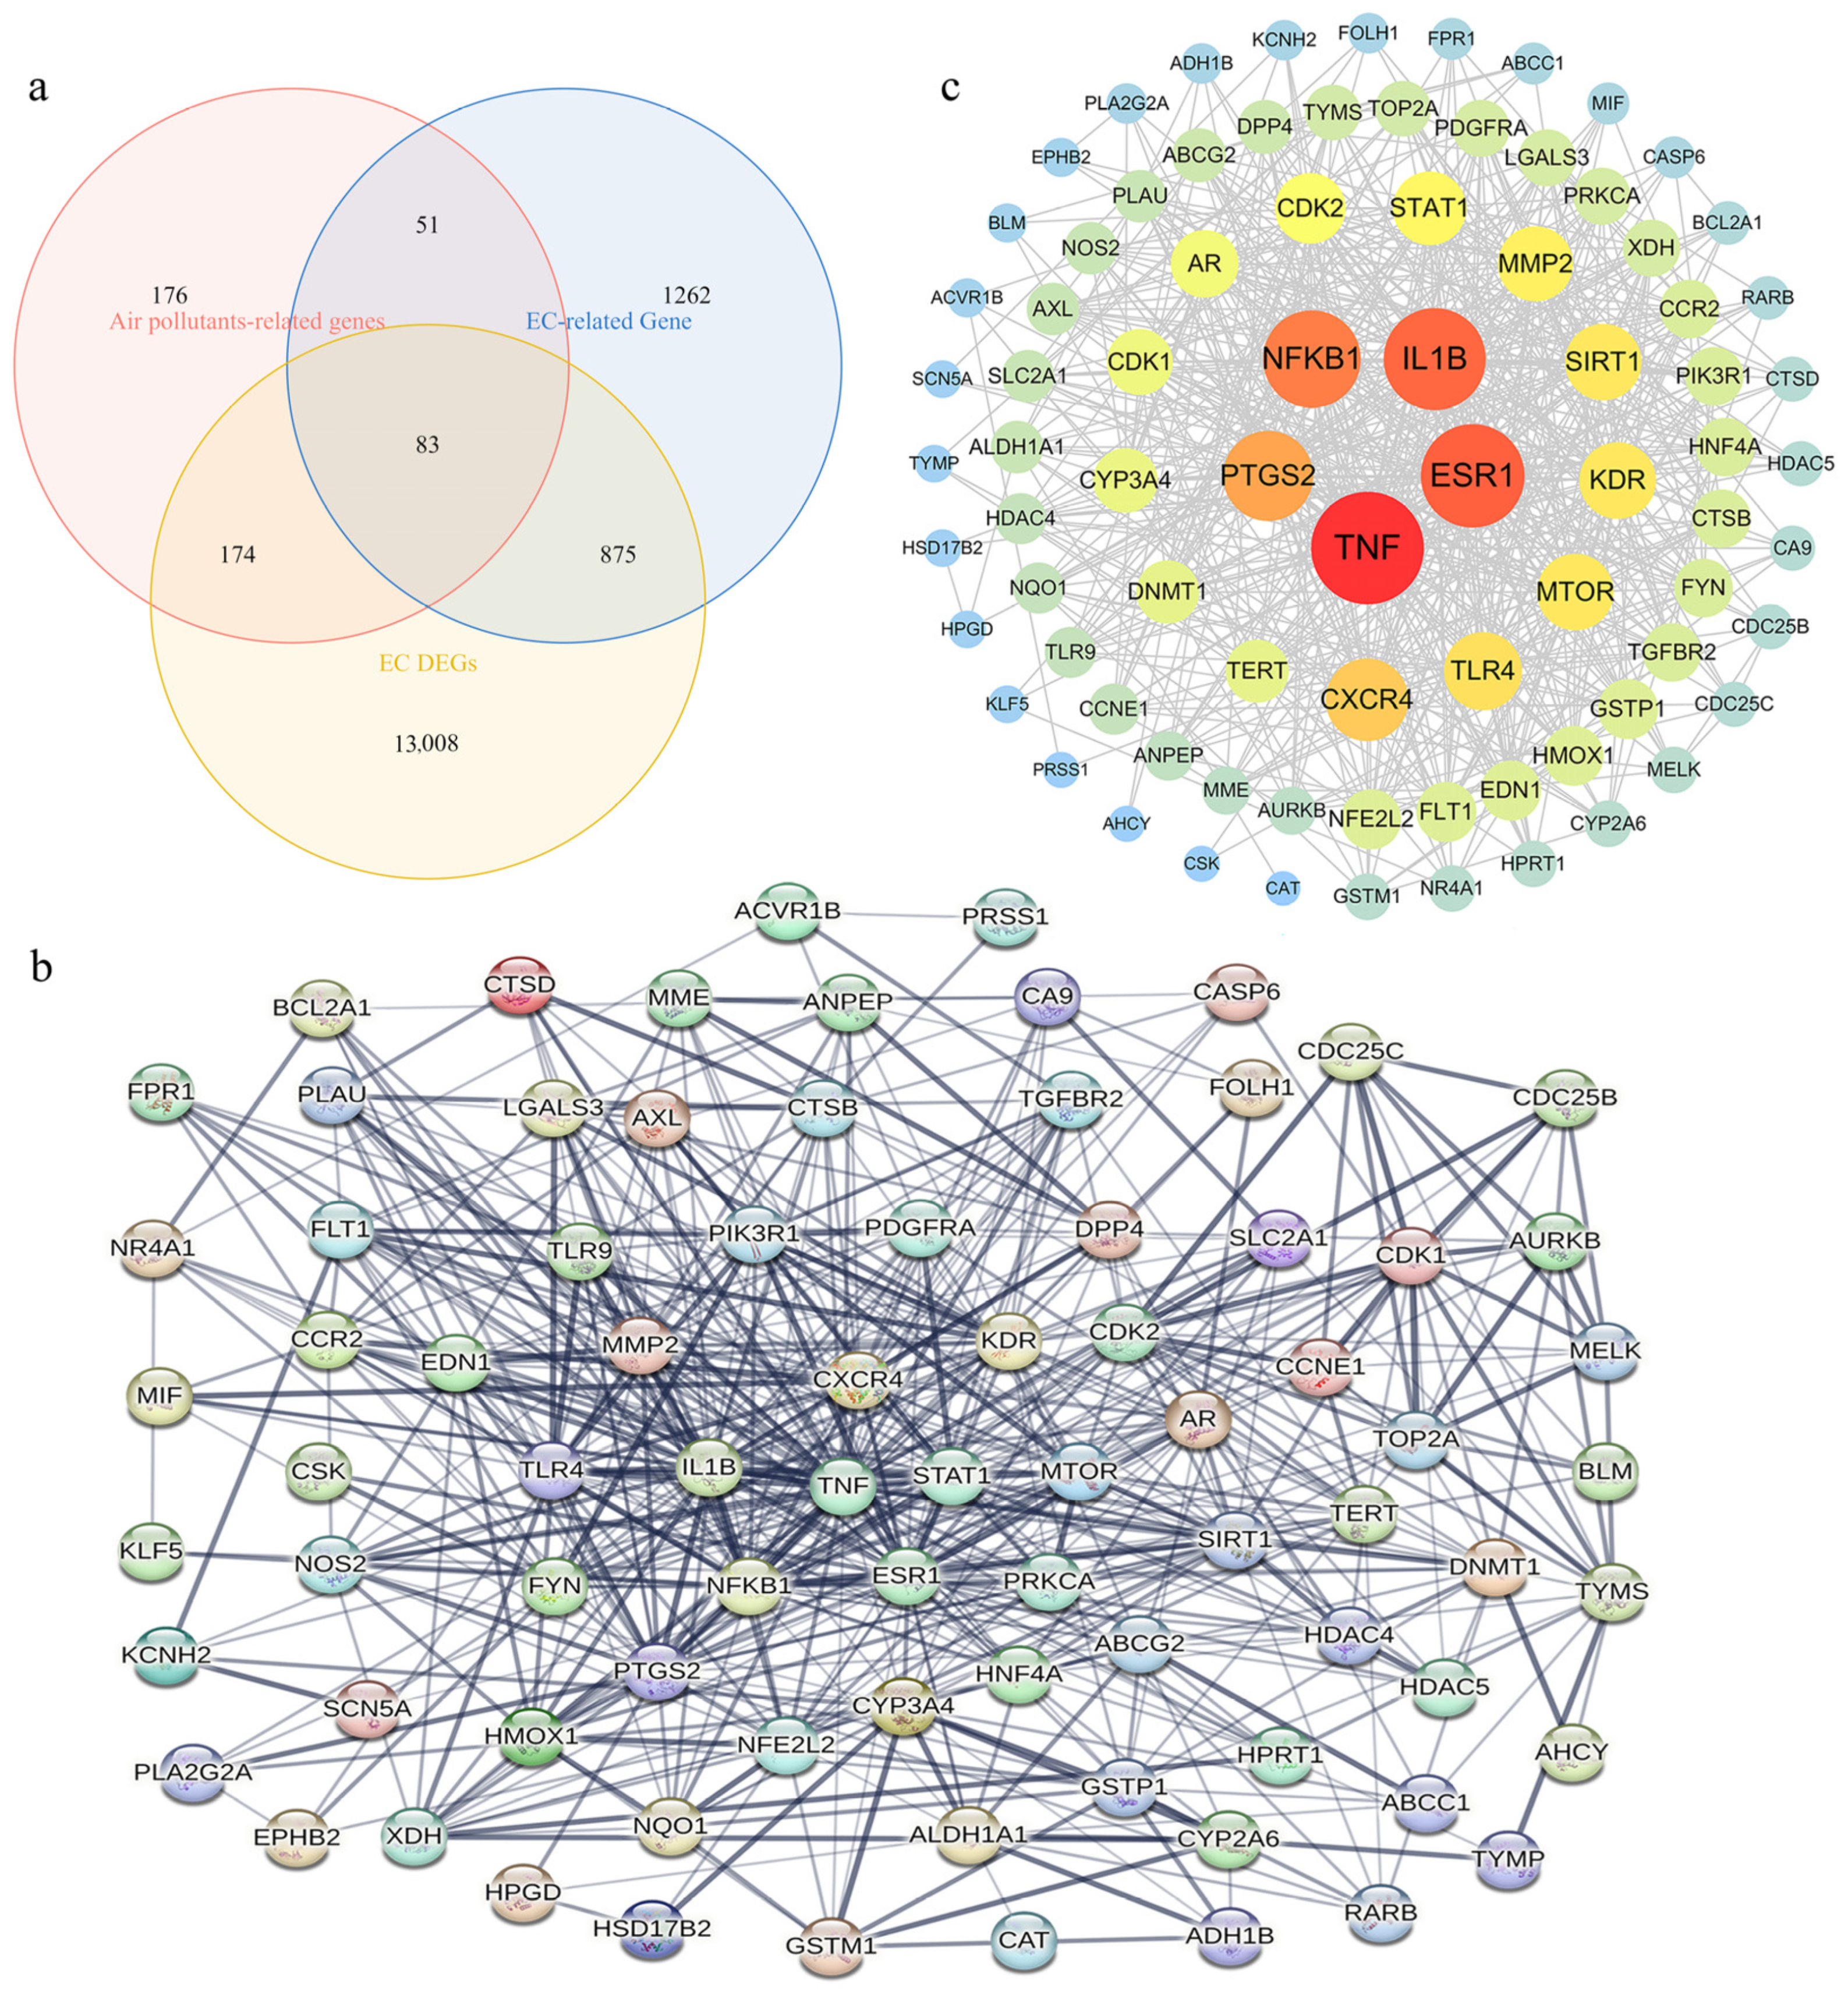
3.5. Identification of APECGs and Hub Genes from the PPI Network

A total of 83 APECGs were identified by intersecting 484 air pollutant-related target genes, 2771 EC-related genes, and 14,140 EC-DEGs (Figure 2a, Supplementary Table S4). These APECGs may serve as molecular links between air pollutant exposure and the development of EC.
We performed PPI analysis on the 83 APECGs using the STRING database, with a confidence score threshold of ≥0.4. After excluding isolated nodes, 81 genes remained in the network (Figure 2b). Next, we used Cytoscape 3.10.3 to visualize the PPI network. The resulting network consists of 81 nodes and 599 edges (Figure 2c). Nodes are ranked by degree, indicating the number of direct connections each node possesses. In the visualization, nodes with a higher degree are represented by larger, darker circles, indicating stronger connectivity. TNF, ESR1, IL1B, NFKB1, and PTGS2 exhibit the highest degrees, suggesting their roles as potential hub proteins.

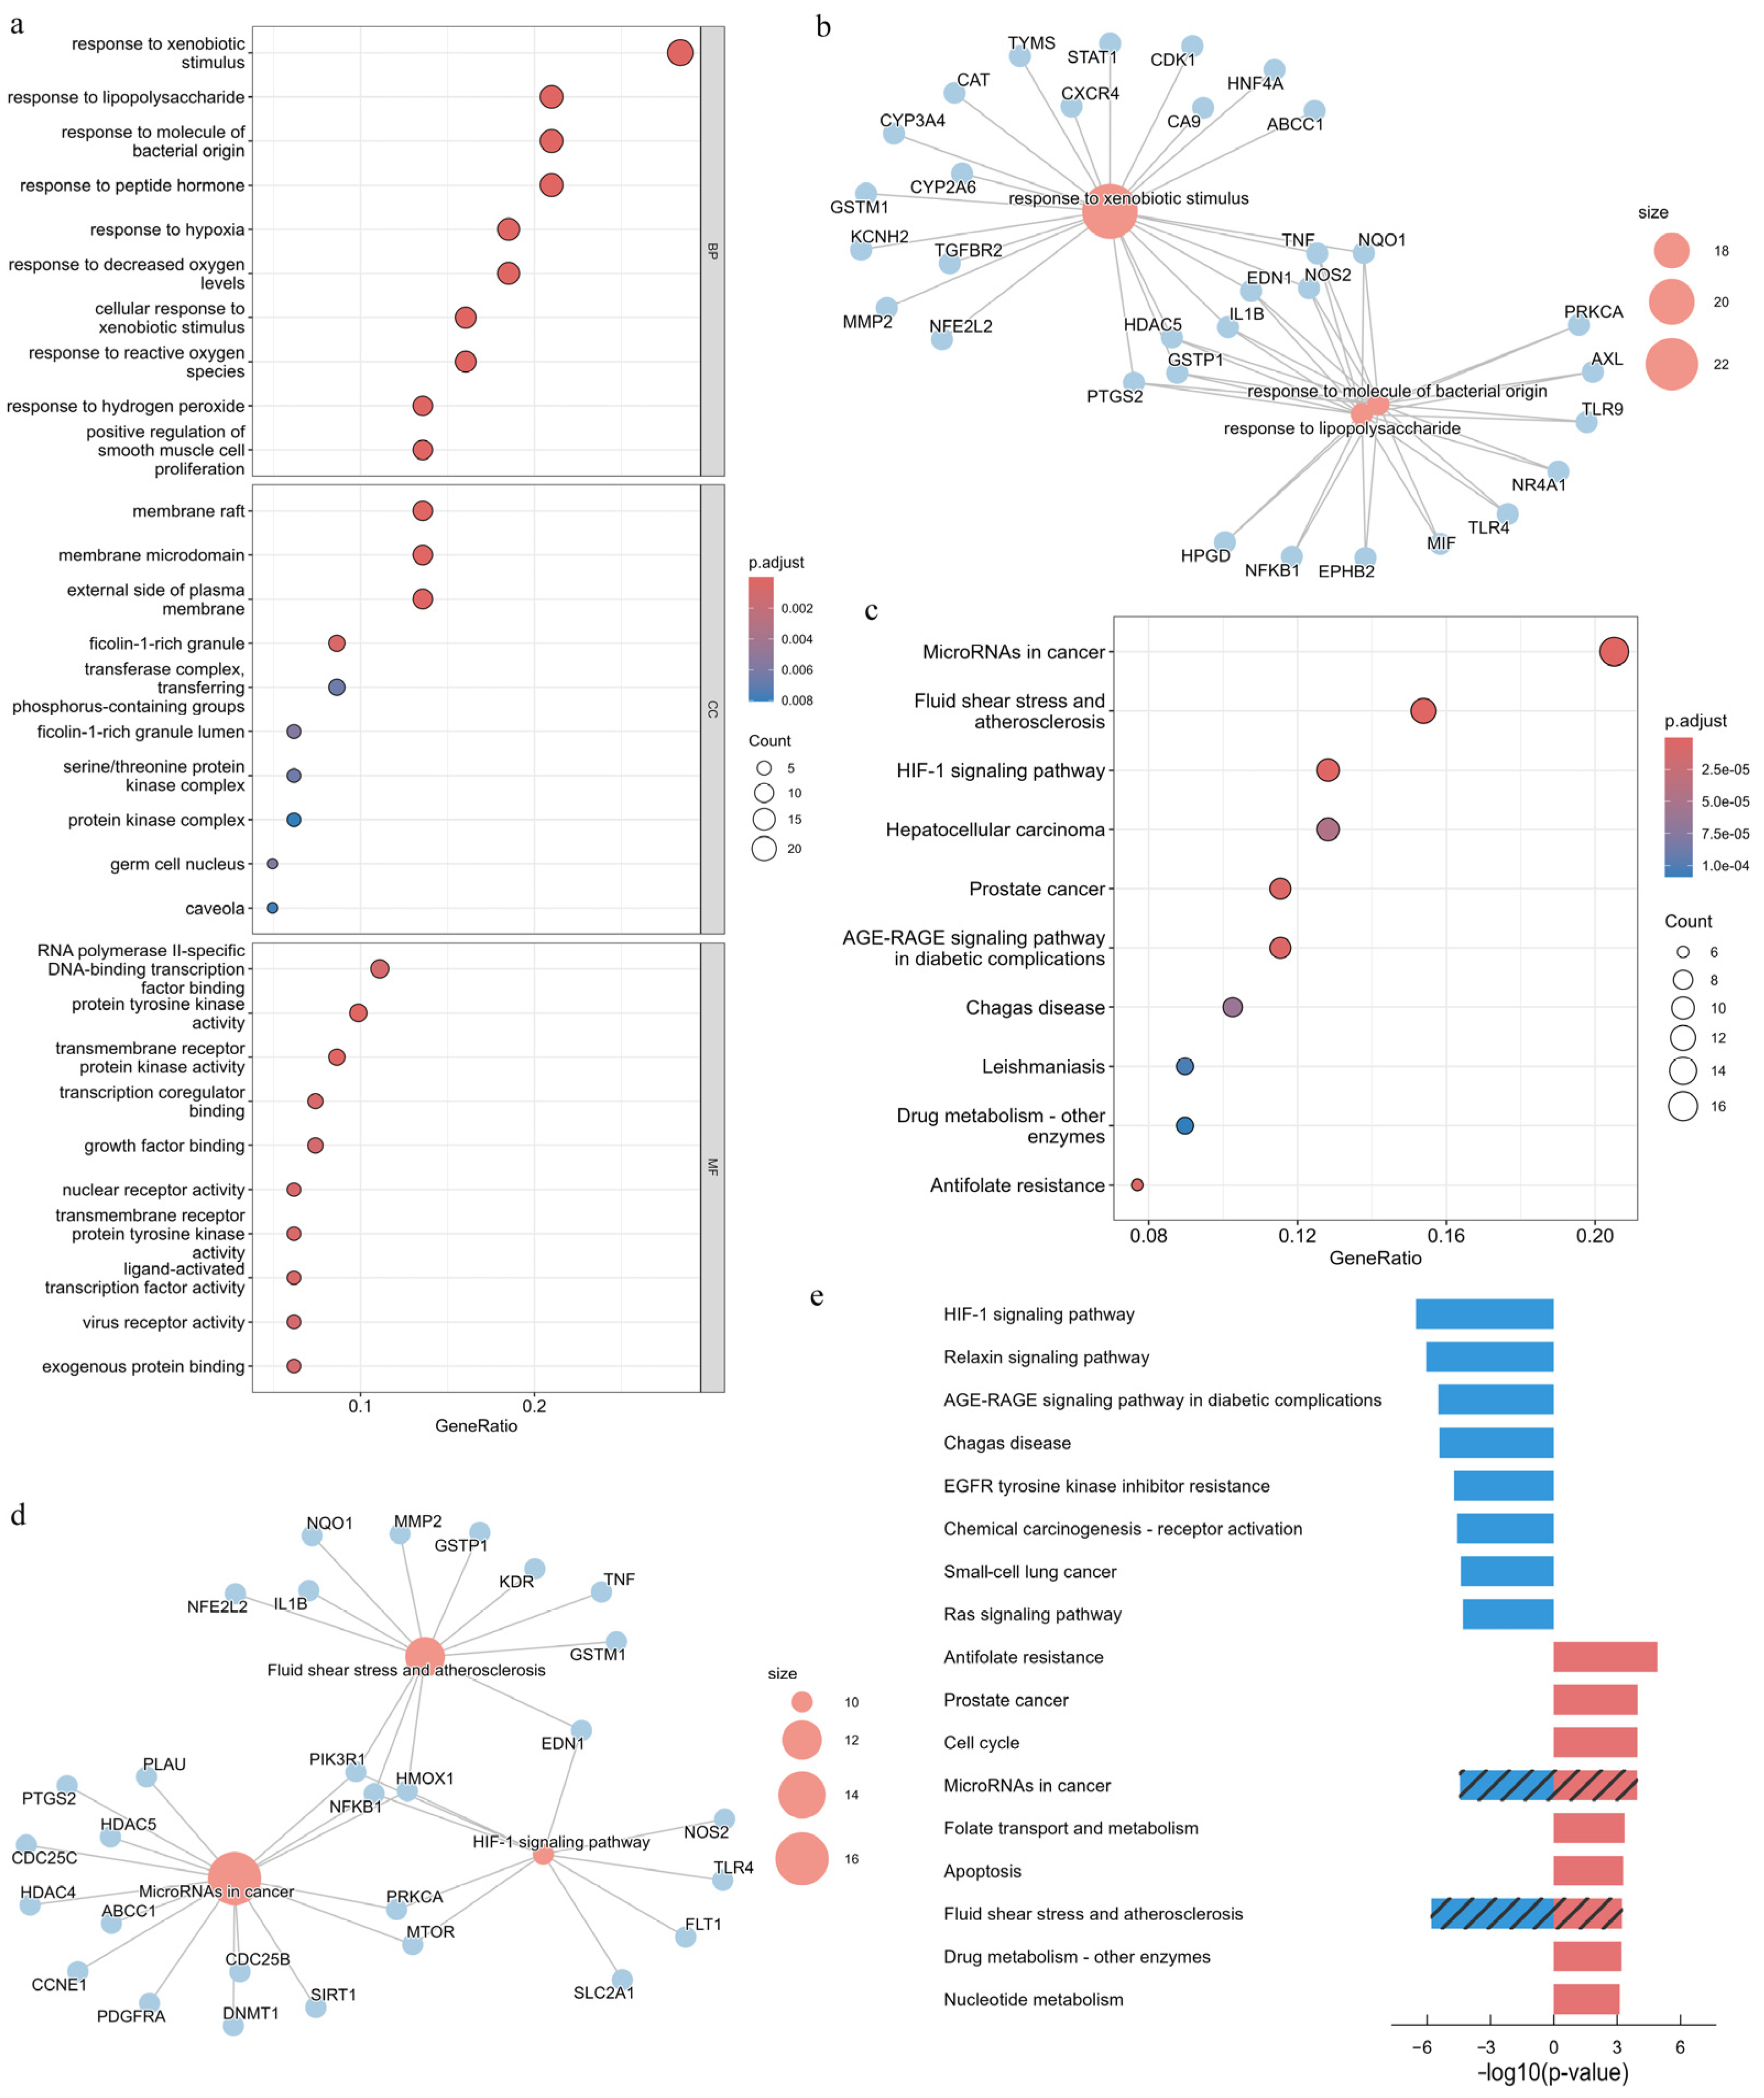
3.6. GO and KEGG Enrichment Analyses of APECGs

We performed GO enrichment analysis on the 81 APECGs. Figure 3a shows the top 10 enriched terms for BP, CC, and MF. For BP, the enriched terms include responses to xenobiotic stimuli, lipopolysaccharides, and bacterial molecules. The CC terms mainly include membrane raft, membrane microdomains, and the external side of the plasma membrane, while the MF terms mainly include RNA polymerase II-specific DNA-binding transcription factor binding, protein tyrosine kinase activity, and transcription factor binding. These GO enrichment results suggest that air pollutants may contribute to EC progression through multiple mechanisms, including inflammatory stress, abnormal membrane signaling, and dysregulation of transcriptional or kinase activity.
We also constructed a gene-pathway network to visualize the top enriched BP terms (Figure 3b). The network highlights key pathways, including responses to xenobiotic stimulus, bacterial molecules, and the lipopolysaccharide response sub-pathway, along with associated genes such as IL1B, TNF, PTGS2, and NFKB1. These genes, which are also hub nodes in the PPI network, suggest that air pollutants may promote EC progression through inflammation.
Next, we perform KEGG enrichment analysis on the 81 APECGs. Figure 3c shows the top 10 enriched KEGG pathways. The gene-pathway network in Figure 3d highlights the top three pathways (microRNAs in cancer, HIF-1 signaling pathway, and fluid shear stress and atherosclerosis), along with their associated genes such as CDC25B, PIK3R1, MMP2, and TLR4.
We then performed separate KEGG enrichment analyses for the 43 upregulated and 38 downregulated APECGs. The top significantly enriched KEGG pathways (p < 0.001) are shown in Figure 3e. Downregulated genes are enriched in pathways such as HIF-1 signaling, relaxin signaling, and AGE-RAGE signaling, while upregulated genes are involved in pathways such as cell cycle, folate metabolism, and antifolate resistance. Both gene sets show enrichment in microRNAs in cancer and fluid shear stress and atherosclerosis. This shared enrichment suggests that air pollutants likely influence EC by altering gene regulation and the tumor microenvironment, highlighting the roles of epigenetic alterations and vascular stress in the pathogenesis of air pollution-related EC.

3.7. Development and Evaluation of an Optimal Prognostic Model Using 117 Machine Learning Combinations

We divide the TCGA-UCEC cohort into a 7:3 ratio, yielding 367 training samples and 156 test samples. Univariate Cox regression analysis of 83 APECGs in the training set identified 15 APECGs significantly associated with prognosis (p < 0.05). Figure 4a shows the forest plot of these 15 APECGs, with hazard ratios (HR) ranging from 0.711 (FOLH1) to 2.035 (AHCY).
We trained prognostic models using 10 algorithms and their 117 combinations, then validated them in the test set. The C-index values were calculated for each model and ranked based on the average C-index in the test cohort. Figure 4b shows the C-index ranking of the top 20 models, with the RSF-SuperPC model achieving the highest average C-index in the test set. The RSF-SuperPC model selects 13 hub APECGs (ESR1, KCNH2, CCNE1, CCR2, HPRT1, FOLH1, CDC25C, AHCY, CTSD, CDC25B, MMP2, TLR4, and SLC2A1) and assigns weights based on their prognostic relevance (Figure 4c).
We also calculate the 1-, 3-, and 5-year AUCs for all 117 models. Figure 4g–i present the AUC rankings of the top 20 models. The RSF-SuperPC model achieves 1-year, 3-year, and 5-year AUCs of 0.725 (95% CI: 0.579–0.871), 0.731 (95% CI: 0.652–0.810), and 0.714 (95% CI: 0.630–0.798) in the training set, and 0.608 (95% CI: 0.501–0.685), 0.596 (95% CI: 0.509–0.683), and 0.610 (95% CI: 0.516–0.704) in the test set, respectively (Figure 4d–f). The detailed rankings of the 117 combinations are provided in Supplementary Figures S1–S4.

3.8. Risk Stratification Using a 13-Gene APECG Model

We constructed a risk score model for the TCGA training set based on 13 hub APECGs (Figure 1). The risk score was calculated as follows: risk score = (−2.2243197 × ESR1 expression) + (1.7999745 × KCNH2 expression) + (1.2085197 × CCNE1 expression) + (−1.0278868 × CCR2 expression) + (0.7521689 × HPRT1 expression) + (−1.7312403 × FOLH1 expression) + (0.9369951 × CDC25C expression) + (0.8612858 × AHCY expression) + (0.8077587 × CTSD expression) + (1.1285354 × CDC25B expression) + (−1.1263597 × MMP2 expression) + (−1.7882890 × TLR4 expression) + (1.0526847 × SLC2A1 expression). Patients in both the training and test sets were classified into high-risk and low-risk groups based on the optimal risk score cutoff. We examined the relationship between risk score and survival status. Figure 5a,b present the distribution of risk scores, survival events, and a heatmap of the expression of the 13 hub APECGs in both sets. The plot shows that patient mortality increases with higher risk scores in both the training and test sets. Kaplan–Meier analysis demonstrates that high-risk scores are associated with worse OS in the training set (p < 0.0001) and test set (p = 0.0015) (Figure 5c,d).

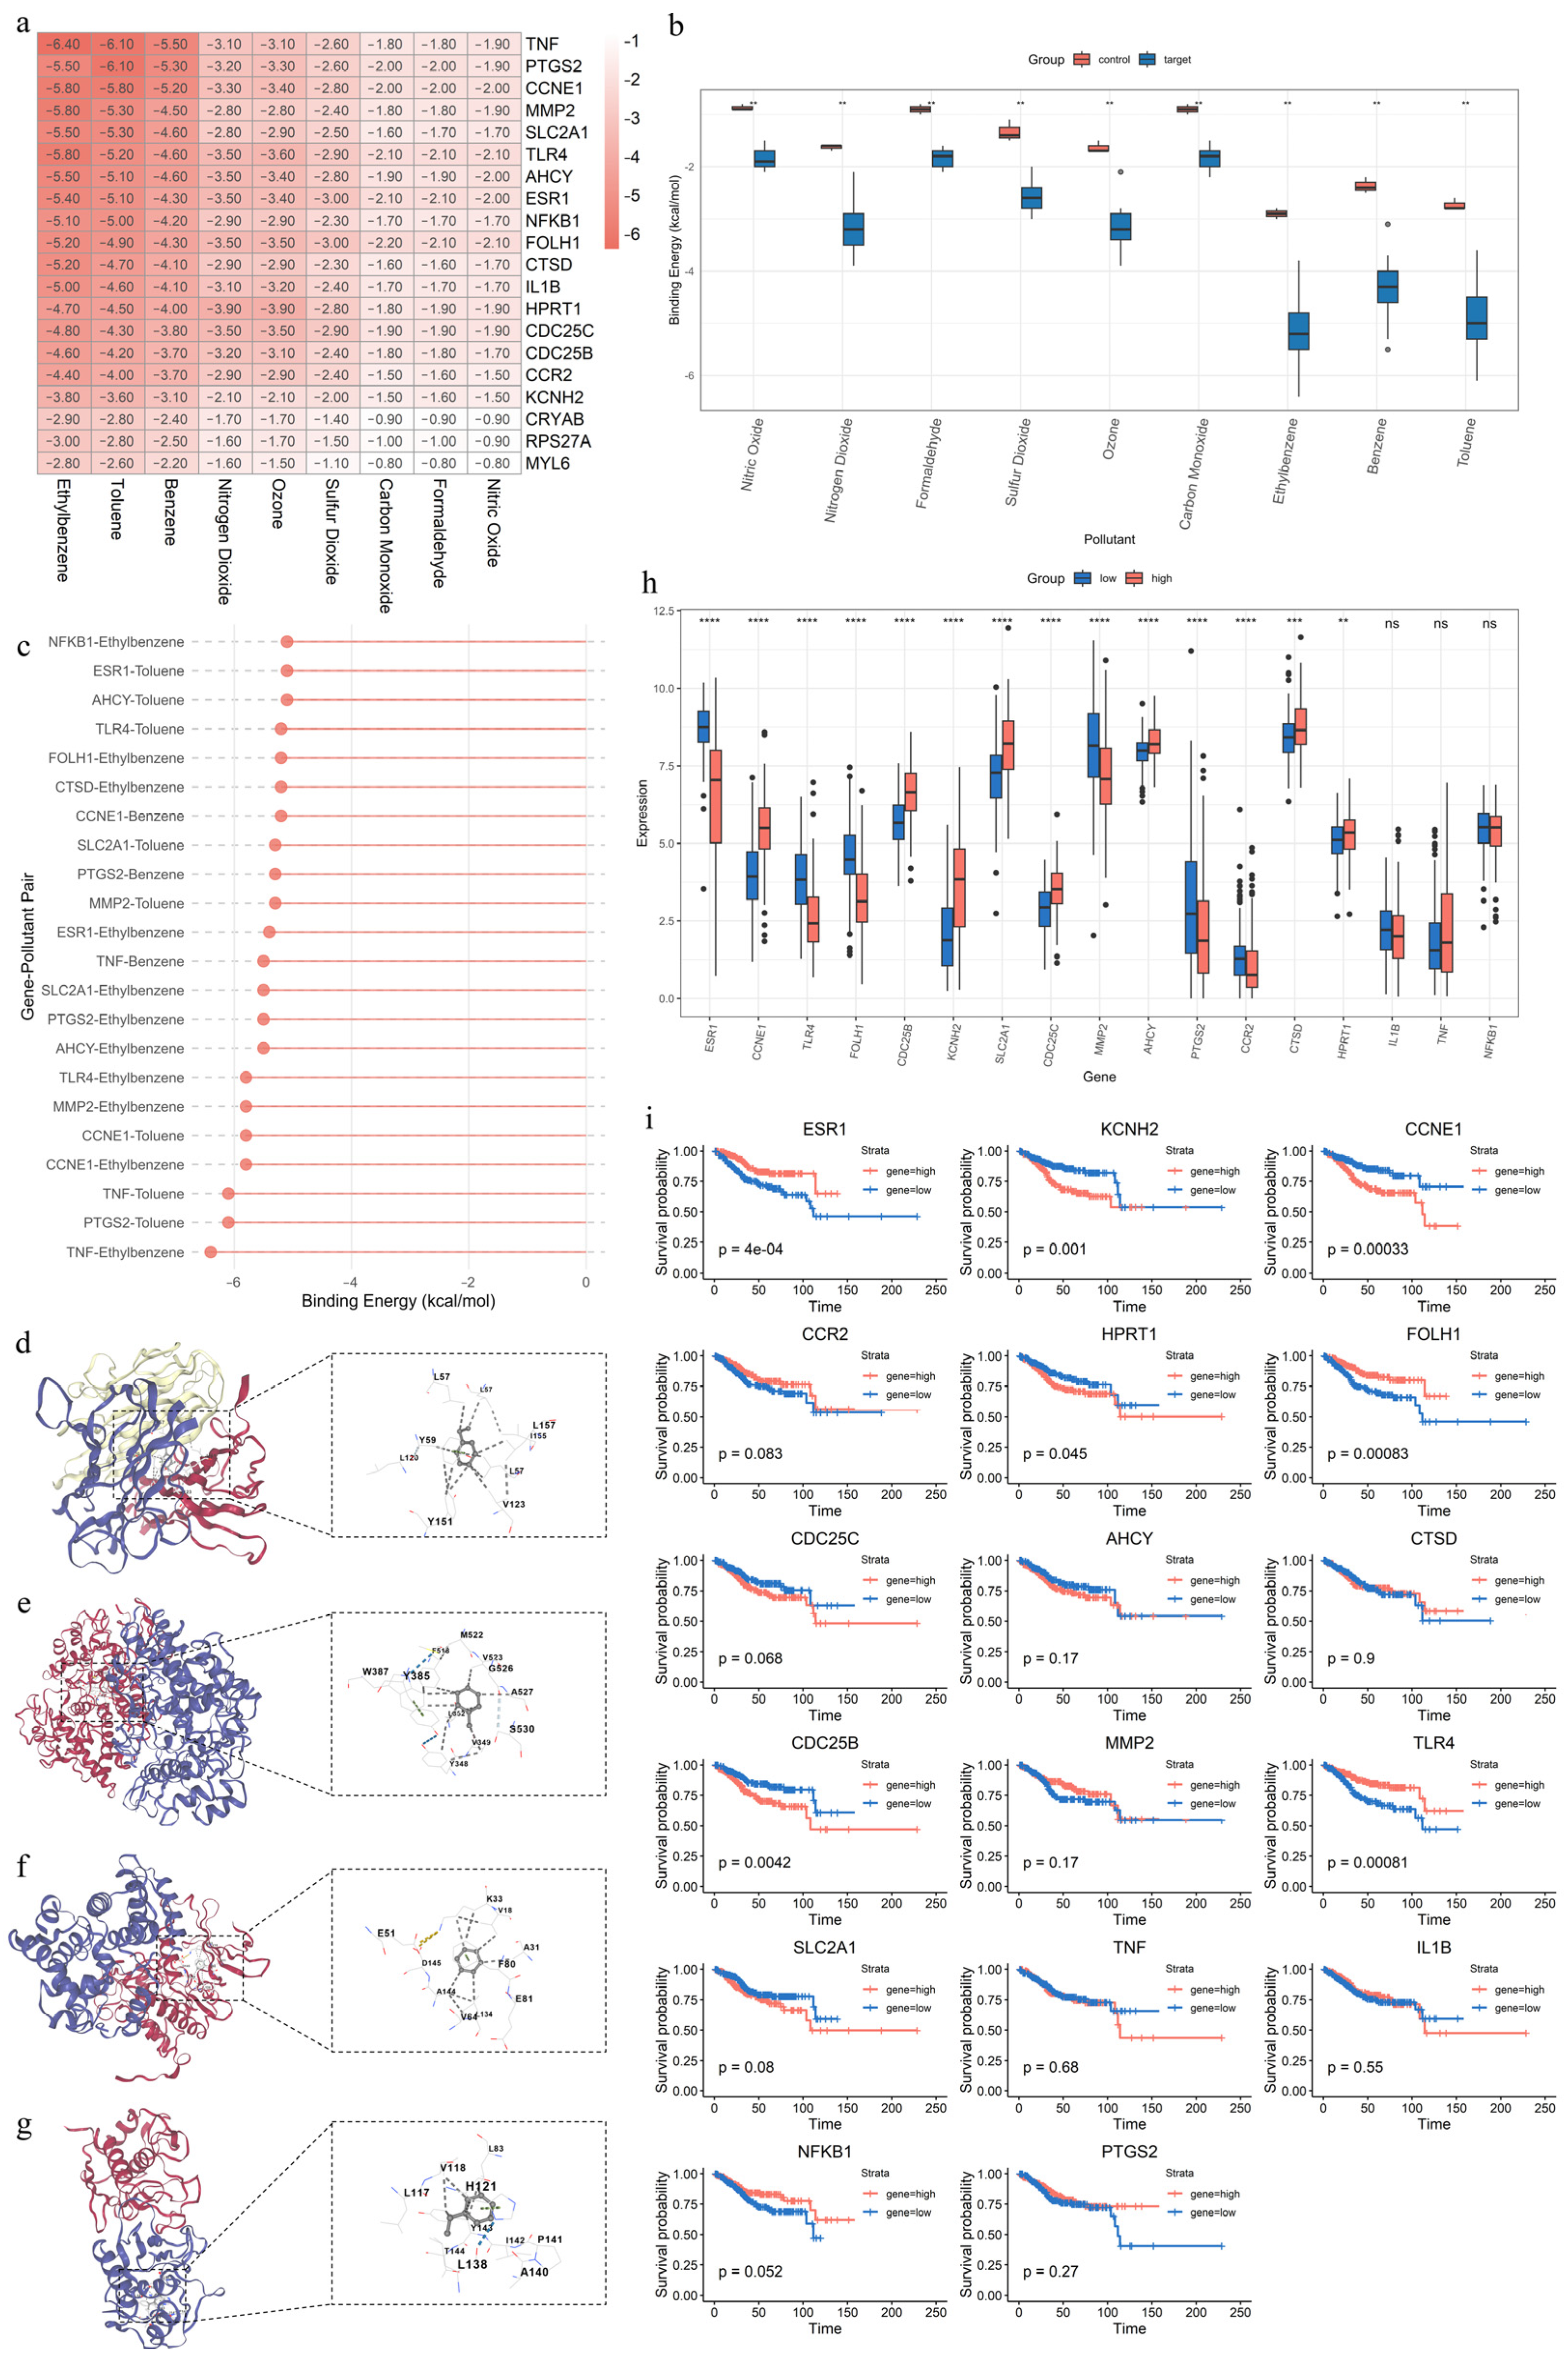
3.9. Molecular Docking, Expression Patterns, and Prognostic Significance of Key APECGs

To explore the potential regulatory role of key APECGs in EC under air pollutant exposure, we analyze 17 genes: 5 hub genes from the PPI network (TNF, ESR1, IL1B, NFKB1, and PTGS2) and 13 hub genes identified by the RSF-SuperPC model (ESR1, KCNH2, CCNE1, CCR2, HPRT1, FOLH1, CDC25C, AHCY, CTSD, CDC25B, MMP2, TLR4, and SLC2A1—note that ESR1 appears in both sets). We then performed the molecular docking, expression, and survival analyses.
The molecular docking analysis reveals that all 17 APECG proteins exhibit significantly stronger binding affinities to the nine air pollutants than to the non-target control proteins (CRYAB, RPS27A, and MYL6), with p-values < 0.01 by Wilcoxon’s rank-sum test (Figure 6a–g). This finding suggests that the selected APECGs possess a greater structural propensity to interact with these environmental pollutants. Among the pollutants, ethylbenzene shows stable binding (ΔG < –5 kcal/mol) with 12 APECGs (TNF, PTGS2, CCNE1, MMP2, SLC2A1, TLR4, AHCY, ESR1, NFKB1, FOLH1, CTSD, and IL1B), toluene with 9 APECGs (TNF, PTGS2, CCNE1, MMP2, SLC2A1, TLR4, AHCY, ESR1, and NFKB1), and benzene with 3 APECGs (TNF, PTGS2, and CCNE1) (Figure 6c). These results indicate that specific gaseous pollutants may directly bind to and potentially alter the structure or function of key APECGs, thereby contributing to EC progression in the context of environmental exposure.
The expression analysis reveals that 14 genes are differentially expressed between high- and low-risk groups (p < 0.01) (Figure 6h). Specifically, CCNE1, CDC25B, KCNH2, SLC2A1, CDC25C, MMP2, AHCY, CTSD, and HPRT1 are significantly upregulated in the high-risk group, whereas ESR1, TLR4, FOLH1, PTGS2, and CCR2 are downregulated. These findings suggest their potential involvement in disease progression.
The Kaplan–Meier survival analysis based on TCGA data further demonstrates that low expression of ESR1 (p < 0.0001), TLR4 (p < 0.0001), and FOLH1 (p < 0.0001) is associated with poor prognosis. In contrast, high expression of CCNE1 (p < 0.0001), CDC25B (p = 0.0042), and KCNH2 (p = 0.001) correlates with worse outcomes (Figure 6i).
To further clarify the potential roles of these genes in EC progression and their relevance to environmental exposures, we summarize the biological functions of all 17 APECGs, their associated signaling pathways, and their predicted interactions with representative air pollutants. These results are presented in Table 2.

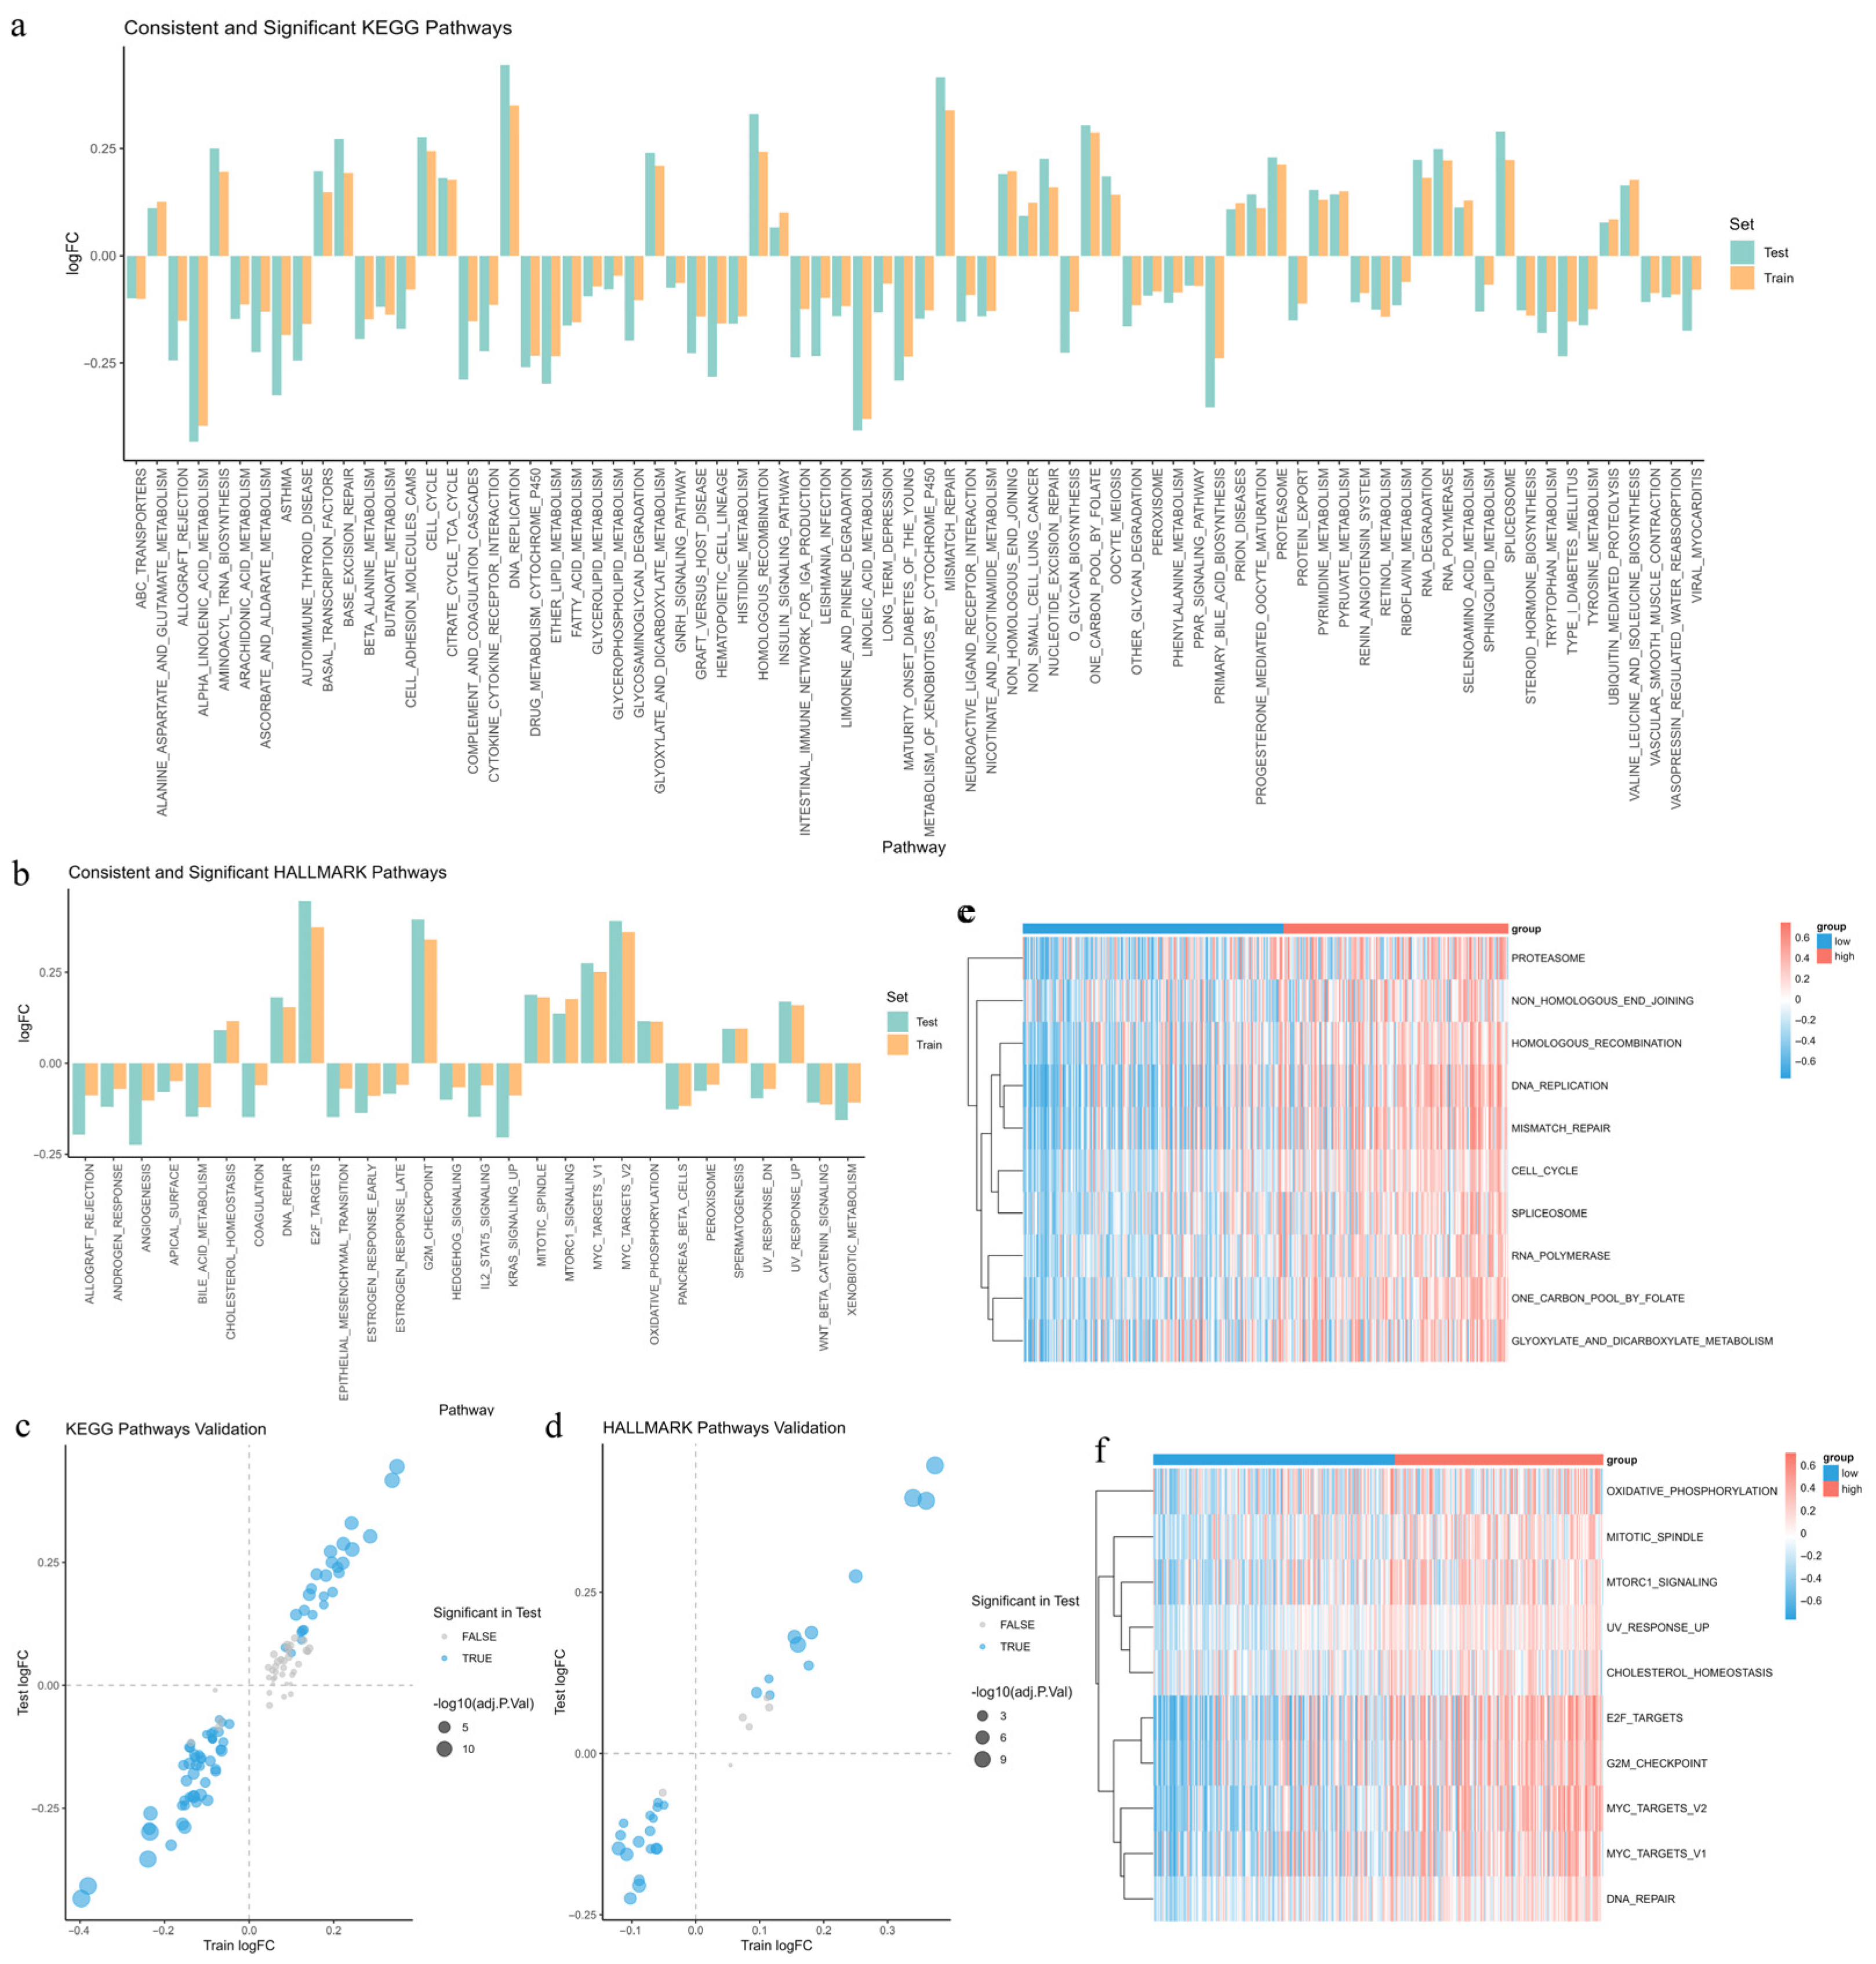
3.10. Identification of Differentially Enriched Pathways Between Risk Groups

To investigate enriched pathway differences between high-risk and low-risk EC groups, we applied GSVA to calculate the KEGG and Hallmark pathway enrichment scores. We used the “limma” R package (version 3.62.2) to perform differential analysis in the training set and validate the results in the test set. In the training set, we identified 113 KEGG pathways and 34 Hallmark pathways with significant differences (adjusted p-value < 0.05). In the test set, 76 KEGG pathways and 28 Hallmark pathways are significant (adjusted p-value < 0.05) and show a consistent log2FC direction (Figure 7a–d). These pathways likely influence EC progression under air pollution exposure.
We also generate heatmaps to visualize the enrichment scores of the top 10 pathways in the high-risk group (Figure 7e,f). In the high-risk group, significantly enriched pathways are mainly linked to DNA damage repair (homologous recombination, non-homologous end joining, and mismatch repair), cell cycle regulation (cell cycle, G2M checkpoint, and E2F targets), metabolic reprogramming (oxidative phosphorylation, folate metabolism, and cholesterol homeostasis), and transcription and protein degradation (MYC targets, RNA polymerase, spliceosome, and proteasome). These findings suggest that air pollution may promote EC progression by enhancing DNA repair and cell proliferation, altering metabolism, and activating transcriptional and protein processing pathways.

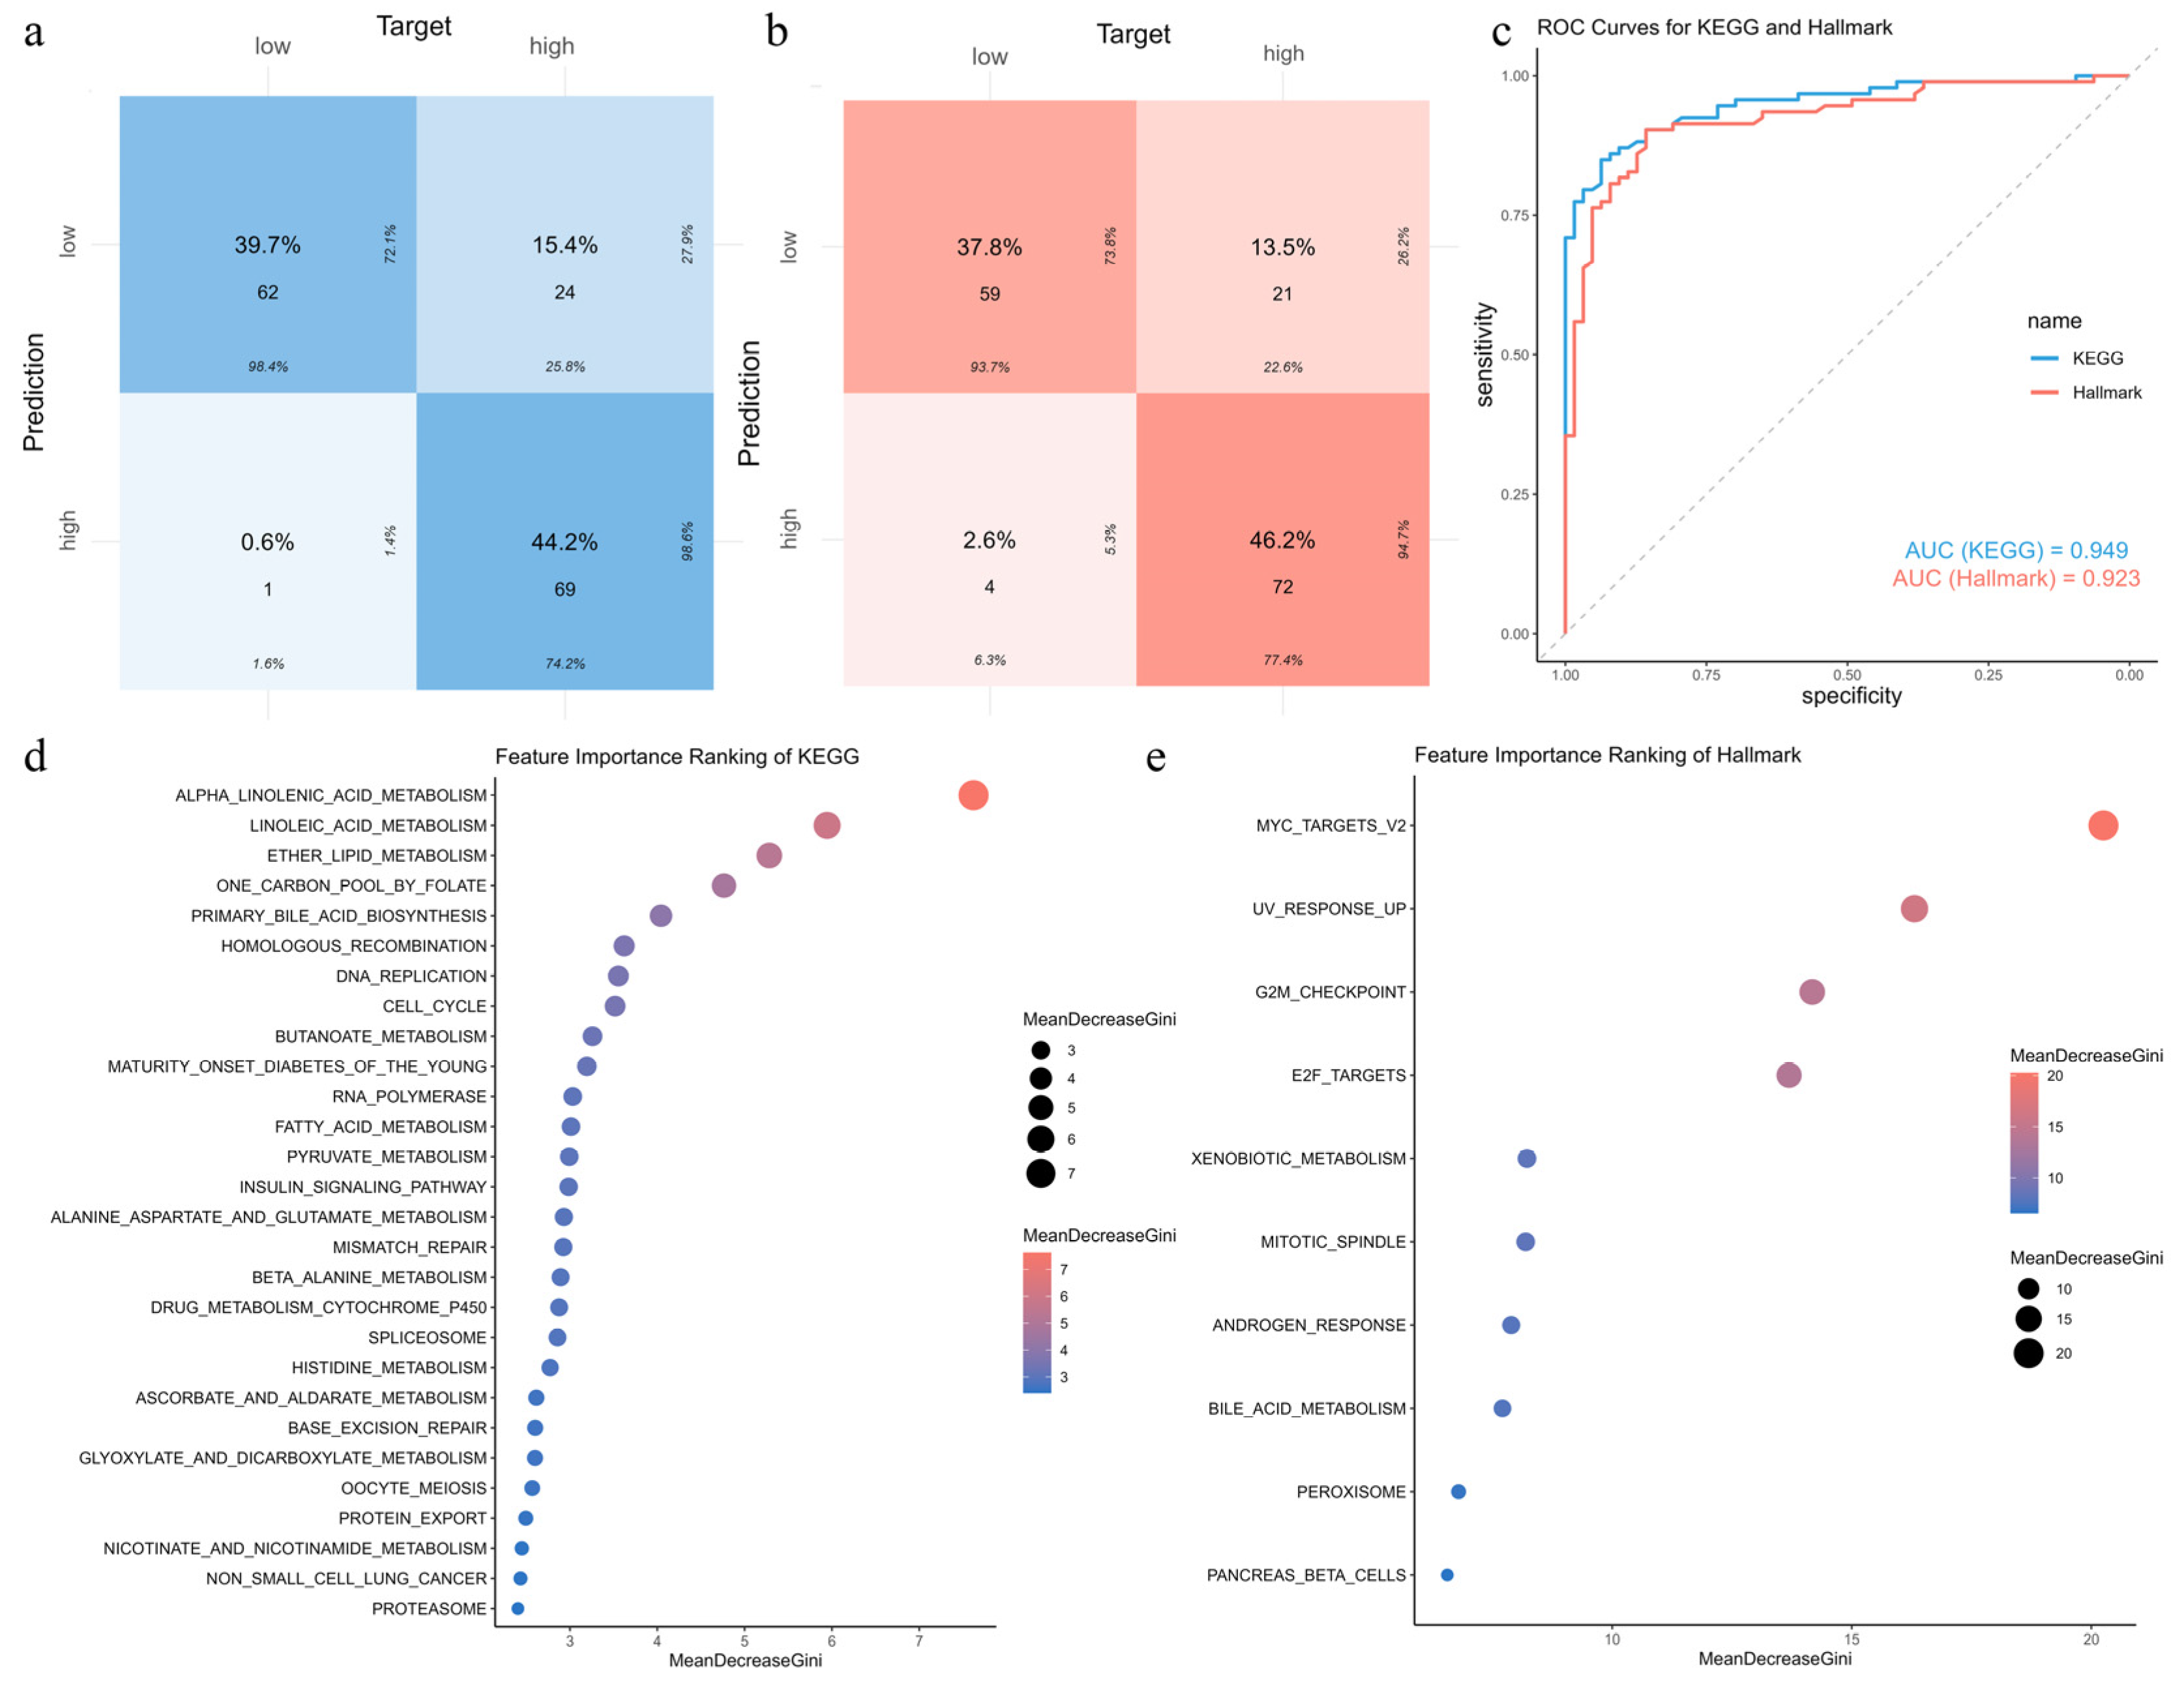
3.11. Construction and Validation of Random Forest Models for Risk-Associated Pathways

We constructed random forest models using the 76 KEGG and 28 Hallmark pathways from the training set to identify the most relevant pathways for EC risk prediction. We validated these models using the test set. For KEGG pathways, the model achieves an accuracy of 0.840, sensitivity of 0.742, precision of 0.986, and an F1 score of 0.847 (Figure 8a). For Hallmark pathways, the model achieves an accuracy of 0.840, sensitivity of 0.774, precision of 0.947, and an F1 score of 0.852 (Figure 8b). The AUC values are 0.949 (95% CI: 0.917–0.981) for KEGG and 0.923 (95% CI: 0.880–0.966) for Hallmark pathways, indicating strong predictive performance (Figure 8c). Feature importance was evaluated using the Mean Decrease in Gini Impurity (MDGI). Pathways with MDGI values above the mean were selected, resulting in 28 KEGG pathways and 10 Hallmark pathways (Figure 8d,e). Among the KEGG pathways, pathways like cell cycle, DNA replication, and mismatch repair stand out. These pathways regulate cell proliferation and genomic stability, which may be disrupted by air pollution in EC. For Hallmark pathways, pathways like MYC targets V2, the G2M checkpoint, and E2F targets stand out. These pathways are associated with tumor growth, suggesting their involvement in EC risk under air pollution exposure.

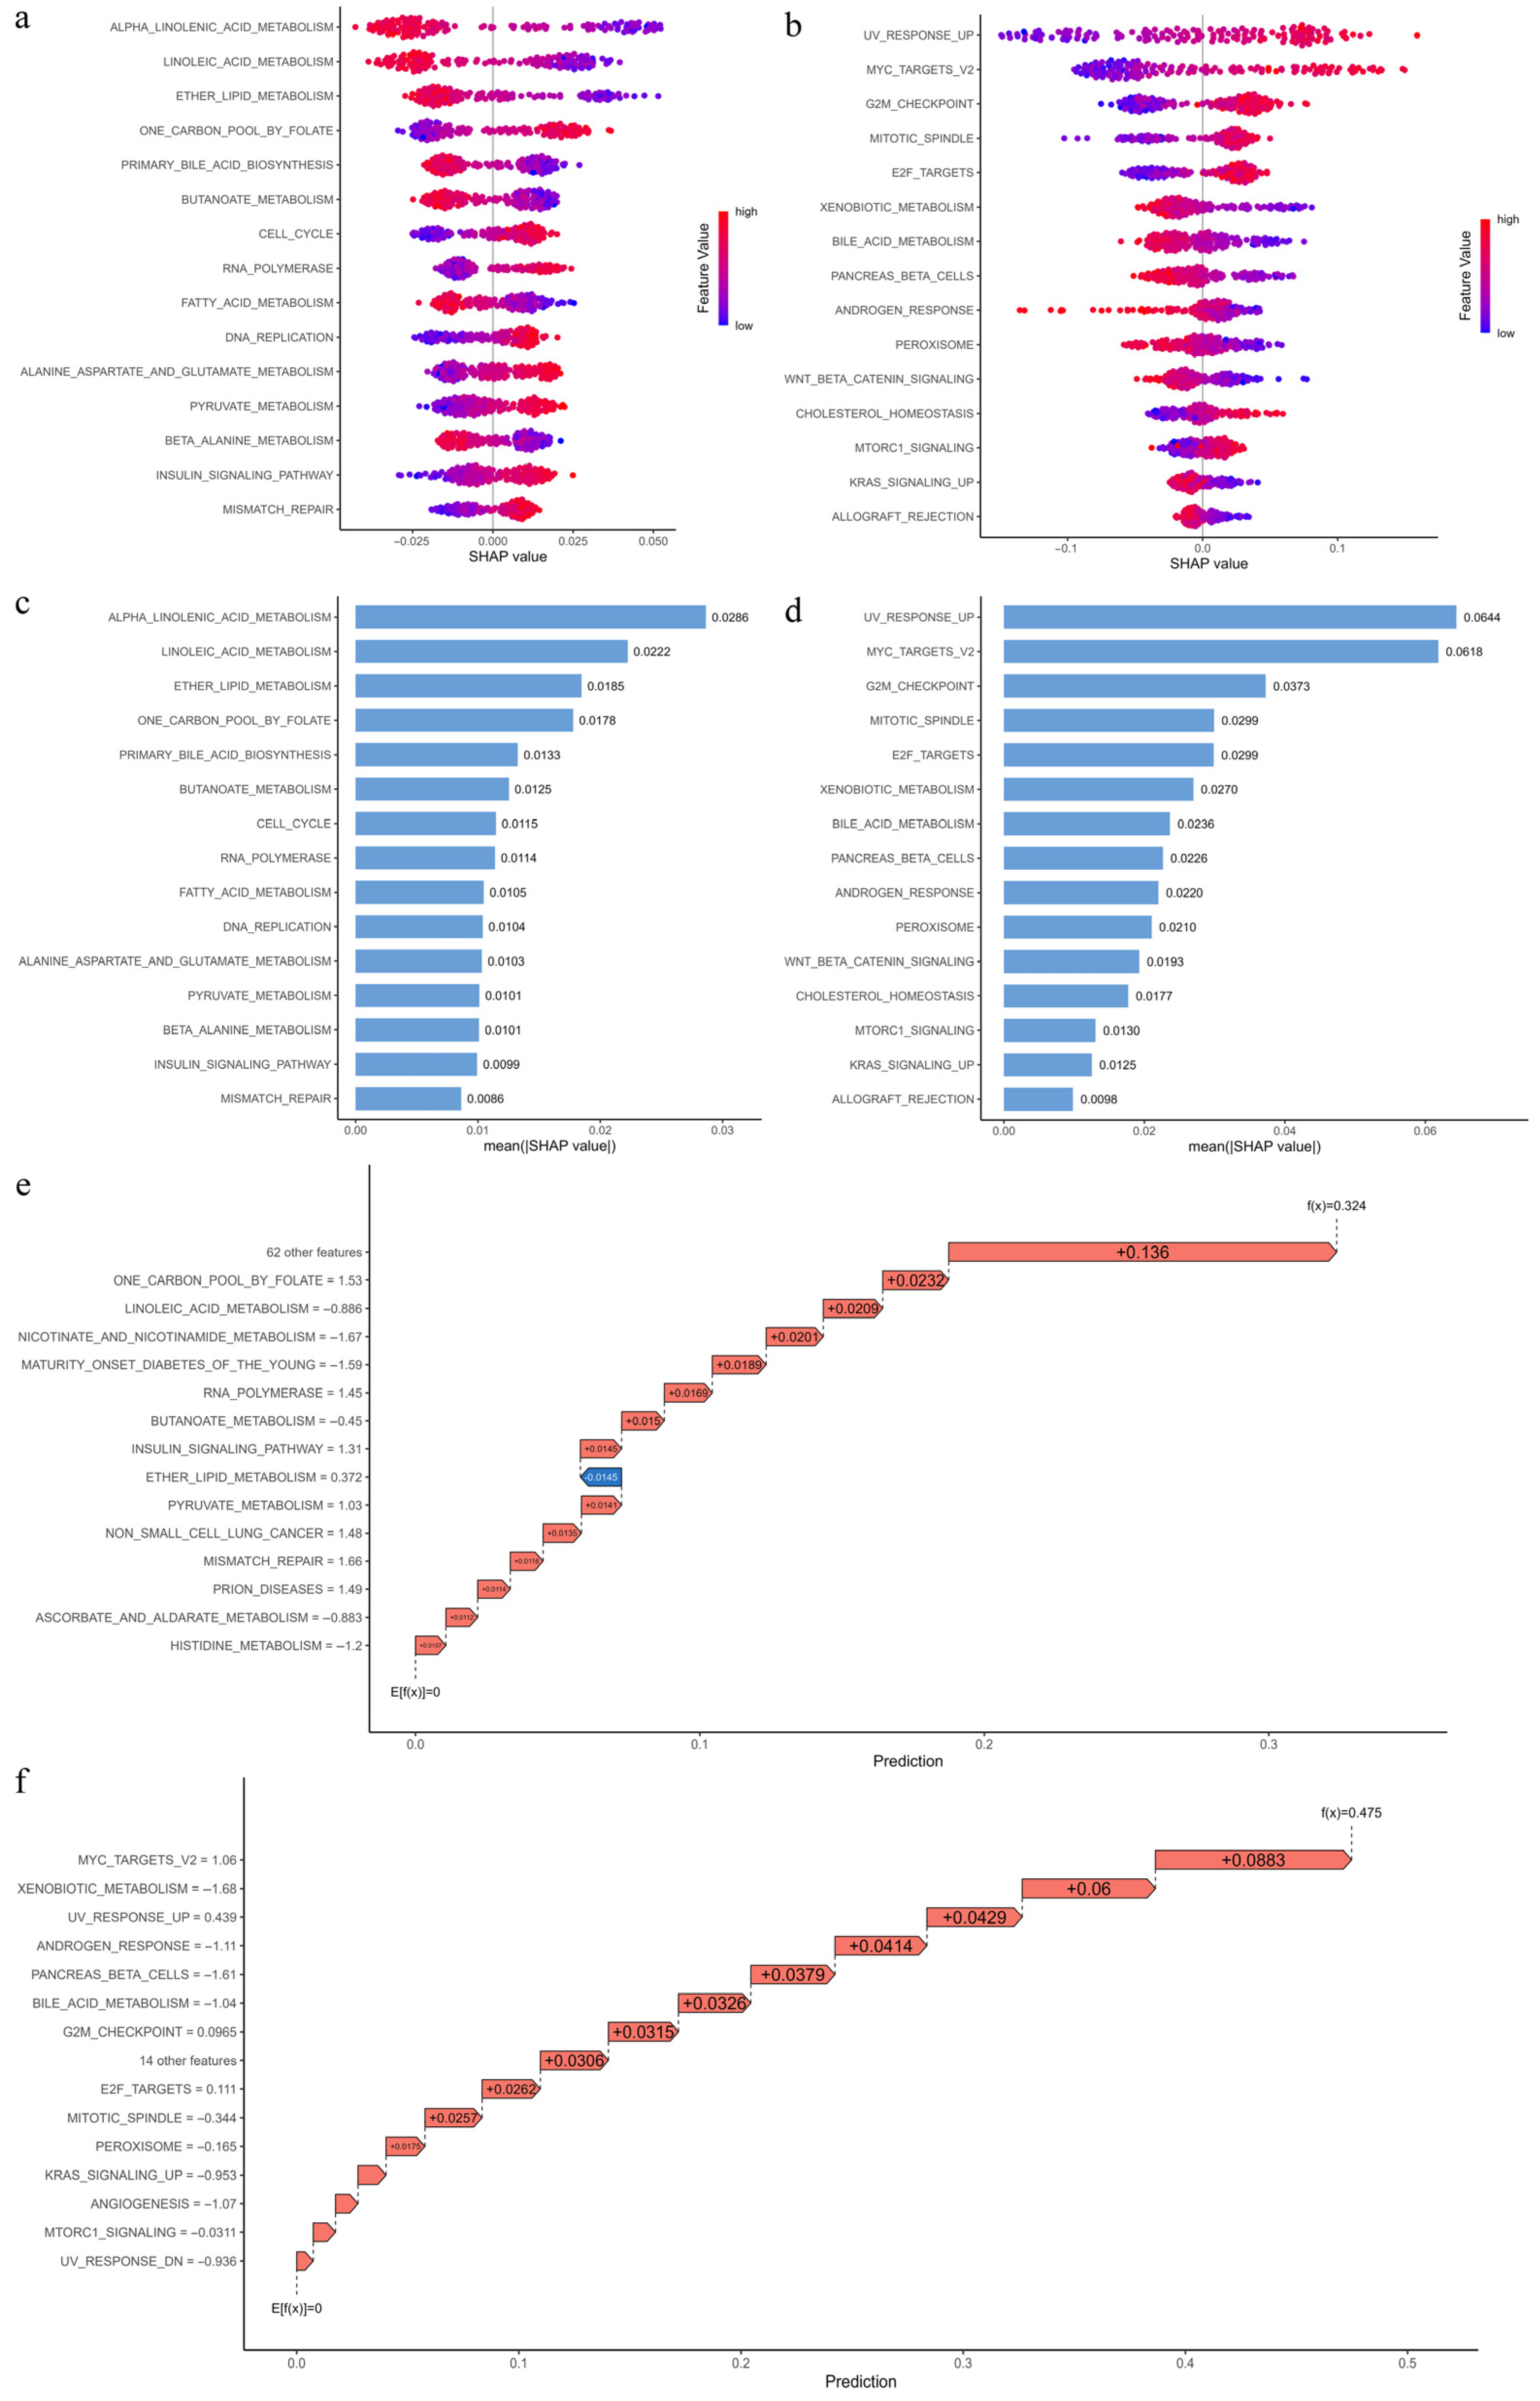
3.12. Interpretation of Pathway Importance in Risk Prediction Using SHAP Analysis

To interpret the impact of pathways on EC risk prediction, we calculated SHAP values for the random forest models. The SHAP summary plots highlight the top 15 KEGG and Hallmark pathways and their contributions (Figure 9a,b). Pathways associated with cell cycle progression (cell cycle, DNA replication, E2F targets, G2M checkpoint, and mitotic spindle), DNA repair (mismatch repair), oncogenic signaling (MTORC1 signaling, MYC targets V2, and UV response up), metabolic reprogramming (one carbon pool by folate, alanine aspartate and glutamate metabolism, pyruvate metabolism, and cholesterol homeostasis), and regulatory signaling (insulin signaling) show higher activity in the high-risk group, while pathways linked to detoxification (xenobiotic metabolism), lipid metabolism (fatty acid metabolism, alpha-linolenic acid metabolism, linoleic acid metabolism, ether lipid metabolism, primary bile acid biosynthesis, butanoate metabolism, beta-alanine metabolism, bile acid metabolism, and peroxisome), hormonal regulation (androgen response and pancreas beta cells), and immune or signaling suppression (WNT beta catenin signaling, KRAS signaling up, and allograft rejection) exhibit lower activity in the high-risk group. These findings suggest that air pollutants promote EC progression by upregulating pathways involved in cell cycle progression, proliferation, DNA repair, oncogenic signaling, metabolic reprogramming, and regulatory signaling, thereby accelerating tumor growth and genomic instability in high-risk individuals. In contrast, suppressed activity in detoxification, lipid metabolism, hormonal regulation, and immune-related pathways may weaken protective mechanisms and increase EC susceptibility.
To visualize the contribution of the top 15 KEGG and Hallmark pathways to EC risk prediction, representative true positive samples were selected for SHAP waterfall plots (Figure 9e,f). Figure 9e presents the cumulative SHAP contributions of the top 15 KEGG pathways in predicting a high-risk outcome (f(x) = 0.324), while Figure 9f shows the corresponding Hallmark pathways (f(x) = 0.445).

4. Discussion

The link between environmental exposures and EC remains poorly understood, particularly with respect to gaseous air pollutants, which are widespread in industrial and urban environments. In this study, we adopt an integrative approach that combines network toxicology, transcriptomics, molecular docking, and machine learning to investigate how exposure to common air pollutants may shape the molecular landscape and clinical progression of EC. Our findings suggest a biologically potential cascade through which air pollutants—especially benzene, toluene, and ethylbenzene—may promote tumorigenesis through the disruption of DNA damage response, metabolic reprogramming, epigenetic remodeling, immune suppression, and chronic inflammation.
The carcinogenic assessment of nine common gaseous pollutants confirms their potential to induce carcinogenesis, which is consistent with the existing classifications by the International Agency for Research on Cancer (IARC) [81,82,83,84] and the previous literature reports [85,86,87,88,89,90,91,92]. Additionally, benzene, toluene, and ethylbenzene have been shown to exhibit weak estrogenic activity [93,94] and to cause reproductive and developmental toxicity [95,96,97,98], further implicating these compounds in hormone-sensitive cancers such as EC.
Through integrative analyses, we identified 17 APECGs potentially involved in air pollutant-induced EC. These genes demonstrate strong structural binding affinity to key pollutants—especially ethylbenzene, toluene, and benzene—as supported by molecular docking results (ΔG < –5 kcal/mol) and statistical significance (p < 0.01 vs. non-targets). Of these, 13 genes are selected through the RSF–SuperPC model to construct a prognostic risk score system. These genes demonstrate high predictive value for patient survival and effectively stratify patients into high- and low-risk groups, suggesting their critical role as candidate driver genes mediating air pollutant-induced EC progression. In addition, five genes with the highest degree in the PPI network were identified as topological hubs. Their central positions within the network suggest broader regulatory roles in linking air pollution to EC-related biological processes.
The gene expression and SHAP analyses further support the functional relevance of these genes:
Expression profiling shows significant upregulation of CCNE1, CDC25B, CDC25C, KCNH2, CTSD, SLC2A1, AHCY, and HPRT1 in the high-risk group. These genes are involved in key oncogenic processes, including cell cycle regulation (CCNE1, CDC25B, and CDC25C), proliferation, invasion, and migration (KCNH2 and CTSD), metabolic reprogramming (SLC2A1), epigenetic modification (AHCY), and nucleotide biosynthesis (HPRT1). These findings align with pathways significantly activated in high-risk groups as identified by the SHAP analysis, such as cell cycle regulation, DNA replication, G2/M checkpoint, E2F target pathways, mTORC1 pathway, and one-carbon metabolism. These pathways represent hallmarks of uncontrolled proliferation and genomic instability, which are key features of cancer [99,100,101,102,103,104,105,106].
Specifically, CCNE1 promotes the G1/S transition via CDK2 activation [47,49], while CDC25B and CDC25C facilitate G2/M progression by activating the CDK1–cyclin B complex [62]. Together, these regulators drive rapid cell proliferation and genomic instability [47,49,68]. HPRT1 supports purine salvage and facilitates rapid DNA synthesis, enabling tumor growth under high replication stress [56]. KCNH2 (hERG), a voltage-gated potassium channel, and CTSD, a lysosomal protease, promote proliferation, angiogenesis, and invasion via autocrine and paracrine signaling [45,46,65]. SLC2A1 (GLUT1) facilitates glucose uptake and enhances aerobic glycolysis (the Warburg effect), supporting the elevated energy and biosynthetic demands of tumor cells [78,80]. The SHAP analysis supports this metabolic phenotype by identifying activation of glycolysis and insulin signaling pathways in the high-risk group. Meanwhile, marked downregulation of lipid metabolic pathways—including α-linolenic acid metabolism, linoleic acid metabolism, and fatty acid oxidation—indicates decreased reliance on lipid-derived energy, reinforcing a shift toward glycolysis dominance. This metabolic reprogramming is consistent with previous toxicological studies showing that low-dose formaldehyde exposure upregulates key glycolytic and cell cycle genes such as Cyclin D–CDK4, E2F1, PKM2, SLC2A1, and LDHA, thereby enhancing glycolytic flux and proliferation [107]. Similar effects are also observed after exposure to NO2 and O3, which promote glycolysis and suppress lipid metabolism [108,109].
AHCY, a key regulator of one-carbon metabolism, is significantly upregulated in the high-risk group. By hydrolyzing S-adenosylhomocysteine (SAH), AHCY maintains cellular methylation potential and supports DNA and histone methylation [63,64]. The SHAP analysis indicates notable activation of the one-carbon metabolism pathway in high-risk individuals, suggesting that epigenetic dysregulation may be one of the central mechanisms in pollutant-associated tumor progression. Importantly, multiple studies confirm that exposure to air pollutants—including benzene, formaldehyde, O3, and NO2—induces widespread epigenetic alterations. These include aberrant DNA methylation and histone modifications at cancer-related genes [110,111,112,113]. In this context, elevated AHCY expression may represent both a compensatory response to oxidative stress and a driver of pollutant-induced epigenetic reprogramming in EC.
Moreover, the SHAP analysis highlights significant enrichment of mismatch repair and UV response pathways in the high-risk group, indicating increased DNA damage stress. This is biologically plausible as numerous studies have established that common air pollutants—particularly BTEX compounds (benzene, toluene, ethylbenzene, and xylene), formaldehyde, O3, NO, and CO—are potent inducers of oxidative stress and genotoxicity. These pollutants generate reactive oxygen and nitrogen species (ROS/RNS), leading to DNA base damage, strand breaks, chromosomal instability, and impaired repair mechanisms [6,114,115,116,117,118,119,120,121,122]. For example, benzene and its metabolites induce oxidative DNA lesions and inhibit topoisomerase II [115,116,117,118], while formaldehyde forms DNA–protein crosslinks and disrupts replication [119]. Similarly, O3 and NO2 impair mitochondrial function and increase DNA oxidation and mutational burden via redox imbalance and nitrosative stress [121,122]. These genotoxic insults may synergize with the upregulation of cell cycle regulators—particularly CCNE1, CDC25B, and CDC25C—to accelerate replication under stress, impair checkpoint fidelity, and promote genomic instability. This cooperative effect between environmental stressors and oncogenic pathway activation may contribute to malignant transformation and the progression of EC.
In addition, the SHAP analysis reveals that several detoxification-related pathways—including bile acid metabolism, peroxisome function, and xenobiotic metabolism—are significantly downregulated in the high-risk group. These pathways are crucial for eliminating fat-soluble toxins and maintaining redox homeostasis [123,124,125]. Their suppression may lead to intracellular accumulation of lipophilic pollutants, exacerbate oxidative stress, and impair cellular detoxification, thereby amplifying DNA damage and promoting tumorigenesis.
Conversely, several downregulated genes in the high-risk group—ESR1, TLR4, CCR2, FOLH1, and MMP2—indicate endocrine disruption, immune suppression, and impaired tissue remodeling, potentially contributing to a tumor-promoting microenvironment under pollutant exposure.
ESR1, which encodes estrogen receptor α (ERα), plays a central role in estrogen signaling in type I EC. Its downregulation in the high-risk group suggests impaired hormonal responsiveness and a potential shift toward more aggressive, hormone-independent tumor subtypes [27,31,32,33,34]. Notably, several air pollutants studied—such as benzene, toluene, and ethylbenzene—exhibit weak estrogenic activity and function as xenoestrogens [93]. These compounds bind to estrogen receptors with low affinity (~1000-fold less than estradiol) and act as partial agonists or antagonists in a tissue-specific manner, thereby disrupting ERα signaling [126,127,128]. This interference may mimic or compete with endogenous estrogens, potentially triggering feedback suppression of ESR1 or altering receptor responsiveness. Additionally, endocrine disruptors have been reported to alter hormone receptor expression by inducing epigenetic modifications, contributing to steroid receptor dysregulation [127,128].
TLR4, CCR2, and FOLH1 are involved in innate and adaptive immune activation. Their downregulation indicates compromised leukocyte recruitment, antigen presentation, and CD8+ T-cell infiltration [52,53,54,57,73,76,77]. This aligns with the SHAP analysis, which reveals reduced activity in the allograft rejection pathway, indicating impaired immune surveillance. Supporting this, exposure to benzene and toluene has been shown to suppress NK cell function [129,130]. Formaldehyde promotes Treg differentiation and suppresses Th1/Th2 function by modulating NFAT signaling, thereby weakening immune responses [131,132], and further impairs immunity in combination with benzene [133]. Recent research also demonstrates that formaldehyde and NO2 enhance immunosuppression by tumor-associated macrophages (TAMs) or impair neutrophil function via metabolic reprogramming and inhibition of neutrophil extracellular trap (NET) formation, respectively [134,135]. FOLH1 silencing is particularly linked to reduced CD8+ T-cell infiltration, reinforcing an immune-evasive phenotype [57,58]. Finally, MMP2, a key matrix metalloproteinase, is involved in ECM remodeling and cytokine regulation. Its downregulation may hinder tissue repair and facilitate the accumulation of pro-inflammatory mediators, thereby promoting chronic inflammation and tissue degradation [69,70,71].
PPI network analysis identifies TNF, IL1B, NFKB1, and PTGS2 as central hub genes, highlighting the key role of inflammation in the pathological cascade linking air pollution to EC. Functionally, these genes serve as key regulators of innate immunity, cytokine signaling, and the resolution of inflammation. Their central position in the network suggests that dysregulated inflammatory signaling acts as a key intermediate mechanism through which pollutants affect tumor initiation and progression. Notably, this notion is further supported by the SHAP analysis, which reveals significant downregulation of lipid metabolic pathways—such as α-linolenic and linoleic acid metabolism—that are essential for the biosynthesis of anti-inflammatory lipid mediators [136].
Consistent with these findings, extensive evidence shows that air pollutants induce inflammatory dysregulation. Exposure to benzene and BTEX compounds (benzene, toluene, ethylbenzene, and xylene) activates innate immune pathways, increases IL1B and TNF levels, and triggers systemic immune dysregulation [137,138]. Gaseous pollutants like O3 and NO2 have been shown to cause oxidative stress and systemic inflammation, contributing to endocrine, cardiovascular, and reproductive dysfunctions [139,140]. Clinical studies report increased levels of inflammatory markers, such as CRP and TNF, after short-term exposure to O3, NO2, and SO2 [141]. Mechanistic studies show that pollutant-induced ROS/RNS modify damage-associated molecular patterns (DAMPs) and activate the NF-κB pathway, thereby enhancing TNF and IL1B expression and sustaining chronic inflammation [142]. Although expression of TNF, IL1B, and NFKB1 does not significantly differ between risk groups, their known pollutant responsiveness and immune-regulatory roles support their involvement. Notably, PTGS2 is downregulated in the high-risk group, potentially indicating impaired inflammatory regulation and immune imbalance, promoting a tumor-supportive microenvironment [44,143,144]. These alterations suggest that chronic, unresolved inflammation may represent a key axis through which air pollutants promote EC development.
Based on the above findings, we propose a mechanistic hypothesis describing how air pollutants contribute to EC, from local homeostatic disruption to systemic pathological progression.
(1)
Initial Exposure and Local Disturbance: Gaseous pollutants—particularly benzene, toluene, and ethylbenzene—enter systemic circulation and accumulate in metabolically active tissues such as the endometrium. These compounds generate reactive intermediates and electrophilic metabolites, inducing oxidative stress, forming DNA and protein adducts, and disrupting local redox balance. Several pollutants also exhibit weak estrogenic activity, potentially altering estrogen receptor signaling and hormonal regulation in the endometrium.
(2)
DNA Damage and Genomic Instability: These genotoxic insults activate damage response pathways while overwhelming the DNA repair machinery. In parallel, upregulation of cell cycle drivers such as CCNE1 and CDC25B/C enables continued proliferation despite DNA damage, compromising checkpoint fidelity and accelerating mutation accumulation—key events that drive malignant transformation.
(3)
Metabolic Reprogramming and Epigenetic Alterations: To adapt to persistent stress and elevated biosynthetic demands, endometrial cells undergo a metabolic shift toward aerobic glycolysis, characterized by increased glucose uptake and enhanced glycolytic flux. This shift is accompanied by suppression of lipid-based energy metabolism, including α-linolenic acid metabolism, linoleic acid metabolism, and fatty acid oxidation, as well as downregulation of detoxification-related pathways such as peroxisome function and bile acid metabolism. Together, these changes reduce metabolic flexibility, impair redox buffering, and favor a glycolysis-dominant, pro-tumor phenotype. At the same time, dysregulated one-carbon metabolism—driven by increased AHCY activity—alters DNA and histone methylation patterns, enabling epigenetic reprogramming that supports oncogene activation and silencing of tumor suppressor genes.
(4)
Immune Dysregulation and Chronic Inflammation: Air pollutants suppress key components of the immune system by downregulating genes involved in leukocyte recruitment and antigen presentation, such as TLR4, CCR2, and FOLH1. This leads to reduced cytotoxic T-cell infiltration and impaired immune surveillance. Additionally, reduced synthesis of polyunsaturated fatty acids (PUFAs) limits the production of anti-inflammatory lipid mediators—such as resolvins and lipoxins—compromising inflammation resolution. Persistent activation of inflammatory signaling pathways, including those regulated by TNF, IL1B, and NFKB1, perpetuates low-grade chronic inflammation, reinforcing a tumor-promoting immune microenvironment.
(5)
Systemic Imbalance and Malignant Progression: These molecular disruptions interact synergistically to establish a self-reinforcing loop of DNA damage, metabolic reprogramming, epigenetic dysregulation, immune escape, and unresolved inflammation. Impaired detoxification capacity further limits the clearance of lipophilic toxins, while endocrine and immune imbalances exacerbate local stress. Collectively, these changes reshape the endometrial microenvironment, enabling sustained tumor growth, invasion, and potential metastasis.
These findings may offer translational value in high-exposure populations. In regions with elevated air pollution, systematic monitoring of key APECGs—such as CCNE1, CDC25B, SLC2A1, AHCY, and ESR1—could inform risk stratification strategies for EC. Expression or methylation profiling of these genes using minimally invasive approaches, such as uterine lavage fluid, endometrial brushings, or liquid biopsy (e.g., circulating cell-free RNA or exosomal content), may enable early identification of pollutant-associated molecular alterations. Such biomarkers, if validated in prospective cohorts, may support early detection, guide personalized surveillance programs, and inform preventive interventions in environmentally vulnerable populations.
However, several important limitations warrant consideration. First, the proposed pollutant–gene interactions and mechanistic pathways are derived primarily from computational predictions, including molecular docking and the SHAP-based interpretation of machine learning models. While these approaches provide biologically plausible insights, the absence of experimental validation precludes definitive conclusions regarding causality or functional impact. Second, real-world environmental exposures are typically chronic, multifactorial, and involve complex mixtures of pollutants. Our analysis, which evaluates pollutants individually, does not account for potential additive, antagonistic, or synergistic interactions among co-occurring agents, thereby limiting its ecological validity. Third, the transcriptomic data used in this study (TCGA-UCEC) lack detailed information on individual-level environmental exposure, such as pollutant concentration, duration, or temporal variability. This precludes dose–response modeling and hinders efforts to contextualize molecular changes within actual exposure histories. Fourth, although the prognostic model demonstrates high predictive performance within the TCGA dataset, it has not yet been externally validated in independent patient cohorts. In addition, important host variables—including hormonal status, ethnicity, lifestyle factors, and comorbid conditions—are not incorporated, limiting the model’s generalizability across diverse populations. Finally, despite the prognostic relevance of APECGs and their association with dysregulated pathways in EC, their clinical applicability remains preliminary. The lack of integration with established clinical markers (e.g., estrogen receptor status), prospective validation, and correlation with real-world exposure data constrains the immediate translational potential of our findings for early detection or prognostic use.
To overcome these limitations, future research should adopt a multi-tiered strategy, outlined as follows:
(1)
Experimental validation of key mechanisms
Functional assays are essential to verify predicted gene–pollutant interactions. In vitro experiments using EC cell lines exposed to representative pollutants should evaluate effects on gene expression, pathway activation (e.g., PI3K-AKT, HIF-1, and the G2/M checkpoint), and cellular behaviors such as proliferation, apoptosis, migration, and immune modulation. In vivo models—including xenografts or chemically induced endometrial carcinogenesis—will be crucial for validating mechanistic insights under physiologically relevant conditions.
(2)
Modeling real-world exposure complexity
To improve ecological relevance, future computational frameworks should integrate pollutant mixture effects using advanced models (e.g., Bayesian kernel machine regression or weighted quantile sum regression). This would better reflect environmental co-exposure scenarios and clarify the additive or interactive effects of multiple pollutants.
(3)
Integration of epidemiological exposure data
Linking high-resolution air quality data, geospatial models, or personal exposure records to biological samples will allow for investigation of how long-term environmental exposures shape molecular changes and clinical outcomes in EC patients. Such studies could also enable dose–response analysis and temporal modeling.
(4)
Refinement and external validation of the prognostic model
External validation in independent datasets is essential to assess model reproducibility and generalizability. Incorporating clinical variables such as age, body mass index, hormone replacement therapy, and menopausal status will improve discriminatory power and clinical utility. Development of user-friendly tools (e.g., web-based calculators or nomograms) could facilitate clinical application. Additionally, translation of APECG detection into clinically feasible platforms—such as qPCR-based assays or methylation-specific PCR from endometrial biopsies or uterine fluid—should be prioritized.
(5)
Multi-omics and single-cell dissection of pollutant effects
Integrative multi-omics analyses—including epigenomics, metabolomics, and proteomics—can uncover system-level perturbations in response to pollutant exposure. Single-cell sequencing will further enable dissection of cell-type-specific responses, revealing how pollutants reprogram epithelial, stromal, and immune compartments within the tumor microenvironment. Such insights may identify novel biomarkers or therapeutic vulnerabilities linked to environmental carcinogenesis.
Collectively, these approaches will be instrumental in validating our computational findings, deepening mechanistic understanding, and accelerating translation into early detection strategies, precision risk stratification, and public health interventions in the context of air pollution and gynecologic oncology.

5. Conclusions

In conclusion, this study identifies critical molecular connections between gaseous air pollutants and EC. We identify 83 APECGs, with TNF, ESR1, IL1B, NFKB1, and PTGS2 emerging as potential hub genes through PPI network analysis. Among 117 machine learning combinations, an optimal 13-gene RSF-SuperPC model—comprising key regulators such as CCNE1, SLC2A1, AHCY, and CDC25C—is selected. Its risk score effectively stratifies patients based on survival outcomes. Molecular docking confirms high pollutant-binding affinity for these genes, while further analyses using GSVA, random forest, and SHAP suggest that these genes mediate pollutant-induced EC initiation and progression through mechanisms involving DNA damage, epigenetic dysregulation, metabolic reprogramming, immune dysfunction, and chronic inflammation. These findings offer novel insights into the molecular mechanisms by which air pollutants may promote EC development and progression. They also provide a foundation for future biomarker development and risk assessment strategies in pollution-exposed populations. Nonetheless, further validation through experimental studies, multi-omics integration, and real-world exposure assessment is necessary to support clinical translation.

Supplementary Materials

The following supporting information can be downloaded at https://www.mdpi.com/article/10.3390/atmos16070841/s1, Figures S1–S4: Performance metrics of 117 machine learning combinations; Table S1: Target genes of nine air pollutants; Table S2: Endometrial cancer-related genes; Table S3: Differential expression genes of endometrial cancer; Table S4: Air pollutants-endometrial cancer associated genes.

Author Contributions

Conceptualization, H.L. and Y.Z.; Software, H.L.; Validation, H.L. and Y.Z.; Formal analysis, H.L. and Y.Z.; Data curation, H.L.; Writing—original draft, H.L. and Y.Z.; Writing—review & editing, H.L. and Y.Z.; Visualization, H.L.; Supervision, Y.Z. All authors have read and agreed to the published version of the manuscript.

Funding

This research received no external funding.

Institutional Review Board Statement

Ethical review and approval were waived for this study due to the exclusive use of publicly available, de-identified datasets. The study did not involve any direct interaction with human participants or the use of personally identifiable information. All data were obtained from open-access databases, which have their own ethical approvals and data access regulations.

Informed Consent Statement

All data used were obtained from publicly available and anonymized databases such as TCGA and UCSC Xena, which do not contain personally identifiable information and therefore do not require informed consent.

Data Availability Statement

The data are contained within the article and Supplementary Materials.

Conflicts of Interest

The authors declare no conflicts of interest.

References

  1. Schraufnagel, D.E.; Balmes, J.R.; Cowl, C.T.; De Matteis, S.; Jung, S.H.; Mortimer, K.; Perez-Padilla, R.; Rice, M.B.; Riojas-Rodriguez, H.; Sood, A.; et al. Air Pollution and Noncommunicable Diseases: A Review by the Forum of International Respiratory Societies’ Environmental Committee, Part 2: Air Pollution and Organ Systems. Chest 2019, 155, 417–426. [Google Scholar] [CrossRef] [PubMed]
  2. Schraufnagel, D.E.; Balmes, J.R.; Cowl, C.T.; De Matteis, S.; Jung, S.H.; Mortimer, K.; Perez-Padilla, R.; Rice, M.B.; Riojas-Rodriguez, H.; Sood, A.; et al. Air Pollution and Noncommunicable Diseases: A Review by the Forum of International Respiratory Societies’ Environmental Committee, Part 1: The Damaging Effects of Air Pollution. Chest 2019, 155, 409–416. [Google Scholar] [CrossRef]
  3. Barbier, E.; Carpentier, J.; Simonin, O.; Gosset, P.; Platel, A.; Happillon, M.; Alleman, L.Y.; Perdrix, E.; Riffault, V.; Chassat, T.; et al. Oxidative stress and inflammation induced by air pollution-derived PM(2.5) persist in the lungs of mice after cessation of their sub-chronic exposure. Environ. Int. 2023, 181, 108248. [Google Scholar] [CrossRef]
  4. Loomis, D.; Grosse, Y.; Lauby-Secretan, B.; El Ghissassi, F.; Bouvard, V.; Benbrahim-Tallaa, L.; Guha, N.; Baan, R.; Mattock, H.; Straif, K.; et al. The carcinogenicity of outdoor air pollution. Lancet Oncol. 2013, 14, 1262–1263. [Google Scholar] [CrossRef] [PubMed]
  5. Turner, M.C.; Andersen, Z.J.; Baccarelli, A.; Diver, W.R.; Gapstur, S.M.; Pope, C.A., 3rd; Prada, D.; Samet, J.; Thurston, G.; Cohen, A. Outdoor air pollution and cancer: An overview of the current evidence and public health recommendations. CA Cancer J. Clin. 2020, 70, 460–479. [Google Scholar] [CrossRef]
  6. Xu, J.; Zhang, Q.; Su, Z.; Liu, Y.; Yan, T.; Zhang, Y.; Wang, T.; Wei, X.; Chen, Z.; Hu, G.; et al. Genetic damage and potential mechanism exploration under different air pollution patterns by multi-omics. Environ. Int. 2022, 170, 107636. [Google Scholar] [CrossRef] [PubMed]
  7. Xue, Y.; Wang, L.; Zhang, Y.; Zhao, Y.; Liu, Y. Air pollution: A culprit of lung cancer. J. Hazard. Mater. 2022, 434, 128937. [Google Scholar] [CrossRef]
  8. Bray, F.; Ferlay, J.; Soerjomataram, I.; Siegel, R.L.; Torre, L.A.; Jemal, A. Global cancer statistics 2018: GLOBOCAN estimates of incidence and mortality worldwide for 36 cancers in 185 countries. CA Cancer J. Clin. 2018, 68, 394–424. [Google Scholar] [CrossRef]
  9. Crosbie, E.J.; Kitson, S.J.; McAlpine, J.N.; Mukhopadhyay, A.; Powell, M.E.; Singh, N. Endometrial cancer. Lancet 2022, 399, 1412–1428. [Google Scholar] [CrossRef]
  10. Lortet-Tieulent, J.; Ferlay, J.; Bray, F.; Jemal, A. International Patterns and Trends in Endometrial Cancer Incidence, 1978–2013. J. Natl. Cancer Inst. 2018, 110, 354–361. [Google Scholar] [CrossRef]
  11. Onstad, M.A.; Schmandt, R.E.; Lu, K.H. Addressing the Role of Obesity in Endometrial Cancer Risk, Prevention, and Treatment. J. Clin. Oncol. 2016, 34, 4225–4230. [Google Scholar] [CrossRef] [PubMed]
  12. Papatla, K.; Huang, M.; Slomovitz, B. The obese endometrial cancer patient: How do we effectively improve morbidity and mortality in this patient population? Ann. Oncol. 2016, 27, 1988–1994. [Google Scholar] [CrossRef]
  13. Simpson, A.N.; Lennox, G. Highlighting obesity as a risk factor for endometrial cancer. CMAJ 2021, 193, E58. [Google Scholar] [CrossRef] [PubMed]
  14. Brinton, L.A.; Trabert, B.; Anderson, G.L.; Falk, R.T.; Felix, A.S.; Fuhrman, B.J.; Gass, M.L.; Kuller, L.H.; Pfeiffer, R.M.; Rohan, T.E.; et al. Serum Estrogens and Estrogen Metabolites and Endometrial Cancer Risk among Postmenopausal Women. Cancer Epidemiol. Biomark. Prev. 2016, 25, 1081–1089. [Google Scholar] [CrossRef]
  15. Kim, J.J.; Kurita, T.; Bulun, S.E. Progesterone action in endometrial cancer, endometriosis, uterine fibroids, and breast cancer. Endocr. Rev. 2013, 34, 130–162. [Google Scholar] [CrossRef] [PubMed]
  16. Peltomaki, P.; Nystrom, M.; Mecklin, J.P.; Seppala, T.T. Lynch Syndrome Genetics and Clinical Implications. Gastroenterology 2023, 164, 783–799. [Google Scholar] [CrossRef] [PubMed]
  17. Zhao, S.; Chen, L.; Zang, Y.; Liu, W.; Liu, S.; Teng, F.; Xue, F.; Wang, Y. Endometrial cancer in Lynch syndrome. Int. J. Cancer 2022, 150, 7–17. [Google Scholar] [CrossRef]
  18. Brown, J.A.; Ish, J.L.; Chang, C.J.; Bookwalter, D.B.; O’Brien, K.M.; Jones, R.R.; Kaufman, J.D.; Sandler, D.P.; White, A.J. Outdoor air pollution exposure and uterine cancer incidence in the Sister Study. J. Natl. Cancer Inst. 2024, 116, 948–956. [Google Scholar] [CrossRef]
  19. Craver, A.; Luo, J.; Kibriya, M.G.; Randorf, N.; Bahl, K.; Connellan, E.; Powell, J.; Zakin, P.; Jones, R.R.; Argos, M.; et al. Air quality and cancer risk in the All of Us Research Program. Cancer Causes Control. 2024, 35, 749–760. [Google Scholar] [CrossRef]
  20. Li, W.; Wang, W. Causal effects of exposure to ambient air pollution on cancer risk: Insights from genetic evidence. Sci. Total Environ. 2024, 912, 168843. [Google Scholar] [CrossRef]
  21. Iwai, K.; Mizuno, S.; Miyasaka, Y.; Mori, T. Correlation between suspended particles in the environmental air and causes of disease among inhabitants: Cross-sectional studies using the vital statistics and air pollution data in Japan. Environ. Res. 2005, 99, 106–117. [Google Scholar] [CrossRef] [PubMed]
  22. Liu, W.; Pan, Y. Unraveling the mechanisms underlying diabetic cataracts: Insights from Mendelian randomization analysis. Redox Rep. 2024, 29, 2420563. [Google Scholar] [CrossRef]
  23. Shao, X.; Wang, Y.; Geng, Z.; Liang, G.; Zhu, X.; Liu, L.; Meng, M.; Duan, L.; Zhu, G. Novel therapeutic targets for major depressive disorder related to oxidative stress identified by integrative multi-omics and multi-trait study. Transl. Psychiatry 2024, 14, 443. [Google Scholar] [CrossRef] [PubMed]
  24. Liu, H.; Zhang, W.; Zhang, Y.; Adegboro, A.A.; Fasoranti, D.O.; Dai, L.; Pan, Z.; Liu, H.; Xiong, Y.; Li, W.; et al. Mime: A flexible machine-learning framework to construct and visualize models for clinical characteristics prediction and feature selection. Comput. Struct. Biotechnol. J. 2024, 23, 2798–2810. [Google Scholar] [CrossRef]
  25. Kalliolias, G.D.; Ivashkiv, L.B. TNF biology, pathogenic mechanisms and emerging therapeutic strategies. Nat. Rev. Rheumatol. 2016, 12, 49–62. [Google Scholar] [CrossRef]
  26. Ray, I.; Meira, L.B.; Michael, A.; Ellis, P.E. Adipocytokines and disease progression in endometrial cancer: A systematic review. Cancer Metastasis Rev. 2022, 41, 211–242. [Google Scholar] [CrossRef] [PubMed]
  27. He, D.; Wang, X.; Zhang, Y.; Zhao, J.; Han, R.; Dong, Y. DNMT3A/3B overexpression might be correlated with poor patient survival, hypermethylation and low expression of ESR1/PGR in endometrioid carcinoma: An analysis of The Cancer Genome Atlas. Chin. Med. J. 2019, 132, 161–170. [Google Scholar] [CrossRef]
  28. Tian, W.; Teng, F.; Gao, J.; Gao, C.; Liu, G.; Zhang, Y.; Yu, S.; Zhang, W.; Wang, Y.; Xue, F. Estrogen and insulin synergistically promote endometrial cancer progression via crosstalk between their receptor signaling pathways. Cancer Biol. Med. 2019, 16, 55–70. [Google Scholar] [CrossRef]
  29. Liu, A.; Zhang, D.; Yang, X.; Song, Y. Estrogen receptor alpha activates MAPK signaling pathway to promote the development of endometrial cancer. J. Cell Biochem. 2019, 120, 17593–17601. [Google Scholar] [CrossRef]
  30. Backes, F.J.; Walker, C.J.; Goodfellow, P.J.; Hade, E.M.; Agarwal, G.; Mutch, D.; Cohn, D.E.; Suarez, A.A. Estrogen receptor-alpha as a predictive biomarker in endometrioid endometrial cancer. Gynecol. Oncol. 2016, 141, 312–317. [Google Scholar] [CrossRef]
  31. Rodriguez, A.C.; Blanchard, Z.; Maurer, K.A.; Gertz, J. Estrogen Signaling in Endometrial Cancer: A Key Oncogenic Pathway with Several Open Questions. Horm. Cancer 2019, 10, 51–63. [Google Scholar] [CrossRef] [PubMed]
  32. Blanchard, Z.; Vahrenkamp, J.M.; Berrett, K.C.; Arnesen, S.; Gertz, J. Estrogen-independent molecular actions of mutant estrogen receptor 1 in endometrial cancer. Genome Res. 2019, 29, 1429–1441. [Google Scholar] [CrossRef] [PubMed]
  33. Sasaki, M.; Kaneuchi, M.; Fujimoto, S.; Tanaka, Y.; Dahiya, R. Hypermethylation can selectively silence multiple promoters of steroid receptors in cancers. Mol. Cell Endocrinol. 2003, 202, 201–207. [Google Scholar] [CrossRef] [PubMed]
  34. Wik, E.; Raeder, M.B.; Krakstad, C.; Trovik, J.; Birkeland, E.; Hoivik, E.A.; Mjos, S.; Werner, H.M.; Mannelqvist, M.; Stefansson, I.M.; et al. Lack of estrogen receptor-alpha is associated with epithelial-mesenchymal transition and PI3K alterations in endometrial carcinoma. Clin. Cancer Res. 2013, 19, 1094–1105. [Google Scholar] [CrossRef]
  35. Voronov, E.; Shouval, D.S.; Krelin, Y.; Cagnano, E.; Benharroch, D.; Iwakura, Y.; Dinarello, C.A.; Apte, R.N. IL-1 is required for tumor invasiveness and angiogenesis. Proc. Natl. Acad. Sci. USA 2003, 100, 2645–2650. [Google Scholar] [CrossRef]
  36. Rebe, C.; Ghiringhelli, F. Interleukin-1beta and Cancer. Cancers 2020, 12, 1791. [Google Scholar] [CrossRef]
  37. Mantovani, A.; Dinarello, C.A.; Molgora, M.; Garlanda, C. Interleukin-1 and Related Cytokines in the Regulation of Inflammation and Immunity. Immunity 2019, 50, 778–795. [Google Scholar] [CrossRef]
  38. Garlanda, C.; Mantovani, A. Interleukin-1 in tumor progression, therapy, and prevention. Cancer Cell 2021, 39, 1023–1027. [Google Scholar] [CrossRef]
  39. Apte, R.N.; Dotan, S.; Elkabets, M.; White, M.R.; Reich, E.; Carmi, Y.; Song, X.; Dvozkin, T.; Krelin, Y.; Voronov, E. The involvement of IL-1 in tumorigenesis, tumor invasiveness, metastasis and tumor-host interactions. Cancer Metastasis Rev. 2006, 25, 387–408. [Google Scholar] [CrossRef]
  40. Lawrence, T. The nuclear factor NF-kappaB pathway in inflammation. Cold Spring Harb. Perspect. Biol. 2009, 1, a001651. [Google Scholar] [CrossRef]
  41. Concetti, J.; Wilson, C.L. NFKB1 and Cancer: Friend or Foe? Cells 2018, 7, 133. [Google Scholar] [CrossRef] [PubMed]
  42. Lyndin, M.; Kravtsova, O.; Sikora, K.; Lyndina, Y.; Kuzenko, Y.; Awuah, W.A.; Abdul-Rahman, T.; Hyriavenko, N.; Sikora, V.; Romaniuk, A. COX2 Effects on endometrial carcinomas progression. Pathol. Res. Pract. 2022, 238, 154082. [Google Scholar] [CrossRef] [PubMed]
  43. Korbecki, J.; Siminska, D.; Gassowska-Dobrowolska, M.; Listos, J.; Gutowska, I.; Chlubek, D.; Baranowska-Bosiacka, I. Chronic and Cycling Hypoxia: Drivers of Cancer Chronic Inflammation through HIF-1 and NF-kappaB Activation: A Review of the Molecular Mechanisms. Int. J. Mol. Sci. 2021, 22, 10701. [Google Scholar] [CrossRef] [PubMed]
  44. Hashemi Goradel, N.; Najafi, M.; Salehi, E.; Farhood, B.; Mortezaee, K. Cyclooxygenase-2 in cancer: A review. J. Cell Physiol. 2019, 234, 5683–5699. [Google Scholar] [CrossRef]
  45. He, S.; Moutaoufik, M.T.; Islam, S.; Persad, A.; Wu, A.; Aly, K.A.; Fonge, H.; Babu, M.; Cayabyab, F.S. HERG channel and cancer: A mechanistic review of carcinogenic processes and therapeutic potential. Biochim. Biophys. Acta Rev. Cancer 2020, 1873, 188355. [Google Scholar] [CrossRef]
  46. Arcangeli, A.; Becchetti, A. hERG Channels: From Antitargets to Novel Targets for Cancer Therapy. Clin. Cancer Res. 2017, 23, 3–5. [Google Scholar] [CrossRef]
  47. Suski, J.M.; Braun, M.; Strmiska, V.; Sicinski, P. Targeting cell-cycle machinery in cancer. Cancer Cell 2021, 39, 759–778. [Google Scholar] [CrossRef]
  48. Leskela, S.; Perez-Mies, B.; Rosa-Rosa, J.M.; Cristobal, E.; Biscuola, M.; Palacios-Berraquero, M.L.; Ong, S.; Matias-Guiu Guia, X.; Palacios, J. Molecular Basis of Tumor Heterogeneity in Endometrial Carcinosarcoma. Cancers 2019, 11, 964. [Google Scholar] [CrossRef]
  49. Fagundes, R.; Teixeira, L.K. Cyclin E/CDK2: DNA Replication, Replication Stress and Genomic Instability. Front. Cell Dev. Biol. 2021, 9, 774845. [Google Scholar] [CrossRef]
  50. Bogani, G.; Ray-Coquard, I.; Concin, N.; Ngoi, N.Y.L.; Morice, P.; Enomoto, T.; Takehara, K.; Denys, H.; Nout, R.A.; Lorusso, D.; et al. Uterine serous carcinoma. Gynecol. Oncol. 2021, 162, 226–234. [Google Scholar] [CrossRef]
  51. Xu, M.; Wang, Y.; Xia, R.; Wei, Y.; Wei, X. Role of the CCL2-CCR2 signalling axis in cancer: Mechanisms and therapeutic targeting. Cell Prolif. 2021, 54, e13115. [Google Scholar] [CrossRef] [PubMed]
  52. Kurihara, T.; Warr, G.; Loy, J.; Bravo, R. Defects in macrophage recruitment and host defense in mice lacking the CCR2 chemokine receptor. J. Exp. Med. 1997, 186, 1757–1762. [Google Scholar] [CrossRef]
  53. Fei, L.; Ren, X.; Yu, H.; Zhan, Y. Targeting the CCL2/CCR2 Axis in Cancer Immunotherapy: One Stone, Three Birds? Front. Immunol. 2021, 12, 771210. [Google Scholar] [CrossRef]
  54. Chen, W.; Fang, Y.; Wang, H.; Tan, X.; Zhu, X.; Xu, Z.; Jiang, H.; Wu, X.; Hong, W.; Wang, X.; et al. Role of chemokine receptor 2 in rheumatoid arthritis: A research update. Int. Immunopharmacol. 2023, 116, 109755. [Google Scholar] [CrossRef] [PubMed]
  55. Townsend, M.H.; Ence, Z.E.; Felsted, A.M.; Parker, A.C.; Piccolo, S.R.; Robison, R.A.; O’Neill, K.L. Potential new biomarkers for endometrial cancer. Cancer Cell Int. 2019, 19, 19. [Google Scholar] [CrossRef] [PubMed]
  56. Lu, Y.; Chen, R.; Zhang, H.; Sun, X.; Li, X.; Yang, M.; Zhang, X. Prognostic significance and immunological role of HPRT1 in human cancers. Biomol. Biomed. 2024, 24, 262–291. [Google Scholar] [CrossRef]
  57. Sun, D.; Zhang, A.; Gao, B.; Zou, L.; Huang, H.; Zhao, X.; Xu, D. Identification of Alternative Splicing-Related Genes CYB561 and FOLH1 in the Tumor-Immune Microenvironment for Endometrial Cancer Based on TCGA Data Analysis. Front. Genet. 2022, 13, 770569. [Google Scholar] [CrossRef]
  58. Mhawech-Fauceglia, P.; Smiraglia, D.J.; Bshara, W.; Andrews, C.; Schwaller, J.; South, S.; Higgs, D.; Lele, S.; Herrmann, F.; Odunsi, K. Prostate-specific membrane antigen expression is a potential prognostic marker in endometrial adenocarcinoma. Cancer Epidemiol. Biomark. Prev. 2008, 17, 571–577. [Google Scholar] [CrossRef]
  59. Wang, R.; He, G.; Nelman-Gonzalez, M.; Ashorn, C.L.; Gallick, G.E.; Stukenberg, P.T.; Kirschner, M.W.; Kuang, J. Regulation of Cdc25C by ERK-MAP kinases during the G2/M transition. Cell 2007, 128, 1119–1132. [Google Scholar] [CrossRef]
  60. Vassileva, V.; Millar, A.; Briollais, L.; Chapman, W.; Bapat, B. Genes involved in DNA repair are mutational targets in endometrial cancers with microsatellite instability. Cancer Res. 2002, 62, 4095–4099. [Google Scholar]
  61. Liu, K.; Zheng, M.; Lu, R.; Du, J.; Zhao, Q.; Li, Z.; Li, Y.; Zhang, S. The role of CDC25C in cell cycle regulation and clinical cancer therapy: A systematic review. Cancer Cell Int. 2020, 20, 213. [Google Scholar] [CrossRef] [PubMed]
  62. Karlsson-Rosenthal, C.; Millar, J.B. Cdc25: Mechanisms of checkpoint inhibition and recovery. Trends Cell Biol. 2006, 16, 285–292. [Google Scholar] [CrossRef]
  63. Vizan, P.; Di Croce, L.; Aranda, S. Functional and Pathological Roles of AHCY. Front. Cell Dev. Biol. 2021, 9, 654344. [Google Scholar] [CrossRef]
  64. Ponnaluri, V.K.C.; Esteve, P.O.; Ruse, C.I.; Pradhan, S. S-adenosylhomocysteine Hydrolase Participates in DNA Methylation Inheritance. J. Mol. Biol. 2018, 430, 2051–2065. [Google Scholar] [CrossRef]
  65. Benes, P.; Vetvicka, V.; Fusek, M. Cathepsin D—Many functions of one aspartic protease. Crit. Rev. Oncol. Hematol. 2008, 68, 12–28. [Google Scholar] [CrossRef] [PubMed]
  66. Lindqvist, A.; Kallstrom, H.; Lundgren, A.; Barsoum, E.; Rosenthal, C.K. Cdc25B cooperates with Cdc25A to induce mitosis but has a unique role in activating cyclin B1-Cdk1 at the centrosome. J. Cell Biol. 2005, 171, 35–45. [Google Scholar] [CrossRef] [PubMed]
  67. Galaktionov, K.; Lee, A.K.; Eckstein, J.; Draetta, G.; Meckler, J.; Loda, M.; Beach, D. CDC25 phosphatases as potential human oncogenes. Science 1995, 269, 1575–1577. [Google Scholar] [CrossRef]
  68. Boutros, R.; Lobjois, V.; Ducommun, B. CDC25 phosphatases in cancer cells: Key players? Good targets? Nat. Rev. Cancer 2007, 7, 495–507. [Google Scholar] [CrossRef]
  69. Wolosowicz, M.; Prokopiuk, S.; Kaminski, T.W. The Complex Role of Matrix Metalloproteinase-2 (MMP-2) in Health and Disease. Int. J. Mol. Sci. 2024, 25, 13691. [Google Scholar] [CrossRef]
  70. Fernandez-Patron, C.; Kassiri, Z.; Leung, D. Modulation of Systemic Metabolism by MMP-2: From MMP-2 Deficiency in Mice to MMP-2 Deficiency in Patients. Compr. Physiol. 2016, 6, 1935–1949. [Google Scholar] [CrossRef]
  71. de Almeida, L.G.N.; Thode, H.; Eslambolchi, Y.; Chopra, S.; Young, D.; Gill, S.; Devel, L.; Dufour, A. Matrix Metalloproteinases: From Molecular Mechanisms to Physiology, Pathophysiology, and Pharmacology. Pharmacol. Rev. 2022, 74, 712–768. [Google Scholar] [CrossRef] [PubMed]
  72. Alaseem, A.; Alhazzani, K.; Dondapati, P.; Alobid, S.; Bishayee, A.; Rathinavelu, A. Matrix Metalloproteinases: A challenging paradigm of cancer management. Semin. Cancer Biol. 2019, 56, 100–115. [Google Scholar] [CrossRef] [PubMed]
  73. Ran, S. The Role of TLR4 in Chemotherapy-Driven Metastasis. Cancer Res. 2015, 75, 2405–2410. [Google Scholar] [CrossRef] [PubMed]
  74. Oda, M.; Yamamoto, H.; Kawakami, T. Maintenance of homeostasis by TLR4 ligands. Front. Immunol. 2024, 15, 1286270. [Google Scholar] [CrossRef]
  75. O’Neill, L.A.; Bowie, A.G. The family of five: TIR-domain-containing adaptors in Toll-like receptor signalling. Nat. Rev. Immunol. 2007, 7, 353–364. [Google Scholar] [CrossRef]
  76. Lupi, L.A.; Cucielo, M.S.; Silveira, H.S.; Gaiotte, L.B.; Cesario, R.C.; Seiva, F.R.F.; de Almeida Chuffa, L.G. The role of Toll-like receptor 4 signaling pathway in ovarian, cervical, and endometrial cancers. Life Sci. 2020, 247, 117435. [Google Scholar] [CrossRef]
  77. Kim, H.J.; Kim, H.; Lee, J.H.; Hwangbo, C. Toll-like receptor 4 (TLR4): New insight immune and aging. Immun. Ageing 2023, 20, 67. [Google Scholar] [CrossRef]
  78. Lopez-Serra, P.; Marcilla, M.; Villanueva, A.; Ramos-Fernandez, A.; Palau, A.; Leal, L.; Wahi, J.E.; Setien-Baranda, F.; Szczesna, K.; Moutinho, C.; et al. A DERL3-associated defect in the degradation of SLC2A1 mediates the Warburg effect. Nat. Commun. 2014, 5, 3608. [Google Scholar] [CrossRef]
  79. Ooi, A.T.; Gomperts, B.N. Molecular pathways: Targeting cellular energy metabolism in cancer via inhibition of SLC2A1 and LDHA. Clin. Cancer Res. 2015, 21, 2440–2444. [Google Scholar] [CrossRef]
  80. Barron, C.C.; Bilan, P.J.; Tsakiridis, T.; Tsiani, E. Facilitative glucose transporters: Implications for cancer detection, prognosis and treatment. Metabolism 2016, 65, 124–139. [Google Scholar] [CrossRef]
  81. IARC Working Group on the Evaluation of Carcinogenic Risks to Humans. Formaldehyde, 2-butoxyethanol and 1-tert-butoxypropan-2-ol. IARC Monogr. Eval. Carcinog. Risks Hum. 2006, 88, 1–478. [Google Scholar]
  82. Loomis, D.; Guyton, K.Z.; Grosse, Y.; El Ghissassi, F.; Bouvard, V.; Benbrahim-Tallaa, L.; Guha, N.; Vilahur, N.; Mattock, H.; Straif, K.; et al. Carcinogenicity of benzene. Lancet Oncol. 2017, 18, 1574–1575. [Google Scholar] [CrossRef]
  83. International Agency for Research on Cancer (IARC). Agents Classified by the IARC Monographs. Volumes 1–123. IARC. 2018. Available online: https://monographs.iarc.who.int/wp-content/uploads/2018/09/ClassificationsAlphaOrder.pdf (accessed on 7 April 2025).
  84. IARC Working Group on the Evaluation of Carcinogenic Risks to Humans. Outdoor Air Pollution. IARC Monogr. Eval. Carcinog. Risks Hum. 2016, 109, 9–444. [Google Scholar]
  85. Blanc-Lapierre, A.; Sauve, J.F.; Parent, M.E. Occupational exposure to benzene, toluene, xylene and styrene and risk of prostate cancer in a population-based study. Occup. Environ. Med. 2018, 75, 562–572. [Google Scholar] [CrossRef]
  86. El-Zaemey, S.; Anand, T.N.; Heyworth, J.S.; Boyle, T.; van Tongeren, M.; Fritschi, L. Case-control study to assess the association between colorectal cancer and selected occupational agents using INTEROCC job exposure matrix. Occup. Environ. Med. 2018, 75, 290–295. [Google Scholar] [CrossRef]
  87. Kim, S.; Park, E.; Song, S.H.; Lee, C.W.; Kwon, J.T.; Park, E.Y.; Kim, B. Toluene concentrations in the blood and risk of thyroid cancer among residents living near national industrial complexes in South Korea: A population-based cohort study. Environ. Int. 2021, 146, 106304. [Google Scholar] [CrossRef]
  88. Warden, H.; Richardson, H.; Richardson, L.; Siemiatycki, J.; Ho, V. Associations between occupational exposure to benzene, toluene and xylene and risk of lung cancer in Montreal. Occup. Environ. Med. 2018, 75, 696–702. [Google Scholar] [CrossRef] [PubMed]
  89. Cheng, Y.; Kong, D.; Ci, M.; Guan, Y.; Luo, C.; Zhang, X.; Gao, F.; Li, M.; Deng, G. Oxidative Stress Effects of Multiple Pollutants in an Indoor Environment on Human Bronchial Epithelial Cells. Toxics 2023, 11, 251. [Google Scholar] [CrossRef]
  90. Dees, C.; Askari, M.; Henley, D. Carcinogenic potential of benzene and toluene when evaluated using cyclin-dependent kinase activation and p53-DNA binding. Environ. Health Perspect. 1996, 104 (Suppl. S6), 1289–1292. [Google Scholar] [CrossRef]
  91. Dees, C.; Travis, C. Hyperphosphorylation of p53 induced by benzene, toluene, and chloroform. Cancer Lett. 1994, 84, 117–123. [Google Scholar] [CrossRef]
  92. Sosa, V.; Moline, T.; Somoza, R.; Paciucci, R.; Kondoh, H.; Lleonart, M.E. Oxidative stress and cancer: An overview. Ageing Res. Rev. 2013, 12, 376–390. [Google Scholar] [CrossRef]
  93. Bolden, A.L.; Schultz, K.; Pelch, K.E.; Kwiatkowski, C.F. Exploring the endocrine activity of air pollutants associated with unconventional oil and gas extraction. Environ. Health 2018, 17, 26. [Google Scholar] [CrossRef] [PubMed]
  94. Kassotis, C.D.; Klemp, K.C.; Vu, D.C.; Lin, C.H.; Meng, C.X.; Besch-Williford, C.L.; Pinatti, L.; Zoeller, R.T.; Drobnis, E.Z.; Balise, V.D.; et al. Endocrine-Disrupting Activity of Hydraulic Fracturing Chemicals and Adverse Health Outcomes After Prenatal Exposure in Male Mice. Endocrinology 2015, 156, 4458–4473. [Google Scholar] [CrossRef]
  95. Brown-Woodman, P.D.; Webster, W.S.; Picker, K.; Huq, F. In vitro assessment of individual and interactive effects of aromatic hydrocarbons on embryonic development of the rat. Reprod. Toxicol. 1994, 8, 121–135. [Google Scholar] [CrossRef]
  96. Ono, A.; Sekita, K.; Ogawa, Y.; Hirose, A.; Suzuki, S.; Saito, M.; Naito, K.; Kaneko, T.; Furuya, T.; Kawashima, K.; et al. Reproductive and developmental toxicity studies of toluene. II. Effects of inhalation exposure on fertility in rats. J. Environ. Pathol. Toxicol. Oncol. 1996, 15, 9–20. [Google Scholar] [PubMed]
  97. Ungvary, G.; Tatrai, E. On the embryotoxic effects of benzene and its alkyl derivatives in mice, rats and rabbits. Arch. Toxicol. Suppl. 1985, 8, 425–430. [Google Scholar] [CrossRef] [PubMed]
  98. Xu, X.; Cho, S.I.; Sammel, M.; You, L.; Cui, S.; Huang, Y.; Ma, G.; Padungtod, C.; Pothier, L.; Niu, T.; et al. Association of petrochemical exposure with spontaneous abortion. Occup. Environ. Med. 1998, 55, 31–36. [Google Scholar] [CrossRef]
  99. Matthews, H.K.; Bertoli, C.; de Bruin, R.A.M. Cell cycle control in cancer. Nat. Rev. Mol. Cell Biol. 2022, 23, 74–88. [Google Scholar] [CrossRef]
  100. Glaviano, A.; Singh, S.K.; Lee, E.H.C.; Okina, E.; Lam, H.Y.; Carbone, D.; Reddy, E.P.; O’Connor, M.J.; Koff, A.; Singh, G.; et al. Cell cycle dysregulation in cancer. Pharmacol. Rev. 2025, 77, 100030. [Google Scholar] [CrossRef]
  101. Evan, G.I.; Vousden, K.H. Proliferation, cell cycle and apoptosis in cancer. Nature 2001, 411, 342–348. [Google Scholar] [CrossRef]
  102. Kent, L.N.; Leone, G. The broken cycle: E2F dysfunction in cancer. Nat. Rev. Cancer 2019, 19, 326–338. [Google Scholar] [CrossRef]
  103. Das, S.K.; Lewis, B.A.; Levens, D. MYC: A complex problem. Trends Cell Biol. 2023, 33, 235–246. [Google Scholar] [CrossRef] [PubMed]
  104. Dhanasekaran, R.; Deutzmann, A.; Mahauad-Fernandez, W.D.; Hansen, A.S.; Gouw, A.M.; Felsher, D.W. The MYC oncogene—The grand orchestrator of cancer growth and immune evasion. Nat. Rev. Clin. Oncol. 2022, 19, 23–36. [Google Scholar] [CrossRef] [PubMed]
  105. Yang, C.; Zhang, J.; Liao, M.; Yang, Y.; Wang, Y.; Yuan, Y.; Ouyang, L. Folate-mediated one-carbon metabolism: A targeting strategy in cancer therapy. Drug Discov. Today 2021, 26, 817–825. [Google Scholar] [CrossRef] [PubMed]
  106. Szwed, A.; Kim, E.; Jacinto, E. Regulation and metabolic functions of mTORC1 and mTORC2. Physiol. Rev. 2021, 101, 1371–1426. [Google Scholar] [CrossRef]
  107. An, J.; Li, F.; Qin, Y.; Zhang, H.; Ding, S. Low concentrations of FA exhibits the Hormesis effect by affecting cell division and the Warburg effect. Ecotoxicol. Environ. Saf. 2019, 183, 109576. [Google Scholar] [CrossRef]
  108. Chen, Z.; Salam, M.T.; Toledo-Corral, C.; Watanabe, R.M.; Xiang, A.H.; Buchanan, T.A.; Habre, R.; Bastain, T.M.; Lurmann, F.; Wilson, J.P.; et al. Ambient Air Pollutants Have Adverse Effects on Insulin and Glucose Homeostasis in Mexican Americans. Diabetes Care 2016, 39, 547–554. [Google Scholar] [CrossRef]
  109. Miller, D.B.; Karoly, E.D.; Jones, J.C.; Ward, W.O.; Vallanat, B.D.; Andrews, D.L.; Schladweiler, M.C.; Snow, S.J.; Bass, V.L.; Richards, J.E.; et al. Inhaled ozone (O3)-induces changes in serum metabolomic and liver transcriptomic profiles in rats. Toxicol. Appl. Pharmacol. 2015, 286, 65–79. [Google Scholar] [CrossRef]
  110. Bollati, V.; Baccarelli, A.; Hou, L.; Bonzini, M.; Fustinoni, S.; Cavallo, D.; Byun, H.M.; Jiang, J.; Marinelli, B.; Pesatori, A.C.; et al. Changes in DNA methylation patterns in subjects exposed to low-dose benzene. Cancer Res. 2007, 67, 876–880. [Google Scholar] [CrossRef]
  111. Feng, J.; Liu, C.W.; Peng, J.; Hsiao, Y.C.; Chen, D.; Jin, C.; Lu, K. Formaldehyde Exposure Induces Systemic Epigenetic Alterations in Histone Methylation and Acetylation. bioRxiv 2025. [Google Scholar] [CrossRef]
  112. Poursafa, P.; Kamali, Z.; Fraszczyk, E.; Boezen, H.M.; Vaez, A.; Snieder, H. DNA methylation: A potential mediator between air pollution and metabolic syndrome. Clin. Epigenetics 2022, 14, 82. [Google Scholar] [CrossRef]
  113. Rider, C.F.; Carlsten, C. Air pollution and DNA methylation: Effects of exposure in humans. Clin. Epigenetics 2019, 11, 131. [Google Scholar] [CrossRef] [PubMed]
  114. Gangwar, R.S.; Bevan, G.H.; Palanivel, R.; Das, L.; Rajagopalan, S. Oxidative stress pathways of air pollution mediated toxicity: Recent insights. Redox Biol. 2020, 34, 101545. [Google Scholar] [CrossRef] [PubMed]
  115. Chen, C.S.; Hseu, Y.C.; Liang, S.H.; Kuo, J.Y.; Chen, S.C. Assessment of genotoxicity of methyl-tert-butyl ether, benzene, toluene, ethylbenzene, and xylene to human lymphocytes using comet assay. J. Hazard. Mater. 2008, 153, 351–356. [Google Scholar] [CrossRef] [PubMed]
  116. Lindsey, R.H., Jr.; Bender, R.P.; Osheroff, N. Effects of benzene metabolites on DNA cleavage mediated by human topoisomerase II alpha: 1,4-hydroquinone is a topoisomerase II poison. Chem. Res. Toxicol. 2005, 18, 761–770. [Google Scholar] [CrossRef]
  117. Monks, T.J.; Butterworth, M.; Lau, S.S. The fate of benzene-oxide. Chem. Biol. Interact. 2010, 184, 201–206. [Google Scholar] [CrossRef]
  118. Chen, H.; Eastmond, D.A. Topoisomerase inhibition by phenolic metabolites: A potential mechanism for benzene’s clastogenic effects. Carcinogenesis 1995, 16, 2301–2307. [Google Scholar] [CrossRef]
  119. Nadalutti, C.A.; Prasad, R.; Wilson, S.H. Perspectives on formaldehyde dysregulation: Mitochondrial DNA damage and repair in mammalian cells. DNA Repair 2021, 105, 103134. [Google Scholar] [CrossRef]
  120. Stucki, D.; Stahl, W. Carbon monoxide—Beyond toxicity? Toxicol. Lett. 2020, 333, 251–260. [Google Scholar] [CrossRef]
  121. Jayakumar, R.; Sasikala, K. Evaluation of DNA damage in jewellery workers occupationally exposed to nitric oxide. Environ. Toxicol. Pharmacol. 2008, 26, 259–261. [Google Scholar] [CrossRef]
  122. Wagner, J.R.; Madugundu, G.S.; Cadet, J. Ozone-Induced DNA Damage: A Pandora’s Box of Oxidatively Modified DNA Bases. Chem. Res. Toxicol. 2021, 34, 80–90. [Google Scholar] [CrossRef] [PubMed]
  123. Thomas, C.; Pellicciari, R.; Pruzanski, M.; Auwerx, J.; Schoonjans, K. Targeting bile-acid signalling for metabolic diseases. Nat. Rev. Drug Discov. 2008, 7, 678–693. [Google Scholar] [CrossRef]
  124. Sandalio, L.M.; Pelaez-Vico, M.A.; Molina-Moya, E.; Romero-Puertas, M.C. Peroxisomes as redox-signaling nodes in intracellular communication and stress responses. Plant Physiol. 2021, 186, 22–35. [Google Scholar] [CrossRef]
  125. Walker, C.L.; Pomatto, L.C.D.; Tripathi, D.N.; Davies, K.J.A. Redox Regulation of Homeostasis and Proteostasis in Peroxisomes. Physiol. Rev. 2018, 98, 89–115. [Google Scholar] [CrossRef]
  126. Ahn, C.; Jeung, E.B. Endocrine-Disrupting Chemicals and Disease Endpoints. Int. J. Mol. Sci. 2023, 24, 5342. [Google Scholar] [CrossRef] [PubMed]
  127. Lee, H.R.; Jeung, E.B.; Cho, M.H.; Kim, T.H.; Leung, P.C.; Choi, K.C. Molecular mechanism(s) of endocrine-disrupting chemicals and their potent oestrogenicity in diverse cells and tissues that express oestrogen receptors. J. Cell Mol. Med. 2013, 17, 1–11. [Google Scholar] [CrossRef]
  128. Yilmaz, B.; Terekeci, H.; Sandal, S.; Kelestimur, F. Endocrine disrupting chemicals: Exposure, effects on human health, mechanism of action, models for testing and strategies for prevention. Rev. Endocr. Metab. Disord. 2020, 21, 127–147. [Google Scholar] [CrossRef]
  129. Bulog, A.; Karaconji, I.B.; Sutic, I.; Micovic, V. Immunomodulation of cell-mediated cytotoxicity after chronic exposure to vapors. Coll. Antropol. 2011, 35 (Suppl. S2), 61–64. [Google Scholar] [PubMed]
  130. De Celis, R.; Feria-Velasco, A.; Bravo-Cuellar, A.; Hicks-Gomez, J.J.; Garcia-Iglesias, T.; Preciado-Martinez, V.; Munoz-Islas, L.; Gonzalez-Unzaga, M. Expression of NK cells activation receptors after occupational exposure to toxics: A preliminary study. Immunol. Lett. 2008, 118, 125–131. [Google Scholar] [CrossRef]
  131. Park, J.; Kang, G.H.; Kim, Y.; Lee, J.Y.; Song, J.A.; Hwang, J.H. Formaldehyde exposure induces differentiation of regulatory T cells via the NFAT-mediated T cell receptor signalling pathway in Yucatan minipigs. Sci. Rep. 2022, 12, 8149. [Google Scholar] [CrossRef]
  132. Park, J.; Yang, H.S.; Song, M.K.; Kim, D.I.; Lee, K. Formaldehyde exposure induces regulatory T cell-mediated immunosuppression via calcineurin-NFAT signalling pathway. Sci. Rep. 2020, 10, 17023. [Google Scholar] [CrossRef] [PubMed]
  133. Wen, H.; Yuan, L.; Wei, C.; Zhao, Y.; Qian, Y.; Ma, P.; Ding, S.; Yang, X.; Wang, X. Effects of combined exposure to formaldehyde and benzene on immune cells in the blood and spleen in Balb/c mice. Environ. Toxicol. Pharmacol. 2016, 45, 265–273. [Google Scholar] [CrossRef] [PubMed]
  134. Shu, Q.; Ma, H.; Wang, T.; Wang, P.; Xu, H. Formaldehyde promotes tumor-associated macrophage polarizations and functions through induction of HIF-1alpha-mediated glycolysis. Toxicol. Lett. 2023, 390, 5–14. [Google Scholar] [CrossRef]
  135. Ye, S.; Ma, Y.; Li, S.; Luo, S.; Wei, L.; Hu, D.; Xiao, F. Ambient NO(2) hinders neutrophil extracellular trap formation in rats: Assessment of the role of neutrophil autophagy. J. Hazard. Mater. 2023, 457, 131755. [Google Scholar] [CrossRef]
  136. Fritsche, K.L. The science of fatty acids and inflammation. Adv. Nutr. 2015, 6, 293S–301S. [Google Scholar] [CrossRef] [PubMed]
  137. Cassidy-Bushrow, A.E.; Burmeister, C.; Birbeck, J.; Chen, Y.; Lamerato, L.; Lemke, L.D.; Li, J.; Mor, G.; O’Leary, B.F.; Peters, R.M.; et al. Ambient BTEX exposure and mid-pregnancy inflammatory biomarkers in pregnant African American women. J. Reprod. Immunol. 2021, 145, 103305. [Google Scholar] [CrossRef]
  138. Guo, H.; Ahn, S.; Zhang, L. Benzene-associated immunosuppression and chronic inflammation in humans: A systematic review. Occup. Environ. Med. 2020, 78, 377–384. [Google Scholar] [CrossRef]
  139. Liu, K.; Cao, H.; Li, B.; Guo, C.; Zhao, W.; Han, X.; Zhang, H.; Wang, Z.; Tang, N.; Niu, K.; et al. Long-term exposure to ambient nitrogen dioxide and ozone modifies systematic low-grade inflammation: The CHCN-BTH study. Int. J. Hyg. Environ. Health 2022, 239, 113875. [Google Scholar] [CrossRef]
  140. Rappazzo, K.M.; Nichols, J.L.; Rice, R.B.; Luben, T.J. Ozone exposure during early pregnancy and preterm birth: A systematic review and meta-analysis. Environ. Res. 2021, 198, 111317. [Google Scholar] [CrossRef]
  141. Xu, Z.; Wang, W.; Liu, Q.; Li, Z.; Lei, L.; Ren, L.; Deng, F.; Guo, X.; Wu, S. Association between gaseous air pollutants and biomarkers of systemic inflammation: A systematic review and meta-analysis. Environ. Pollut. 2022, 292, 118336. [Google Scholar] [CrossRef]
  142. Ziegler, K.; Kunert, A.T.; Reinmuth-Selzle, K.; Leifke, A.L.; Widera, D.; Weller, M.G.; Schuppan, D.; Frohlich-Nowoisky, J.; Lucas, K.; Poschl, U. Chemical modification of pro-inflammatory proteins by peroxynitrite increases activation of TLR4 and NF-kappaB: Implications for the health effects of air pollution and oxidative stress. Redox Biol. 2020, 37, 101581. [Google Scholar] [CrossRef] [PubMed]
  143. Faloppa, C.C.; Baiocchi, G.; Cunha, I.W.; Fregnani, J.H.; Osorio, C.A.; Fukazawa, E.M.; Kumagai, L.Y.; Badiglian-Filho, L.; Pinto, G.L.; Soares, F.A. NF-kappaB and COX-2 expression in nonmalignant endometrial lesions and cancer. Am. J. Clin. Pathol. 2014, 141, 196–203. [Google Scholar] [CrossRef] [PubMed]
  144. Lai, Z.Z.; Yang, H.L.; Ha, S.Y.; Chang, K.K.; Mei, J.; Zhou, W.J.; Qiu, X.M.; Wang, X.Q.; Zhu, R.; Li, D.J.; et al. Cyclooxygenase-2 in Endometriosis. Int. J. Biol. Sci. 2019, 15, 2783–2797. [Google Scholar] [CrossRef] [PubMed]
Figure 1. Transcriptome analysis of EC and PPI network mapping of APECGs: (a) Volcano plot of DEGs between EC and normal samples (|FC| > 1.5, adjusted p < 0.05). (b) Ridge plot of 16 significantly enriched Hallmark pathways identified by GSEA, with colors indicating adjusted p-values. The x-axis shows enrichment scores, and the y-axis lists the pathways. (c) GSEA enrichment plots of the top five Hallmark pathways ranked by normalized enrichment score. (d) Bubble plot of significantly activated and suppressed Hallmark pathways.
Atmosphere 16 00841 g001
Figure 2. Identification and PPI network analysis of APECGs: (a) Venn diagram showing 83 overlapping genes among air pollutant-related targets (n = 484), EC-related genes (n = 2771), and EC DEGs (n = 14,140). (b) PPI network of 81 APECGs from STRING (confidence ≥ 0.4), excluding isolated nodes. The network contains 81 nodes and 599 edges. (c) Cytoscape view of the PPI network. Node size and color represent node degree.
Atmosphere 16 00841 g002
Figure 3. Functional enrichment analysis of APECGs based on GO and KEGG pathways: (a) Top 10 enriched GO terms in BP, CC, and MF categories for 81 APECGs (adjusted p < 0.05). (b) Gene-pathway network linking APECGs to enriched GO-BP terms, highlighting “response to xenobiotic stimulus” and “response to molecule of bacterial origin/lipopolysaccharide”. (c) Top 10 enriched KEGG pathways in APECGs; dot size represents gene count, and color indicates significance. (d) Gene-pathway network of APECGs with enriched KEGG pathways, highlighting “microRNAs in cancer”, “HIF-1 signaling pathway”, and “fluid shear stress and atherosclerosis”. (e) KEGG enrichment results (p < 0.001) for the 43 upregulated (red) and 38 downregulated (blue) APECGs. Slashes indicate the pathways that are shared in the enrichment analysis.
Atmosphere 16 00841 g003
Figure 4. Construction and evaluation of prognostic models based on APECGs: (a) Forest plot of univariate Cox regression analysis for 83 APECGs, showing 15 genes significantly associated with prognosis (p < 0.05). (b) C-index rankings of the top 20 prognostic models selected from 117 combinations of 10 algorithms based on the mean C-index in the test cohort. The RSF-SuperPC model exhibits the highest performance. (c) Weights of 13 hub APECGs in the RSF-SuperPC model. (df) ROC curves for 1-year (d), 3-year (e), and 5-year (f) survival predictions in both the training and test sets using the RSF-SuperPC model. (gi) AUC rankings for the top 20 prognostic models for 1-year (g), 3-year (h), and 5-year (i) survival predictions, selected from 117 combinations of 10 algorithms based on AUC values in the test set.
Atmosphere 16 00841 g004
Figure 5. Validation of the prognostic risk model based on hub APECGs in TCGA cohorts: (a,b) Risk score distribution (top), survival events (middle), and expression heatmap (bottom) for 13 hub APECGs in the TCGA training (a) and test (b) sets. Patients are classified into high- and low-risk groups based on the optimal cutoff value. Higher risk scores correlate with increased mortality. (c,d) Kaplan–Meier survival curves for high- and low-risk groups in the TCGA training (c) and test (d) sets. The high-risk group shows significantly poorer overall survival in both sets (p < 0.01).
Atmosphere 16 00841 g005
Figure 6. Characterization of key APECGs in relation to air pollutants, their expression profiles, and prognostic significance: (a) Heatmap of the binding energies (kcal/mol) between 17 key APECGs and 3 control proteins (CRYAB, RPS27A, MYL6) with 9 air pollutants. Binding energies are calculated using molecular docking via CB-Dock2. Values below –5 kcal/mol indicate stable binding affinity. (b) Boxplot of binding energy differences between 17 key APECGs and 3 control proteins (CRYAB, RPS27A, MYL6) across 9 pollutants. (c) Lollipop plot of stable binding pairs (ΔG < −5.0 kcal/mol) between 17 key APECGs and 9 air pollutants. (dg) Representative molecular docking results generated by CB-Dock2: TNF–Ethylbenzene (d), PTGS2–Toluene (e), CCNE1–Benzene (f), and MMP2–Ethylbenzene (g). The left panels show protein–ligand complexes, and the right panels display detailed views of the binding sites. (h) Expression levels of 17 key APECGs in high-risk (red) and low-risk (blue) groups. Asterisks indicate statistical significance. (i) Kaplan–Meier survival analysis of 17 key APECGs comparing high (red) and low (blue) expression groups.
Atmosphere 16 00841 g006
Figure 7. Differences in pathway enrichment between high- and low-risk groups: (a,b) Bar plots of log2FC for 76 KEGG pathways (a) and 28 Hallmark pathways (b), consistently enriched in both the high- and low-risk groups of the training (orange) and test (cyan) sets. (c,d) Volcano plots illustrating differential enrichment of 113 KEGG (c) and 34 Hallmark (d) pathways in the training set. Blue dots represent pathways with consistent and significant enrichment in both cohorts, with dot size reflecting the –log10 of the adjusted p-value. (e,f) Heatmaps displaying enrichment scores for the top 10 KEGG (e) and Hallmark (f) pathways enriched in the high-risk group. Rows represent pathways, and the color gradient reflects enrichment levels (red: high; blue: low).
Atmosphere 16 00841 g007
Figure 8. Random forest-based risk prediction using KEGG and Hallmark pathway signatures: (a,b) Confusion matrices illustrating the prediction performance of random forest models constructed using 76 KEGG pathways (a) and 28 Hallmark pathways (b). Evaluation metrics include accuracy, sensitivity, precision, and F1 score. (c) ROC curves comparing KEGG-based (blue) and Hallmark-based (red) models. The AUC values are 0.949 and 0.923, respectively. (d,e) Rankings of KEGG (d) and Hallmark (e) pathways based on MDGI, displaying only those with above-average importance.
Atmosphere 16 00841 g008
Figure 9. SHAP-based interpretation of KEGG and Hallmark pathway contributions to EC risk prediction: (a,b) SHAP summary plots for the top 15 KEGG (a) and Hallmark (b) pathways contributing to risk prediction. The x-axis indicates SHAP values (positive values increase high-risk probability; negative values reduce it), while the y-axis lists pathways. Dots represent individual samples, with color indicating pathway activity levels. (c,d) Bar plots of mean absolute SHAP values for the top 15 KEGG (c) and Hallmark (d) pathways, where higher values denote greater contribution to prediction. (e,f) SHAP waterfall plots for representative true positive samples, showing cumulative contributions of the top 15 KEGG (e) and Hallmark (f) pathways to the final prediction. The x-axis represents the prediction score starting from the expected value E[f(x)] = 0. Red arrows (positive SHAP) increase high-risk probability, while blue arrows (negative SHAP) reduce it. Scores of f(x) = 0.5 and −0.5 correspond to 100% high- and low-risk predictions, respectively.
Atmosphere 16 00841 g009
Table 1. Molecular weight, molecular formula, SMILES structure, and predicted carcinogenicity of air pollutants.
NameMolecular WeightMolecular FormulaSMILES
Structure
Carcinogenicity
ADMETLABProToxadmetSAR
Benzene78.11 g/molC6H6C1=CC=CC=C10.9690.920.5524
Toluene92.14 g/molC7H8|C6H5CH3CC1=CC=CC=C10.9570.880.5357
Sulfur Dioxide64.07 g/molO2S|SO2O=S=O0.7860.60.6371
Nitric Oxide30.006 g/molNO[N]=O0.6350.590.4813
Nitrogen Dioxide46.006 g/molNO2N(=O) [O]0.9760.510.4606
Carbon Monoxide28.010 g/molCO[C−] # [O+]10.510.5716
Ozone47.998 g/molO3[O−] [O+]=O0.9810.560.4759
Ethylbenzene106.16 g/molC8H10CCC1=CC=CC=C10.7360.890.5524
Formaldehyde30.026 g/molCH2O|H2COC=O0.6540.780.7138
Table 2. Functional characterization of 17 APECGs, their associated pathways, and predicted interactions with air pollutants.
Gene 1Functional Role in EC/CancerAssociated PathwaysStably Bound Pollutants 2References
TNFTumor Necrosis Factor: Encodes a pro-inflammatory cytokine regulating immune responses, apoptosis, and cell survival. Exerts context-dependent dual roles—promotes tumor growth, angiogenesis, invasion, and immune evasion via NF-κB activation; alternatively induces apoptosis and anti-tumor immunity through TNFR1-mediated death receptor signaling and caspase activation. Outcome influenced by receptor subtype, cell type, and microenvironment.NF-κB signaling, MAPK signaling, cytokine–cytokine receptor interaction, apoptosis, etc.Ethylbenzene, Toluene, Benzene[25,26]
ESR1Estrogen Receptor 1: Encodes a nuclear hormone receptor that binds estrogen response elements to regulate genes involved in proliferation, survival, and angiogenesis. Promotes tumor growth by activating pathways such as PI3K/AKT, MAPK, and E2F in type I EC (hormone-dependent); high expression typically correlates with better differentiation and prognosis. Downregulation—commonly due to promoter methylation or mutation—is frequent in high-risk or advanced-stage EC, contributing to hormone resistance, poor differentiation, and invasiveness. This shift may promote a transition to hormone-independent growth, resembling the aggressive, poorly differentiated characteristics of type II EC. Loss also disrupts immune surveillance by reducing CD8+ T-cell infiltration and enhancing pro-tumorigenic signaling (e.g., VEGF, TGF-β), creating an immunosuppressive microenvironment. Thus, ESR1 plays a context-dependent role in EC, with its presence supporting controlled proliferation and its loss linked to progression and immune evasion.Estrogen signaling, PI3K/Akt signaling, MAPK signaling, Wnt/β-catenin, etc.Ethylbenzene, Toluene[27,28,29,30,31,32,33,34]
IL1BInterleukin-1 Beta: Pro-inflammatory cytokine produced by immune cells, fibroblasts, and tumor cells upon inflammasome activation. Promotes cancer progression by enhancing angiogenesis, proliferation, invasion, metastasis, and by driving chronic inflammation and immunosuppressive cell recruitment. In some contexts, supports anti-tumor immunity via dendritic cell and Th1 activation.NF-κB signaling, cytokine–cytokine receptor interaction, PI3K/Akt signaling, MAPK signaling, STAT3 signaling, etc.Ethylbenzene[35,36,37,38,39]
NFKB1Nuclear Factor Kappa B Subunit 1: Encodes p105/p50, a transcription factor regulating immunity, inflammation, apoptosis, and survival. Promotes tumor progression via p50:p65 heterodimers that activate pro-inflammatory and pro-survival genes; p50:p50 homodimers with Bcl-3 may also drive oncogenesis. Conversely, p50 homodimers lacking transactivation domains can suppress inflammation, inhibit immune evasion, and block survival of DNA-damaged cells, acting as context-dependent tumor suppressors.NF-κB signaling, apoptosis, PI3K/Akt signaling, MAPK signaling, DNA damage response (DDR) Pathway, etc.Ethylbenzene, Toluene[40,41]
PTGS2Prostaglandin–Endoperoxide Synthase 2: Encodes COX-2, a key enzyme in prostaglandin biosynthesis and inflammation. Often upregulated in cancer, promoting angiogenesis, proliferation, invasion, immune evasion, and resistance to apoptosis and therapy. Reduced expression may disrupt inflammatory balance and immune regulation, favoring immune escape and aggressive tumor behavior.NF-κB signaling, HIF-1 signaling, PI3K/Akt signaling, MAPK signaling, prostaglandin synthesis pathway, etc.Ethylbenzene, Toluene, Benzene[42,43,44]
KCNH2Voltage-gated potassium channel involved in membrane repolarization and electrical excitability. Limited direct evidence in EC; overexpression in other cancers linked to enhanced proliferation and migration.Ion channel signaling, potential role in PI3K/Akt signaling, etc.-[45,46]
CCNE1Cyclin E1: Promotes G1/S transition by forming a complex with CDK2. Frequently amplified in EC, especially serous-like or copy-number high subtypes. Overexpression associated with genomic instability and poor prognosis.Cell cycle, p53 signaling, PI3K/Akt signaling, etc.Ethylbenzene, Toluene, Benzene[47,48,49,50]
CCR2C-C Chemokine Receptor Type 2: Mediates monocyte/macrophage chemotaxis and shapes the tumor microenvironment. Promotes cancer progression by recruiting immunosuppressive TAMs and Tregs, enhancing tumor survival, invasion, and metastasis. Reduced signaling may impair immune surveillance, facilitating chronic inflammation or immune escape depending on context.CCL2/CCR2 signaling axis, PI3K/Akt signaling, MAPK/ERK signaling, NF-κB signaling, etc.-[51,52,53,54]
HPRT1Hypoxanthine Phosphoribosyltransferase: Catalyzes purine salvage supporting nucleotide biosynthesis. Commonly overexpressed in EC and other cancers, facilitating rapid proliferation by supplying purine precursors for DNA replication and growth.Purine metabolism, nucleotide biosynthesis, etc.-[55,56]
FOLH1Folate Hydrolase 1: Involved in one-carbon metabolism. Downregulated in advanced-stage EC, associated with poor prognosis and reduced immune infiltration (CD8+ T cells, dendritic cells). Epigenetic silencing via promoter methylation may promote immune evasion and metabolic dysregulation in the tumor microenvironment.Glutamate metabolism, folate biosynthesis, etc.Ethylbenzene[57,58]
CDC25CCell Cycle Phosphatase: Promotes G2/M transition by activating CDK1. Overexpression accelerates mitosis, driving uncontrolled proliferation and genomic instability. In EC, especially MSI-high subtypes, CDC25C mutations or dysregulation may enhance tumor progression.Cell cycle, G2/M checkpoint, p53 signaling, etc.-[59,60,61,62]
AHCYS-adenosylhomocysteine Hydrolase (AHCY): Regulates methylation potential by hydrolyzing SAH, maintaining SAM:SAH balance essential for DNA, RNA, and protein methylation. Supports chromatin regulation and nucleotide synthesis. Limited direct evidence in EC but overexpression may promote epigenetic reprogramming, nucleotide synthesis, and oxidative stress adaptation, contributing to tumor progression.Methionine metabolism, epigenetic regulation, DNA methylation, oxidative stress response, etc.Ethylbenzene, Toluene[63,64]
CTSDCathepsin D: Secreted lysosomal protease acting as an autocrine/paracrine mitogen. Promotes tumor proliferation, invasion, metastasis, and angiogenesis.Lysosomal pathway, extracellular matrix degradation, MAPK signaling, apoptosis, etc.Ethylbenzene[65]
CDC25BCell cycle phosphatase promoting G2/M transition via CDK1–cyclin B1 activation, facilitating mitotic entry and proliferation. Frequently overexpressed in cancers, enabling checkpoint bypass, chromosomal instability, and tumor aggressiveness.Cell cycle, G2/M checkpoint, p53 signaling, etc.-[62,66,67,68]
MMP2Zinc-Dependent Matrix Metalloproteinase: Degrades extracellular matrix (ECM) components. Although direct evidence in EC is limited, it is overexpressed in aggressive tumors, promoting angiogenesis, migration, and pro-tumor signaling (e.g., VEGF, TGF-β). Deficiency impairs ECM remodeling, causing accumulation of pro-inflammatory mediators (e.g., MCP-3, TNF-α), which may foster metabolic and inflammatory dysregulation, a tumor-promoting microenvironment, and genomic instability.ECM remodeling, NF-κB signaling, TGF-β signaling, VEGF pathway, etc.Ethylbenzene, Toluene[69,70,71,72]
TLR4Pattern recognition receptor detecting pathogen- and damage-associated molecular patterns (PAMPs/DAMPs), triggering pro-inflammatory and immune responses via NF-κB and IRF3 pathways. Limited direct evidence in EC; overexpressed in several cancers, promoting tumor growth, inflammation, and chemoresistance. Reduced expression may impair dendritic cell activation, antigen presentation, and cytotoxic T-cell recruitment, weakening anti-tumor immunity. Also involved in tissue integrity and epithelial repair; downregulation may hinder these processes and attenuate type I interferon responses, fostering an immunosuppressive microenvironment.NF-κB signaling, IRF3 pathway, Toll-like receptor signaling, immune cell recruitment, epithelial repair, etc.Ethylbenzene, Toluene[73,74,75,76,77]
SLC2A1Glucose Transporter 1: Facilitates glucose uptake and supports metabolic reprogramming via the Warburg effect. Frequently overexpressed in cancers, promoting proliferation, survival, and chemoresistance.HIF-1 signaling, glucose metabolism, PI3K-Akt-mTOR, Ras-MAPK, c-MYC signaling, p53 suppression, etc.Ethylbenzene, Toluene[78,79,80]
1 Genes are identified via PPI and RSF-SuperPC models. 2 Based on molecular docking with ΔG < –5 kcal/mol.
Disclaimer/Publisher’s Note: The statements, opinions and data contained in all publications are solely those of the individual author(s) and contributor(s) and not of MDPI and/or the editor(s). MDPI and/or the editor(s) disclaim responsibility for any injury to people or property resulting from any ideas, methods, instructions or products referred to in the content.

