Article

Airborne Measurements of Real-World Black Carbon Emissions from Ships

by
Ward Van Roy
*,
Jean-Baptiste Merveille
,
Kobe Scheldeman
,
Annelore Van Nieuwenhove
and
Ronny Schallier
Royal Belgian Institute of Natural Sciences, Vautierstraat 29, 1000 Brussels, Belgium
*
Author to whom correspondence should be addressed.
Atmosphere 2025, 16(7), 840; https://doi.org/10.3390/atmos16070840
Submission received: 6 June 2025 / Revised: 1 July 2025 / Accepted: 7 July 2025 / Published: 10 July 2025
(This article belongs to the Special Issue Air Pollution from Shipping: Measurement and Mitigation)

Abstract

The impact of black carbon (BC) emissions on climate change, human health, and the environment is well-documented in the scientific literature. Although BC still remains largely unregulated at the international level, efforts have been made to reduce emissions of BC and Particulate Matter (PM2.5), particularly in sectors such as energy production, industry, and road transport. In contrast, the maritime shipping industry has made limited progress in reducing BC emissions from ships, mainly due to the absence of stringent BC emission regulations. While the International Maritime Organization (IMO) has established emission limits for pollutants such as SOx, NOx, and VOCs under MARPOL Annex VI, as of today, BC emissions from ships are still unregulated at the international level. Whereas it was anticipated that PM2.5 and BC emissions would be reduced with the adoption of the SOx regulations, especially within the sulfur emission control areas (SECA), this study reveals that BC emissions are only partially affected by the current MARPOL Annex VI regulations. Based on 886 real-world black carbon (BC) emission measurements from ships operating in the southern North Sea, the study demonstrates that SECA-compliant fuels do contribute to a notable decrease in BC emissions. However, it is important to note that the average BC emission factors (EFs) within the SECA remain comparable in magnitude to those reported for non-compliant fuels in earlier studies. Moreover, ships using exhaust gas cleaning systems (EGCSs) as a SECA-compliant measure were found to emit significantly higher levels of BC, raising concerns about the environmental sustainability of EGCSs as an emissions mitigation strategy.

1. Introduction

1.1. Climate and Health Impact of Black Carbon Emissions

The combustion of fossil fuels in maritime shipping not only emits carbon dioxide (CO2) and air pollutants like nitrogen oxides (NOx) and sulfur oxides (SOx), but also black carbon (BC) particles are generated. While BC is not classified as a greenhouse gas, it significantly contributes to climate change through its ability to absorb sunlight and coat sea ice, an effect also known as “blacking” of sea ice, reducing its reflectivity or albedo and consequently increasing ice melt [1,2,3,4,5,6,7].
Despite its recognized impact, the overall climate effect of BC remains a debated topic. Estimates of its global warming potential (GWP) vary widely, with reported values ranging from 690 to 4700 CO2-equivalent (CO2-eq) over a 20-year period (GWP20) and from 120 to 2240 CO2-eq over a 100-year period (GWP100) [1,2,3,8]. Notably, the Intergovernmental Panel on Climate Change (IPCC) did not mention a GWP20 for BC in its 2023 Sixth Assessment Report (AR6). Whereas the Fifth Assessment Report (AR5) still mentions a GWP20 of 2421 CO2-eq. After the conclusion of AR6, the Centre for International Climate and Environmental Research (CISERO, Oslo, Norway) revised the GWP20 of BC downward to 1262 CO2-eq, lowering BC’s ranking from the second to the third most significant climate forcer after methane (CH4) [9]. However, BC’s localized effects in the Arctic may be considerably higher due to its influence on the albedo of snow and ice [10]. Given BC’s short-lived nature, regulating its emissions could yield immediate climate benefits [1,3,8,11,12].
Beyond its climate impact, BC poses severe health risks as a major component of fine particulate matter (PM2.5) [13]. It can penetrate deep into the respiratory system, leading to respiratory diseases such as asthma and increasing the risk of cardiovascular diseases (CVDs) [13,14]. Moreover, BC is a known carcinogen and has been linked to adverse birth outcomes, including low birth weight and preterm birth [15,16].

1.2. BC Emission Regulations

To regulate air pollution from ships, the International Maritime Organization (IMO, London, UK) adopted MARPOL Annex VI in 1997, with the latest revision in 2021 [17]. These regulations primarily aim to reduce SOx and NOx emissions from ships. As part of these regulations, the IMO established sulfur emission control areas (SECAs). For the North and Baltic Sea SECA, a maximum fuel sulfur content (FSC) of 0.1% has been in place since 2015 [18]. In 2020, the IMO introduced a global sulfur cap, reducing the maximum allowable fuel sulfur content (FSC) from 3.5% to 0.5% [19].
While these regulations were designed to lower SO2 emissions, they were also expected to reduce PM2.5 and BC emissions, as compliance was anticipated through the use of distillate fuels like marine gas oil (MGO) [20]. However, instead of switching to distillate fuels, the industry’s shifted towards very low sulfur fuel oils (VLSFO) and ultra low sulfur fuel oils (ULSFO). These new fuel oils, often characterized by a high aromatic content, have been found to be less effective in reducing PM2.5 and BC emissions [21,22,23,24]. In addition, the industry largely opted to use exhaust gas cleaning systems (EGCSs) to comply with sulfur regulations while operating on heavy fuel oil (HFO).
In addition to the sulfur regulations, the IMO implemented restrictions on NOx emissions and created NOx emission control areas (NECAs), where for the newer vessels (with keel laying date after 1 January 2021) stricter Tier III limits apply [25,26]. To achieve Tier III emissions limits, ships use abatement technologies like selective catalytic reduction (SCR) systems or use alternative fuels like liquified natural gas (LNG).
The IMO began formally addressing BC emissions in 2011 during the 62nd session of the Marine Environment Protection Committee (MEPC 62), focusing on the impact of BC from international shipping on the Arctic [27,28]. In 2015, at MEPC 68, the IMO adopted a definition of BC emissions from ships and approved several standardized measurement methods. Member states and observer organizations were also invited to submit data and proposals related to BC emissions and possible control measures [29]. The Fourth IMO GHG Study (2020) includes assessments of BC emissions from ships, based on data submitted by various stakeholders [30]. As climate change opens new Arctic shipping routes, concerns about BC’s role in accelerating sea ice melt have grown, prompting the IMO to adopt a ban on the use and carriage of heavy fuel oil (HFO) in Arctic waters [31]. However, the current impact of the ban remains limited due to exemptions and waivers, with estimated reductions in HFO use of only 16% [32].
In recent years, the IMO’s MEPC and Pollution Prevention and Response (PPR) Sub-Committee have held several sessions discussing the implementation of BC mitigation strategies and abatement technologies. Among the considered after-treatment systems, Wet Electrostatic Precipitators (WESP) and Diesel Particulate Filters (DPFs) have gained particular attention for their effectiveness in reducing BC emissions from marine engines. DPFs have demonstrated reduction efficiencies of up to 99%, while real-world trials of WESP systems installed on EGCS-equipped ships have shown similarly high levels of BC removal [33,34].
Also, the role of aromatic content in marine fuels on BC emissions has been discussed at IMO’s PPR (PPR 7 and 8). A study submitted by Finland and Germany found that fuels with a high percentage of aromatic compounds can significantly increase BC emissions. Measurement results showed that VLSFOs containing 70–95% aromatic content led to a 10–85% increase in BC emissions compared to HFO and up to a 145% increase compared to distillate fuels [35].

1.3. Previous Studies

Previous studies have demonstrated that BC and particle emission factors (EFs) from ships vary depending on fuel composition, engine type and load, engine age, and operational conditions [36,37,38,39,40,41,42,43]. Studies indicate a broad range of BC EF values ranging from 0.17 to 1.33 g/kg fuel (Supplementary Table S1) [4,44,45,46]. Notably, the Fourth IMO GHG Study (2020) presents a power function model that estimates BC EFs based on fuel type and engine load [30]. These models were developed based on research performed by the International Council on Clean Transportation (ICCT, Washinton, DC, USA) (Supplementary Figure S1) [38,47,48].
Several previous studies further indicate that modern, electronically controlled engines tend to emit less BC and that EGCSs may contribute to further reductions [38,39,49]. However, the overall effectiveness of EGCSs in mitigating fleet-wide BC emissions remains uncertain. Some studies suggest that ships equipped with EGCSs using high-sulfur HFO may still produce overall higher levels of air pollutants, including BC, compared to ships using low-sulfur fuels or distillate fuels [21,49,50,51,52].
Despite IMO regulations and projections from previous studies, the actual impact of sulfur and NOx restrictions on BC emissions remains unclear due to a lack of large-scale studies with real-world emission data. Most previous studies have relied on a limited number of onboard measurements, which, while insightful, do not provide a comprehensive picture of fleet-wide emissions. Additionally, they offer limited insights into emissions of ships operating in emission control areas (ECAs), such as the North Sea, under real-world conditions. Furthermore, existing studies often focus on test bed measurements conducted on new engines, which do not take into account the effect of engine wear and maintenance over time [39,53,54].

2. Methods and Materials

2.1. Research Area and Regional Context

2.1.1. Belgian Part of the North Sea

The remote BC emission measurements from ships were primarily conducted in the Belgian part of the North Sea and the Westerscheldt estuary, the main access route to the Port of Antwerp. Additional measurements extended from the SECA border near the French city of Brest up to the port approach area of Rotterdam. The Belgian North Sea area, although relatively limited in extent (approximately 3454 km2) [55], is characterized by intense economic use, including offshore wind energy production and sand extraction (Supplementary Figure S2a). In addition to these economic activities, the region has an exceptionally high shipping density due to its strategic position north of the English Channel and its proximity to major European ports such as Rotterdam, Antwerp, and Hamburg. Consequently, the area ranks among the most heavily trafficked maritime corridors globally, with over 400 daily transits by vessels exceeding 300 gross tonnage (GT) (Supplementary Figure S2b) [56,57,58]. This high concentration of maritime activity makes the region particularly relevant for assessing the environmental and health impacts of ship-related BC emissions.

2.1.2. North Sea Emission Control Area

Under the MARPOL Annex VI regulations, ECAs are defined for which special emission limits for SOx and NOx apply [17]. The North and Baltic Sea ECAs were established in 2011 (Supplementary Figure S3), in addition to ECAs in North America and the Caribbean Sea [18]. Initially the North Sea ECA was limited to SOx emission limitations. In 2021, NOx limits were introduced in the North Sea and Baltic Sea ECAs [26]. The North Sea and Baltic Sea ECAs encompass an extensive maritime region stretching from the English Channel to the Russian border and include coastal areas inhabited by approximately 280 million people. Due to prevailing atmospheric circulation patterns, BC emissions originating in the North Sea ECA can be transported toward the Arctic, highlighting the relevance of emissions from adjacent regions in influencing Arctic climate processes [32].

2.2. Airborne Remote BC Emission Measurements

2.2.1. Coastguard Aircraft and Sniffer Sensor System

The Belgian Coastguard aircraft was used for airborne ship emission measurements. The aircraft, a Britten Norman Islander (BN–2B) (Bembridge, UK), is a high-wing, short take-off and landing (STOL) aircraft. In 2015, it was equipped with a sniffer sensor system developed by Chalmers University (Gothenburg, Sweden). During the sniffer’s operational lifetime of 10 years, emissions from over 9000 ships have been measured at sea [50,51,52,59,60,61,62].
The sniffer sensor’s main purpose is the monitoring of SO2 and NOx emissions from ships. The units that were used for the calculation of the BC EFs in this study are (i) a LI-COR Environmental 7200RS nondispersive infrared (NDIR) sensor (Lincoln, NE, USA) was used for the measurement of CO2 in ppm (unitless); (ii) a ZOTAC Nano ID65 log computer (Duarte, CA, USA); (iii) a COMAR R400NG combined automatic identification system (AIS) and global positioning system (GPS) receiver (Newport, UK); and (iv) an Aeronautical Radio Inc. (ARINC, Annapolis, MD, USA) module to import wind information data from the aircraft’s avionics system. In addition, a Thermo Fisher Scientific TLE 43i SO2 sensor (Waltham, MA, USA) and an ACOEM Serinus 40 NOx sensor (Limonest, France) were used to assess the NOx and SOx compliance respectively.

2.2.2. BC Sensor

This sniffer setup was expanded in 2021 with the installation of a BC sensor. The MA300 sensor, a portable aethalometer from AethLabs (San Franscico, CA, USA), was used. This device utilizes a 5-wavelength UV–IR absorption analysis by measuring the rate of change in transmitted light caused by the continuous deposition of particles on a filter [63,64,65]. A stainless-steel sampling tube (1/4″) probe was installed on the bottom of the aircraft with a PM2.5 selective inlet. Only data from the IR signal (880 nm) was used, as this signal is primarily used to quantify BC [63]. The flow rate of the sensor was set at the highest rate (170 mL/min), and the sample rate was set at 1 Hz.
Notably, while the aethalometer technique used in this study may not be considered the most optimal method for onboard BC measurements, this limitation primarily stems from the high BC concentrations found in exhaust stacks [66]. In contrast, within dispersed plumes where BC concentrations are more comparable to ambient conditions, the technique provides high-quality data for measuring BC [64,65]. In addition, it provides measurement data with a high time response, a requirement for mobile applications. Another key advantage of the aethalometer used in this study is its compactness, allowing the potential deployment on other airborne platforms, such as remotely piloted aircraft systems (RPAS).

2.2.3. Fuel Type

As fuel type and, more specifically, aromatic content are recognized as major factors impacting BC emissions, 30 fuel samples were taken from ships with high BC values in cooperation with the Belgian Shipping Inspectorate. Due to a human error, 21 of the collected fuel samples were discarded. The remaining 9 samples were deemed insufficient for deeper analysis. SOx compliance was used as an alternative to evaluate the used fuel. Therefore, in addition to BC, all ships were measured for FSC with the sniffer system; FSC measurements below 0.13% were considered FSC compliant with a confidence interval (CI) of 68%, and measurements with an FSC above 0.13% were considered FSC non-compliant with a CI of 68% [62].

2.2.4. SURV Ship Database

Static ship information, such as the presence of an EGCS, ship type, GT, and keel-laying year (KLY), is utilized during routine monitoring flights for the enforcement of MARPOL Annex VI regulations 13 and 14. This data is compiled annually into the SURV Ship Database by combining data from the Thetis-EU database of the European Maritime Safety Agency (EMSA, Lisbon, Portugal) [67] and the IMO GISIS database [68]. The SURV Ship database is available offline and contains nearly 80,000 records; the database is used in-flight to link static ship data to airborne measurements, using each ship’s IMO number as a unique identifier.

2.2.5. NOx Tier Classification

According to MARPOL Annex VI, Regulation 13, the IMO sets tiered NOₓ emission limits for ships, with a classification based on the ship’s engine certification date, represented by the KLY. Ships are categorized into three NOx emission tiers: Tier I encompasses vessels with a KLY between 2001 and 2010, Tier II includes those from 2011 to 2020, and Tier III applies to ships constructed from 2021 onward operating within NECAs, such as the North Sea [26]. Vessels built prior to 2000 are not formally included within the tier system. However, those with a KLY post-1990 are still subject to Tier I requirements if their engines exceed 5000 kW in rated power or have a displacement of at least 90 L per cylinder. These vessels were therefore assigned to Tier I. All other pre-2000 vessels were classified into a pre-regulatory category, designated as Tier 0. Tier III vessels are subject to the most stringent emission limits, generally requiring the implementation of abatement technologies, such as SCR systems.

2.2.6. Engine Type

Since information on the engine type was not available in the SURV Ship Database, the engine rated speed (ERS) was used to assess the impact of the engine type on BC emissions. For this comparison, ships were categorized into three groups based on their ERS: the first category included ships with an ERS below 200 RPM, the second category consisted of ships with an ERS between 200 and 500 RPM, and the third category included ships with an ERS above 2000 RPM.

2.3. Analytical Methods and Load-Based Modeling for BC EFs

2.3.1. Analytical Methods for BC EF Calculations

The BC EFs (in g BC/kg fuel) were calculated by analyzing the concentrations of BC and CO2. As the exhaust plume is crossed with the aircraft, the concentrations of BC and CO2 increase, creating peaks that are higher than the background concentrations observed before and after the peak. The surface areas of these peaks above the background concentrations are used to calculate the BC EFs (Supplementary Figure S4). To estimate the amount of fuel burned in kilograms, the carbon (C) content is multiplied by the carbon content of marine fuels (87%) [69,70].
B C   E F = 1 M C g m o l 0.87 × 1000 × B C p e a k B C b k g g d t C O 2 , p e a k C O 2 , b k g p p m d t g k g   f u e l .

2.3.2. BC Measurement Uncertainty

The total uncertainty (utot) of the BC EF measurements was calculated based on the intra-assay coefficient of variability (CVRW) and the sum of all additional supplementary uncertainty factors (usup,i) [71].
u t o t = C V R W 2 + u s u p , i 2 .
The CVRW describes the repeatability of the measurements and can be assessed based on repeated measurements.
C V R W = 1 2 i = 1 n x i 1 x i 2 0.5 x i 1 + x i 2 2 n × 100 % .

2.3.3. Data Post-Processing and Signal Quality

The signal-to-noise ratio (SNR) of the BC measurements was significantly lower than that of the CO2, NOx, and SO2 measurements. Additionally, the BC signal responded more slowly compared to the CO2 signal (Supplementary Figure S4). As a result, the BC EF measurements required manual evaluation and could not be combined with the in-flight NOx and SO2 measurements. Consequently, all the data was reprocessed after four years of measurements. Unfortunately, due to the high noise in the BC signal, only about one-third of the measurements provided high-quality data with a good SNR. In 2022, the sensor was relocated within the aircraft, and the sampling tube was extended, which led to a substantial decrease in the SNR and a higher number of measurements being rejected. This issue was addressed in 2024 by again repositioning the BC sensor, this time closer to the sampling inlet, resulting in higher quality measurements and a lower rejection rate.

2.3.4. Emission Probability Distribution Analysis

For the fitting of the BC EF probability distribution a right skewed gaussian distribution was used.
y = y 0 + A · e 1 2 x x 0 ω + a x x 0 2 .
where
y 0   is the baseline value.
A is the amplitude (peak height).
x 0 is the center of the distribution.
ω is the initial width parameter.
a is the skewness factor.
The least squares method was used to find the best-fitting curve for the probability distribution to the available data points [72]. The best fitting factors of the distribution models were found by minimizing the sum of the squared differences between the observed values and the values predicted by the model.

2.3.5. Engine Load

Ships were identified based on AIS information. The AIS data includes ship identification and navigation parameters like speed and course. With the ship identification from AIS, engine characteristics were obtained from the SURV Ship Database. To correct the ship speed with real-time tidal currents, data from the RBINS ECODAM model was used [73]. The corrected speeds were used with the propeller law to calculate the engine load [30,74,75,76,77].
M o d e l l e d   l o a d = a c t u a l   s p e e d M a x i m u m   s p e e d 3 × C F .
The correction factors (CF) in the above formula vary between 0.7 and 1.3 and are generally based on ship type and operations [30,74,75,76,77]. To derive these CFs, 89 ships were contacted on marine VHF to ask their actual engine load. Based on a least squares analysis, the CFs for the different ship types were calculated that provided the best fit between the actual load and the modeled load.

2.3.6. Load-Based Emission Modeling Approaches

The research referred to in the IMO Fourth GHG study of 2020 applies load-based emission models based on a power function [38,47,48]:
B C   E F = a × L o a d b .
Based on the measured BC EFs, the factors a and b were calculated for the 25th, 75th, and 90th percentiles, as well as for the median and mean values. In addition to the power function, an exponential decay function was applied.
B C   E F = a × 1 d L o a d × b + c .
Likewise, based on the observed BC EFs, the factors a, b, c and d were calculated for the 25th, 75th, and 90th percentiles, as well as for the median and mean values. Other distributions could potentially be applied in future research, but this fell outside the scope of this study.

2.4. Statistical Analysis

Statistical analysis was conducted using TIBCO Statistica software version 14.0.0 (Palo Alto, CA, USA). The normality of BC emission measurement data was evaluated using the Kolmogorov–Smirnov test, which indicated that the data did not follow a normal distribution (p < 0.01). As a result, non-parametric tests were applied. The Mann–Whitney U test was used to compare emission medians across two groups, and the Kolmogorov–Smirnov test was used to compare the overall distribution of two groups. The Kruskal–Wallis test was used to compare the medians of multiple independent groups. The grouping variables were based on the measurement year, engine load, NOx tiers, ship type, ERS (RPM), EGCS, and FSC compliance. Differences in distributions were considered statistically significant at p < 0.05 [78].

3. Results and Discussion

3.1. Dataset Overview and Ship Characteristics

3.1.1. Sample Size and Annual Distribution

In total, 2026 BC measurements were made between 2021 and 2024. After reanalysis, 886 BC measurements remained with a high quality (43%), concerning 726 different ships. The other 159 ships concerned ships that were measured more than once. From these, 77 ships were measured multiple times during one flight to establish the repeatability of the measurements; the other 82 ships were not deliberately measured multiple times in the total time frame of the measurements. The large majority of the high-quality measurements were collected in 2024 (57%) and 2023 (30%), due to technical issues in the years 2021 and 2022 (Supplementary Figure S5).

3.1.2. Engine Loads

The CFs for the propeller law were calculated for the different ship types (Supplementary Table S2). When the CFs were applied, a moderate correlation was found between the modeled engine load and the actual engine load (R2 = 0.56) (Supplementary Figure S6). The moderate correlation is primarily due to limitations and inherent uncertainties of the propeller law, as well as the complex operational environment. While real-time current data were incorporated in the load modeling, real-time wind data were not considered in this study. Additionally, the highly variable conditions in the North Sea, such as unstable currents and frequent maneuvering, contribute to the uncertainty in accurately modeling engine load. The use of more advanced models, such as the STEAM model developed by the Finnish Meteorological Institute (FMI) [79], could potentially further improve load estimations; however, the development or application of such models was beyond the scope of this study.
For 615 ships, accounting for 69% of the total measurements, the engine load at the time of measurement could successfully be calculated using the propeller law and the CFs. The majority (42%) of the observed ships had an engine load below 25%, followed by the 25–50% load category (38%) (Supplementary Figure S7). For the other vessels no information was available on the design speed, and as a result the engine load could not be calculated.

3.1.3. Ship Type, Fuel Type and EGCS

Except for cruise ships, all major merchant vessel types were represented in the analyzed dataset. The most frequently observed ship type was container ships, making up 34% of the total vessels. Tankers, which included chemical, oil, and gas tankers, accounted for 31% of the observed fleet. Bulk carriers followed, comprising 17% of the total, while roll-on/roll-off (Ro-Ro) ships represented 12%. General cargo ships made up the remaining 6% (Supplementary Figure S8).
With regard to fuel type, about 94% of the observed ships were found to be sailing on SECA-compliant fuels (FSC < 0.13%). Besides the use of low-sulfur fuels, ships can opt for an EGCS to reach compliance with SECA limits. A total of 229 ships equipped with an EGCS were recorded, representing 29% of the observed vessels. When looking at the GT, EGCS-equipped ships accounted for 44% of the total GT of the observed ships. Among different ship types, container ships had the highest proportion of EGCS installations, with 43% of container ships fitted with an EGCS. This proportion was even higher when assessed by GT (57%). This distribution is in alignment with global trends. In 2024, approximately 40% of the global container fleet was equipped with an EGCS, compared to 36% in 2023 [80]. Variations in EGCS installation rates may be influenced by factors such as regional fleet composition, operational strategies within ECAs, and regulatory compliance preferences. Additionally, there are significant differences in EGCS installation across shipping companies. Some operators have notably higher proportions of their fleets fitted with EGCS, such as Evergreen (92%), HMM (86%), and MSC (58%), reflecting different environmental strategies and compliance approaches [80]. The sulfur non-compliance rate among the observed ships equipped with an EGCS was 7.8%, substantially higher than the non-compliance rate observed in ships without EGCS, which was 3.3%, in accordance with previous studies [50,51].

3.1.4. NOx Compliance and Ship Age

In addition to measurements of FSC, NOx emissions were also measured using the sniffer system, and NOx tier levels were assigned based on the SURV Ship Database. In terms of fleet composition, the majority of monitored ships were classified under Tier I (51%), followed by Tier II (37%). Tier 0 and Tier III vessels represented 8% and 4% of the fleet, respectively (Supplementary Figure S9). It is important to highlight that tier classification is based on the KLY, rather than the vessel’s actual year of construction [81]. This KLY-classification may create the impression of an underestimation of the presence of newer vessels in the sampled fleet. An analysis based on build year revealed an average vessel age of 13.3 years and a median of 14 years, with the oldest vessel being 46 years old. If the build year were used as the basis for classification, approximately 8% of the vessels would qualify under Tier III, illustrating a discrepancy between regulatory tier classification and the effective age profile of the fleet.
Among the observed fleet, approximately 6.8% of ships were found to be non-compliant with the applicable NOx regulations [61]. Notably, the non-compliance rate among Tier III vessels was drastically higher, reaching 65%, demonstrating a gap between regulatory requirements and the effective implementation of real-world emission reductions.

3.2. Analysis of BC EFs from Remote Measurements

3.2.1. Summary Statistics of Measured BC EFs and Climate Implications

Overall, the mean BC EF value of all measured ships with high-quality BC measurements was 0.46 g BC/kg fuel (Figure 1). The annual mean was slightly higher in the first two years due to the smaller number of measurements conducted and the influence of certain high-emitting ships. In contrast, the annual median BC EFs remained more stable over time and were, at 0.32 g BC/kg fuel, substantially lower than the mean value. When the climate impact of the BC emissions is expressed, based on a GWP20 of 1261 CO2-eq [9], the GWP20 of the average BC EF corresponds to approximately 18% of the ships’ CO2 emissions. This implies that BC accounts for 15% of the total climate impact of the measured ships.

3.2.2. Probability and Cumulative Distribution of BC EFs

The best-fitting probability distribution of the observed BC EFs was obtained with the following parameters:
y = 0.0012 + 0.12 · e 1 2 x 0.19 0.12 + 0.26 x 0.19 2 .
The probability distribution demonstrates that the highest number of observations were made within the 0.15–0.30 g BC/kg fuel category, accounting for 35% of the measurements. Nevertheless, the probability distribution also indicates a substantial number of measurements with high BC EFs (Figure 2a). At 1.25 g BC/kg fuel, the BC emissions account for 50% of the GWP20 of the ships’ CO2 emissions; the cumulative probability distribution indicates that 5% of the monitored ships had a BC EF that was above this value of 1.25 g BC/kg fuel (Figure 2b).

3.2.3. Geospatial Patterns of BC Emissions in the North Sea Region

Spatial analysis of the BC data revealed elevated concentrations particularly in the Westerscheldt and nearshore areas. These elevated BC levels can most likely be attributable to vessel operations under reduced engine loads, such as during maneuvering, berthing, and low-speed navigation. While operational patterns explain the observed emission levels, the proximity of these emissions to densely populated coastal and estuarine zones is concerning due to the associated public health risks. These findings highlight the need for dedicated mitigation strategies in port vicinities and nearshore shipping routes, such as the use of shore power, BC abatement systems and alternative fuels (Figure 3).

3.2.4. BC Measurement Uncertainty and Impact of Plume Concentration on Data Quality

The uncertainty of the BC measurements was assessed using repeated measurements and supplementary uncertainty factors. In total 90 ships were measured twice, providing a CVRW of 27.7% (Supplementary Figure S10). The usup,i comprises all additional known uncertainty factors (Supplementary Table S3). When combined, this gives a total uncertainty utot of 28.2%; this is in line with the uncertainty for airborne SO2 and NOx emission measurements conducted with the Belgian coastguard aircraft [61,62].
An important observation regarding these BC emission measurements is that the average BC EFs derived from these measurements may be an overestimation. This is because ships with extremely low BC emissions (BC < 0.05 g BC/kg fuel) are disproportionately more often excluded due to the poor quality of the BC measurements caused by a low signal-to-noise ratio (SNR). While low BC measurements were recorded, they were less frequently classified as high quality.
In general, lower BC EFs require sampling within a more concentrated plume with high overall emission concentrations. When a plume becomes more diluted, low BC emissions are more frequently rejected due to the low SNR. To assess this impact, BC EFs were evaluated based on their CO2 concentration levels as a proxy for plume concentration. From CO2 peaks of 60 ppm and above, no substantial difference in the mean and median BC EFs was observed (Supplementary Figure S11). A total of 264 ships were measured with CO2 peaks exceeding 60 ppm. When calculating the average BC EFs for this subset, the mean (0.29 g BC/kg fuel) and median (0.20 g BC/kg fuel) values were substantially lower.
However, restricting the analysis solely to these high-plume measurements would result in the exclusion of approximately 70% of the available data. Consequently, further trend analysis was conducted using the complete dataset of BC emission measurements. While this approach introduces a potential bias, the effect is considered minimal for trend assessment purposes, as the distribution of high plume concentrations is assumed to be uniform across the dataset. Furthermore, for the further load-based emission modeling, a comparative assessment was performed using the high-plume subset to evaluate the sensitivity of the model outputs to high plume concentration, therefore excluding this bias.
For further research, implementing BC sensors with higher accuracy or enhancing the SNR through advanced signal processing techniques could improve measurement precision and accuracy, particularly for extremely low BC levels.

3.3. Trend Analysis to Identify Drivers of Variability in BC EFs

3.3.1. Engine Load as a Key Determinant of BC Emission Intensity

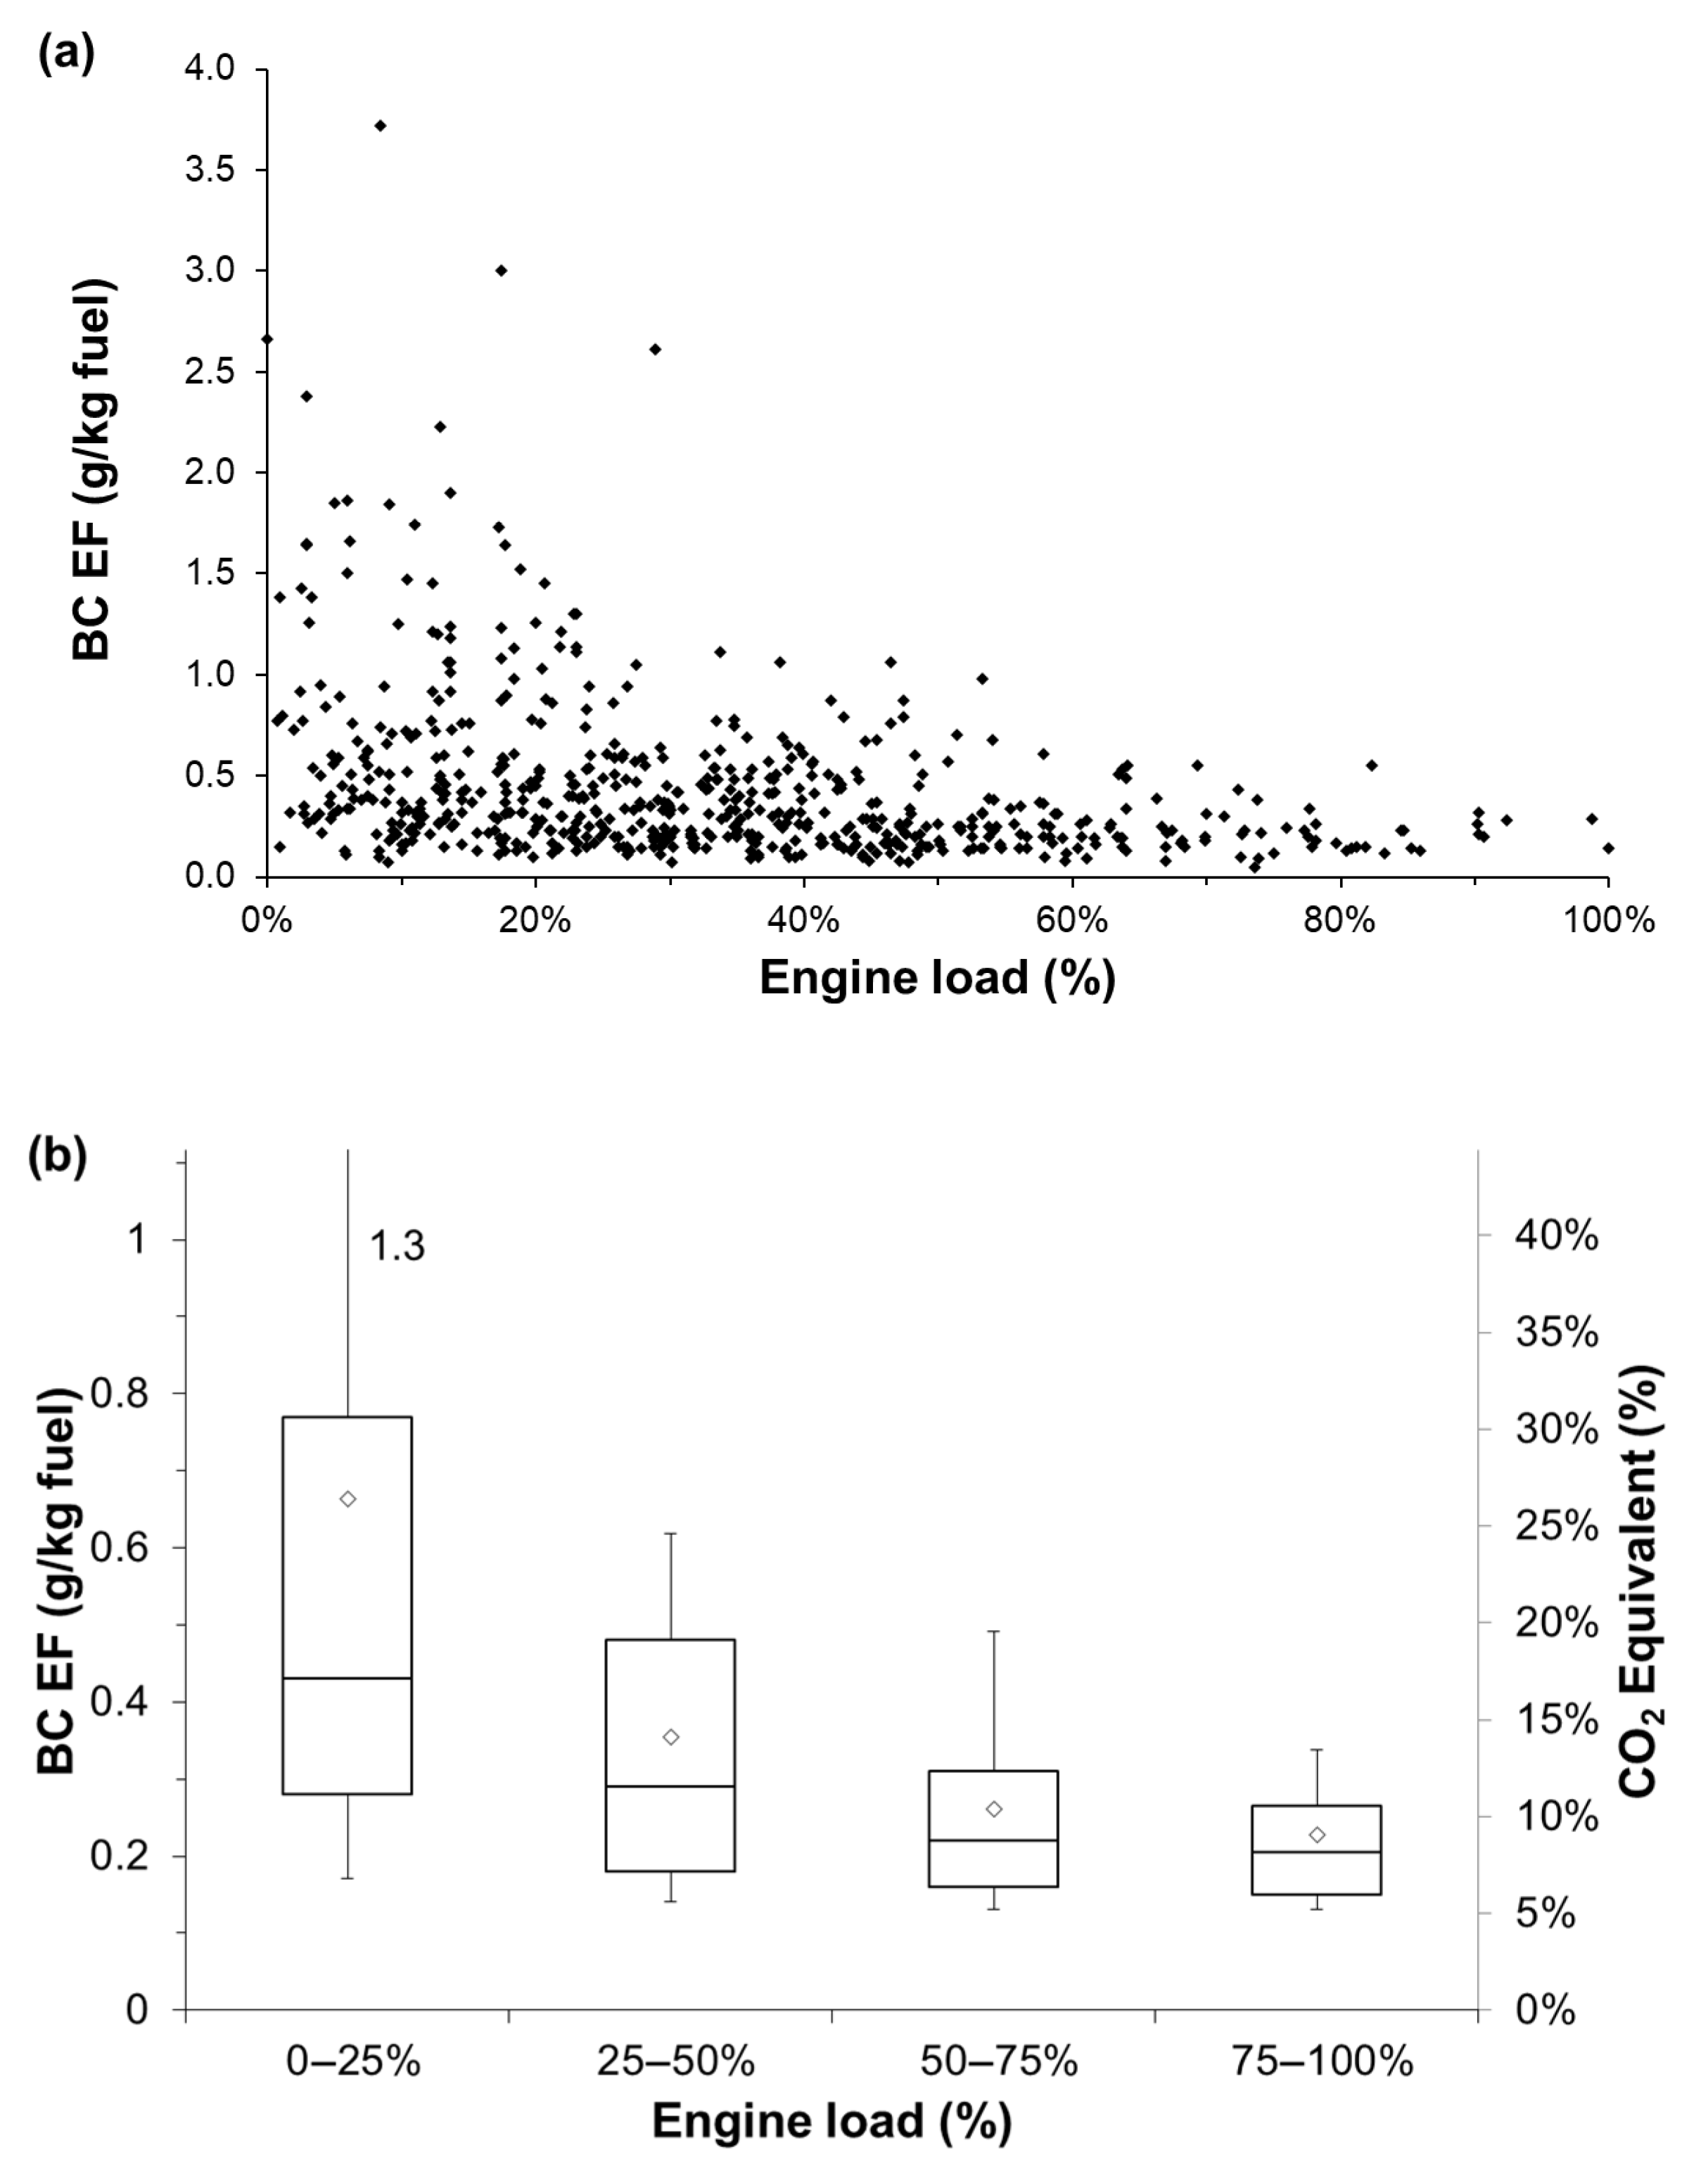
The analysis of the full dataset revealed clearly the impact of the ships’ engine load on the observed BC EFs (Figure 4a). Substantially higher BC EFs were observed for lower engine load points (Figure 4b). Within the engine load of 0–25%, which is the most used engine load category in the North Sea, an average BC EF of 0.65 g/kg fuel was observed, which is 42% higher than the overall average BC EF. The difference in BC EFs was found to be statistically significant between the 0–25% and the 25–50% engine load categories (p = 0.0000) and between the 25–50% and 50–75% engine load categories (p = 0.0009), whereas the difference between the 50–75% and 75–100% categories was not found to be significant (p = 0.43) (Supplementary Table S4).
The difference in BC EFs between low-load and high-load conditions is 0.43 g BC/kg fuel. This variance indicates that the overall climate impact of ships operating under low-load conditions is on average 15% higher compared to ships operating on high loads, under the assumption that fuel efficiency is not impacted. Typically, fuel efficiency decreases at lower load conditions, which could potentially further increase the climate impact of low-load operations. Optimal fuel efficiency is generally observed at engine loads between 50 and 75% [82], where BC EFs are only marginally (0.03 g/kg fuel) higher than at high-load conditions; the BC climate impact from this load is therefore only ca. 1% higher compared to the 75–100% load point. This load range can thus be considered the optimal balance between fuel consumption and BC emissions, offering a compromise between energy efficiency and emission reduction.

3.3.2. Effect of Fuel Type, EGCS Status, and Ship Type on BC EFs

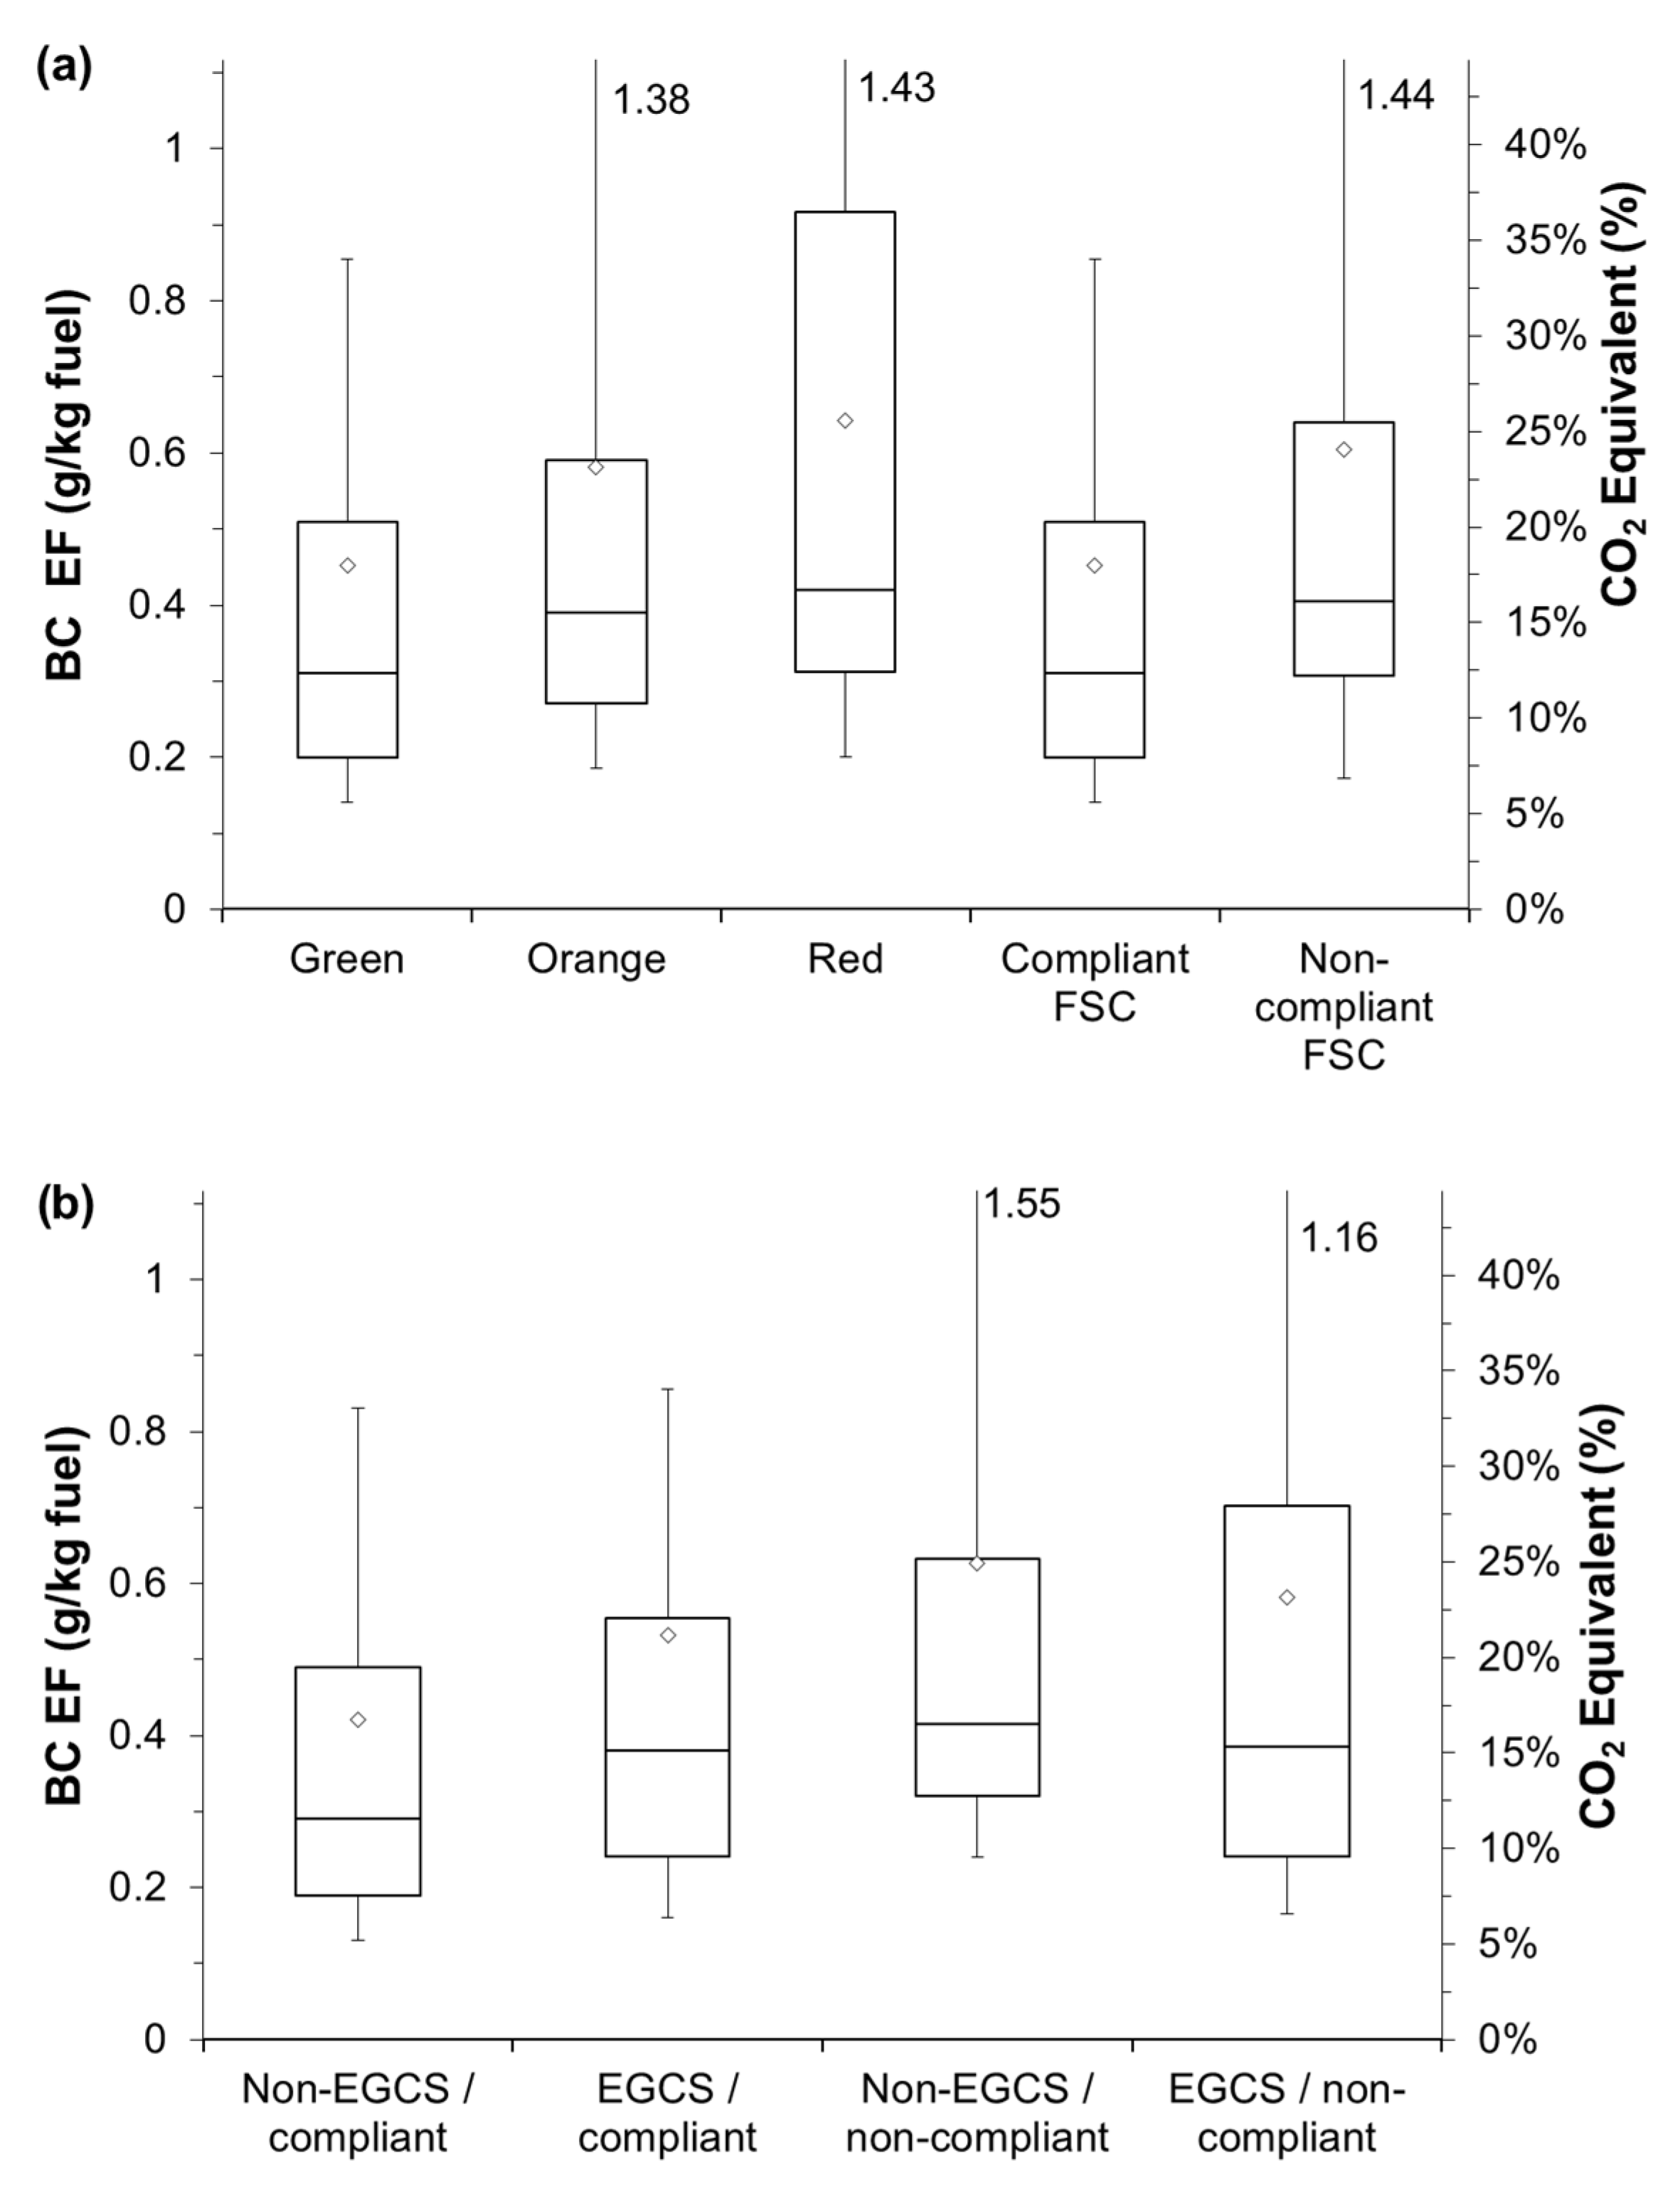
For the evaluation of the impact of the fuel type on BC EFs, a comparison was made between ships operating on SECA-compliant fuel and those with SECA-non-compliant fuel. The results demonstrated the impact of SECA-non-compliant fuels on BC emissions. On average, BC EFs for non-compliant fuels were 35% higher than those for compliant fuels; this difference was found to be significant (p = 0.0003) (Supplementary Table S5). Moreover, the effect was found to be quantifiable—ships flagged for higher levels of non-compliance (“red flags”) had proportionally higher BC EFs (Figure 5a).
Compliance with sulfur emission regulations can be achieved either by using low-sulfur fuels or by employing an EGCS. To assess the impact of EGCS, BC EFs were compared between ships equipped with an EGCS and those without an EGCS. The results indicated that ships with an EGCS exhibited substantially higher BC EFs. On average, EGCS-equipped ships emitted 26% more BC than their non-EGCS counterparts. The difference was found to be statistically significant (p = 0.00008) (Supplementary Table S5). This disparity became even more pronounced when EGCS compliance status was factored into the analysis (Figure 4b). Compliant non-EGCS ships exhibited the lowest BC EFs, with this difference being statistically significant across all categories. Likewise, compliant EGCS ships had lower BC EFs than non-compliant EGCS ships; however, this difference was not found to be significant (p = 0.053). Also, no significant difference was observed between non-compliant EGCS ships and non-compliant non-EGCS ships (p = 0.38).
The higher non-compliance rate observed in EGCS-equipped ships is likely due to their continued use of HFO, which typically generates higher BC emissions compared to ULSFO. Although EGCSs are effective in reducing SOx emissions and can remove some BC, their ability to control BC emissions is likely less effective than using SECA fuels. As a result, EGCS-equipped vessels tend to exhibit higher overall BC emissions than non-EGCS ships that operate on SECA fuels. This conclusion is supported by the observation that non-compliant EGCS and non-compliant non-EGCS vessels display comparable emission levels.
As an insufficient number of collected fuel samples were available to distinguish between distillate fuels (MGO) and fuel oils (VLSFO, ULSFO or HFO), no detailed assessment could be conducted to compare their respective impacts on real-world BC emissions. A more comprehensive set of fuel samples would be necessary to enable such analysis; this could be addressed in future studies.
BC EFs were also analyzed across different ship types (Supplementary Figure S12). However, no statistically significant differences between ship types were observed (p = 0.44) (Supplementary Table S6). This outcome is not surprising, as various engine models and types are commonly used across different ship categories. Moreover, any minor variations in BC emissions are likely attributable to differences in operational modes (i.e., engine load), the fuel used and the presence of an EGCS rather than the specific type of ship. Notably, no ship type demonstrated significantly lower BC emissions, including LNG tankers. Although this type of gas tanker can significantly reduce its BC emissions when operating in boil-off gas mode, it often still relies on conventional fuel oils while sailing in SECAs.

3.3.3. BC EFs in Relation to NOx Compliance, Ship Age and Engine Type

When analyzing the impact of non-compliance to NOx emission regulations on BC emissions, no significant effect was observed (p = 0.32) (Supplementary Figure S13a). When considering the NOx tier levels, Tier II vessels generally exhibited lower BC EFs than Tier I and pre-tier (Tier 0) ships (Supplementary Figure S13b), though the differences between tier levels were not statistically significant (p = 0.43) (Supplementary Table S7). Interestingly, Tier III vessels did not seem to follow this trend; the results indicated that Tier III ships have higher BC EFs than Tier II vessels, although this difference was not found to be significant (p = 0.48).
These findings demonstrate that the more recent NOx Tier II and Tier III standards do not have a significant impact on BC EFs. Tier III ships are subject to stringent NOx emission limits in NECAs, requiring the use of NOx abatement technologies such as SCR. The combination of SCR with a DPF is a well-established strategy for simultaneously reducing NOx and BC emissions in other sectors. However, in the absence of regulations on BC, it is not being widely adopted in the maritime sector. Since the use of DPF is not regulated on an international level, ship registries do not provide information on DPF installations. Therefore, it was not possible to determine the effectivity of DPF within this study.
Notably, previous studies have reported high NOx non-compliance rates (40–50%) with respect to Tier III limits, suggesting that the abatement technology is often either malfunctioning or deliberately deactivated or that the ship is operating outside working limits of the SCR (marine SCRs typically require exhaust gasses with a temperature of min. 250 °C depending on the FSC) [51,83]. To evaluate the impact of a well-functioning SCR on BC emissions, the BC emissions were compared between compliant Tier III ships and non-compliant Tier III ships. This showed no significant difference (p = 0.85), although the small sample size of compliant Tier III vessels (n = 11) limits the strength of this observation. Further research with a larger sample size is necessary to validate these findings and improve our understanding of the influence of NOx abatement systems and DPF on real-world BC emissions.
Previous studies have emphasized that the engine type is a key factor influencing BC EFs, with four-stroke engines producing substantially higher BC emissions [30,38,47,48]. In this study, engine type was assessed based on engine rated speed (ERS). While slightly higher BC EFs were observed in the category with an ERS above 2000 RPM, no statistically significant differences were found between the different ERS categories (p = 0.62) (Supplementary Figure S14). This is not surprising, as the study focused on larger merchant vessels (>100 m), which are predominantly equipped with four-stroke engines. These findings suggest that while ERS may serve as an indicator in combination with other factors, on its own it does not play a significant role in determining BC EFs for larger ships operating in the ECA.
It is important to note that four-stroke engines are often used as auxiliary engines on large vessels, where they typically operate as power generators at higher loads. While auxiliary engines generally account for 10–15% of a ship’s total emissions [84,85], their elevated BC EFs could possibly, although partially, explain the higher BC levels observed in this study.

3.4. Load-Based BC Emission Models

3.4.1. Evaluation of Power and Exponential Decay Models Based on the Full Dataset

The relationship between engine load and BC EFs was initially modeled using a power function, aligning with the approach from previous studies (Figure 6a) [30,38,47,48]. This method effectively captures the nonlinear dependency of BC emissions on engine load, demonstrating how emissions increase disproportionately at lower loads due to inefficient fuel combustion. However, this power model did not yield the best fit for the observed BC EFs (R2 = 0.88). At very low engine loads (under 5%), the power function tends to overestimate the BC EFs, which is followed by a sharp decrease, underestimating the BC EFs between 5 and 50% engine load. The exponential decay function provided a considerably better fit (R2 = 0.94), depicting a more gradual decline in BC EFs as engine load increases.
Another important conclusion drawn from these fitted curves is the large variation in BC EFs and the potential for extremely high emission levels. The 75th percentile of the fitted data shows overall BC EFs that are 50% higher as the median curve is expressed over the full engine load, while the 90th percentile is more than twice as high. This discrepancy is particularly pronounced at lower engine loads. These findings highlight the substantial variability in BC EFs across different ships and operational conditions, emphasizing the need for more accurate emission models that account for these variations, especially at low engine loads.

3.4.2. Comparison of Refined Models Using High-Plume Concentration Subset with IMO Models

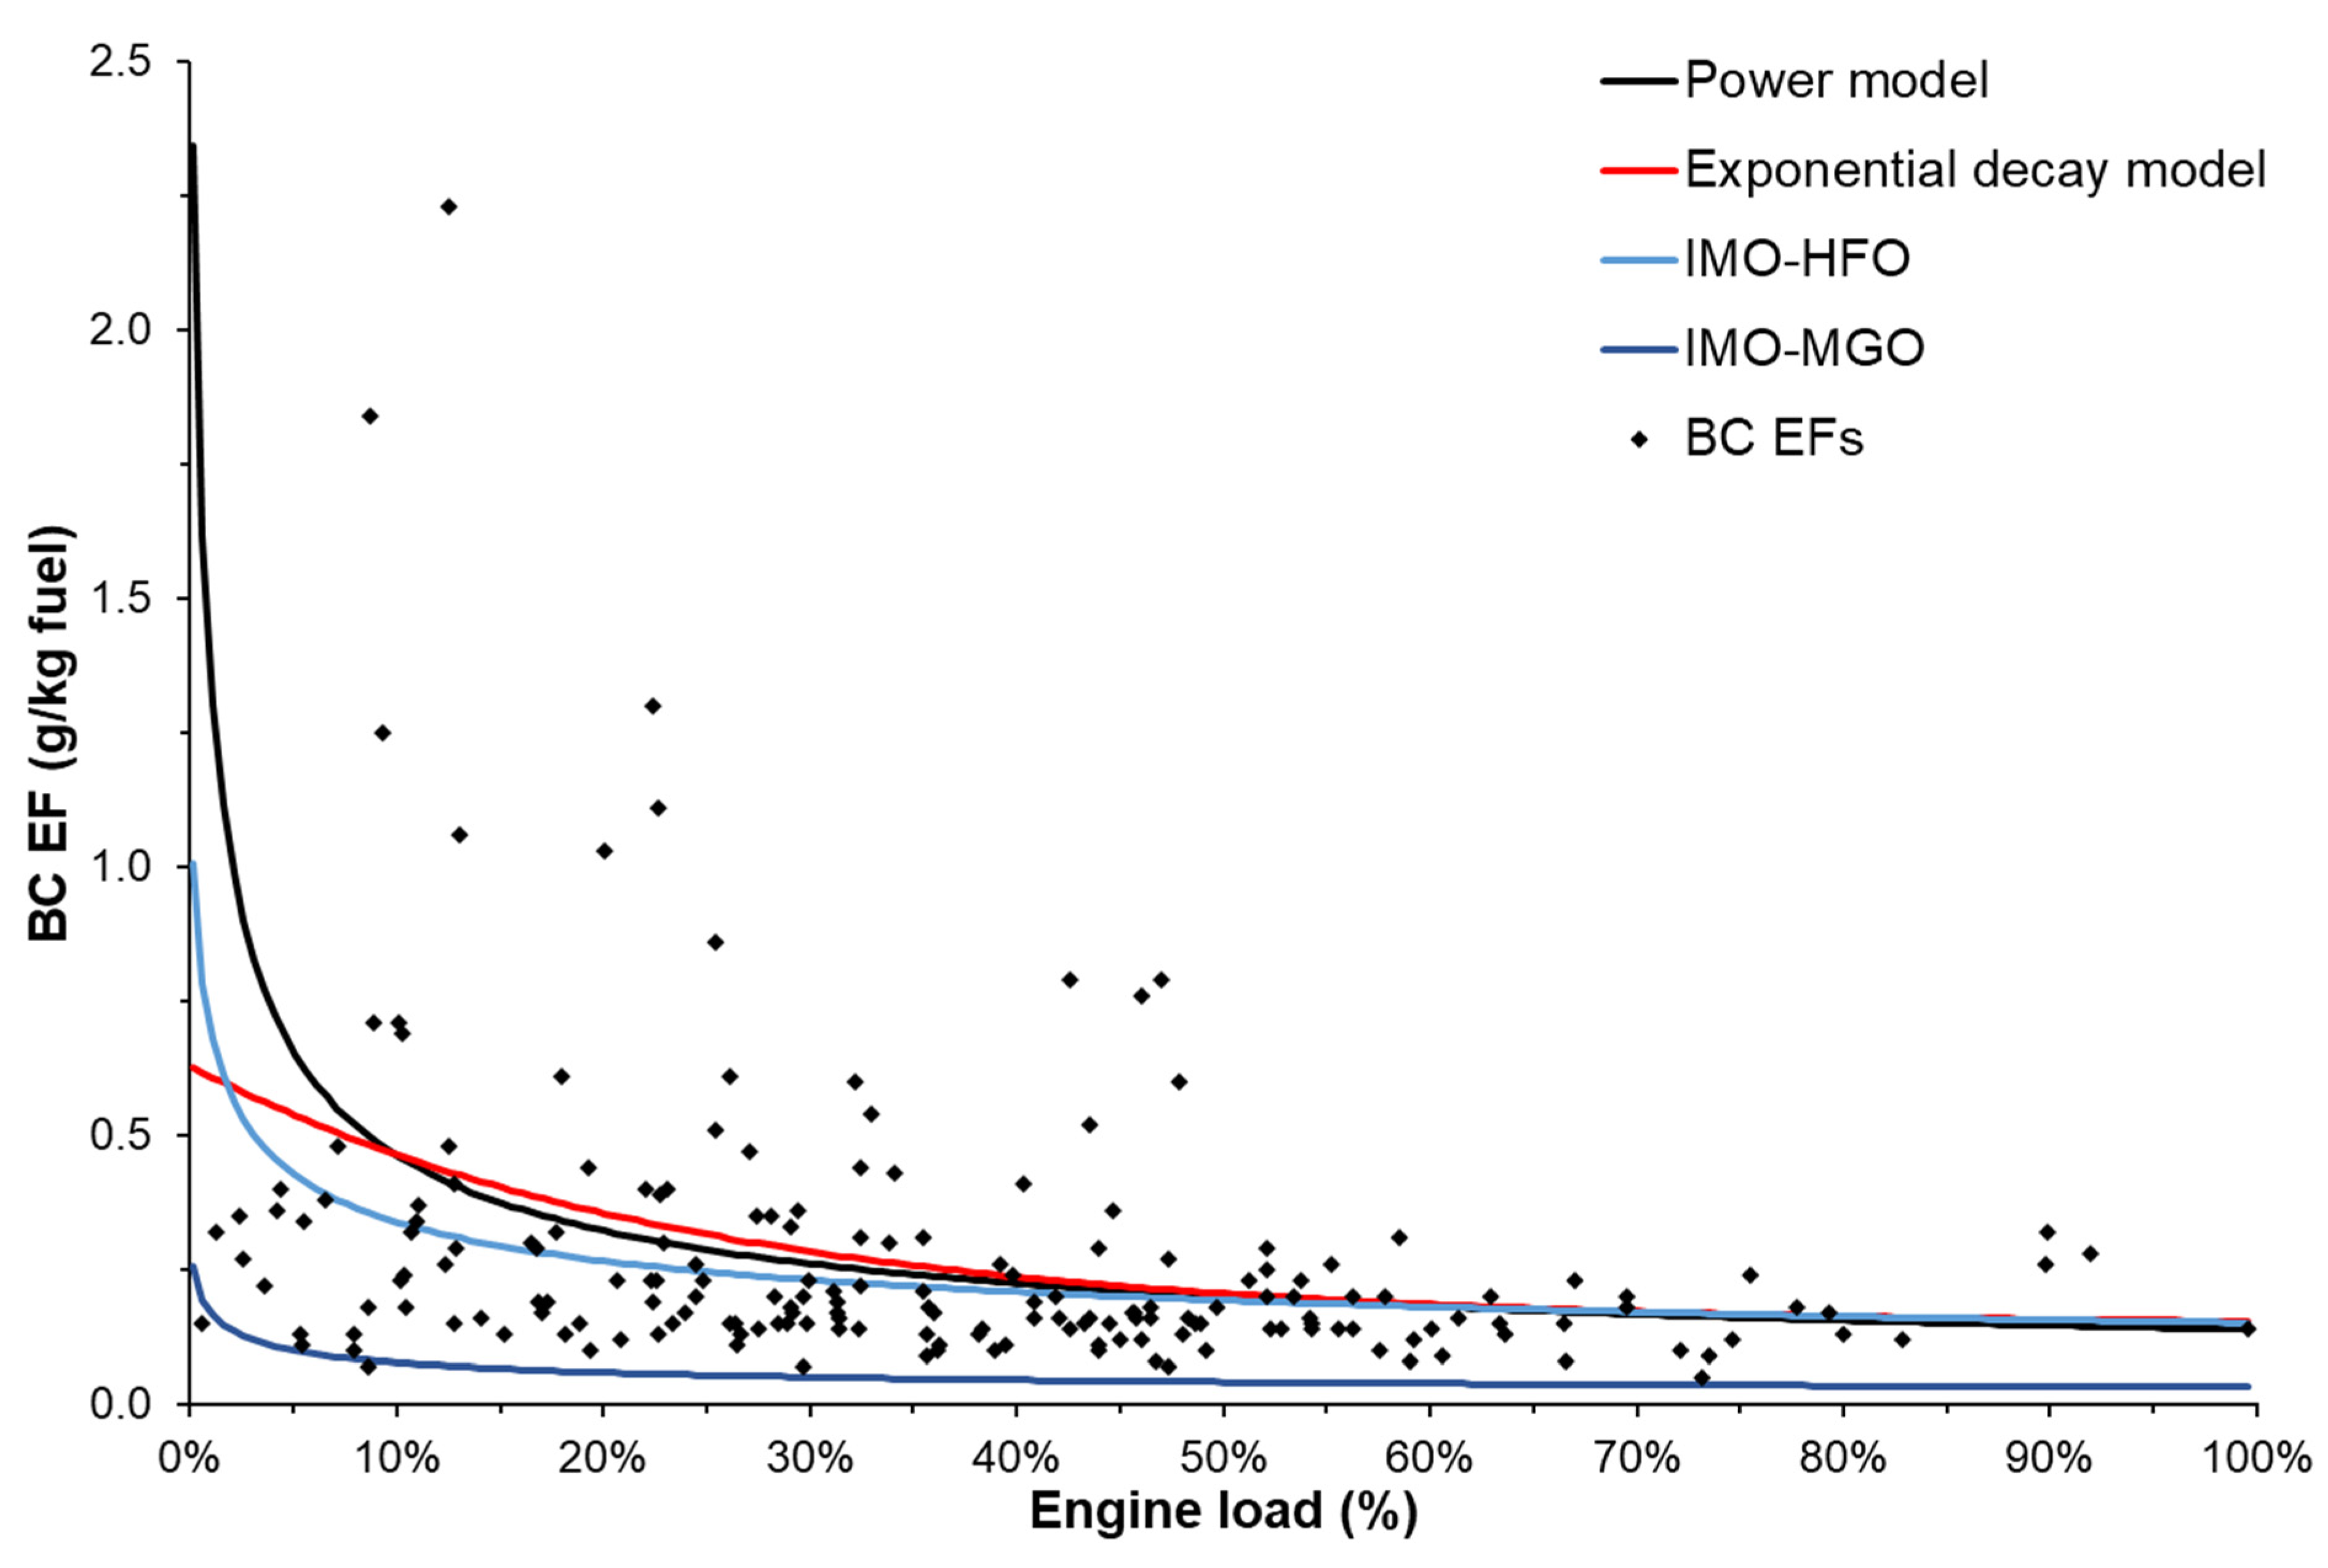
Because the BC EF model based on all measurements does not account for plume concentration, leading to a disproportionate rejection of very low BC emissions due to the lower SNR, it tends to overestimate real-world BC EFs. To facilitate a comparison between real-world BC EFs and the emission models from previous studies, additional emission models were developed using only measurements with very high CO2 peak concentrations (>60 ppm). Therefore, the subset of high-plume concentration BC EFs were fitted using both an exponential decay function and a power function. However, due to the limited number of measurements, this model is less robust than the emission model based on all BC EF measurements. Nevertheless, even in this case the exponential decay function (R2 = 0.70) provided a better fit to the observed BC EFs compared to the power function (R2 = 0.65) (Figure 7).
The resulting engine load-based BC emission models were compared with the models for HFO and MGO that are presented in the IMO Fourth GHG study of 2020, which are based on studies from the ICCT [30,38,47,48]; for simplicity, these models are further referred to as the IMO–HFO and IMO–MGO curves.
The IMO–HFO curve showed a much stronger alignment with the fitted curves than the IMO–MGO curve. At higher engine loads (>50%), both fitted curves closely followed the IMO–HFO curve. As expected, the fitted power curve aligned more closely with the IMO–HFO curve, as they are both based on a power function. The primary discrepancies between the fitted curves and the IMO–HFO curve were observed at lower engine loads. The fitted power function substantially exceeds the IMO–HFO curve between 0 and 50% engine load. While for the exponential decay function, for engine loads between 0 and 2%, the IMO–HFO curve has higher values; however, between 3% and 60% engine load, the exponential decay function exceeds the IMO–HFO curve by up to 38% at 15% engine load (Supplementary Figure S15). The comparison over the full engine load revealed that the IMO–HFO curve underestimates real–world emissions by 13% based on the exponential decay function and by 21% based on the power function.
Since the use of HFO is technically prohibited in ECAs, except for EGCS ships, it was considered whether the IMO–MGO function could serve as a proxy for BC emissions in ECAs. However, the differences between the fitted curves and the IMO–MGO curve were striking, with overall deviations of 417% for the exponential decay function and 452% for the power function. These discrepancies indicate that the IMO–MGO curve is not suitable to accurately represent actual ship emissions in ECA regions. While fuel type data was unavailable at the time of measurement, the results strongly suggest that the widespread adoption of ULSFO, rather than MGO, is responsible for this discrepancy.
The authors of the models cited in the IMO Fourth GHG Study report that BC EFs for ULSFO are estimated to be 25% lower than those used in the IMO–HFO models [38]. Consequently, a modified IMO–ULSFO model would, on average, give BC EFs that are 51–61% lower than the real-world values observed in this study.
These findings highlight a key limitation of the current load-based models: they are derived from a small number of controlled test bench measurements and may not capture the full variability of real-world ship operations. In contrast, the models developed in this study are based on a much larger dataset of real-world emissions, reflecting a broader range of engine types and ages, operating conditions and vessel types. This larger empirical basis allowed not only for refinement of the current power function as referred to by the IMO Fourth GHG Study but also for the exploration of alternative models, such as the exponential decay function, which demonstrated a better overall fit. The discrepancies observed—particularly at lower engine loads—suggest that real-world emissions are systematically underestimated by the IMO quoted models, emphasizing the need for updated modeling approaches that better reflect actual operational behavior.

3.4.3. Model Validation by Comparing Observed vs. Modeled BC EFs

To assess the effectiveness of the developed load-based BC emission models, the complete dataset of observed BC EFs was compared with their modeled BC EFs based on the engine load (Supplementary Figure S16). The objective was to determine whether the developed models would improve the estimation of real-world BC emissions compared to the load-based models from previous studies. Analysis of the mean BC EF indicates that the power model provided the best fit to the observed BC EFs (−27%), followed by the exponential decay model (−32%), while the IMO–HFO model underestimated emissions more substantially (−44%), and the IMO–MGO model showed the poorest performance (−88%) (Figure 8). When considering median modeled values, the exponential decay model performed best (−10%), followed by the power function (−18%), with the IMO–HFO (−28%) and IMO–MGO (−84%) models exhibiting lower accuracy.

4. Conclusions

While previous studies on BC emissions from ships primarily relied on on-board measurements conducted in controlled test environments, data on real-world emissions, particularly in ECAs such as the North Sea, was lacking. In particular, the impact of the strengthened ship emission regulations on NOx and SOx in reducing real-world BC emissions remained insufficiently explored. This study addresses these gaps based on an analysis of large-scale airborne measurements, comprising BC emissions from 886 ships conducted over four years.
While airborne measurements for ship emissions for other pollutants have been applied for several years [51,60,61,62], limited experiences were available for BC. This study demonstrates the effectiveness of airborne measurements in providing insights into real-world BC emissions. However, the findings also highlight areas for improvement; both the technology and the applied algorithms could be further optimized to enhance measurement quality and reduce the rate of rejected data.
Previous studies have commonly reported BC EFs values in the order of 0.3 g BC/kg fuel [45,46,86]. However, the results of this study show that the use of standard BC EFs is of limited use for assessing BC emissions from ships. Although, with an average of 0.29–0.46 g/kWh, the results of this study are in line with these average values, this approach fails to account for the substantial variability in BC emissions driven by engine operating conditions. This study therefore supports the findings from previous studies, confirming that engine load is a key factor influencing BC emissions [37,38,47,48]. Notably, it was found that ships operating at low engine loads (0–25%) emit 43% more BC than the overall average.
Given that 42% of vessels in the North Sea ECA operate under low load conditions, emission models that are not load-based tend to risk underestimating the true environmental and health impact of shipping in the ECA. This load dependency also emphasizes the need to incorporate operational factors into BC emission control strategies and suggests that engine load should be a key consideration in the development of future IMO BC emission regulations.
The findings of this study furthermore indicate that emission models should not rely solely on engine load. The FSC of the used fuel also significantly influences BC emissions, supporting previous studies that indicate that ULSFO and VLSFO have lower BC EFs compared to HFO [38]. The study finds that non-compliant fuels (>0.1% FSC) were associated with on average 49% higher BC EFs. This underscores the role of sulfur regulation enforcement in reducing BC output. This having been said, it must be mentioned that the anticipated benefits of the SECA implementation on particle emissions were not fully realized. Instead of mainly transitioning to low-sulfur distillate fuels such as MGO, the shipping industry predominantly adopted ULSFOs, which have a high aromatic content and are associated with high BC emissions.
Further in relation to the sulfur regulations, the study found that ships equipped with EGCS emitted on average 25% more BC than non-EGCS vessels, with non-compliant EGCS ships emitting 38% more than ships using ECA-compliant fuels. This challenges the perception of EGCS as a sustainable compliance solution, not only in environmentally sensitive regions such as the Arctic but also in the North Sea ECA. Given that approximately 40% of the global merchant fleet is equipped with EGCS, the contribution of these systems to global BC emissions is considerable [62].
Furthermore, neither ship type nor NOx compliance (including tier classification) was found to significantly impact BC emissions. Notably, selective catalytic reduction (SCR) systems had no discernible impact on BC emissions. In addition, contrary to previous studies, which suggest that four-stroke engines have higher BC EFs [38,47,48], no significant impact was found when looking at the ERS, where high ERS was used as a proxy for four stroke engines. However, further data collection is needed before drawing definitive conclusions.
The modeling of observed BC EFs with load-based emission models reveals that the load-based emission models as referred to in the IMO Fourth GHG Study (2020) for HFO tend to underestimate real-world emissions in the ECA by 13–21%. It must be emphasized that based on the assessment of the developed models, albeit an improvement, the results demonstrate that they may still not fully capture the variability in BC emissions, particularly at extreme levels (>1 g/kg fuel).
The results of this study show that BC emissions from ships make a substantial contribution to their overall climate impact. For the observed ships, BC accounted for approximately 15% of the ships’ total climate impact. It is important to emphasize that the assessment of the climate impact of shipborne BC in this study was based on the most recent GWP20 values. However, other studies have proposed significantly higher GWP20 values for BC. By applying the more conservative estimates, this study may still underestimate the true climate impact of BC emissions from ships.
In light of the findings of this study, there is a clear opportunity to enhance current regulatory approaches to better align with real-world BC emissions from marine shipping. It is recommended that the IMO consider the development of BC emission models that reflect real-world emissions, for example, by incorporating exponential decay models, as they are better suited to capture the load dependency of real-world BC emissions. Furthermore, given the elevated BC EFs observed from EGCS ships, a reassessment of regulatory measures for these ships may be warranted. In particular, the introduction of mandatory WESP systems for EGCS ships is recommended. Also, the introduction of other advanced abatement technologies, such as DPFs, could support more effective BC emission reductions. In addition, taking into account the high frequency of low engine load operations within ECAs, the development of load-based BC emission limits could serve as an incentive for optimizing engine performance and promoting the uptake of BC abatement technologies. Moreover, addressing BC emissions as part of the broader climate and air quality impacts of fossil fuel use underscores the potential role of cleaner alternative fuels, such as ammonia, green methanol or hydrogen, in reducing both CO2 and BC emissions from the maritime sector.

Supplementary Materials

The following supporting information can be downloaded at https://www.mdpi.com/article/10.3390/atmos16070840/s1. Supplementary Figure S1. BC EFs in function of engine load based on a power function as mentioned in the IMO Fourth GHG Study. Supplementary Figure S2. Map of the Belgian part of the North Sea with the indication of the shipping lanes and dedicated spatial areas (a) and map of the North Sea with the shipping density based on AIS traffic with delimitation of the Belgian part of the North Sea (magenta) (b). Supplementary Figure S3. North Sea and Baltic Sea ECAs for both NOx (NECA) and SOx (SECA). Supplementary Figure S4. Print screen of the sniffer software demonstrating the increase in BC (blue line), CO2 (magenta line), SO2 (green line) and NOx (red line) when crossing a ship exhaust plume. The red arched area represents the peak areas, and the black arched area represents the background. Supplementary Figure S5. Distribution of the observed ships per year. Supplementary Figure S6. Correlation between the modeled engine load and the reference engine load. For the modeled engine load, the propeller law was used; for the reference engine loads, radio communication with the ship was established to obtain the present power use of the main engine. Supplementary Figure S7. Distribution of the engine loads used by the observed ships. Supplementary Figure S8. Distribution of the observed ship types and the proportion equipped with an EGCS. Supplementary Figure S9. Distribution of the observed ships according to their tier level. Supplementary Figure S10. Regression between repeated measurements showing a good correlation (R2 = 0.93), with the red line y = x as reference. Supplementary Figure S11. Impact of the peak height of CO2 on the observed mean and median BC EFs. Supplementary Figure S12. Box plot of median, 10, 25, 75 and 90% percentiles, and mean (♢) BC EFs according to ship type. Supplementary Figure S13. Box plot of median, 10, 25, 75 and 90% percentiles, and mean (♢) BC EFs according to the NOx compliance level (a) and the NOx tier level (b). Supplementary Figure S14. Box plot of median, 10, 25, 75 and 90% percentiles, and mean (♢) BC EFs according to the engine rated speed (RPM). Supplementary Figure S15. Difference between IMO power function and the modeled BC EFs based on an exponential decay distribution. Supplementary Figure S16. Comparison of observed BC EFs versus modeled BC EFs based on the engine load for exponential decay function (a), modified power function (b), IMO–HFO function (c) and IMO–MGO function (d). Supplementary Table S1. BC EFs from literature. Supplementary Table S2. Correction factors used to model engine load with the propeller law. Supplementary Table S3. Supplementary uncertainty factors and the combined supplementary standard uncertainty. Supplementary Table S4. Statistical tests comparing BC EFs between groups of engine loads. Supplementary Table S5. Statistical tests comparing BC EFs between compliance and EGCS. Supplementary Table S6. Statistical tests comparing BC EFs between ship types. Supplementary Table S7. Statistical tests comparing BC EFs between NOx tiers and NOx compliance. Supplementary Table S8. Statistical tests comparing BC EFs between engine types based on engine rated speed. Supplementary Table S9. Factors for power and exponential decay function of the real-world BC EFs of all observed ships. Supplementary Table S10. Factors for power and exponential decay function BC EFS of high concentration plumes. References [87,88,89,90,91,92] are cited in Supplementary Materials.

Author Contributions

W.V.R. designed the research and wrote the paper; W.V.R., J.-B.M., K.S. and A.V.N. acquired the remote measurements; W.V.R. performed the numerical analysis; K.S. performed the geospatial analysis; J.-B.M. ensured that the international maritime legal references were correct; J.-B.M., K.S., A.V.N. and R.S. read and commented on the paper. All authors have read and agreed to the published version of the manuscript.

Funding

The BC sensor was funded by the Environmental Compensation Funding program of the Belgian Federal Public Service Environment.

Institutional Review Board Statement

Not applicable.

Informed Consent Statement

Not applicable.

Data Availability Statement

The anonymized airborne BC monitoring dataset is publicly available at https://surv.naturalsciences.be/f/72f70c81c2aa47b981d9/ (DOI under construction) A non-public dataset containing ship identification information can be requested for research purposes from the corresponding author.

Acknowledgments

The European Maritime Safety Agency (EMSA) is gratefully acknowledged for providing the ship and engine data. The authors wish to thank the Federal Public Service for Mobility and Transport for their overall support of the study objective to collect BC emission field data from shipping; in particular, Christophe Swolfs and Bart Colaers are acknowledged for their help in obtaining the Thetis-EU data. Johan Mellqvist and Vladimir Conde of Chalmers University are acknowledged for their help in setting up the BC measurements with the Coastguard aircraft. Finally, the authors would like to express their greatest gratitude to the pilots, Alexander Vermeire, Geert Present, Pieter Janssens, and Dries Noppe from the Belgian Defense, for their skillful and safe piloting of the Coastguard Aircraft.

Conflicts of Interest

The authors declare that they have no known competing financial interests or personal relationships that could have appeared to influence the work reported in this paper.

References

  1. Bond, T.C.; Sun, H. Can Reducing Black Carbon Emissions Counteract Global Warming? Environ. Sci. Technol. 2005, 39, 5921–5926. [Google Scholar] [CrossRef] [PubMed]
  2. Hansen, J.; Sato, M.; Kharecha, P.; Russell, G.; Lea, D.W.; Siddall, M. Climate Change and Trace Gases. Philos. Trans. R. Soc. A Math. Phys. Eng. Sci. 2007, 365, 1925–1954. [Google Scholar] [CrossRef] [PubMed]
  3. Ramanathan, V.; Carmichael, G. Global and Regional Climate Changes Due to Black Carbon. Nat. Geosci. 2008, 1, 221–227. [Google Scholar] [CrossRef]
  4. Eyring, V.; Isaksen, I.S.A.; Berntsen, T.; Collins, W.J.; Corbett, J.J.; Endresen, O.; Grainger, R.G.; Moldanova, J.; Schlager, H.; Stevenson, D.S. Transport Impacts on Atmosphere and Climate: Shipping. Atmos. Environ. 2010, 44, 4735–4771. [Google Scholar] [CrossRef]
  5. Shindell, D.; Faluvegi, G. Climate Response to Regional Radiative Forcing during the Twentieth Century. Nat. Geosci. 2009, 2, 294–300. [Google Scholar] [CrossRef]
  6. Bond, T.C.; Doherty, S.J.; Fahey, D.W.; Forster, P.M.; Berntsen, T.; DeAngelo, B.J.; Flanner, M.G.; Ghan, S.; Kärcher, B.; Koch, D.; et al. Bounding the Role of Black Carbon in the Climate System: A Scientific Assessment. J. Geophys. Res. Atmos. 2013, 118, 5380–5552. [Google Scholar] [CrossRef]
  7. Hansen, J.; Sato, M.; Ruedy, R.; Nazarenko, L.; Lacis, A.; Schmidt, G.A.; Russell, G.; Aleinov, I.; Bauer, M.; Bauer, S.; et al. Efficacy of Climate Forcings. J. Geophys. Res. Atmos. 2005, 110, D18104. [Google Scholar] [CrossRef]
  8. Jacobson, M.Z. Correction to “Control of Fossil-Fuel Particulate Black Carbon and Organic Matter, Possibly the Most Effective Method of Slowing Global Warming”. J. Geophys. Res. Atmos. 2005, 110, D14105. [Google Scholar] [CrossRef]
  9. Samset, B.H.; Lund, M.T.; Aamaas, B. Climate Effects of Black Carbon Emissions: Updated GWP and GTP Values After the IPCC AR6; CICERO: Oslo, Norway, 2023. [Google Scholar]
  10. Hansen, J.; Nazarenko, L. Soot Climate Forcing via Snow and Ice Albedos. Proc. Natl. Acad. Sci. USA 2004, 101, 423–428. [Google Scholar] [CrossRef]
  11. Intergovernmental Panel on Climate Change (IPCC). Climate Change 2021—The Physical Science Basis; Cambridge University Press: Cambridge, UK, 2023; ISBN 9781009157896. [Google Scholar]
  12. Jacobson, M.Z. Control of Fossil-fuel Particulate Black Carbon and Organic Matter, Possibly the Most Effective Method of Slowing Global Warming. J. Geophys. Res. Atmos. 2002, 107, ACH 16-1–ACH 16-22. [Google Scholar] [CrossRef]
  13. Janssen, N.A.; Gerlofs-Nijland, M.E.; Lanki, T.; Salonen, R.O.; Cassee, F.; Hoek, G.; Fischer, P.; Brunekreef, B.; Krzyzanowski, M. Health Effects of Black Carbon; WHO: Copenhagen, Denmark, 2012. [Google Scholar]
  14. Song, X.; Hu, Y.; Ma, Y.; Jiang, L.; Wang, X.; Shi, A.; Zhao, J.; Liu, Y.; Liu, Y.; Tang, J.; et al. Is Short-Term and Long-Term Exposure to Black Carbon Associated with Cardiovascular and Respiratory Diseases? A Systematic Review and Meta-Analysis Based on Evidence Reliability. BMJ Open 2022, 12, e049516. [Google Scholar] [CrossRef] [PubMed]
  15. Niranjan, R.; Thakur, A.K. The Toxicological Mechanisms of Environmental Soot (Black Carbon) and Carbon Black: Focus on Oxidative Stress and Inflammatory Pathways. Front. Immunol. 2017, 8, 763. [Google Scholar] [CrossRef] [PubMed]
  16. Goriainova, V.; Awada, C.; Opoku, F.; Zelikoff, J.T. Adverse Effects of Black Carbon (BC) Exposure during Pregnancy on Maternal and Fetal Health: A Contemporary Review. Toxics 2022, 10, 779. [Google Scholar] [CrossRef] [PubMed]
  17. MEPC. Amendments to the Annex of the Protocol of 1997 to Amend the International Convention for the Prevention of Pollution from Ships, 1973, as Modified by the Protocol of 1978 Relating Thereto (2021 Revised MARPOL Annex VI), Resolution MEPC.328(76), Entered into Force on 1 November 2022; IMO: London, UK, 2022. [Google Scholar]
  18. MEPC. List of Special Areas, Emission Control Areas and Particularly Sensitive Sea Areas, Circular MEPC.1/Circ.778/Rev.3 of 2 July 2008; Marine Environmental Protection Committee, International Maritime Organization: London, UK, 2008; pp. 1–5. [Google Scholar]
  19. MEPC. Amendments to the Annex of the Protocol of 1997 to Amend the International Convention for the Prevention of Pollution from Ships, 1973, as Modified by the Protocol of 1978 Relating Thereto (Prohibition on the Carriage of Non-Compliant Fuel Oil for Combustion Purposes for Propulsion or Operation on Board a Ship), Resolution MEPC.305(73), Adopted on 26 October 2018, Entered into Force on 1 March 2020; Marine Environment Protection Committee, International Maritime Organization: London, UK, 2018; pp. 1–5. [Google Scholar]
  20. MEPC. Study on Effects of the Entry into Force of the Global 0.5% Fuel Oil Sulphur Content Limit on Human Health Submitted by Finland. MEPC 70/INF.34; IMO: London, UK, 2016; pp. 1–30. [Google Scholar]
  21. Comer, B.; Georgeff, E.; Osipova, L. Air Emissions and Water Pollution Discharges from Ships with Scrubbers; International Council on Clean Transportation: Washington, DC, USA, 2020. [Google Scholar]
  22. Wan, Z.; Zhou, X.; Zhang, Q.; Chen, J. Influence of Sulfur Emission Control Areas on Particulate Matter Emission: A Difference-in-Differences Analysis. Mar. Policy 2021, 130, 104584. [Google Scholar] [CrossRef]
  23. Bauer, M.; Czech, H.; Anders, L.; Passig, J.; Etzien, U.; Bendl, J.; Streibel, T.; Adam, T.W.; Buchholz, B.; Zimmermann, R. Impact of Fuel Sulfur Regulations on Carbonaceous Particle Emission from a Marine Engine. npj Clim. Atmos. Sci. 2024, 7, 288. [Google Scholar] [CrossRef]
  24. Kleijn, A. Comparison Air Pollutant Emissions MARPOL Annex VI Compliance Options in 2020; CE Delft: Delft, The Netherlands, 2021. [Google Scholar]
  25. MEPC. Amendments to the Technical Code on Control of Emission of Nitrogen Oxides from Marine Diesel Engines (NOx Technical Code 2008), Resolution MEPC.177(58), Adopted on 10 October 2008, Entered into Force on 1 July 2010; Marine Environmental Protection Committee, International Maritime Organization: London, UK, 2008. [Google Scholar]
  26. MEPC. Amendments to the Annex of the Protocol of 1997 to Amend the International Convention for the Prevention of Pollution from Ships, 1973, as Modified by the Protocol of 1978 Relating Thereto. Amendments to MARPOL Annex VI (Designation of the Baltic Sea and the North Sea Emission Control Areas for NOx Tier III Control), Resolution MEPC.268(71), Adopted on 7 July 2017, Entered into Force on 1 January 2019; Marine Environment Protection Committee, International Maritime Organization: London, UK, 2017. [Google Scholar]
  27. MEPC. Report of the Marine Environmental Protection Committee on Its Sixty-Second Session; IMO: London, UK, 2011; pp. 1–199. [Google Scholar]
  28. MEPC. Report of the Marine Environmental Protection Committee on Its Sixty-Fifth Session; IMO: London, UK, 2013; pp. 1–166. [Google Scholar]
  29. MEPC. Report of the Marine Environment Protection Committee on Its Sixty-Eighth Session; IMO: London, UK, 2015; pp. 1–74. [Google Scholar]
  30. Faber, J.; Hanayama, S.; Zhang, S.; Pereda, P.; Comer, B.; Hauerhof, E.; van der Loeff, W.S.; Smith, T.; Zhang, Y.; Kosaka, H.; et al. Fourth IMO GHG Study 2020 Full Report; IMO: London, UK, 2021. [Google Scholar]
  31. MEPC. Amendments to the Annex of the International Convention for the Prevention of Pollution from Ships, 1973, as Modified by the Protocol of 1978 Relating Thereto, Amendments to MARPOL Annex I (Prohibition on the Use and Carriage for Use as Fuel of Heavy Fuel Oil by Ships in Arctic Waters), Resolution MEPC.329(76), Adopted on 17 June 2021; IMO: London, UK, 2021. [Google Scholar]
  32. Comer, B.; Osipova, L.; Georgeff, E.; Mao, X. The International Maritime Organization’s Proposed Arctic Heavy Fuel Oil Ban: Likely Impacts and Opportunities for Improvement; International Council on Clean Transportation: Washington, DC, USA, 2020. [Google Scholar]
  33. MUDP. Development of Wet Electrostatic Precipitator for Marine Engines; Miljøstyrelsen: Odense, Denmark, 2024. [Google Scholar]
  34. MEPC. Guidance on Best Practice on Recommendatory Goal-Based Control Measures to Reduce the Impact on the Arctic of Black Carbon Emissions from International Shipping, Resolution MEPC.393(82), Adopted on 4 October 2024; IMO: London, UK, 2024. [Google Scholar]
  35. PPR. Final Results of a Black Carbon Measurement Campaign with Emphasis on the Impact of the Fuel Oil Quality on Black Carbon Emissions, PPR.8/5/1, Submitted by Finland and Germany; IMO: London, UK, 2021. [Google Scholar]
  36. Gysel, N.R.; Welch, W.A.; Johnson, K.; Miller, W.; Cocker, D.R. Detailed Analysis of Criteria and Particle Emissions from a Very Large Crude Carrier Using a Novel ECA Fuel. Environ. Sci. Technol. 2017, 51, 1868–1875. [Google Scholar] [CrossRef]
  37. Johnson, K.; Welch, B.; Miller, W.; Cocker III, D.R.; Russell, R.L.; Yu, J. Black Carbon and Other Gaseous Emissions from an Ocean Going Vessel Main Engine Operating on Two Fuels; California Air Resources Board: Riverside, CA, USA, 2015. [Google Scholar]
  38. Comer, B.; Olmer, N.; Mao, X.; Roy, B.; Rutherford, D. Black Carbon Emissions and Fuel Use in Global Shipping 2015; International Council on Clean Transportation: Washington, DC, USA, 2017. [Google Scholar]
  39. Lack, D.A.; Corbett, J.J. Black Carbon from Ships: A Review of the Effects of Ship Speed, Fuel Quality and Exhaust Gas Scrubbing; EGU: Vienna, Austria, 2012. [Google Scholar]
  40. Petzold, A.; Weingartner, E.; Hasselbach, J.; Lauer, P.; Kurok, C.; Fleischer, F. Physical Properties, Chemical Composition, and Cloud Forming Potential of Particulate Emissions from a Marine Diesel Engine at Various Load Conditions. Environ. Sci. Technol. 2010, 44, 3800–3805. [Google Scholar] [CrossRef]
  41. Geldenhuys, G.; Wattrus, M.; Forbes, P.B.C. Gas and Particle Phase Polycyclic Aromatic Hydrocarbon Emission Factors from a Diesel Vehicle Engine: Effect of Operating Modes in a Developing Country Context. Atmos. Environ. X 2022, 13, 100158. [Google Scholar] [CrossRef]
  42. Celik, S.; Drewnick, F.; Fachinger, F.; Brooks, J.; Darbyshire, E.; Coe, H.; Paris, J.-D.; Eger, P.G.; Schuladen, J.; Tadic, I.; et al. Influence of Vessel Characteristics and Atmospheric Processes on the Gas and Particle Phase of Ship Emission Plumes: In Situ Measurements in the Mediterranean Sea and around the Arabian Peninsula. Atmos. Chem. Phys. 2020, 20, 4713–4734. [Google Scholar] [CrossRef]
  43. Lack, D.A.; Cappa, C.D.; Langridge, J.; Bahreini, R.; Buffaloe, G.; Brock, C.; Cerully, K.; Coffman, D.; Hayden, K.; Holloway, J.; et al. Impact of Fuel Quality Regulation and Speed Reductions on Shipping Emissions: Implications for Climate and Air Quality. Environ. Sci. Technol. 2011, 45, 9052–9060. [Google Scholar] [CrossRef]
  44. Lack, D.; Lerner, B.; Granier, C.; Baynard, T.; Lovejoy, E.; Massoli, P.; Ravishankara, A.R.; Williams, E. Light Absorbing Carbon Emissions from Commercial Shipping. Geophys. Res. Lett. 2008, 35, L13815. [Google Scholar] [CrossRef]
  45. Peters, G.P.; Nilssen, T.B.; Lindholt, L.; Eide, M.S.; Glomsrød, S.; Eide, L.I.; Fuglestvedt, J.S. Future Emissions from Shipping and Petroleum Activities in the Arctic. Atmos. Chem. Phys. 2011, 11, 5305–5320. [Google Scholar] [CrossRef]
  46. Winther, M.; Christensen, J.H.; Plejdrup, M.S.; Ravn, E.S.; Eriksson, Ó.F.; Kristensen, H.O. Emission Inventories for Ships in the Arctic Based on Satellite Sampled AIS Data. Atmos. Environ. 2014, 91, 1–14. [Google Scholar] [CrossRef]
  47. Olmer, N.; Comer, B.; Roy, B.; Mao, X.; Rutherford, D. Greenhouse Gas Emissions from Global Shipping, 2013–2015; International Council on Clean Transportation: Washington, DC, USA, 2017. [Google Scholar]
  48. Olmer, N.; Comer, B.; Roy, B.; Mao, X.; Rutherford, D. Greenhouse Gas Emissions from Global Shipping, 2013–2015 Detailed Methodology; International Council on Clean Transportation: Washington, DC, USA, 2017. [Google Scholar]
  49. Bendl, J.; Saraji-Bozorgzad, M.R.; Käfer, U.; Padoan, S.; Mudan, A.; Etzien, U.; Giocastro, B.; Schade, J.; Jeong, S.; Kuhn, E.; et al. How Do Different Marine Engine Fuels and Wet Scrubbing Affect Gaseous Air Pollutants and Ozone Formation Potential from Ship Emissions? Environ. Res. 2024, 260, 119609. [Google Scholar] [CrossRef]
  50. Van Roy, W.; Merveille, J.-B.; Scheldeman, K.; Van Nieuwenhove, A.; Schallier, R.; Van Roozendael, B.; Maes, F. Assessment of the Effect of International Maritime Regulations on Air Quality in the Southern North Sea. Atmosphere 2023, 14, 969. [Google Scholar] [CrossRef]
  51. Van Roy, W.; Van Roozendael, B.; Vigin, L.; Van Nieuwenhove, A.; Scheldeman, K.; Merveille, J.-B.; Weigelt, A.; Mellqvist, J.; Van Vliet, J.; van Dinther, D.; et al. International Maritime Regulation Decreases Sulfur Dioxide but Increases Nitrogen Oxide Emissions in the North and Baltic Sea. Commun. Earth Environ. 2023, 4, 391. [Google Scholar] [CrossRef]
  52. Van Roy, W.; Merveille, J.-B.; Scheldeman, K.; Van Nieuwenhove, A.; Van Roozendael, B.; Schallier, R.; Maes, F. The Role of Belgian Airborne Sniffer Measurements in the MARPOL Annex VI Enforcement Chain. Atmosphere 2023, 14, 623. [Google Scholar] [CrossRef]
  53. Duran, V.; Uriondo, Z.; Moreno-Gutiérrez, J. The Impact of Marine Engine Operation and Maintenance on Emissions. Transp. Res. D Transp. Environ. 2012, 17, 54–60. [Google Scholar] [CrossRef]
  54. Lauer, A.; Eyring, V.; Corbett, J.J.; Wang, C.; Winebrake, J.J. Assessment of Near-Future Policy Instruments for Oceangoing Shipping: Impact on Atmospheric Aerosol Burdens and the Earth’s Radiation Budget. Environ. Sci. Technol. 2009, 43, 5592–5598. [Google Scholar] [CrossRef]
  55. Maes, F.; Cliquet, A.; van Gaever, S.; Lescrauwaet, A.-K.; Pirlet, H.; Verleye, T.; Mees, J.; Herman, R. (Eds.) Raakvlak Marien Onderzoek En Beleid. In Compendium voor Kust en Zee 2013: Een Geïntegreerd Kennisdocument over de Socio-Economische, Ecologische en Institutionele Aspecten van de Kust en zee in Vlaanderen en België; Vlaams Instituut voor de Zee (VLIZ): Oostende, Belgium, 2013; pp. 286–323. [Google Scholar]
  56. Maut, A. BE AWARE: Technical Sub Report 1: Ship Traffic; Bonn Agreement: London, UK, 2014. [Google Scholar]
  57. Cotteleer, A. Technical Sub Report 3: Future Traffic Model 2020; Bonn Agreement: London, UK, 2014. [Google Scholar]
  58. EMSA. Available online: https://Portal.Emsa.Europa.Eu/Group/Thetis-Eu/ (accessed on 7 April 2025).
  59. Van Roy, W.; Maes, F. Application of Remote Measurements for Compliance Monitoring and Enforcement of SO2 and NOx Emissions Under MARPOL Annex VI; Royal Belgian Institute of Natural Sciences: Brussels, Belgium, 2023. [Google Scholar]
  60. Van Roy, W.; Schallier, R.; Scheldeman, K.; Van Roozendael, B.; Van Nieuwenhove, A.; Maes, F. Airborne Monitoring of Compliance to Sulfur Emission Regulations by Ocean-Going Vessels in the Belgian North Sea Area. Atmos. Pollut. Res. 2022, 13, 101445. [Google Scholar] [CrossRef]
  61. Van Roy, W.; Scheldeman, K.; Van Roozendael, B.; Van Nieuwenhove, A.; Schallier, R.; Vigin, L.; Maes, F. Airborne Monitoring of Compliance to NOx Emission Regulations from Ocean-Going Vessels in the Belgian North Sea. Atmos. Pollut. Res. 2022, 13, 101518. [Google Scholar] [CrossRef]
  62. Van Roy, W.; Van Nieuwenhove, A.; Scheldeman, K.; Van Roozendael, B.; Schallier, R.; Mellqvist, J.; Maes, F. Measurement of Sulfur-Dioxide Emissions from Ocean-Going Vessels in Belgium Using Novel Techniques. Atmosphere 2022, 13, 1756. [Google Scholar] [CrossRef]
  63. AethLabs MicroAeth® MA Series MA200, MA300, MA350 Operating Manual. Available online: https://aethlabs.com (accessed on 1 July 2025).
  64. Blanco-Donado, E.P.; Schneider, I.L.; Artaxo, P.; Lozano-Osorio, J.; Portz, L.; Oliveira, M.L.S. Source Identification and Global Implications of Black Carbon. Geosci. Front. 2022, 13, 101149. [Google Scholar] [CrossRef]
  65. Chakraborty, M.; Giang, A.; Zimmerman, N. Performance Evaluation of Portable Dual-Spot Micro-Aethalometers for Source Identification of Black Carbon Aerosols: Application to Wildfire Smoke and Traffic Emissions in the Pacific Northwest. Atmos. Meas. Tech. 2023, 16, 2333–2352. [Google Scholar] [CrossRef]
  66. Aakko-Saksa, P.; Kuittinen, N.; Murtonen, T.; Koponen, P.; Aurela, M.; Järvinen, A.; Teinilä, K.; Saarikoski, S.; Barreira, L.M.F.; Salo, L.; et al. Suitability of Different Methods for Measuring Black Carbon Emissions from Marine Engines. Atmosphere 2021, 13, 31. [Google Scholar] [CrossRef]
  67. EMSA Thetis-EU. Available online: https://portal.emsa.europa.eu/web/thetis-eu (accessed on 1 July 2025).
  68. IMO. Available online: https://Gisis.Imo.Org/Public/Default.Aspx (accessed on 7 April 2025).
  69. Beecken, J.; Mellqvist, J.; Salo, K.; Ekholm, J.; Jalkanen, J.P. Airborne Emission Measurements of SO2, NOx and Particles from Individual Ships Using a Sniffer Technique. Atmos. Meas. Tech. 2014, 7, 1957–1968. [Google Scholar] [CrossRef]
  70. Beecken, J.; Mellqvist, J.; Salo, K.; Ekholm, J.; Jalkanen, J.P.; Johansson, L.; Litvinenko, V.; Volodin, K.; Frank-Kamenetsky, D.A. Emission Factors of SO2, NOx and Particles from Ships in Neva Bay from Ground-Based and Helicopter-Borne Measurements and AIS-Based Modeling. Atmos. Chem. Phys. 2015, 15, 5229–5241. [Google Scholar] [CrossRef]
  71. Ministerieel Besluit van 8 Januari 2014—Compendium Voor de Monsterneming, Meting en Analyse van Water (WAC)—Meetonzekerheid (VITO); Belgisch Staatsblad: Brussels, Belgium, 2014.
  72. Sprinthall, R.C. Basic Statistical Analysis, 9th ed.; Pearson: London, UK, 2011; ISBN 9780205052172. [Google Scholar]
  73. RBINS Physical State of the Sea—Belgian Coastal Zone—COHERENS UKMO; Royal Belgian Institute of Natural Sciences: Brussels, Belgium, 2025. [CrossRef]
  74. Knudsen, B.; Lallana, A.L.; Ledermann, L. NOx Emissions from Ships in Danish Waters Assessment of Current Emission Levels and Potential Enforcement Models; The Danish Environmental Protection Agency: Odense, Denmark, 2022. [Google Scholar]
  75. Sturtz, T.M.; Lindhjem, C.; Chan, L.; Yarwood, G. Final Report Link-Based Modeling Emissions Inventory of Marine Vessels (Ocean Going Vessels) in Transit and at Anchor in the Gulf of Mexico; Texas Commission on Environmental Quality: Austin, TX, USA, 2015. [Google Scholar]
  76. Goldsworthy, L.; Goldsworthy, B. Modelling of Ship Engine Exhaust Emissions in Ports and Extensive Coastal Waters Based on Terrestrial AIS Data—An Australian Case Study. Environ. Model. Softw. 2015, 63, 45–60. [Google Scholar] [CrossRef]
  77. Yau, P.S.; Lee, S.C.; Corbett, J.J.; Wang, C.; Cheng, Y.; Ho, K.F. Estimation of Exhaust Emission from Ocean-Going Vessels in Hong Kong. Sci. Total Environ. 2012, 431, 299–306. [Google Scholar] [CrossRef]
  78. Devore, J.; Berk, K.; Carlton, M. Modern Mathematical Statistics with Applications, 3rd ed.; Springer: Berlin/Heidelberg, Germany, 2011. [Google Scholar]
  79. Johansson, L.; Jalkanen, J.-P.; Kukkonen, J. Global Assessment of Shipping Emissions in 2015 on a High Spatial and Temporal Resolution. Atmos. Environ. 2017, 167, 403–415. [Google Scholar] [CrossRef]
  80. Global Maritime Hub COSCO Joins Lead Group of Scrubber Users! Available online: https://globalmaritimehub.com/cosco-joins-lead-group-of-scrubber-users.html (accessed on 7 March 2025).
  81. Van Roy, W.; Merveille, J.-B.; Van Nieuwenhove, A.; Scheldeman, K.; Maes, F. Policy Recommendations for International Regulations Addressing Air Pollution from Ships. Mar. Policy 2024, 159, 105913. [Google Scholar] [CrossRef]
  82. Degiuli, N.; Martić, I.; Farkas, A.; Gospić, I. The Impact of Slow Steaming on Reducing CO2 Emissions in the Mediterranean Sea. Energy Rep. 2021, 7, 8131–8141. [Google Scholar] [CrossRef]
  83. SCIPPER. SCIPPER Project Finds High Nitrogen Oxides Emissions of Tier III Vessels from Remote Measurements in North European Seas; The SCIPPER Project (European Union’s Horizon 2020): Brussels, Belgium, 2023. [Google Scholar]
  84. Heywood, J. Internal Combustion Engine Fundamentals, 2nd ed.; McGraw-Hill Education Ltd.: London, UK, 2018. [Google Scholar]
  85. DNV-GL. Energy Management Study 2015, Energy Efficient Operation-What Really Matters; DNV: Yokohama, Japan, 2015. [Google Scholar]
  86. Corbett, J.J.; Lack, D.A.; Winebrake, J.J.; Harder, S.; Silberman, J.A.; Gold, M. Arctic Shipping Emissions Inventories and Future Scenarios. Atmos. Chem. Phys. 2010, 10, 9689–9704. [Google Scholar] [CrossRef]
  87. Bonn Agreement. BE-AWARE: Summary Report; Bonn Agreement: London, UK, 2014. [Google Scholar]
  88. Sinha, P.; Hobbs, P.V.; Yokelson, R.J.; Christian, T.J.; Kirchstetter, T.W.; Bruintjes, R. Emissions of Trace Gases and Particles from Two Ships in the Southern Atlantic Ocean. Atmos. Environ. 2003, 37, 2139–2148. [Google Scholar] [CrossRef]
  89. Rutherford, D.; Director, P.; Comer, B.; Durbin, T.; Jiang, Y.; Yang, J.; Karavalakis, G.; Cocker, D.; Fofi, E.; Jung, H.; et al. Black Carbon Measurement Methods and Emission Factors from Ships; International Council on Clean Transportation: Washington, DC, USA, 2016. [Google Scholar]
  90. Petzold, A.; Hasselbach, J.; Lauer, P.; Baumann, R.; Franke, K.; Gurk, C.; Schlager, H.; Weingartner, E. Experimental Studies on Particle Emissions from Cruising Ship, Their Characteristic Properties, Transformation and Atmospheric Lifetime in the Marine Boundary Layer. Atmos. Chem. Phys. 2008, 8, 2387–2403. [Google Scholar] [CrossRef]
  91. Fuglestvedt, J.S.; Shine, K.P.; Berntsen, T.; Cook, J.; Lee, D.S.; Stenke, A.; Skeie, R.B.; Velders, G.J.M.; Waitz, I.A. Transport Impacts on Atmosphere and Climate: Metrics. Atmos. Environ. 2010, 44, 4648–4677. [Google Scholar] [CrossRef]
  92. Dentener, F.; Kinne, S.; Bond, T.; Boucher, O.; Cofala, J.; Generoso, S.; Ginoux, P.; Gong, S.; Hoelzemann, J.J.; Ito, A.; et al. Emissions of Primary Aerosol and Precursor Gases in the Years 2000 and 1750 Prescribed Data-Sets for AeroCom. Atmos. Chem. Phys. 2006, 6, 4321–4344. [Google Scholar] [CrossRef]
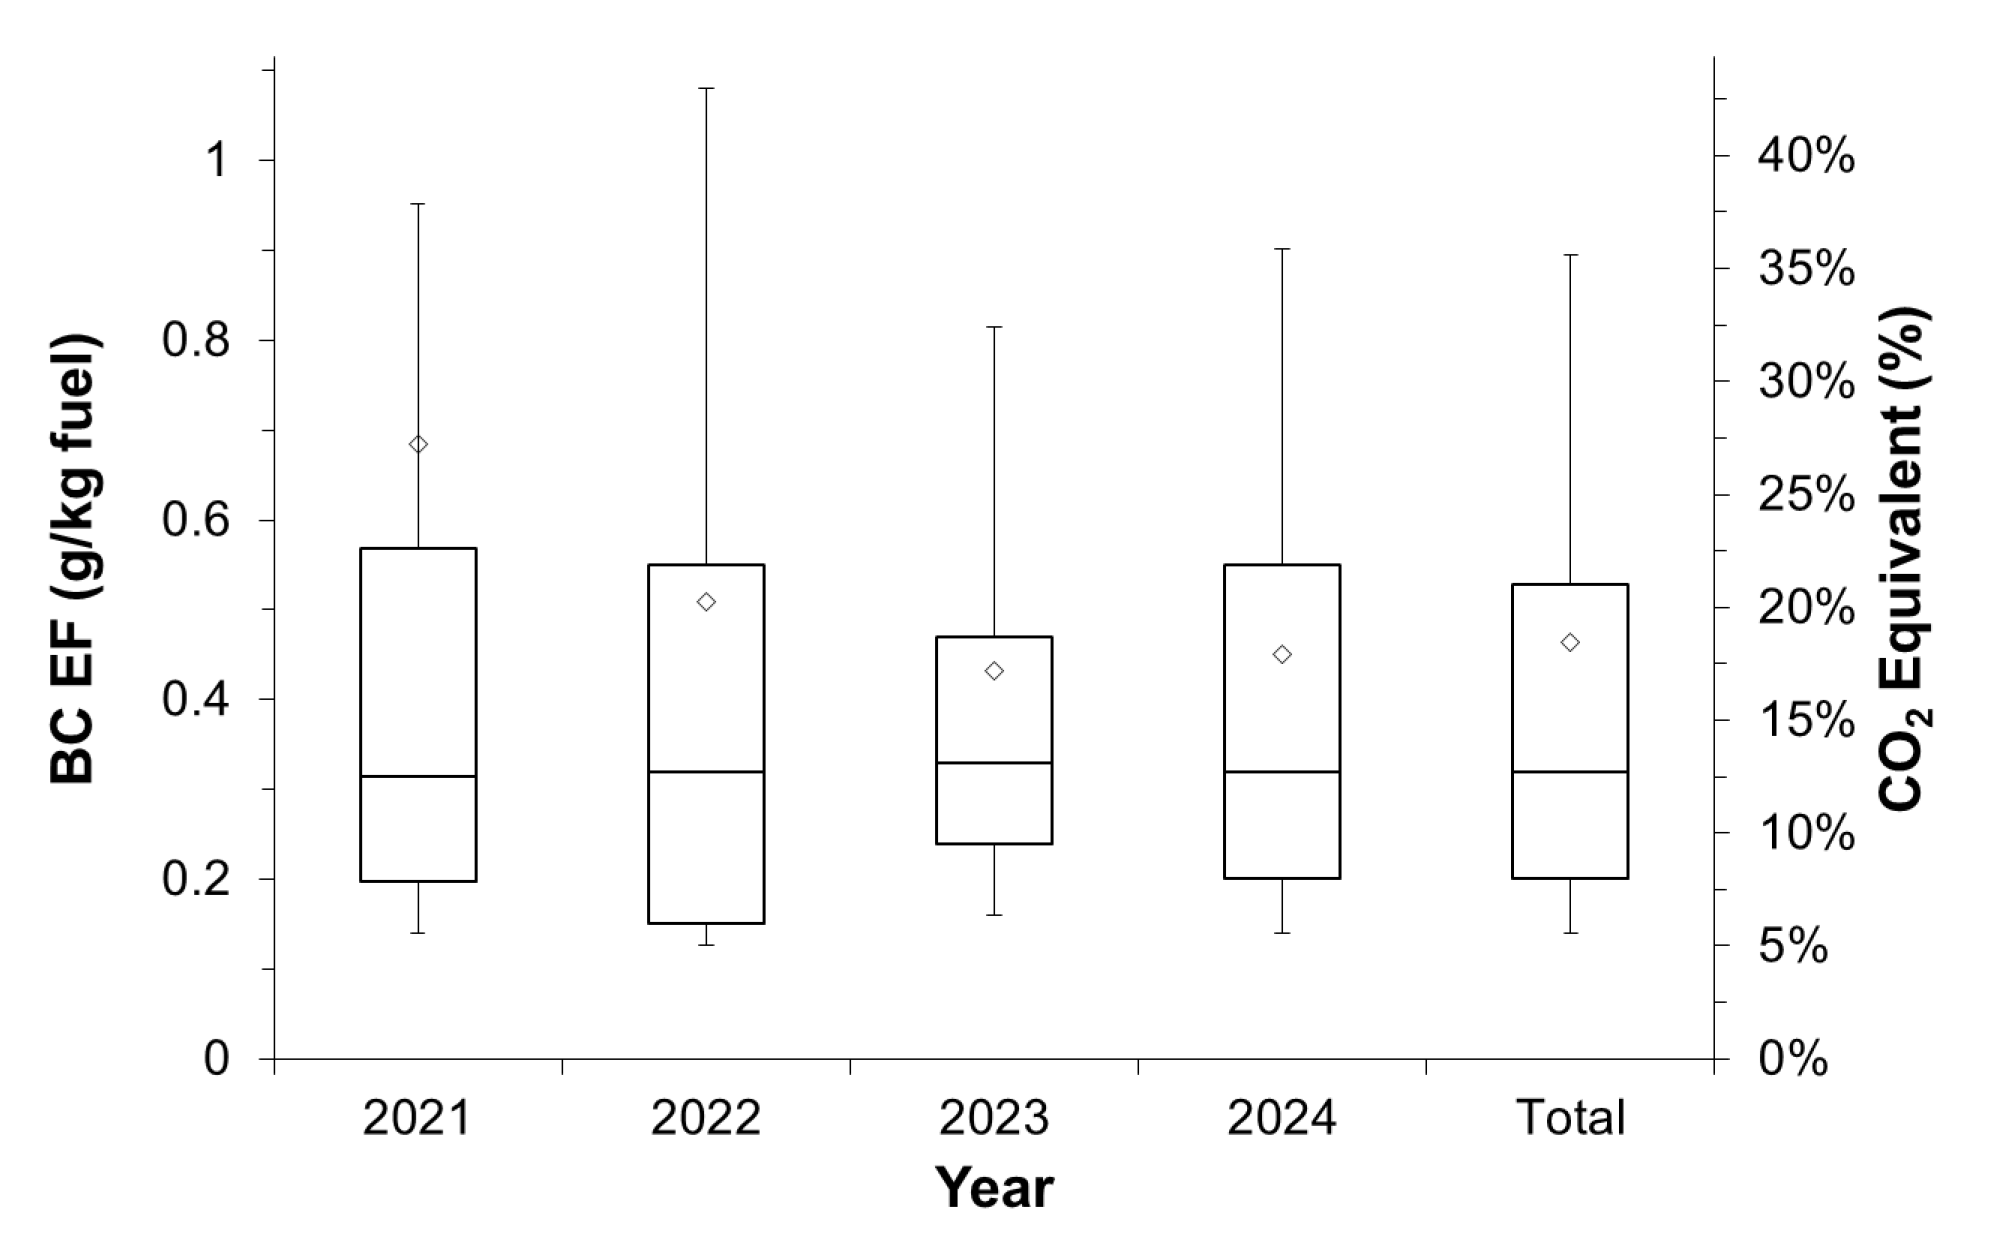
Figure 1. Boxplot with the median, 10, 25, 75 and 90% percentiles, and mean (♢) of the annual and total measured BC EFs for the period 2021–2024. The right axis gives the BC GWP20 in CO2-eq expressed as the percentage of the ship’s CO2 emissions.
Atmosphere 16 00840 g001
Figure 2. Normalized observed and fitted probability distributions of the observed BC EFs (a) and cumulative observed and fitted probability distributions of the observed BC EF measurements, with the indication of the mean and median values and the proportion of ships surpassing 1.25 g BC/kg fuel (b).
Atmosphere 16 00840 g002
Figure 3. Spatial distribution of remote BC emission measurements, with color-coded representation of BC EF levels (in g BC/kWh).
Atmosphere 16 00840 g003
Figure 4. Load dependency of the BC EF measurements (a) and box plot of median, 10, 25, 75 and 90% percentiles, and mean (♢) BC EFs between 4 different engine load ranges (b).
Atmosphere 16 00840 g004
Figure 5. Box plot of median, 10, 25, 75 and 90% percentiles, and mean (♢) BC EFs according to FSC compliance with green (FSC < 0.13%), orange (0.13–0.3% FSC) and red (FSC > 0.3%) flags (a) and EGCS (b).
Atmosphere 16 00840 g005
Figure 6. Comparison of the fitted BC EFs using a power function (a) and exponential decay function (b).
Atmosphere 16 00840 g006
Figure 7. Fitting of a subset of high plume concentration measurements using a power model and an exponential decay model in comparison with the models for MGO and HFO presented in the IMO Fourth GHG study [30,38,47,48].
Atmosphere 16 00840 g007
Figure 8. Box plot of median, 10, 25, 75 and 90% percentiles, and mean (♢) BC EFs of the observed BC EFs versus the IMO models, the exponential decay model and the power model.
Atmosphere 16 00840 g008
Disclaimer/Publisher’s Note: The statements, opinions and data contained in all publications are solely those of the individual author(s) and contributor(s) and not of MDPI and/or the editor(s). MDPI and/or the editor(s) disclaim responsibility for any injury to people or property resulting from any ideas, methods, instructions or products referred to in the content.