Article

Spatiotemporal Variation Patterns of and Response Differences in Water Conservation in China’s Nine Major River Basins Under Climate Change

1
College of Geographical Science, Inner Mongolia Normal University, Hohhot 010022, China
2
Inner Mongolia Autonomous Region Territorial Space Planning Academy, Hohhot 010010, China
3
Key Laboratory of Mongolian Plateau Geographical Research, Inner Mongolia Autonomous Region, Hohhot 010022, China
*
Author to whom correspondence should be addressed.
Atmosphere 2025, 16(7), 837; https://doi.org/10.3390/atmos16070837
Submission received: 15 May 2025 / Revised: 29 June 2025 / Accepted: 4 July 2025 / Published: 10 July 2025

Abstract

As a crucial manifestation of ecosystem water regulation and supply functions, water conservation plays a vital role in regional ecosystem development and sustainable water resource management. This study investigates nine major Chinese river basins (Songliao, Haihe, Huaihe, Yellow, Yangtze, Pearl, Southeast Rivers, Southwest Rivers, and Inland Rivers) through integrated application of the InVEST model and geographical detector model. We systematically examine the spatiotemporal heterogeneity of water conservation capacity and its driving mechanisms from 1990 to 2020. The results reveal a distinct northwest–southeast spatial gradient in water conservation across China, with lower values predominating in northwestern regions. Minimum conservation values were recorded in the Inland River Basin (15.88 mm), Haihe River Basin (42.07 mm), and Yellow River Basin (43.55 mm), while maximum capacities occurred in the Pearl River Basin (483.68 mm) and Southeast Rivers Basin (517.21 mm). Temporal analysis showed interannual fluctuations, peaking in 2020 at 130.98 mm and reaching its lowest point in 2015 at 113.04 mm. Precipitation emerged as the dominant factor governing spatial patterns, with higher rainfall correlating strongly with enhanced conservation capacity. Land cover analysis revealed superior water retention in vegetated areas (forests, grasslands, and cultivated land) compared to urbanized and bare land surfaces. Our findings demonstrate that water conservation dynamics result from synergistic interactions among multiple factors rather than single-variable influences. Accordingly, we propose that future water resource policies adopt an integrated management approach addressing climate patterns, land use optimization, and socioeconomic factors to develop targeted conservation strategies.

1. Introduction

The intensification of global warming has precipitated frequent extreme climatic events including heatwaves, droughts, and torrential rainfall. Concurrently, escalating water demands from population growth, industrial expansion, agricultural intensification, and urbanization have created critical imbalances in water resource distribution [1]. This hydrological stress has amplified regional disparities in water availability, heightening vulnerability to both water scarcity and flooding events. In this context, ecosystem-mediated hydrological services (water conservation) have emerged as a crucial focus for sustainable water management strategies [2]. Natural systems such as forests, wetlands, and grasslands function as biological reservoirs through precipitation interception, soil moisture regulation, and runoff redistribution. These processes mitigate flood risks, enhance water storage capacity, and reduce disaster frequency [3], playing an indispensable role in maintaining global hydrological stability and optimizing water resource allocation.
As a fundamental ecosystem service, water conservation embodies the capacity of vegetation canopies, litter layers, and soil matrices to retain water through integrated processes of interception, storage, runoff modulation, and purification within specific spatiotemporal contexts [4]. This regulatory function critically influences local ecological dynamics while exerting cascading effects on downstream ecosystem productivity, nutrient cycling, and environmental remediation [5]. Understanding its operational mechanisms and quantitatively characterizing its temporal dynamics and driving forces therefore constitute a prerequisite for informed water resource governance.
Substantial progress has been made in conceptualizing and evaluating water conservation. Q.T. Zuo et al. [6] established theoretical frameworks linking conservation capacity to synergistic climate–vegetation–surface interactions, proposing quantitative methods through mathematical modeling. Y.F. Wang et al. [3] categorized methodological evolution into four developmental phases: observational studies, field experimentation, formulaic approaches, and model-based assessments, with the latter representing the current state of the art.
Contemporary evaluation models employ diverse methodologies: SEBS and SCS models apply water balance principles (precipitation minus evapotranspiration and runoff), though their exclusion of subsurface processes risks overestimation. The SWAT model provides robust physical parameterization of rainfall–runoff dynamics but demands intensive data inputs for large basins. By contrast, the InVEST model synthesizes ecohydrological processes with spatial analytics, utilizing accessible geospatial data (land use, meteorology, topography, soil properties) to quantify water yield and conservation through modular computation [3,7]. Its operational efficiency and spatial explicitness have established it as a preferred tool for basin-scale assessments.
Empirical studies reveal precipitation as the principal determinant of water conservation [8,9], while vegetation mediates hydrological processes through canopy interception and transpiration regulation [10,11,12]. Land use alterations modify conservation capacity via vegetation coverage and surface permeability changes [13,14], with additional influences from topography, climatic variability, and anthropogenic pressures [15,16]. Advanced analytical techniques including random forests, principal component analysis, and geodetector modeling enable systematic investigation of driving factors. The geodetector model [17] particularly excels in spatial heterogeneity analysis, identifying dominant influences and evaluating factor interactions through its dual detection capabilities [18]. This approach proves particularly valuable given the multi-scale, nonlinear nature of water conservation dynamics [19].
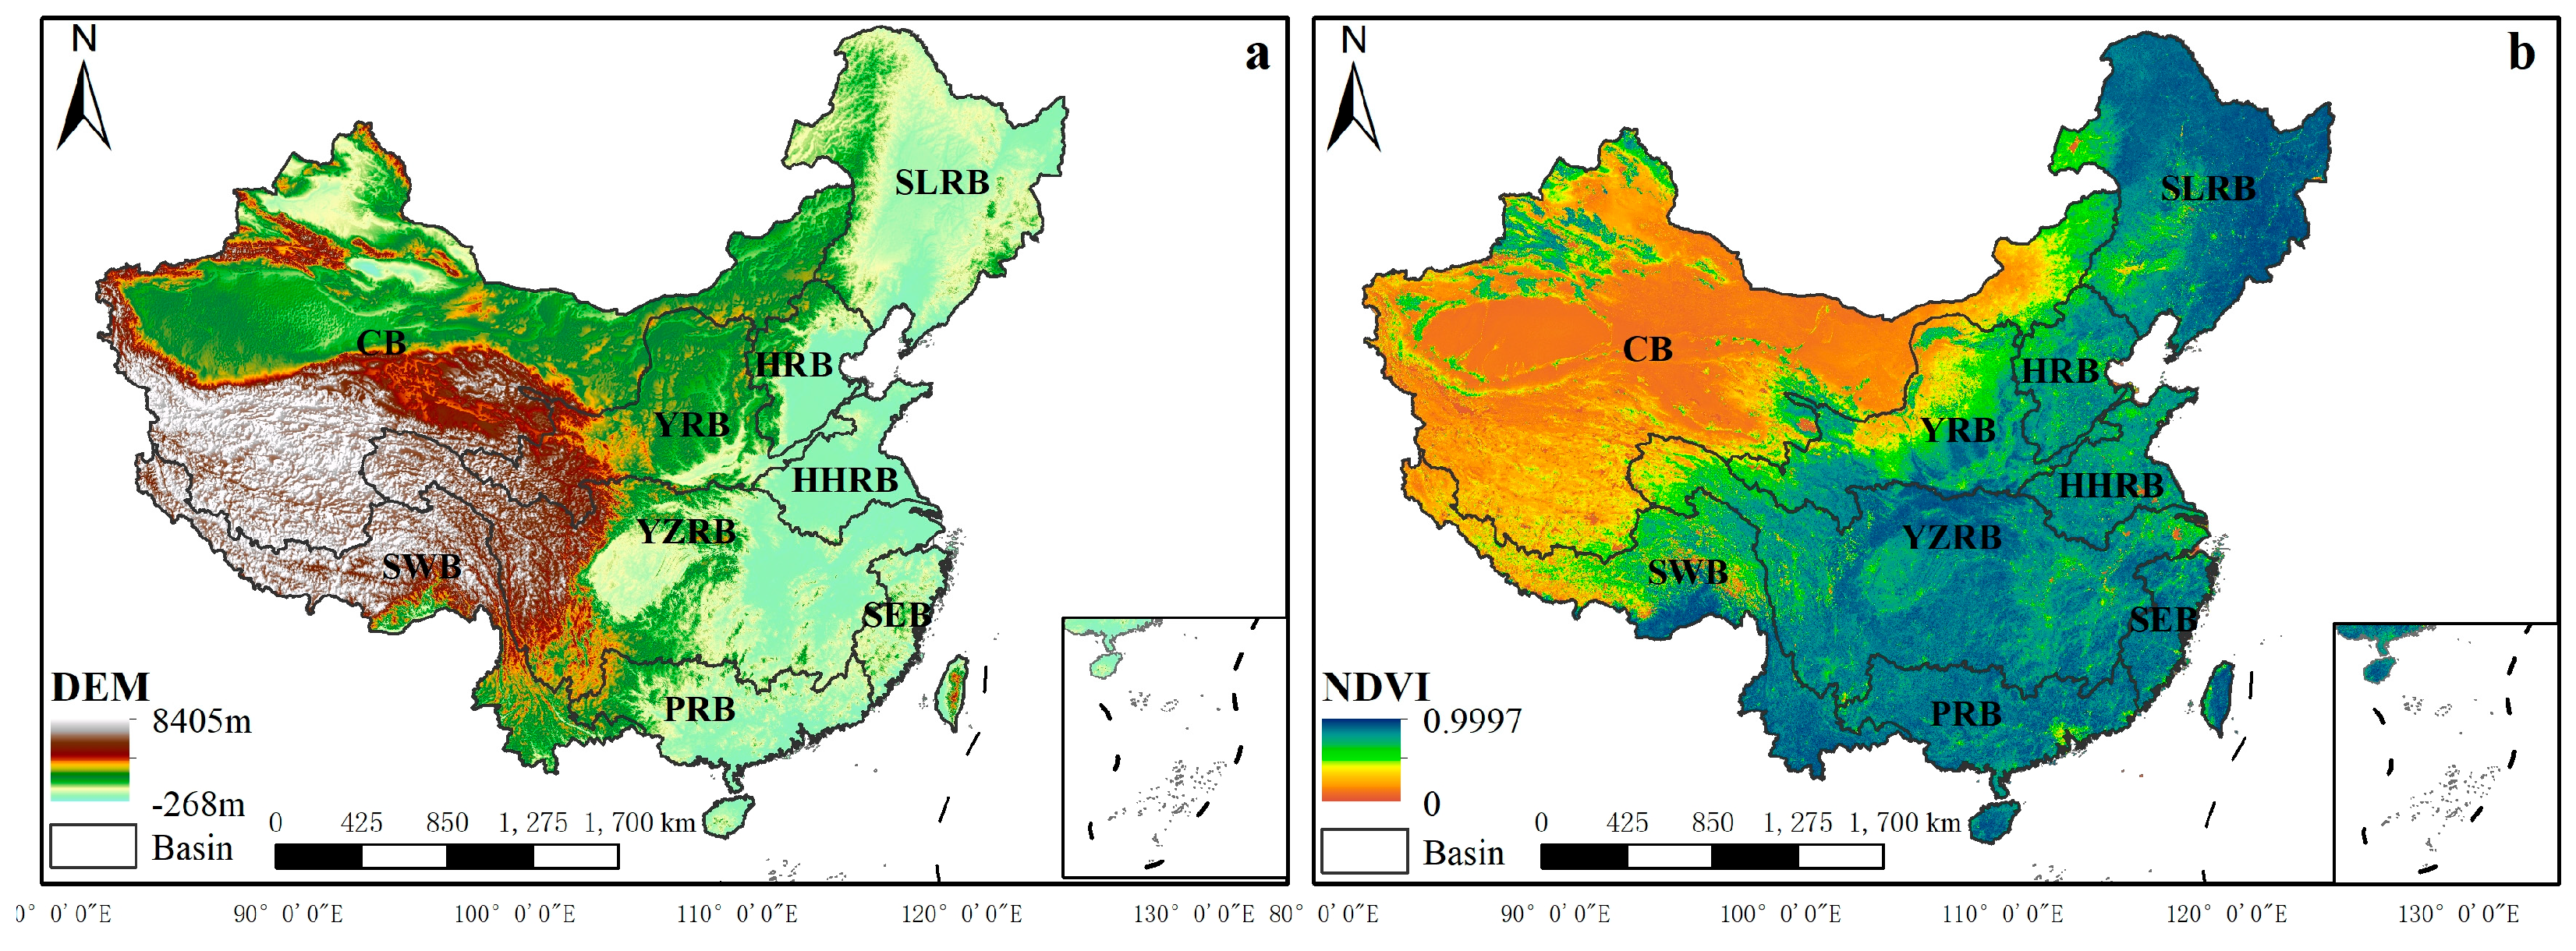
China’s complex ecohydrological landscape, spanning 9.6 million km2 with pronounced northwest–southeast precipitation gradients (demarcated by the 400 mm isohyet), presents unique conservation challenges. The eastern monsoon region features dense river networks sustained by abundant rainfall, while northwestern arid zones rely on limited precipitation and glacial meltwater. This environmental diversity fosters distinct conservation mechanisms: forest interception in humid basins, wetland regulation in floodplains, and permafrost-mediated processes in alpine regions.
Addressing these challenges, this study investigates the spatiotemporal evolution and driving mechanisms of water conservation across China’s nine major river basins. Employing the InVEST model’s water yield module integrated with multi-source data (meteorological, pedological, land use), we reconstruct conservation dynamics from 1990 to 2020. Through geodetector analysis, we elucidate multi-scale drivers via factor interaction detection, achieving two primary innovations: ① large-scale dynamic assessment through remote sensing data fusion, and ② sub-basin-scale factor analysis informing differentiated management strategies. Our findings provide critical insights for ecohydrological system governance and sustainable water resource management.

2. Materials and Methods

2.1. Study Area

Situated in eastern Asia along the western Pacific Rim (3°51′–53°33′ N, 73°33′–135°5′ E), China encompasses a vast territory of 9.6 million km2 characterized by dramatic topographic variations. The continental landmass exhibits a distinctive three-step topographic descending from the high-altitude Qinghai–Tibet Plateau (average elevation > 4000 m) in the west to eastern coastal plains, featuring a maximum vertical relief exceeding 8600 m (Figure 1). This complex geomorphology comprises parallel mountain ranges, expansive plateaus, intermountain basins, alluvial plains, and rolling hills, supporting diverse ecosystems including grasslands, forests, and cultivated lands [20,21]. Climatically, the region experiences a mean annual temperature of 10.25 °C with pronounced precipitation heterogeneity. The national average precipitation reaches 700 mm annually, yet spatial distribution reveals extreme contrasts: southeastern coastal areas receive >1600 mm/year compared to <400 mm/year in northwestern arid zones. Hyper-arid regions along desert margins record < 100 mm/year, with the Tarim Basin (Xinjiang) and Qaidam Basin (Qinghai) averaging < 25 mm/year. These conditions contribute to water resource scarcity, with per capita availability significantly below global averages and marked spatial–temporal disparities. Hydrologically, China is partitioned into nine major basin systems: Songliao, Haihe, Huaihe, Yellow, Yangtze, Pearl, Southeast Rivers, Southwest Rivers, and Inland Rivers. This basin-based division reflects distinct hydrological regimes shaped by regional climate patterns and topographic controls, ranging from precipitation-dominated monsoon systems in the east to glacier-fed inland basins in the west.

2.2. Data Sources

This study integrates multi-source datasets spanning 1990–2020, comprising the following:
Meteorological Data: Annual precipitation (TIFF format) from spatial interpolation products provided by the Resource and Environment Science and Data Center (RESDC), Chinese Academy of Sciences. Potential evapotranspiration (PET) derived from monthly netCDF files of the National Earth System Science Data Center, with annual aggregates calculated through temporal summation. Land Use/Land Cover (LULC): Hierarchically classified data from RESDC utilizing a two-tier system: 6 primary categories (cultivated land, forest, grassland, water bodies, built-up areas, unused land, and ocean) based on utilization attributes, and 25 secondary classes reflecting natural resource characteristics. Topographic Data: Digital Elevation Model (DEM) at 30 m resolution from the ASTER Global Digital Elevation Database. Vegetation Index: Annual Normalized Difference Vegetation Index (NDVI) spatial interpolation products from RESDC. Pedological Data: Soil texture parameters (sand, silt, clay content), organic carbon, and depth profiles sourced from the Harmonized World Soil Database v1.1 (HWSD) jointly developed by FAO and IIASA, enabling calculation of plant available water content and saturated hydraulic conductivity. Socioeconomic Indicators: Gridded GDP and population density datasets generated through spatial interpolation of RESDC’s annual statistics. Detailed dataset specifications and provenance are systematically cataloged in Table 1.
All datasets were standardized to a consistent projected coordinate system (Krasovsky_1940_Albers) and spatially resampled to 1 km resolution using bilinear interpolation for continuous data and nearest-neighbor methods for categorical variables. Administrative boundary vectors were obtained from the Resource and Environment Science and Data Center (RESDC) platform and subsequently validated against the official civil administrative divisions published by China’s Ministry of Civil Affairs [18,22].

2.3. Methods

2.3.1. Water Conservation Calculation

The water conservation capacity was quantified using the InVEST model’s water yield module, which applies the Budyko hydrological framework within a water balance approach [13,23]. This module computes grid-cell level water yield by integrating precipitation, evapotranspiration (including plant transpiration and surface evaporation), and root-zone water-holding capacity derived from meteorological data, land use/cover maps, and soil properties. The resulting water yield estimates were subsequently adjusted to reflect actual water conservation through the incorporation of terrain indices (slope, aspect), soil saturated hydraulic conductivity, and flow velocity coefficients [24]. The calculation formula is as follows:
Y i j = 1 A E T i P i × P i
A E T i P i = 1 + P E T i P i 1 + P E T i P i ω 1 ω
P E T i = K c , j × E T 0 , i
ω i = Z × A E C i P i + 1.25
A W C i = min R e s t   l a y e r   d e p t h i , R o o t   d e p t h i × P A W C i
P A W C = 54.509 0.132 × s a n d 0.003 × s a n d 2 0.055 × s i l t 0.006 × s i l t 2 0.738 × c l a y + 0.007 × c l a y 2 2.688 × O M + 0.051 × O M 2
where Yij represents the annual water yield of grid unit j under land cover type i. Pi is the annual total precipitation in grid i. AETi denotes the annual actual evapotranspiration in grid i. AWCi indicates the available water content of the soil (mm). PETi represents the potential evapotranspiration in grid i. ET0,i is the reference crop evapotranspiration in grid i. ω is a non-physical parameter characterizing natural climate and soil properties. sand is the soil sand content (%). silt is the soil silt content (%). clay is the soil clay content (%). OM is the soil organic matter content (%).
The biophysical parameter table contains attribute information such as plant root depth and evapotranspiration coefficients (Kc) for different land cover types. Root depth typically refers to the depth at which 95% of the vegetation’s root biomass is concentrated. The evapotranspiration coefficient (Kc), specific to the land use/cover type in a grid unit, represents the ratio of water consumed (in grams) to synthesize 1 g of plant biomass. This coefficient adjusts reference evapotranspiration based on plant physiological traits and calculates potential evapotranspiration for different land cover types. Kc values range from 0 to 1.5 and were determined by integrating findings from relevant studies, FAO crop reference values, and InVEST model recommendations [25,26,27,28,29]. PAWCi (plant available water content) is calculated using established formulas [24,25]. The Z coefficient (Zhang coefficient) is an empirical constant that characterizes regional precipitation patterns and hydrogeological features. It is typically determined based on the annual number of precipitation events. In this study, the optimal Z value was selected by iteratively validating simulated water yields against annual average water yield data from water resource bulletins [25,26,27]. Water conservation capacity (WR) is derived from water yield (Yx) as follows:
W R = min 1 , 249 V e l o c i t y × min 1 , 0.9 × T I 3 min 1 , K s a t 300 × Y x
T I = log 10 D r a i n a g e   a r e a S o i l   d e p t h × P e r c e n t   s l o p e
K s a t = 0.056 × c l a y + 0.016 × s a n d + 0.231 × O M 0.693
where WR represents the water conservation capacity, TI (Topographic Index) is calculated based on the number of catchment grid cells, soil depth, and slope percentage. Ksat denotes the saturated hydraulic conductivity, derived from soil texture-related parameters. Velocity is determined according to land use types and referenced from previous studies [28,30,31].

2.3.2. Driving Factor Analysis of Water Conservation

The geodetector model was employed to quantitatively assess the driving factors influencing water conservation capacity. This approach leverages spatial correlation and heterogeneity analysis to examine the following: (1) geographical associations between independent and dependent variables within homogeneous units, and (2) regional variability in these relationships across different spatial domains [32,33,34]. The model effectively identifies dominant factors by (i) detecting spatial covariation patterns between predictors and water conservation, and (ii) quantifying the relative contribution of each explanatory variable [17,35,36,37]. Through this spatially explicit framework, the method provides robust identification of key determinants governing the spatial distribution of water conservation services. The calculation formula is as follows:
q = 1 h = 1 L N h σ h 2 N σ 2
where q measures the explanatory power of the independent variable. L denotes the stratification of the dependent or independent variables. Nh and σh2 represent the number of units and variance within stratum h, respectively. N and σh2 denote the total number of units and variance across the entire study area, respectively.
Building on the existing literature and empirical evidence, this study identifies the primary factors influencing water conservation ecosystem services. Water conservation service is comprehensively affected by the natural environment, socioeconomic, and other aspects, and is the result of the combined action of different factors related to climate, terrain, vegetation, land use, and human activities [7,16,38]. Considering data availability and representativeness, this study selected key influencing factors such as the precipitation, temperature, slope, land use type, Normalized Difference Vegetation Index (NDVI), population density, and GDP to explore the response characteristics of water conservation to variations in the above drivers [24,38,39,40].

3. Results

3.1. Validation of Water Conservation Simulation Accuracy

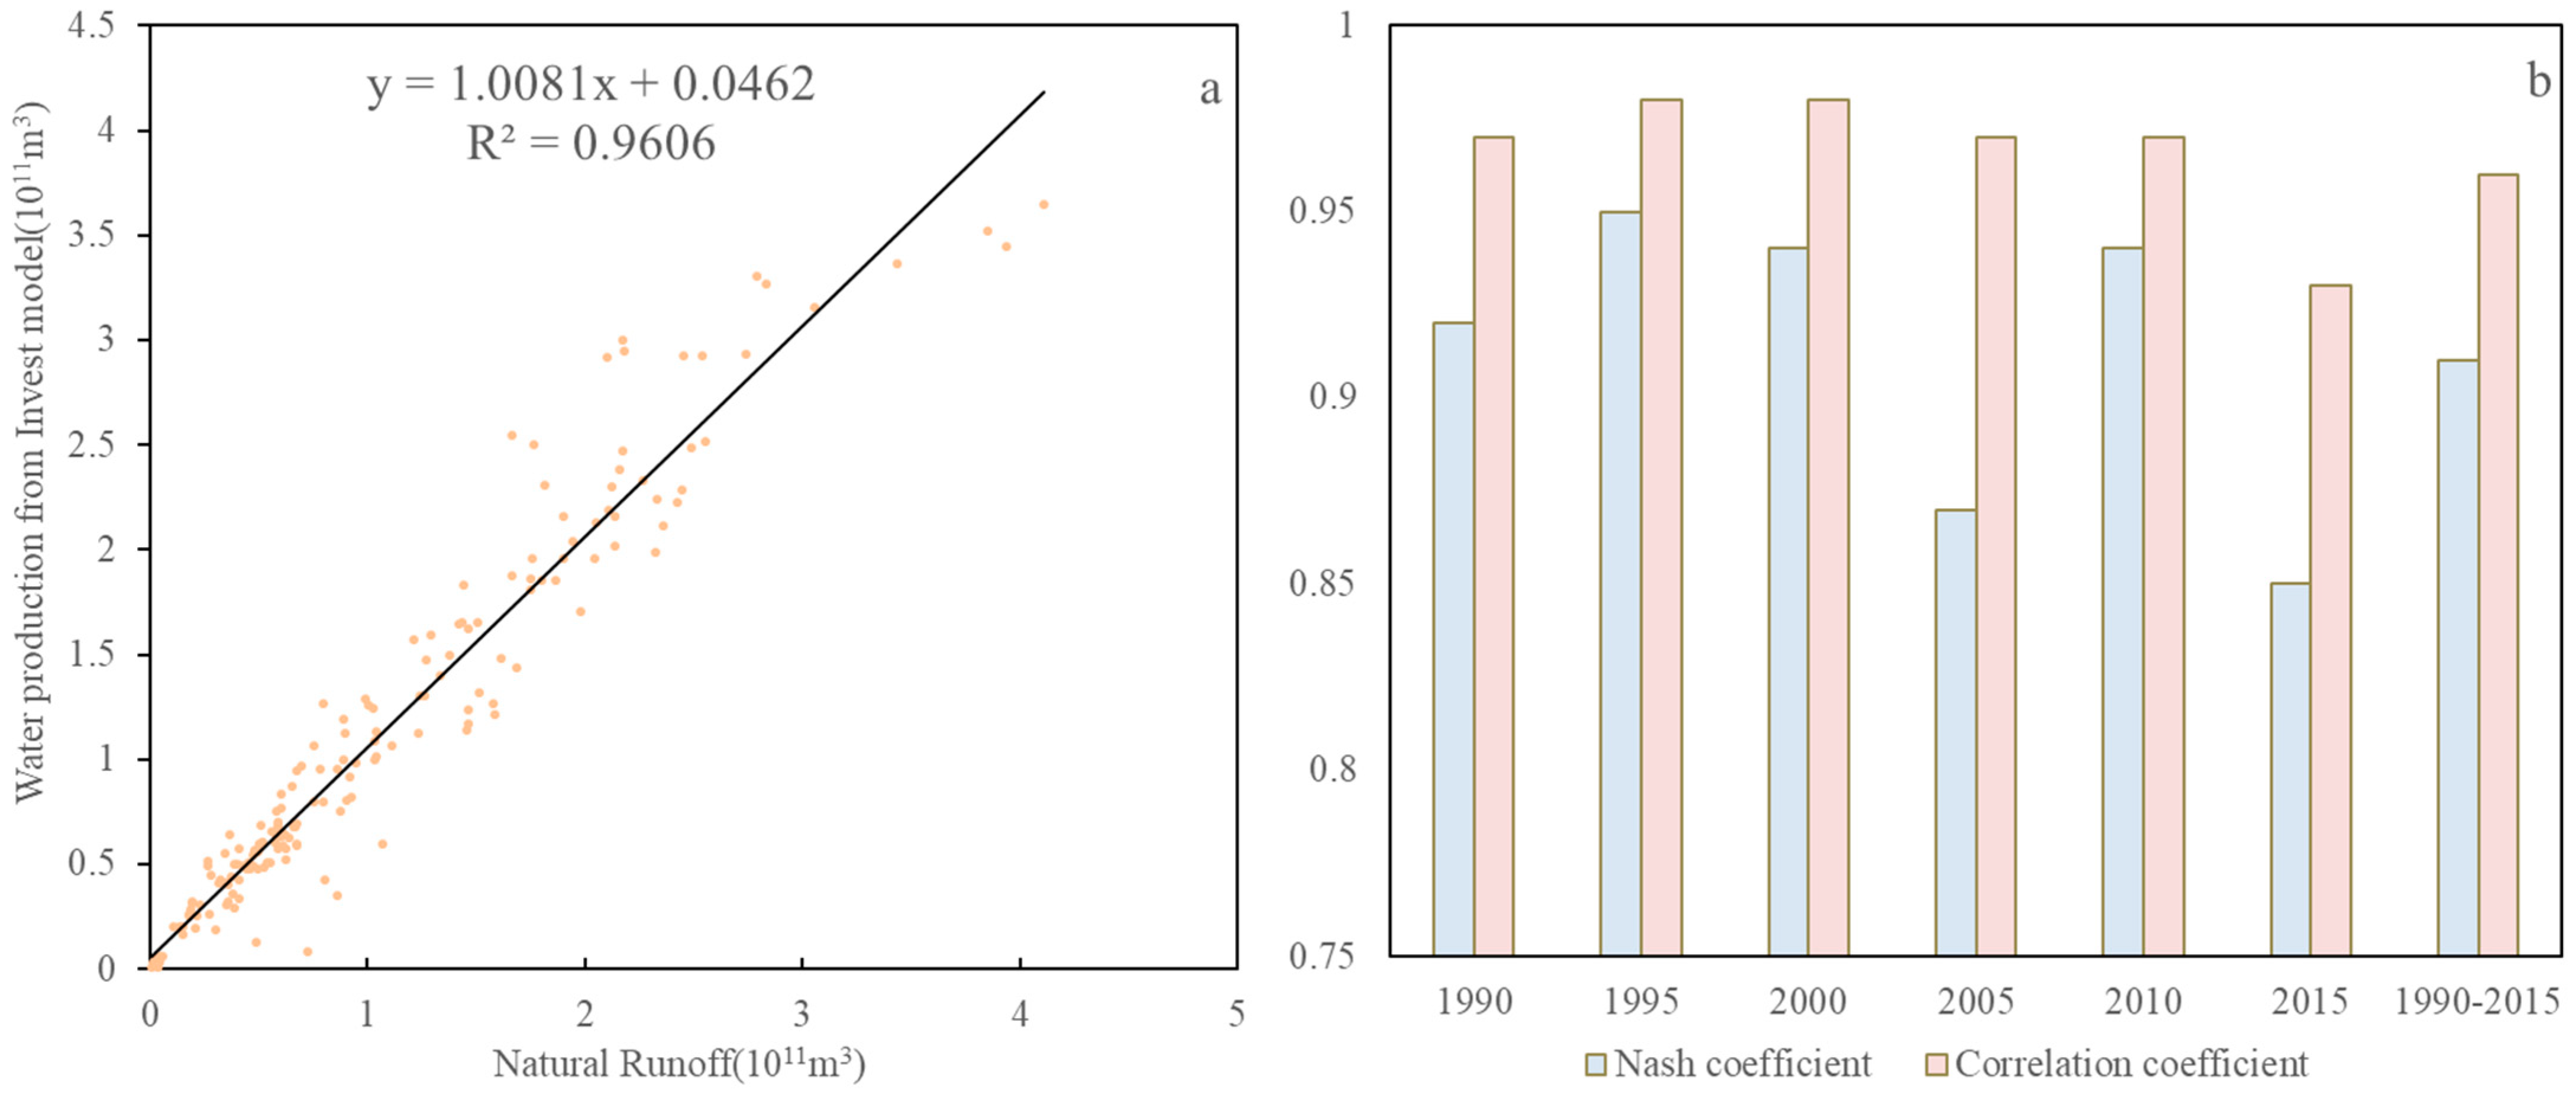
To evaluate model performance [28,41,42], we compared InVEST-derived water yield estimates against observed runoff data from the CNRD v1.0 dataset (1961–2018). Provincial-scale annual runoff values for 1990–2015 were extracted using ArcGIS zonal statistics, with corresponding model outputs calculated for benchmark years (1990, 1995, 2000, 2005, 2010, 2015). Statistical validation revealed strong agreement between the simulated and observed values: correlation coefficients consistently exceeded 0.9 (reaching > 0.97 during 1990–2010), while the Nash–Sutcliffe efficiency (NSE) values remained above 0.85. Linear regression analysis demonstrated excellent fit (R2 = 0.96, NSE = 0.91) across the entire study period (1990–2015), confirming the InVEST model’s robustness for water yield and conservation simulations in China (Figure 2).

3.2. Spatiotemporal Variation Characteristics of Water Conservation in China

Figure 3 presents the spatial distribution of water conservation across China’s major river basins from 1990 to 2020. From 1990 to 2020, water conservation in China exhibited a clear northwest–southeast increasing gradient. The Southeast and Pearl River Basins had the highest capacities (517.21 mm/year and 483.68 mm/year), followed by the Yangtze and Southwest Basins. Northern and inland basins showed much lower values, with the Inland Basin at just 15.88 mm/year. These patterns highlight strong spatial heterogeneity across basins.
Temporally, China’s overall water conservation capacity fluctuated considerably during the study period. The national average peaked in 2020 (130.98 mm) and dipped in 2015 (113.04 mm), with alternating declines (1995, 2000) and recoveries (2005, 2010). Temporal patterns varied by basin. Northern basins (e.g., Songliao, Haihe) shared 2015 as the driest year, while peak years ranged from 1990 to 2020 across basins. Notable extremes occurred in the Southeast (636.88 mm in 2010) and Pearl River Basins (553.22 mm in 2015).
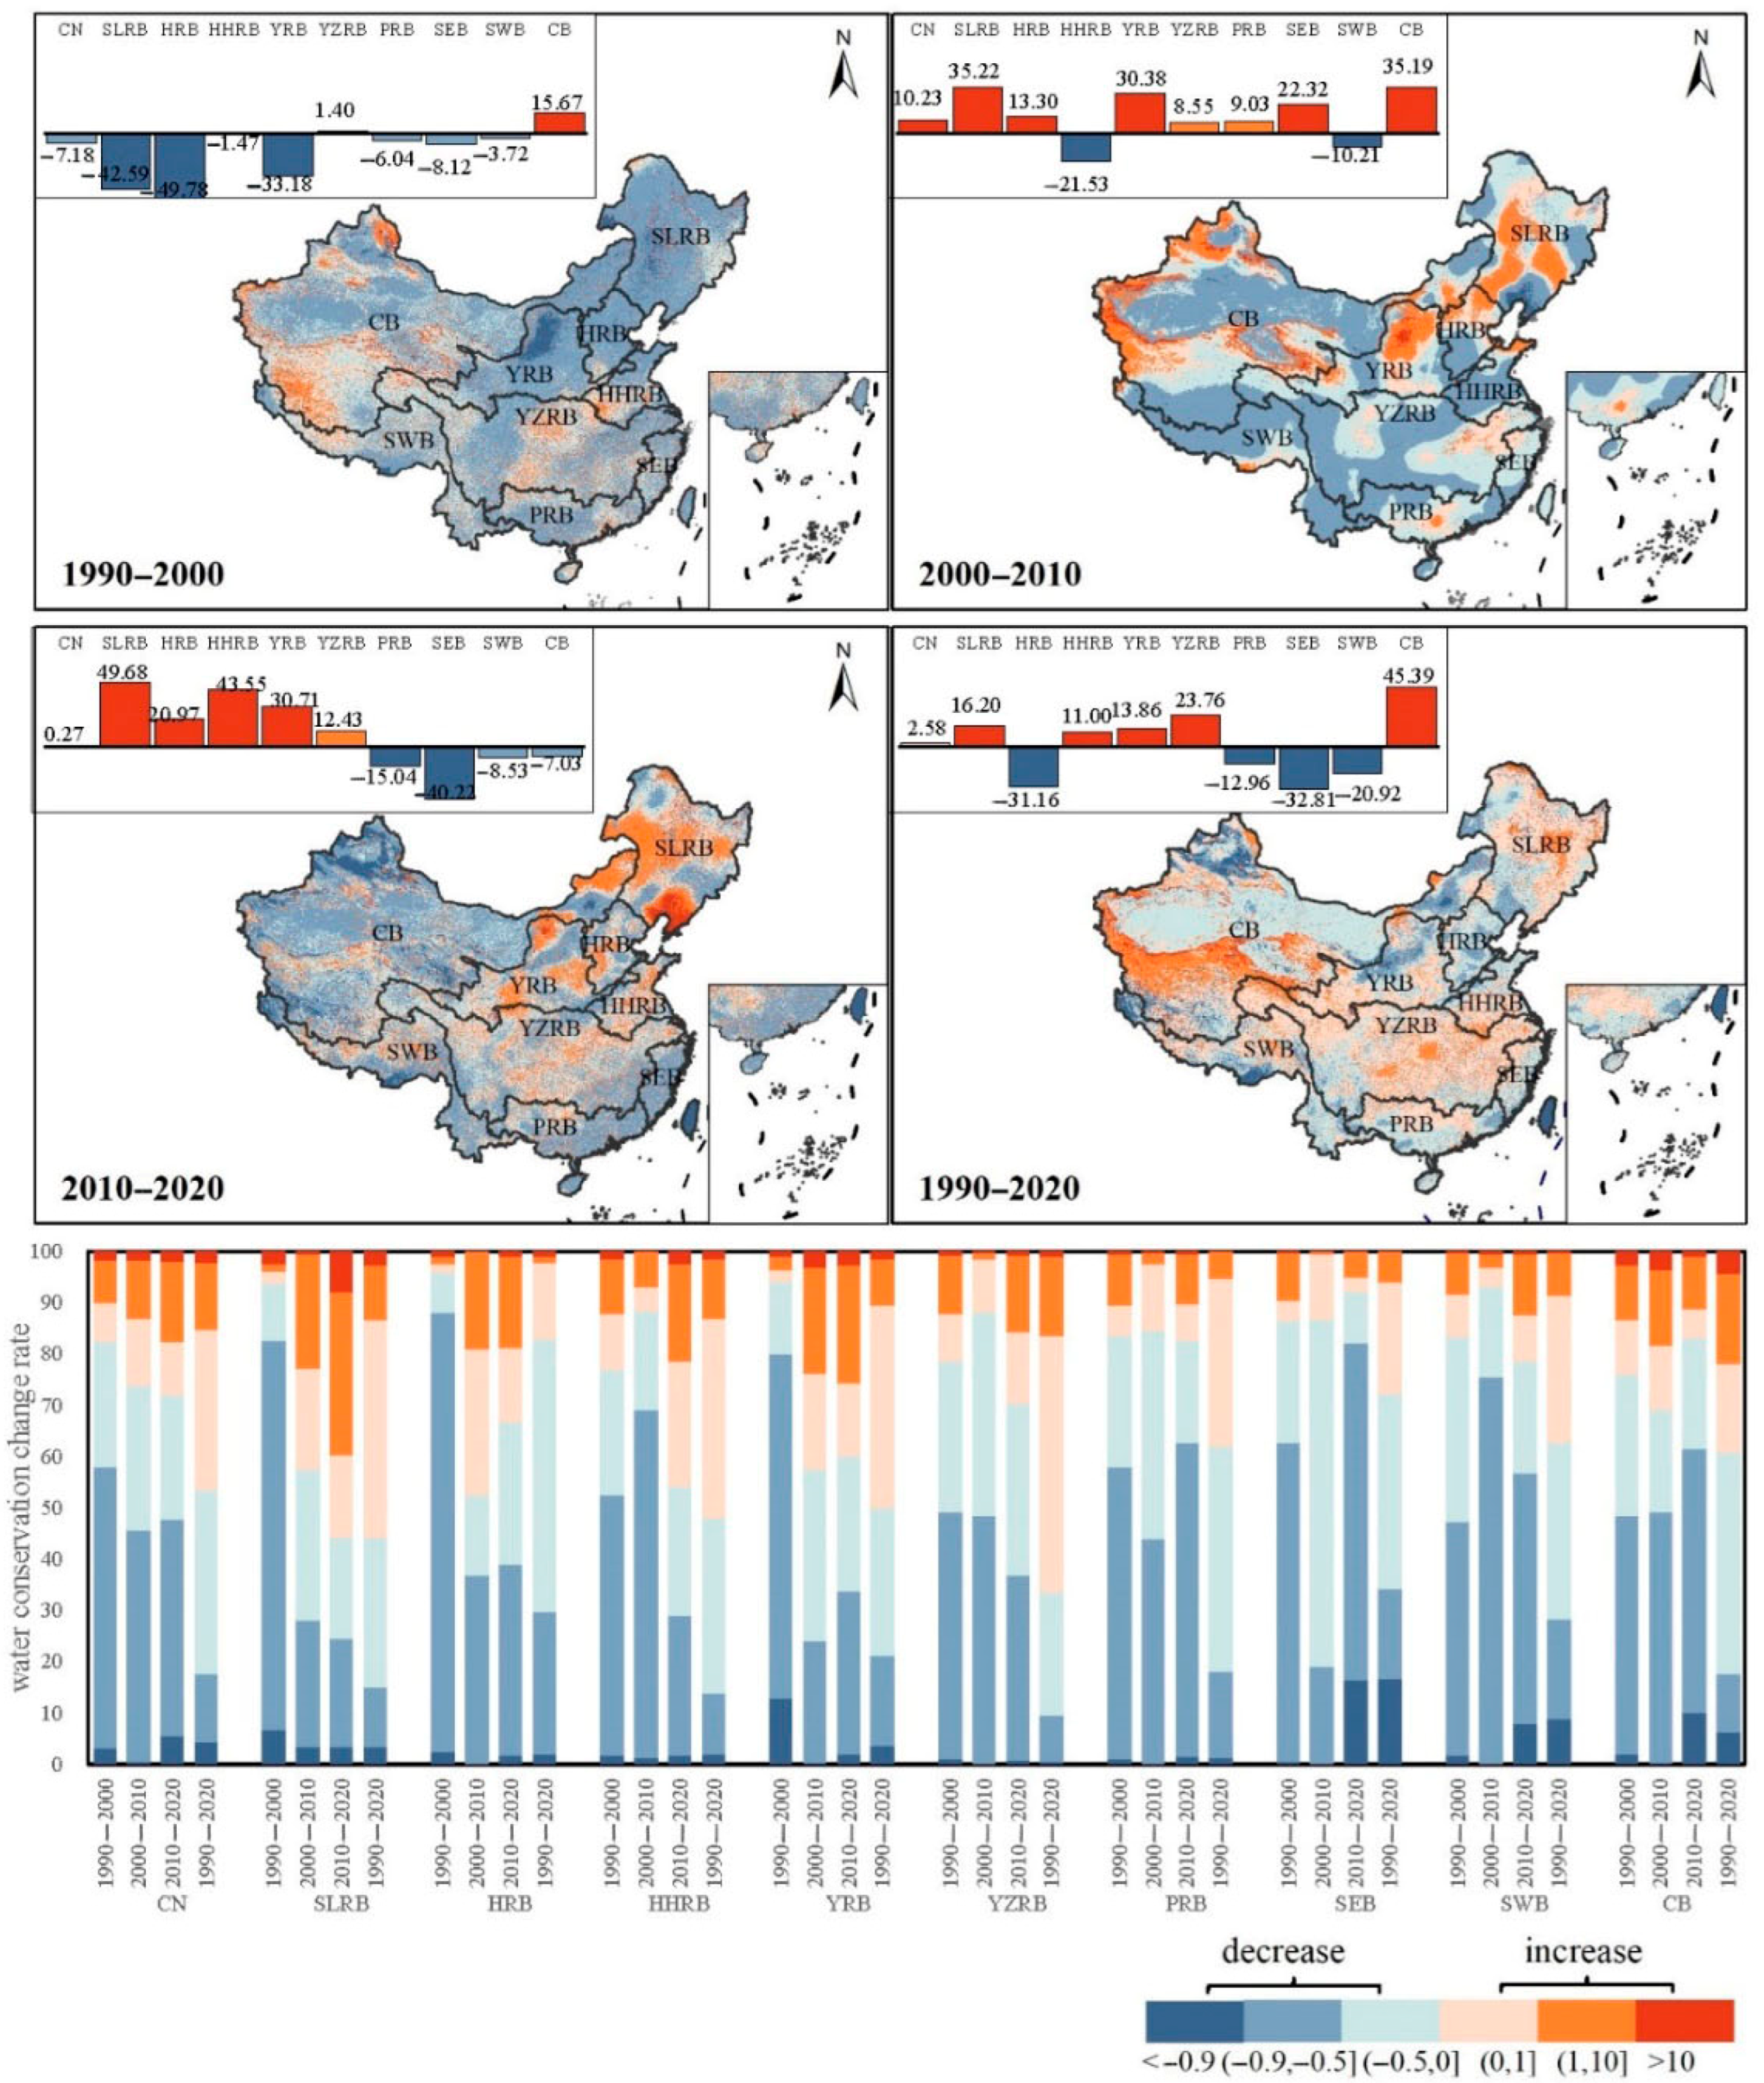
Figure 4 illustrates the temporal variations in water conservation across China’s major river basins from 1990 to 2020. Five basins (Songliao, Huaihe, Yellow, Yangtze, Inland) showed net increases, while four (Haihe, Pearl, Southeast, Southwest) showed decreases. Increasing basins had mixed trends, with the Yangtze showing steady growth. The Southwest Basin saw a continuous decline over the 30-year period.
To better interpret spatiotemporal patterns, water conservation change rates were classified into six categories using natural breaks: significant/obvious/slight increases and decreases. Nationally, over 50% of the land area showed declining trends, with slight decreases being most prevalent. This pattern was most evident in 1990–2000, when over 80% of areas experienced reductions, followed by 70%+ in the next two decades, mainly as obvious decreases.
At the basin level, six basins (Haihe, Yellow, Pearl, Southeast, Southwest, and Inland Rivers) had more than half of their areas declining in most periods. For instance, from 1990–2000, 95.88% of the Haihe Basin and 93.98% of the Yellow River Basin experienced decreases, with 85.71% and 66.98% categorized as obvious, respectively. The Pearl River Basin peaked in decline during 2000–2010 (84.61%), split between obvious (43.83%) and slight (40.72%) reductions.
In contrast, the Songliao, Huaihe, and Yangtze Basins showed more mixed trends. Notably, the Yangtze Basin recorded a net increase over 1990–2020 in 66.38% of its area (mostly slight increases), though it also experienced significant declines during 2000–2010 (88.19%). These results reveal basin-specific responses to environmental and anthropogenic changes over the past 30 years.

3.3. Analysis of Driving Factors of Spatiotemporal Variation in Water Conservation

3.3.1. Factor Detection Results

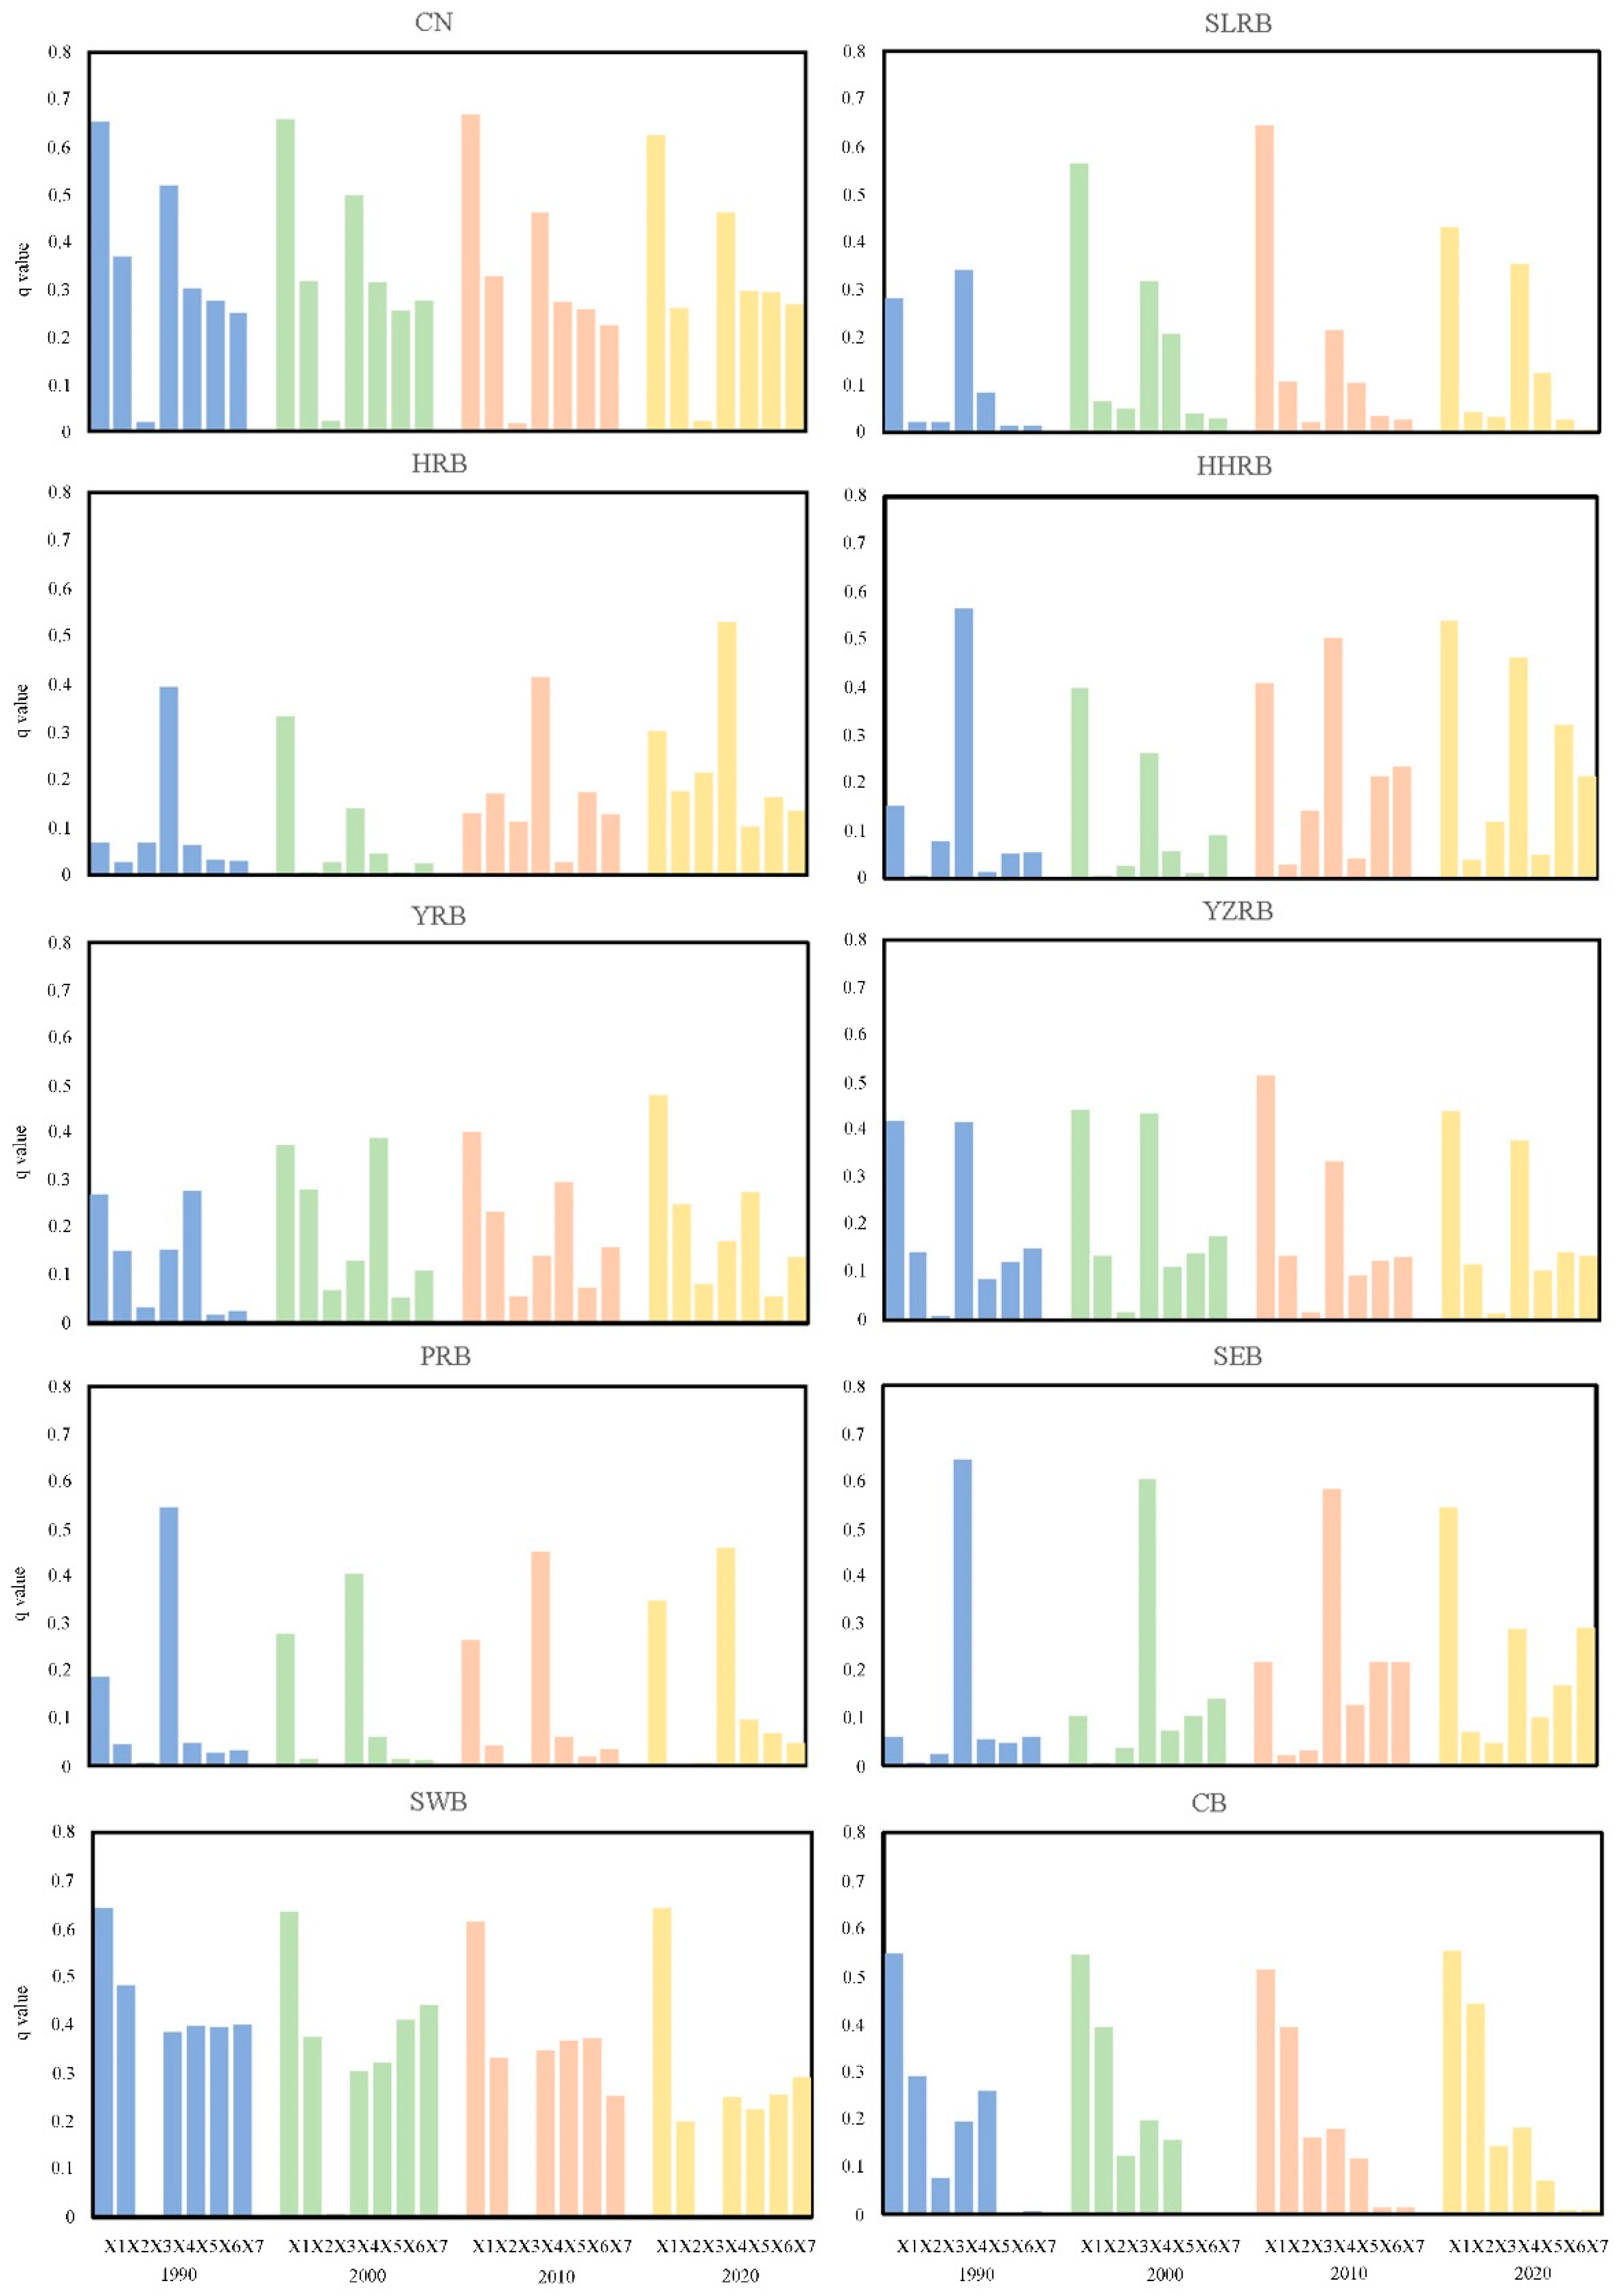
Figure 5 presents the dominant driving factors and their q-values for water conservation from 1990 to 2020. Overall, all considered factors have a statistically significant influence on water conservation (q-values > 0.1). Among them, precipitation and land use type are the most influential and remain the core driving forces of water conservation across China. Their q-values in the four study years are as follows: precipitation (0.65, 0.66, 0.67, 0.63) and land use (0.52, 0.50, 0.46, 0.46), indicating their strong and stable explanatory power over time. Additionally, temperature, NDVI, population, and GDP have moderate influences (q-values between 0.2 and 0.3), while slope shows the weakest impact, with q-values consistently below 0.023—likely due to its spatial stability or limited influence on surface runoff at the 1 km scale.
The dominant factors influencing water conservation displayed notable variation across different river basins during 1990–2020. In five basins (Songliao, Haihe, Huaihe, Yangtze, and Southeast Rivers), precipitation and land use type jointly served as primary determinants, with other factors playing relatively minor roles. The Yellow River Basin showed a distinctive pattern where precipitation stood as the dominant factor, while temperature, land use, and NDVI contributed secondary influences. Similarly, in the Southwest Rivers Basin, precipitation remained the main driver, supplemented by measurable effects from temperature, land use, NDVI, and socioeconomic factors (population and GDP). The Pearl River Basin presented a unique case where land use type surpassed precipitation as the principal factor. In the arid Inland Rivers Basin, precipitation maintained primary importance, followed by temperature as a secondary factor, with land use and NDVI providing additional contributions. Despite these basin-specific variations, our analysis confirms that precipitation and land use type consistently served as the two most critical factors governing water conservation across all major Chinese river basins during the study period.

3.3.2. Interaction Effects Among Driving Factors

Figure 6 displays the interaction detection results for water conservation influencing factors from 1990 to 2020. The analysis reveals that factor interactions predominantly exhibit two distinct patterns: two-factor enhancement and nonlinear enhancement. This indicates that the combined effect of any two factors on water conservation consistently exceeds the influence of individual factors acting alone. At the national scale, the interaction between precipitation and land use type demonstrates the strongest synergistic effect, with a maximum q-value reaching 0.88. Precipitation also shows considerable interactive effects when paired with other factors, maintaining q-values above 0.69 across all combinations. Similarly, temperature and land use type exhibit notable interaction strengths when combined with other variables, consistently yielding q-values exceeding 0.41 and 0.42, respectively.
The interaction effects display distinct spatial variations across different river basins. While the precipitation–land use type interaction remains the most influential combination in all basins, several regional patterns emerge: In the Songliao River Basin, Yellow River Basin, Southwest Rivers Basin, and Inland Rivers Basin, precipitation demonstrates particularly strong interactions with other environmental factors. Conversely, the Haihe River Basin, Huaihe River Basin, Pearl River Basin, and Southeast Rivers Basin show more pronounced interactions between land use type and other variables. The Yangtze River Basin presents a unique case where precipitation, land use type, and other factors all maintain strong mutual interactions. These basin-specific interaction patterns highlight the complex, spatially heterogeneous nature of how multiple environmental factors jointly influence water conservation capacity across China’s diverse hydrological regions.

3.3.3. Zoning of Water Conservation Intensity

To better characterize regional differences in water conservation capacity, this study proposes the water conservation rate index, defined as the ratio of regional water conservation to precipitation over a given spatiotemporal scale. This index effectively quantifies an ecosystem’s integrated capacity for precipitation interception, runoff regulation, and water retention [5,43,44]. 
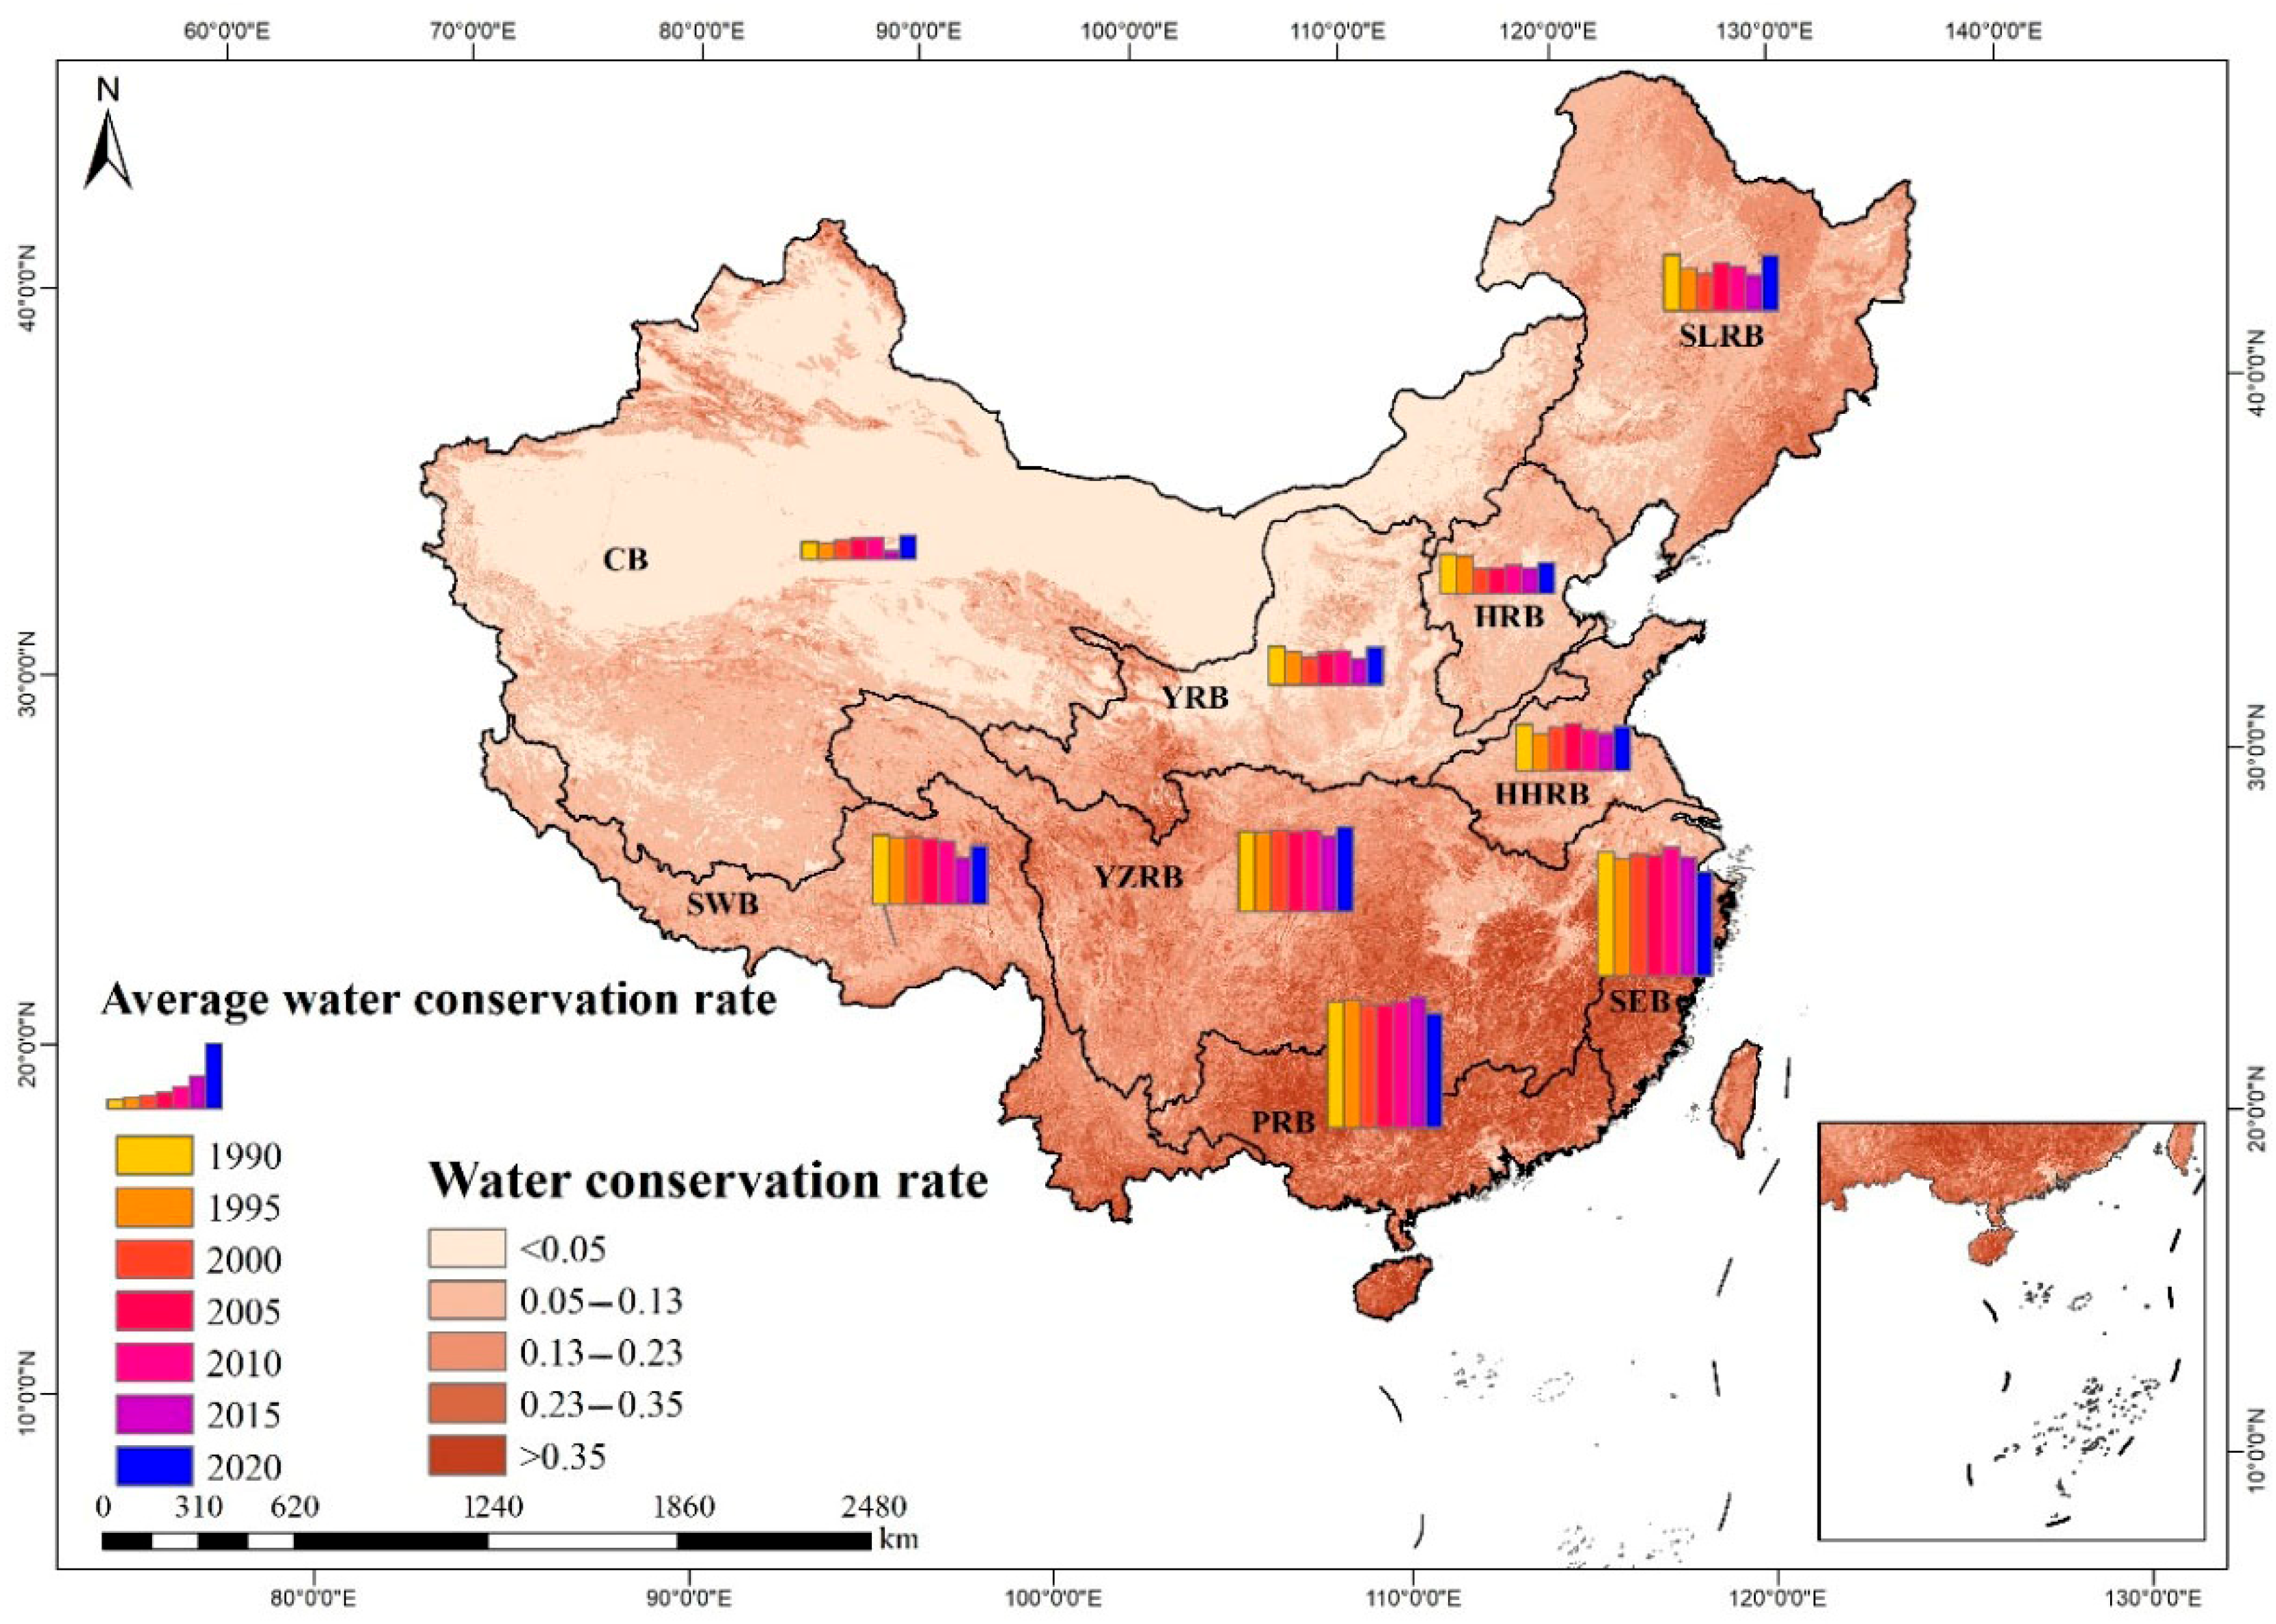
Figure 7 illustrates the spatiotemporal distribution of water conservation rates across China from 1990 to 2020. The results reveal a clear spatial pattern consistent with both precipitation and water conservation distributions, showing a distinct northwest-to-southeast increasing gradient. Temporally, the lowest values occurred in 2015 while the highest appeared in 2020, with an overall decreasing trend from 1995 to 2000 followed by recovery from 2005 to 2010.
The analysis identifies three distinct zones of water conservation efficiency: High-efficiency zones (Southeast Rivers, Pearl River, and Yangtze River Basins) benefit from abundant rainfall and extensive forest coverage, while low-efficiency zones (Inland Rivers, Yellow River, and Haihe River Basins) suffer from both precipitation scarcity and limited vegetation. A higher water conservation rate indicates superior ecosystem performance in the following: (1) retaining precipitation within the watershed, (2) mitigating flood risks through reduced surface runoff, and (3) sustaining base flow during dry periods to maintain river networks and groundwater recharge. These functions are critically important for maintaining regional water resource sustainability and ensuring long-term water security across China’s diverse hydrological regions. The spatial–temporal patterns of water conservation rates provide valuable insights for developing targeted watershed management strategies based on local ecosystem characteristics and hydrological conditions.

4. Discussion

4.1. The Fundamental Role of Precipitation in Water Conservation

Water conservation represents a critical ecosystem service, encompassing the processes and capacities through which natural systems retain water via precipitation interception and storage within specific spatiotemporal contexts [45,46]. Our analysis (Figure 3 and Figure 8) reveals a pronounced spatial congruence between precipitation patterns and water conservation capacity across China, with both exhibiting a characteristic southeast-to-northwest decreasing gradient. This alignment is particularly evident when comparing basin-specific patterns: high-precipitation basins (Southeast Rivers, Pearl River, Yangtze River, Southwest Rivers, and Huaihe River) consistently demonstrate superior water conservation performance, while their low-precipitation counterparts (Songliao River, Haihe River, Yellow River, and Inland Rivers) show markedly reduced capacities. The temporal analysis further confirms this relationship, with 2020 (peak precipitation year) and 2015 (minimum precipitation year) corresponding precisely to the highest and lowest water conservation values, respectively, across all basins. These observations corroborate previous findings by Jiang et al. [45], Sun et al. [46], and Yan et al. [47], demonstrating that enhanced precipitation generally strengthens water conservation potential, particularly in well-vegetated regions [43,44,47,48].
While precipitation establishes the fundamental water input, our results emphasize that land cover characteristics critically mediate its conversion into conserved water [48,49,50]. When precipitation intensity surpasses surface infiltration capacity—a frequent occurrence in impervious or compacted areas—the excess transforms into surface runoff rather than contributing to water conservation. This mechanism explains why moderate, sustained rainfall events typically prove more effective than intense storms for groundwater recharge and ecosystem water storage. Our factor analysis (Section 3.3) reveals important regional variations in these relationships: precipitation dominates water conservation dynamics in the Songliao River, Southwest Rivers, and Inland Rivers Basins, whereas the Huaihe River, Yellow River, and Yangtze River Basins demonstrate more balanced influences from both precipitation and land use factors. These differential patterns underscore how local meteorological conditions and land cover characteristics interact to shape basin-specific water conservation responses, suggesting that water management strategies must account for these contextual differences to optimize conservation outcomes.
Moreover, precipitation not only serves as a direct hydrological input but also plays a significant role in shaping land use patterns, especially in regions where human activity is sensitive to climatic variability. In water-abundant areas, stable and sufficient rainfall supports dense vegetation, drives agricultural expansion, and fosters afforestation or forest conservation efforts. Conversely, limited rainfall in arid and semi-arid zones constrains vegetation growth and often leads to the conversion of land to drought-resistant uses such as grasslands or bare soil. These responses are further modulated by human adaptation strategies, including irrigation development and land use regulation.
The interaction detection results reinforce this coupling effect, showing that the synergy between precipitation and land use exerts the strongest combined influence on water conservation (q-value = 0.88), surpassing the explanatory power of either factor alone. For example, in the Yellow River Basin, increased precipitation in recent years, coupled with large-scale ecological restoration projects like the Grain for Green program, significantly improved vegetation cover and enhanced soil infiltration, thereby increasing water retention. In contrast, the Pearl River Basin experienced declining water conservation despite stable rainfall, primarily due to rapid urbanization and impervious surface expansion.
These findings highlight the necessity of integrating climatic variables and land use policy in ecosystem management. Coordinated planning that addresses both natural and anthropogenic drivers is crucial for sustaining and enhancing regional water conservation services.

4.2. The Influence of Land Use Patterns on Water Conservation Capacity

While climate factors like precipitation establish the broad spatial patterns of water conservation [51], our analysis demonstrates that land use characteristics critically modify these patterns through their effects on hydrological processes. Different land cover types create distinct underlying surface conditions that influence precipitation interception, infiltration rates, water storage potential, and evapotranspiration losses [52,53]. Forest ecosystems, with their multi-layered canopy structures, thick litter layers, and deep root systems, exhibit superior water retention capabilities compared to other vegetation types. Grasslands, despite having good surface coverage, show more limited conservation potential due to shallower root depths. Urbanized areas dominated by impervious surfaces generate rapid runoff with minimal water retention [54]. These fundamental relationships are clearly reflected in our basin-scale comparisons: the Pearl River and Southeast Rivers Basins, characterized by extensive forest coverage, demonstrate both strong land use influences on water conservation and high absolute conservation values due to combined favorable precipitation and vegetation conditions. Conversely, the Inland Rivers Basin, with its predominance of barren land and sparse vegetation, shows minimal land use impacts and low conservation capacity, constrained further by arid conditions (Figure 9).
China’s dramatic land cover transformations from 1990 to 2020, driven by urbanization and ecological restoration efforts, have created complex temporal patterns in water conservation responses. The implementation of major conservation initiatives (e.g., Three-North Shelterbelt, Yangtze River Protection) since 2000 has significantly altered vegetation patterns across multiple basins. In the Pearl River and Southeast Rivers Basins, urban expansion has reduced forest cover while increasing impervious surfaces, corresponding with decreased water conservation despite high precipitation. Contrastingly, the Yellow River Basin shows increased conservation associated with vegetation recovery, highlighting the positive effects of ecological projects. Some basins present more complex interactions—the Songliao and Huaihe River Basins show increased conservation despite vegetation loss, likely due to compensating precipitation increases, while the Haihe and Southwest Rivers Basins demonstrate decreased conservation from combined grassland reduction and rainfall declines, suggesting forest expansion may have been insufficient to offset these changes. These differential responses underscore the importance of considering both land use transitions and climatic variations when assessing long-term water conservation trends and implementing regional water management strategies.

4.3. Synergistic Effects of Multiple Factors on Water Conservation

Our interaction analysis (Figure 6) reveals that water conservation dynamics are predominantly governed by two types of factor relationships: nonlinear enhancement and two-factor enhancement, where combined influences consistently surpass individual factor effects. Across all study regions, the precipitation–land use interaction emerges as the most powerful determinant of water conservation patterns, though substantial synergistic effects also exist between precipitation, land use, and secondary factors. These findings from both single-factor and interaction analyses collectively establish precipitation and land use as the primary drivers of spatial heterogeneity in water conservation services, aligning with established research [49,51,53]. Importantly, the complex nature of water conservation processes means additional factors—including temperature, slope gradient, vegetation vigor (NDVI), and population density—contribute meaningfully to observed spatial variations, though their individual impacts are comparatively modest.
The interaction results provide critical insights for ecosystem management by demonstrating how climate, land cover, and human activities jointly regulate water conservation efficiency. In well-vegetated systems, precipitation is effectively retained through multi-layer interception (canopy, litter, soil) with high conversion rates to conserved water. Conversely, impervious surfaces in urbanized or barren areas promote rapid runoff generation regardless of precipitation amounts, severely limiting conservation potential. These mechanistic understandings suggest divergent management strategies across China’s major basins: In high-rainfall, forested regions like the Southeast and Pearl River Basins, conservation efforts should focus on maintaining existing vegetation structure and hydrological connectivity. For arid regions such as the Inland Rivers Basin with limited precipitation and poor soil permeability, interventions should prioritize increasing grassland cover to enhance interception capacity and soil infiltration rates. Such targeted approaches, accounting for regional differences in dominant factor interactions, will be essential for optimizing water conservation outcomes amid changing climatic and land use conditions.

4.4. Policy Implications and Extended Interpretations

Although our findings reaffirm that precipitation and land use are the dominant drivers of water conservation, this study provides deeper insights by analyzing spatial heterogeneity, temporal dynamics, and factor interactions. From 1990 to 2020, these two factors consistently showed the highest explanatory power nationwide (q-values of 0.65–0.67 for precipitation and 0.46–0.52 for land use), yet their influence varied across regions. In arid and semi-arid basins such as the Yellow River, temperature and NDVI also played significant roles due to their effects on evapotranspiration and vegetation coverage—further strengthened by ecological policies like the “Grain for Green” program. In contrast, in basins like the Pearl River and Southeast Rivers, rapid urbanization led to stronger impacts from land use changes.
Interaction detection revealed that most factor combinations exhibited bivariate or nonlinear enhancement, especially between precipitation and land use (q = 0.88). These results highlight the importance of considering factor synergies rather than analyzing each driver in isolation. For instance, in the Yangtze River Basin, both natural factors (precipitation) and anthropogenic influences (land use, GDP) showed strong interactive effects due to the region’s diverse environments and the impact of national projects such as the South-to-North Water Diversion.
The results underscore the need for regionally differentiated policy responses that consider both dominant drivers and their interactions. In semi-arid basins like the Yellow River, ecological restoration and climate-adaptive land management (e.g., reforestation, sustainable agriculture) should be prioritized to enhance vegetation resilience and evapotranspiration regulation. In urbanized or rapidly developing basins (e.g., Haihe, Pearl), policies should focus on controlling impervious surface expansion, enforcing land use zoning, and promoting nature-based solutions such as urban green infrastructure.
Furthermore, major inter-basin projects like the South-to-North Water Diversion should integrate ecological compensation mechanisms and cumulative impact assessments to avoid unintended disruptions to local hydrological functions. National land and water policies must also incorporate spatial heterogeneity and factor interactions, ensuring that land planning aligns with hydrological sustainability. Geodetector’s results provide a scientific foundation to guide such policies and help optimize resource allocation for water conservation.
In addition to its hydrological significance, changes in water conservation capacity may exert profound impacts on ecosystem health. A persistent decline in water retention capacity, particularly in ecologically fragile regions such as the Yellow River and Southwest basins, could aggravate soil erosion, reduce base flow during dry seasons, and disrupt aquatic habitat stability. These changes may, in turn, negatively affect biodiversity, especially species dependent on stable hydrological regimes.
Moreover, decreased water conservation can lead to reduced groundwater recharge and increased surface runoff, elevating the risk of non-point source pollution and deteriorating water quality in downstream areas. This is particularly concerning in rapidly urbanizing basins, such as the Pearl and Haihe River Basins, where intensified land use and impervious surfaces exacerbate hydrological imbalances.
Therefore, maintaining and enhancing regional water conservation is not only vital for water supply regulation but also crucial for safeguarding biodiversity, ecological resilience, and long-term water quality. Integrated land use planning, ecological restoration, and climate-adaptive water governance are essential to mitigate these potential risks and ensure the sustainability of hydrological ecosystem services.

4.5. Limitations

This study systematically evaluated water conservation patterns across China’s major river basins using the InVEST model and geodetector analysis, yet several limitations merit discussion. The water conservation process involves complex hydrological interactions that current modeling approaches simplify—the InVEST model’s static parameterization of evapotranspiration and infiltration processes [3,6,7] may not fully capture dynamic ecosystem responses. Data constraints limited model validation to the CNRD v1.0 dataset (1961–2018), preventing verification of recent years (2016–2020). Furthermore, our analysis of human impacts focused primarily on land use changes while overlooking finer-scale activities like reservoir operations and agricultural water withdrawals that significantly alter hydrological regimes.
Future research should prioritize three key improvements to address these limitations. Firstly, integrating process-based models like SWAT with InVEST could enhance the physical representation of key hydrological processes. Secondly, incorporating detailed human activity data (e.g., irrigation withdrawals, dam operations) would better quantify anthropogenic influences on water conservation. Finally, adopting continuous time-series analysis rather than decadal snapshots would provide more robust characterization of long-term trends. These methodological advances would significantly improve our understanding of water conservation dynamics and support more effective water resource management across China’s diverse basins.

5. Conclusions

This study systematically evaluates the spatiotemporal patterns and driving mechanisms of water conservation across China’s nine major river basins from 1990 to 2020, revealing three key findings: (1) water conservation exhibits a distinct northwest-to-southeast increasing gradient, with extensive low-value areas dominating arid northwestern regions and peak values occurring in 2020 (30.98 mm) versus minimum levels in 2015 (113.04 mm); (2) basin-scale analysis identifies the Southeast Rivers and Pearl River Basins as conservation hotspots, while the Inland Rivers, Yellow River, and Haihe River Basins show limited capacity, with most basins experiencing declining trends (primarily slight-to-moderate decreases) that closely follow precipitation patterns; and (3) precipitation and land use emerge as dominant controls, where southeastern basins (Southeast Rivers, Yangtze, Pearl, and Southwest Rivers) benefit from synergistic high rainfall and vegetation cover, whereas the arid Inland Rivers Basin requires targeted vegetation restoration within its water-carrying capacity to enhance conservation function. These findings underscore the necessity for regionally tailored water management strategies that address both climatic constraints and land use impacts.

Author Contributions

All of the authors contributed significantly to this manuscript. Methodology, software, data processing, investigation, validation, writing—original draft, Q.Z.; conceptualization, methodology, writing—review, editing, fundraising, supervision, project administration, Y.B. All authors have read and agreed to the published version of the manuscript.

Funding

This research was funded by the National Natural Science Foundation of China (Grant No. 42261079 and 42461021), the Natural Science Foundation of Inner Mongolia Autonomous Region of China (Grant No. 2024MS03048), the First-Class Discipline Research Special Project (Grant No. YLXKZX-NSD-033 and YLXKZX-NSD-029), the Central Guidance for Local Scientific and Technological Development Fund (Grant No. 2024XY0035), and the Program for Young Talents of Science and Technology in Universities of Inner Mongolia Autonomous Region (Grant No. NJYT23019).

Institutional Review Board Statement

Not applicable.

Informed Consent Statement

Not applicable.

Data Availability Statement

Data are contained within the article.

Conflicts of Interest

The authors declare no conflicts of interest.

References

  1. Chen, Y.; Li, Y.; Li, Z.; Liu, Y.; Huang, W.; Liu, X.; Feng, M. Analysis of the Impact of Global Climate Change on Dryland Areas. Adv. Earth Sci. 2022, 37, 111–119. [Google Scholar]
  2. Lü, Y.; Hu, J.; Sun, F.; Zhang, L. Water retention and hydrological regulation: Harmony but not the same in terrestrial hydrological ecosystem services. Acta Ecol. Sin. 2015, 35, 5191–5196. [Google Scholar]
  3. Wang, Y.; Ye, A.; Qiao, F. The review on service of water retention and computing method. South North Water Transf. Water Sci. Technol. 2021, 19, 1041–1071. [Google Scholar]
  4. Yu, D.; Han, S. Ecosystem service status and changes of degraded natural reserves—A study from the Changbai Mountain Natural Reserve, China. Ecosyst. Serv. 2016, 20, 56–65. [Google Scholar] [CrossRef]
  5. Zhang, C.; Xie, G.; Liu, C.; Fan, N.; Wang, X. Evaluation of water conservation of China’s ecosystems based on benchmark. Acta Ecol. Sin. 2022, 42, 9250–9260. [Google Scholar]
  6. Zuo, Q.; Wang, J.; Yang, F.; Song, Q. Analysis of water conservation and calculation methods of water conservation capacity. Adv. Sci. Technol. Water Resour. 2022, 42, 13–19. [Google Scholar]
  7. Lü, L.; Ren, T.; Sun, C.; Zheng, D.; Wang, H. Spatial and temporal changes of water supply and water conservation function in Sanjiangyuan National Park from 1980 to 2016. Acta Ecol. Sin. 2020, 40, 993–1003. [Google Scholar]
  8. Yang, B.; Thomas, O.; Ochuodhoa; Jian, Y. Impact of land use and climate change on water-related ecosystem services in Kentucky, USA. Ecol. Indic. 2019, 102, 51–64. [Google Scholar]
  9. Capdevila, J.; Gampe, D.; García, H. Impact and mitigation of global change on freshwater-related ecosystem services in Southern Europe. Sci. Total Environ. 2012, 440, 140–153. [Google Scholar]
  10. Burt, T.; Swank, W. Flow frequency responses to hardwood-to-grass conversion and subsequent SUC-cession. Hydrol. Process. 1992, 6, 179–188. [Google Scholar] [CrossRef]
  11. Bosch, J.; Hewlett, J. A review of catchment experiments to determine the effect of vegetation changes on water yield and evapotranspiration. J. Hydrol. 1982, 55, 3–23. [Google Scholar] [CrossRef]
  12. Gash, J. An analytical model of rainfall interception by forests. Q. J. R. Meteorol. Soc. 1979, 105, 43–55. [Google Scholar] [CrossRef]
  13. Lan, X.; Ye, C.; Wang, Y.; Zeng, T.; Sun, J. Spatiotemporal Variation Characteristics and Its Driving Forces of Water Conservation Function on the Tibetan Plateau from 1995 to 2014. Acta Agrestia Sin. 2021, 29, 80–92. [Google Scholar]
  14. Liu, Y.; Liu, X.; Zhang, B.; Li, M. Spatial features analysis of water conservation function in the hilly areas of the Loess Plateau based on InVEST model. Acta Ecol. Sin. 2020, 40, 6161–6170. [Google Scholar]
  15. Pan, T.; Wu, S.; Dai, E. Spatiotemporal variation of water source supply service in Three Rivers Source Area of China based on InVEST model. Chin. J. Appl. Ecol. 2013, 24, 183–189. [Google Scholar]
  16. Xue, J.; Li, Z.; Feng, Q. Spatiotemporal variation characteristics of water conservation amount in the Qilian Mountains from 1980 to 2017. J. Glaciol. Geocryol. 2022, 44, 1–13. [Google Scholar]
  17. Wang, J.; Xu, C. Geodetector: Principle and prospective. Acta Geogr. Sin. 2017, 72, 116–134. [Google Scholar]
  18. Hu, A.; Wu, Y.; Huang, Y. Analysis of Supplies, Demands and Driving Forces of Ecosystem Services in Regions with High Spatial Heterogeneity: A Case Study of Sichuan Province. Resour. Environ. Yangtze Basin 2022, 31, 1062–1076. [Google Scholar]
  19. Ma, W.; Ren, P.; Zeng, Y. The Characteristics for the Spatial-Temporal Evolution of Water Conservation Value in Farmland Ecosystem in Chengdu Plain Economic Zone. China Land Sci. 2015, 29, 85–94. [Google Scholar]
  20. Fu, B.; Xu, P.; Wang, Y.; Peng, Y.; Ren, J. Spatial pattern of water retetnion in Dujiangyan county. Acta Ecol. Sin. 2013, 33, 789–797. [Google Scholar]
  21. Wu, Y.; Meng, J. Quantifying the spatial pattern for the importance of natural resource ecosystem services in China. J. Nat. Resour. 2022, 31, 17–33. [Google Scholar] [CrossRef]
  22. Costanza, R.; D’arge, R.; De Grootr, R.; Farber, S.; Grasso, M.; Hannon, B.; Limburg, K.; Naeem, S.; O’Neill, R.V.; Paruelo, J.; et al. The value of the world’s ecosystem services and natural capital. Nature 1997, 387, 253–260. [Google Scholar] [CrossRef]
  23. Zhang, X.; Li, Y.; Lyu, C. Research progress on application of ecosystem service functions based on InVEST model. Ecol. Sci. 2022, 41, 237–242. [Google Scholar]
  24. Bao, Y.; Li, T.; Liu, H.; Ma, T.; Wang, H.; Liu, K.; Shen, Q.; Liu, X. Spatial and temporal changes of water conservation of Loess Plateau in northern Shaanxi province by InVEST model. Geogr. Res. 2016, 35, 664–676. [Google Scholar]
  25. Gu, J.; Li, Y.; Du, W. Evaluation on water source conservation capacity and analysis of its variation characteristics of Taihu Lake Basin based on InVEST model. Water Resour. Prot. 2018, 34, 62–67. [Google Scholar]
  26. Wang, B.; Chen, H.; Dong, Z. Impact of land use change on the water conservation service of ecosystems in the urban agglomeration of the Golden Triangle of Southern Fujian, China, in 2030. Acta Ecol. Sin. 2020, 40, 484–498. [Google Scholar]
  27. Li, J.; Dong, S.; Li, Y.; Wang, Y.; Li, Z.; Li, F. Effects of land use change on ecosystem services in the China–Mongolia–Russia economic corridor. J. Clean. Prod. 2022, 360, 132175. [Google Scholar] [CrossRef]
  28. Wu, C.; Qiu, D.; Gao, P.; Mu, X.; Zhao, G. Application of the InVEST model for assessing water yield and its response to precipitation and land use in the Weihe River Basin, China. J. Arid. Land 2022, 14, 426–440. [Google Scholar] [CrossRef]
  29. Sharp, R.; Tallis, H.; Guerry, A. Natural Capital Project, 2025. InVEST 3.16.1. Stanford University, University of Minnesota, Chinese Academy of Sciences, The Nature Conservancy, World Wildlife Fund, Stockholm Resilience Centre and the Royal Swedish Academy of Sciences. Available online: https://natcap.github.io/invest.release-metadata/3.16.1.html (accessed on 3 July 2025).
  30. Li, Y.; Liu, W.; Feng, Q. Quantitative Assessment for the Spatiotemporal Changes of Ecosystem Services, Tradeoff-Synergy Relationships and Drivers in the Semi-Arid Regions of China. Remote Sens. 2022, 14, 239. [Google Scholar] [CrossRef]
  31. Zhou, Q.; Yang, J.; Qiu, M.; Liu, Z. Spatial-Temporal Distribution and the Influencing Factors of Water Conservation Function in Yunnan, China. Appl. Sci. 2023, 13, 11720. [Google Scholar]
  32. Wu, Y.; Wu, Y.; Li, M. Multi-Scale Spatial Differentiation and Geographic Detection Response of Ecosystem Service Value in Sichuan-Yunnan Ecological Barrier Based on the Modifiable Areal Unit Problem. Res. Soil Water Conserv. 2023, 30, 333–342. [Google Scholar]
  33. Li, L.; Zhao, F.; Zhu, L. Geographical detection of ecosystem services trade-offs and their spatial variation mechanism in qihe river basin. Acta Ecol. Sin. 2021, 41, 7568–7578. [Google Scholar]
  34. Xiao, Y.; Zhao, L.; Zou, D. Analyses of the influence factors of permafrost distribution on the Qinghai-Tibet Plateau based on geographical detector. J. Glaciol. Geocryol. 2021, 43, 311–321. [Google Scholar]
  35. Deng, Y.; Wu, Y. Assessment on water retention function of grassland ecosystems in the Upper Yangtze River Basin. Asian J. Water Environ. Pollut. 2010, 7, 1–6. [Google Scholar]
  36. Dai, E.; Wang, Y. Attribution analysis for water yield service based on the geographical detector method: A case study of the Hengduan Mountain region. J. Geogr. Sci. 2020, 30, 1005–1020. [Google Scholar] [CrossRef]
  37. Wang, J.; Zhang, T.; Fu, B. A measure of spatial stratified heterogeneity. Ecol. Indic. 2016, 67, 250–256. [Google Scholar] [CrossRef]
  38. Gong, S.; Xiao, Y.; Zheng, H.; Xiao, Y.; Ouyang, Z. Spatial patterns of ecosystem water conservation in China and its impact factors analysis. Acta Ecol. Sin. 2017, 37, 2455–2462. [Google Scholar]
  39. Li, S.; Xie, G. Study on flow process of conservation service for typical farmland ecosystem. North. Hortic. 2014, 3, 193–196. [Google Scholar]
  40. Guo, C.; Gao, J.; Zhou, B.; Yang, J. Factors of the Ecosystem Service Value in Water Conservation Areas Considering the Natural Environment and Human Activities: A Case Study of Funiu Mountain, China. Int. J. Environ. Res. Public Health. 2021, 18, 11074. [Google Scholar] [CrossRef]
  41. Wang, Y.; Zhao, J.; Fu, J.; Wei, W. Effects of the Grain for Green Program on the water ecosystem services in an arid area of China-Using the Shiyang River Basin as an example. Ecol. Indic. 2019, 104, 659–668. [Google Scholar] [CrossRef]
  42. Wang, T.; Gong, Z. Evaluation and analysis of water conservation function of ecosystem in Shaanxi Province in China based on “Grain for Green” Projects. Environ. Sci. Pollut. Res. 2022, 29, 83878–83896. [Google Scholar] [CrossRef] [PubMed]
  43. Wei, X.; Oliver, V.; Cao, G.; Xu, L. Spatio-temporal variation of water conservation and its impact factors on the southern slope of Qilian Mountains. Reg. Sustain. 2023, 4, 54–67. [Google Scholar] [CrossRef]
  44. He, S.; Qian, H.; Liu, Y.; Zhao, X.; Su, F.; Ma, H.; Guan, Z.; Zhang, T. Water conservation assessment and its influencing factors identification using the InVEST and random forest model in the northern piedmont of the Qinling Mountains. J. Hydrol. Reg. Stud. 2025, 57, 102194. [Google Scholar] [CrossRef]
  45. Jiang, G.; Bi, L.; He, Y. Spatiotemporal variation of water conservation and its influencing factors in Zoige wetland. Sci. Technol. Eng. 2021, 21, 12688–12694. [Google Scholar]
  46. Sun, W.; Bian, J.; Li, Y.; Li, J. Water conservation capacity under climate and land use change scenarios in Changbai Mountain, China. Water Supply 2022, 22, 9005–9022. [Google Scholar] [CrossRef]
  47. Yan, X.; Cao, G.; Cao, S. Spatiotemporal variations of water conservation and its influencing factors in the Qinghai Plateau, China. Ecol. Indic. 2023, 155, 111047. [Google Scholar] [CrossRef]
  48. Guan, D.; Chen, S.; Zhang, Y.; Liu, Z.; Peng, G.; Zhou, L. Influencing factors and the establishment of a basin ecological compensation mechanism from the perspective of water conservation: A case study of the upper Yangtze River in China. J. Clean. Prod. 2024, 456, 142332. [Google Scholar] [CrossRef]
  49. Xu, F.; Zhao, L.; Jia, Y. Evaluation of water conservation function of Beijiang River basin in Nanling Mountains, China, based on WEP-L model. Ecol. Indic. 2022, 134, 108383. [Google Scholar] [CrossRef]
  50. Xue, J.; Li, Z.; Feng, Q. Spatiotemporal variations of water conservation and its influencing factors in ecological barrier region, Qinghai-Tibet Plateau. J. Hydrol. Reg. Stud. 2022, 42, 101164. [Google Scholar] [CrossRef]
  51. Wang, J.; Wu, T.; Li, Q.; Wang, S. Quantifying the effect of environmental drivers on water conservation variation in the eastern Loess Plateau, China. Ecol. Indic. 2021, 125, 107493. [Google Scholar] [CrossRef]
  52. Wu, L.; Luo, Y.; Pang, S.; Wang, G.; Ma, X. Factor analysis of hydrologic services in water-controlled grassland ecosystems by InVEST model and geodetector. Environ. Sci. Pollut. Res. Int. 2024, 31, 20409–20433. [Google Scholar] [CrossRef] [PubMed]
  53. Zhang, Y.; Zheng, H.; Chen, X. Effects of ecological restoration projects on ecosystem services flows. Ecosyst. Serv. 2024, 70, 101681. [Google Scholar] [CrossRef]
  54. Ci, M.; Ye, L.; Liao, C.; Yao, L.; Tu, Z.; Xing, Q.; Tang, X.; Ding, Z. Long-Term Dynamics of Ecosystem Services and Their Influencing Factors in Ecologically Fragile Southwest China. Sustainability 2023, 15, 12331. [Google Scholar] [CrossRef]
Figure 1. Spatial distribution of (a) topography and (b) vegetation NDVI across China’s nine major river basins (CN: China; SLRB: Songliao River Basin; HRB: Haihe River Basin; HHRB: Huaihe River Basin; YRB: Yellow River Basin; YZRB: Yangtze River Basin; PRB: Pearl River Basin; SEB: Southeast Rivers Basin; SWB: Southwest Rivers Basin; CB: Inland River Basin).
Atmosphere 16 00837 g001
Figure 2. Correlation analysis (a) and statistical metrics (Nash–Sutcliffe efficiency and correlation coefficient) (b) between simulated and observed water yield in China, 1990–2015.
Atmosphere 16 00837 g002
Figure 3. Spatiotemporal distribution map of water conservation capacity in China (CN: China; SLRB: Songliao River Basin; HRB: Haihe River Basin; HHRB: Huaihe River Basin; YRB: Yellow River Basin; YZRB: Yangtze River Basin; PRB: Pearl River Basin; SEB: Southeast Rivers Basin; SWB: Southwest Rivers Basin; CB: Inland River Basin).
Atmosphere 16 00837 g003
Figure 4. Change rate of water conservation and area proportion of change magnitude in China and its major river basins (CN: China; SLRB: Songliao River Basin; HRB: Haihe River Basin; HHRB: Huaihe River Basin; YRB: Yellow River Basin; YZRB: Yangtze River Basin; PRB: Pearl River Basin; SEB: Southeast Rivers Basin; SWB: Southwest Rivers Basin; CB: Inland River Basin).
Atmosphere 16 00837 g004
Figure 5. Factor detection results of influencing factors on water conservation (CN: China; SLRB: Songliao River Basin; HRB: Haihe River Basin; HHRB: Huaihe River Basin; YRB: Yellow River Basin; YZRB: Yangtze River Basin; PRB: Pearl River Basin; SEB: Southeast Rivers Basin; SWB: Southwest Rivers Basin; CB: Inland River Basin; X1: Precipitation; X2: Temperature; X3: Slope; X4: Land Use Type; X5: GDP; X6: Population; X7: NDVI).
Atmosphere 16 00837 g005
Figure 6. Interaction detection results of influencing factors on water conservation (CN: China; SLRB: Songliao River Basin; HRB: Haihe River Basin; HHRB: Huaihe River Basin; YRB: Yellow River Basin; YZRB: Yangtze River Basin; PRB: Pearl River Basin; SEB: Southeast Rivers Basin; SWB: Southwest Rivers Basin; CB: Inland River Basin; X1: Precipitation; X2: Temperature; X3: Slope; X4: Land Use Type; X5: GDP; X6: Population; X7: NDVI).
Atmosphere 16 00837 g006
Figure 7. Spatiotemporal distribution of and variation in water conservation rate (CN: China; SLRB: Songliao River Basin; HRB: Haihe River Basin; HHRB: Huaihe River Basin; YRB: Yellow River Basin; YZRB: Yangtze River Basin; PRB: Pearl River Basin; SEB: Southeast Rivers Basin; SWB: Southwest Rivers Basin; CB: Inland River Basin).
Atmosphere 16 00837 g007
Figure 8. Spatial distribution of and annual variation in precipitation in China (1990–2020).
Atmosphere 16 00837 g008
Figure 9. Spatial distribution and area proportion of land use types (numbers in the figure represent categories: 1: cultivated land; 2: forest land; 3: grassland; 4: water area; 5: construction land; 6: unused land; 9: ocean. Transition codes indicate land use changes, e.g., 21: forest land to cultivated land; 56: construction land to unused land; and so on).
Atmosphere 16 00837 g009
Table 1. Summary of the primary data.
DataDatasetSpatial ResolutionData Source
Annual Precipitation DataAnnual Spatial Interpolation Dataset of Meteorological Elements in China1 kmhttps://www.resdc.cn (accessed on 7 July 2023)
Potential Evapotranspiration1 km monthly potential evapotranspiration dataset for China0.0083°http://www.geodata.cn (accessed on 7 July 2023)
Land Use and Land Cover The land use and land cover change database in China1 kmhttps://www.resdc.cn (accessed on 7 July 2023)
Digital Elevation ModelSpatial Distribution Data of Elevation (DEM) in China1 kmhttps://www.resdc.cn (accessed on 7 July 2023)
Soil DataHarmonized World Soil Database version 1.11 kmhttps://www.fao.org/soils-portal/en (accessed on 7 July 2023)
Population1 km Population Spatial Distribution Dataset of China1 kmhttps://www.resdc.cn (accessed on 10 July 2023)
Gross Domestic ProductChina Gridded GDP Spatial Distribution Dataset1 kmhttps://www.resdc.cn (accessed on 10 July 2023)
Normalized Difference Vegetation Index (NDVI)China Annual NDVI and EVI 1 km Dataset1 kmhttps://www.resdc.cn (accessed on 7 March 2024)
Natural Runoff DatasetChina natural runoff dataset version 1.0CNRD v1.01 kmhttp://data.tpdc.ac.cn (accessed on 5 March 2024)
Disclaimer/Publisher’s Note: The statements, opinions and data contained in all publications are solely those of the individual author(s) and contributor(s) and not of MDPI and/or the editor(s). MDPI and/or the editor(s) disclaim responsibility for any injury to people or property resulting from any ideas, methods, instructions or products referred to in the content.

