Abstract
Parabolic trough collector (PTC) systems, often deployed in arid regions, are vulnerable to dust accumulation (soiling), which reduces mirror reflectivity and energy output. This study presents a physically based soiling forecast algorithm (SFA) designed to estimate soiling levels. The model was calibrated and validated using three meteorological data sources—numerical forecasts (YR), METAR observations, and on-site measurements—from a PTC facility in Limassol, Cyprus. Field campaigns covered dry, rainy, and red-rain conditions. The model demonstrated robust performance, particularly under dry summer conditions, with normalized root mean square errors (NRMSE) below 1%. Sedimentation emerged as the dominant soiling mechanism, while the contributions of impaction and Brownian motion varied according to site-specific environmental conditions. Under dry deposition conditions, the reflectivity change rate during spring and autumn was approximately twice that of summer, indicating a need for more frequent cleaning during transitional seasons. A red-rain event resulted in a pronounced drop in reflectivity, showcasing the model’s ability to capture abrupt soiling dynamics associated with extreme weather episodes. The proposed SFA offers a practical, adaptable tool for reducing soiling-related losses and supporting seasonally adjusted maintenance strategies for solar thermal systems.
1. Introduction
Solar energy is one of the primary renewable energy sources, valued for its abundance and accessibility. However, its inherently intermittent nature, driven by dynamic atmospheric conditions, poses challenges for grid stability [1]. Concentrating solar power (CSP) technologies address these limitations by integrating thermal energy storage, enabling stable and dispatchable power output [2]. As a result, numerous companies across the globe have recognized the advantages of these technologies and sought to utilize the generated electricity using solar-based solutions. Among CSP technologies, parabolic trough collector (PTC) systems are the most commercially mature solar thermal applications, capable of efficiently meeting the energy demands of various industrial processes [3]. With their ability to provide reliable and large-scale heat and power, PTC systems have the potential to significantly impact the economy, environment, and society through sustainable energy production. This makes PTC systems particularly suitable for industrial sectors, which consume 32% of global energy consumption [4], two-thirds of which is used for steam for industrial applications [5].
PTC systems are situated in areas where hot and dry conditions prevail, but the presence of dust has a significant impact on their performance [6]. The reflectivity of the mirrors affects the effectiveness of PTC plants, according to the study of Zhao et al. [7]. Cleanliness is used as a measure to assess dust accumulation, as it causes a reduction in the reflectivity of mirrors. Furthermore, the daily change in cleanliness is referred to as the “soiling rate”. It has been estimated that the dust deposition on concentrating systems is responsible for the reduction of 4–7% in the global potential electricity production through solar energy [8]. This situation is anticipated to become worse due to the increase in power plants that will be installed in arid regions in the future [9]. As indicated by most studies, plant operation and maintenance (O&M) represent a significant cost, accounting for 14–17% of the levelized cost of electricity (LCOE) (containing fixed O&M costs of 10–11% and staff and consumables, which account for 4–6%) [10]. According to the International Renewable Energy Agency [11], O&M is a significant potential area for overall cost reduction.
The literature asserts that numerous simulation models have been developed to forecast, evaluate, and improve PTC system performance. Several studies have explored different methods for predicting soiling at PTC plants, employing both physical models [12] and statistical models [13]. Statistical approaches rely on reflectance measurements along with meteorological data to model the dependence of soiling losses on different environmental parameters. These models are developed using techniques such as machine learning models [14] and other data-driven methods [15,16], which bypass the need for a detailed model and do not allow for reliable extrapolation to different sites and environmental conditions. Previous studies have examined various meteorological and atmospheric variables influencing PTC soiling. El Boujdaini et al. [17] identified wind speed, relative humidity, ambient temperature, and dust optical depth as the most significant environmental factors. Paetzold et al. [18] further emphasized wind speed as the primary meteorological driver of particle deposition on parabolic trough systems, highlighting its substantial impact on system performance.
Physical models, based on physical laws, describe the deposition of dust particles on the surface of solar collectors [19,20]. Picotti et al. [21] compiled the major phenomena involved in the soiling process. Their work resulted in a well-organized directory of physical models that would help researchers and operators identify the critical factors that affect the soiling of solar collectors. Such prediction capabilities would help operators find the optimal balance between cleaning costs and soiling-induced losses. Wolfertstetter et al. [22] estimated the soiling rate for a CSP plant as a function of meteorological variables using temporally variable approaches to optimize system operation based on cleaning strategies. Their findings demonstrate that, even in the absence of precise measurements of soiling rate, a reliable estimation of the site’s soiling conditions can be obtained.
Despite the growing body of literature on soiling prediction models, most existing studies remain either purely statistical or are based on simplified assumptions that limit their application across diverse environments. Data-driven approaches often lack physical interpretability and fail to generalize beyond the training site [23]. Moreover, although physical models provide mechanistic insights, they often demand extensive calibration and are rarely validated across diverse environmental conditions [24].
Since Cyprus lacks natural resources, it relies solely on imported fossil fuels to generate electricity. Consequently, 94% of the nation’s energy needs are met by fossil fuels [25], which also highlights the significance of employing such concentrated systems and focuses on the use of PTC systems as a promising solar thermal solution for Cyprus. The deployment of renewable energy systems, particularly solar-based technologies, has expanded in recent years due to European Union regulations and initiatives aimed at reducing fossil fuel dependency. The potential of using PTC systems for industrial heat generation in Cyprus was previously investigated by Kalogirou [26], demonstrating their technical and economic viability for local applications. For a typical meteorological year (TMY) in Nicosia, Cyprus, the system was thermally and economically examined using TRNSYS. However, there is not sufficient research linking other meteorological variables to the soiling rate of concentrated solar collectors.
The scope of this paper is to develop and evaluate a soiling forecast algorithm for a PTC system installed in Limassol, Cyprus’s largest soft drink factory, KEAN Soft Drinks Ltd, in order to predict its reflectivity by estimating the soiling rate. The physical mechanisms and the equations used are derived from existing atmospheric dust transport models and have been applied to the problem of soiling of the PTC mirrors. The soiling forecast algorithm was calibrated against measurements from three experimental campaigns conducted in spring, summer, and autumn of 2022, therefore covering a wide range of atmospheric conditions. Furthermore, the calibration was performed under three separate procedures, each employing a distinct meteorological driver. The results of this analysis provide insights into the optimal timing for PTC cleaning, thereby minimizing energy losses.
The original contributions of this work are (a) multi-source calibration, (b) cross-campaign validation for seasonal robustness, and (c) an evaluation of the model’s ability to handle extreme weather conditions. Importantly, our study also contributes rare in situ reflectivity measurements, which are often lacking in previous soiling models.
The remainder of this paper is structured as follows: Section 2 introduces the study site and details the meteorological and environmental datasets used. Section 3 describes the methodology for developing the soiling forecast algorithm (SFA), including the physical mechanisms involved in dust deposition and removal, and the mathematical formulation of reflectivity estimation. Section 4 presents the results of the algorithm’s calibration and testing phases, showcasing performance across three seasonal campaigns using different meteorological drivers. Finally, the paper concludes with a discussion on the model’s implications for PTC operation and outlines future research directions.
2. Investigation Area and Input Data
2.1. Investigation Area
The PTC system, as shown in Google Maps in Figure 1, is situated at the KEAN factory in Limassol, Cyprus (34.41° N, 33.04° E). Due to its proximity to the sea—approximately 250 m—the PTC plant is influenced by local weather systems, such as the sea breeze. The location of the plant also contributes to the soiling on the system as it is surrounded by areas of high dust concentration, such as coastal sand. Moreover, Cyprus has an intense Mediterranean climate, characterized by hot, dry summers with frequent dust events by dust carried over from the Middle East and Sahara deserts, and mild winters from November to mid-March [27], making the estimation of soiling rate very challenging. Using a sun tracker to locate the position of the sun during the day, the PTC plant is aligned with the solar disk in order to enhance its efficiency. This results in the concentrating system receiving direct solar radiation throughout the day, so the computation of soiling mechanisms considers the change in its position during the day. In this study, the angular position of the mirrors is identified by the solar zenith angle, which is calculated within the algorithm. Location-specific data were also utilized to calculate it. Further details regarding the design and operational configuration of the PTC system can be found in previous studies by Ktistis [25,28].
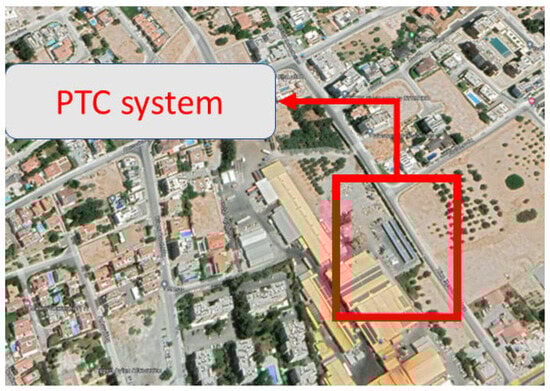
Figure 1.
PTC location. Google Maps (accessed on 8 May 2025).
2.2. Data and Models
Meteorological forecasts from the Norwegian Meteorological Institute (YR), pinpointed to the system’s location, were utilized to calibrate the model. Moreover, meteorological observations from the closest airport RAF Akrotiri (METAR) and from the automatic station of the KEAN factory were also employed. In each of the three distinct meteorological drivers, the variables of air temperature, relative humidity, wind speed and direction, as well as total hourly precipitation, were utilized.
Dust aerosol mixing ratio (kg/kg) for fine (0.03–0.55 μm), medium (0.55–0.9 μm), and large (0.9–20 μm) particles, along with aerosol optical depth (AOD), both essential inputs for the soiling algorithm, are obtained from the Copernicus Atmosphere Monitoring Service (CAMS) [29]. Operated by the European Centre for Medium-Range Weather Forecasts (ECMWF), CAMS provides reliable, quality-controlled atmospheric composition forecasts and reanalysis data, supporting real-time environmental applications such as air quality, solar energy forecasting, and climate monitoring.
Measurements of mirror reflectivity were made with a Condor reflectometer from Abengoa Solar [28]. For each collector row, measurements were conducted at ten points distributed along its length. At each point, three reflectivity sets were taken, specifically positioned at the center and both edges of the mirrors across four different sections.
2.3. Methodology
The first step of the model involves quantifying the flux of airborne particles deposited onto the surface of solar collectors. The particle deposition on the ground from the atmosphere is represented as particle flux F in the atmospheric dust transport models (ADTMs), from which the soiling forecasting estimation is derived [30]. The following equation calculates the particle flux F toward the mirror surface:
where is the particle diameter, is the deposition velocity (m/s), and is the particle concentration (1/m3). The computational procedure was divided into two distinct methods in order to determine the rate at which dust particles can accumulate on the surface of a CSP mirror. One method applies equations for the laminar flow regime, while the other focuses on the turbulence flow regime.
2.3.1. Deposition Velocity and Soiling Mechanisms
The deposition velocity for the laminar flow model is calculated as a sum of the velocities resulting from by the mechanisms of sedimentation (vs), Brownian motion (vB), and impaction (vIm) [5]. The effect of soiling mechanisms on PTC systems during the laminar flow regime is illustrated in Figure 2.
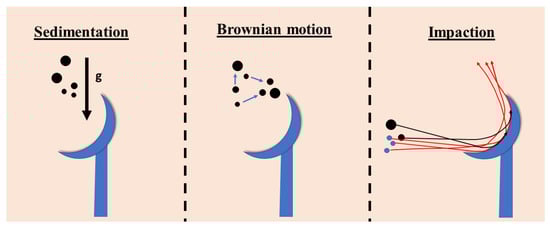
Figure 2.
Effect of soiling mechanisms on PTC mirrors’ laminar flow.
Sedimentation is the particle’s ability to settle, which depends on the ratio between the drag force that resists its movement and the gravity force that pulls on it. The particle reaches a final sedimentation velocity under stable environmental conditions [30]. Additionally, it is referred to as “gravitational settling”. This mechanism depends on particle size and the position of the system during the day. According to the definition of Brownian motion, which is a diffusion process, soil particles tend to be distributed equally throughout the medium depending on the temperature, nearby air molecules, and other aerosol components. This motion depends solely on the wind speed and is independent of environmental factors. Impaction occurs when particles’ inertia prevents them from following the flow’s curved streamlines, which leads to a collision with the obstacle. If the transferred momentum can overcome their kinetic inertia, the small particles that are interacting with an obstacle, in this case the PTC mirror, partially follow the direction of the air stream; if not, then they hit or impact the mirror’s surface. The impaction is proportional to the speed and direction of the wind, depending on the position of the system.
When there is significant contribution from quantities not related to the mean wind, the air exhibits turbulence [31] and particle deposition can be explained by other equations. For a case of turbulent flow, the expression in Table 1 is used to calculate the deposition velocity. According to the literature [32], the turbulent flow equations are chosen to estimate soiling accurately for wind speed values that exceed 6.8 m/s.

Table 1.
Soiling mechanisms for laminar and turbulent flow.
Table 1 summarizes the equations used to calculate the deposition velocity for each type of flow. Also, the angle between the mirror’s surface plane and the horizon is known as the elevation angle (). The elevation angle of the mirror is equal to the solar zenith angle (SZA) since the PTC’s structure employs a tracking mechanism to follow the sun. Wolfertstetter et al. [30] provide a detailed explanation of the physical significance, derivation, and application context of the parameters and formulations presented in Table 1.
2.3.2. Removal Mechanisms
In contrast to the mechanisms that estimate the formation of dust layers on the mirror’s surface, the forecasting algorithm has considered the mechanisms that “clean” the mirror by removing dust particles from the surface. Rebound, also known as the removal of dust particles caused by adhesion forces between the particles and the mirror surface, is the first process that appears to reduce dust accumulation on PTCs. The amount of dust on solar mirrors can also change depending on specific rainfall episodes. However, since PTC mirrors are typically situated in areas with infrequent rainfall during the months that mirrors are in operation, the impact of rain on soiling is rarely observed. By relating the data to the existing meteorological conditions, it is possible to calculate the contribution of both rebound and rain washout processes to the soiling estimation [32].
2.3.3. Reflectivity Estimation
A set of variables related to the accumulation of dust are first added in order to quantify the degree of soiling on the CSP mirror’s surface. The cleanliness ξ is determined by dividing the reflectance of a dirty mirror in time t by the reflectivity of a clean mirror:
The reduction in cleanliness with time is used to express the soiling rate:
In this study, it is assumed that the daily rate estimation of dust accumulation on the mirror’s surface is the soiling rate (SR). The rate of surface coverage (CR), which is determined as follows, is a metric that is used to quantify the soiling rate and is proportional to the soiling rate:
where the deposition flux is determined by the deposition velocity (m/s) and the concentration of the number of spherical particles (1/m3). The rate of surface coverage CR and the proportionality coefficient ζ are used to estimate the soiling rate SR:
The mirror’s predicted reflectivity, , is computed as follows:
where is the clean mirror’s reflectivity (about 0.95).
2.3.4. Forecast Accuracy
Once the model is specified and the parameters are computed, it is very important to examine the consistency of predictions with observations. In the following section, the formulas for computing the root mean square error (RMSE), its normalized form (NRMSE), the normalized mean bias error (NMBE), and the coefficient of determination R2 are presented.
The root mean square error:
The normalized root mean square error:
The normalized mean bias error:
The coefficient of determination R2:
where n is the number of observations, represents the observations, is the simulated quantity (reflectivity), and is the mean value of the observations. Statistical analysis of these specific variables will reveal the model’s ability to estimate observed conditions. The values of RMSE, NRMSE, and NMBE typically range from 0 to 1, with values close to zero indicating good forecasting performance. In contrast, R2 also ranges from 0 to 1, where values closer to 1 indicate a higher level of agreement between observed and predicted values, with 1 representing perfect predictive skill.
3. Results
3.1. Calibration and Prediction Using the SFA
The soiling forecast algorithm (SFA) is evaluated in two stages: a calibration phase and a prediction phase. During calibration, the objective is to determine the optimal proportionality coefficient (ζ) by minimizing the RMSE between modeled and measured reflectivity for each meteorological driver (YR, METAR, KEAN). For improved clarity, the structure of the SFA is summarized in Figure 3 as a step-by-step process. Each stage of the model corresponds to a physically meaningful mechanism and includes both input preparation and output estimation.
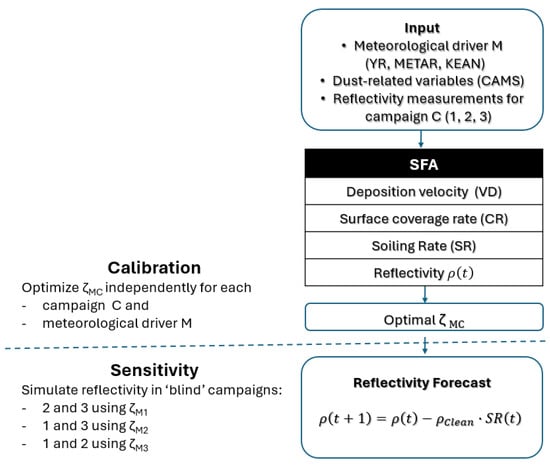
Figure 3.
Flowchart of the soiling forecast algorithm (SFA).
This calibration is performed separately for each of the three bi-weekly experimental campaigns conducted in April, June, and October 2022. The coefficient ζ characterizes the relationship between the modeled dust coverage rate and the observed reflectivity loss, acting as a proportionality factor in the conversion of physical deposition mechanisms into daily soiling rates. In the prediction phase, the ζ estimated during each calibration campaign is applied to the other two campaigns to simulate reflectivity, allowing for an assessment of the model’s generalizability and robustness under varying environmental conditions.
Each campaign was characterized by distinct environmental conditions that influenced the soiling dynamics and reflectivity trends. The April campaign included a red-rain event (from dust from the desert), where the measured reflectivity decreased significantly between April 7th and 8th. During the October campaign several rain events occurred, resulting in the partial cleaning of the PTC mirrors, while the June campaign was conducted under hot and dry weather, typical of stable summer conditions.
Figure 4 and Table 2 depict the modeled reflectivity during the calibration phase (Figure 4a) and the prediction phase (Figure 4b) across all campaigns and under all meteorological drivers. Overall, in the calibration phase, the model outputs captured the phasing and magnitude of the measurements, demonstrating behavior that closely matches the observed conditions in all simulations for each measurement campaign. The factor ζ took similar values under YR or METAR data, while KEAN required a relatively nearly double proportionality coefficient. The SFA configuration using KEAN achieved the lowest error with NRMSE of 0.6%, attributed to both the high accuracy of the KEAN data and the station’s proximity to the system. Due to its proximity to the PTC plant, the local meteorological station at the KEAN factory served as a reference station.
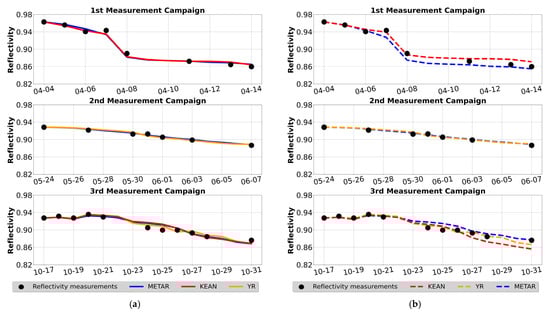
Figure 4.
Estimated reflectivity derived from the soiling forecast algorithm for each measurement campaign utilizing different meteorological inputs, where (a) represents the calibration phase and (b) represents the prediction phase. The blue line corresponds to the simulation with METAR input, the red line to the simulation with KEAN input, and the orange line to the simulation with YR input, while the black dots represent the measured reflectivity.
Table 2.
Performance of the soiling forecast algorithm during the calibration and prediction phases using three distinct meteorological input datasets.
During the first campaign, KEAN provided the most accurate results, achieving an R2 of 0.99 and the lowest NRMSE (0.5%) during training, and maintained high performance in testing (NRMSE = 0.7%). Its proximity to the PTC site allowed it to better capture the sharp reflectivity drop around April 8, attributed to a red-rain event, which METAR underestimated (NMBE = −0.6%, NRMSE = 1.1%). In the second campaign, both METAR and YR showed strong agreement with observations, with METAR slightly outperforming (R2 = 0.98, NRMSE = 0.2%) during the training phase. This advantage persisted in the test phase, where METAR-based SFA maintained higher consistency. Reflectivity declined gradually, indicating slow and steady soiling accumulation. In the third campaign, YR delivered the best performance (R2 = 0.96, NRMSE = 0.5%) in both training and testing phases due to its accurate representation of reflectivity recovery after a rainfall event on October 26. METAR and KEAN showed slightly lower accuracy (R2 = 0.92), with NRMSE values of 0.6% and 0.7%, respectively. These results highlight the importance of accurately modeling wet deposition events in soiling forecasts.
Following the optimization step, the importance of each soiling mechanism in the PTC reflectivity under different seasons and meteorological drivers was quantified.
Sedimentation (Figure 5a) exhibits a consistent daily variation that is principally affected from the sun’s position with respect to the system’s rotation, with the maximum being observed during solar noon when the projected area of the mirror in the horizon maximizes. The discontinuity in the figure corresponds to the non-operational hours (PTC in upside-down position). Seasonally, the sedimentation effect is larger in the warm season since the PTC system interacts with a bigger optical air mass due to the longer duration of the day and the smaller solar zenith angle. Overall, as expected, the sedimentation mechanism was insensitive to the meteorological drivers.
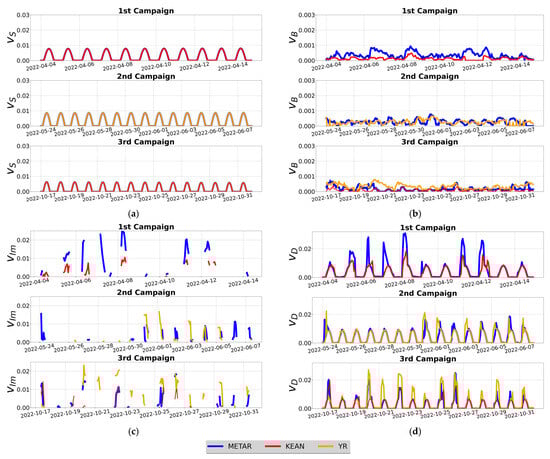
Figure 5.
Soiling mechanisms and deposition velocity over the course of the calibration period, where (a) corresponds to sedimentation, (b) to Brownian motion, (c) to impaction, and (d) to deposition velocity, respectively. The blue line corresponds to the simulation with METAR input, the red line to the simulation with KEAN input, and the orange line to the simulation with YR input, respectively. Brownian motion (b) is of a significantly smaller order of magnitude compared to sedimentation and impaction; a separate vertical scale is used for clarity.
Brownian motion exhibits deposition even at night. Its variability is primarily influenced by wind speed (V) and air temperature (T) proportionally to the factor VT2/3. Therefore, soiling accumulation from Brownian motion is very sensitive to the selected meteorological driver (Figure 5b) due to discrepancies among datasets. KEAN yields the lowest Brownian deposition, while METAR and especially YR produce higher contributions due to a systematic overestimation of the wind speed.
The impaction mechanism relies on the wind speed and direction as a function of the position of the system during the day. For dust accumulation through impaction to be possible, the system must be in operation, and its position must be aligned with the direction of the wind. Due to this condition, this mechanism is frequently not activated. Like Brownian deposition, impaction is highly sensitive to meteorological drivers (Figure 5c). For example, an overestimated wind speed may produce a very large or zero impaction effect depending on whether the wind direction is correctly or incorrectly aligned with the system. Among datasets, METAR and YR generally yield augmented impaction estimates compared to those of KEAN.
Comparing the three mechanisms, deposition velocity due to Brownian motion is of a smaller order of magnitude compared to the other soiling mechanisms. While impaction achieved the highest values overall, its discontinuous nature results in gravitational settling having a greater effect.
The total deposition velocity (Figure 5d) is determined by the sum of the three soiling mechanisms when the wind regime is laminar. The illustrated diurnal variation shows a strong dependence on sedimentation, with superimposed contributions from the Brownian motion (non-zero numbers during the night) and bursts due to impaction or turbulent flow. Overall, the total deposition velocity is positively correlated with the wind speed, exhibiting higher values in YR and KEAN (due to wind overestimation) and lower values in KEAN.
Table 3 presents the contribution of soiling mechanisms to deposition velocity across all campaigns and meteorological datasets, evaluated only during non-turbulent hours to ensure consistency. Sedimentation was the dominant mechanism in all cases, contributing 54–81% in METAR, 47–76% in YR, and 74–78% in KEAN. Impaction, driven by wind speed, accounted for up to 49%—highest under YR in the third campaign—while Brownian motion consistently played a minor role (~2–5%). The KEAN dataset showed no turbulent deposition and yielded the most stable sedimentation-dominated results. METAR performed best under stable conditions, whereas YR captured dynamic effects such as rainfall more accurately. These results emphasize the influence of meteorological inputs on soiling predictions, with impaction highly sensitive to wind variability.
Table 3.
Contribution of soiling mechanisms to deposition velocity for each measurement campaign using three different meteorological drivers (in daylight hours).
Overall, sedimentation had the greatest impact on deposition velocity across all campaigns and data sources, confirming its dominant role in particle deposition. Conversely, Brownian motion had the least impact, reflecting its limited effect on larger particles. Impaction increased with higher wind speeds, with the highest value (49%) recorded under YR during the third campaign, indicating strong winds. The deviations between the datasets were caused by an overestimation of wind speed in the YR and METAR approaches, resulting in higher calculated impaction values. The findings suggest that the choice of meteorological input dataset significantly affects the accuracy of soiling forecasts. METAR demonstrated higher accuracy under stable conditions dominated by sedimentation, while YR outperformed the others under more dynamic conditions involving rainfall and turbulence.
The total contribution of the soiling mechanisms to deposition velocity does not provide sufficient evidence on how the system is affected. For this reason, the hourly percentage contribution of each mechanism for the third measurement campaign—the only campaign for which all three meteorological drivers are available, to the average hourly deposition velocity was calculated. This analysis is presented in Figure 6, where the shaded area represents the average deposition velocity on an hourly basis, and the colored lines are the soiling mechanisms. This hourly temporal resolution analysis provides important insights into the functioning of each mechanism at specific times of the day.
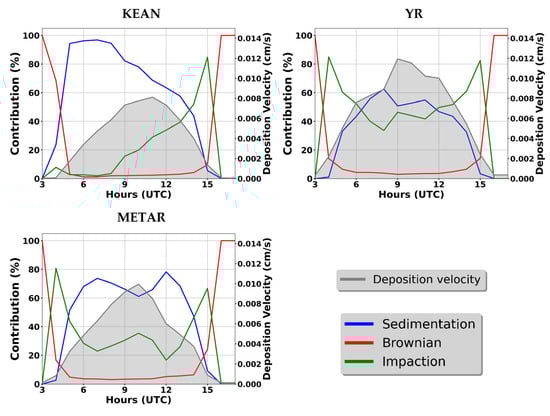
Figure 6.
Influence of each soiling mechanism on deposition velocity in hourly temporal resolution for the third measurement campaign for three distinct series of simulations. The shaded area corresponds to the average hourly deposition velocity, and the colored lines correspond to the soiling mechanisms.
Across all simulations, sedimentation (blue line) dominates the daytime deposition process, particularly between 09:00 and 12:00 UTC, where the shaded area (representing deposition velocity) reaches its maximum values. This alignment underscores sedimentation’s primary role in dust accumulation. An additional common feature between the simulations is the exclusive effect of Brownian motion (red line) (100%) during the evening hours, as it is the only soiling mechanism contributing to dust formation when the system is turned off, but its overall impact remains minimal due to the larger particle sizes involved. Impaction (green line) exhibits the highest variability, with YR simulations showing the strongest impaction effects, particularly around 04:00 UTC and 15:00 UTC, which correspond to the mirror’s rotational transitions and associated wind interactions. However, despite localized peaks, impaction contributes only modestly to average deposition due to its limited duration. Similar behavior was observed in the METAR simulation, where sedimentation dominated midday hours, while impaction showed increased contributions during periods of higher wind activity.
3.2. Seasonal Patterns of Reflectivity Loss for PTC
The results presented in Table 4 highlight the seasonal variability of soiling rates and their implications for maintenance scheduling based on the time (days) needed for reflectivity to fall below the critical threshold of 0.8 in PCT installations (Cleaning-to-Cleaning operation period, C2C). The reflectivity change rate (RCR) was calculated under dry deposition conditions, explicitly excluding periods affected by rainfall or red-rain events to isolate the impact of dust accumulation. The spring campaign (April) demonstrated the highest normalized RCR of 0.68 %/day, requiring 28 days of dust accumulation for reflectivity to reach the critical threshold. A similarly high soiling intensity was observed during the autumn campaign (October), with RCR = 0.62 %/day and a cleaning frequency of 26 days, suggesting comparable environmental conditions that accelerate surface degradation. Conversely, the summer campaign (May–June) exhibited the lowest soiling impact (RCR = 0.33 %/day), extending the required cleaning interval to 46 days, due to calmer weather conditions and reduced dust deposition. RCR was also evaluated during wet deposition periods. In the spring campaign, the red-rain event, which occurred around April 8, led to a noticeable drop in reflectivity, with an RCR of 5 %/day. During the autumn campaign, rainfall events were observed on the afternoons of October 17 and 19, resulting in reflectivity increases, with RCR values recovering by 0.44 %/day and 0.88%/day, respectively. Such episodes illustrate the compound impact of wet and dry soiling and underline the need to incorporate extreme weather events into maintenance planning. This analysis underscores the importance of implementing seasonally adaptive maintenance protocols that consider environmental variability to optimize reflectivity. Adjusting cleaning schedules according to seasonal soiling dynamics allows PTC operators to enhance energy yield and ensure more efficient resource management.
Table 4.
The normalized reflectivity loss (ΔR/R) and the corresponding cleaning intervals based on the time to reach the threshold of 0.8 for each seasonal measurement campaign under dry deposition.
4. Discussion
This study presents the development of a new soiling forecast algorithm implemented at a PTC facility in Limassol, Cyprus. The model was calibrated using data from three measurement campaigns conducted between April and October 2022, incorporating three distinct meteorological input sources. These were the meteorological forecasts from the Norwegian Meteorological Institute (YR), the meteorological observations from the closest airport at Akrotiri (METAR), and the data from the automatic weather station at the PTC system’s location (KEAN). The calibration employing KEAN data was used as a reference due to its accuracy but also due to the station’s proximity to the system.
The proposed SFA introduces several important innovations that extend current modeling approaches. First, it combines a physically based framework with multi-source calibration from three independent meteorological datasets, enhancing model reliability under varying input conditions. Second, it supports cross-campaign validation, allowing for the assessment of robustness across distinct seasonal conditions. Third, the model was tested under complex environmental conditions, including rare red-rain events, illustrating its adaptability beyond typical dry or dusty environments. Additionally, a key contribution of this work is the incorporation of in situ reflectivity measurements—an element often missing from earlier soiling models —providing a strong empirical basis for algorithm calibration and validation.
The model delivered consistent performance across the three meteorological inputs, effectively capturing both the magnitude and temporal evolution of soiling patterns throughout all three campaigns. Despite differences in spatial resolution and origin, each dataset reproduced reflectivity trends, such as gradual declines and post-rainfall recovery. The model exhibited comparable accuracy across drivers, with all configurations achieving low NRMSE values (<1%) and high R2 scores (>0.9) in both calibration and prediction phases. This agreement across independent meteorological sources confirms the robustness of the SFA and supports its application even when on-site meteorological data are unavailable.
Each campaign tested the SFA under distinct seasonal conditions, enabling the evaluation of its performance across diverse environmental conditions. The summer campaign (second) showed the smallest errors across all configurations, owing to the absence of a wet deposition processes. Simulations during dry periods generally achieved higher accuracy due to simpler deposition dynamics. In contrast, the spring (first) and autumn (third) campaigns featured more complex dynamics, including red-rain and rainfall events that influenced deposition and removal rates. Despite these variations, the model consistently reproduced reflectivity trends with high accuracy across all seasons. This seasonal consistency supports its application throughout the operational year.
The SFA was further evaluated under extreme weather conditions. In the first campaign, a red-rain event led to a sharp reflectivity drop, which the model accurately captured—even during the prediction phase using parameters calibrated from the second and third campaigns. This demonstrates the algorithm’s ability to generalize and respond to sudden soiling events without requiring event-specific recalibration. Similarly, in the third campaign, rainfall events led to partial surface cleaning, which was captured by all simulations. These results highlight the model’s adaptability in handling both deposition and removal dynamics and underscore its value in forecasting under standard and extreme atmospheric scenarios.
Analysis of deposition mechanisms revealed sedimentation as the dominant mechanism across all campaigns and meteorological inputs, consistently peaking during daytime hours—highlighting the most critical window for dust accumulation. Impaction, more sensitive to wind speed, showed greater variability and became more influential during transitional seasons. A marked reduction in impaction was observed during the summer, attributed to calmer atmospheric conditions. Brownian motion remained consistently negligible (<5%), active mainly during nighttime periods when the system was inactive. Despite variations in magnitude, the preserved ranking of mechanisms across campaigns and meteorological sources reinforces the physical consistency and generalizability of the SFA across diverse environmental conditions.
Considering the results of the SFA, seasonally adjusted maintenance strategies that account for environmental conditions are essential for PTC operators to determine optimal cleaning schedules, minimizing energy loss and reducing operation and maintenance costs. Under dry conditions, reflectivity decays daily between 0.33% (summer) and 0.68% (spring, autumn). Therefore, for the KEAN system the optimum cleaning periods are 1.5 months in summertime and about a month in transitional periods (spring and autumn), under dry conditions and using 0.8 as the reflectivity threshold. At the opposite end, during days with wet deposition coupled with abrupt conditions (e.g., red-rain), reflectivity drop can be quite noticeable (~5%).
Τhe SFA was developed and validated using data from a single PTC installation in Cyprus; however, its robustness was enhanced through calibration with three distinct meteorological input sources and across different seasonal conditions. Nevertheless, we acknowledge that site-specific factors may limit full generalizability. Future research will focus on including humidity-related physical mechanisms in the SFA and testing the model in other geographic locations with varying atmospheric and environmental characteristics (especially wet deposition). Additionally, incorporating uncertainty analysis in a real-time forecasting integration could further enhance operational reliability and practical applicability.
Author Contributions
Conceptualization, I.K.; methodology, A.P. and I.K.; software, A.P.; validation, A.P. and I.K.; investigation, A.P. and I.K.; data curation, J.C.S., S.D., P.K., S.A.K. and O.S.A.; writing—original draft preparation, A.P. and I.K.; writing—review and editing, A.P., J.C.S., S.A.K., O.S.A. and I.K.; visualization, A.P.; supervision, I.K. All authors have read and agreed to the published version of the manuscript.
Funding
This research (Smart Colar System project) has been co-financed under the umbrella of SOLAR-ERA.NET Cofund by Projektträger Jülich—Forschungszentrum Jülich GmbH—Energie-Technologie-Nachhaltigkeit (ETN 1) and General Secretariat of Research and Innovation (GSRI). SOLAR-ERA.NET is supported by the European Commission within the EU Framework Programme for Research and Innovation HORIZON 2020 (Cofund ERA-NET Action, N° 786483). Funding from the state of North Rhine-Westphalia on the basis of the directive on the granting of funding from the “Programme for the rational use of energy, regenerative energies and energy saving—pro-gres.nrw—programme area innovation”.
Institutional Review Board Statement
Not applicable.
Informed Consent Statement
Not applicable.
Data Availability Statement
The detailed and extensive amount of data supporting the results of this paper are only (and even only in parts) accessible to the consortium members of project S3 within legal restrictions bound by a cooperation agreement. For reasons of maintaining intellectual property, the information and data presented in this paper are limited.
Acknowledgments
The authors would like to thank KEAN Soft Drinks Ltd. for their support during the measurement campaigns.
Conflicts of Interest
Author S. Dutta was employed by the company Protarget AG. The remaining authors declare that the research was conducted in the absence of any commercial or financial relationships that could be construed as a potential conflict of interest.
References
- Dai, H.; Zhen, Z.; Wang, F.; Lin, Y.; Xu, F.; Duić, N. A short-term PV power forecasting method based on weather type credibility prediction and multi-model dynamic combination. Energy Convers. Manag. 2025, 326, 119501. [Google Scholar] [CrossRef]
- Alamdari, P.; Khatamifar, M.; Lin, W.X. Heat loss analysis review: Parabolic trough and linear Fresnel collectors. Renew. Sustain. Energy Rev. 2024, 199, 114497. [Google Scholar] [CrossRef]
- Xu, L.; Sun, F.; Ma, L.; Li, X.; Lei, D.; Yuan, G.; Zhu, H.; Zhang, Q.; Xu, E.; Wang, Z. Analysis of optical and thermal factors’ effects on the transient performance of parabolic trough solar collectors. Sol. Energy 2019, 179, 195–209. [Google Scholar] [CrossRef]
- Lizárraga-Morazán, J.R.; Picón-Núñez, M. Optimal design of parabolic trough solar collector networks: A design approach for year-round operation. Energy 2024, 306, 132434. [Google Scholar] [CrossRef]
- Mouaky, A.; Alami Merrouni, A.; Laadel, N.E.; Bennouna, E.G. Simulation and experimental validation of a parabolic trough plant for solar thermal applications under the semi-arid climate conditions. Sol. Energy 2019, 194, 969–985. [Google Scholar] [CrossRef]
- Adekanbi, M.L.; Alaba, E.S.; John, T.J.; Tundealao, T.D.; Banji, T.I. Soiling loss in solar systems: A review of its effect on solar energy efficiency and mitigation techniques. Clean. Energy Syst. 2024, 7, 100094. [Google Scholar] [CrossRef]
- Zhao, K.; Wang, X.; Gai, Z.; Qin, Y.; Li, Y.; Jin, H. Enhancing the efficiency of solar parabolic trough collector systems via cascaded multiple concentration ratios. J. Clean. Prod. 2024, 437, 140665. [Google Scholar] [CrossRef]
- Parsay, A.; Gandomzadeh, M.; Yaghoubi, A.; Hoorsun, A.; Gholami, A.; Zandi, M.; Gavagsaz-ghoachani, R.; Kazem, H.A. Enhancing photovoltaic efficiency: An in-depth systematic review and critical analysis of dust monitoring, mitigation, and cleaning techniques. Appl. Energy 2025, 388, 125668. [Google Scholar] [CrossRef]
- Ilse, K.; Micheli, L.; Figgis, B.W.; Lange, K.; Dasler, D.; Hanifi, H.; Wolfertstetter, F.; Naumann, V.; Hagendorf, C.; Gottschalg, R.; et al. Techno-economic assessment of soiling losses and mitigation strategies for solar power generation. Joule 2019, 3, 2303–2321. [Google Scholar] [CrossRef]
- Khan, M.I.; Guti’ errez-Alvarez, R.; Asfand, F.; Bicer, Y.; Sgouridis, S.; Al-Ghamdi, S.G.; Jouhara, H.; Asif, M.; Kurniawan, T.A.; Abid, M.; et al. The economics of concentrating solar power (CSP): Assessing cost competitiveness and deployment potential. Renew. Sustain. Energy Rev. 2024, 200, 114551. [Google Scholar] [CrossRef]
- IRENA. Renawable Energy Benefits—Leveraging Local Capacity for Concentrated Solar Power. 2025. Available online: https://www.irena.org/-/media/Files/IRENA/Agency/Publication/2025/Jan/IRENA_Renewable_energy_benefits_leveraging_capacity_CSP_2025.pdf (accessed on 25 April 2025).
- Fernández-Solas, A.; Montes-Romero, J.; Micheli, L.; Almonacid, F.; Fernández, E.F. Estimation of soiling losses in photovoltaic modules of different technologies trough analytical methods. Energy 2022, 244, 123173. [Google Scholar] [CrossRef]
- Sharkawy, A.-N.; Ali, M.M.; Mousa, H.H.H.; Ali, A.S.; Abdel-Jaber, G.T.; Hussein, H.S.; Farrag, M.; Ismeil, M.A. Solar PV power estimation and upscaling forecast using different artificial neural networks types: Assessment, validation, and comparison. IEEE Access 2023, 11, 19279–19300. [Google Scholar] [CrossRef]
- Brenner, A.; Kahn, J.; Hirsch, T.; Röger, M.; Pitz-Paal, R. Soiling determination for parabolic trough collectors based on operational data analysis and machine learning. Sol. Energy 2023, 259, 257–276. [Google Scholar] [CrossRef]
- Tao, H.; Alawi, O.A.; Homod, R.Z.; Mohammed, M.K.A.; Goliatt, L.; Togun, H.; Shafik, S.S.; Heddam, S.; Yaseen, Z.M. Data driven insights for parabolic trough solar collectors: Artificial intelligence-based energy and exergy performance analysis. J. Clean. Prod. 2024, 443, 141069. [Google Scholar] [CrossRef]
- Pelissari, F.; Filho, J.C.C.; Ferreira, W.G.; Dezan, D.J. Surrogate-based optimization applied to parabolic trough collectors with variable geometry. J. Therm. Anal. Calorim. 2024, 149, 14791–14818. [Google Scholar] [CrossRef]
- El Boujdaini, L.; Mezrhab, A.; Moussaoui, M.A.; Carballo Lopez, J.A.; Wolfertstetter, F. The effect of soiling on the performance of solar mirror materials: Experimentation and modeling. Sustain. Energy Technol. Assess. 2022, 53, 102741. [Google Scholar] [CrossRef]
- Paetzold, J.; Cochard, S.; Vassallo, A.; Fletcher, D.F. Wind engineering analysis of parabolic trough solar collectors: The effects of varying the trough depth. J. Wind. Eng. Ind. Aerodyn. 2014, 135, 118–128. [Google Scholar] [CrossRef]
- Usamentiaga, R.; Fernández, A.; Carús, J.L. Evaluation of Dust Deposition on Parabolic Trough Collectors in the Visible and Infrared Spectrum. Sensors 2020, 20, 6249. [Google Scholar] [CrossRef]
- Yang, L.; Du, K. Thermo-economic analysis of a novel parabolic trough solar collector equipped with preheating system and canopy. Energy 2020, 211, 118900. [Google Scholar] [CrossRef]
- Picotti, G.; Borghesani, P.; Cholette, M.E.; Manzolini, G. Soiling of solar collectors-Modelling approaches for airborne dust and its interactions with surfaces. Renew. Sustain. Energy Rev. 2018, 81, 2343–2357. [Google Scholar] [CrossRef]
- Wolfertstetter, F.; Wilbert, S.; Terhag, F.; Hanrieder, N.; Fernandez-García, A.; Sansom, C.; King, P.; Zarzalejo, L.; Ghennioui, A. Modelling the soiling rate: Dependencies on meteorological parameters. AIP Conf. Proc. 2019, 2126, 190018. [Google Scholar] [CrossRef]
- Noura, H.N.; Chahine, K.; Bassil, J.; Chaaya, J.A.; Salman, O. Efficient combination of deep learning models for solar panel damage and soiling detection. Measurement 2025, 251, 117185. [Google Scholar] [CrossRef]
- Younis, A.; Alhorr, Y. Modeling of dust soiling effects on solar photovoltaic performance: A review. Sol. Energy 2021, 220, 1074–1088. [Google Scholar] [CrossRef]
- Ktistis, P.K.; Agathokleous, R.A.; Kalogirou, S.A. A design tool for a parabolic trough collector system for industrial process heat based on dynamic simulation. Renew. Energy 2022, 183, 502–514. [Google Scholar] [CrossRef]
- Kalogirou, S. The potential of solar industrial process heat applications. Appl. Energy 2003, 76, 337–361. [Google Scholar] [CrossRef]
- Adamides, G. A Review of Climate-Smart Agriculture Applications in Cyprus. Atmosphere 2020, 11, 898. [Google Scholar] [CrossRef]
- Ktistis, P.K.; Agathokleous, R.A.; Kalogirou, S.A. Experimental performance of a parabolic trough collector system for an industrial process heat application. Energy 2021, 215, 119288. [Google Scholar] [CrossRef]
- CAMS. Available online: https://ads.atmosphere.copernicus.eu/cdsapp#!/dataset/cams-global-atmospheric-composition-forecasts?tab=form (accessed on 20 January 2025).
- Wolfertstetter, F.; Sansom, C.; King, P.; Wilbert, S.; Fernandez-García, A. Soiling and Condensation Model Applied to CSP Solar Field, WASCOP Project Report 3.2 2018. Available online: https://wascop.eu/wp-content/uploads/2018/06/WASCOP_deliverable_3.2_final_plainText.pdf (accessed on 8 May 2025).
- Muyshondt, A.; Anand, N.K.; McFarland, A.R. Turbulent Deposition of Aerosol Particles in Large Transport Tubes. Aerosol Sci. Technol. 1996, 24, 107–116. [Google Scholar] [CrossRef]
- Wolfertstetter, F.; Wilbert, S.; Dersch, J.; Dieckmann, S.; Pitz-Paal, R.; Ghennioui, A. Integration of soiling-rate measurements and cleaning strategies in yield analysis of parabolic trough plants. J. Sol. Energy Eng. 2018, 140, 041008. [Google Scholar] [CrossRef]
Disclaimer/Publisher’s Note: The statements, opinions and data contained in all publications are solely those of the individual author(s) and contributor(s) and not of MDPI and/or the editor(s). MDPI and/or the editor(s) disclaim responsibility for any injury to people or property resulting from any ideas, methods, instructions or products referred to in the content. |
© 2025 by the authors. Licensee MDPI, Basel, Switzerland. This article is an open access article distributed under the terms and conditions of the Creative Commons Attribution (CC BY) license (https://creativecommons.org/licenses/by/4.0/).