1. Introduction
Since most studies focus on the analysis and assessment of fixed-areas and short-duration sport events [
1,
2,
3,
4,
5,
6,
7,
8,
9], there is not much research performed regarding the thermal comfort assessment of large-area and long-duration outdoor sport events, such as the Olympic Torch Relay and Le Tour de France. Especially after the COVID-19 pandemic, not only are numerous international competitions held in full swing, but also many people plan long-duration outdoor activities and travels, such as hiking/cycling around an island.
This study focuses on the thermal comfort analysis of outdoor sport events held outside a fixed venue or location, over a long duration, and involving many participants with different thermal sensitivities and heat tolerances. The 2020 Olympic Torch Relay is such an example, as it started on 12 March 2020 in Olympia, Greece, and after a whole year, was completed on 23 July 2021 in Tokyo, Japan. There were 10,515 torchbearers of many nationalities involved; the requirements for the application were people born before 2 April 2008 who had a specific connection to the place where they wished to carry the torch. From teenagers to more than 100-year-old citizens, there were more than 10,000 members participating in this process as torchbearers for a distance of about 20,000 km [
10].
The difficulties in analyzing and evaluating the thermal comfort for such events include (1) large differences in the backgrounds and physical training experiences among torchbearers, (2) the application of data on both symptoms and characteristics, and (3) the influences within different built environments. It is quite difficult to conduct a relatively comprehensive thermal environment assessment for large-area and long-duration outdoor sport events due to the limits of obtaining detailed records of urban impacts.
Torchbearers have different training backgrounds, so they have different thermal perceptions and resistances [
11]. If each participant can make decisions regarding their own situation, they can participate at any time and on any route according to their preferences and physical capacity (e.g., 2022 NCT Run, Heidelberg, Germany), which will reduce thermal discomfort and heat stress risk. However, since the torch relay has a fixed route and a settled timetable, which must be carried out according to the planned itinerary, the route and schedule cannot be flexibly changed to avoid high thermal discomfort risk.
Heat impact assessment for large-area sport events requires a good understanding of the differences between built environments; therefore, obtaining more detailed urban-scale climate data is an important key. Meteorological monitoring stations are prioritized in certain places to avoid the effects of human activities. Furthermore, the analysis scale is the mesoscale, which is indeed different from the microclimate scale used for urban analysis. Therefore, the data from meteorological monitoring stations cannot fully reflect detailed urban characteristics such as wind field and solar radiation distribution at pedestrian height.
Downscaled model results can be used for real-time data display and early warning operations from 3 km to 8 km grid resolutions [
12,
13,
14]. High-density monitoring networks in urban areas could be helpful in providing services for continuous monitoring and analysis on a microclimate scale. However, it can only be carried out within a limited area and is really difficult to maintain and operate for decades. The description and corresponding challenges for urban environment analysis are shown in
Table 1.
This study attempts to analyze thermal comfort for large-area and long-duration outdoor sport events in Taiwan and takes the 2021 Torch Relay Round the Island, Taiwan as the study case.
2. Materials and Methods
Solving the issues involving (1) the insufficient spatial resolution of urban-scale data, (2) the lack of details on the built environment, and (3) the lack of continuous datasets at street level for decades are the tasks for the thermal analysis of large-area and long-duration sport events. This study attempts to approach a possible solution by obtaining the data with the following characteristics: (1) stability with long-term environmental characteristics and tendencies; (2) a large coverage area, not just the output results of a few internal points; and (3) the capacity to show the influence of different urban built environments.
2.1. Study Area and Setting
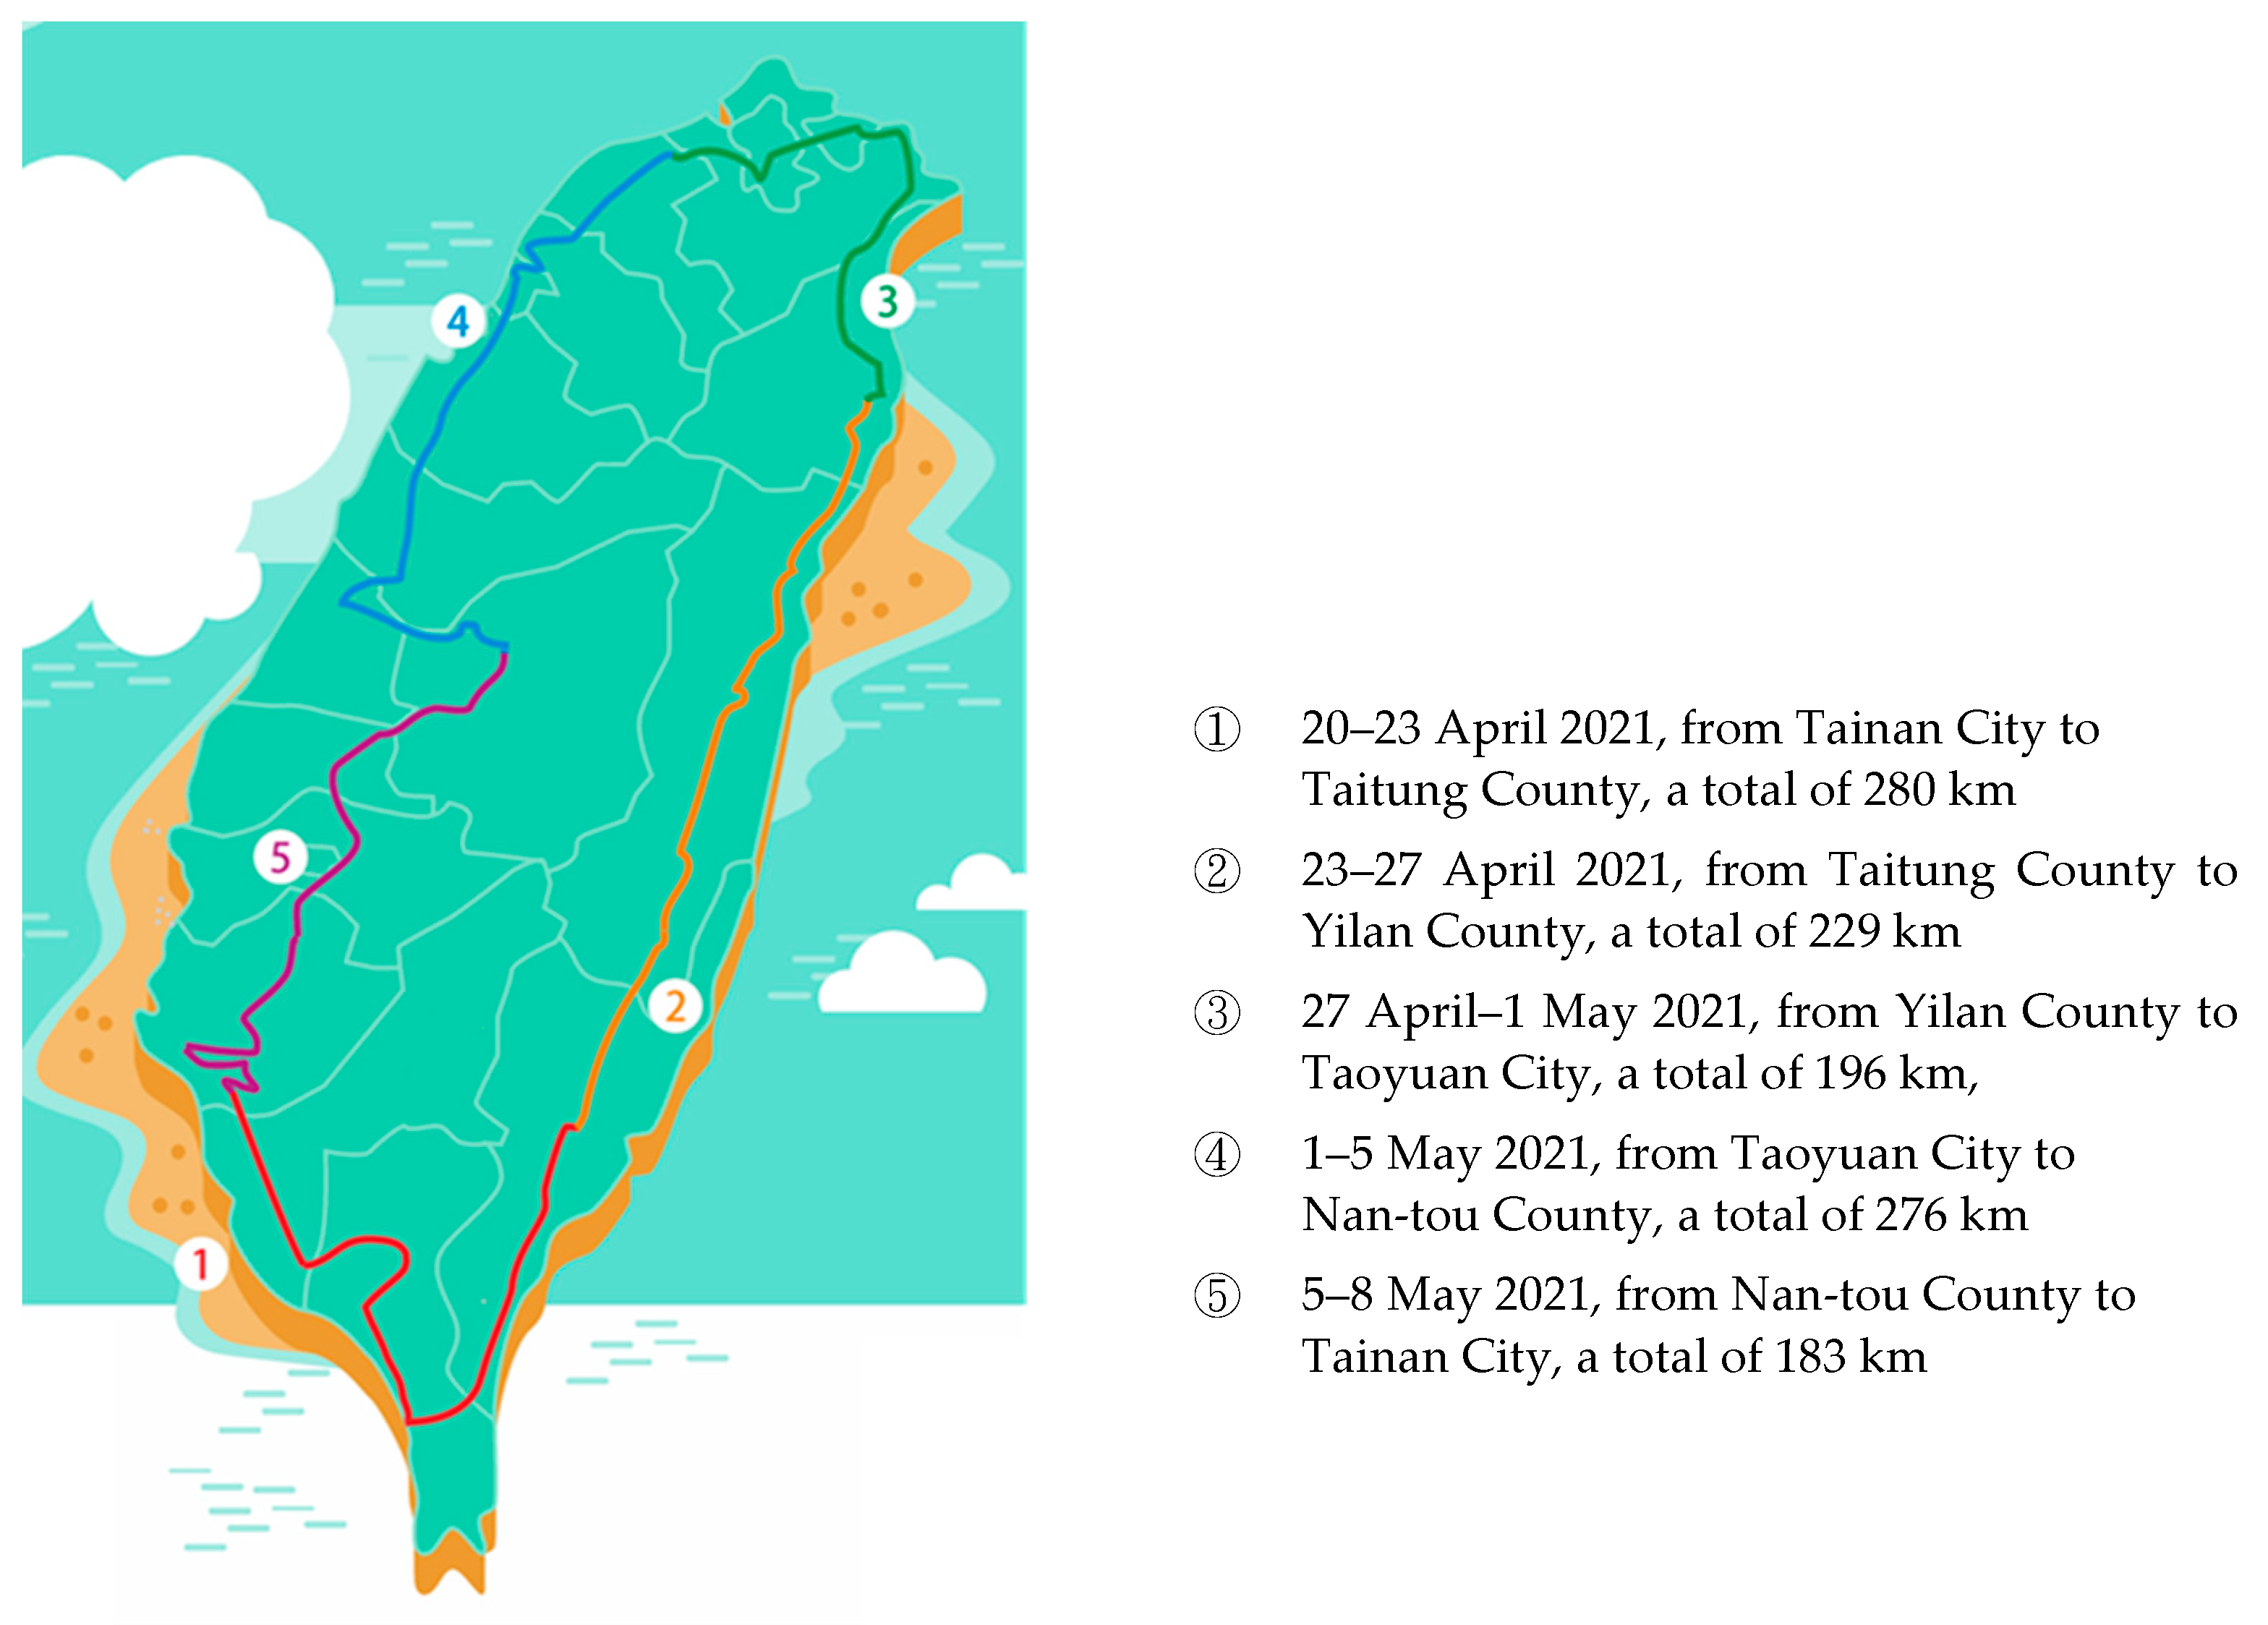
The route of the 2021 Torch Relay Round the Island, Taiwan, comprises 16 cities/counties and 32 universities, with more than 140 sites, The total running distance of 1164 km was separated into 5 turns (Route ①–Route ⑤), as shown in
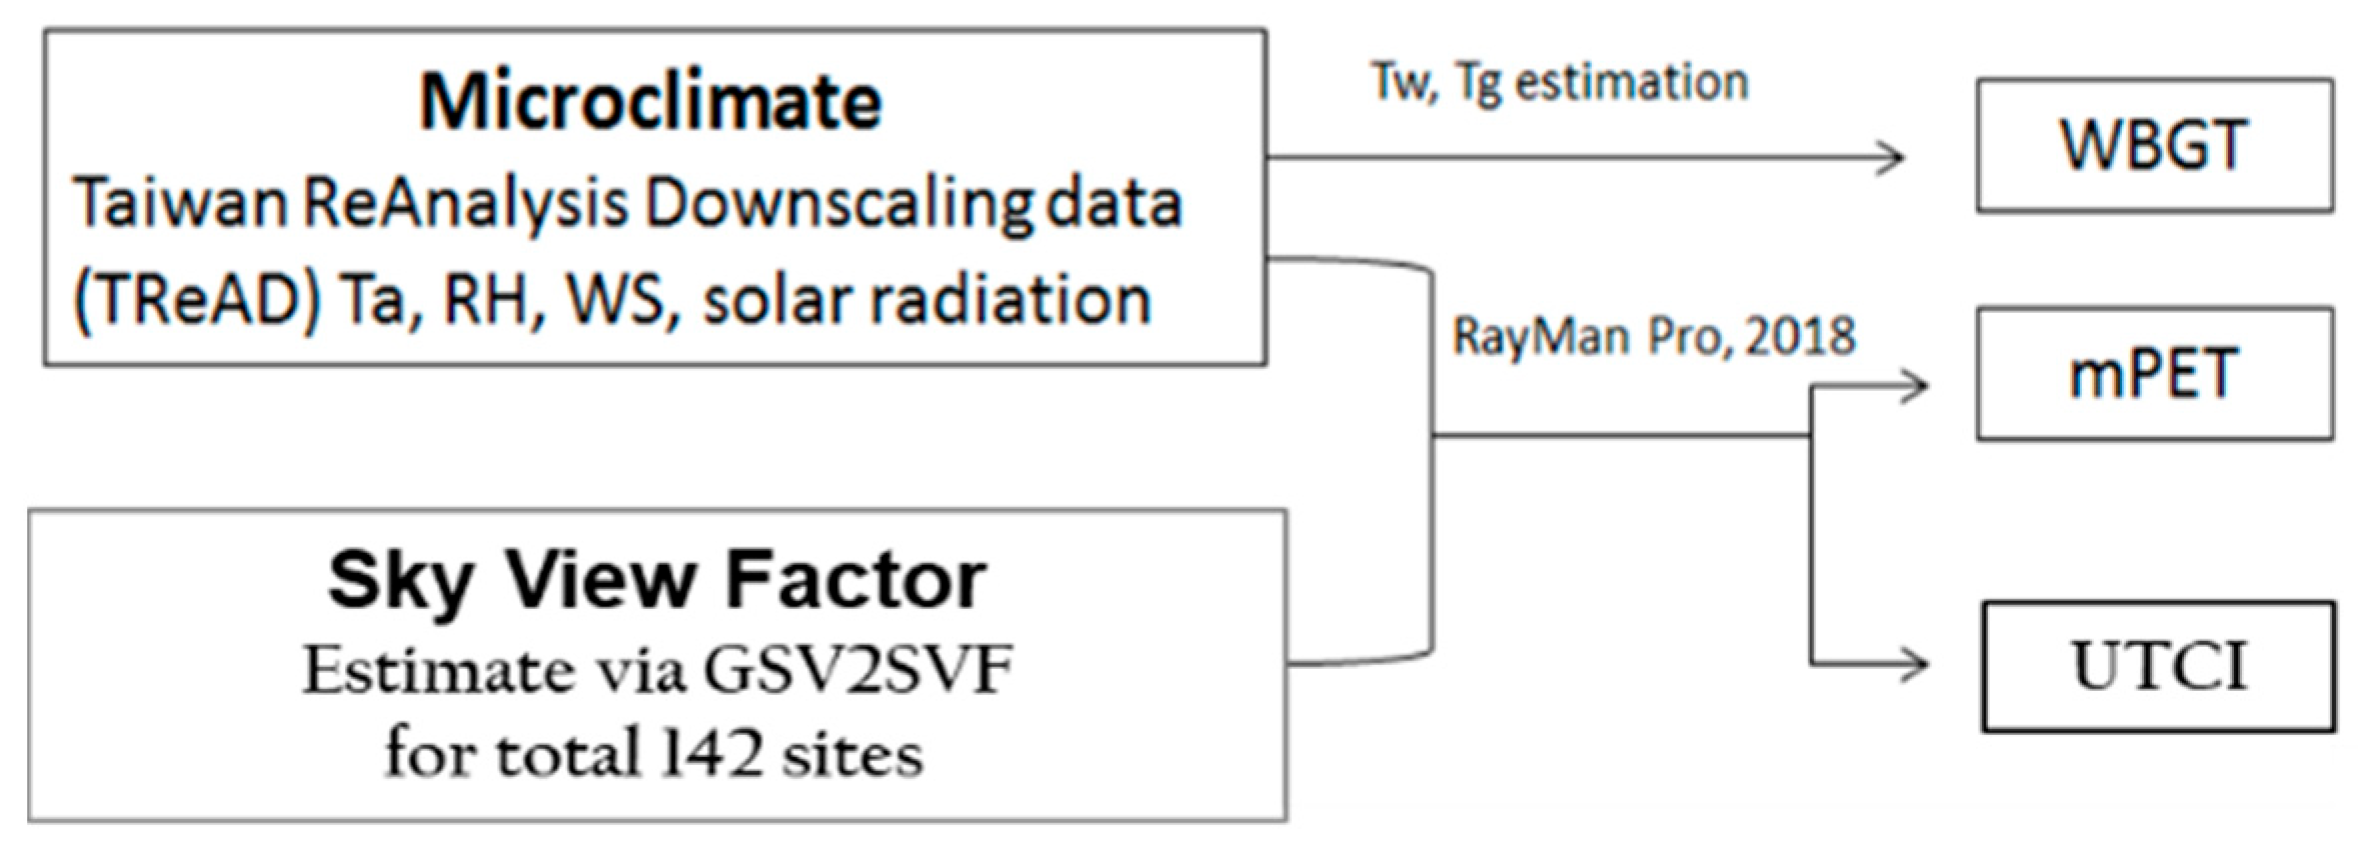
Figure 1. The relay spanned from 6:00 a.m. on 20 April to 11:00 a.m. on 8 May, was scheduled for 9–10 h daily, and included 5–8 runners shifting. The data and the process phases are summarized in
Scheme 1. More details regarding Taiwan ReAnalysis Downscaling data (TReAD), Sky View Factor (SVF), and the evaluation of thermal indices are described in
Section 2.2,
Section 2.3 and
Section 2.4.
2.2. Meso-Scale Environmental Data for the Background Environment Analysis
The real-time monitoring and forecasting data present the weather details for specific days, while the reanalysis downscaling data of recent years show the symptoms and characteristics of different built environments, which could provide the background information for the analysis and arrangements for outdoor events held in large areas of various built environments.
Taiwan ReAnalysis Downscaling data (TReAD) was developed by the Taiwan Climate Change Projection Information and Adaptation Knowledge Platform (TCCIP), the National Science and Technology Council (NSTC), and the National Science and Technology Center for Disaster Reduction (NCDR), Taiwan. By applying the Weather Research and Forecasting (WRF) Model to dynamically downscale the European Centre for Medium-Range Weather Forecasts (ECMWF) Reanalysis version 5 data, TReAD could produce higher resolution data. Furthermore, TReAD also integrated the surface terrain data, land-use information, and cloud amount data to better simulate the environmental condition near the surface. Moreover, TReAD data has been compared with the data from monitoring stations of Central Weather Administration, Taiwan. Although there are still some errors, the trend of change is similar to the on-site monitoring data and can present long-term climate characteristics [
16]. The TReAD data applied in this study are shown in
Table 2.
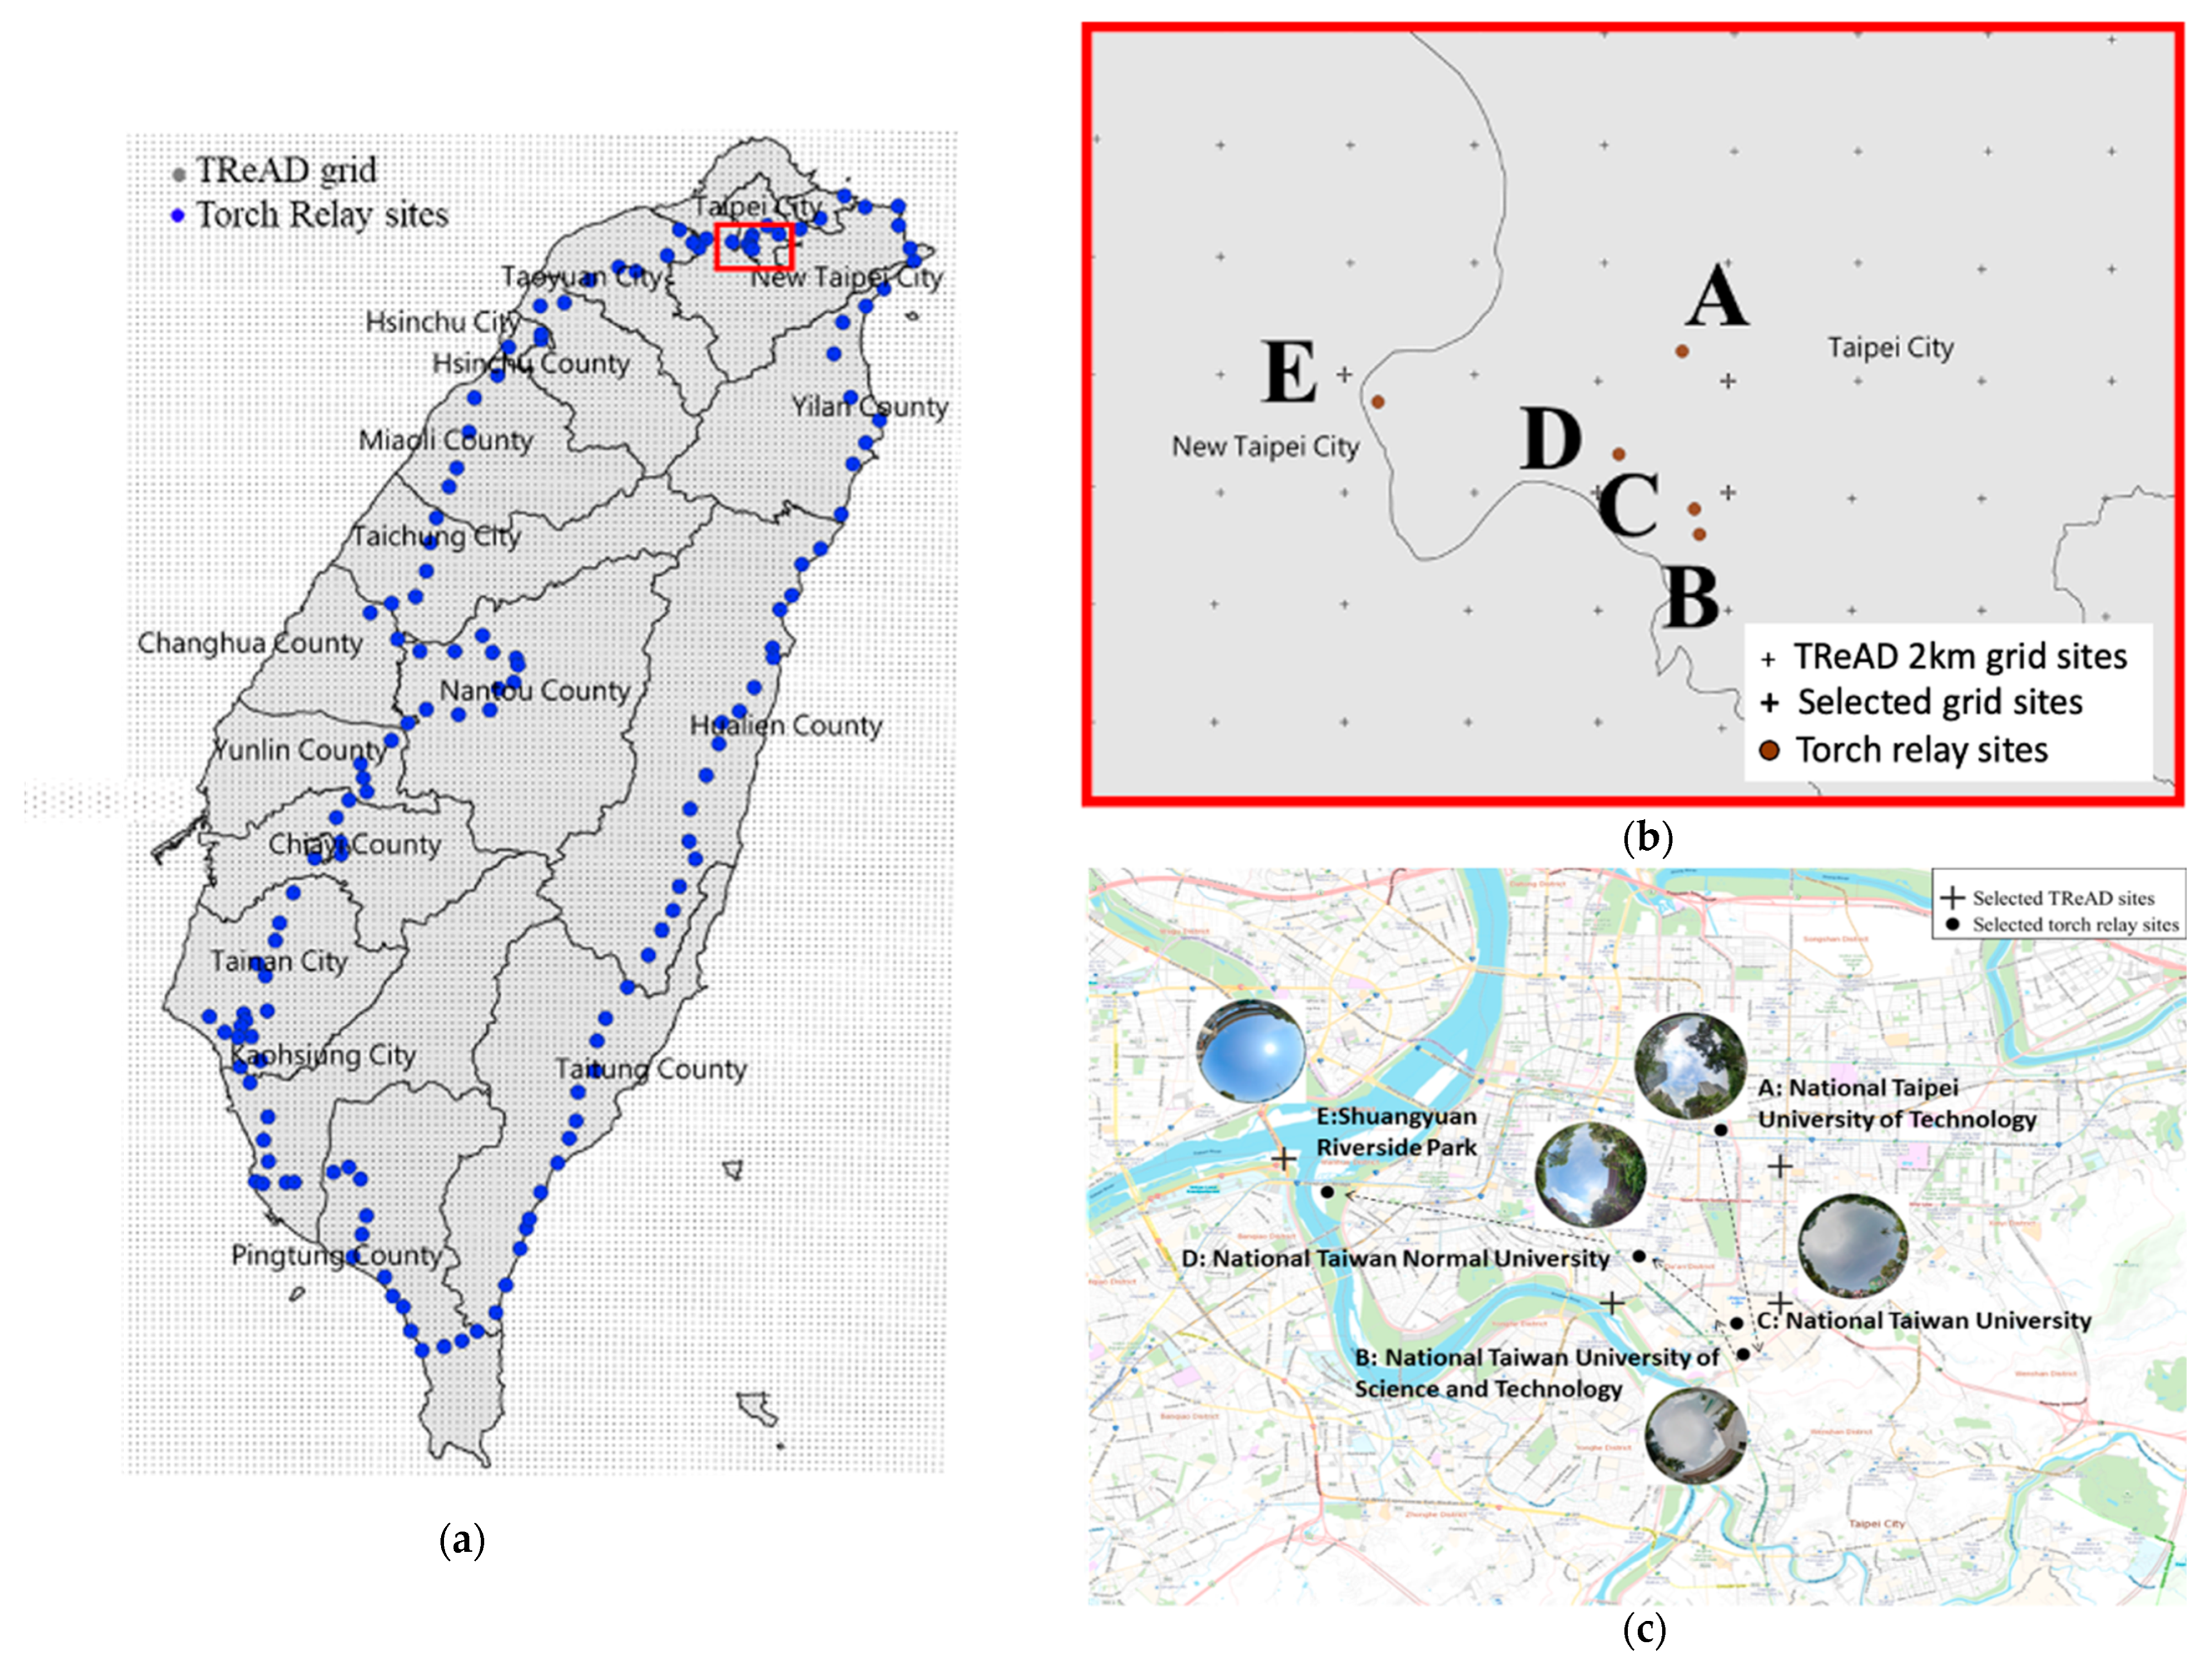
Based on the 142 sites scheduled on the planned routes, TReAD grid data and Google Street View images were selected based on distance. The grid and street view images with the shortest distance were selected, as shown in
Figure 2. The 142 sites are shown in
Figure 2a as blue dots and TReAD 2 km grids are displayed as smaller grey dots. The closest TReAD dataset was selected for the torch relay sites in Taipei, as the example in
Figure 2b,c shows [
15].
2.3. Micro-Scale Data Applied for Detailed Built Environment at Street Level
Urban spatial morphology affects the urban microclimate environment [
17,
18,
19]. The Sky View Factor (SVF) refers to “the ratio of the radiation received/emitted by a plane to the radiation emitted/received by the entire hemispherical environment”. It can effectively reflect the urban spatial and street building morphology and can also be used to simulate and predict urban microscale atmospheric conditions, energy exchange, temperature changes, and other phenomena. It can also provide a practical assessment of individual sunlight exposure and thereby assess human exposure to solar radiation [
20,
21,
22,
23,
24,
25]. SVF represents the density/height of surrounding elements using an estimate from 0 to 1, which is closer to 1 for an open site.
Google Street View (GSV) data around Taiwan is relatively dense, and GSV images are open-access data. Therefore, Google Street View to SVF (GSV2SVF), an interactive GIS tool for converting Google Street View imagery to fisheye imagery, was applied to all sites in this study. With the fisheye photos, we can estimate the SVF [
26,
27]. Google Street View images are a very comprehensive dataset that covers almost all major streets and roads in many countries, but all images are taken in the middle of the road and cannot represent the visible sky area of pedestrian vision. In addition, there is a time difference between the image-taking time and the actual situation, which also causes spatial and interpretive errors. There are studies using different methods to verify the spatial and accuracy deviations of Google Street View [
19,
28,
29]. Due to limited time and resources, we applied the GSV2SVF tool for analysis. Fisheye photos were also inputted to RayMan Pro to better analyze the level of sunlight exposure at each site and the impact of built environments by examining orientation and shadows over time.
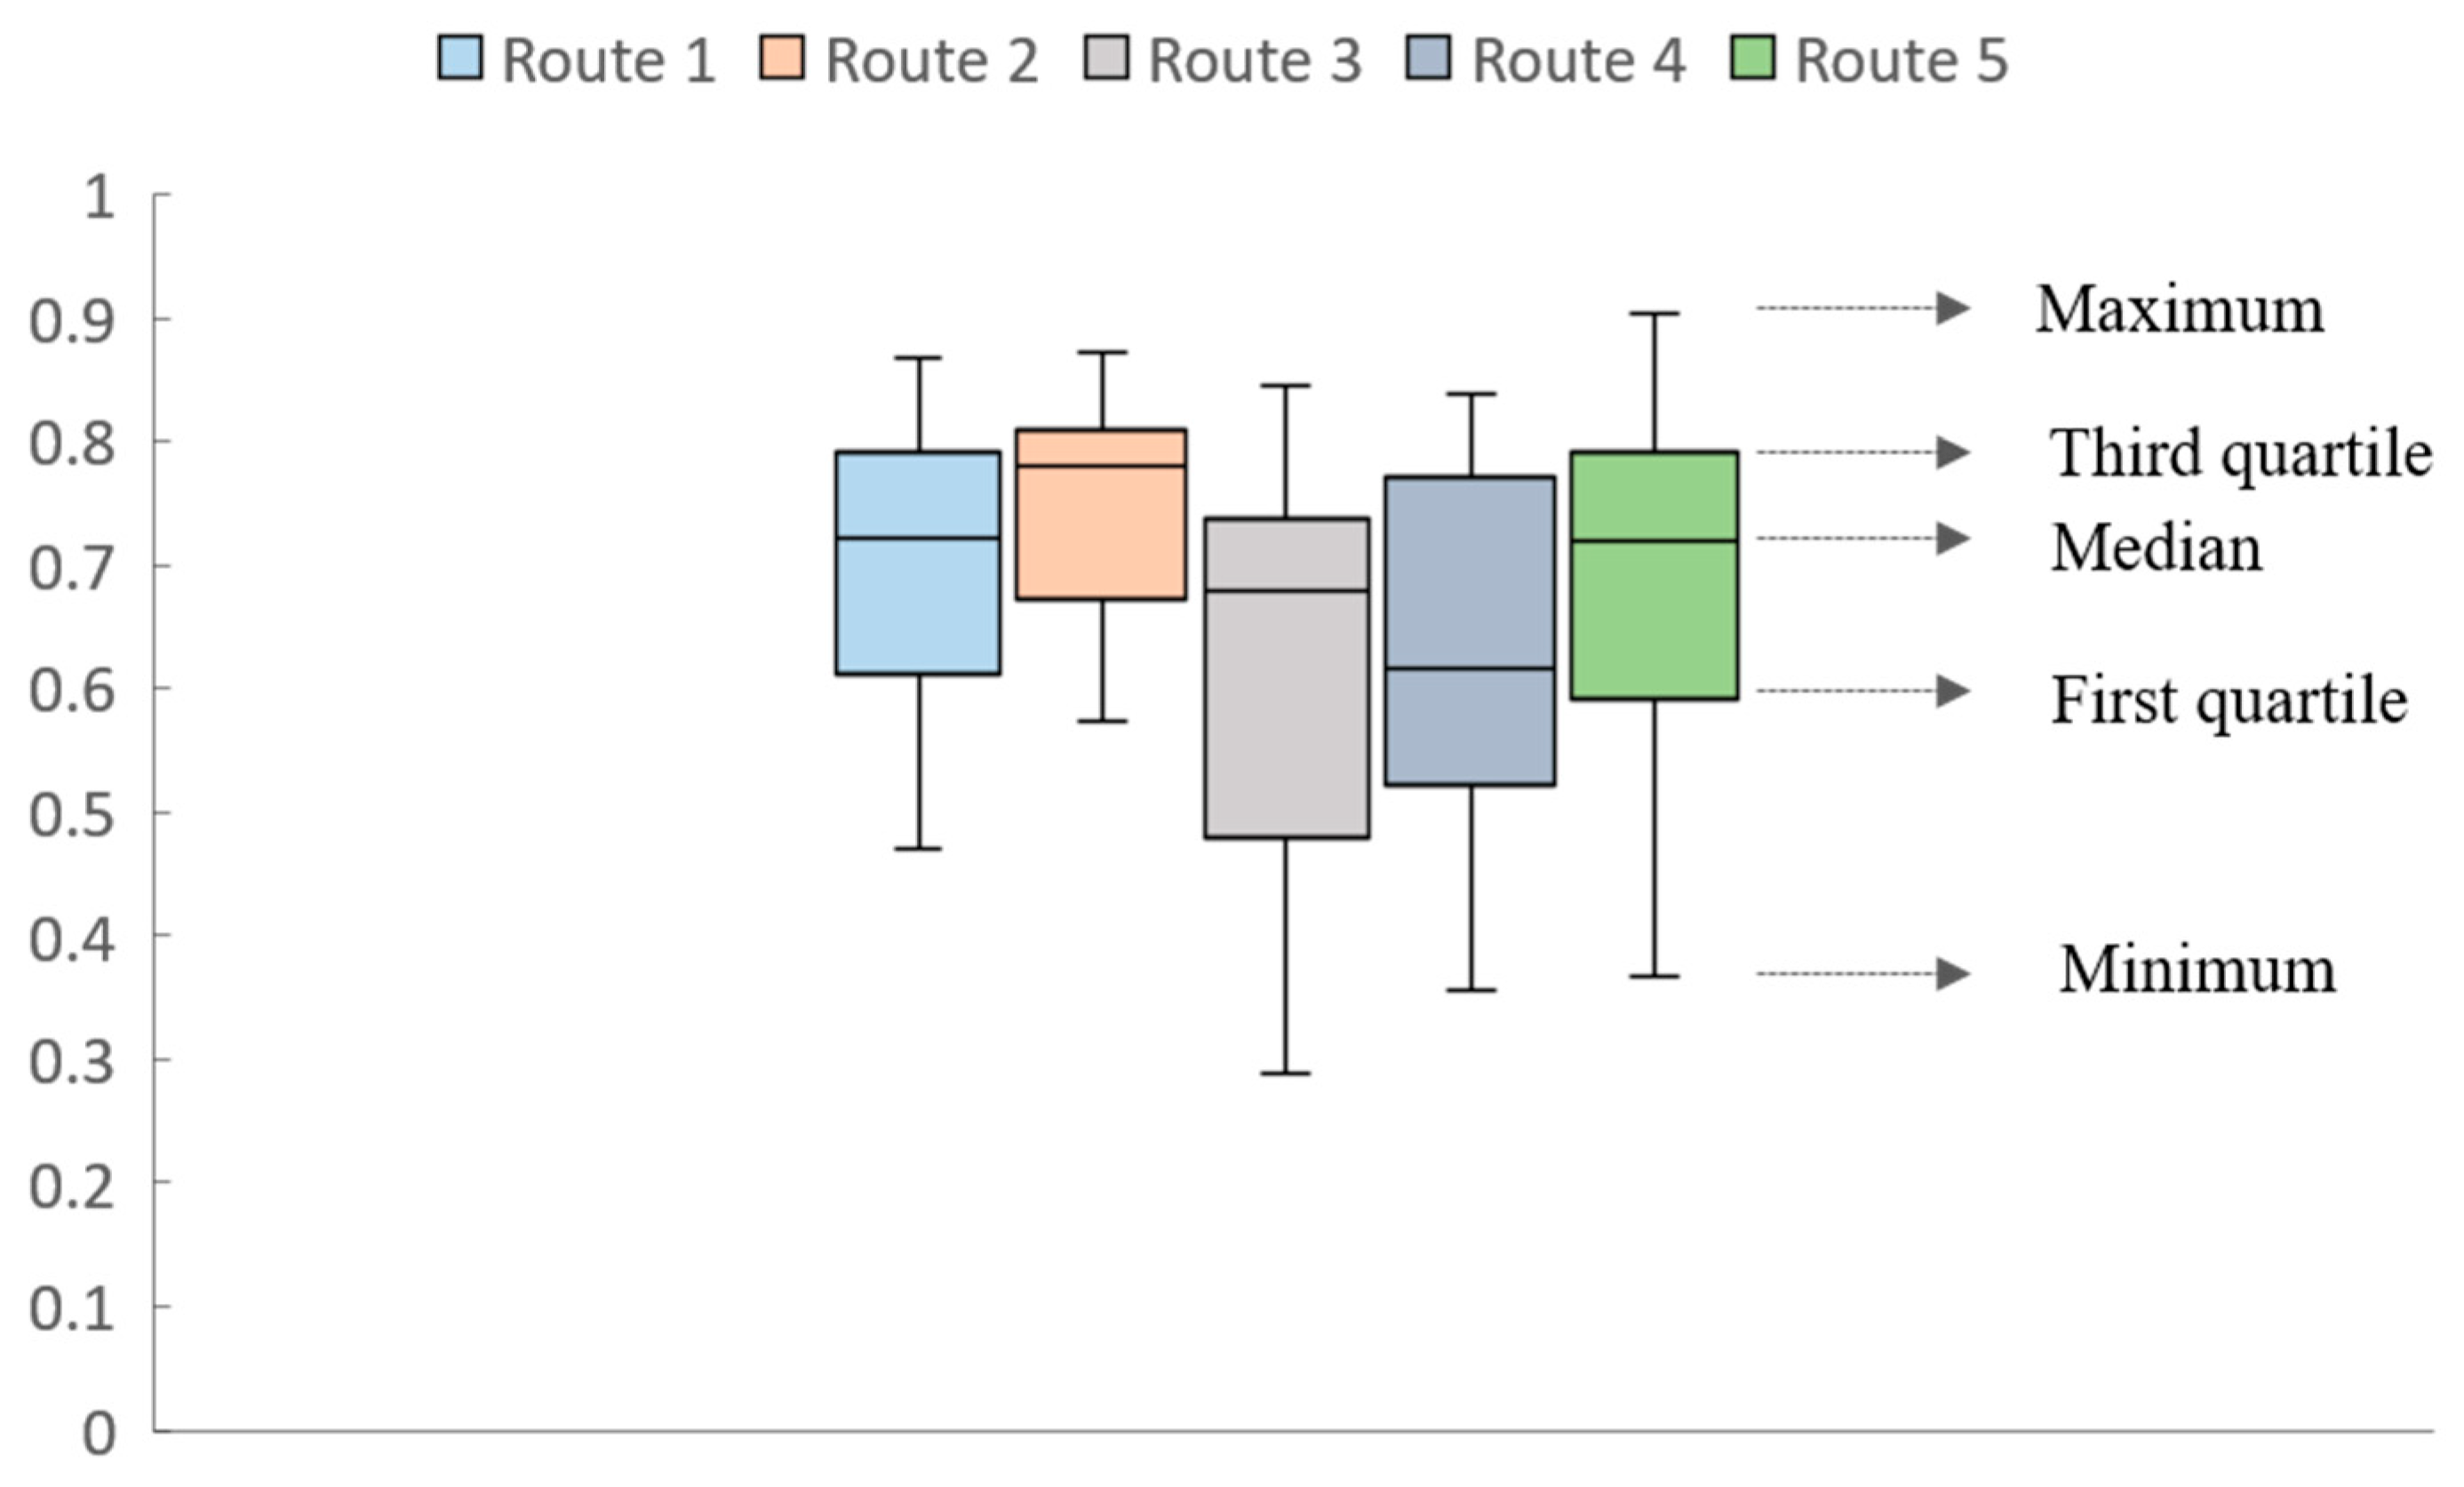
As shown in
Figure 3, the SVF distributions in Routes 3, 4, and 5 are more diverse than those in Route 1 and 2, revealing the different urban compactness archetypes in different parts of Taiwan. Route 1 and 2 covered most of southern and eastern Taiwan, where the built types are relatively open and separate. Route 3, 4, and 5 passed from northern to western Taiwan and covered the most developed cities from medium- to high-level compactness.
2.4. Thermal Indices
2.4.1. mPET and UTCI Estimation
The RayMan pro model was used in this study to estimate the mPET and UTCI [
30,
31]. The initial metabolic rate and clothing insulation for the torchbearers were set according to the ISO 7730, ISO 8996 and ASHRAE standards [
32,
33,
34]. Here, a torchbearer is defined as a jogger who completes a 10 km route in 2 h at a pace of 5 km/hour, with a metabolic rate of 200 W/m
2. Since the torchbearers wear identical outfits, the clothing insulation (Icl) value for each torchbearer is fixed to 0.7 clo (typical application, including underwear, shirts, pants, socks, shoes, etc.).
2.4.2. Wet Bulb Globe Temperature (WBGT) Estimation
ISO 7243 [
35] defines WBGT as one of the thermal indicators to quantify thermal stress in a constant-direct-sunlight environment, as per Equation (1):
where Tw is the wet bulb temperature (unit of °C), Tg is the globe temperature (unit of °C), and Ta is the air temperature (unit of °C). Ta is viewed as the dry bulb temperature here. Methods of estimating Tg with several environmental factors were applied in this study [
36], as per Equation (2):
where sol is the solar radiation (unit of W/m
2) and wind is the wind speed (unit of m/s).
2.4.3. Thermal Indices Heat Stress Category
In this study, the modified Physiologically Equivalent Temperature (mPET) [
37], Wet Bulb Globe Temperature (WBGT), and Universal Thermal Climate Index (UTCI) were estimated and selected as thermal indicators for the purpose of obtaining a more comprehensive perspective. These three indices consider not only the temperature but also the influence of humidity, wind speed, and radiation and are suitable for the characteristics of hot, humid areas.
People from different regions might have different feelings and tolerances to heat. For example, in Taiwan, “PET 34–38 °C” represents a warm state, while “PET > 38 °C” makes people feel very hot and uncomfortable. Meanwhile, “PET 29–35 °C” and “PET > 35 °C” are European classifications representing “warm” and “very uncomfortable” thermal perceptions [
38,
39]. According to the WBGT standard guidelines for the prevention of heat disorders published by the Japanese Ministry of the Environment and the Japan Sports Association, the risk of heat stress increases when “WBGT > 25 °C” occurs. Once WBGT reaches 28 °C, a “warning” level is reached. Warnings can be issued and adjustments can be made to mitigate thermal risks during sport events [
40,
41,
42]. UTCI involves Ta, RH (or vapor pressure), wind speed, mean radiant temperature, metabolic rate, and clothing factors. Achieving a UTCI of 32 °C on the 10 thermal perception levels was defined as meeting the severe heat stress threshold [
43,
44]. A simple traffic light symbol (green: comfortable/yellow: warm/red: hot) to classify the thermal perceptions and heat stress levels among the three thermal indices is shown in
Table 3.
3. Results
Only considering the SVF is not sufficient to reveal the variations in different built environments. By integrating fisheye photos into the RayMan Pro model, we estimated the shading of sunlight at a specific time and better understood the shading conditions of different built structures and compositions along the routes. As shown in
Table 4, Routes 1, 4, and 5 mostly cover compact mid-rise buildings. Route 2 is relatively open, and most of the buildings in it are scattered and open low-rise buildings. Since Route 3 passes through areas ranging from the less developed Hualien County to the most developed Taipei City and New Taipei City, the SVF range is larger than other routes. Additionally, more sites were arranged in most developed areas. Therefore, the torchbearers ran on Route 3, and they were exposed to high-density building environments for a longer time. With similar SVF values, different built environment components caused different effects. The individual thermal performance for the routes is discussed in the following sections.
3.1. Thermal Performance
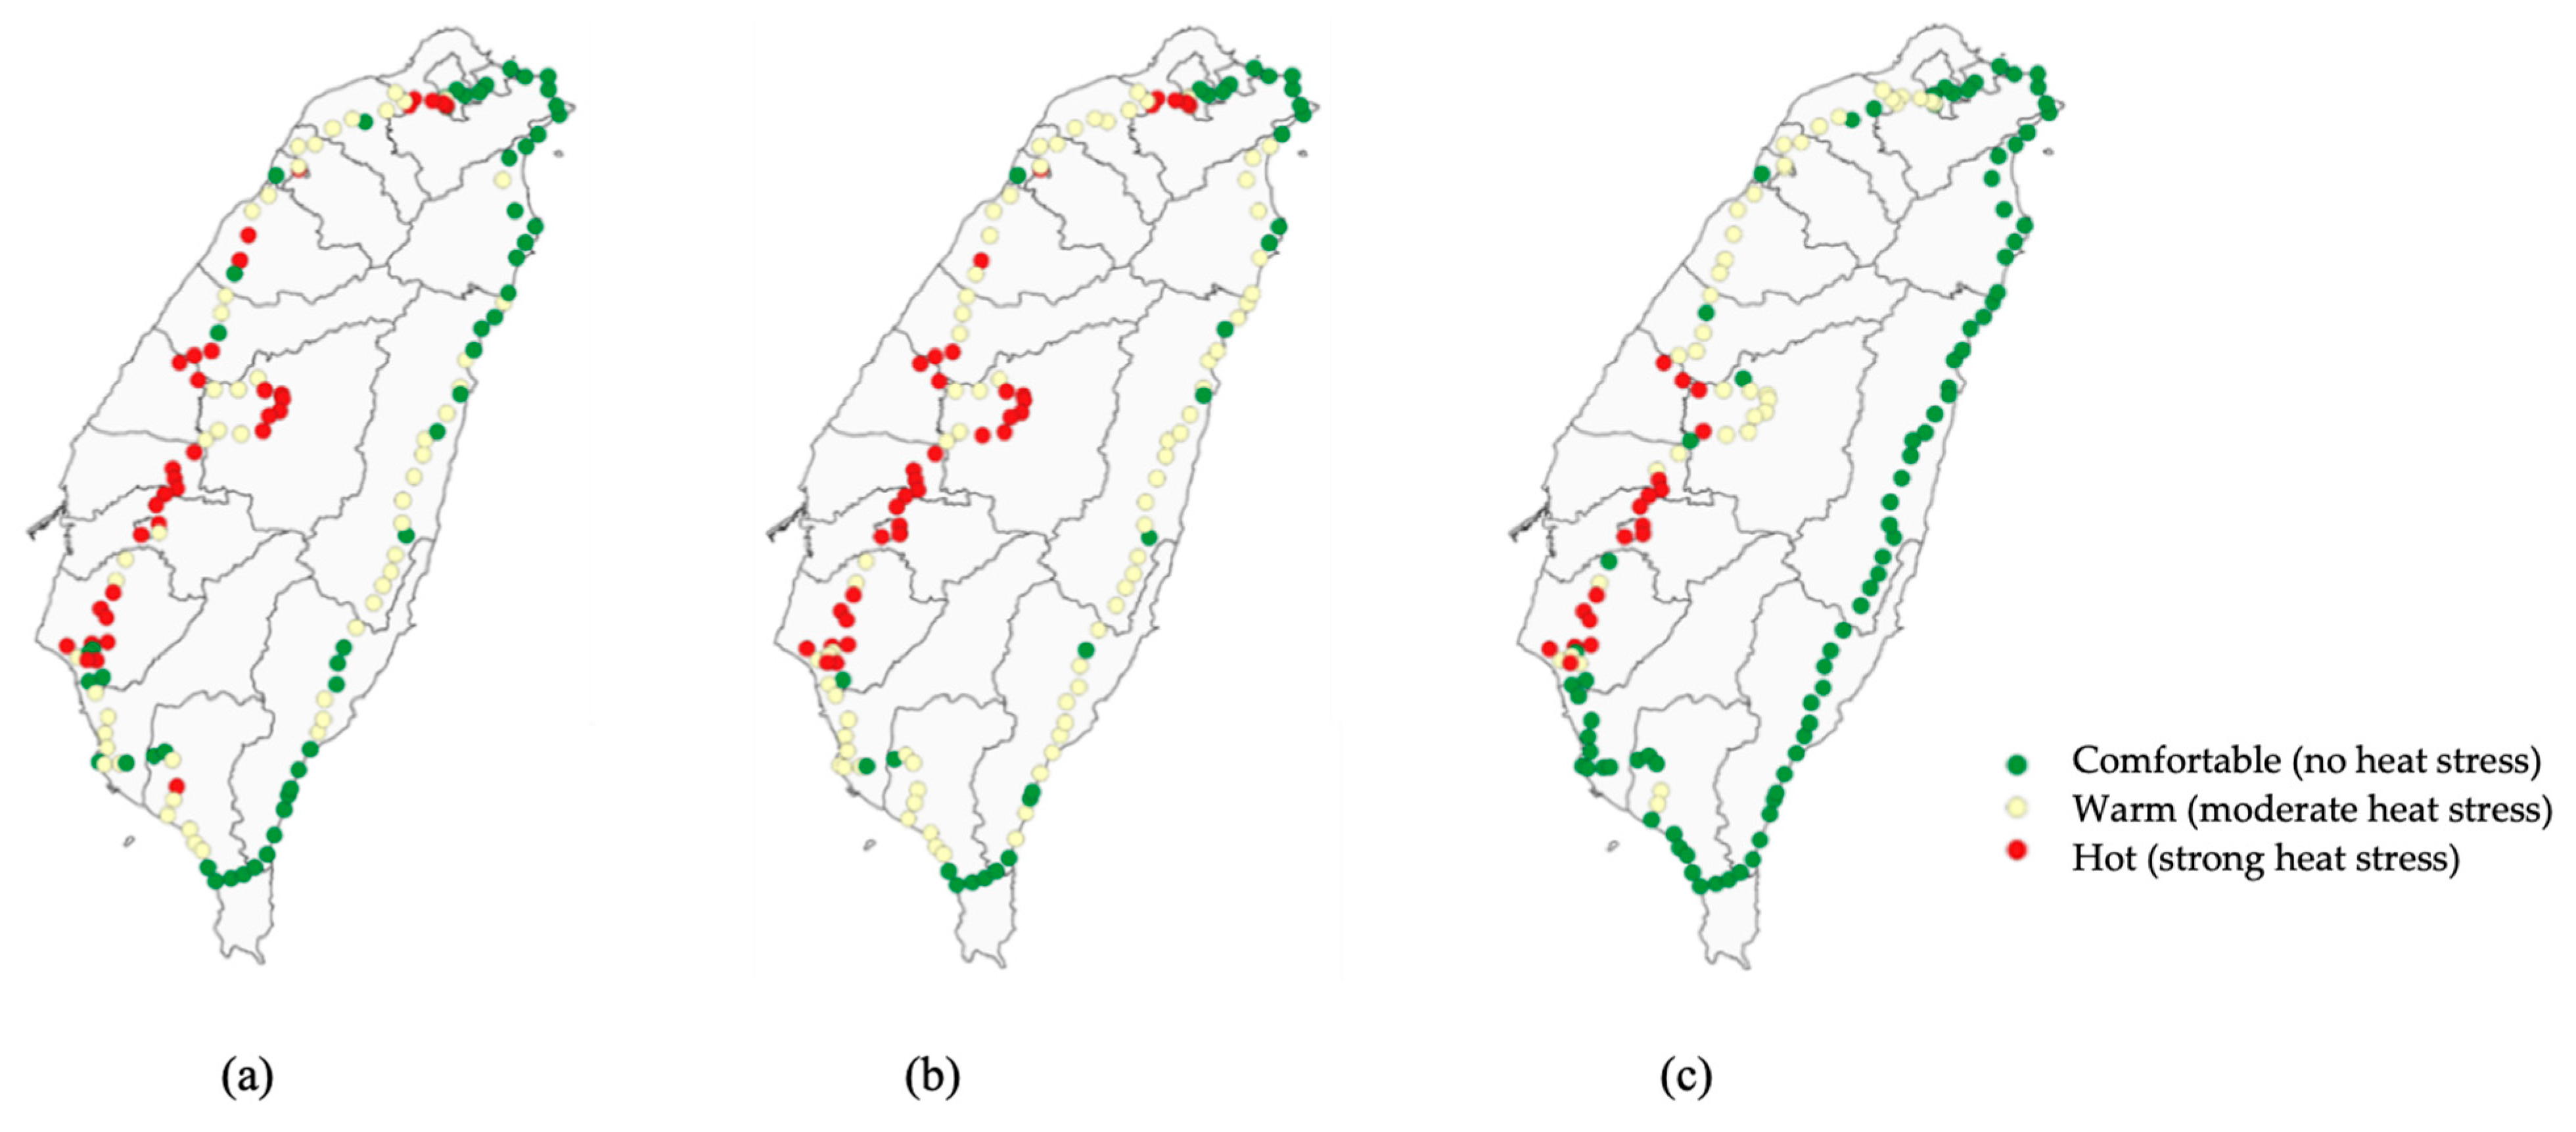
The results of mPET, UTCI, and WBGT performed at scheduled times (from 20 April to 8 May, scheduled daily 9–10 h) are shown in
Figure 4. Each dot represents the on-site thermal performance at the expected time of the torch relay. The three indicators all show that the thermal performance in eastern Taiwan is not only more comfortable than that in western Taiwan but also has a lower heat stress risk. With the running schedule of Routes 1–2–3–4–5, the torchbearers were actually moving along southern–eastern–northern-western Taiwan, which indicates that they were running from more comfortable to less comfortable conditions. In order to better focus on the impact of heat exchange on the torchbearer in different built environments, mPET was selected here as the example thermal indicator for analyzing the thermal performance by time and its correlation with running distance.
3.2. mPET Performance by Time
The relay spanned from 6:00 a.m. on 20 April to 11:00 a.m. on 8 May, was scheduled daily for 9–10 h, and included 5–8 runners shifting in each torch-carrying term. The main running hours were from 7 a.m. to 5 p.m. The daily start and end times could be adjusted depending on the location and local conditions. The hourly mean mPET and the heat stress level among each route are shown in
Table 5. The heat stress risk is generally lower in earlier hours (before 10 a.m.) and is higher from 10 a.m. to 2 p.m. The heat stress risk on Route 4 and Route 5 is obviously higher than that of the other routes.
4. Discussion
Large international activities are facing serious thermal risk threats, such as the World Athletics Championships held in Doha [
1,
2,
6,
7,
45]. This is caused not only by the current specific weather conditions but also by the complex impact of the surrounding built environment [
46,
47]. It could be better adjusted by planning appropriate routes/time schedules/venues in advance such as the changing venue from Tokyo to Sapporo for the marathon in the Tokyo Olympic Games in summer 2020 [
3,
4,
5,
6,
48].
The lack of (1) spatial resolution at the urban scale, (2) details of the built environment, and (3) continuous street data sets for decades can be defined as challenges. The real-time monitoring data shows the weather details for specific days, and the reanalysis of downscaling data of recent years displays the symptoms and characteristics in large areas. Nevertheless, there are also studies that attempt to better understand the significance of and correlation between urban characteristics and land-use changes through machine learning models [
49].
In this study, by applying the reanalysis of downscaling environmental data and microclimate visualization data for a detailed description of the layout at street level, we saw an overall demonstration of thermal risk among the whole island of Taiwan during the April-May period. This could be further developed into annual/seasonal/monthly analysis or assessment systems.
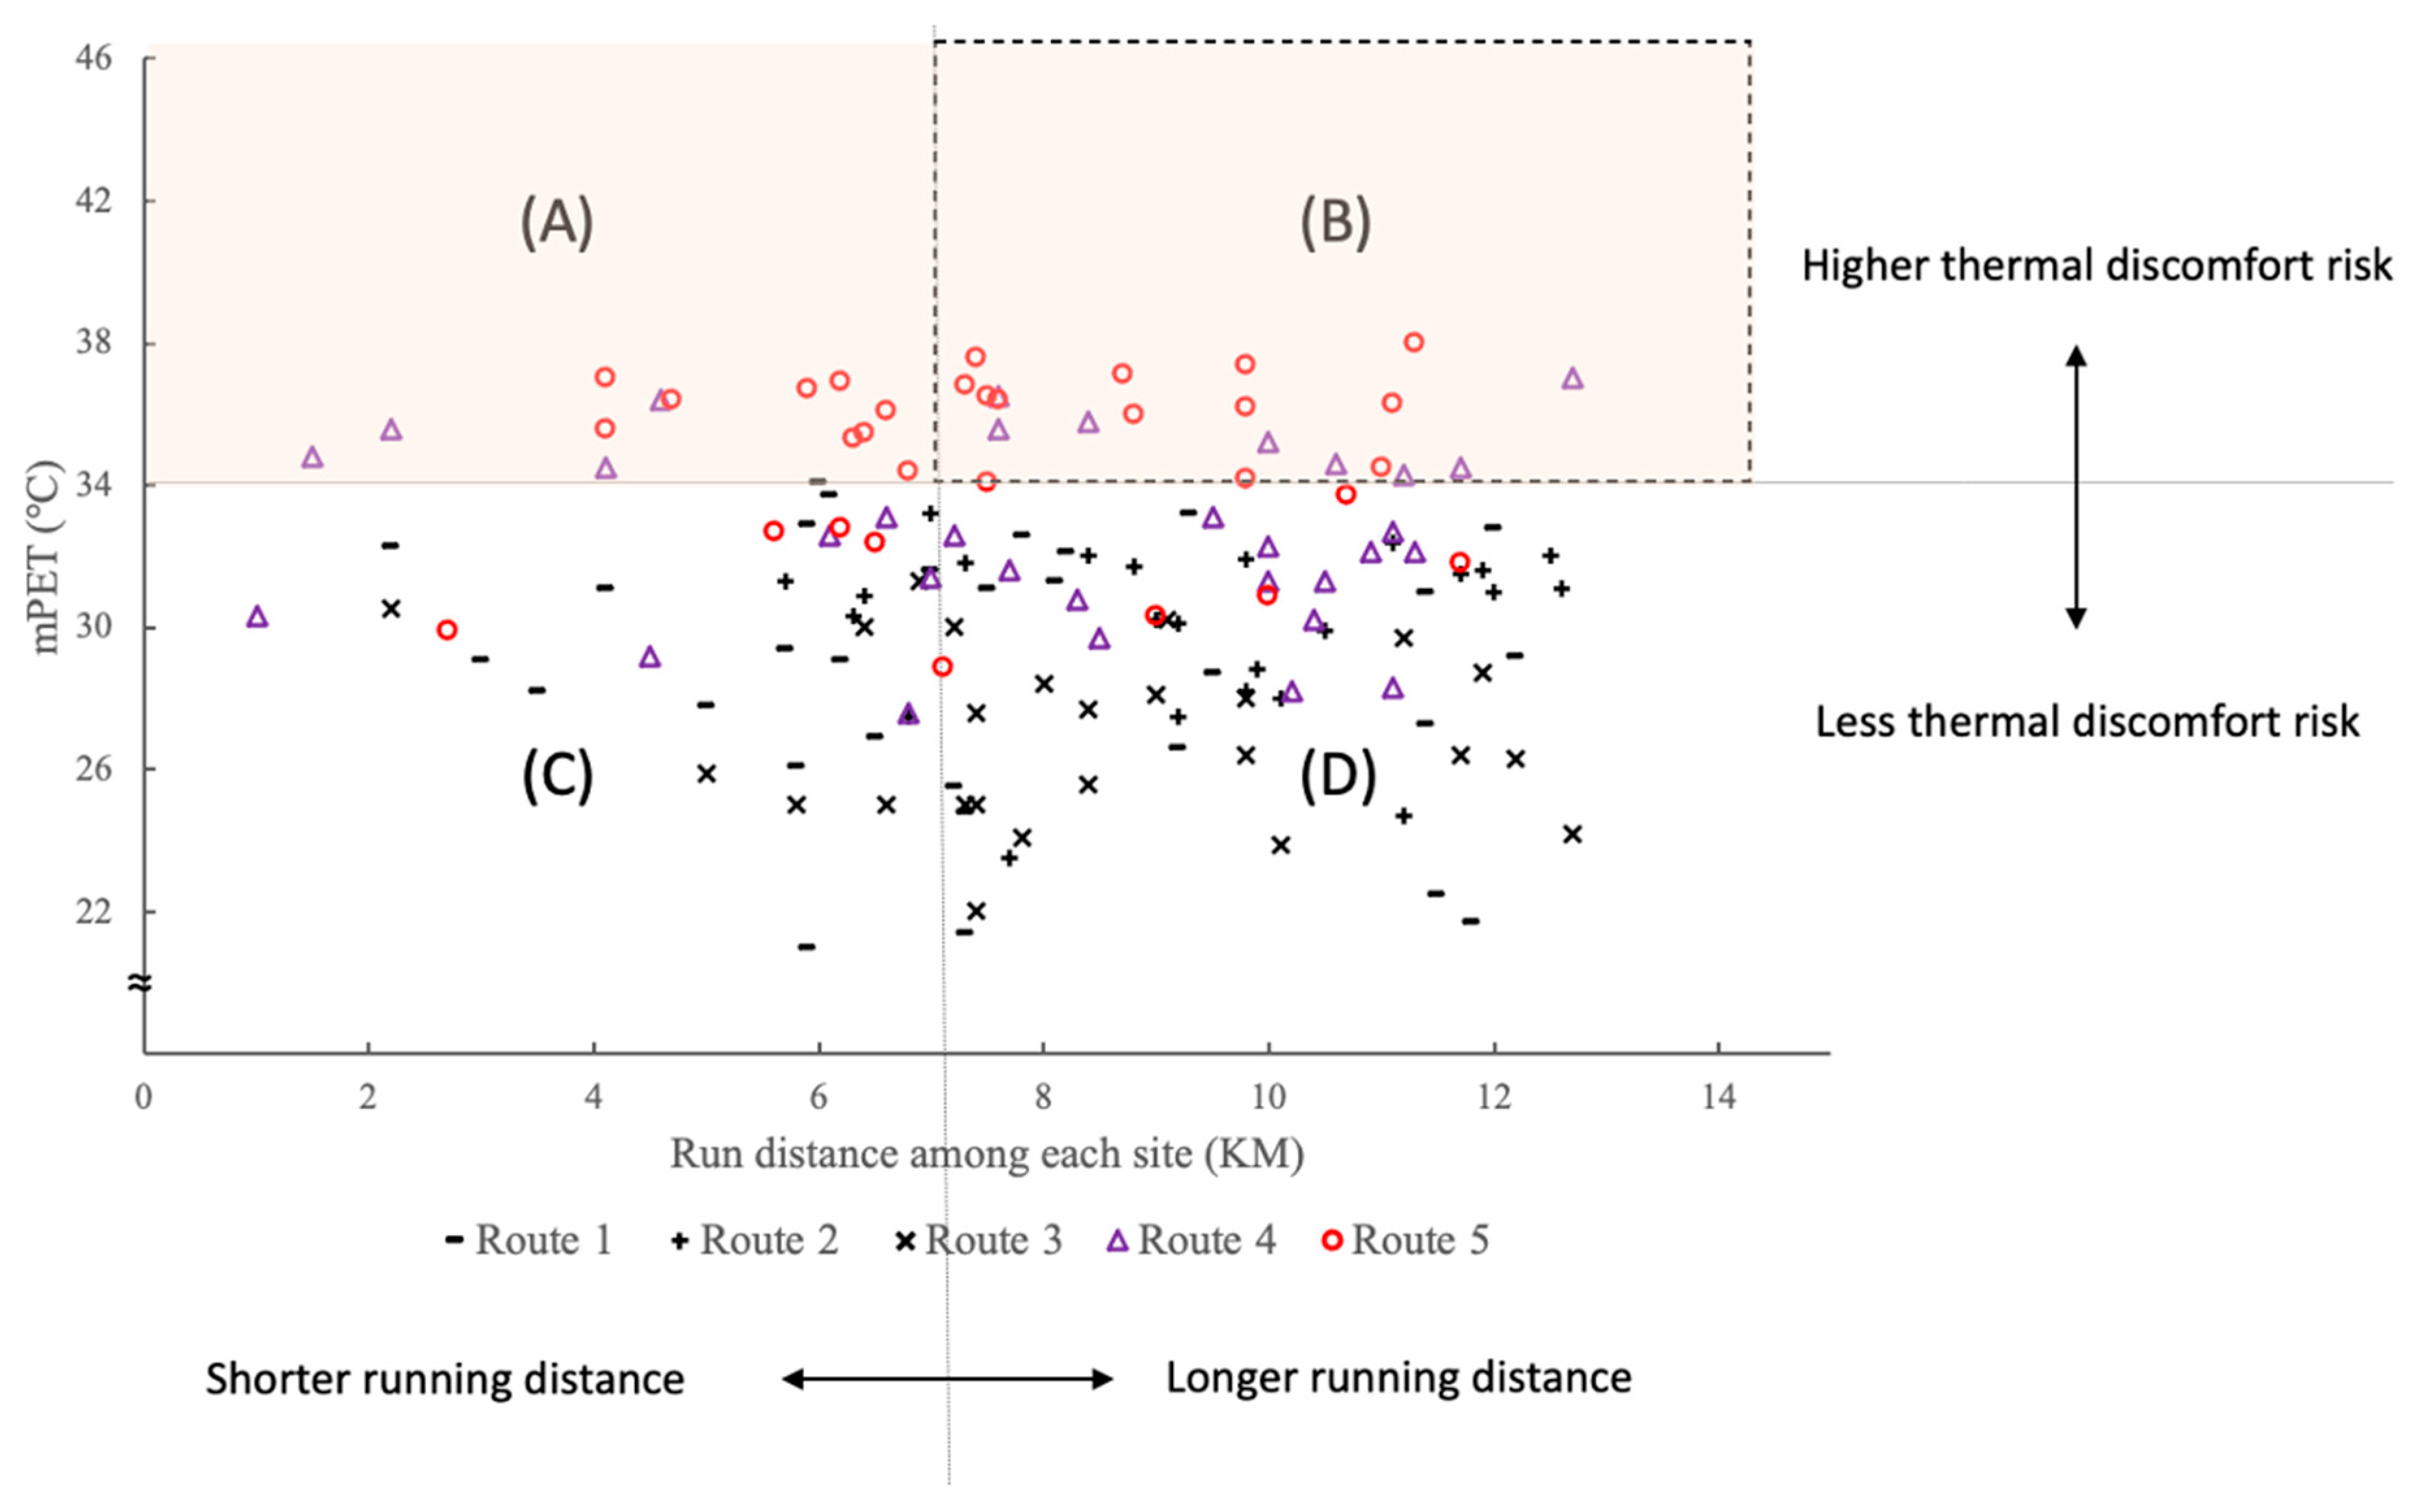
The correlation between mPET and running distance is not obvious, due to (1) the complex environmental factors affecting outdoor thermal comfort, (2) the differences in the surrounding built environment, and (3) the impact on the torchbearers exposed to the surrounding environment over time. The correlation distribution of the mPET performance and the running distance are shown in
Figure 5. Areas (A) and (B) represent the sites with higher thermal risk; therefore, it is appropriate to arrange torchbearers with higher heat tolerance. As for Areas (B) and (D), it is suitable to arrange torchbearers with long-distance running experience. Since Area (B) shows a more challenging situation, torchbearers with better heat resistance and long-distance running ability are much more appropriate. Those who have a lower thermal tolerance and less running experience can be placed into Area (C).
Large-area outdoor activities (torch relay of games, hiking/climbing/cycling around the island, cross country, etc.) involve participants of different backgrounds, endurance training levels, ages, genders, and nationalities. In this study, the 2021 Torch Relay Round the Island, Taiwan, was selected as a case study for the thermal assessment of large-area and long-duration outdoor events. There were more than 60 torchbearers and 10 bicycle riders participating, and every participant voluntarily joined, including college students, graduated alumni, running enthusiasts, and local residents. Participants of all genders, aged between 20 and 50 years old, were involved in this event. Age and gender differences can affect the results of thermal discomfort analysis: the elderly and infants have a poorer perception of the thermal environment [
50,
51,
52], and even with the same weight, females tend to have less muscle mass to generate body heat. Therefore, males tend to feel hotter in the same thermal environment [
53].
Using reanalysis downscaling data for thermal assessment among various built environments would be helpful in (1) indicating the high-risk sites or routes requiring cooling strategies in advance, such as adjusting the daily start/end time, increasing the shift members, reducing the distance loading for each person, and avoiding high-risk periods, and (2) providing instructions for making appropriate arrangements of the schedule for torchbearers according to their physical fitness and the thermal toleration capacity.
To approach a comprehensive thermal assessment of a large-area and long-duration outdoor sport event, it is essential to integrate the influence of different built environments. Estimating the correlation between the built types and the thermal performance is important to determine the appropriate thermal index that represents the regional heat symptom. In this study, mPET was selected to demonstrate the process of presenting the thermal risk and thermal perception as traffic light symbols (green means comfortable: no heat stress; yellow means warm: moderate heat stress; red means hot: strong heat stress). Hiking and cycling around the island have become more and more popular in Taiwan; therefore, it is necessary to establish a standard with simple and clear visual instructions to draw people’s attention. Due to time limitations, we did not arrange interviews or surveys during the event, and we could not see how intuitive the “traffic light symbol” is to the torchbearers and the host. It is crucial for future follow-up studies to include participants’ feedback or subjective evaluations.
5. Conclusions
This study mainly focuses on establishing a method for evaluating environmental thermal comfort for large-scale, long-term outdoor activities and provides suggestions for the arrangement of shifts in routes and participants for heat warning and mitigation. The diversity of participants (gender, age, training level, background, etc.) has not been well discussed in this study, which will be included for detailed assessment in future related research plans.
In this study, (1) by applying the reanalysis downscaling environmental data for recent years, the symptoms and characters for the target areas and the pattern could be shown, and (2) by integrating the SVF estimation results and fisheye photos, different thermal effects among different built environments at street level could be seen. This can be helpful for having overall information about the thermal risk and thermal perception among the whole island of Taiwan during the April–May period.
The thermal performance analysis results show that the thermal performance in eastern Taiwan is not only more comfortable than that in western Taiwan but also has less heat stress risk. Routes 4 and 5 have a higher thermal discomfort risk than the other routes. The torchbearers followed the scheduled Route 1–2–3–4–5 and ran from more comfortable to less comfortable conditions. If it were possible to adjust the schedule before the event, Route 1–2–3–4–5 should be avoided; otherwise, more heat mitigation strategies shall be applied.
Traffic light symbols (green: comfortable; yellow: warm; red: hot) in thermal discomfort risk and thermal perceptions are also defined, which provides an easy-to-understand way to describe and visualize the thermal concept. Since the torchbearers were from different regions and had different training experiences, each participant had different abilities in both thermal tolerance and running distance. Therefore, through the thermal performance of each site and the distribution of running distances, torchbearers can be classified according to the attributes of individuals, which can help in arranging the running schedule and reducing the risk of thermal discomfort.
Author Contributions
Conceptualization and methodology, S.-Y.Y., T.-P.L. and A.M.; Formal analysis and investigation, S.-Y.Y.; Writing—original draft preparation, S.-Y.Y.; Writing—review and editing, S.-Y.Y., T.-P.L. and A.M. All authors have read and agreed to the published version of the manuscript.
Funding
This research received no external funding.
Data Availability Statement
Data available on request from the authors.
Acknowledgments
The authors greatly appreciate the support, data transfer, and data sharing from the Taiwan Climate Change Projection Information and Adaptation Knowledge Platform (TCCIP) Taiwan ReAnalysis Downscaling data (TReAD), National Science and Technology Council (NSTC), and National Science and Technology Center for Disaster Reduction (NCDR), Taiwan.
Conflicts of Interest
The authors declare no conflicts of interest.
Abbreviations
| ECMWF | European Centre for Medium-Range Weather Forecasts |
| Icl | clothing insulation |
| ASHRAE | American Society of Heating, Refrigerating and Air-Conditioning Engineers |
| GSV | Google Street View |
| GSV2SVF | Google Street View to Sky View Factor |
| ISO | International Organization for Standardization |
| mPET | modified Physiologically Equivalent Temperature |
| NCDR | National Science and Technology Center for Disaster Reduction |
| NSTC | National Science and Technology Council |
| PET | Physiologically Equivalent Temperature |
| SVF | Sky View Factor |
| TCCIP | Taiwan Climate Change Projection Information and Adaptation Knowledge Platform |
| TReAD | Taiwan ReAnalysis Downscaling data |
| UTCI | Universal Thermal Climate Index |
| WBGT | Wet Bulb Globe Temperature |
| WRF | Weather Research and Forecasting Model |
References
- Matzarakis, A.; Frohlich, D. Sport events and climate for visitors—The case of FIFA World Cup in Qatar 2022. Int. J. Biometeorol. 2015, 59, 481–486. [Google Scholar] [CrossRef] [PubMed]
- Matzarakis, A.; Graw, K. Human Bioclimate Analysis for the Paris Olympic Games. Atmosphere 2022, 13, 269. [Google Scholar] [CrossRef]
- Matzarakis, A.; Fröhlich, D.; Bermon, S.; Adami, P. Visualization of Climate Factors for Sport events and Activities–The Tokyo 2020 Olympic Games. Atmosphere 2019, 10, 572. [Google Scholar] [CrossRef]
- Wu, Y.; Graw, K.; Matzarakis, A. Comparison of thermal comfort between Sapporo and Tokyo—The case of the Olympics 2020. Atmosphere 2020, 11, 444. [Google Scholar] [CrossRef]
- Seo, Y.; Honjo, T. Thermal stress in Tokyo and Sapporo during the 2020 Olympics period. J. Environ. Inf. Sci. 2021, 1, 29–36. [Google Scholar]
- Matzarakis, A.D.; Fröhlich, S.B.; Adami, E.P. Quantifying Thermal Stress for Sport Events—The Case of the Olympic Games 2020 in Tokyo. Atmosphere 2018, 9, 479. [Google Scholar] [CrossRef]
- Hosokawa, Y.; Grundstein, A.J.; Casa, D.J. Extreme Heat Considerations in International Football Venues: The Utility of Climatologic Data in Decision Making. J. Athl. Train. 2018, 53, 860–865. [Google Scholar] [CrossRef]
- Vanos, J.K.; Kosaka, E.; Iida, A.; Yokohari, M.; Middel, A.; Scott-Fleming, I.; Brown, R.D. Planning for spectator thermal comfort and health in the face of extreme heat: The Tokyo 2020 Olympic marathons. Sci. Total Environ. 2019, 657, 904–917. [Google Scholar] [CrossRef]
- Yu, S.-Y.; Matzarakis, A.; Lin, T.-P. A Study of the Thermal Environment and Air Quality in Hot–Humid Regions during Running Events in Southern Taiwan. Atmosphere 2020, 11, 1101. [Google Scholar] [CrossRef]
- Olympic Games Tokyo 2020. Available online: https://olympics.com/en/olympic-games/tokyo-2020/torch-relay (accessed on 2 April 2025).
- Lin, T.P.; Yang, S.-R.; Chen, Y.-C.; Matzarakis, A. Potential for Modified Physiologically Equivalent Temperature (mPET) Based on Local Thermal Comfort Perception in Hot and Humid Areas. Theor. Appl. Climatol. 2019, 135, 873–876. [Google Scholar] [CrossRef]
- Blaylock, B.K.; Horel, J.D.; Galli, C. High-Resolution Rapid Refresh Model Data Analytics Derived on the Open Science Grid to Assist Wildland Fire Weather Assessment. J. Atmos. Ocean. Technol. 2018, 35, 2213–2227. [Google Scholar] [CrossRef]
- Jänicke, B.; Kim, K.R.; Cho, C. A simple high-resolution heat-stress forecast for Seoul, Korea: Coupling climate information with an operational numerical weather prediction model. Int. J. Biometeorol. 2020, 64, 1197–1205. [Google Scholar] [CrossRef] [PubMed]
- Giunta, G.; Salerno, R.; Ceppi, A.; Ercolani, G.; Mancini, M. Effects of Model Horizontal Grid Resolution on Short- and Medium-Term Daily Temperature Forecasts for Energy Consumption Application in European Cities. Adv. Meteorol. 2019, 2019, 1561697. [Google Scholar] [CrossRef]
- Yu, S.-Y.; Matzarakis, A.; Lin, T.-P. A Study Regarding the Thermal Environment and Thermal Comfort during the 2021 National Intercollegiate Athletic Games and Related Activities in Taiwan. Environ. Sci. Proc. 2021, 8, 32. [Google Scholar]
- Taiwan Climate Change Projection and Information Platform, TCCIP, E-Newsletter No. 46. Available online: https://tccip.ncdr.nat.gov.tw/user/km_newsletter_one.aspx?nid=20210323110413 (accessed on 11 June 2025).
- Matzarakis, A.; Matuschek, O. Sky view factor as a parameter in applied climatology-rapid estimation by the SkyHelios model. Meteorol. Z. 2011, 20, 39. [Google Scholar] [CrossRef]
- Ahmadi, A.; Tenpierik, V.; Taleghani, M. The role of sky view factor and urban street greenery in human thermal comfort and heat stress in a desert climate. J. Arid. Environ. 2019, 166, 68–76. [Google Scholar] [CrossRef]
- Xia, Y.; Yabuki, N.; Fukuda, T. Sky view factor estimation from street view images based on semantic segmen-tation. Urban Clim. 2021, 40, 100999. [Google Scholar] [CrossRef]
- Oke, T.R. Canyon geometry and the nocturnal urban heat island: Comparison of scale model and field observations. J. Climatol. 1981, 1, 237–254. [Google Scholar] [CrossRef]
- Watson, I.D.; Johnson, G.T. Graphical estimation of sky view-factors in urban environments. J. Climatol. 1987, 7, 193–197. [Google Scholar] [CrossRef]
- Krüger, E.L.; Minella, F.O.; Rasia, F. Impact of urban geometry on outdoor thermal comfort and air quality from field measurements in Curitiba, Brazil. Build. Environ. 2011, 46, 621–634. [Google Scholar] [CrossRef]
- Svensson, M.K. Sky view factor analysis–implications for urban air temperature differences. Meteorol. Appl. 2004, 11, 201–211. [Google Scholar] [CrossRef]
- Tan, C.L.; Wong, N.H.; Jusuf, S.K. Outdoor mean radiant temperature estimation in the tropical urban environment. Build. Environ. 2013, 64, 118–129. [Google Scholar] [CrossRef]
- Zhu, S.; Guan, H.; Bennett, J.; Clay, R.; Ewenz, C.; Benger, S.; Maghrabi, A.; Millington, A.C. Influence of sky temperature distribution on sky view factor and its applications in urban heat island. Int. J. Climatol. 2013, 33, 1837–1843. [Google Scholar] [CrossRef]
- Liang, J.; Gong, J.; Zhang, J.; Li, Y.; Wu, D.; Zhang, G. GSV2SVF-an interactive GIS tool for sky, tree and building view factor estimation from street view photographs. Build. Environ. 2020, 168, 106475. [Google Scholar] [CrossRef]
- Gong, F.-Y.; Zeng, Z.-C.; Zhang, F.; Li, X.-J.; Ng, E.; Norford, L. Mapping sky, tree, and building view factors of street canyons in a high density urban environment. Build. Environ. 2018, 134, 155–167. [Google Scholar] [CrossRef]
- Zamir, A.R.; Shah, M. Accurate image localization based on Google Maps Street View. In Computer Vision–ECCV 2010; Springer: Berlin/Heidelberg, Germany, 2010; pp. 255–268. [Google Scholar]
- Carrasco-Hernandez, R.; Smedley, A.R.D.; Webb, A.R. Using urban canyon geometries obtained from Google Street View for atmospheric studies: Potential applications in the calculation of street level total shortwave irradiances. Energy Build. 2015, 86, 340–348. [Google Scholar] [CrossRef]
- Matzarakis, A.; Rutz, F.; Mayer, H. Modelling radiation fluxes in simple and complex environments—Application of the RayMan model. Int. J. Biometeorol. 2007, 51, 323–334. [Google Scholar] [CrossRef] [PubMed]
- Matzarakis, A.; Rutz, F.; Mayer, H. Modelling radiation fluxes in simple and complex environments: Basics of the RayMan model. Int. J. Biometeorol. 2010, 54, 131–139. [Google Scholar] [CrossRef]
- ISO 7730; Ergonomics of the Thermal Environment—Analytical Determination and Interpretation of Thermal Comfort Using Calculation of the PMV and PPD Indices and Local Thermal Comfort Criteria. ISO: Geneva, Switzerland, 2005.
- ISO 8996; Classification of Metabolic Rates by Activity, Ergonomics of Thermal Environments-Determination of Metabolic Heat Production. ISO: Geneva, Switzerland, 1989.
- ASHRAE Standard 55; Thermal Environmental Conditions for Human Occupancy. ATLANTA: Peachtree Corners, GA, USA, 2010.
- ISO 7243; Hot Environments—Estimation of the Heat Stress on Working Man, Based on the WBGT-Index (Wet Bulb Globe Temperature). ISO: Berlin, Germany, 1989.
- Okada, M.; Kusaka, H. Proposal of a new equation to estimate globe temperature in an urban park environment. J. Agric. Meteorol. 2013, 69, 23–32. [Google Scholar] [CrossRef]
- Chen, Y.-C.; Matzarakis, A. Modified physiologically equivalent temperature—Basics and applications for western European climate. Theor. Appl. Clim. 2018, 132, 1275–1289. [Google Scholar] [CrossRef]
- Lin, T.-P.; Matzarakis, A. Tourism climate and thermal comfort in Sun Moon Lake, Taiwan. Int. J. Biometeorol. 2008, 52, 281–290. [Google Scholar] [CrossRef] [PubMed]
- Matzarakis, A.; Mayer, H.; Iziomon, M.G. Applications of a universal thermal index: Physiological equivalent temperature. Int. J. Biometeorol. 1999, 43, 76–84. [Google Scholar] [CrossRef] [PubMed]
- Ministry of the Environment, Japan, Heat Illness Prevention Information. Available online: https://www.wbgt.env.go.jp/en/wbgt.php (accessed on 2 April 2025).
- Japan Sports Association. A Guidebook for the Prevention of Heat Disorder During Sports Activities; Japan Sports Association: Tokyo, Japan, 2013. [Google Scholar]
- Ministry of the Environment, Japan, Olympic and Paralympic. Available online: https://www.wbgt.env.go.jp/survey/tokyo2020_2020/README.pdf (accessed on 2 April 2025).
- Zare, S.; Hasheminejad, N.; Shirvan, H.E.; Hemmatjo, R.; Sarebanzadeh, K.; Ahmadi, A. Comparing Universal Thermal Climate Index (UTCI) with selected thermal indices/environmental parameters during 12 months of the year. Weather. Clim. Extrem. 2018, 19, 49–57. [Google Scholar] [CrossRef]
- International Union of Physiological Sciences—Thermal Commission. Glossary of terms for thermal physiology. J. Therm. Biol. 2003, 28, 75–106. [Google Scholar] [CrossRef]
- Hollander, K.; Klöwer, M.; Richardson, A.; Navarro, L.; Racinais, S.; Scheer, V.; Murray, A.; Branco, P.; Timpka, T.; Junge, A.; et al. Apparent temperature and heat-related illnesses during international athletic championships: A prospective cohort study. Scand. J. Med. Sci. Sports 2021, 31, 2092–2102. [Google Scholar] [CrossRef] [PubMed]
- Matzarakis, A. Comments on the Quantification of Thermal Comfort and Heat Stress with Thermal Indices. Atmosphere 2024, 15, 963. [Google Scholar] [CrossRef]
- Fröhlich, D.; Matzarakis, A. A quantitative sensitivity analysis on the behaviour of common thermal indices under hot and windy conditions in Doha, Qatar. Theor. Appl. Clim. 2016, 124, 179–187. [Google Scholar] [CrossRef]
- Honjo, T.; Seo, Y.; Yamasaki, Y.; Tsunematsu, N.; Yokoyama, H.; Yamato, H.; Mikami, T. Thermal comfort along the marathon course of the 2020 Tokyo Olympics. Int. J. Biometeorol. 2018, 62, 1407–1419. [Google Scholar] [CrossRef]
- Alinasab, N.; Mohammadzadeh, N.; Karimi, A.; Mohammadzadeh, R.; Gál, T. A measurement-based framework integrating machine learning and morphological dynamics for outdoor thermal regulation. Int. J. Biometeorol. 2025, 69, 1645–1662. [Google Scholar] [CrossRef]
- National Institute for Public Health and the Environment, Ministry of Health, Welfare and Sport, Netherland, The National Heatwave Plan. Available online: https://www.rivm.nl/en/heat/vulnerable-groups (accessed on 11 June 2025).
- UK Health Security Agency, UK, Heatwave Plan for England. Available online: https://www.gov.uk/guidance/supporting-vulnerable-people (accessed on 11 June 2025).
- Federal Ministry for the Environment, Nature Conservation, Building and Nuclear Safety 2017, Recommendations for Action Heat Action Plans to protect human health, Germany. Available online: https://www.bmuv.de/fileadmin/Daten_BMU/Download_PDF/Klimaschutz/hap_handlungsempfehlungen_en_bf.pdf (accessed on 11 June 2025).
- Karjalainen, S. Gender differences in thermal comfort and use of thermostats in everyday thermal environments. Build. Environ. 2007, 42, 1594–1603. [Google Scholar] [CrossRef]
| Disclaimer/Publisher’s Note: The statements, opinions and data contained in all publications are solely those of the individual author(s) and contributor(s) and not of MDPI and/or the editor(s). MDPI and/or the editor(s) disclaim responsibility for any injury to people or property resulting from any ideas, methods, instructions or products referred to in the content. |
© 2025 by the authors. Licensee MDPI, Basel, Switzerland. This article is an open access article distributed under the terms and conditions of the Creative Commons Attribution (CC BY) license (https://creativecommons.org/licenses/by/4.0/).


 —Heat stress category: Comfortable (no heat stress), mPET: 21–30 °C.
  —Heat stress category: Warm (moderate heat stress), mPET: 30–34 °C.
  —Heat stress category: Hot (strong heat stress), mPET: ≥34 °C.