Abstract
In this study, relevant rice cultivation data were collected through a local survey, and the life cycle assessment (LCA) method was employed to quantify greenhouse gas (GHG) emissions from rice production on consolidated land in the Red River Delta (RRD). Systematic sampling was used in face-to-face interviews with 45 rice farming households in a representative commune of Hai Duong province. Specific GHG emissions were significantly higher in the summer crop (averaged at 11.4 t CO2-eq/ha or 2.2 t CO2-eq/t grain) than in the spring crop (6.8 t CO2-eq/ha or 1.2 t CO2-eq/t grain). Methane was a dominant GHG emitted from paddy fields, contributing 84% of the total emissions of CO2-eq in the summer crop and 73% in the spring crop. Fertilizer use and N2O emissions accounted for 9% of emissions in the summer crop and 16% in the spring crop. Energy consumption for machinery and irrigation added a further 4% and 8%, respectively. Annually, as of 2023, the rice production activities in the RRD release 7.3 Tg of CO2-eq (100 years), a significant contribution to the national GHG emissions. GHG emissions under alternative scenarios of rice straw management were assessed. This study highlights the role of land consolidation in improving water management, which contributes to lowering emissions. Based on the findings, several mitigation measures could be identified, including improved irrigation practices, optimized fertilizer use, and the promotion of sustainable rice straw management practices.
1. Introduction
Sustainable agriculture plays a crucial role in achieving the overall sustainable development goals, as it is responsible for providing food for the growing population around the world. Agriculture is one of the most vulnerable sectors due to climate change. At the same time, it is also a significant source of greenhouse gas (GHG) emissions, contributing 11% to the total global GHG emissions annually [1]. In Vietnam, a country with an agrarian economy, GHG emissions from this sector contribute around 30% of the country’s total CO2-equivalent emissions [2]. The three largest sources of GHG emissions from agriculture in Vietnam are rice cultivation, livestock, and fertilizer management, with rice cultivation accounting for up to 50% of the sector’s total. With the strong commitment to achieving net-zero GHG emissions by 2050, the Vietnamese government has set a goal to transition rice production to a low-carbon model [3]. It is therefore necessary to quantify GHG emissions from rice production and assess the main factors influencing emissions so that appropriate mitigation solutions can be proposed for achieving this target.
In Vietnam, rice is primarily cultivated in the Red River Delta (RRD) in the north—producing about 5.8 million tons annually (13.3% of the national total production)—and in the Mekong Delta in the south, contributing over half of the total national rice output [4]. Despite being a key rice-producing region, farm areas in the RRD are typically small and fragmented, with average farm sizes being less than 0.25 ha per household and often separated into 5–6 individual plots [5]. Fragmented landholdings reduce the efficiencies of irrigation, pest management, and mechanization [6].
To overcome these limitations, land consolidation policies have been implemented in Vietnam, institutionalized under the 2013 Land Law and promoted through Resolution No. 19-NQ/TW (2012). Land consolidation aims to enlarge farm plots, reduce production costs, improve agricultural productivity, and facilitate mechanization [7]. While several studies have documented the socioeconomic benefits of land consolidation—including improved income [8], farming efficiency [6], and food security [9]—its implications for GHG emissions remain unexplored. Previous studies indicate that GHG emissions vary among rice-producing regions, influenced by climatic conditions and specific cultivation practices—particularly those related to water management, fertilizer application, and straw handling. Moreover, some studies also suggest that GHG emissions tend to be lower in larger rice fields [10,11].
Several studies have been conducted to quantify GHG emissions from rice cultivation in Vietnam, but most of them focused on the Mekong Delta [12] along with some other regions [13]. To date, to the best of the authors’ knowledge, there have been no comprehensive GHG emission inventories specifically conducted to assess the effects of the consolidation of rice fields in the RRD. Such studies should reveal factors affecting GHG emissions at both the national and regional scale, thereby identifying and promoting mitigation solutions for the agricultural sector. While environmental policies increasingly emphasize the dual goals of GHG emissions reductions and economic development, few studies in Vietnam have explicitly connected agricultural GHG emissions to broader environmental–economic frameworks such as the Environmental Kuznets Curve (EKC) hypothesis. The EKC proposes that environmental degradation initially increases with income but later decreases after reaching a certain income threshold. Incorporating this perspective, as highlighted in [14,15], this study situates its findings within the broader context of sustainable economic development. Implementation of emission mitigation measures, e.g., with low-emission rice production technologies and relevant regulations, could help cut down the emission peak (environmental degradation) early in the development pathway, thus contributing to achieving the sustainable development goals.
This study aims to address the data gap by evaluating GHG emissions from consolidated rice fields in the RRD, the main rice production area in the north of Vietnam, using survey-based activity data of agricultural practices and applying the life cycle assessment (LCA) methodology. LCA is a widely accepted approach for quantifying environmental impacts across a product’s entire life cycle—from production and transport to use and disposal [16]—and has been successfully applied in rice production studies across China [10,17,18,19,20], India [21], Thailand [22,23], and Myanmar [24].
A local household-level survey was conducted in a representative rice plantation commune of Hai Duong province in the RRD to generate data related to activity levels. Using these survey data on rice cultivation, irrigation, and input use, among others, this study provides a bottom–up, field-specific emission inventory of GHG emissions. It also presents RRD regional-scale emission estimates under realistic scenarios of yield and straw management, thereby bridging the gap between localized data and policy-level application. The novelty of this study lies in (i) using local-level, field-specific data from consolidated plots and (ii) estimating regional GHG emissions under realistic straw management and productivity scenarios.
2. Materials and Methods
2.1. Study Area
The RRD covers a total area of nearly 21,278 km2 (about 6,4% of the national total area). It comprises two large municipalities of Hanoi Metropolitan Region (HMR), housing the capital, Hanoi, and Hai Phong, together with nine provinces: Vinh Phuc, Bac Ninh, Hai Duong, Hung Yen, Thai Binh, Ha Nam, Nam Dinh, Ninh Binh, and Quang Ninh (Figure 1). This region houses nearly 23.7 million residents as of 2023, with an average population density of 1115 capita/km2, which is well above the country’s average of 302 capita/km2 [4]. The rural population in the RRD comprised nearly 61 % of its total population in 2023. The RRD climate zone is characterized by a tropical monsoon climate with two distinct seasons: a cold, dry winter and a hot, humid summer with heavy rainfall. The average annual rainfall is 1700 mm, and the average annual temperature ranges from 23 to 24 °C. These climatic conditions are generally favorable for growing rice and other agricultural crops.
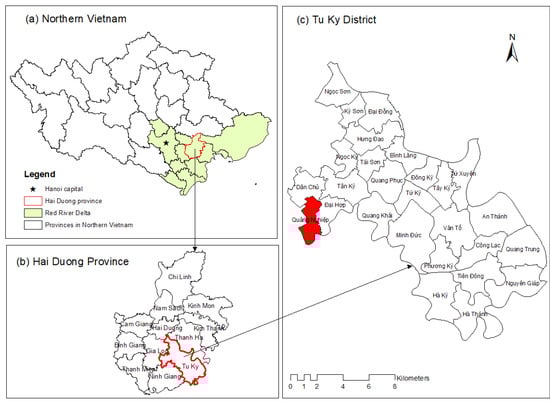
Figure 1.
A map showing the location of (a) the RRD and Hai Duong province in northern Vietnam, (b) Tu Ky district within Hai Duong province, and (c) the surveyed area in Tu Ky district, highlighting Quang Nghiep commune.
The survey was conducted in Quang Nghiep commune, located in the northwest of Tu Ky District, Hai Duong Province, which is a representative rice cultivation area of the RRD (Figure 1). Hai Duong province implemented land consolidation and field reorganization from 2013 to 2015, following Plan 1704/KH-UBND dated 13 September 2013, issued by the Provincial People’s Committee. The surveyed commune covers an area of 368 hectares, comprising three villages with a total of 1632 households. The agricultural land area is 255 hectares, of which rice cultivation accounts for 60% (154 hectares). Rice cultivation in the area has two crop cycles per year. As a result of land consolidation, each household in the commune owns 1–2 plots, as compared to 3–4 plots prior to land consolidation [25].
2.2. Data Collection
Data were collected through structured face-to-face household interviews regarding rice production for the spring and summer crops of 2023. The interviews were conducted from March to April 2024, ensuring that farmers provided accurate retrospective information for both cropping seasons. The survey revealed that rice fields in each village within the commune had relatively uniform soil and irrigation conditions. Random systematic sampling was applied, and 15 households were selected from each village, resulting in a total of 45 surveyed households. As most households owned only 1–2 rice fields, the information provided was relatively consistent and easy to verify. The structured questionnaire covered key aspects of rice production, including yield, rice field area, varieties/growth duration, use of agricultural inputs, and water management practices during the growing season.
Energy consumption data for land preparation and harvesting were collected through interviews with the communal machinery management team, who monitor fuel usage for shared agricultural equipment. Irrigation electricity consumption was estimated based on the maximum allowable electricity consumption for the RRD region [26].
2.3. System Boundary and Functional Unit for LCA
The LCA method was employed to estimate GHG emissions from rice production following the British Standards Institute (BSI) guidelines of PAS 2050:11 [27] in both units, i.e., the emissions per unit area in kg or tons of CO2-equivalent per hectare (CO2-eq/ha) and emissions per unit of weight (CO2-eq/ton of grain). Similar to other studies [10,12,13,28], this study utilized the “Cradle to Farmgate” system boundary to estimate emissions for each cropping season. Within this boundary, production inputs are considered from planting to harvesting for each rice crop cycle.
2.4. Estimation of Greenhouse Gas Emissions
Rice production is the source of both indirect and direct GHG emissions. Indirect emissions come from the activities related to the production of inorganic fertilizers, pesticides, and nylon sheets used for rodent barriers, as well as energy use for land preparation, harvesting, spraying pesticides, and irrigation. In addition, N2O emissions also stem from atmospheric deposition and the leaching or runoff of nitrogen into the environment. Specifically, the activities releasing direct GHG emissions include the use of diesel for land preparation, direct N2O emissions from the application of nitrogen-containing fertilizers, and methane emissions during rice cultivation. The latter depend on water management practices and the amount of straw incorporated into the soil after harvest.
GHG emissions from these activities were estimated using the emission factors (EFs) and the activity data. This study used EFs taken from a published and reputable database. Specifically, EFs for inorganic fertilizers (N, P2O5, K2O) were taken from the FAO’s global database on GHG emissions from feed crop production [29], while those for pesticides were adopted from Audsley et al. [30], who classify emissions by product types due to limited data on active ingredients. Emission factors for all relevant inputs are detailed in Table A1 (Appendix A). Activity data—including quantities of fertilizers, fuel, electricity, and other inputs—were obtained from the structured household surveys, as described in Section 3.1. Note that this study calculated the emissions for the base year 2023 in CO2 equivalents for 100 year-horizon.
Estimation of GHG emissions from agricultural input materials:
GHG emissions from the production of seeds, inorganic fertilizers, pesticides, energy use, and nylon for rodent barriers are calculated using the following formula:
where GHGi is the total GHG emissions (kg CO2-eq) from the agricultural input i per hectare of rice field; Ii is the quantity of input i; and EFi is the EF of input i.
- Estimation of N2O and CH4 Emissions:
Direct and indirect N2O emissions from the use of synthetic fertilizers (FSN) and the incorporation of straw residues (FCR) were estimated according to IPCC (2019) guidelines [31]. Specifically, Tier 2 emission factors from the Vietnamese Ministry of Agriculture and Rural Development (MARD) [32] were applied for direct N2O emissions in spring and summer rice seasons in northern Vietnam, while Tier 1 methods were used for indirect N2O emissions (Appendix A Table A1):
where and are the amounts of direct and indirect N2O emissions, respectively, from rice cultivation (in kg CO2-eq/ha) resulting from the use of N (kg N/ha) in synthetic nitrogen fertilizers (FSN) and crop residues left after harvest (FCR); and are the amounts of N2O emissions from atmospheric deposition and leaching/runoff of N; is the direct N2O EF (kg N2O-N/kg N); and are the EF for N2O emissions due to volatilization and leaching/runoff of nitrogen from fertilizers or crop residues; FracGASF, FracGASM, and FracLEACHING are the fraction factors for nitrogen volatilization into the atmosphere from inorganic fertilizers (GASF) and nitrogen leaching/runoff (LEACHING) (detailed in Table 1); 44/28 is the conversion factor for the molecular weight ratio of N2 to N2O [33]; and 265 is the 100-year global warming potential (GWP) of N2O relative to CO2 [34].

Table 1.
Survey results of for activity data related to rice production in spring and summer rice crops.
A limitation of this study is that the Tier 2 emission factors used to estimate direct N2O emissions reflect average rice production conditions in northern Vietnam and do not account for variations in irrigation practices, such as continuous flooding versus intermittent drainage, which may influence N2O emission levels.
Methane emissions during rice cultivation are calculated following IPCC (2019) [31]:
where is the amount of CH4 directly emitted during rice cultivation (kg CO2-eq/ha); EFd is the daily CH4 (kg CH4/ha/day); t is the number of days of the rice-growing period and depends on the season and rice variety; and 28 is the 100-year GWP of CH4 relative to CO2 [34].
EFd is calculated as follows:
where EFc is the baseline EF under continuously flooded fields (kg CH4/ha/day), varying by crop season to reflect temperature differences. EFc values are based on Tier 2 national emission factors issued by Vietnam’s Ministry of Agriculture and Rural Development ([32]; Table A1). SFw is the scaling factor for EFc based on irrigation practices during the cultivation period. In this study, as all rice fields were drained twice per season, SFw = 0.55, following Table 5.12 of the IPCC 2019 Refinement (Volume 4, Chapter 5—Cropland, p. 5.54). SFp is the scaling factor for the differences in water regime in the pre-season and the cultivation period; in this study, we assessed double cropping of rice in a non-flooded pre-season <180 days. Hence, SFp = 1. SFo is the scaling factor for EFc for the application of organic fertilizers and is calculated using Equation (9).
ROAi is the application rate of organic amendment i. In this study, farmers did not apply organic fertilizers, so the organic matter added was only from the straw incorporated into the soil after harvest. As all rice fields in the surveyed commune were harvested using combine harvesters, it is assumed that all the straw and stubble were returned to the soil. CFOAi is the conversion factor for organic matter amendments assumed to be 0.19 for straw incorporation for more than 30 days [31].
The scenario analysis included rice straw burned in the field, with methane (CH4) and nitrous oxide (N2O) emissions from straw burning (GHGB) calculated by applying EFs of 2.7 g/kg for CH4 and 0.07 g/kg for N2O to the quantity of crop residues burned, following the IPCC (2006) guidelines.
- Estimating Total GHG Emissions:
The total GHG emissions per unit area (kg CO2-eq/ha) for a single crop cycle of a rice field are calculated as follows:
The total GHG emissions per unit of weight (kg CO2-eq/kg grain) for a rice field are calculated as follows:
2.5. Data Analysis
The data were processed using Microsoft Excel 365. Descriptive statistics such as mean values and standard deviations were calculated for key variables. An independent samples t-test was used to assess differences in GHG emissions between the spring and summer crops, after verifying the assumptions of normality and equal variances. GHG emissions from the RRD under land consolidation conditions were estimated using official statistical data on average rice yield in 2023, combined with typical regional straw management practices.
3. Results and Discussion
3.1. Survey Results—Characteristics of Rice Production and Agricultural Inputs
The rice cultivation area for each household in the survey commune has been aggregated into a single plot, with an average area of 0.17 ha (Table 1). Note that not all areas in the RRD have such a consolidated rice field per household. The average RRD plot size is 0.09 ha (three plots per household) [8]. In the midland region of Bac Giang province (not belonging to the RRD), each household has five and nine plots, with an area of about 0.02–0.05 ha per plot [6]. Generally, larger plot sizes make land preparation and water management across the fields more convenient and resource-efficient.
All households interviewed in the commune practiced draining water when the rice stopped tillering to reduce unproductive tillers. Additionally, to facilitate mechanical harvesting, after the rice was nearly heading, irrigation was stopped to allow the fields to dry gradually until harvest. A similar double-drainage application on consolidated land of rice fields may be further assumed for all provinces of the RRD. Note that water drainage practices affect GHG emissions. However, there are no statistics on the extent of water drainage application in rice fields across all areas in Vietnam. In the Mekong Delta, about 35–52% of households practiced alternate wetting and drying during the rice vegetative stage [35]. In the midland region, about 50% of households practiced at least one drainage cycle during the tillering phase [13]. In China, for example, Minh [10] found that rice-growing farmers often practiced multiple water drainages in fields with large plot sizes due to land consolidation, while only draining once mid-season in fields with small plot sizes.
In larger rice fields after consolidation, mechanization is implemented in almost all stages of rice production, i.e., the use of plowing and harrowing machines for land preparation, combine harvesters for harvesting, and electric sprayers for pesticide application. Diesel fuel consumption is 87.5 L per hectare in both seasons. Electricity is consumed to pump irrigation water and to power electric sprayers, amounting to 406.03 kWh/ha for the spring season, higher than the 374.69 kWh/ha for the summer season.
Rice is grown by direct seeding, with a seed rate of about 64 kg/ha for both the spring and summer seasons. The growth period for the spring season is 118 days (from February to May), while for the summer season it is about 106 days (from July to October). The yield of rice in the spring season (5.8 t/ha) tended to be higher than in the summer season (5.4 t/ha). Overall, the yield in both crop seasons was not high and showed significant variation among households (SD = 1 ton/ha). Farmers reported that in 2023, rice was heavily damaged by rats, despite using nylon barriers around the fields and rodenticides.
Farmers only used chemical fertilizers for rice, with application rates almost the same in both seasons (119–120 kg N/ha, 21 kg P2O5/ha, and 54–55 kg K2O/ha). Herbicides and insecticides were used more in the summer season (0.38 and 1.02 kg a.i./ha, respectively) compared to the spring season (0.2 and 0.75 kg a.i./ha). However, fungicides were used more in the spring season (0.47 kg a.i./ha) compared to the summer season (0.13 kg a.i./ha).
Regarding the management of straw after harvest, out of the 45 surveyed households, only 2 households burned the straw, and 3 households collected the straw for feeding cattle or other purposes. This indicates that the amount of rice straw taken away or burned is insignificant, and hence it may be assumed that most of the straw (up to 95%) in this surveyed commune is left in the field and plowed under.
3.2. GHG Emissions from Rice Production
The specific GHG emissions from rice production in the surveyed commune are presented in Table 2. The results show that, owning to a higher EFc (Table A1, Appendix A), the emissions during the summer crop were 11.4 t CO2-eq/ha (equivalent to 2.2 t CO2-eq/t grain), significantly higher than those during the spring crop, at 6.8 t CO2-eq/ha (equivalent to 1.2 t CO2-eq/t grain) (p < 0.001). These values are lower but still generally comparable to those found for the Mekong Delta (9.7–16.6 t CO2-eq/ha, equivalent to 1.6–2.7 t CO2-eq/t grain) [12] and for the Northern Midlands of Vietnam (9.5–15.6 t CO2-eq/ha, equivalent to 1.3–2.3 t CO2-eq/t grain) [13]. Our findings are also comparable to those in other rice-growing countries, such as the central [20] and eastern regions [36] of China and the Western Ghats, India [37]. Some studies in Thailand and Myanmar, however, have reported lower GHG emissions, i.e., 3.8–5.2 t CO2-eq/ha in Phichit, Thailand [38], and 4.6–4.9 t CO2-eq/ha in Myanmar [24]. The difference in GHG emissions from rice production across studies is explained by differences in the growing season/period, water management, straw management, and the extent of agricultural input. The lower GHG emissions in our case study compared to those in the Mekong Delta and the Northern Midlands of Vietnam are primarily due to lower methane emissions, which are explained by the fact that 100% of the rice fields in the study area adopted double-drainage practices in each crop cycle (discussed further in Section 3.3). Further, the emissions during the summer crop were nearly double those during the spring crop, indicating that reducing the rice cultivation area in the summer crop could help mitigate GHG emissions. This option is even more attractive given the survey results showing a higher yield of the spring crop than the summer crop. It may be considered a relevant measure for GHG emissions reduction while increasing rice production to achieve sustainable development goals, i.e., cutting the peak of emissions sooner in the EKC [14].
Table 2.
Total GHG emissions per unit area and per unit of weight in spring and summer crop from surveyed commune.
3.3. Analysis of GHG Emission Activities Under Current and Alternative Scenarios
3.3.1. Current Emissions
Methane emissions directly from rice paddies during cultivation are the largest contributors to the total GHG emissions from rice production (Table 3 and Figure 2). These emissions account for 84% of the total emissions (9618 kg CO2-eq/ha) in the summer crop and 73% (4937 kg CO2-eq/ha) in the spring crop. This finding is similar to those reported in previous studies in Vietnam and the other countries mentioned in Section 3.2. In our study, methane emissions were calculated for different activities using the EFs specific to each crop season, reflecting water management practices and the amount of straw incorporated after harvest (Table A1 and Equation (8)). The higher baseline EFc in the summer season is the main factor causing its higher methane emissions compared to the spring crop, i.e., nearly double.
Table 3.
GHG emissions from different activities in spring and summer crops (kg CO2-eq/ha).
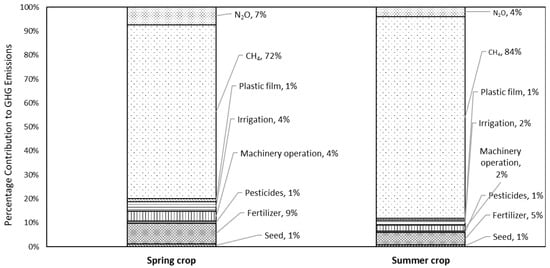
Figure 2.
The contribution of different activities to the total GHG emissions in spring and summer rice crops.
Large consolidated field sizes and convenient irrigation management allow for the application of double water drainage, i.e., farmers drain the water twice: at the end of the tillering stage and from the heading stage until harvest (25–30 days before harvesting). This practice reduces methane emissions by 45% compared to continuous flooding, i.e., SFw = 0.55 in Equation (8) (0.45 less than the value of 1.0 used for continuous flooding) [31]. As a result, the methane emissions in our study area are considerably lower than in the Northern Midlands and Mekong Delta regions in Vietnam. Specifically, in the Northern Midlands, with about 50% of farmers draining water once per season, methane emissions are 13,917 kg CO2-eq/ha in the summer crop and 7621 kg CO2-eq/ha in the spring crop [13]. In the Mekong Delta, with 35% of farmers practicing intermittent flooding [35], the average methane emissions per rice crop is 11,673 kg CO2-eq/ha (extracted from [12]). This difference highlights how improved water management in consolidated rice fields can effectively reduce total GHG emissions. Moreover, the widespread adoption of such climate-smart practices—facilitated by land consolidation—also reflects the potential alignment of agricultural transitions in Vietnam with the EKC hypothesis, i.e., similar to the shift to more production in the spring crop as discussed above.
The use of fertilizers and N2O emissions from the field are the next major contributors to total GHG emissions from rice production. These sources account for 9% (1042 kg CO2-eq/ha) in the summer crop and 16% (1090 kg CO2-eq/ha) in the spring crop (Figure 2 and Table 3). Among these, the main contribution is from nitrogen fertilizer, accounting for 8% of the total GHG emissions in the summer crop and 15% in the spring crop (Figure 3). The nitrogen application rate in this study is 120 kg/ha, higher than the rate in the Northern Midlands (93–103 kg/ha [13]) and the recommended rate for Hai Duong province (70–80 kg N/ha [39]). Reducing nitrogen use in rice production may be considered a potential option to mitigate GHG emissions.

Figure 3.
The contribution of different nitrogen sources to the total GHG emissions in spring and summer crops.
While water regime and N input were explicitly considered, soil pH and texture—factors known to influence N2O and CH4 emissions—were not included. The Tier 2 emission factors used reflect average regional conditions and do not differentiate by soil properties, which is a limitation. Field-specific data may improve future estimates.
Energy use for machinery operation and irrigation also contributes significantly to GHG emissions, accounting for 4% (527.6 kg CO2-eq/ha) in the summer crop and 8% (548.9 kg CO2-eq/ha) in the spring crop. These values are slightly lower than those reported for the Northern Midlands [13], which were 3.6% (564 kg CO2-eq/ha) for the summer crop and 6.4% (601 kg CO2-eq/ha) for the spring crop, despite higher mechanization levels, particularly during harvesting. Note that we used the national electricity grid emission factor of 0.68 kg CO2-eq/kWh [40], which is lower than the 0.86 kg CO2-eq/kWh used in a previous study in the Northern Midlands region [13]. This difference is due to the annual updates of grid emission factors reflecting changes in the national energy mix. Our study applied the most recent emission factor published in 2022, whereas the earlier study used the 2019 value. This variation in emission factor may partially explain the lower energy-related GHG emissions observed in our results. The remaining contributions from pesticides, rodent-proof nylon, and seeds are negligible, each accounting for only 1%.
3.3.2. Emissions Under Alternative Straw Management Scenarios
Methane and N2O emissions are strongly influenced by the amount of straw incorporated into the soil after harvest. In the surveyed commune, favorable conditions for mechanization have enabled 100% of households to use combine harvesters. Consequently, most of the straw is left in the field and incorporated into the soil through plowing for decomposition, a practice that significantly contributes to both methane and N2O emissions.
To assess the potential for emissions reduction, an alternative scenario was evaluated in which straw is not incorporated into the soil. Under this scenario, methane emissions were reduced by approximately 40%, from 9618 to 5582 kg CO2-eq/ha in the summer crop and from 4937 to 2934 kg CO2-eq/ha in the spring crop. N2O emissions also decreased by about 26%, from 507 to 376 kg CO2-eq/ha in the spring and from 453 to 334 kg CO2-eq/ha in the summer crop. As a result, the total GHG emissions declined by 31% in the spring crop (from 6812 to 4679 kg CO2-eq/ha) and by 36% in the summer crop (from 11,434 to 7279 kg CO2-eq/ha), as shown in Table 4. These results emphasize the critical role of straw management in reducing emissions from rice production.
Table 4.
GHG emissions (CH4, N2O, and total) from rice fields under various straw management scenarios in spring and summer crops (kg CO2-eq/ha).
Nevertheless, open-field burning of straw—a common practice in many regions—leads to the release of not only GHGs but also short-lived climate pollutants (SLCPs), such as black carbon, and various toxic air pollutants, including fine particulate matter and hazardous gases [41,42]. Alternative approaches to straw disposal, such as off-site utilization for composting, mushroom cultivation, or biofuel production, offer effective emission reduction pathways. However, these alternatives are often labor-intensive and less attractive to farmers [43], likely due to the absence of viable business models and weak supply chain infrastructure. Recently, microbial products designed to accelerate straw decomposition in the field have been introduced in several provinces of Vietnam. These technologies present a promising solution, as they reduce methane emissions while retaining organic nutrients in the soil for subsequent cropping seasons [44].
3.4. Estimation of GHG Emissions from Rice Production in RRD
To explore the implications of land consolidation and broader mitigation opportunities, we estimated GHG emissions from rice production in the RRD under typical conditions for 2023. The RRD, located in the lower reaches of the Red River and Thai Binh River in northern Vietnam, encompasses 11 provinces, as detailed in Figure 1. The region covers a total natural area of 2127.8 thousand hectares, including 771 thousand hectares of agricultural land. Rice is cultivated in two cropping seasons annually. In the spring season, 477 thousand hectares are used for rice cultivation, with an average yield of 6.7 tons per hectare, while in the summer season, 460 thousand hectares are used with average crop yields of 5.7 tons per hectare [4]. These yields are notably higher than those recorded in the surveyed commune, where average yields were 5.75 and 5.39 tons per hectare for the spring and summer–autumn seasons, respectively (Table 1).
Post-harvest rice straw management in the RRD is highly diverse. Based on previous studies, it is estimated that approximately 25% of straw is openly burned in the field, 30% is incorporated into the soil, and 45% is collected for off-site use [45,46]. These proportions were applied in this study to estimate greenhouse gas emissions from rice production across the RRD. In applying these estimates, we followed common assumptions used in previous research [12]: when straw is collected for off-site use, it is assumed that 5% remains in the field and is incorporated into the soil; similarly, under open-field burning practices, 20% of the straw is considered incorporated into the soil, while the remaining 80% is burned. These assumptions were used to reflect practical field conditions and to calculate the associated CH4 and N2O emissions under different straw management regimes. Table 5 presents estimates of GHG emissions associated with consolidated farmland in the RRD under typical production conditions in 2023 (including yield levels and straw management practices) during both rice cropping seasons. The results show that emissions in the spring season are 5.8 t CO2-eq per hectare and 0.9 t CO2-eq per ton of grain, which are lower than those in the summer–autumn season (9.4 t CO2-eq/ha and 1.7 t CO2-eq/t grain, respectively). These findings suggest that the RRD has lower GHG emissions compared to the surveyed commune, likely due to higher rice productivity and a lower proportion of straw incorporation into the soil. However, when assessing GHG emissions, it is necessary to consider SLCFs to obtain a more comprehensive assessment of emissions and the associated climate and environment effects. This incorporation is recommended for future studies.
Table 5.
Total GHG emissions per unit area and per unit of weight in spring and summer crops on consolidated land in RRD.
Using official rice production statistics [4], total GHG emissions from rice cultivation in the Red River Delta (RRD) were estimated and are presented in Table 5. These emissions represent approximately 10.5% of Vietnam’s total agricultural CO2 emissions in 2021, which were reported at 69.6 Tg [47]. This regional estimate highlights the significant contribution of rice production in the RRD to national emissions and underscores the need for mitigation measures, particularly through improved productivity and better straw management practices. Future studies should also incorporate emissions from short-lived climate forcers (SLCFs), such as black carbon and organic carbon, as well as other air pollutants including fine particulate matter and toxic gases, to provide a more comprehensive assessment of environmental and climate impacts.
4. Conclusions
GHG emissions from rice production under conditions of consolidated land in the surveyed commune of the RRD for the summer crop were 11.4 t CO2-eq/ha (equivalent to 2.2 t CO2-eq/t grain), significantly higher than those for the spring crop, at 6.8 t CO2-eq/ha (equivalent to 1.2 t CO2-eq/t grain). Methane emissions directly from rice paddies during cultivation were the largest contributors, totaling 9618 kg CO2-eq/ha in the summer, accounting for 84% of the total emissions in that period, and 4937 kg CO2-eq/ha in the spring, accounting for 73% in that period. The use of fertilizers and N2O emissions from the field are the next major contributors, collectively accounting for 9% and 16% of the total in the summer crop and the spring crop, respectively. Energy use for machinery operations and irrigation also contributes significantly, i.e., 4% and 8% of the total in the summer and spring crops, respectively.
The specific GHG emissions in the surveyed commune are lower than those in the Mekong Delta and Northern Midlands of Vietnam mainly due to lower methane emissions, which can be partly explained by the application of double-drainage practices in rice cultivation. Land consolidation efforts resulted in larger rice fields and are thus proven to enhance efficient water management, an important factor in reducing GHG emissions. Better straw management practices and more rational fertilizer use should be adopted to further reduce GHG emissions. The fact that GHG emissions in the summer crop are nearly double those in the spring season indicates that reducing the rice cultivation area in the summer crop will also contribute to reducing GHG emissions.
GHG emissions were calculated for rice production in the entire RRD based on the surveyed results but accounting for the difference in straw management practices. As of 2023, rice production in the RRD releases 7.3 Tg of GHG in CO2-eq per year (100-year horizon), a significant contribution to the total national GHG emissions. The lower specific GHG emissions in the RRD compared to the surveyed commune are due to less straw incorporated into the soil for degradation.
While this study provides valuable insights, its findings contain several limitations. The survey was conducted only with a single commune, and emissions were calculated for only one production year, thus limiting the spatial and temporal generalizability of the results. To overcome these limitations, future surveys should be conducted in different areas of the RRD. The emission trend should be analyzed, especially to reflect the impacts of national low-emission development strategies promoting climate-smart rice production. In addition, several emission factors—particularly those related to fertilizers and pesticides—were obtained from the literature. Local measurements of emission factors are required to fully capture the local agricultural practices and conditions of the region. Future research should therefore adopt multi-site, multi-year designs and prioritize the development of locally calibrated emission factors. Such efforts are essential to improve the accuracy of emission estimates and to support the advancement of climate-smart rice production in alignment with national low-emission development strategies.
Author Contributions
Conceptualization, N.T.B.Y. and D.T.H.V.; methodology, N.T.B.Y.; formal analysis, N.T.B.Y., N.T.K.O. and D.T.H.V.; data curation, N.T.B.Y. and D.T.H.V.; writing—original draft preparation, D.T.H.V.; writing—review and editing, N.T.B.Y. and N.T.K.O. All authors have read and agreed to the published version of the manuscript.
Funding
This research received no external funding.
Institutional Review Board Statement
Not applicable.
Informed Consent Statement
Informed consent was obtained from all subjects involved in the study.
Data Availability Statement
The data supporting the findings of this study are available from the corresponding author upon reasonable request.
Conflicts of Interest
The authors declare no conflict of interest.
Abbreviations
The following abbreviations are used in this manuscript:
| GHG | greenhouse gas |
| LCA | life cycle assessment |
| MR | Mekong Delta |
| RRD | Red River Delta |
| HMR | Hanoi Metropolitan Region |
| SLCP | short-lived climate pollutant |
Appendix A
Table A1.
Greenhouse gas emission factors for agricultural inputs in rice production.
Table A1.
Greenhouse gas emission factors for agricultural inputs in rice production.
| Emission Sources | Emission Factor (kg CO2-eq per Specified Unit) | References |
|---|---|---|
| INDIRECT EMISSIONS | ||
| Seed | 1.12 kg CO2-eq/kg seed | [48] |
| Inorganic fertilizer | ||
| N | 4.00 kg CO2-eq/kg N | [29] |
| P | 1.29 kg CO2-eq/kg P2O5-eq | [29] |
| K | 1.47 kg CO2-eq/kg K2O-eq | [29] |
| Pesticide | ||
| Herbicide | 55.44 kg CO2-eq/kg a.i. | [29,30] |
| Insecticide | 44.94 kg CO2-eq/kg a.i. | [29,30] |
| Fungicide | 36.33 kg CO2-eq/kg a.i. | [29,30] |
| Electricity | 0.68 kg CO2-eq/kWh | [40] |
| Diesel | 0.38664 CO2-eq/L diesel | [28] |
| Plastic sheet | 2.51 kg CO2-eq/kg plastic sheet | [49] |
| N2O | ||
| Atmospheric deposition | 0.014 kg N2O-N (kg NH3-N + NOx-N volatilized)−1 | [31] |
| 0.11 kg NH3-N (kg N applied)−1 | [31] | |
| Leaching | 0.011 kg N2O-N (kg N leaching/runoff)−1 | [31] |
| 0.24 kg N (kg N additions)−1 | [31] | |
| DIRECT EMISSIONS | ||
| Diesel | 2.75 kg CO2-eq/L diesel | [32,50,51] |
| N2O (during rice cultivation) | ||
| Spring rice | 0.0034 kg N2O-N/kg N | [32] |
| Summer rice | 0.0025 kg N2O-N/kg N | [32] |
| CH4 (during rice cultivation) | ||
| Spring crop | 1.61 kg CH4/day/ha | [32] |
| Summer crop | 3.43 kg CH4/day/ha | [32] |
References
- Tiseo, I. Agriculture Emissions Worldwide—Statistics & Facts. 2024. Available online: https://www.statista.com/topics/10348/agriculture-emissions-worldwide/#topicOverview (accessed on 2 August 2024).
- Hinh, N.T. Solutions to Reduce Greenhouse Gas Emissions in Vietnamese Agriculture. 2022. Available online: https://tapchimoitruong.vn/chuyen-muc-3/mot-so-giai-phap-nham-giam-phat-thai-khi-nha-kinh-trong-nong-nghiep-viet-nam-26379 (accessed on 2 August 2024). (In Vietnamese).
- Shrivastava, A.; Tchale, H.; Cao, B.T.; Elabed, G.; Kar, A.; Kieu, H.T.P.; Nguyen, H.T.T. Vietnam—Spearheading Vietnam’s Green Agricultural Transformation: Moving to Low-Carbon Rice; World Bank Group: Washington, DC, USA, 2022; Available online: https://documents.worldbank.org/en/publication/documents-reports/documentdetail/099735109222222315/p17448205335130730bb7e0a6e231e1f667 (accessed on 29 May 2023).
- General Statistic Office of Vietnam. 2023. Available online: https://www.gso.gov.vn/so-lieu-thong-ke/ (accessed on 12 March 2025).
- Thomas, M.; Finn, T.; Do, H.T.; Nguyen, D.A.T.; Markussen, T.; Inter- and Intra-Farm Land Fragmentation in Vietnam. WIDER Working Paper Series wp-2016-11, World Institute for Development Economic Research (UNU-WIDER). 2016. Available online: https://ideas.repec.org/p/unu/wpaper/wp-2016-11.html (accessed on 5 August 2024).
- Dung, N.T.; Ha, N.Q.; Phuong, M.L. Researching the relationship between agricultural land fragmentation and crop production efficiency of farm households in Bac Giang province. Vietnam. J. Agric. Sci. 2019, 17, 764–770. [Google Scholar]
- Tho, N.Đ.; Tuan, Đ.A.; Thuy, T.T. Land Consolidation, Plot Exchange, and Land Adjustment to Meet the Requirements of Urban Upgrading, Development, and Land Concentration in Rural Areas. J. Environ. 2023. Available online: https://tapchimoitruong.vn/nghien-cuu-23/don-dien-doi-thua-dieu-chinh-dat-dai-dap-ung-yeu-cau-chinh-trang-phat-trien-do-thi-va-tap-trung-dat-dai-o-nong-thon-29200 (accessed on 4 August 2024). (In Vietnamese).
- Tran, T.Q.; Vu, H.V. Land fragmentation and household income: First evidence from rural Vietnam. Land Use Policy 2019, 89, 104247. [Google Scholar] [CrossRef]
- Phan, N.T.; Hang, N.T.V.; Kien, N.D.; Oanh, D.T.K.; Quy, L.A. Analysis of the Impact of Land Fragmentation on Food Security of Rice-Producing Households: A Case Study in Huong Thuy Town, Thua Thien Hue Province. Hue Univ. J. Sci. Econ. Dev. 2023, 132, 61–74. (In Vietnamese) [Google Scholar]
- Minh, Y.; Dinh, L.; Dung, Q.B.; Con, T.; Chao, G.; Robert, R. A comparative study on carbon footprint of rice production between household and aggregated farms from Jiangxi, China. Environ. Monit. Assess. 2015, 187, 332. [Google Scholar]
- Masuda, K. Eco-Efficiency Assessment of Intensive Rice Production in Japan: Joint Application of Life Cycle Assessment and Data Envelopment Analysis. Sustainability 2019, 11, 5368. [Google Scholar] [CrossRef]
- Leon, A.; Izumi, T. Impacts of alternate wetting and drying on rice farmers’ profits and life cycle greenhouse gas emissions in An Giang Province in Vietnam. J. Clean. Prod. 2022, 354, 131621. [Google Scholar] [CrossRef]
- Yen, N.T.B.; Kamoshita, A. Factors influencing the carbon footprint of rice production in Northeastern Vietnam. Int. J. Life Cycle Assess. 2024, 29, 1688–1705. [Google Scholar] [CrossRef]
- Panayotou, T. Demystifying the Environmental Kuznets Curve: Turning a Black Box into a Policy Tool. Environ. Dev. Econ. 1997, 2, 465–484. [Google Scholar] [CrossRef]
- Sadik-Zada, E.R.; Gatto, A. The Puzzle of Greenhouse Gas Footprints of Oil Abundance. Socio-Econ. Plan. Sci. 2021, 75, 100936. [Google Scholar] [CrossRef]
- Shabir, I.; Dash, K.K.; Dar, A.H.; Pandey, V.K.; Fayaz, U.; Srivastava, S.; R, N. Carbon Footprints Evaluation for Sustainable Food Processing System Development: A Comprehensive Review. Future Foods 2023, 7, 100215. [Google Scholar] [CrossRef]
- Xu, X.; Zhang, B.; Liu, Y.; Xue, Y.; Di, B. Carbon footprints of rice production in five typical rice districts in China. Acta Ecol. Sin. 2013, 33, 227–232. [Google Scholar] [CrossRef]
- Xue, J.F.; Pu, C.; Liu, S.; Zhao, X.; Zhang, R.; Chen, F.; Xiao, X.P.; Zhang, H. Carbon and nitrogen footprint of double rice production in Southern China. Ecol. Indic. 2016, 64, 249–257. [Google Scholar] [CrossRef]
- Zhang, L.; Ruiz-Menjivar, J.; Tong, Q.; Zhang, J.; Yue, M. Examining the carbon footprint of rice production and consumption in Hubei, China: A life cycle assessment and uncertainty analysis approach. J. Environ. Manag. 2021, 300, 113698. [Google Scholar] [CrossRef] [PubMed]
- Shen, X.; Zhang, L.; Zhang, J. Ratoon rice production in central China: Environmental sustainability and food production. Sci. Total Environ. 2021, 764, 142850. [Google Scholar] [CrossRef]
- Kashyap, D.; Agarwal, T. Carbon footprint and water footprint of rice and wheat production in Punjab, India. Agric. Syst. 2021, 186, 102959. [Google Scholar] [CrossRef]
- Yodkhum, S.; Sampattagul, S. Life Cycle Greenhouse Gas Evaluation of Rice Production in Thailand. In Proceedings of the 1st Environment and Natural Resources International Conference (ENRIC 2014), Bangkok, Thailand, 6–7 November 2014. [Google Scholar]
- Yodkhum, S.; Gheewala, S.H.; Sampattagul, S. Life cycle GHG evaluation of organic rice production in northern Thailand. J. Environ. Manag. 2017, 196, 217–223. [Google Scholar] [CrossRef]
- Moe, M.M.; Bunyasiri, I.; Sirisupluxana, P. Quantifying and Comparing Greenhouse Gas Emissions in Monsoon Rice Production: A Comprehensive Analysis of Transplanting and Broadcasting Sowing Methods in Myanmar. Open Agric. J. 2024, 18, e18743315290024. [Google Scholar] [CrossRef]
- Minh, B.; Tu Ky Focuses on Land Consolidation and Plot Exchange. Hai Duong Province’s Online Newspaper. 2015. Available online: https://baohaiduong.vn/tu-ky-tap-trung-don-dien-doi-thua-300899.html (accessed on 31 July 2024). (In Vietnamese).
- Guidelines for Elaboration of Economic—Technical Norms in the Management and Exploitation of Irrigation Works (In Vietnamese). Circular 27/2022/TT-NNPTNT Issued on 30 December 2022. Available online: https://thuvienphapluat.vn/van-ban/Linh-vuc-khac/Thong-tu-27-2022-TT-BNNPTNT-xay-dung-dinh-muc-kinh-te-ky-thuat-khai-thac-cong-trinh-thuy-loi-551320.aspx (accessed on 31 July 2024).
- British Standards Institute. The Guide to PAS 2050: 2011 How to Carbon Footprint Your Products, Identify Hotspots and Reduce Emissions in Your Supply Chain; British Standards Institute: London, UK, 2011. [Google Scholar]
- Arunrat, N.; Sereenonchai, S.; Chaowiwat, W.; Wang, C.; Hatano, R. Carbon, Nitrogen and Water Footprints of Organic Rice and Conventional Rice Production over 4 Years of Cultivation: A Case Study in the Lower North of Thailand. Agronomy 2022, 12, 380. [Google Scholar] [CrossRef]
- FAO. Global database of GHG emissions related to feed crops: A life cycle inventory. Version 1. In Livestock Environmental Assessment and Performance Partnership; FAO: Rome, Italy, 2017. [Google Scholar]
- Audsley, E.; Stacey, K.; Parsons, D.J.; Williams, G.A. Estimation of the Greenhouse Gas Emissions from Agricultural Pesticide Manufacture and Use. 2009. Available online: https://www.researchgate.net/publication/276941041_Estimation_of_the_greenhouse_gas_emissions_from_agricultural_pesticide_manufacture_and_use (accessed on 16 April 2024).
- IPCC. 2019 Refinement to the 2006—IPCC Guidelines for National Greenhouse Gas Inventories, Volume 4: Agriculture, Forestry and Other Land Use (AFOLU). 2019. Available online: https://www.ipcc-nggip.iges.or.jp/public/2019rf/vol4.html (accessed on 15 July 2024).
- MONRE. List of Greenhouse Gas Emission Coefficients for Greenhouse Gas Inventory According to Decision No. 2626 of the Ministry of Natural Resources and Environment, Vietnam Dated 10 October 2022. Available online: https://thuvienphapluat.vn/van-ban/Tai-nguyen-Moi-truong/Quyet-dinh-2626-QD-BTNMT-2022-cong-bo-he-so-phat-thai-phuc-vu-kiem-ke-khi-nha-kinh-532253.aspx (accessed on 5 October 2024). (In Vietnamese).
- IPCC. IPCC Guidelines for National Greenhouse Gas Inventories; IPCC/IGES: Kanagawa, Japan, 2006. [Google Scholar]
- IPCC. Climate Change 2014: Synthesis Report: Contribution of Working Group I, II and III to the Fifth Assessment Report of the Intergovernmental Panel of Climate Change; IPCC: Geneva, Switzerland, 2014; pp. 105–151. [Google Scholar]
- Enriquez, Y.; Neuson, K.; Sander, B.O.; Bouman, B.; Pede, V.; Watanable, M. Accelerating Intermittent Irrigation for Low-Carbon and Resilient Rice Production Systems in Asia: Progress, Challenges and Opportunities; Green Asia Report Series No. 2; Japan International Research Center for Agricultural Sciences: Tsukuba, Japan, 2023; Available online: https://www.jircas.go.jp/sites/default/files/publication/gars-e/gars-e2-_-.pdf (accessed on 30 July 2024).
- Xu, Q.; Li, J.; Liang, H.; Ding, Z.; Shi, X.; Chen, Y.; Dou, Z.; Dai, Q.; Gao, H. Coupling life cycle assessment and global sensitivity analysis to evaluate the uncertainty and key processes associated with carbon footprint of rice production in Eastern China. Front. Plant Sci. 2022, 13, 990105. [Google Scholar] [CrossRef]
- Paramesh, V.; Kumar, P.; Parajuli, R.; Francaviglia, R.; Manohara, K.K.; Arunachalam, V.; Mayekar, T.; Toraskar, S. A Life Cycle Assessment of Rice–Rice and Rice–Cowpea Cropping Systems in the West Coast of India. Land 2023, 12, 502. [Google Scholar] [CrossRef]
- Arunrat, N.; Pumijumnong, N.; Sereenonchai, S.; Chareonwong, U.; Wang, C. Comparison of GHG Emissions and Farmers’ Profit of Large-Scale and Individual Farming in Rice Production across Four Regions of Thailand. J. Clean. Prod. 2021, 278, 123945. [Google Scholar] [CrossRef]
- Thanh, P.T.; Khanh, N.T.; Tu, D.X.; Hieu, D.T.; Sen, N.T.; Tuan, N.T.; Thuan, H.N. Improving nitrogen fertilizer efficiency in rice cultivation in Red River Delta. Vietnam. J. Sci. Technol. Eng. 2020, 5, 8–15. (In Vietnamese) [Google Scholar]
- DDC. The Vietnam Grid Emission Factor in 2022 According to Decision 327/BĐKH-PTCBT. 2024. Available online: http://www.dcc.gov.vn/van-ban-phap-luat/1110/He-so-phat-thai-luoi-dien-Viet-Nam-2022.html (accessed on 30 July 2024). (In Vietnamese)
- Kim Oanh, N.T.; Permadi, D.A.; Hopke, P.K.; Smith, R.K.; Dong, N.P.; Anh Nguyet, D. Annual emissions of air toxics emitted from crop residue open burning in Southeast Asia over the period of 2010–2015. Atmos. Environ. 2018, 187, 163–173. [Google Scholar] [CrossRef]
- Kim Oanh, N.T. Rice straw open burning: Emissions, effects and multiple benefits of non-burning alternatives. Vietnam. J. Sci. Technol. Eng. 2021, 6, 79–85. [Google Scholar] [CrossRef]
- Van Hung, N.; Maguyon-Detras, M.C.; Migo, M.V.; Quilloy, R.; Balingbing, C.; Chivenge, P.; Gummert, M. Rice Straw Overview: Availability, Properties, and Management Practices. In Sustainable Rice Straw Management; Springer International Publishing: Cham, Switzerland, 2020; pp. 1–13. ISBN 978-3-030-32373-8. [Google Scholar] [CrossRef]
- Ha, B.T.H. Technological Breakthrough: Straw Processing Without Rest Time Vietnam Agriculture. 2023. Available online: https://nongnghiep.vn/dot-pha-cong-nghe-xu-ly-rom-ra-khong-can-thoi-gian-nghi-d341946.html (accessed on 28 July 2024).
- Son, N.H.; Loan, B.T.P.; Minh, N.D. Sustainable rice straw management in Vietnam: Current situation, challenges and potential. J. Vietnam Agric. Sci. Technol. 2018, 1, 113–119. [Google Scholar]
- Ha, D.T.; Ngan, H.T.; Hue, N.T.; Ha, P.Q. Management of by- products from rice cultivation in Vietnam. J. Vietnam Agric. Sci. Technol. 2019, 10, 155–160. (In Vietnamese) [Google Scholar]
- Ritchie, H.; Roser, M.; Rosado, P. CO2 and Greenhouse Gas Emissions: Greenhouse Gas Emission by Sector, Vietnam. 2021. Available online: https://ourworldindata.org/co2/country/vietnam (accessed on 25 April 2025).
- Nguyen-Van-Hung; Sander, B.O.; Quilty, J.; Balingbing, C.; Castalone, A.G.; Romasanta, R.; Alberto, M.C.R.; Sandro, J.M.; Jamieson, C.; Gummert, M. An Assessment of Irrigated Rice Production Energy Efficiency and Environmental Footprint with In-Field and off-Field Rice Straw Management Practices. Sci. Rep. 2019, 9, 16887. [Google Scholar] [CrossRef]
- Tenhunen-Lunkka, A.; Rommens, T.; Vanderreydt, I.; Mortensen, L. Greenhouse Gas Emission Reduction Potential of European Union’s Circularity Related Targets for Plastics. Circ. Econ. Sustain. 2023, 3, 475–510. [Google Scholar] [CrossRef]
- VEECOM. Tool for Converting Energy Unit. 2019. Available online: https://veecom.vn/tools/chuyen-doi-don-vi-nang-luong-15 (accessed on 16 April 2023). (In Vietnamese).
- Kashyap, D.; de Vries, M.; Pronk, A.; Adiyoga, W. Environmental Impact Assessment of Vegetable Production in West Java, Indonesia. Sci. Total Environ. 2023, 864, 160999. [Google Scholar] [CrossRef]
Disclaimer/Publisher’s Note: The statements, opinions and data contained in all publications are solely those of the individual author(s) and contributor(s) and not of MDPI and/or the editor(s). MDPI and/or the editor(s) disclaim responsibility for any injury to people or property resulting from any ideas, methods, instructions or products referred to in the content. |
© 2025 by the authors. Licensee MDPI, Basel, Switzerland. This article is an open access article distributed under the terms and conditions of the Creative Commons Attribution (CC BY) license (https://creativecommons.org/licenses/by/4.0/).