
Optical Properties of Near-Surface Cloud Layers and Their Interactions with Aerosol Layers: A Case Study of Australia Based on CALIPSO

 , ,
, , 
Abstract
1. Introduction
2. Methodology
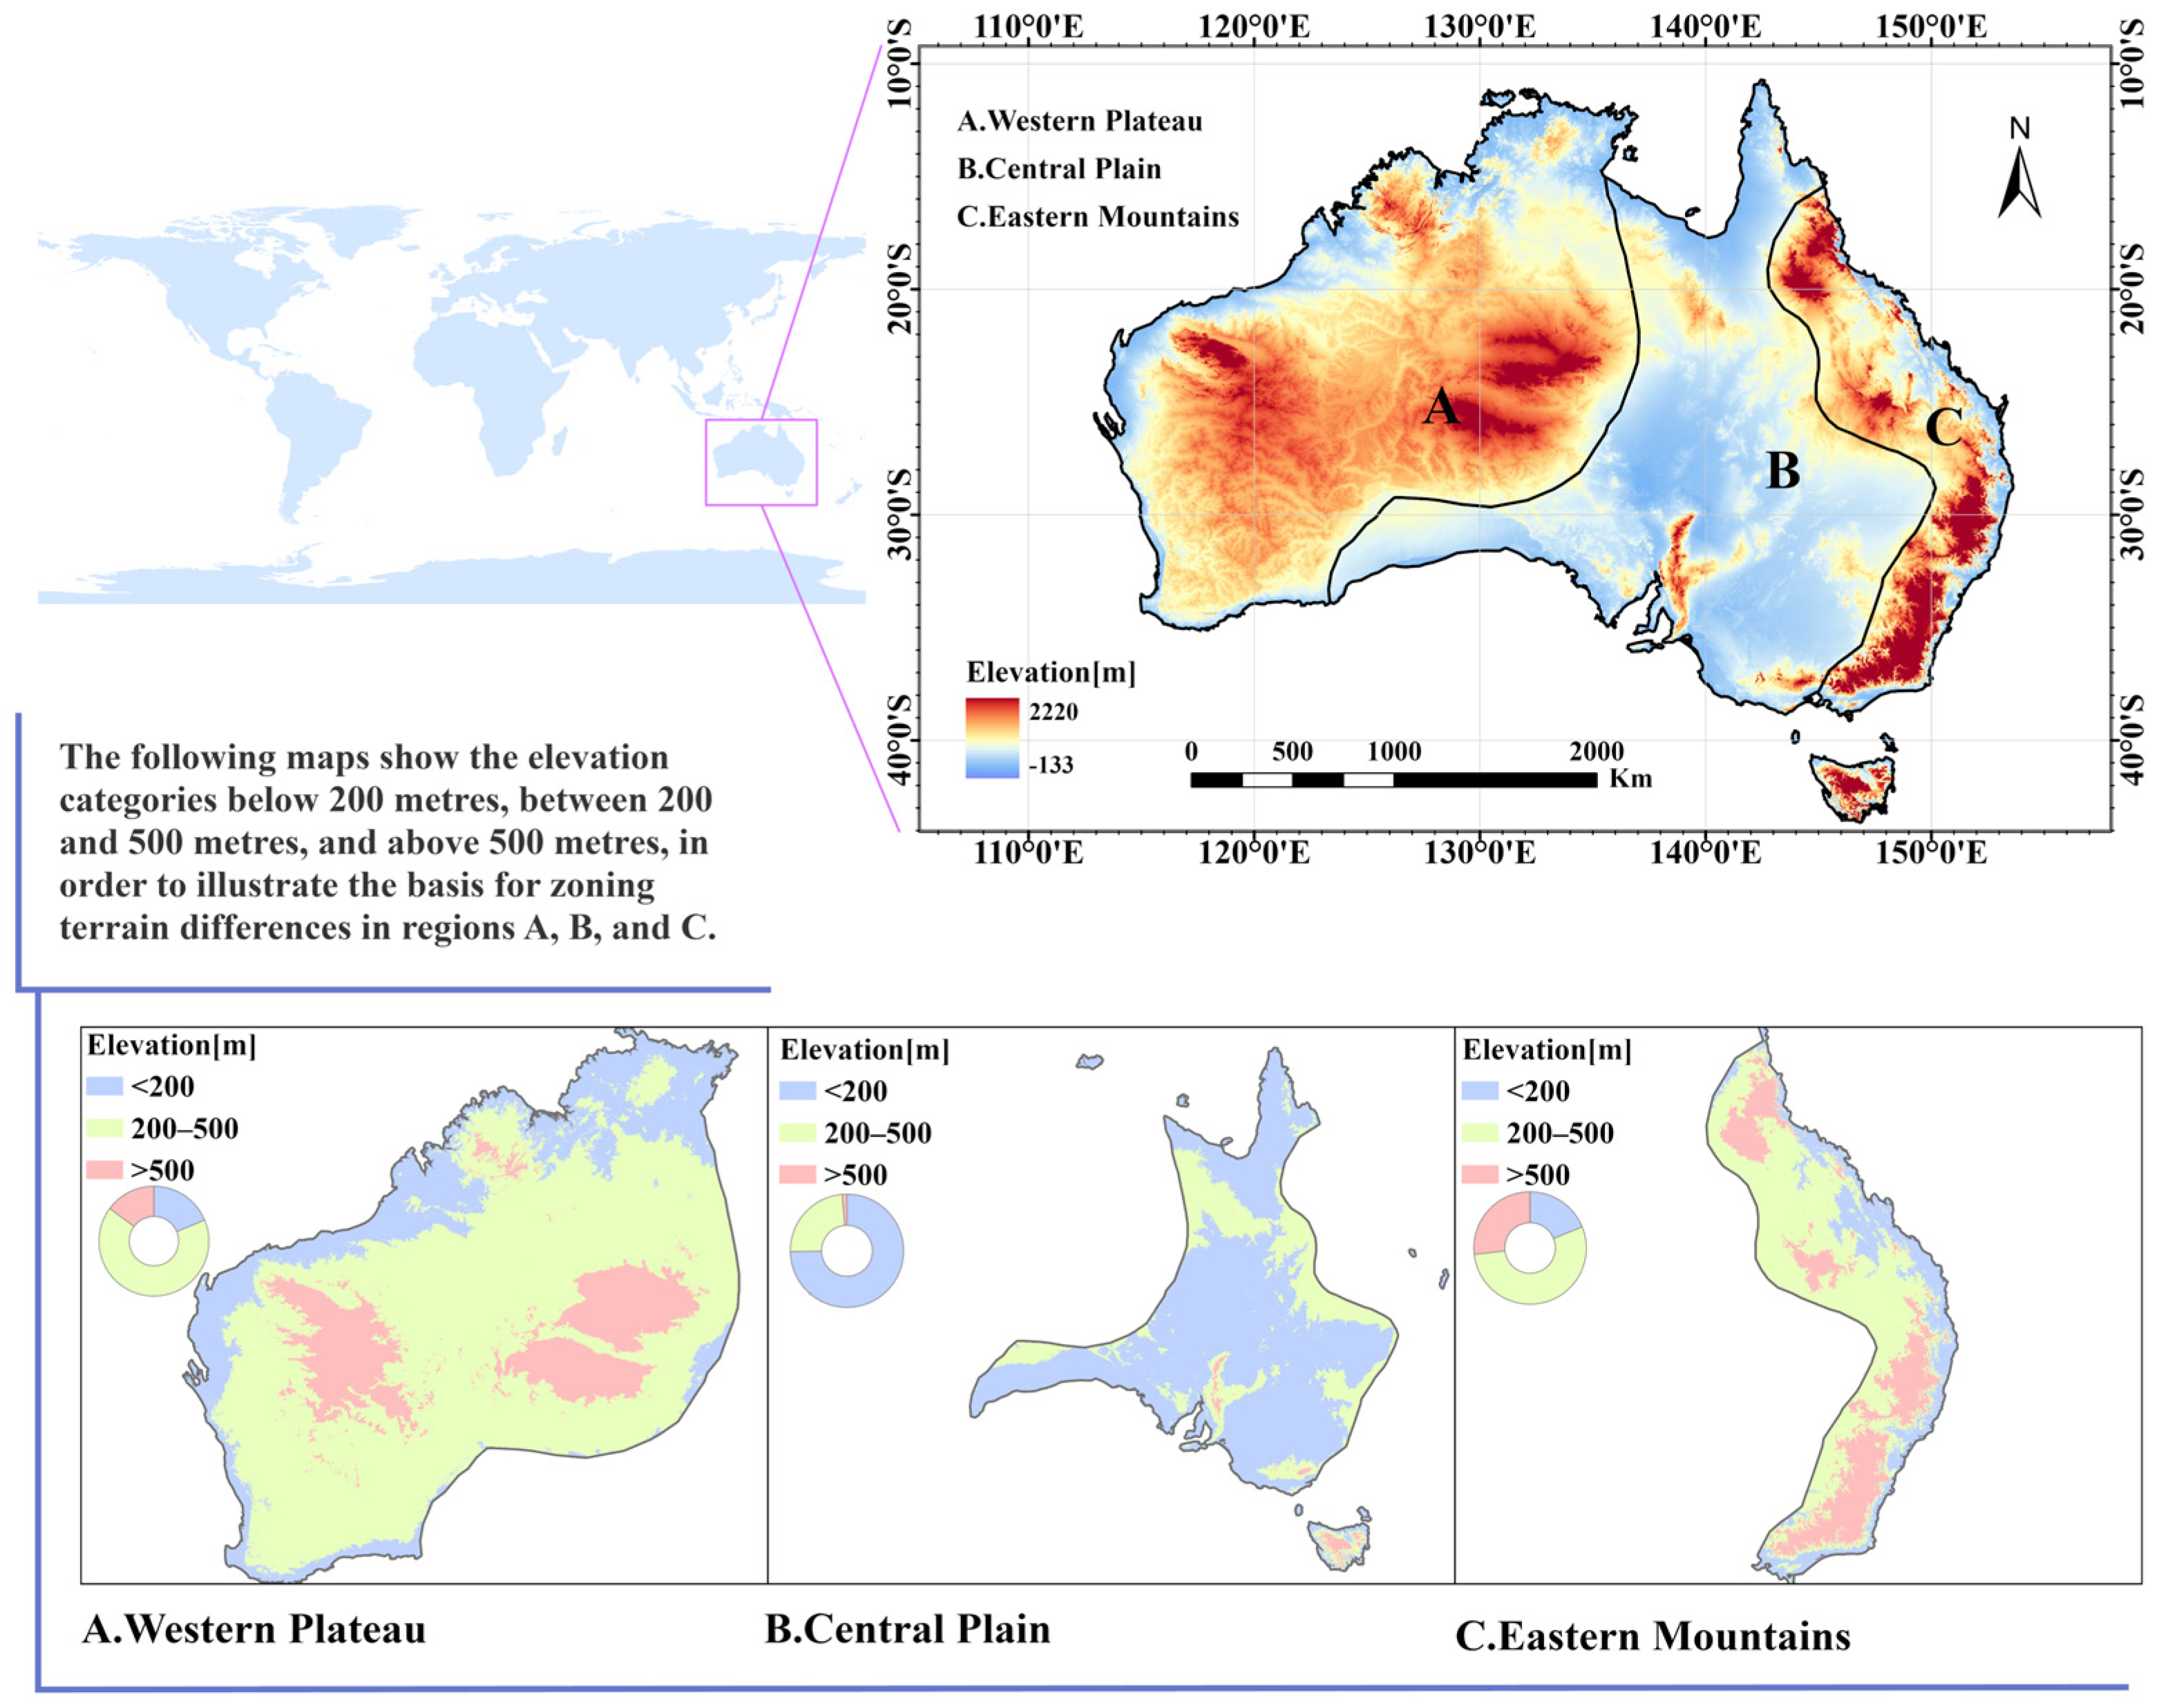
2.1. Study Area
2.2. Data and Processing
3. Results and Discussion
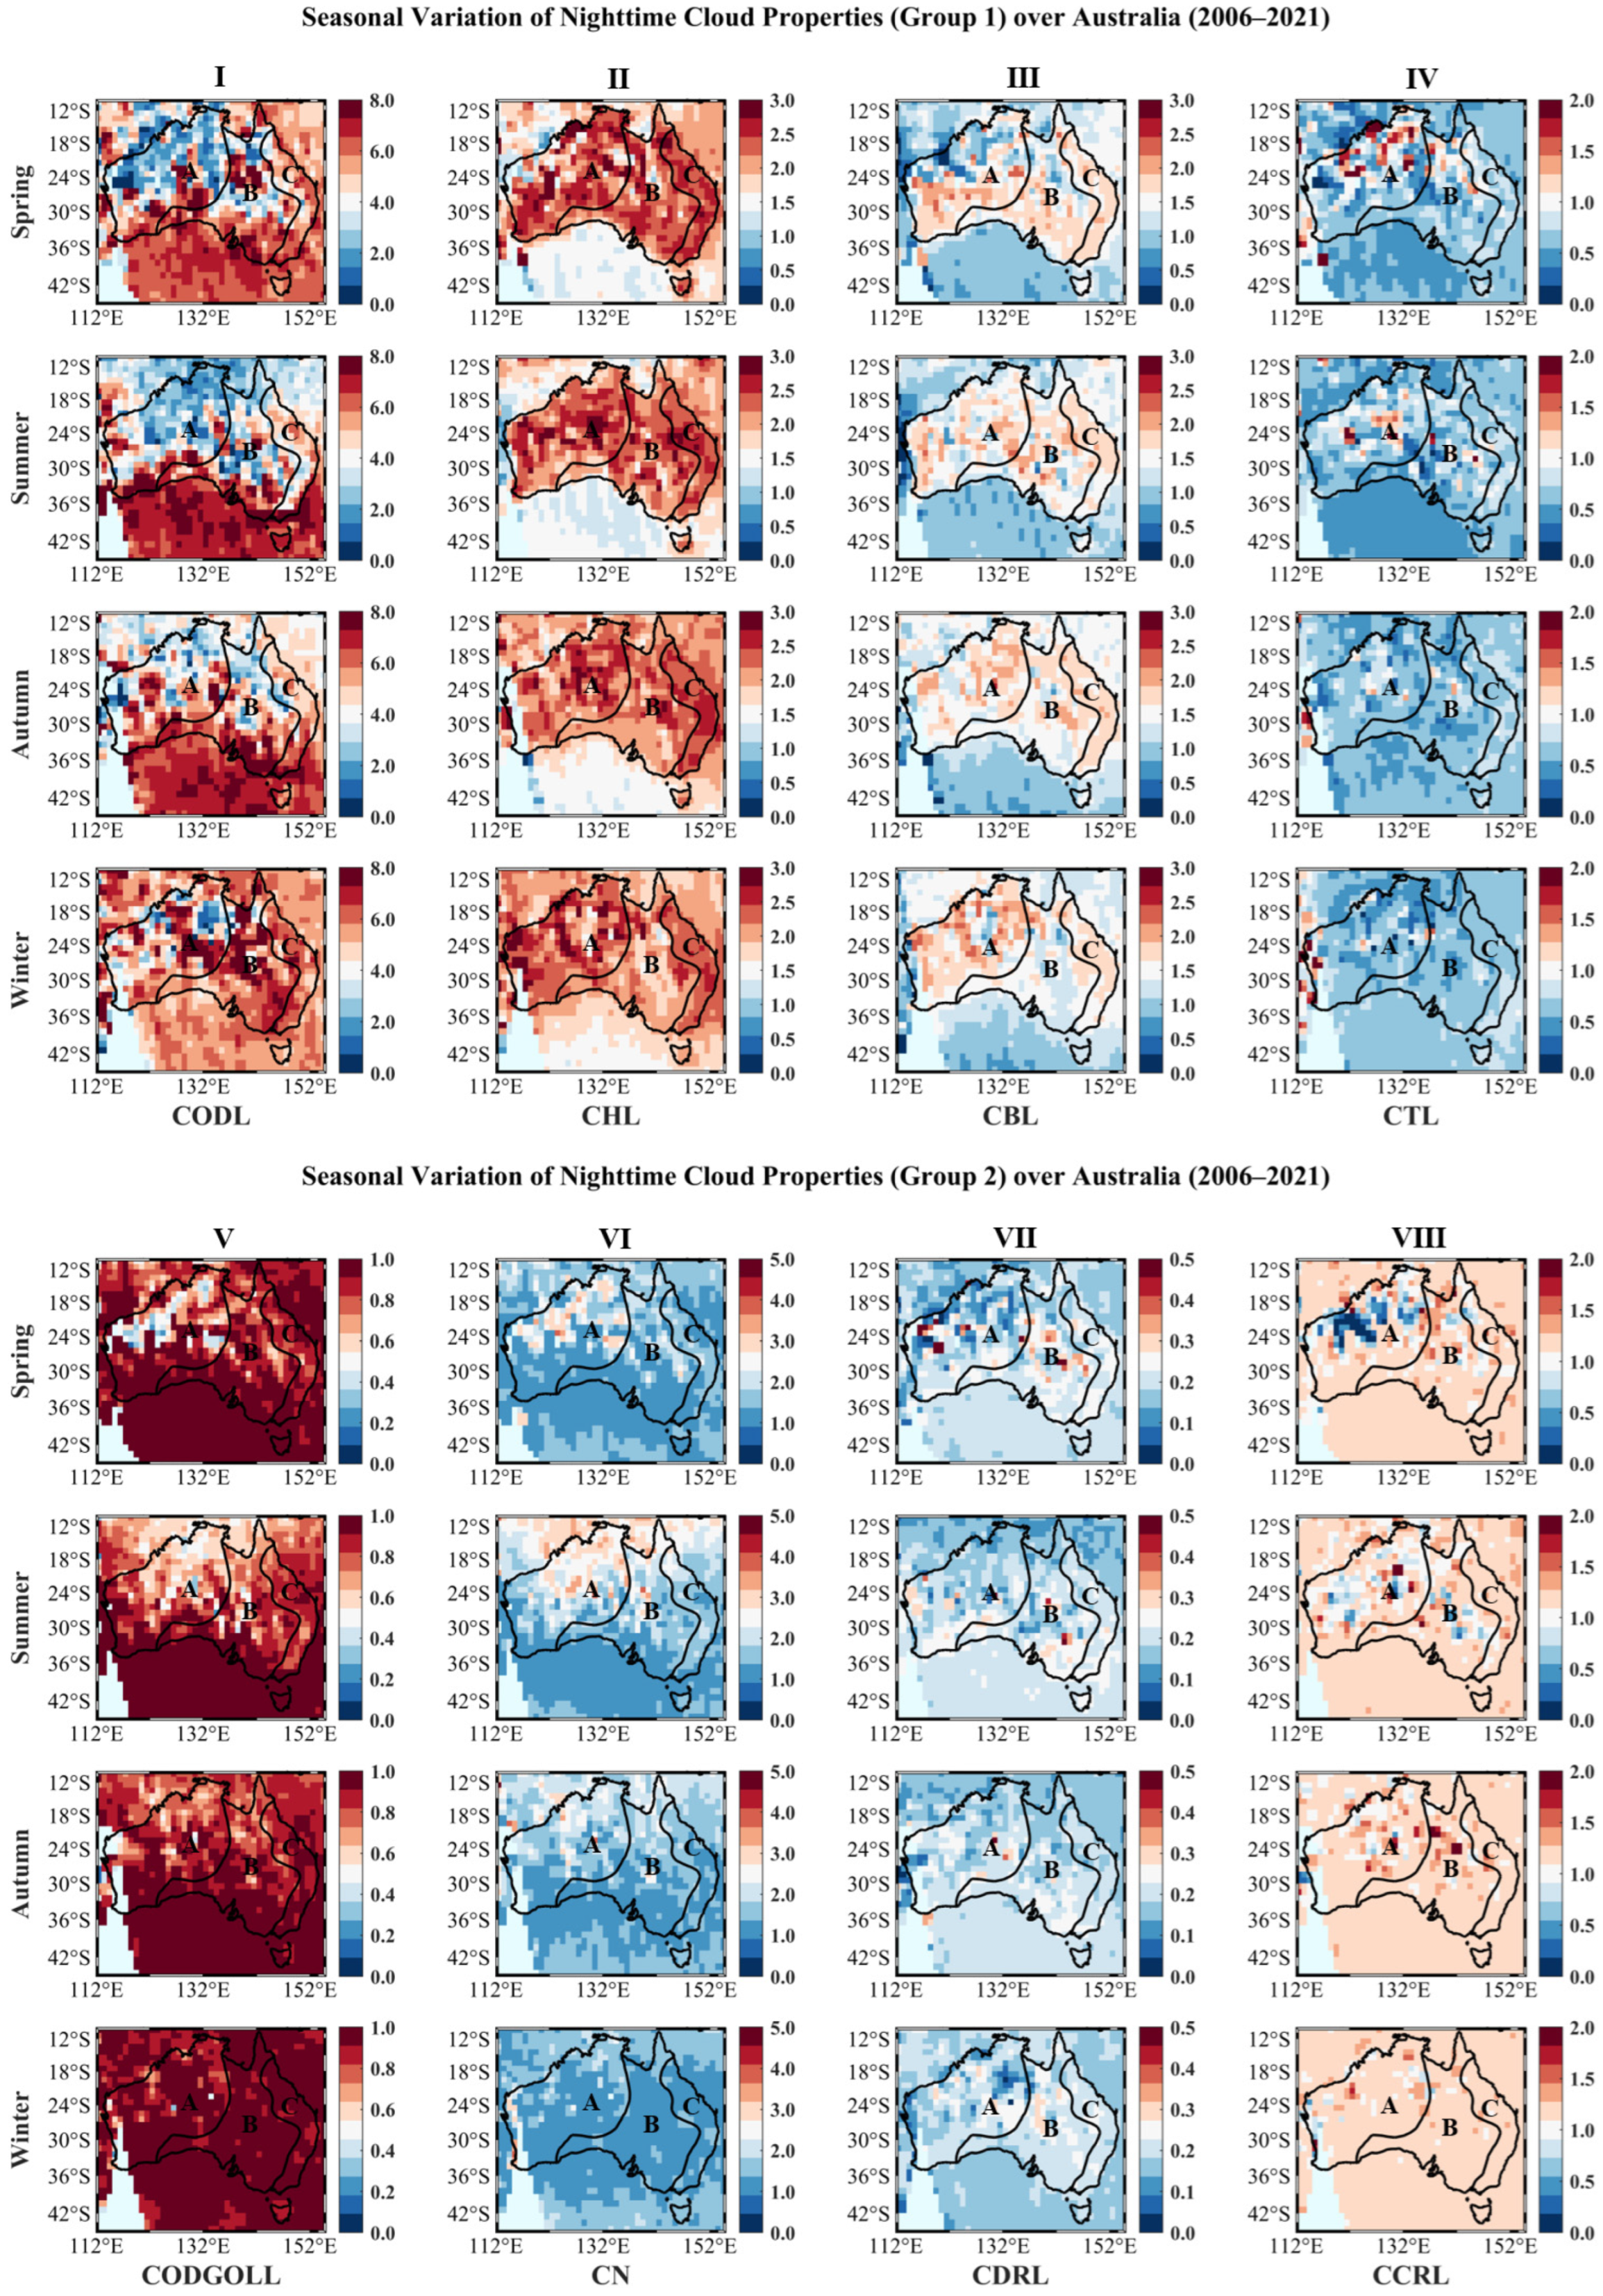
3.1. Spatial Distribution Characteristics of Low Cloud Layers’ Optical Properties in Australia
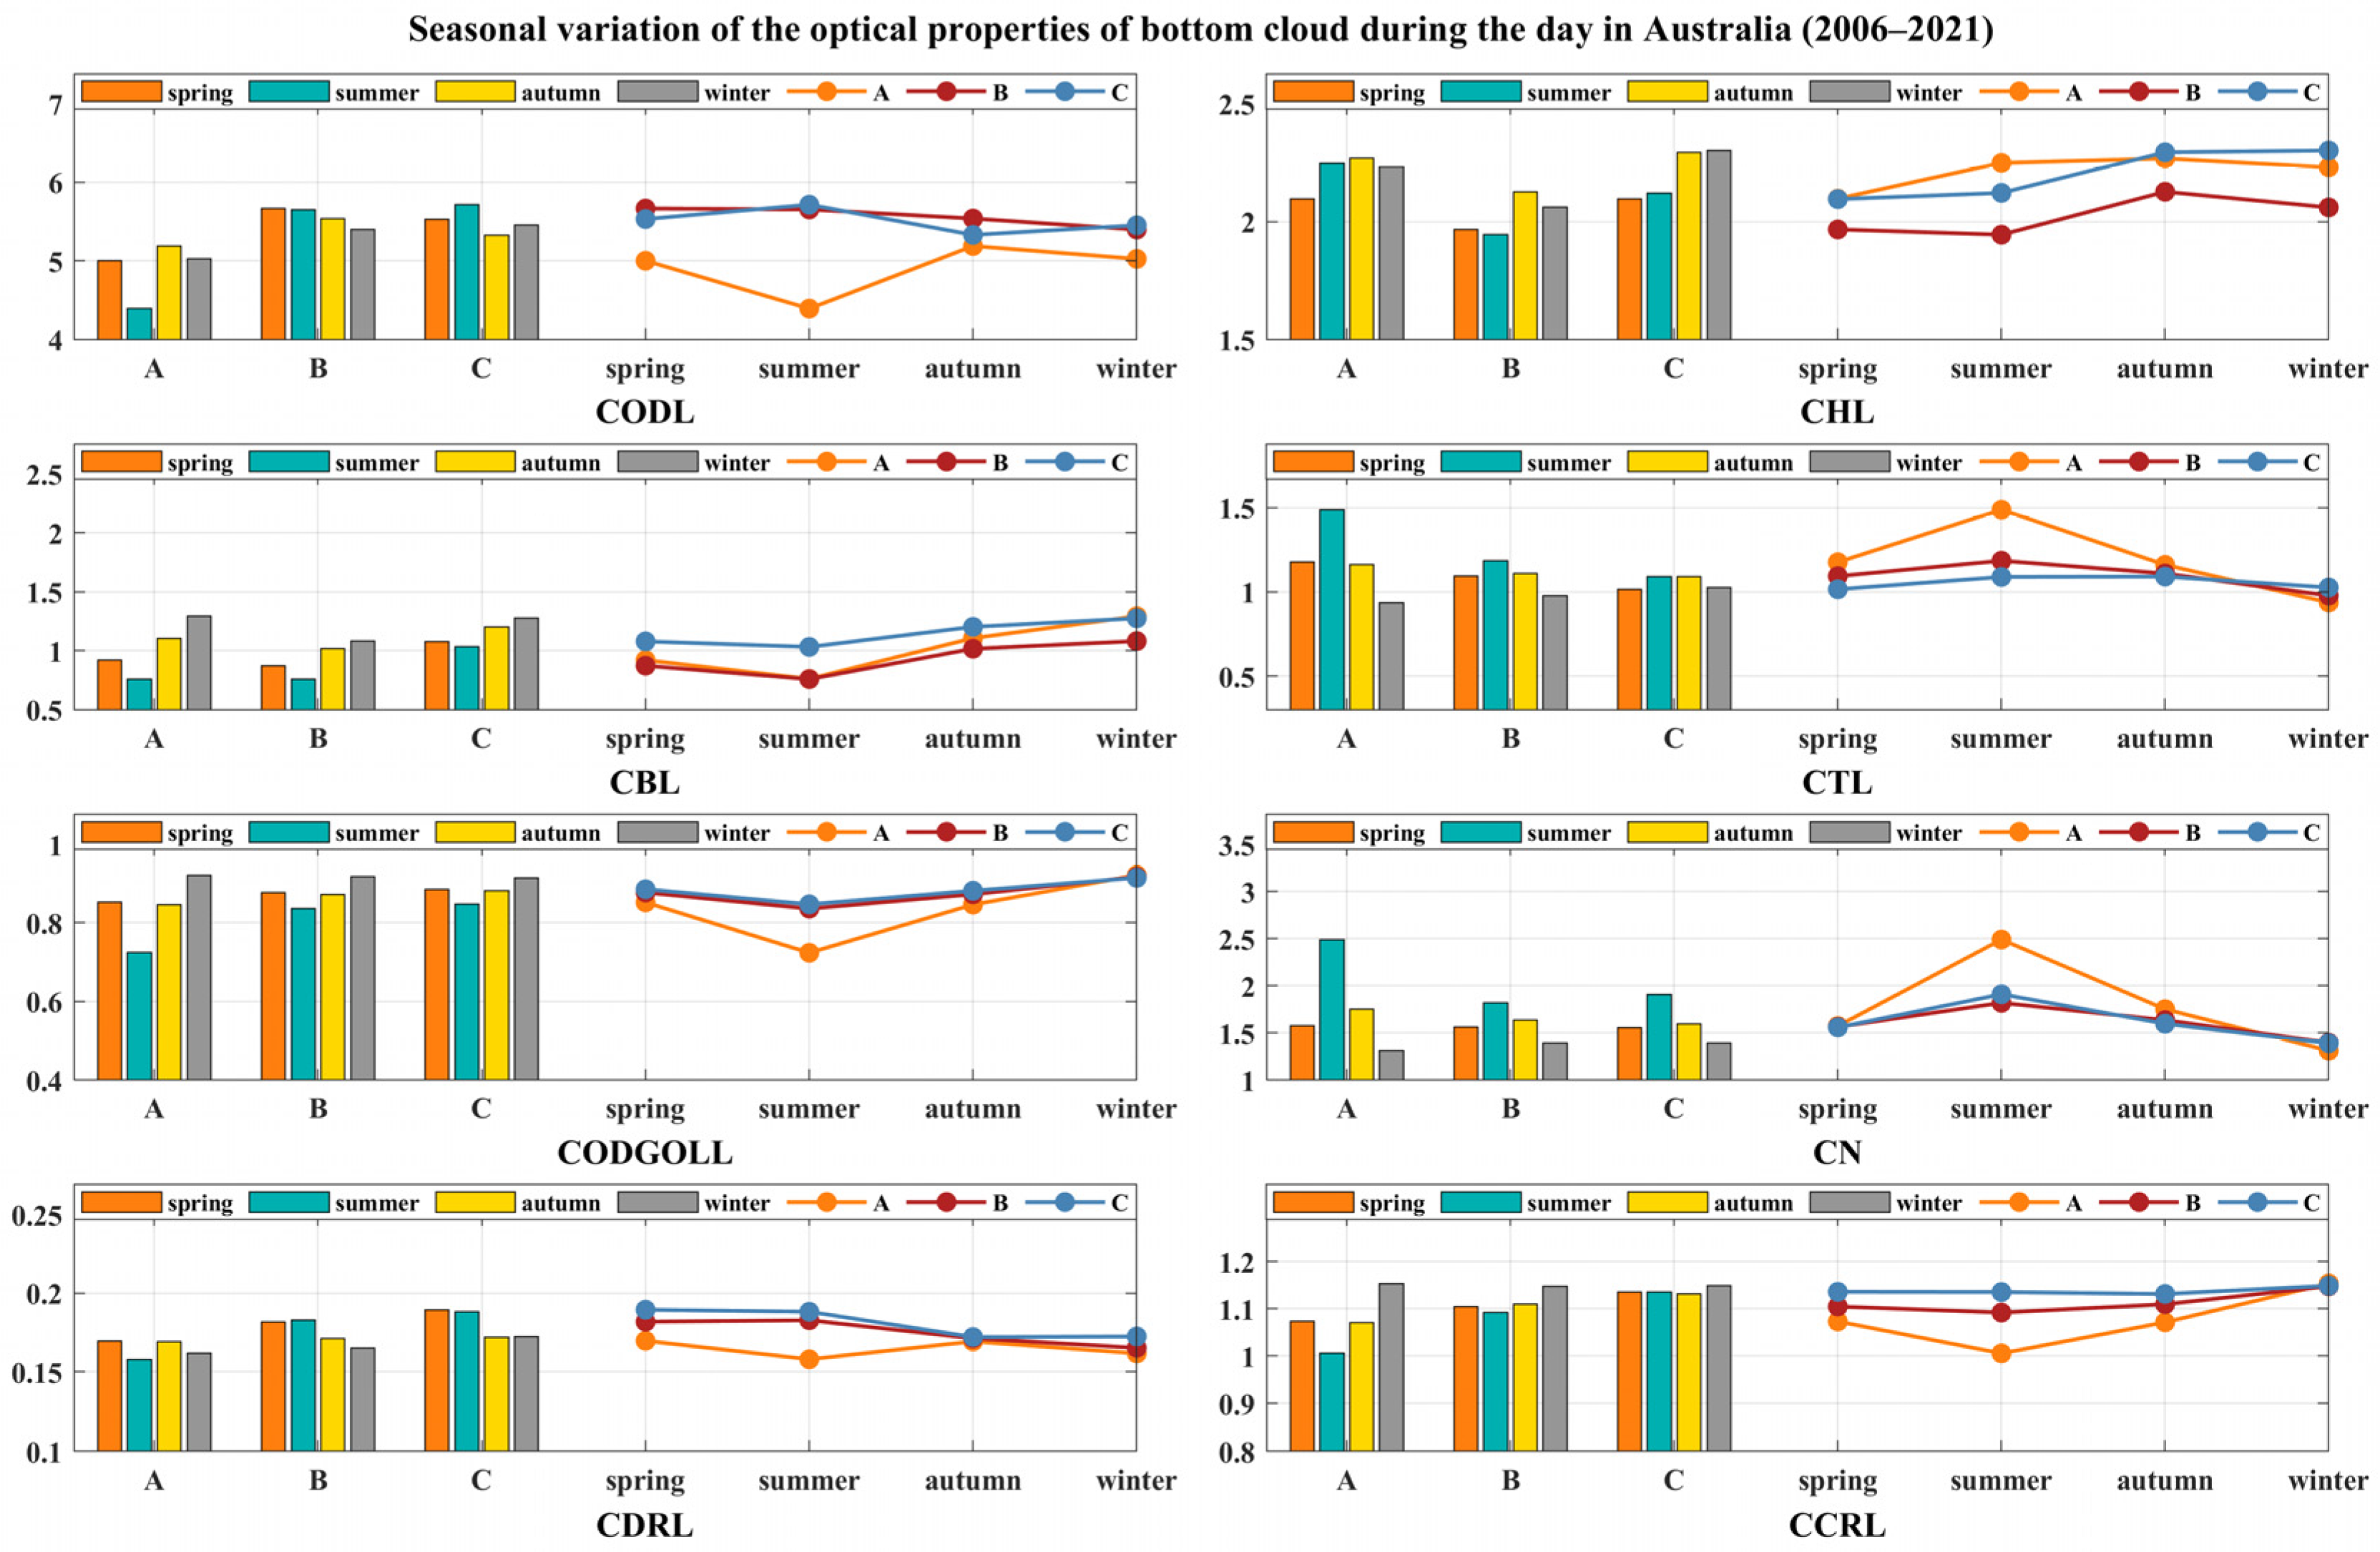
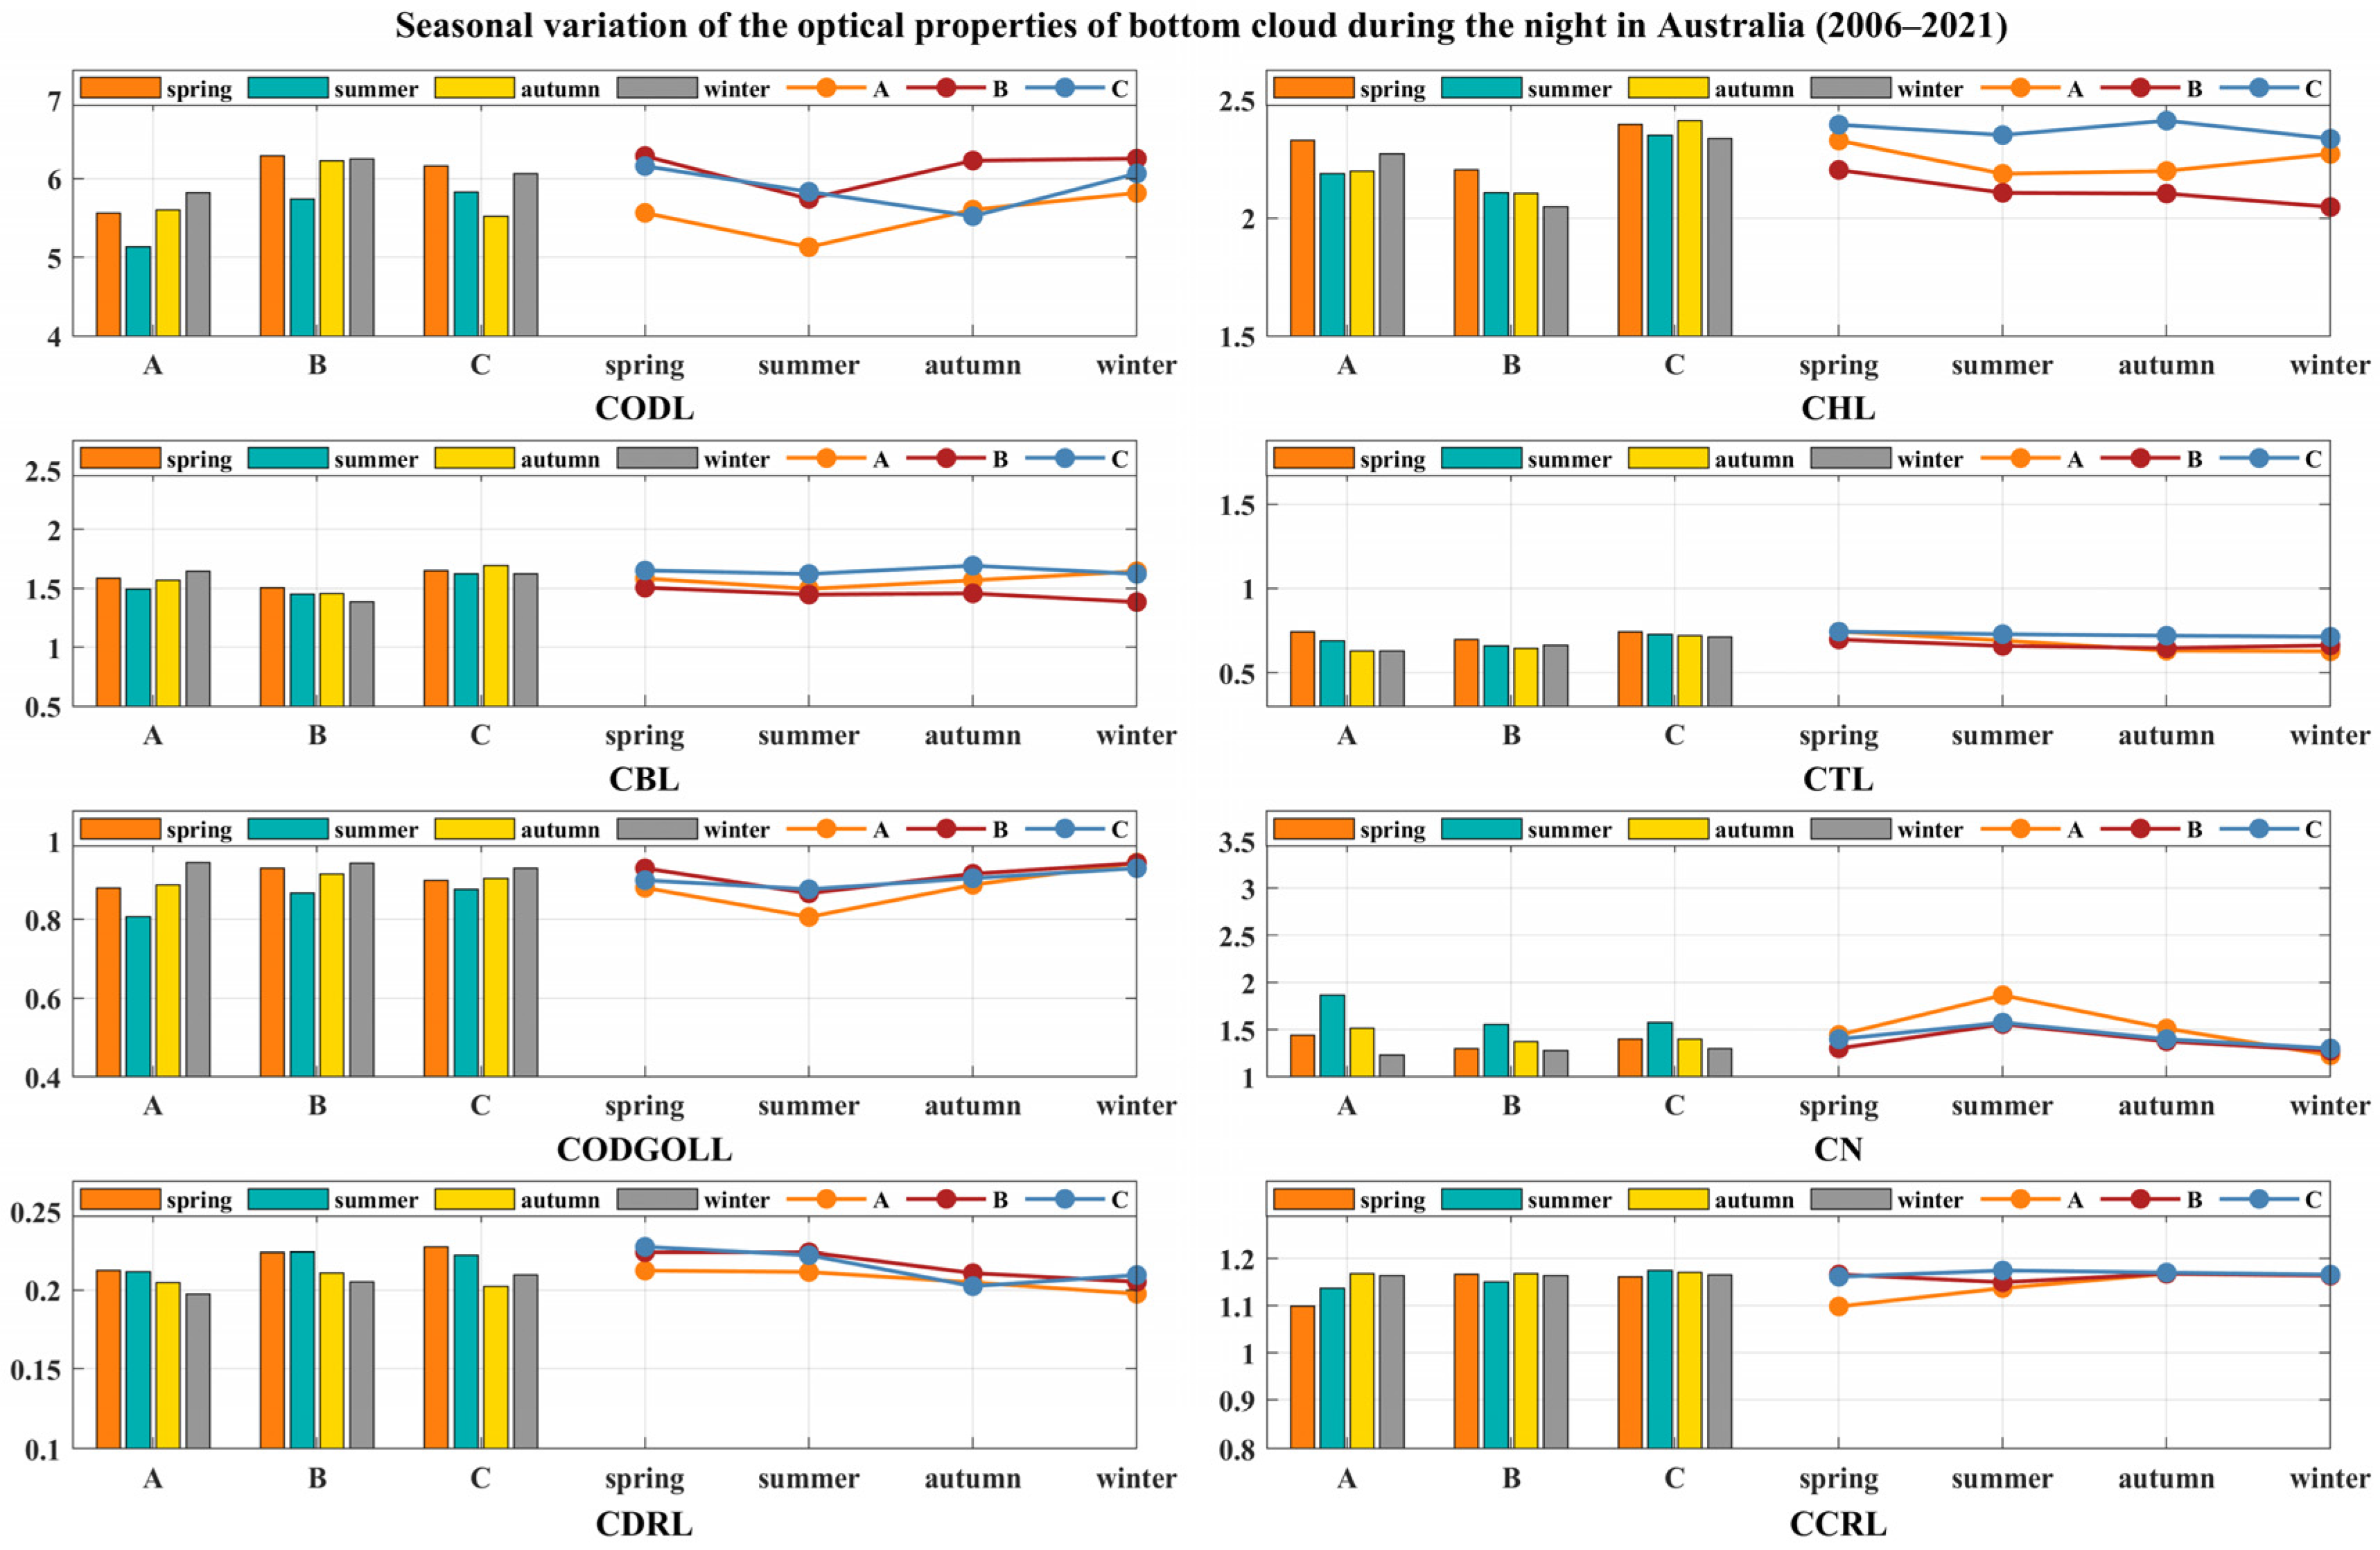
3.2. Regional and Seasonal Variations of Low Cloud Layers’ Optical Properties in Australia
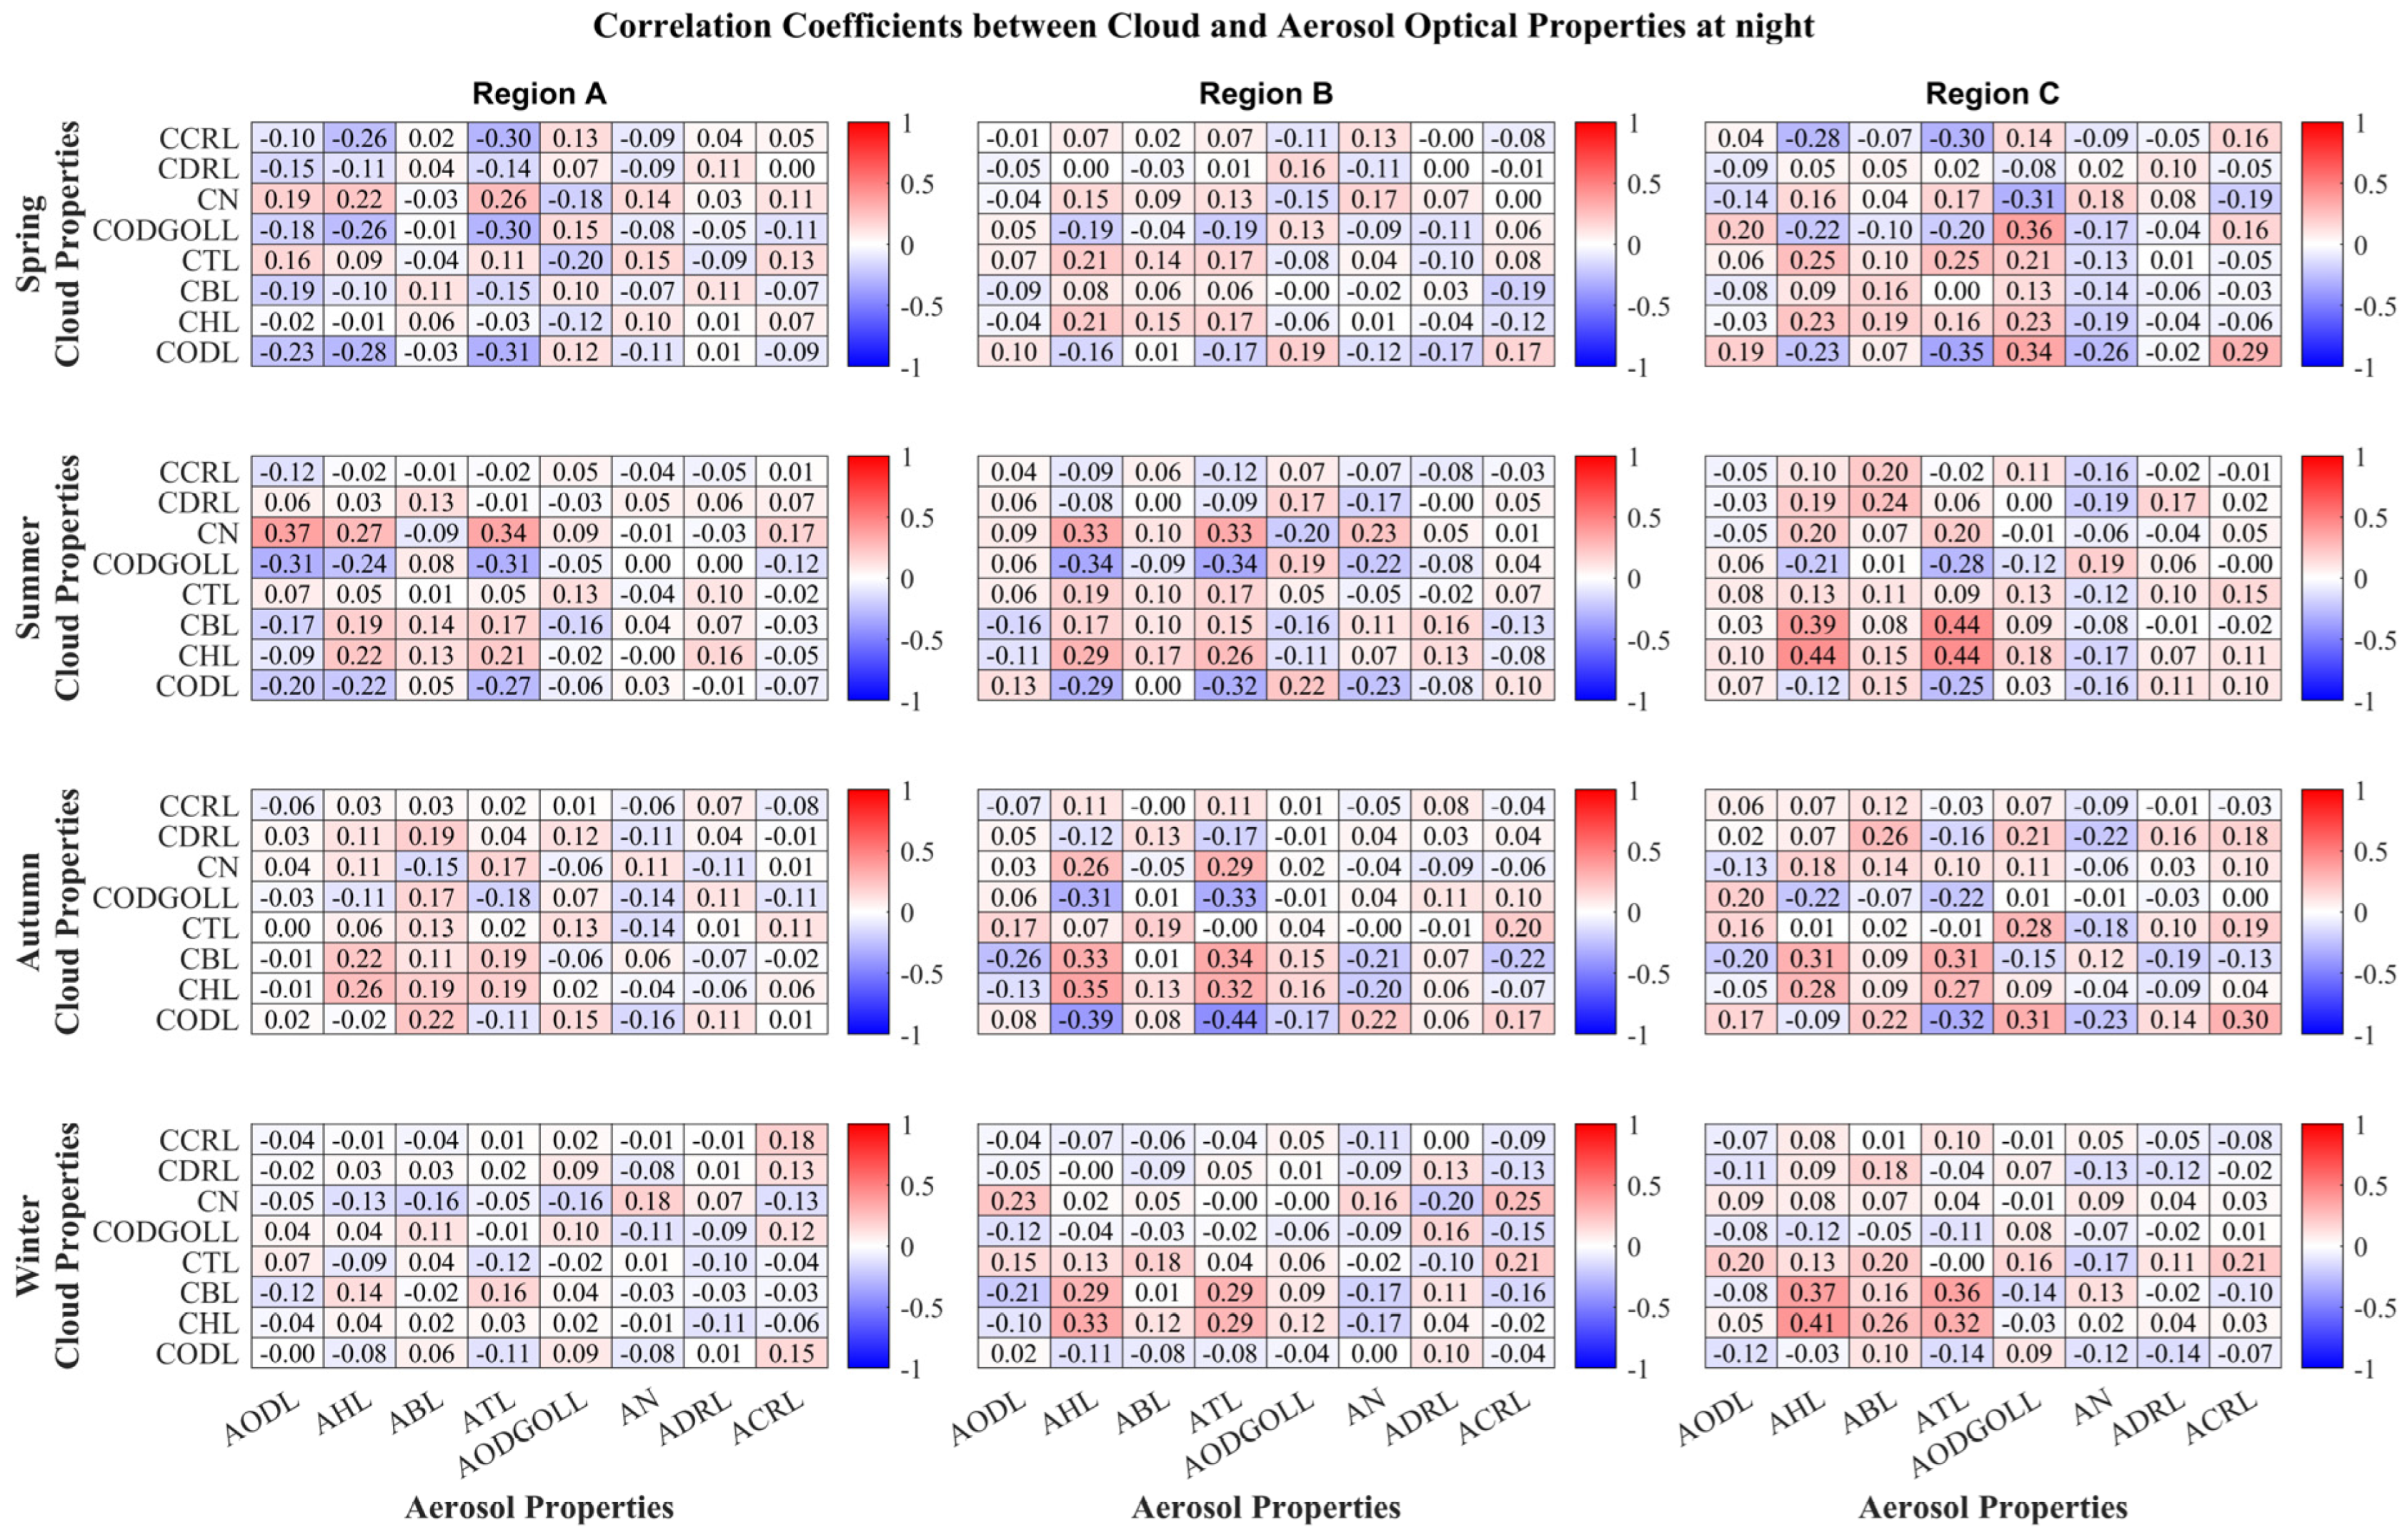
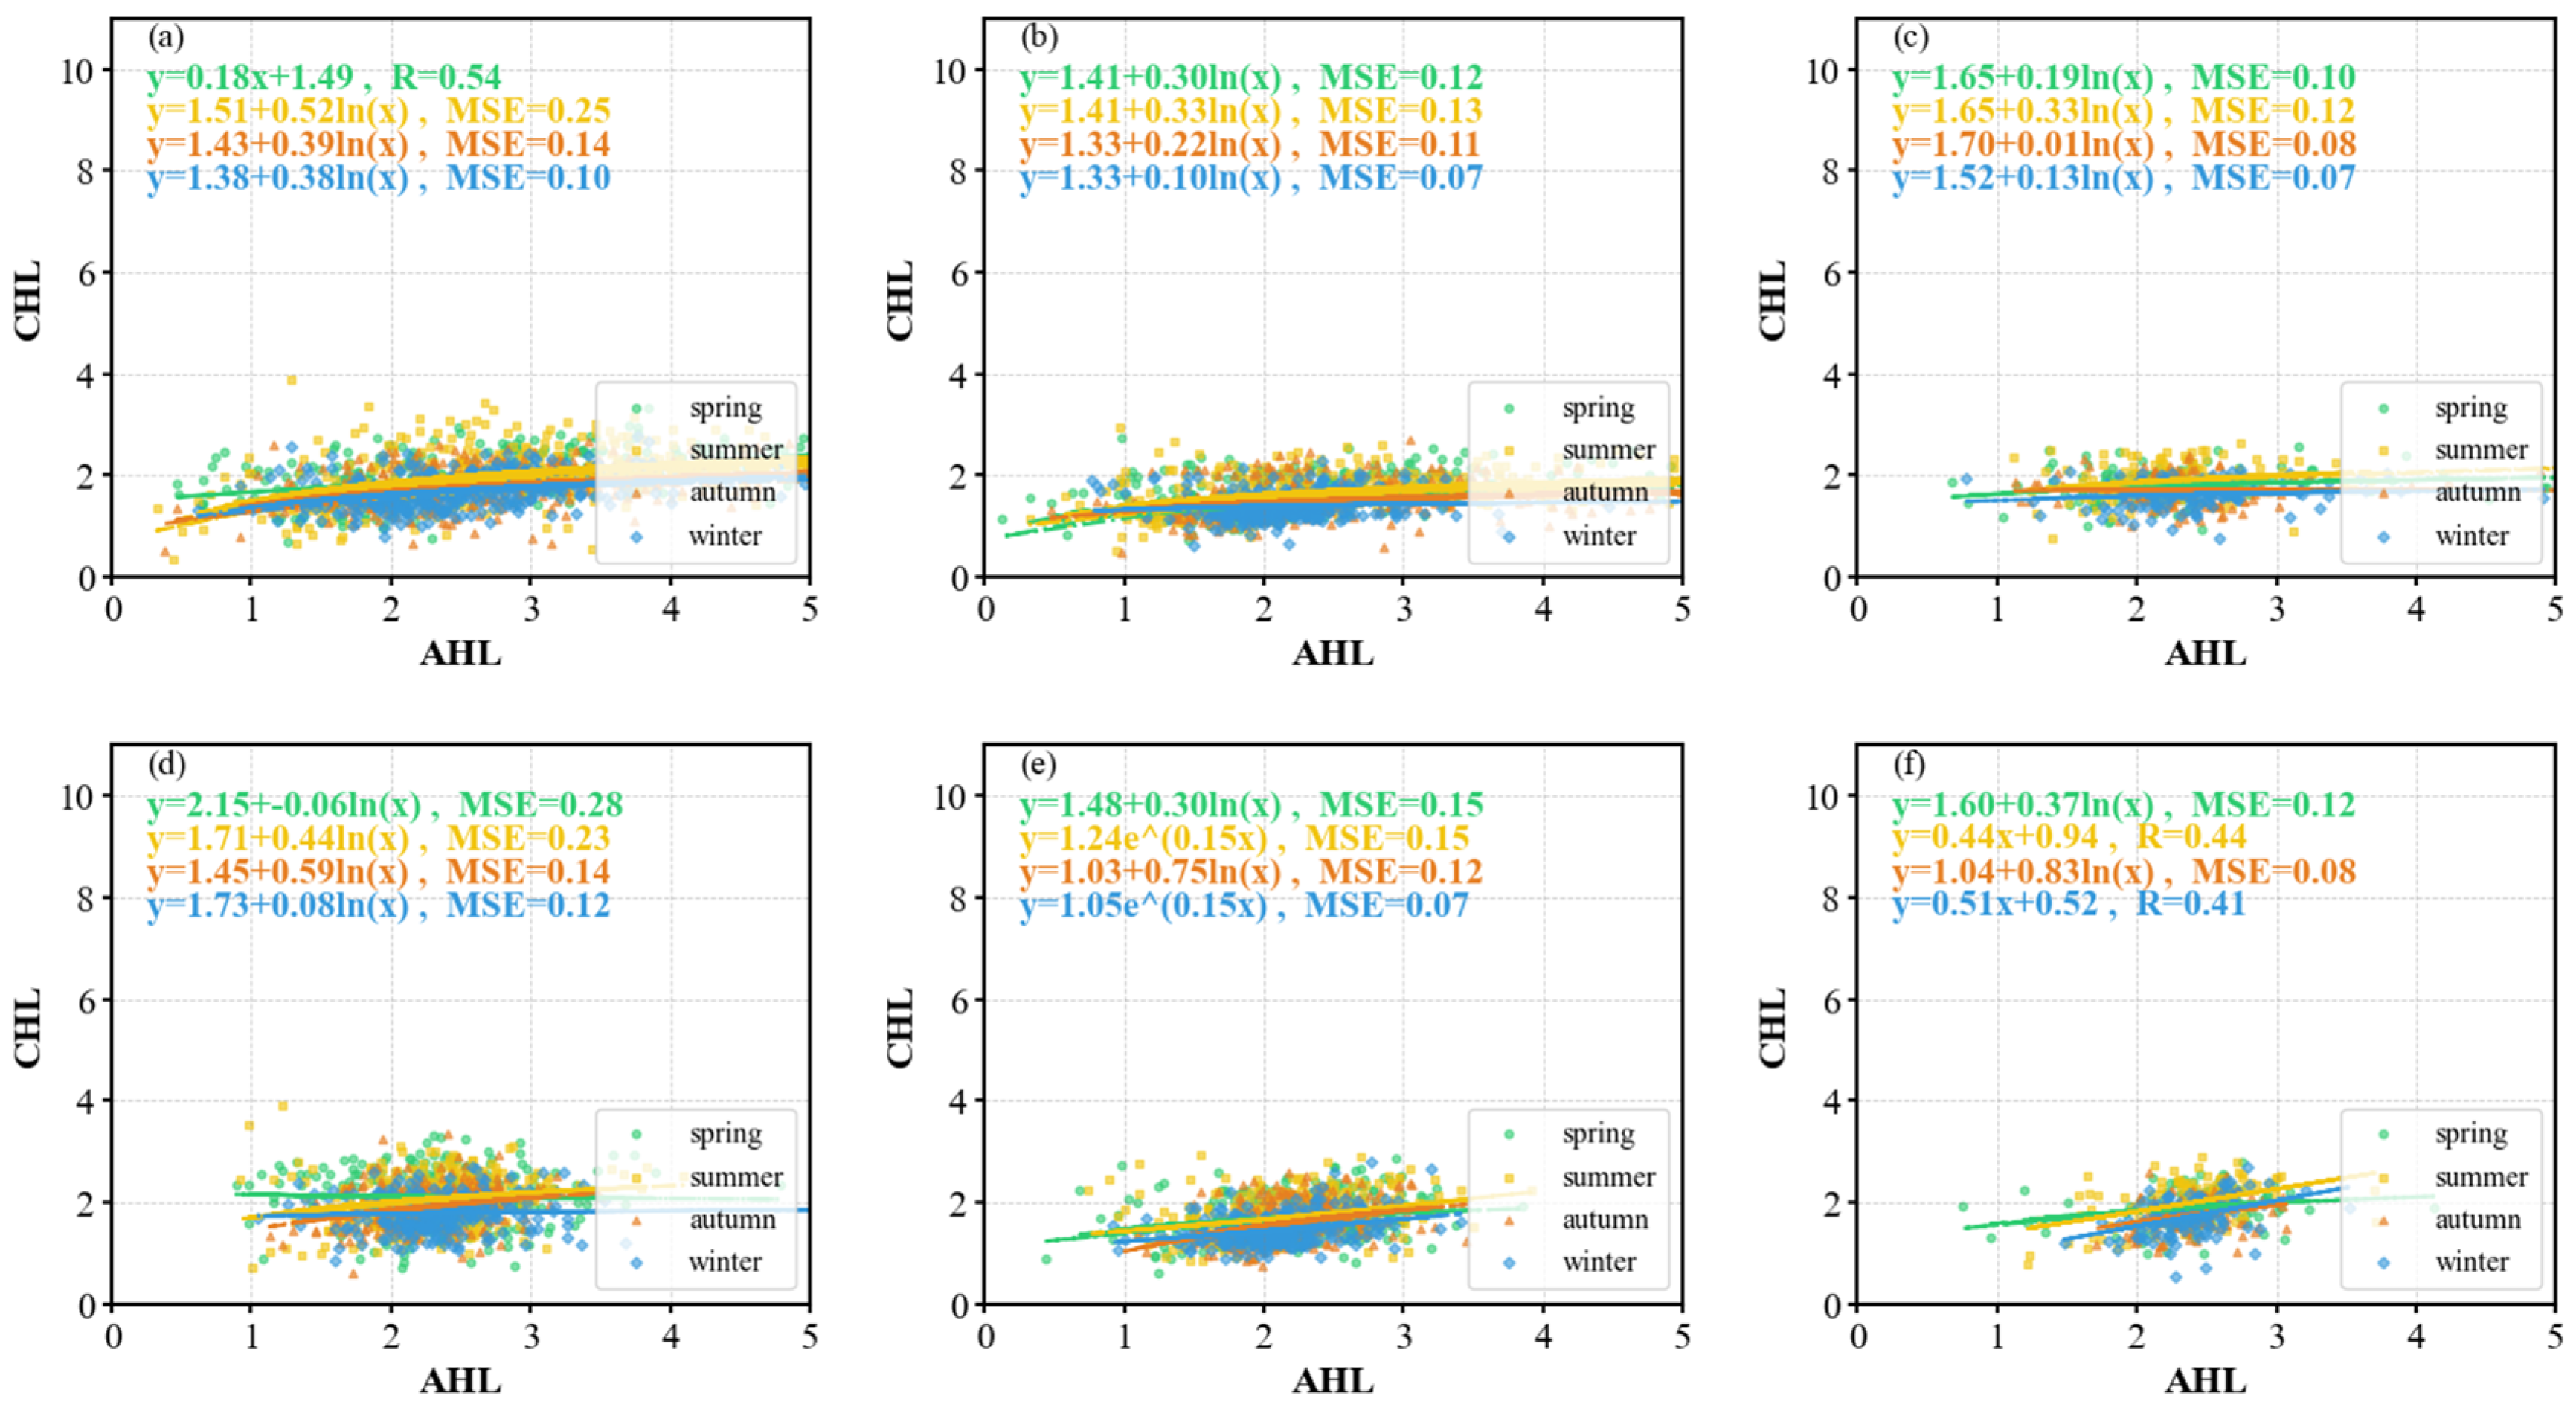
3.3. Correlations Between Low Cloud Layer and Aerosol Layer Optical Properties in Australia
4. Conclusions
Author Contributions
Funding
Institutional Review Board Statement
Informed Consent Statement
Data Availability Statement
Acknowledgments
Conflicts of Interest
References
- Masson-Delmotte, V.; Zhai, P.; Pirani, A. IPCC, 2021: Summary for Policymakers. In Climate Change 2021: The Physical Science Basis. Contribution of Working Group I to the Sixth Assessment Report of the Intergovernmental Panel on Climate Change; Cambridge University Press: Cambridge, UK, 2021; pp. 1–41. [Google Scholar]
- Ramanathan, V.; Cess, R.D.; Harrison, E.F.; Minnis, P.; Barkstrom, B.R.; Ahmad, E.; Hartmann, D. Cloud-Radiative Forcing and Climate: Results from the Earth Radiation Budget Experiment. Science 1989, 243, 57–63. [Google Scholar] [CrossRef] [PubMed]
- Harrison, E.F.; Minnis, P.; Barkstrom, B.R.; Ramanathan, V.; Cess, R.D.; Gibson, G.G. Seasonal Variation of Cloud Radiative Forcing Derived from the Earth Radiation Budget Experiment. J. Geophys. Res. 1990, 95, 18687–18703. [Google Scholar] [CrossRef]
- Rosenfeld, D.; Steven, S.; Wood, R.; Donner, L. Climate Effects of Aerosol-Cloud Interactions. Science 2014, 343, 379–380. [Google Scholar] [CrossRef] [PubMed]
- Yu, D.; Rossow, Y.Z.; MacIntosh, W.Y.; Zhang, T.G.; Song, S. Aerosol-driven droplet concentrations dominate coverage and water of oceanic low-level clouds. Science 2019, 363, eaav0566. [Google Scholar] [CrossRef]
- Rosenfeld, D.; Andreae, M.O.; Asmi, A.; Chin, M.; de Leeuw, G.; Donovan, D.P.; Kahn, R.; Kinne, S.; Kivekäs, N.; Kulmala, M.; et al. Global observations of aerosol-cloud-precipitation-climate interactions. Rev. Geophys. 2014, 52, 750–808. [Google Scholar] [CrossRef]
- Feingold, G.; Ghate, T.; Yamaguchi, T. Quantifying albedo susceptibility biases in shallow clouds. Atmos. Chem. Phys. 2022, 22, 3303–3319. [Google Scholar] [CrossRef]
- Stevens, B.; Feingold, G. Untangling aerosol effects on clouds and precipitation in a buffered system. Nature 2009, 461, 607–613. [Google Scholar] [CrossRef]
- Varnai, T.; Marshak, A. Global CALIPSO Observations of Aerosol Changes Near Clouds. IEEE Geosci. Remote Sens. Lett. 2010, 8, 19–23. [Google Scholar] [CrossRef]
- Naeger, A.R.; Liu, Z.; Christopher, S.A.; Ferrare, R. A New Technique Using Infrared Satellite Measurements to Improve the Accuracy of the CALIPSO Cloud-Aerosol Discrimination Method. IEEE Trans. Geosci. Remote Sens. 2013, 51, 642–653. [Google Scholar] [CrossRef]
- Shang, H.; Chen, L.; Tao, J.; Su, L.; Jia, S. Synergetic Use of MODIS Cloud Parameters for Distinguishing High Aerosol Loadings from Clouds Over the North China Plain. IEEE J. Sel. Top. Appl. Earth Obs. Remote Sens. 2014, 7, 4879–4886. [Google Scholar] [CrossRef]
- Bao, S.; Letu, H.; Zhao, C.; Tana, G.; Shang, H.; Wang, T.; Lige, B.; Bao, Y.; Purevjav, G.; He, J. Spatiotemporal Distributions of Cloud Parameters and the Temperature Response Over the Mongolian Plateau During 2006–2015 Based on MODIS Data. IEEE J. Sel. Top. Appl. Earth Obs. Remote Sens. 2018, 12, 549–558. [Google Scholar] [CrossRef]
- Coy, J.J.; Su, M.; Yang, P.; Liu, X.; Hu, Y. A Robust Ice Cloud Optical Property Model for Lidar-Based Remote Sensing Applications. IEEE Geosci. Remote Sens. Lett. 2024, 21, 1000405. [Google Scholar] [CrossRef]
- Josset, D.; Pelon, J.; Pascal, N.; Hu, Y.; Hou, W. On the Use of CALIPSO Land Surface Returns to Retrieve Aerosol and Cloud Optical Depths. IEEE Trans. Geosci. Remote Sens. 2018, 56, 3256–3264. [Google Scholar] [CrossRef]
- Qiu, R.; Han, G.; Li, X.; Xiao, J.; Liu, J.; Wang, S.; Li, S.; Gong, W. Contrasting responses of relationship between solar-induced fluorescence and gross primary production to drought across aridity gradients. Remote Sens. Environ. 2024, 302, 113984. [Google Scholar] [CrossRef]
- L’Ecuyer, T.S.; Hang, Y.; Matus, A.V.; Wang, Z. Reassessing the Effect of Cloud Type on Earth’s Energy Balance in the Age of Active Spaceborne Observations. Part I: Top of Atmosphere and Surface. J. Clim. 2019, 32, 6197–6217. [Google Scholar] [CrossRef]
- Pan, Z.; Gong, W.; Mao, F.; Li, J.; Wei, W.; Li, C.; Min, Q. Macrophysical and optical properties of clouds over East Asia measured by CALIPSO. J. Geophys. Res. Atmos. 2015, 120, 11653–11668. [Google Scholar] [CrossRef]
- Fan, C.; Fan, Y.; Wu, P.; Ding, M. The Relationship between Precipitation and Aerosol: Evidence from Satellite Observation. Atmos. Ocean. Phys. 2018, 3, 1812–1845. [Google Scholar]
- Yeom, J.M.; Freedman, S.H.; Anderson, J.C.; Yang, F.; Cantrell, W.; Shaw, R.A. Cloud microphysical response to entrainment of dry air containing aerosols. npj Clim. Atmos. Sci. 2025, 8, 8. [Google Scholar] [CrossRef]
- Kim, M.H.; Omar, A.H.; Tackett, J.L.; Vaughan, M.A.; Magill, B.E. The CALIPSO Version 4 Automated Aerosol Classification and Lidar Ratio Selection Algorithm. Atmos. Meas. Tech. 2018, 11, 6107–6135. [Google Scholar] [CrossRef]
- Tackett, J.L.; Winker, D.M.; Getzewich, B.J.; Vaughan, M.A.; Young, S.A.; Kar, J. CALIPSO lidar level 3 aerosol profile product: Version 3 algorithm design. Atmos. Meas. Tech. 2018, 11, 4129–4152. [Google Scholar] [CrossRef]
- Winker, D.M.; Pelon, J.; Coakley, J.A., Jr.; Ackerman, S.A.; Charlson, R.J.; Colarco, P.R.; Flamant, P.; Fu, Q.; Hoff, R.M.; Kittaka, C.; et al. The CALIPSO Mission: A Global 3D View of Aerosols and Clouds. Bull. Am. Meteorol. Soc. 2010, 91, 1211–1230. [Google Scholar] [CrossRef]
- Winker, D.M.; Pelon, J.R.; Mccormick, M.P. The CALIPSO mission: Spaceborne lidar for observation of aerosols and clouds. In Proceedings of the Third International Asia-Pacific Environmental Remote Sensing Remote Sensing of the Atmosphere, Ocean, Environment, and Space, Hangzhou, China, 23–27 October 2002. [Google Scholar]
- Winker, D.M.; Vaughan, M.A.; Omar, A.; Hu, Y.; Powell, K.A.; Liu, Z.; Hunt, W.H.; Young, S.A. Overview of the CALIPSO Mission and CALIOP Data Processing Algorithms. J. Atmos. Ocean. Technol. 2009, 26, 2310–2323. [Google Scholar] [CrossRef]
- Han, G.; Huang, Y.; Shi, T.; Zhang, H.; Li, S.; Zhang, H.; Chen, W.; Liu, J.; Gong, W. Quantifying CO2 emissions of power plants with Aerosols and Carbon Dioxide Lidar onboard DQ-1. Remote Sens. Environ. 2024, 313, 114368. [Google Scholar] [CrossRef]
- Stewart, S.B.; MacKenzie, T.R.; Van Niel, T.G.; Cai, D. Continental scale spatial temporal interpolation of near-surface air temperature: Do 1 km hourly grids for Australia outperform regional and global reanalysis outputs? Clim. Dyn. 2024, 62, 9971–10002. [Google Scholar] [CrossRef]
- Acworth, I.; Berhane, T.; Andersen, M.S.; Rau, G.C. Hydrological complexity and climate implications in Australia’s arid zone: A decade of high-resolution rainfall observations. J. Hydrol. Reg. Stud. 2024, 51, 101643. [Google Scholar] [CrossRef]
- Li, F.; Jupp, D.L.B.; Paget, M.; Briggs, P.R.; Thankappan, M.; Lewis, A.; Held, A. Improving BRDF normalisation for Landsat data using statistical relationships between MODIS BRDF shape and vegetation structure in the Australian continent. Remote Sens. Environ. 2017, 195, 275–296. [Google Scholar] [CrossRef]
- Sawyer, R.; Bradstock, R.; Bedward, M.; Morrison, R.J. Soil carbon in Australian fire-prone forests determined by climate more than fire regimes. Sci. Total Environ. 2018, 639, 526–537. [Google Scholar] [CrossRef]
- Yang, X.; Zhao, C.; Yang, Y.; Fan, H. Long-term multi-source data analysis about the characteristics of aerosol optical properties and types over Australia. Atmos. Chem. Phys. 2021, 21, 3803–3825. [Google Scholar] [CrossRef]
- Seinfeld, J.H.; Bretherton, C.; Carslaw, K.S.; Coe, H.; DeMott, P.J.; Dunlea, E.J.; Feingold, G.; Ghan, S.; Guenther, A.B.; Kahn, R.; et al. Improving our fundamental understanding of the role of aerosol−cloud interactions in the climate system. Proc. Natl. Acad. Sci. USA 2016, 113, 5781–5790. [Google Scholar] [CrossRef]
- Zhang, M.; Dong, Q.; Wang, N.; Chen, S.; Wang, Y.; Lu, F.; Qi, P. Optical and Physical Characteristics of Aerosol Layers in Australia Based on CALIPSO. Atmosphere 2023, 14, 1145. [Google Scholar] [CrossRef]
- McCoy, D.T.; Field, P.R.; Schmidt, A.; Grosvenor, D.P.; Bender, F.A.-M.; Shipway, B.J.; Hill, A.A.; Wilkinson, J.M.; Elsaesser, G.S. Aerosol midlatitude cyclone indirect effects in observations and high-resolution simulations. Atmos. Chem. Phys. 2018, 18, 5821–5846. [Google Scholar] [CrossRef]
- Hernandez-Jaramillo, D.C.; McFarquhar, C.; Braga, R.C.; Butcherine, P.; Doss, A.; Kelaher, B.; Rosenfeld, D.; Harrison, D.P. New airborne research facility observes sensitivity of cumulus cloud microphysical properties to aerosol regime over the great barrier reef. Environ. Sci. Atmos. 2024, 4, 861–871. [Google Scholar] [CrossRef]
- Leung, G.; van der Heever, S.C. Aerosol breezes drive cloud and precipitation increases. Nat. Commun. 2023, 14, 2527. [Google Scholar] [CrossRef] [PubMed]
- Mitchell, R.M.; Forgan, B.W.; Campbell, S.K. The Climatology of Australian Aerosol. Atmos. Chem. Phys. 2017, 17, 5131–5154. [Google Scholar] [CrossRef]
- Mcpherson, C.J.; Reagan, J.A. Analysis of Optical Properties of Saharan Dust Derived from Dual-Wavelength Aerosol Retrievals from CALIPSO Observations. IEEE Geosci. Remote Sens. Lett. 2010, 7, 98–102. [Google Scholar] [CrossRef]
- Lakshmi, N.B.; Babu, S.S.; Nair, V.S. Recent Regime Shifts in Mineral Dust Trends Over South Asia from Long-Term CALIPSO Observations. IEEE Trans. Geosci. Remote Sens. 2019, 57, 4485–4489. [Google Scholar] [CrossRef]
- Hu, Y.; Winker, D.; Vaughan, M.; Lin, B.; Omar, A.; Trepte, C.; Flittner, D.; Yang, P.; Nasiri, S.L.; Baum, B.; et al. CALIPSO/CALIOP Cloud Phase Discrimination Algorithm. J. Atmos. Ocean. Technol. 2009, 26, 2293–2309. [Google Scholar] [CrossRef]
- Avery, M.A.; Ryan, R.A.; Getzewich, B.J.; Vaughan, M.A.; Winker, D.M.; Hu, Y.; Garnier, A.; Pelon, J.; Verhappen, C.A. CALIOP V4 cloud thermodynamic phase assignment and the impact of near-nadir viewing angles. Atmos. Meas. Tech. 2020, 13, 4539–4563. [Google Scholar] [CrossRef]
- Young, S.A.; Vaughan, M.A.; Garnier, A.; Tackett, J.L.; Lambeth, J.D.; Powell, K.A. Extinction and optical depth retrievals for CALIPSO’s Version 4 data release. Atmos. Meas. Tech. 2018, 11, 5701–5727. [Google Scholar] [CrossRef]
- Xing, Y.; Han, G.; Mao, H.; He, H.; Bo, Z.; Gong, R.; Ma, X.; Gong, W. MAM-YOLOv9: A Multi-Attention Mechanism Network for Methane Emission Facility Detection in High-Resolution Satellite Remote Sensing Images. IEEE Trans. Geosci. Remote Sens. 2024, 63, 5614516. [Google Scholar] [CrossRef]
- Vaughan, M.A.; Young, S.A.; Winker, D.M.; Powell, K.A.; Omar, A.H.; Liu, Z.; Hu, Y.; Hostetler, C.A. CALIOP Algorithm Theoretical Basis Document, Part 2: Feature Detection and Layer Properties Algorithms. PC-SCI-202.02; NASA Langley Research Center: Hampton, VA, USA, 2005; 87p. [Google Scholar]


| Variable Name | Explanation |
|---|---|
| CODL | Optical depths of low clouds |
| CHL | Top heights of low clouds |
| CBL | Base heights of low clouds |
| CTL | Geometric thickness of low clouds |
| CODGOLL | Fraction of low cloud optical depths |
| CN | Number of cloud layers |
| CDRL | Depolarization ratio of low clouds |
| CCRL | Color ratio of low clouds |
| DAYTIME | NIGHTTIME | |||||
|---|---|---|---|---|---|---|
| Autumn | Spring | Summer | Autumn | Summer | Winter | |
| A | A | B | B | C | C | |
| CODL_ATL | −0.41 | −0.44 | ||||
| CHL_AHL | 0.54 | 0.44 | 0.41 | |||
| CHL_ATL | 0.52 | 0.40 | 0.44 | |||
| CBL_ATL | 0.44 | |||||
| CTL_AHL | 0.53 | |||||
| CTL_ATL | 0.51 | |||||
| CDRL_AHL | −0.43 | −0.43 | ||||
| CDRL_ATL | −0.44 | −0.46 | ||||
| CCRL_AHL | −0.41 | |||||
| CCRL_ATL | −0.40 | |||||
| CN_ATL | 0.42 | 0.43 | ||||
| CODGOLL_AHL | −0.50 | |||||
| CODGOLL_ATL | −0.50 | −0.40 | ||||
Disclaimer/Publisher’s Note: The statements, opinions and data contained in all publications are solely those of the individual author(s) and contributor(s) and not of MDPI and/or the editor(s). MDPI and/or the editor(s) disclaim responsibility for any injury to people or property resulting from any ideas, methods, instructions or products referred to in the content. |
© 2025 by the authors. Licensee MDPI, Basel, Switzerland. This article is an open access article distributed under the terms and conditions of the Creative Commons Attribution (CC BY) license (https://creativecommons.org/licenses/by/4.0/).
Share and Cite
Zhang, M.; Zhang, Y.; Wang, Y.; Liang, J.; Yue, Z.; Song, W.; Han, G. Optical Properties of Near-Surface Cloud Layers and Their Interactions with Aerosol Layers: A Case Study of Australia Based on CALIPSO. Atmosphere 2025, 16, 793. https://doi.org/10.3390/atmos16070793
Zhang M, Zhang Y, Wang Y, Liang J, Yue Z, Song W, Han G. Optical Properties of Near-Surface Cloud Layers and Their Interactions with Aerosol Layers: A Case Study of Australia Based on CALIPSO. Atmosphere. 2025; 16(7):793. https://doi.org/10.3390/atmos16070793
Chicago/Turabian StyleZhang, Miao, Yating Zhang, Yingfei Wang, Jiwen Liang, Zilu Yue, Wenkai Song, and Ge Han. 2025. "Optical Properties of Near-Surface Cloud Layers and Their Interactions with Aerosol Layers: A Case Study of Australia Based on CALIPSO" Atmosphere 16, no. 7: 793. https://doi.org/10.3390/atmos16070793
APA StyleZhang, M., Zhang, Y., Wang, Y., Liang, J., Yue, Z., Song, W., & Han, G. (2025). Optical Properties of Near-Surface Cloud Layers and Their Interactions with Aerosol Layers: A Case Study of Australia Based on CALIPSO. Atmosphere, 16(7), 793. https://doi.org/10.3390/atmos16070793