Abstract
Pollen allergies represent a growing public health concern that necessitates enhancements to the network of instruments and modeling calculations in order to facilitate a more profound comprehension of pollen transportation. The Beenose instrument quantifies the light scattered by particles that traverse a laser beam at four angles. This methodology enables the differentiation of pollen particles from other particulate matter, predominantly mineral and carbonaceous in nature, thereby facilitating the retrieval of pollen concentrations. The Beenose instrument has been installed on the tourist balloon known as “Ballon de Paris” in a large park situated in the southwest of Paris, France. The measurement period is from April to November 2024, coinciding with the pollen seasons of trees and grasses. The balloon conducts numerous flights per day, reaching an altitude of 150 m when weather conditions are conducive, which occurs approximately 58% of the time during this period. The data are averaged to produce vertical profiles with a resolution of 30 m. Concentrations of the substance decrease with altitude, although a secondary layer is observed in spring. This phenomenon may be attributed to the presence of emissions from a proximate forest situated at a higher altitude. The average decrease in concentration of 11 ± 8% per 10 m is consistent with the findings of previous studies. The long-term implementation of Beenose measurements on this tourist balloon is intended to enhance the precision of the results and facilitate the differentiation of the various parameters that can influence the vertical transportation of pollen.
1. Introduction
A growing proportion of the population is affected by pollen-induced allergies, which have become a significant health concern due to symptoms such as conjunctivitis, rhinitis, and asthma. The prevalence of allergic rhinitis has increased in France from 4% in the 1970s to over 30% today [1,2]. The allergic responses exhibited by citizens in response to pollen exposure have been shown to vary according to three main factors: the nature of the pollen, its method of transportation, and the proximity of the individual to the source of the pollen [3]. Recent studies have demonstrated that local concentrations measured at the same time can vary considerably, by up to a factor of 10, over distances of only a few km depending on the topography of cities and landscapes [4]. Consequently, it is imperative to accurately estimate pollen concentrations at the local scale and enhance the capacity to predict citizens’ pollen allergy responses. This objective can be accomplished by employing modeling calculations and a network of sensors to accurately determine the manner in which pollens are transported. This is a challenging task due to the fact that pollen transport processes must consider meteorological conditions, horizontal and vertical transport, and the aerodynamic properties of various pollen families [5,6]. It can be hypothesized, though this needs to be confirmed, that larger pollen grains are more difficult to transport by wind, while the smallest pollen grains can easily reach a rooftop sensor or higher.
A significant proportion of pollen dispersal occurs in close proximity to emission sources. However, long-distance transports of low concentrations have also been observed [7,8,9]. Horizontal dispersion and global transport by winds have been thoroughly investigated from local to regional scales, as evidenced in the literature [10,11,12,13,14,15], since they can directly impact the geographic extent of the populations’ allergen exposure. It is noteworthy that low concentrations of long-transported pollens have the potential to exceed the threshold for triggering allergic sensitivity. The situation is more complex in the context of vertical transport, which is less documented, wherein pollens are subject to a dual process of gravitational settling and wind-driven vertical transport. The complexity of this process is attributable to the influence of local temperature gradients, which can give rise to local winds and upward movements. This phenomenon is further compounded in urban environments, where the vertical profile and configuration of buildings can induce local wind phenomena and generate areas of stagnation (a phenomenon exemplified by canyon streets with particulate matter pollution [16]). Therefore, the vertical transport needs to be studied in urban environments, in particular, for citizens that could be exposed to pollens across residential building floors.
A field campaign conducted in Germany utilized sensors in 25 cities, revealing that pollen concentrations are diminished at an elevation of 50 m as compared to levels near the ground, which are typically 1.5 m. A decrease of approximately 30% was observed, although some variability in the results was evident [17]. A further field campaign conducted in Thessaloniki, Greece, utilizing sensors positioned at heights of 1.5 m and 30 m above ground level, demonstrated that pollen concentrations diminished by an average factor of two for every 19 m of elevation [18]. This phenomenon was recently substantiated through a qualitative assessment during a field campaign conducted in Brussels, Belgium [4]. The decline in pollen concentrations with altitude can account for the phenomenon of pollen being detected earlier at street level than at rooftop level, with a shift of up to three weeks [19].
The findings of these studies indicate the necessity of measuring pollen concentrations at varying elevations in a synchronized manner, thereby facilitating more precise estimation of the decline in concentration. To this end, a campaign was conducted over several months from spring to autumn 2024 in Paris, France. The Beenose instrument was carried on board the tethered tourist balloon, designated “Ballon de Paris Generali,” up to an elevation of 150 m.
2. Materials and Methods
2.1. Measurements Conditions
The measurements were conducted in one of Paris’ main parks, called Parc André Citroën, located in the southwest of the city. The park, which covers an area of 14 hectares, contains a diverse array of plant life, including 2500 trees, 70,000 shrubs, and 250,000 perennial plants of various varieties, in addition to grass beds [20]. It is noteworthy that these factors can be regarded as substantial local sources of pollen, particularly for nearby residents and individuals engaged in activities such as walking or physical exercise in the park.
The tethered tourist attraction, the Ballon de Paris Generali, is located at the heart of the park at 48.8415° N and 2.2739° E (Figure 1), at an altitude of 30 m above sea level. The balloon is filled with helium in order to ascend to an elevation of 150 m above ground level. The vehicle’s return to the ground is facilitated by a cable and an electric engine. In the event of favorable meteorological conditions, characterized by the absence of precipitation and wind speeds below approximately 10 m per second, the possibility arises for the execution of tens of flights on a daily basis. These flights are characterized by an ascent speed of 0.9 m.s−1 and a descent speed of 0.6 m.s−1. It is important to note that flights are not performed at night. In addition to the transportation of tourists, the balloon is utilized for the conveyance of scientific instruments employed in the monitoring of air quality for the purpose of scientific research programs, with specific regard to particulate matter, O3, and greenhouse gases. This platform provides a unique opportunity to monitor the air column above southwest Paris over extended periods of time [21]. During a seven-year field campaign, the LOAC optical aerosol counter, which is dedicated to measuring the concentration of particulate matter from 0.2 to 50 µm, demonstrated the capability to detect pollen using an optical device. The result is founded upon an analysis of the observed seasonal cycle, which evinces a greater number of large particles in summer than in winter, in contrast to the cycle of submicronic pollution particles. The aforementioned detection process necessitates confirmation, which can be accomplished through the utilization of the recently developed Beenose instrument (Lify Air Company, Orléans, France), as outlined in Section 2.2, for the purpose of pollen detection.

Figure 1.
Left: Touristic “Ballon de Paris” inside the André Citroën Park; right, location of the measurements (from Google map).
As with the other instruments already present, the Beenose instrument was installed on the outer edge of the balloon gondola on 19 April 2024. The analysis of the measurements was concluded at the onset of November, at which point the pollen concentrations were found to be at their lowest. Three distinct temporal periods were considered, corresponding to the pollens of varying origins: spring (20 April to 20 May), primarily comprising tree pollens; summer (20 May to 5 September 2024), predominantly consisting of grass pollens; and autumn (5 September to 5 November 2024), marking the final period of grass and weed pollens. Due to meteorological limitations, the balloon was in flight for 58% of the total number of days in this period, always during periods of sunny weather that prevail for pollen emission and during low or moderate wind conditions that can favor pollen transport without dispersing it excessively.
2.2. Beenose Instrument and Data Processing
The Beenose instrument is an in situ optical aerosol counter dedicated to pollen detection, based on the LOAC design, which takes measurements at specific scattering angles [22]. The device incorporates a 360° inlet that is insensitive to wind direction, and a fan is utilized to pump ambient air at a rate of approximately 13 L/min, bringing air flow up to an optical chamber. The instrument provides measurements at 10 s intervals; however, in order to retrieve a size distribution (i.e., the number of particles per size class) for large particles, the data must be integrated over longer time periods. The particles traverse the laser beam individually, and the scattered light is collected by photodiodes at four different angles of incidence: 15°, 60°, 125°, and 160°. The intensity of the scattered light detected at the first angle is found to be independent of the refractive index of irregularly shaped particles, such as pollens. This enables the establishment of a direct relationship between particle size and scattered light during laboratory calibration [23]. The data set encompasses particle concentrations across a total of 19 size classes, with a measurement range of 5–90 µm. However, the search for pollen is conducted within a size range that extends above 10 µm.
It is important to note that measurements at the other angles are sensitive to a variety of factors, namely particle shape, porosity, and refractive index. It is also crucial to emphasize that these measurements are highly specific to the detected sample [24]. The identification of various pollen families (see Table 1) is conducted using the empirical speciation method [22], combining measurements from the 60°, 125°, and 160° channels with measurements from the 15° channel. The resulting value, referred to as the “speciation index” and expressed without units, is associated with the particle’s capacity to absorb light and is contingent on its size. The higher the speciation index, the greater the darkness of the particles. For pollens, the speciation index values are approximately 10, decreasing down to 1 for transparent mineral particles and liquid droplets, rising above 20 for carbonaceous particles, and reaching 100 for black carbon particles.

Table 1.
List of pollens used to establish the “pollen speciation zone.”
These values are obtained in the laboratory using samples with well-known compositions. In the case of pollens, pure reference samples were used. The scattering properties of an individual particle may differ from those of another particle of the same type due to its possible orientation and rotation when pumped by the instrument and when crossing the laser beam. It is a prerequisite that a minimum of ten particles of the same type and size are present in order to determine the mean scattering properties of such irregular, compact particles [25]. The “pollen speciation zones” for the 60°, 125°, and 160° channels can then be defined by aggregating all pollen speciation indexes retrieved for each species. These zones differ from those of other conventional ambient air particles in that the speciation zones for mineral particles lie below those for pollen, and the speciation zones for gray and dark (mainly carbonaceous) particles lie above.
Maximum pollen concentrations are typically observed to be above hundreds of particles.m−3 and rarely exceed 1000 particles.m−3 [26]. It has been determined that such concentrations are inadequate to be retrieved instantaneously with the Beenose device during each balloon flight at all altitudes, on account of the ascent and descent speeds. Therefore, a compromise must be found between achieving the best possible vertical resolution and the number of measurements (or time integration) necessary to retrieve size distributions for irregular grains and calculate speciation indexes. Then, five elevation ranges are considered from the ground: 0–30 m, 30–60 m, 60–90 m, 90–120 m, and 120–150 m.
For each elevation range, the data are integrated over a period of 15 min. A specific procedure must be applied to measurements taken at the first altitude range, where the balloon remains between flights, as well as when there are no flights. The number of measurements in this layer per day is greater than in the layers above, which has the potential to introduce bias to the analysis. In order to resolve this issue, it is imperative that solely those measurements that were conducted within the 0–30 m layer and that fall between 30 min prior to and 30 min following the initial and final flights, are given full consideration. Furthermore, measurements obtained on days on which no flights were conducted are to be disregarded. Subsequently, it has been verified that the daily number of measurements within each altitude range is similar and is high enough for statistical studies.
The Beenose measurements are unambiguously indicative of pollen detection when the speciation indexes for three angles and a given size class fall within the pollen zones. However, this assumption may lead to an underestimation of pollen concentrations because measurements with typology curves inside just one or two pollen zones are excluded, even though they may or may not be due to pollen particles. This ambiguous detection could be attributed to statistical fluctuations in speciation index calculations in cases of low concentration values. As illustrated in Figure 2, the pollen speciation zones (green lines denoting the upper and lower borders) for the three scattering angles are delineated, along with the about 20,000 individual speciation index curves calculated for each 15 min-integrated measurement within the 0–30 m altitude range. Clusters of curves have been observed, which are indicative of the presence of particles of different natures. It is noteworthy that all particles in the pollen zones are smaller than 40 µm, which is consistent with pollen size and confirms the robustness of the detection method. In this study, the focus is exclusively on the global pollen speciation zones, as the integration time at varying elevations is deemed inadequate to statistically distinguish the various pollen taxa.
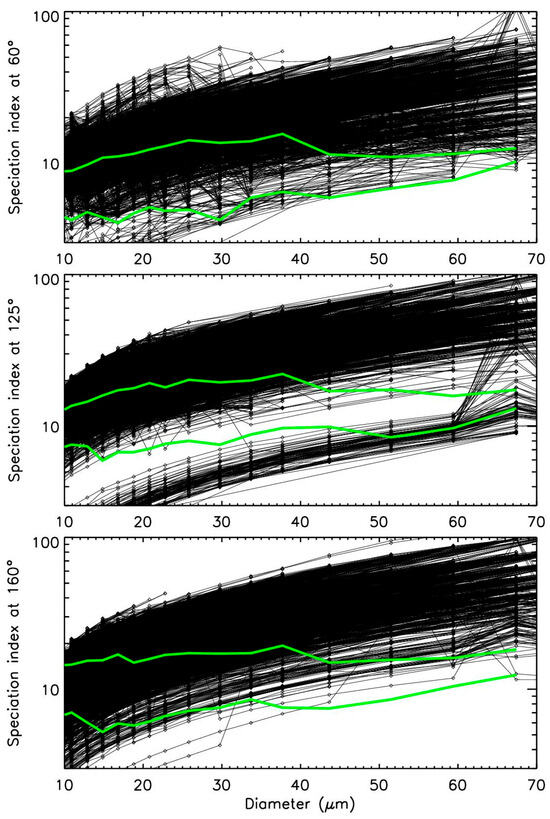
Figure 2.
Speciation zone for pollens (upper and lower borders in green), and about 20,000 individual speciation index curves that can sometimes overlap, for the 0–30 m elevation range.
This procedure allows to distinguish between pollen and non-pollen particles. The time evolution of these two families for 2024 are presented in Figure 3.

Figure 3.
Daily time evolution of pollens and other particles’ concentrations on the days when the touristic balloon is in flight.
3. Results
As illustrated in Figure 4, the average vertical evolution of pollen and other particulate matter concentrations is established across the three distinct periods. Sometimes, short-term strong concentration peaks appear that are far above the mean daily pollen concentration values. Concentrations exceeding 1000 particles/m3 are indicative of local contamination resulting from tourist presence and residual lawn mowing activities in the park. The values above this 1000 particles/m3 threshold are removed regardless of the altitude in order to not bias the daily average calculations.
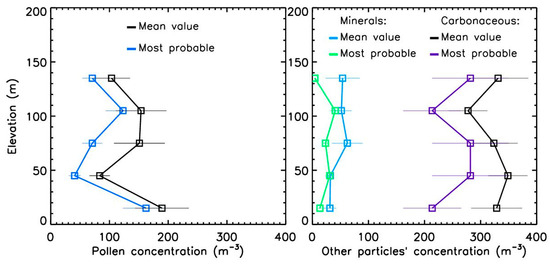
Figure 4.
Vertical evolution of the pollens’ concentrations (left) and the other particles (right) during the period of pollen mainly emitted by the trees (spring). The profiles are retrieved using two different statistical methods (mean and most probable).
During the analysis period, the percentage of pollen particles among total particles greater than 10 µm ranged from 10% in autumn to 30% in spring. Consequently, pollen is not the primary source of the large particles detected in the park, indicating that a criterion based solely on size discrimination is inadequate for the isolation of pollen. It is imperative that a dedicated device is utilized for this purpose, as is the case with the Hirst device [27,28,29], where manual visualization is employed, or the Beensose instruments’ data processing software, which functions automatically.
Two methodologies are employed to ascertain the vertical evolution of concentrations: the mean of all values and the most probable value. The second method involves the identification of the maximum value in the concentration histogram, followed by the application of a Gaussian fit, a process previously employed for particulate matter concentrations using the LOAC instrument (MeteoModem Company, Ury, France) at the “Ballon de Paris” [21]. Figure 4, Figure 5 and Figure 6 present the evolution of pollen concentrations with elevation, as well as those of mineral and carbonaceous particles, for the three periods. The concentration values are plotted at the midpoint of each layer.

Figure 5.
Vertical evolution of the pollens’ concentrations (left) and the other particles (right) during the period of pollen mainly emitted by grass (summer). The profiles are retrieved using two different statistical methods (mean and most probable).

Figure 6.
Vertical evolution of the pollens’ concentrations (left) and the other particles (right) during the end of period of pollen mainly emitted by grass (autumn). The profiles are retrieved using two different statistical methods (mean and most probable).
Total pollen concentrations are elevated in the spring months, decrease during the summer period, and are at their lowest in the autumn. The elevated values observed during the spring period, which correspond to the peak tree pollen season, may be attributable to the substantial presence of arboreal vegetation within the park.
The vertical concentration profiles for pollen demonstrate an initial decrease from ground level to approximately 50 m, a secondary maximum between 50 and 100 m, and a final decrease at higher elevations during the spring and summer periods. For the lower concentrations recorded during the autumnal period, a single decrease in concentration is identified.
The vertical profiles of the other particle types do not exhibit a correlation with the pollen profiles, indicating the potential involvement of remote sources. The concentration of non-pollen particles has been found to remain consistent across the three periods under investigation. Variations between periods are attributed to meteorological conditions, with increased pollution levels being observed during periods of low wind. The vertical profiles of mineral particles have been shown to be indicative of episodes of dust particles being deposited locally, transported from the Sahara; soil particles being lifted from the park; and minerals being transported from nearby sandpits and waste sites. The dark particles, which are composed of a variety of elements, are likely not of park origin. These particles may originate from conventional urban pollution sources, primarily traffic and industrial activities, and may exhibit vertical transport and mixture during daytime hours [30,31].
4. Discussion
The pollen vertical profile displays a marked secondary peak at elevations between 75 and 100 m. Several potential explanations can be proposed. Firstly, it is conceivable that the pollen may have a source external to the park, with the possibility of unrestricted transportation above buildings with an altitude of less than 50 m in Paris (most of the buildings in Paris). Secondly, and a more probable explanation, is the presence of a large forest called “Forêt domaniale de Meudon,” located about 5 km southwest of the park. This forest is situated at an altitude between 100 and 200 m, whereas the park is located at an altitude of 30 m. Consequently, the pollen detected in the secondary peak could originate from this forest and could have been transported to the park by southwest winds. Indeed, such winds are prominent in Paris, as shown by weather analysis (for example in [32]). This finding provides a potential explanation for the observation that the secondary peak is more pronounced during the period of tree pollen than during the period of grass pollen. A further explanation for this less pronounced secondary peak during the grass pollen season may be attributed to the size of the pollen. The diameter of grass pollen typically ranges from 25 to 100 µm, whereas tree pollen generally varies from 15 to 40 µm. It may be hypothesized that the size of the pollen grain directly correlates with its ability to be transported by wind. It can be posited that pollen of greater dimensions will have a diminished capacity to be carried by wind.
In order to tentatively evaluate the mean value of decreasing pollen concentrations within the 0–150 m altitude range above ground level, the percentage decrease per 10 m range should be calculated. Two configurations are considered: a decrease after each layer of maximum concentration or a decrease for the whole profile if no secondary layer is present. The percentages are derived from the following formula:
P (%) = 100 × (Cmax − Cmin)/Cmax)/(d/10)
C(max) denotes the highest concentration value, C(min) is the lowest concentration value, and d is the elevation difference (in m). The results for the three periods are presented in Table 2. When two layers are present, only the decrease from the ground up to the beginning of the second layer is considered. It has emerged that the decline in concentration appears to be more pronounced during the period of tree pollen than during the period of grass pollen. When all these values are considered collectively, an average value of 11 ± 8% is obtained.
Table 2.
Percentage of decreasing concentration with 10 m altitude.
The findings, particularly the highest values, demonstrate a good agreement with the estimated value of 25% per 10 m ascertained in Thessaloniki, Greece, through the utilization of Hirst devices [18]. In contrast, a German study encompassing 25 cities and employing Hirst instruments determined a mean value of 6% per 10 m, which aligns more closely with the lower values observed in the present study. Despite the utilization of disparate methodologies and measurement conditions, the similarity of these values is encouraging.
However, it is imperative to exercise caution when utilizing these values, as their accuracy is subject to the influence of numerous parameters. Firstly, it is important to note that meteorological conditions, including sunshine, temperature, precipitation, and wind speed, have a significant impact on the intensity of pollen sources, as well as the concentrations and the efficiency of both horizontal and vertical transport [33]. Secondly, the dimensions of pollen particles are subject to variation according to the taxonomic classification of the pollen source. Pollens from trees are generally smaller in size than pollen from grasses, and this can have a consequential effect on the manner of its transportation. The analysis of data obtained during different periods of the year and from different pollen families can introduce a degree of uncertainty. Finally, climate change may have an effect on the reproductive function of plants [34], the duration of pollen emission [35], and mean weather conditions. This has the potential to introduce bias when comparing measurements obtained at periods that are too far apart. The necessity of establishing the dependence on these parameters is acknowledged. Consequently, the present study constitutes a preliminary investigation into the potential for obtaining an average value for the vertical transport of pollen using a Beenose instrument installed on a permanent tourist balloon. The results of this study demonstrate a high degree of agreement with those of previous studies, thus providing a valuable foundation for further research in this area. The motivation for such measurements is rooted in the vertical resolution of 30 m, which surpasses that of previous studies, and the capacity to conduct measurements at elevated altitudes (150 m). It is evident that further work is required over a more extended period in order to differentiate more distinctly between the various parameters that drive vertical transport.
5. Conclusions
Beenose measurements taken over several months in 2024 have shown that pollen can be transported vertically up to an altitude of 150 m with a vertical resolution of 30 m. The decline in concentration, which is approximately 10% per 10 m of elevation, is consistent with prior estimations obtained with lower vertical resolution. Such values must be considered in modeling works on pollen transport and dissemination. In order to produce accurate pollen concentration maps and alerts for allergic citizens, it will be necessary to combine local measurements and the improved models.
The tourist balloon activity at the André Citroën Park in Paris is set to continue until at least 2030, and the Beenose instrument is scheduled to remain operational throughout the entire period. This will facilitate the study of diverse pollination scenarios under varying meteorological conditions. It is to be noted that a number of flights of a scientific nature will be conducted up to an elevation of 300 m during periods of low wind. This will enable the vertical evaluation of pollen concentration at higher elevations to be detected. Ultimately, the augmentation of the quantity of measurements over an extended timeframe will enhance the retrieval of the speciation index, thereby facilitating the identification of the various pollen families. This will allow us to ascertain whether the observed variation in vertical pollen concentrations is attributable to different sources.
Author Contributions
Conceptualization, J.-B.R.; methodology, J.-B.R.; validation, J.-B.R.; formal analysis, J.-B.R.; investigation, J.-B.R.; resources: J.G. and J.L., writing—original draft preparation, J.-B.R.; writing—review and editing, J.L. and J.G.; visualization, J.-B.R. All authors have read and agreed to the published version of the manuscript.
Funding
This work was conducted with no specific funding.
Informed Consent Statement
Not applicable.
Data Availability Statement
The Beenose data are available on request to the Lify-Air Company.
Acknowledgments
The authors thank François-Xavier Onfray (Aerophile) for the balloon operations, Jérôme Richard and Matthieu Jeannot (Lify Air Company) for the Beenose instrument developments, and Eric Poincelet for proofreading.
Conflicts of Interest
Author Johann Lauthier was employed by the company Lify-Air. Author Jérôme Giacomoni was employed by the company Aerophile SAS. The remaining authors declare that the research was conducted in the absence of any commercial or financial relationships that could be construed as a potential conflict of interest.
References
- ANSES. Etat des Connaissances sur L’impact Sanitaire Lié à L’exposition de la Population Générale aux Pollen Présents Dans L’air Ambiant. Anses. Saisine n2011-SA-0151. 2014. Available online: https://www.anses.fr/fr/system/files/AIR2011sa0151Ra.pdf (accessed on 18 June 2025). (In French)
- Savouré, M.; Bousquet, J.; Jaakkola, J.J.K.; Jaakkola, M.S.; Jacquemin, B.; Nadif, R. Worldwide Prevalence of Rhinitis in Adults: A Review of Definitions and Temporal Evolution. Clinic. Translat. Allergy 2022, 12, e12130. [Google Scholar]
- Renard, J.-B.; Lefèvre, S.; Glévarec, G. Low-Cost Pollen and allergy symptoms monitoring with Beenose sampler and Livepollen App: The case study of the Metz city, France, during spring 2023. Atmosphere 2025, 16, 271. [Google Scholar] [CrossRef]
- Renard, J.-B.; El Azari, H.; Lauthier, J.; Surcin, J. Spatial Variation of Airborne Pollen Concentrations Locally around Brussels City, Belgium, during a Field Campaign in 2022–2023, Using the Automatic Sensor Beenose. Sensors 2024, 24, 3731. [Google Scholar] [CrossRef] [PubMed]
- Oteros, J.; García-Mozo, H.; Alcázar, P.; Belmonte, J.; Bermejo, D.; Boi, M.; Cariñanos, P.; de la Guardia, C.D.; Fernández-González, D.; González-Minero, F.; et al. A new method for determining the sources of airborne particles. J. Environ. Manag. 2015, 155, 212–218. [Google Scholar] [CrossRef]
- Arritt, R.W.; Clark, C.A.; Goggi, A.S.; Sanchez, H.L.; Westgate, M.E.; Riese, J.M. Lagrangian numerical simulations of canopy air flow effects on maize pollen dispersal. Field. Crops. Res. 2007, 102, 151–162. [Google Scholar] [CrossRef]
- Efstathiou, C.; Isukapalli, S.; Georgopoulos, P. A mechanistic modeling system for estimating large scale emissions and transport of pollen and co-allergens. Atmos Environ. 2011, 45, 2260–2276. [Google Scholar] [CrossRef]
- Zhang, R.; Duhl, T.; Salam, M.T.; House4, J.M.; Flagan, R.C.; Avol, E.L.; Gilliland, F.D.; Guenther, A.; Chung, S.H.; Lamb, B.K.; et al. Development of a regional-scale pollen emission and transport modeling framework for investigating the impact of climate change on allergic airway disease. Biogeosciences 2014, 11, 1461–1478. [Google Scholar] [CrossRef]
- Skjøth, C.A.; Kurganskiy, A.; Grundström, M.; Werner, M.; Adams-Groom, B. Air Pollution Affecting Pollen Concentrations through Radiative Feedback in the Atmosphere. Atmosphere 2021, 12, 1376. [Google Scholar] [CrossRef]
- Kartz, D.S.W.; Batterman, S.A. Urban-scale variation in pollen concentrations: A single station is insufficient to characterize daily exposure. Aerobiologia 2020, 36, 417–431. [Google Scholar] [CrossRef]
- Sofiev, M.; Siljamo, P.; Ranta, H.; Rantio-Lehtimaki, A. Towards numerical forecasting of long-range air transport of birch pollen: Theoretical considerations and a feasibility study. Int. J. Biometeorol. 2006, 50, 392–402. [Google Scholar] [CrossRef]
- Sofiev, M.; Siljamo, P.; Valkama, I.; Ilvonen, M.; Kukkonen, J. A dispersion modelling system SILAM and its evaluation against ETEX data. Atmos. Environ. 2006, 40, 674–685. [Google Scholar] [CrossRef]
- Seinfeld, J.H.; Pandis, S.N. Atmospheric Chemistry and Physics: From Air Pollution to Climate Change, 2nd ed.; Wiley Interscience: New York, NY, USA, 2006. [Google Scholar]
- Sofiev, M.; Belmonte, J.; Gehrig, R.; Izquierdo, R.; Smith, M.; Dahl, Å.; Siljamo, P. Airborne Pollen Transport. Allergenic Pollen. A Review of the Production, Release, Distribution and Health Impacts; Sofiev, M., Bergman, K.C., Eds.; Springer: Berlin/Heidelberg, Germany, 2013; pp. 127–159. [Google Scholar]
- Cariñanos, P.; Ruiz-Peñuela, S.; Casans, A.; Cazorla, A.; Rejano, F.; Ontiveros, A.; Ortiz-Amezcua, P.; Guerrero-Rascado, J.L.; Olmo, F.J.; Alados-Arboledas, L.; et al. Assessment of potential sources of airborne pollen in a high-mountain mediterranean natural environment. Atmos. Environ. 2025, 340, 120917. [Google Scholar] [CrossRef]
- Zhou, J.; Liu, J.; Xiang, S.; Zhang, Y.; Wang, Y.; Ge, W.; Hu, J.; Wan, Y.; Wang, X.; Liu, Y.; et al. Evaluation of the Street Canyon Level Air Pollution Distribution Pattern in a Typical City Block in Baoding, China. Int. J. Environ. Res. Public Health 2022, 19, 10432. [Google Scholar] [CrossRef] [PubMed]
- Rojo, J.; Oteros, J.; Pérez-Badia, R.; Cervigón, P.; Ferencova, Z.; Gutiérrez-Bustillo, A.M.; Bergmann, K.-C.; Oliver, G.; Thibaudon, M.; Albertini, R.; et al. Near-ground effect of height on pollen exposure. Environ. Res. 2019, 174, 160–169. [Google Scholar] [CrossRef]
- Charalampopoulos, A.; Damialis, A.; Lazarina, M.; Halley, J.M.; Vokou, D. Spatiotemporal assessment of airborne pollen in the urban environment: The pollenscape of Thessaloniki as a case study. Atmos. Environ. 2021, 247, 118185. [Google Scholar] [CrossRef]
- de Weger, L.A.; Molster, F.; de Raat, K.; den Haan, J.; Romein, J.; van Leeuwen, W.; de Groot, H.; Mostert, M.; Hiemstra, P.S. A new portable sampler to monitor pollen at street level in the environment of patients. Sci. Total Environ. 2020, 741, 40404. [Google Scholar] [CrossRef] [PubMed]
- Available online: https://paris1900.lartnouveau.com/paris15/le_parc_andre_citroen.htm (accessed on 18 June 2025).
- Renard, J.-B.; Michoud, V.; Giacomoni, J. Vertical Profiles of Pollution Particle Concentrations in the Boundary Layer above Paris (France) from the Optical Aerosol Counter LOAC Onboard a Touristic Balloon. Sensors 2020, 20, 1111. [Google Scholar] [CrossRef]
- Renard, J.B.; Dulac, F.; Berthet, G.; Lurton, T.; Vignelles, D.; Jégou, F.; Tonnelier, T.; Jeannot, M.; Couté, B.; Akiki, R. LOAC: A light aerosols counter for ground-based and balloon measurements of the size distribution and of the main nature of atmospheric particles, 1. Principle of measurements and instrument evaluation. Atmos. Meas. Tech. 2016, 9, 1721–1742. [Google Scholar] [CrossRef]
- Lurton, T.; Renard, J.-B.; Vignelles, D.; Jeannot, M.; Akiki, R.; Mineau, J.-L.; Tonnelier, T. Light scattering at small angles by atmospheric irregular particles; modelling and laboratory measurements. Atmos. Meas. Tech. 2014, 7, 931–939. [Google Scholar] [CrossRef]
- Renard, J.-B.; El Azari, H.; Richard, J.; Lauthier, J.; Surcin, J. Towards an Automatic Pollen Detection System in Ambient Air Using Scattering Functions in the Visible Domain. Sensors 2022, 22, 4984. [Google Scholar] [CrossRef]
- Renard, J.-B.; Geffrin, J.-M.; Tobon Valencia, V.; Tortel, H.; Ménard, F.; Rannou, P.; Milli, J.; Berthet, G. Number of independent measurements required to obtain reliable mean scattering properties of irregular particles having a small size parameter, using microwave analogy measurements. J. Quant. Spect. Rad. Trans. 2021, 272, 107718. [Google Scholar] [CrossRef]
- Valipour Shokouhi, B.; de Hoogh, K.; Gehrig, R.; Eeftens, M. Estimation of historical daily airborne pollen concentrations across Switzerland using a spatio temporal random forest model. Sci. Tot. Environ. 2024, 906, 167286. [Google Scholar] [CrossRef]
- Hirst, J.M. An automatic volumetric spore trap. Ann. Appl. Biol. 1952, 39, 257–265. [Google Scholar] [CrossRef]
- Oteros, J.; Buters, J.; Laven, G.; Röseler, S.; Wachter, R.; Schmidt-Weber, C.; Hofmann, F. Errors in determining the flow rate of Hirst-type pollen traps. Aerobiologia 2017, 33, 201–210. [Google Scholar] [CrossRef]
- Adamov, S.; Lemonis, N.; Clot, B.; Crouzy, B.; Gehrig, R.; Graber, M.J.; Sallin, C.; Tummon, F. On the measurement uncertainty of Hirst-type volumetric pollen and spore samplers. Aerobiologia 2021, 40, 77–91. [Google Scholar] [CrossRef]
- Samad, A.; Vogt, U.; Panta, A.; Uprety, D. Vertical distribution of particulate matter, black carbon and ultra-fine particles in Stuttgart, Germany. Atmos. Pollut. Res. 2020, 11, 1441–1450. [Google Scholar] [CrossRef]
- Liu, H.; Pan, X.; Lei, S.; Zhang, Y.; Du, A.; Yao, W.; Tang, G.; Wang, T.; Xin, J.; Li, J.; et al. Vertical distribution of black carbon and its mixing state in the urban boundary layer in summer. Atmos. Chem. Phys. 2023, 23, 7225–7239. [Google Scholar] [CrossRef]
- Schramm, P.J.; Brown, C.L.; Saha, S.; Conlon, K.C.; Manangan, A.P.; Bell, J.E.; Hess, J.J. A systematic review of the effects of temperature and precipitation on pollen concentrations and season timing, and implications for human health. Int. J. Biometeorol. 2021, 65, 1615–1628. [Google Scholar] [CrossRef]
- Santiago, J.P.; Sharkey, T.D. Pollen development at high temperature and role of carbon and nitrogen metabolites. Plant Cell Environ. 2019, 42, 2759–2775. [Google Scholar] [CrossRef]
- Zhang, Y.; Steiner, A.L. Projected climate-driven changes in pollen emission season length and magnitude over the continental United States. Nat. Commun. 2022, 13, 1234. [Google Scholar] [CrossRef]
- Available online: https://globalwindatlas.info/en/area/France/Ile-de-France (accessed on 18 June 2025).
Disclaimer/Publisher’s Note: The statements, opinions and data contained in all publications are solely those of the individual author(s) and contributor(s) and not of MDPI and/or the editor(s). MDPI and/or the editor(s) disclaim responsibility for any injury to people or property resulting from any ideas, methods, instructions or products referred to in the content. |
© 2025 by the authors. Licensee MDPI, Basel, Switzerland. This article is an open access article distributed under the terms and conditions of the Creative Commons Attribution (CC BY) license (https://creativecommons.org/licenses/by/4.0/).