

Urban Heat Island Effect: Remote Sensing Monitoring and Assessment—Methods, Applications, and Future Directions


Abstract
1. Introduction
1.1. Urban Heat Island Concept, Formation Mechanisms, and Impacts
1.2. Role and Advantages of Remote Sensing Technology in Heat Island Monitoring
1.2.1. Spatial Coverage Advantages and Observation Density
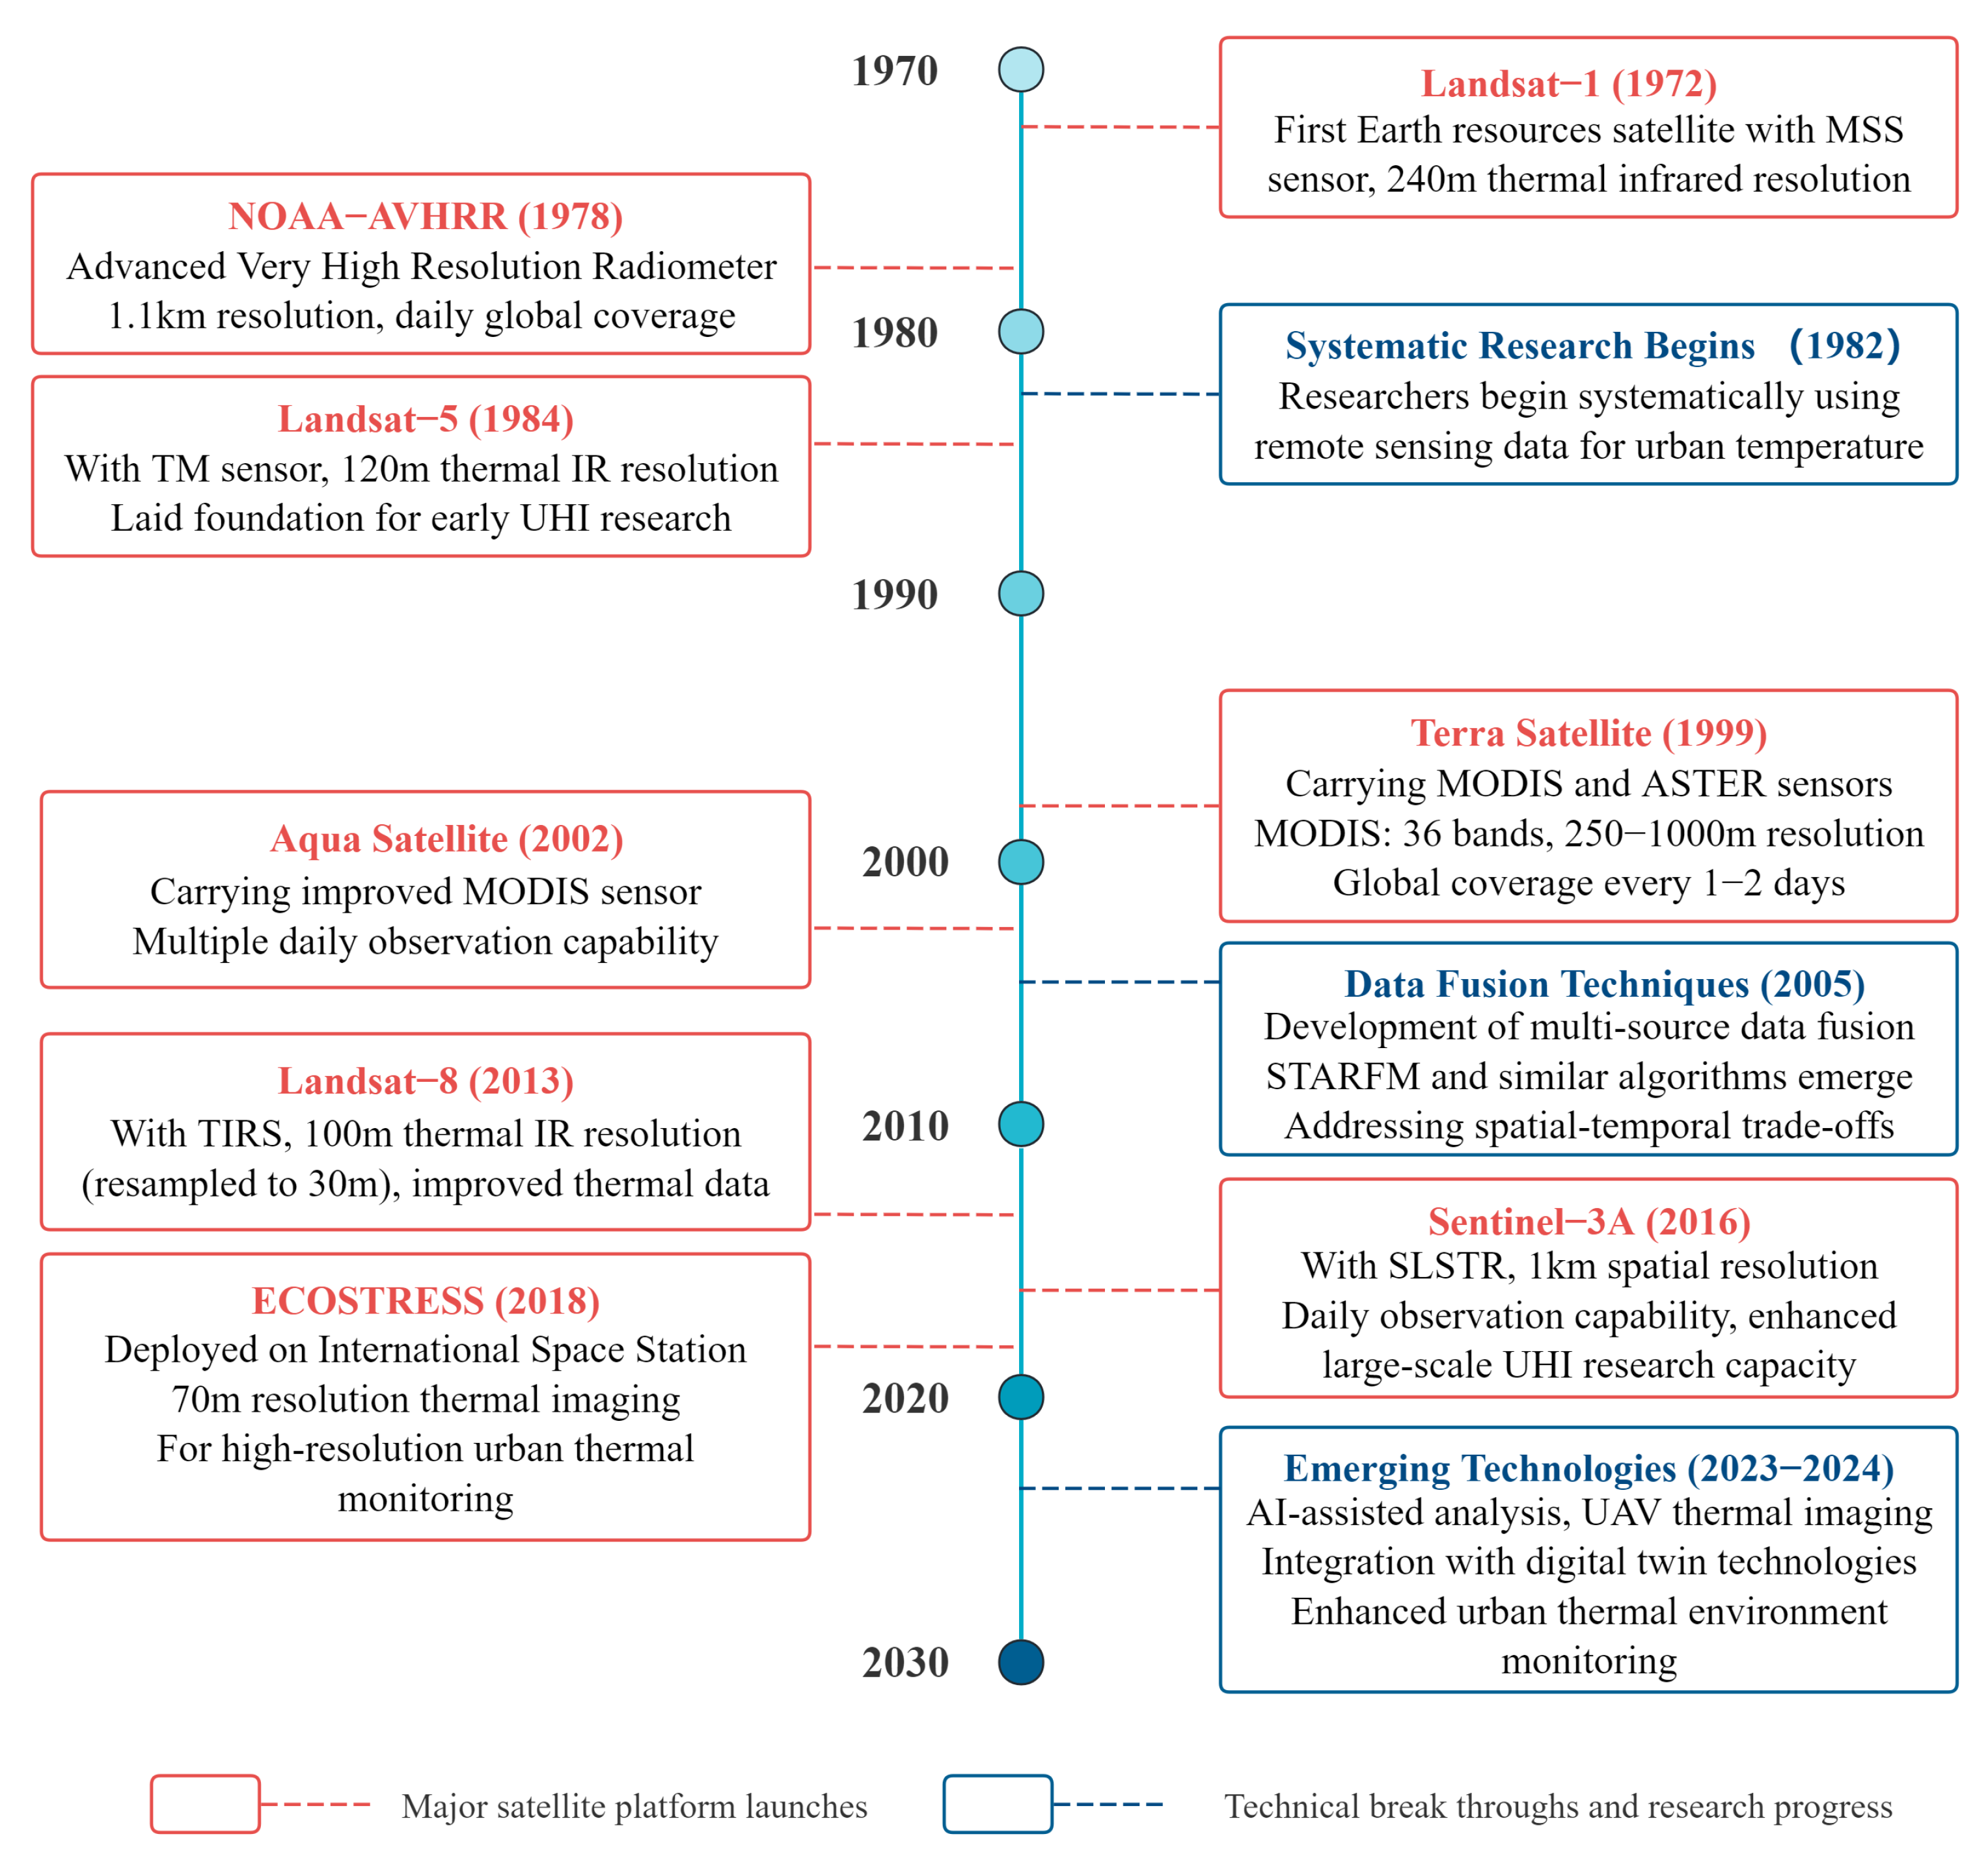
1.2.2. Technological Development History and Accuracy Improvement
1.2.3. Core Application Values of Remote Sensing Technology
1.2.4. Inherent Limitations and Technical Challenges
1.3. Research Questions and Review Objectives
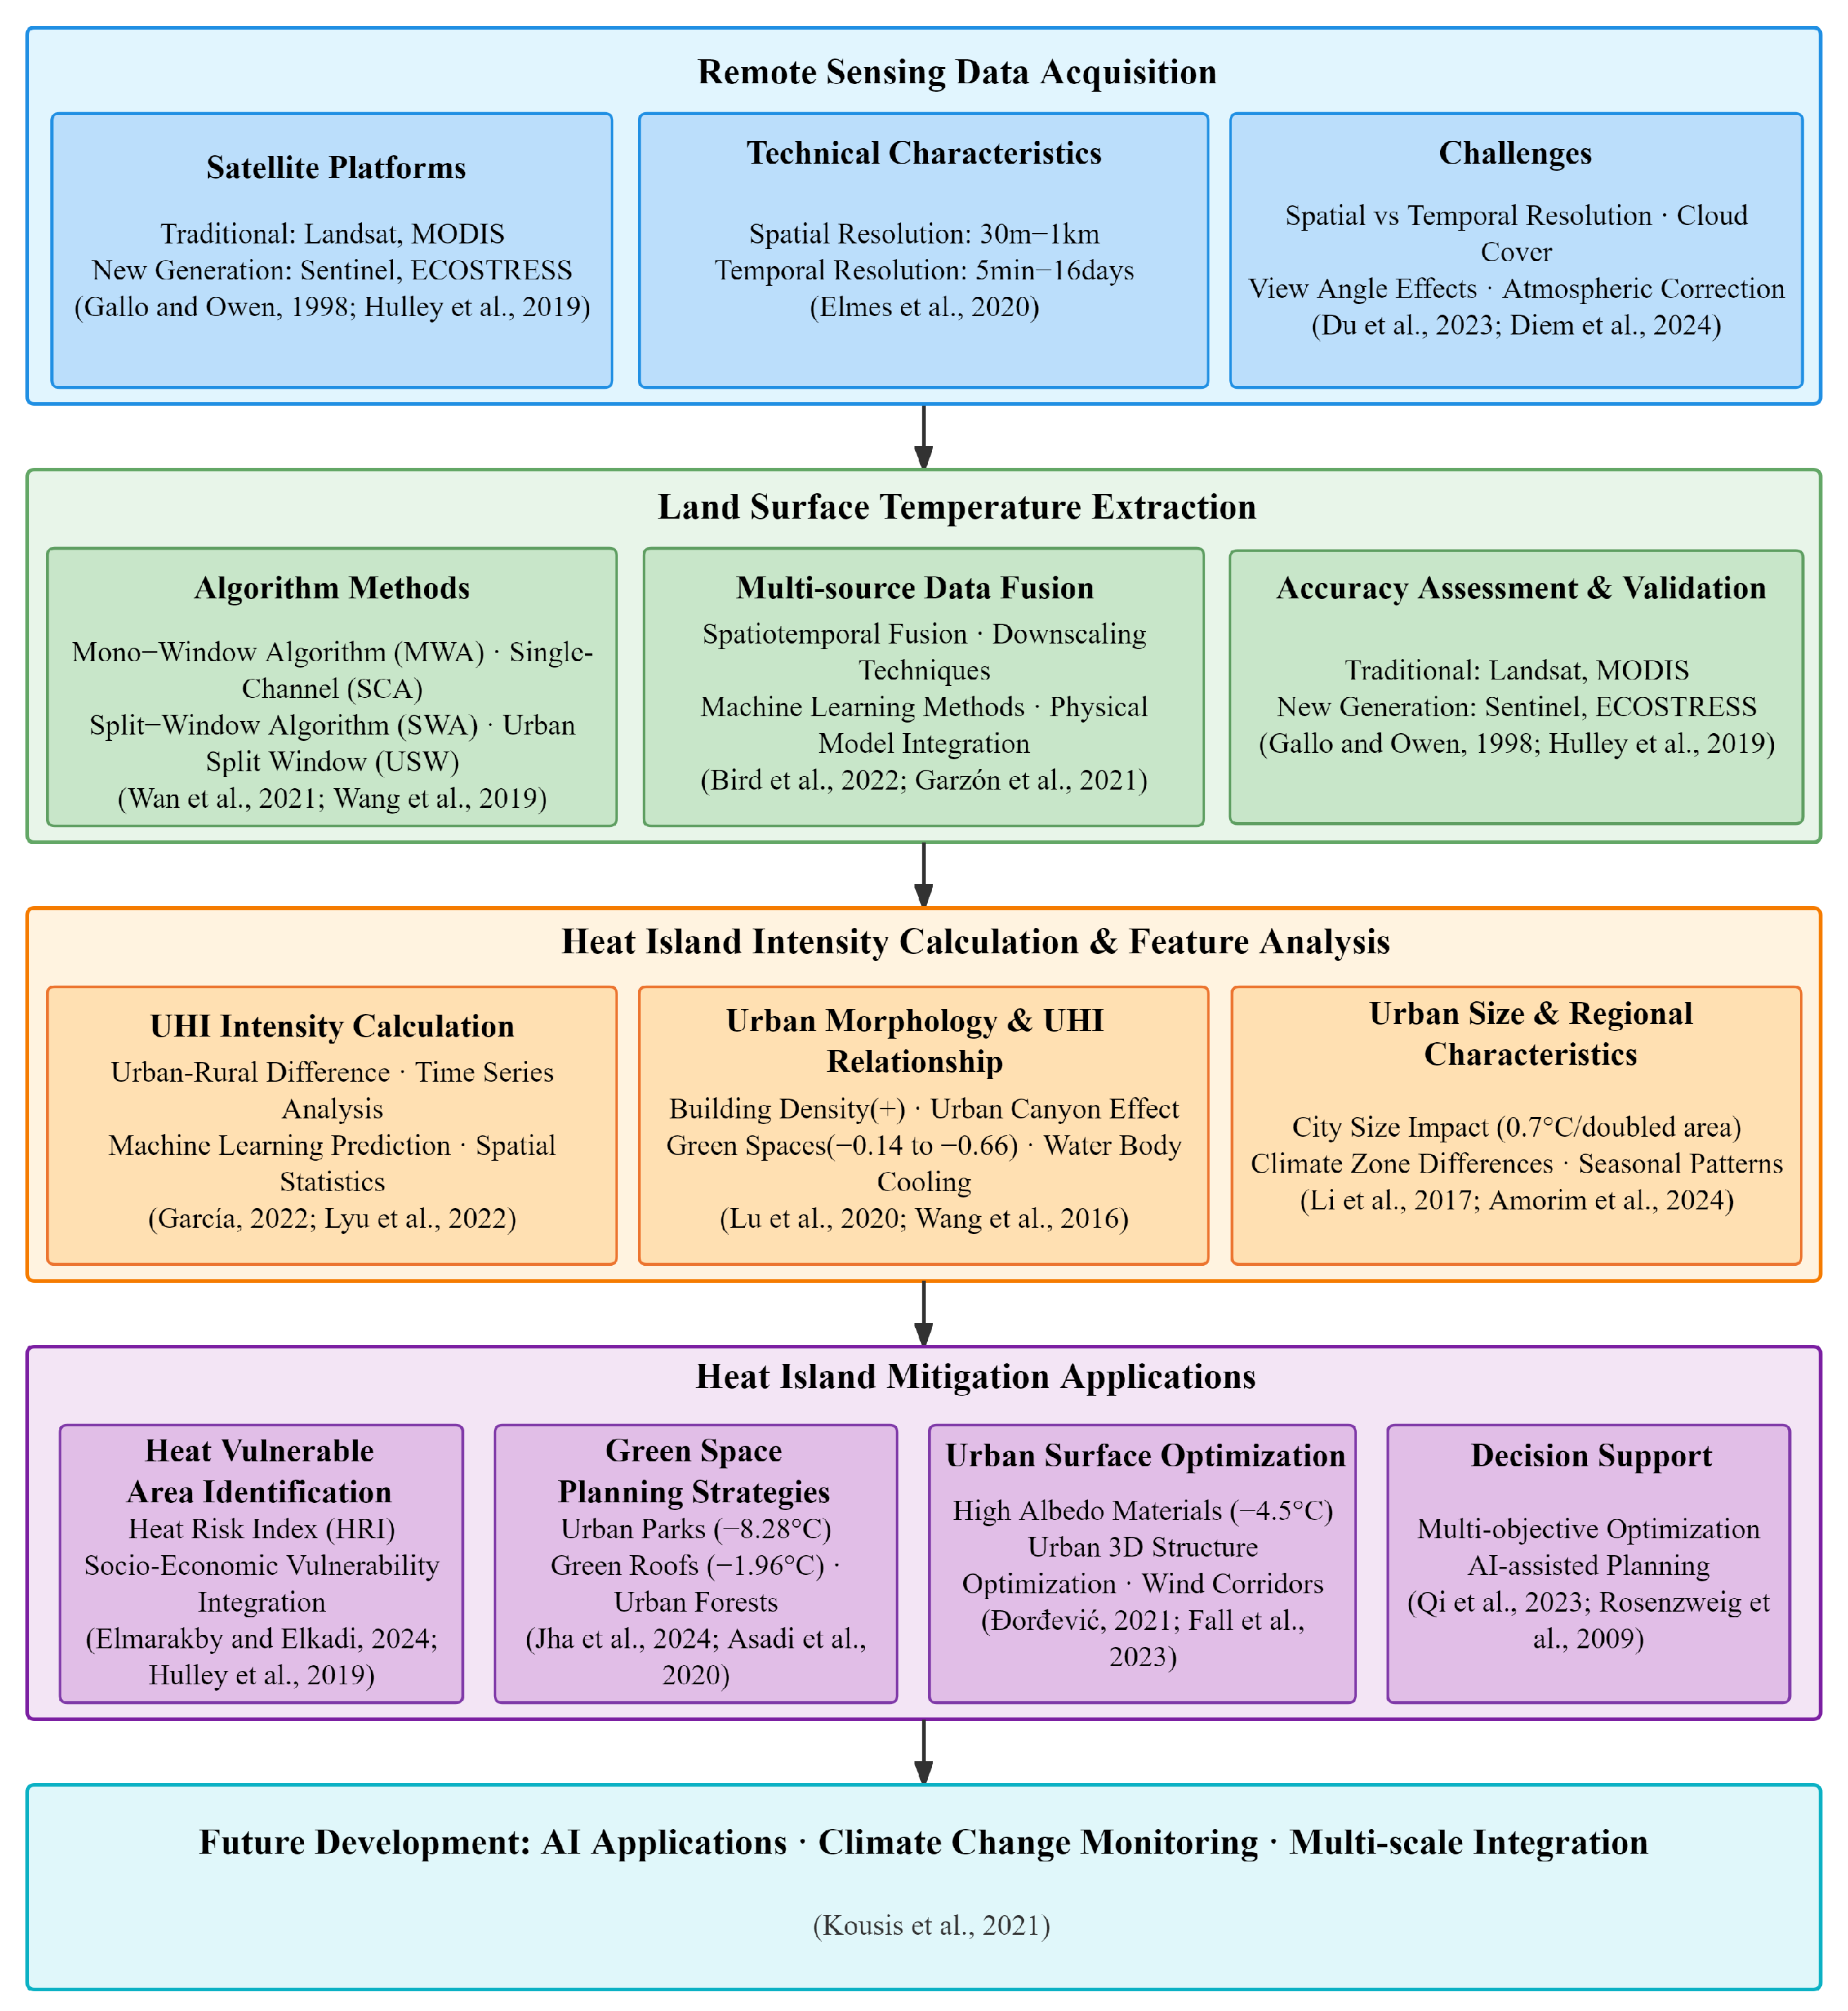
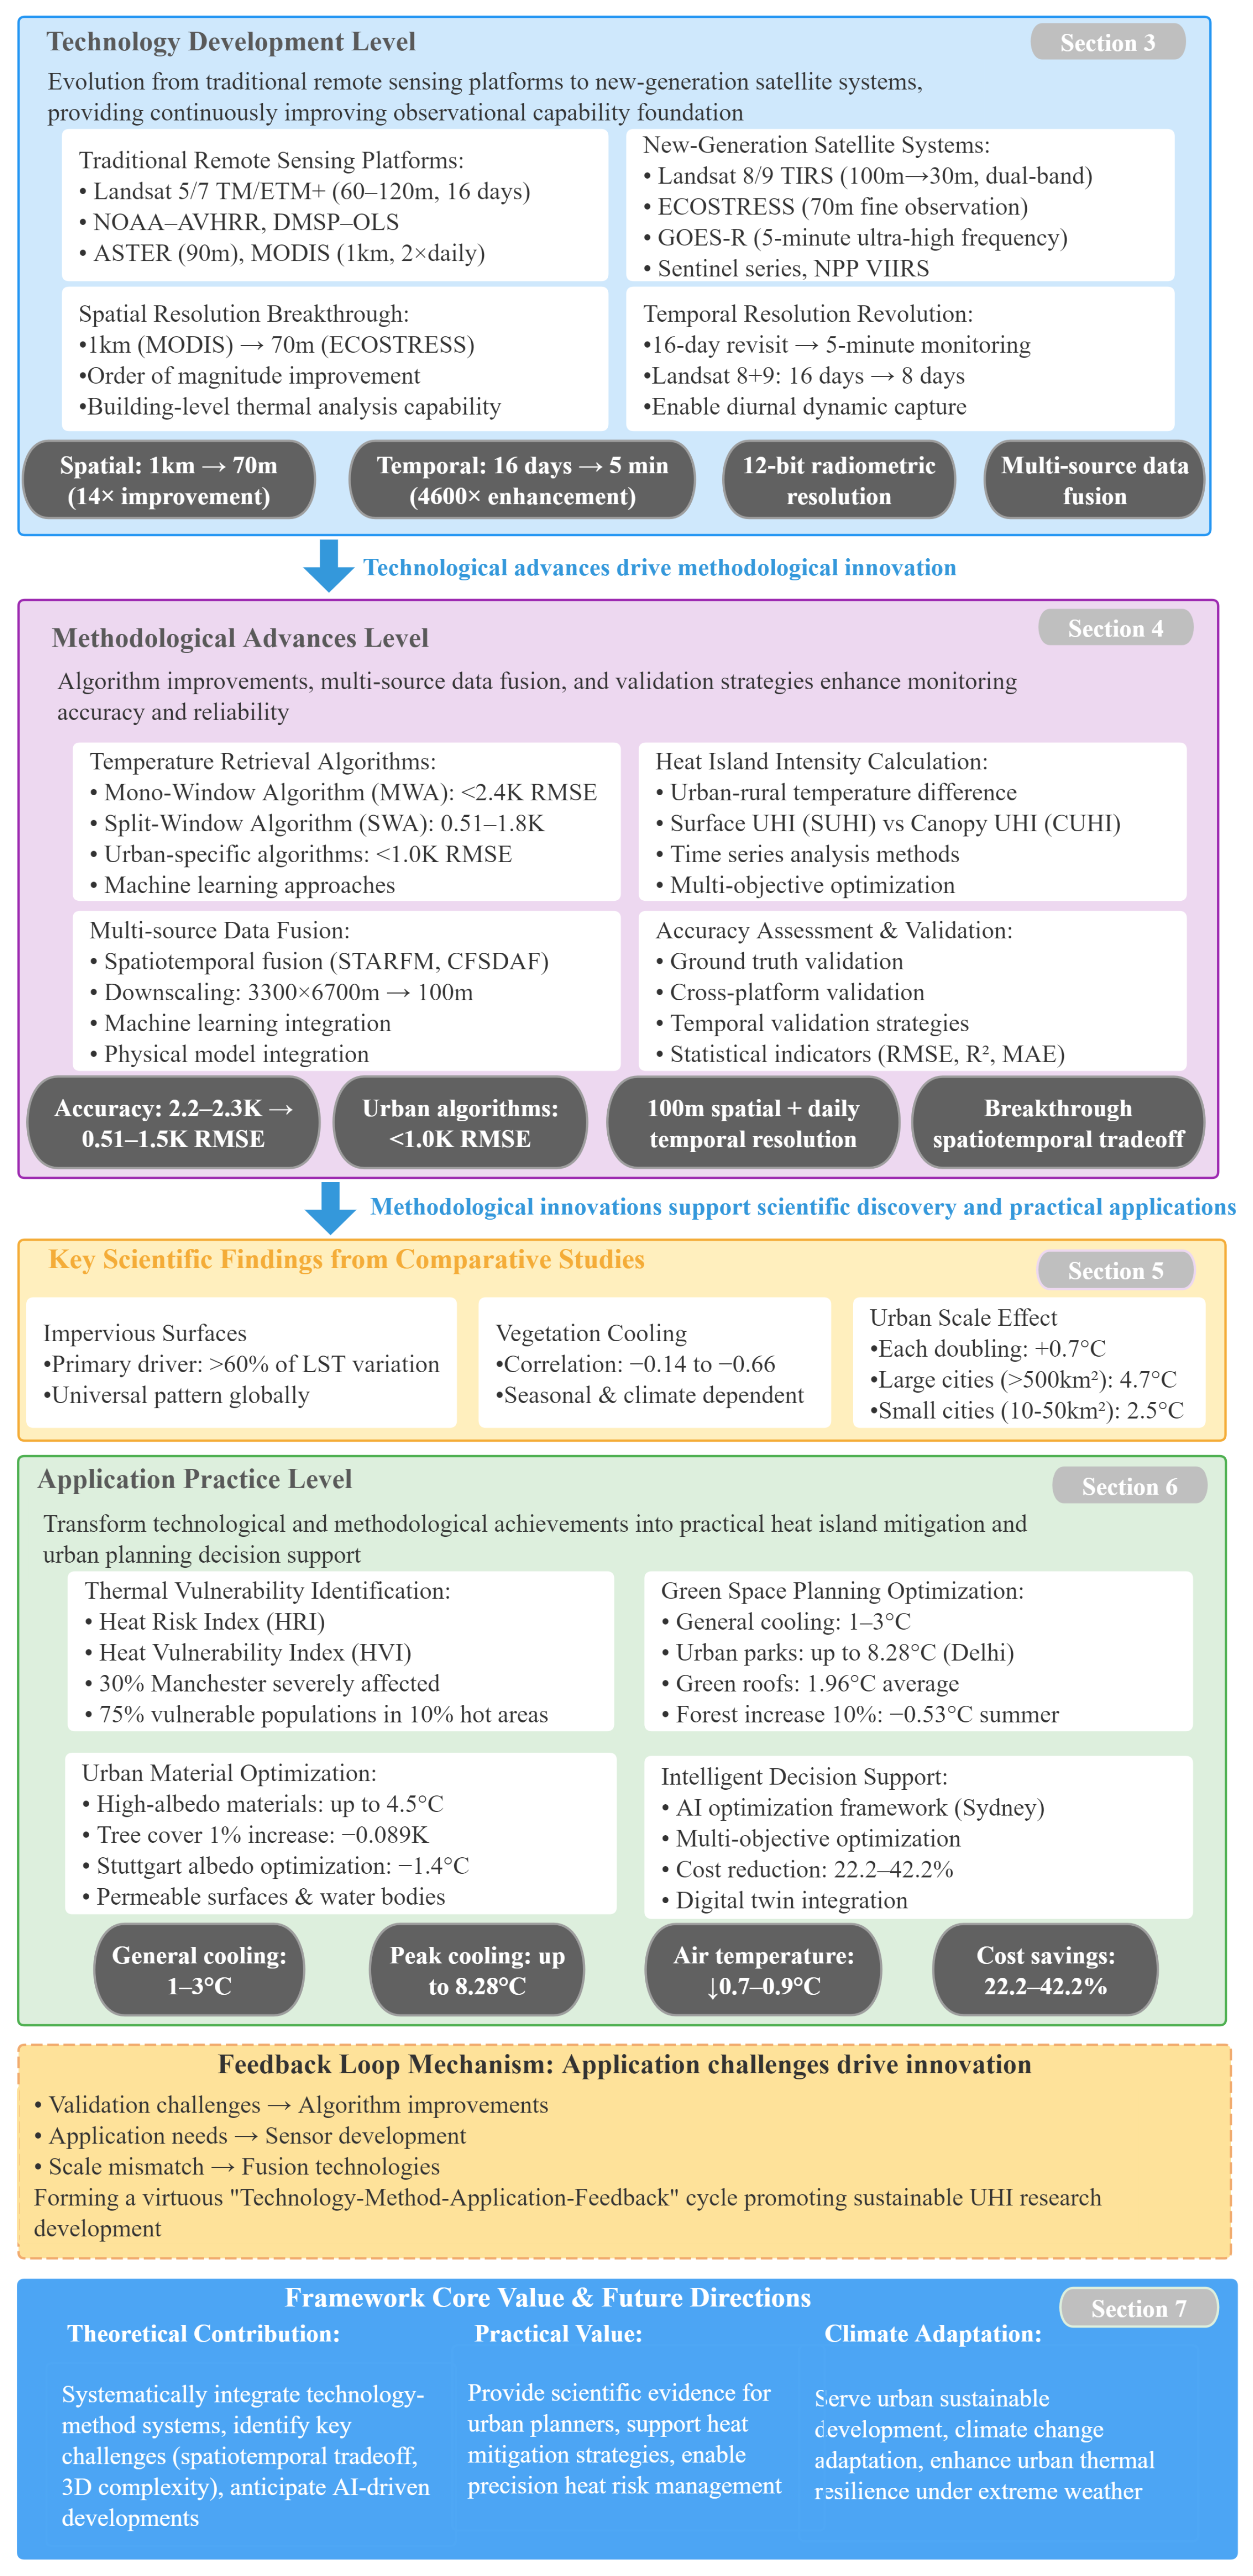
1.4. Review Conceptual Framework
2. Materials and Methods
2.1. Literature Search Strategy
2.2. Literature Screening Criteria and Process
2.3. Data Extraction and Analysis Framework
3. Evolution of Remote Sensing Technology
3.1. Traditional Remote Sensing Platforms and Technical Characteristics
3.2. New Generation Satellite Systems and Their Advantages
3.3. Improvements in Spatial and Temporal Resolution and Their Application Value
3.4. Spatial Resolution Adaptation for Multi-Scale Heat Island Monitoring
4. Methodological Advances
4.1. Land Surface Temperature Extraction and Heat Island Intensity Calculation Methods
4.2. Integration and Fusion Technologies for Multi-Source Remote Sensing Data
4.2.1. Main Types of Fusion Technologies
4.2.2. Data Fusion Quality Assessment and Uncertainty Analysis
4.2.3. Method Selection Principles and Development Trends
4.3. Accuracy Assessment and Validation Strategies
5. Comparative Study of Heat Island Characteristics
5.1. Comparison of Heat Islands Between Metropolises and Small-to-Medium City Sections
5.2. Key Findings on the Relationship Between Urban Form and Heat Islands
5.3. Regional Differences and Universal Patterns
6. Heat Island Mitigation Applications
6.1. Thermal Vulnerability Zone Identification and Green Space Planning
6.2. Urban Materials and Surface Property Optimization
6.3. Remote Sensing-Based Heat Island Mitigation Decision Support
7. Challenges and Future Directions
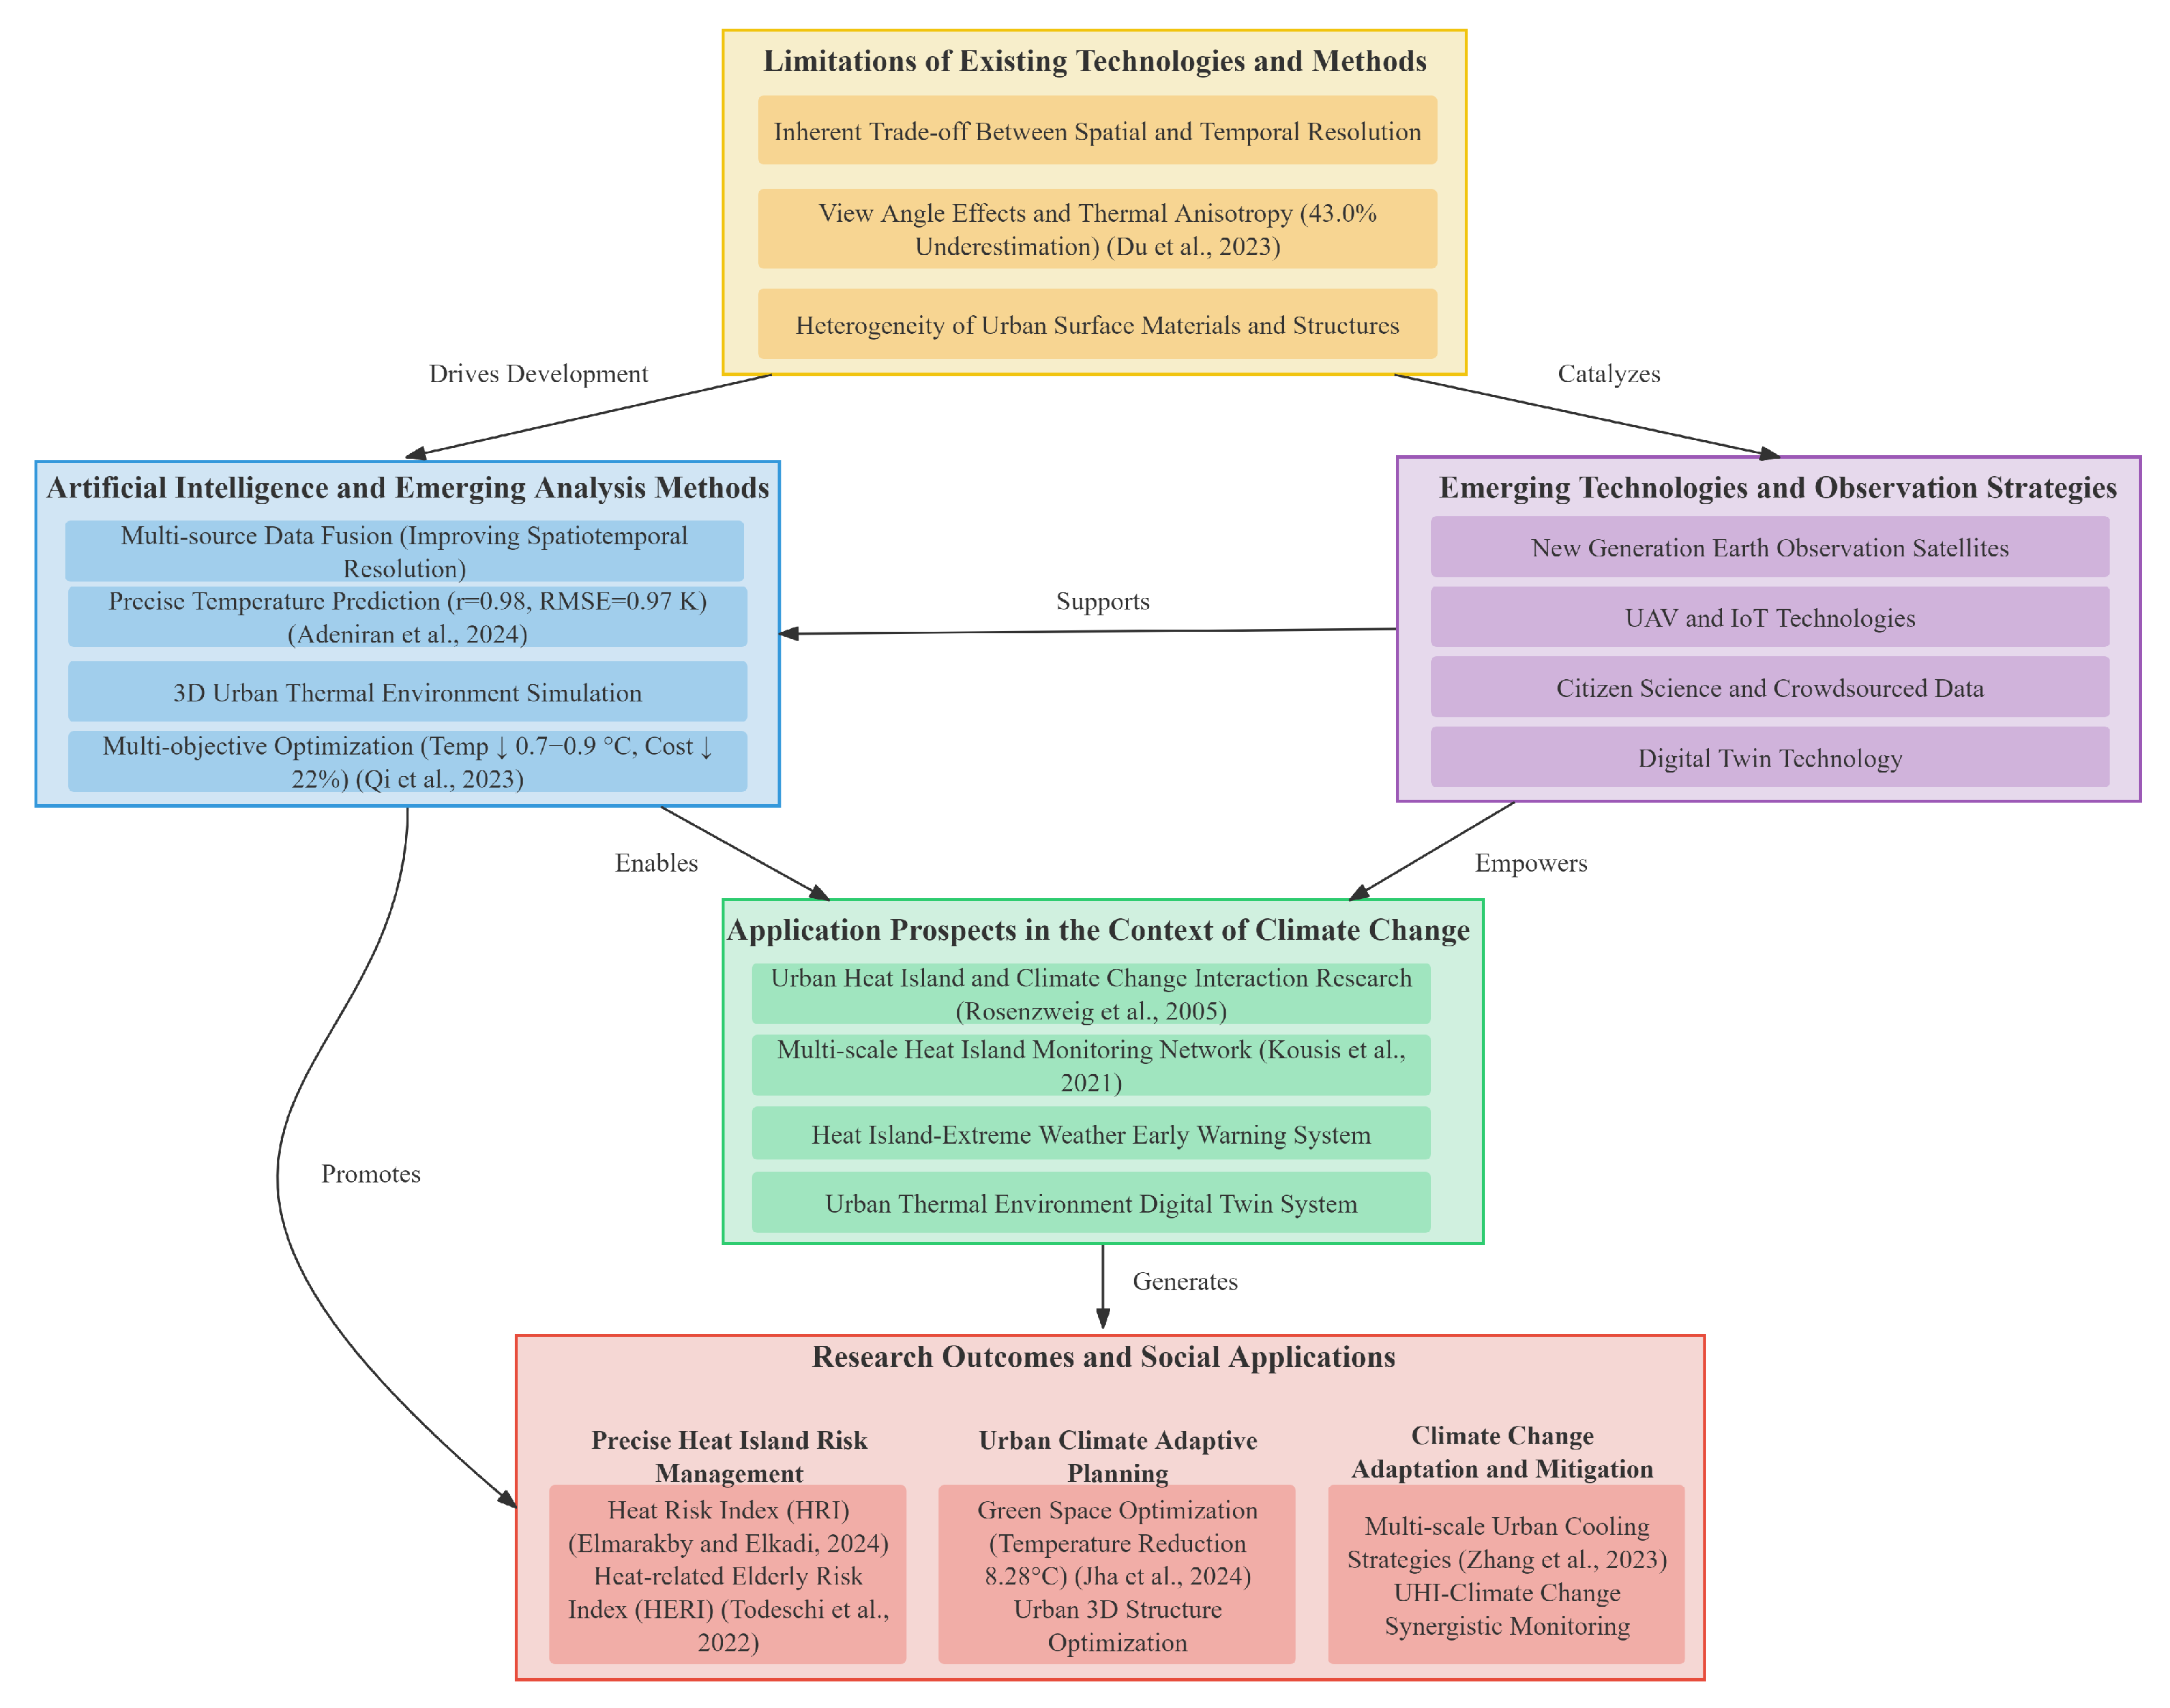
7.1. Limitations of Existing Technologies and Methods
7.2. Application Prospects of Artificial Intelligence and Emerging Analytical Methods
7.3. Prospects for Urban Heat Island Monitoring in the Context of Climate Change
8. Conclusions
8.1. Critical Knowledge Gaps and Research Challenges
8.1.1. Most Urgent Research Challenges
8.1.2. Unresolved Technical Limitations
8.2. Promising Directions for Future Investigation and Policy Development
8.2.1. Key Directions for Technical Development
8.2.2. Key Directions for Future Research and Policy Development
8.3. Review Value and Prospects
Author Contributions
Funding
Institutional Review Board Statement
Informed Consent Statement
Data Availability Statement
Conflicts of Interest
References
- Wang, W.; Yao, X.; Shu, J. Air advection induced differences between canopy and surface heat islands. Sci. Total Environ. 2020, 725, 138120. [Google Scholar] [CrossRef] [PubMed]
- Wang, C.; Myint, S.W.; Wang, Z.; Song, J. Spatio-Temporal Modeling of the Urban Heat Island in the Phoenix Metropolitan Area: Land Use Change Implications. Remote Sens. 2016, 8, 185. [Google Scholar] [CrossRef]
- de Costa Trindade Amorim, M.C.; Dubreuil, V.; Teixeira, D.C.F.; Amorim, A.T.; Brabant, C. Exceptional heat island intensities also occur in medium-sized cities. Urban Clim. 2024, 53, 101821. [Google Scholar] [CrossRef]
- Li, L.; Zhan, W.; Hu, L.; Chakraborty, T.; Wang, Z.; Fu, P.; Wang, D.; Liao, W.; Huang, F.; Fu, H.; et al. Divergent urbanization-induced impacts on global surface urban heat island trends since 1980s. Remote Sens. Environ. 2023, 295, 113650. [Google Scholar] [CrossRef]
- Zhang, P.; Imhoff, M.L.; Wolfe, R.E.; and, L.B. Characterizing urban heat islands of global settlements using MODIS and nighttime lights products. Can. J. Remote Sens. 2010, 36, 185–196. [Google Scholar] [CrossRef]
- Qi, J.; Ding, L.; Lim, S. Application of a decision-making framework for multi-objective optimisation of urban heat mitigation strategies. Urban Clim. 2023, 47, 101372. [Google Scholar] [CrossRef]
- Chakraborty, T.; Hsu, A.; Manya, D.; Sheriff, G. A spatially explicit surface urban heat island database for the United States: Characterization, uncertainties, and possible applications. ISPRS J. Photogramm. Remote Sens. 2020, 168, 74–88. [Google Scholar] [CrossRef]
- Moore, M.; Gould, P.; Keary, B.S. Global urbanization and impact on health. Int. J. Hyg. Environ. Health 2003, 206, 269–278. [Google Scholar] [CrossRef]
- van de Giesen, N.; Hut, R.; Selker, J. The Trans-African Hydro-Meteorological Observatory (TAHMO). WIREs Water 2014, 1, 341–348. [Google Scholar] [CrossRef]
- Crawford, C.J.; Roy, D.P.; Arab, S.; Barnes, C.; Vermote, E.; Hulley, G.; Gerace, A.; Choate, M.; Engebretson, C.; Micijevic, E.; et al. The 50-year Landsat collection 2 archive. Sci. Remote Sens. 2023, 8, 100103. [Google Scholar] [CrossRef]
- Fisher, J.B.; Lee, B.; Purdy, A.J.; Halverson, G.H.; Dohlen, M.B.; Cawse-Nicholson, K.; Wang, A.; Anderson, R.G.; Aragon, B.; Arain, M.A.; et al. ECOSTRESS: NASA’s Next Generation Mission to Measure Evapotranspiration From the International Space Station. Water Resour. Res. 2020, 56, e2019WR026058. [Google Scholar] [CrossRef]
- Malakar, N.K.; Hulley, G.C.; Hook, S.J.; Laraby, K.; Cook, M.; Schott, J.R. An Operational Land Surface Temperature Product for Landsat Thermal Data: Methodology and Validation. IEEE Trans. Geosci. Remote Sens. 2018, 56, 5717–5735. [Google Scholar] [CrossRef]
- Jiménez-Muñoz, J.C.; Sobrino, J.A.; Skoković, D.; Mattar, C.; Cristóbal, J. Land Surface Temperature Retrieval Methods From Landsat-8 Thermal Infrared Sensor Data. IEEE Geosci. Remote Sens. Lett. 2014, 11, 1840–1843. [Google Scholar] [CrossRef]
- McCabe, M.F.; Rodell, M.; Alsdorf, D.E.; Miralles, D.G.; Uijlenhoet, R.; Wagner, W.; Lucieer, A.; Houborg, R.; Verhoest, N.E.C.; Franz, T.E.; et al. The future of Earth observation in hydrology. Hydrol. Earth Syst. Sci. 2017, 21, 3879–3914. [Google Scholar] [CrossRef] [PubMed]
- Zhou, D.; Xiao, J.; Bonafoni, S.; Berger, C.; Deilami, K.; Zhou, Y.; Frolking, S.; Yao, R.; Qiao, Z.; Sobrino, J.A. Satellite Remote Sensing of Surface Urban Heat Islands: Progress, Challenges, and Perspectives. Remote Sens. 2019, 11, 48. [Google Scholar] [CrossRef]
- Papenfus, M.; Schaeffer, B.; Pollard, A.I.; Loftin, K. Exploring the potential value of satellite remote sensing to monitor chlorophyll-a for US lakes and reservoirs. Environ. Monit. Assess. 2020, 192, 808. [Google Scholar] [CrossRef] [PubMed]
- Hu, L.; Brunsell, N.A. A new perspective to assess the urban heat island through remotely sensed atmospheric profiles. Remote Sens. Environ. 2015, 158, 393–406. [Google Scholar] [CrossRef]
- Degefu, M.A.; Argaw, M.; Feyisa, G.L.; Degefa, S. Regional and Urban Heat Island Studies in Megacities: A Systematic Ana Lysis of Research Methodology. Indoor Built Environ. 2022, 31, 1775–1786. [Google Scholar] [CrossRef]
- Du, H.; Zhan, W.; Liu, Z.; Scott Krayenhoff, E.; Chakraborty, T.; Zhao, L.; Jiang, L.; Dong, P.; Li, L.; Huang, F.; et al. Global mapping of urban thermal anisotropy reveals substantial potential biases for remotely sensed urban climates. Sci. Bull. 2023, 68, 1809–1818. [Google Scholar] [CrossRef]
- Elmes, A.; Healy, M.; Geron, N.; Andrews, M.; Rogan, J.; Martin, D.; Sangermano, F.; Williams, C.A.; Weil, B. Mapping Spatiotemporal Variability of the Urban Heat Island across an Urban Gradient in Worcester, Massachusetts Using in-Situ Thermochrons and Landsat-8 Thermal Infrared Sensor (TIRS) Data. GISci. Remote Sens. 2020, 57, 845–864. [Google Scholar] [CrossRef]
- Jha, P.; Joy, M.S.; Yadav, P.K.; Begam, S.; Bansal, T. Detecting the role of urban green parks in thermal comfort and public health for sustainable urban planning in Delhi. Discov. Public Health 2024, 21, 236. [Google Scholar] [CrossRef]
- Gallo, K.P.; Owen, T.W. Assessment of urban heat Islands: A multi-sensor perspective for the Dallas-Ft. worth, USA region. Geocarto Int. 1998, 13, 35–41. [Google Scholar] [CrossRef]
- Hulley, G.; Shivers, S.; Wetherley, E.; Cudd, R. New ECOSTRESS and MODIS Land Surface Temperature Data Reveal Fine-Scale Heat Vulnerability in Cities: A Case Study for Los Angeles County, California. Remote Sens. 2019, 11, 2136. [Google Scholar] [CrossRef]
- Bird, D.N.; Banzhaf, E.; Knopp, J.; Wu, W.; Jones, L. Combining Spatial and Temporal Data to Create a Fine-Resolution Daily Urban Air Temperature Product from Remote Sensing Land Surface Temperature (LST) Data. Atmosphere 2022, 13, 1152. [Google Scholar] [CrossRef]
- Garzón, J.; Molina, I.; Velasco, J.; Calabia, A. A Remote Sensing Approach for Surface Urban Heat Island Modeling in a Tropical Colombian City Using Regression Analysis and Machine Learning Algorithms. Remote Sens. 2021, 13, 4256. [Google Scholar] [CrossRef]
- García, D.H. Analysis of Urban Heat Island and Heat Waves Using Sentinel-3 Images: A Study of Andalusian Cities in Spain. Earth Syst. Environ. 2022, 6, 199–219. [Google Scholar] [CrossRef] [PubMed]
- Wang, L.; Lu, Y.; Yao, Y. Comparison of Three Algorithms for the Retrieval of Land Surface Temperature from Landsat 8 Images. Sensors 2019, 19, 5049. [Google Scholar] [CrossRef]
- Lyu, F.; Wang, S.; Han, S.Y.; Catlett, C.; Wang, S. An integrated cyberGIS and machine learning framework for fine-scale prediction of Urban Heat Island using satellite remote sensing and urban sensor network data. Urban Inform. 2022, 1, 6. [Google Scholar] [CrossRef] [PubMed]
- Wan, J.; Zhu, M.; Ding, W. Accuracy Evaluation and Parameter Analysis of Land Surface Temperature Inversion Algorithm for Landsat-8 Data. Adv. Meteorol. 2021, 2021, 9917145. [Google Scholar] [CrossRef]
- Li, X.; Zhou, Y.; Asrar, G.R.; Imhoff, M.; Li, X. The surface urban heat island response to urban expansion: A panel analysis for the conterminous United States. Sci. Total Environ. 2017, 605–606, 426–435. [Google Scholar] [CrossRef]
- Lu, L.; Weng, Q.; Xiao, D.; Guo, H.; Li, Q.; Hui, W. Spatiotemporal Variation of Surface Urban Heat Islands in Relation to Land Cover Composition and Configuration: A Multi-Scale Case Study of Xi’an, China. Remote Sens. 2020, 12, 2713. [Google Scholar] [CrossRef]
- Elmarakby, E.; Elkadi, H. Prioritising urban heat island mitigation interventions: Mapping a heat risk index. Sci. Total Environ. 2024, 948, 174927. [Google Scholar] [CrossRef] [PubMed]
- Asadi, A.; Arefi, H.; Fathipoor, H. Simulation of green roofs and their potential mitigating effects on the urban heat island using an artificial neural network: A case study in Austin, Texas. Adv. Space Res. 2020, 66, 1846–1862. [Google Scholar] [CrossRef]
- Đorđević, T. Reducing Urban Heat Islands and Improving the Thermal Comfort of Resid Ents: A Nature-Based Solution. Arhitektura i Urbanizam 2021, 52, 65–76. [Google Scholar] [CrossRef]
- Fall, S.; Coulibaly, K.; Quansah, J.; El Afandi, G. Differential Urban Heat Vulnerability: The Tale of Three Alabama Cities. Urban Sci. 2023, 7, 121. [Google Scholar] [CrossRef]
- Rosenzweig, C.; Solecki, W.D.; Parshall, L.; Lynn, B.; Cox, J.; Goldberg, R.; Hodges, S.; Gaffin, S.; Slosberg, R.B.; Savio, P.; et al. Mitigating New York City’s Heat Island: Integrating Stakeholder Perspectives and Scientific Evaluation. Bull. Am. Meteorol. Soc. 2009, 90, 1297–1312. [Google Scholar] [CrossRef]
- Diem, P.K.; Nguyen, C.T.; Diem, N.K.; Diep, N.T.H.; Thao, P.T.B.; Hong, T.G.; Phan, T.N. Remote sensing for urban heat island research: Progress, current issues, and perspectives. Remote Sens. Appl. Soc. Environ. 2024, 33, 101081. [Google Scholar] [CrossRef]
- Kousis, I.; Pigliautile, I.; Pisello, A.L. Intra-urban microclimate investigation in urban heat island through a novel mobile monitoring system. Sci. Rep. 2021, 11, 9732. [Google Scholar] [CrossRef]
- Reuter, D.C.; Richardson, C.M.; Pellerano, F.A.; Irons, J.R.; Allen, R.G.; Anderson, M.; Jhabvala, M.D.; Lunsford, A.W.; Montanaro, M.; Smith, R.L.; et al. The Thermal Infrared Sensor (TIRS) on Landsat 8: Design Overview and Pre-Launch Characterization. Remote Sens. 2015, 7, 1135–1153. [Google Scholar] [CrossRef]
- Sekertekin, A.; Bonafoni, S. Land Surface Temperature Retrieval from Landsat 5, 7, and 8 over Rural Areas: Assessment of Different Retrieval Algorithms and Emissivity Models and Toolbox Implementation. Remote Sens. 2020, 12, 294. [Google Scholar] [CrossRef]
- Jin, M.; Li, J.; Wang, C.; Shang, R. A Practical Split-Window Algorithm for Retrieving Land Surface Temperature from Landsat-8 Data and a Case Study of an Urban Area in China. Remote Sens. 2015, 7, 4371–4390. [Google Scholar] [CrossRef]
- Ru, C.; Duan, S.B.; Jiang, X.G.; Li, Z.L.; Huang, C.; Liu, M. An extended SW-TES algorithm for land surface temperature and emissivity retrieval from ECOSTRESS thermal infrared data over urban areas. Remote Sens. Environ. 2023, 290, 113544. [Google Scholar] [CrossRef]
- Huang, W.; Li, J.; Guo, Q.; Mansaray, L.R.; Li, X.; Huang, J. A Satellite-Derived Climatological Analysis of Urban Heat Island over Shanghai during 2000–2013. Remote Sens. 2017, 9, 641. [Google Scholar] [CrossRef]
- Li, L.; Zhan, W.; Du, H.; Lai, J.; Wang, C.; Fu, H.; Huang, F.; Liu, Z.; Wang, C.; Li, J.; et al. Long-Term and Fine-Scale Surface Urban Heat Island Dynamics Revealed by Landsat Data Since the 1980s: A Comparison of Four Megacities in China. J. Geophys. Res. Atmos. 2022, 127, e2021JD035598. [Google Scholar] [CrossRef]
- Islam, S.; Mayo, S.M.; Rahman, M.A.U.; Afzal, U.; Ali, M. Determination and Mitigation of Urban Heat Island (UHI) In Lahore (A comparative Study of Landsat 8&9). Int. J. Innov. Sci. Technol. 2022, 4, 526–551. [Google Scholar] [CrossRef]
- Piestova, I.; Lubskyi, M.; Svideniuk, M.; Golubov, S.; Laptiev, O. Urban thermal micro-mapping using satellite imagery and ground-truth measurements: Kyiv city area case study. Ukr. J. Remote Sens. 2019, 21, 40–48. [Google Scholar] [CrossRef]
- Sobrino, J.A.; Irakulis, I. A Methodology for Comparing the Surface Urban Heat Island in Selected Urban Agglomerations Around the World from Sentinel-3 SLSTR Data. Remote Sens. 2020, 12, 2052. [Google Scholar] [CrossRef]
- Bah, A.R.; Norouzi, H.; Prakash, S.; Blake, R.; Khanbilvardi, R.; Rosenzweig, C. Spatial Downscaling of GOES-R Land Surface Temperature over Urban Regions: A Case Study for New York City. Atmosphere 2022, 13, 332. [Google Scholar] [CrossRef]
- Khan, S.; Gul, S.; Li, W. Remote sensing evaluation of land surface temperature and urban area expansion in Zhengzhou city during 2013–2015. Nat. Appl. Sci. Int. J. 2021, 2, 39–55. [Google Scholar] [CrossRef]
- Yang, Y.; Lee, X. A Scale-Separating Framework for Fusing Satellite Land Surface Temperature Products. Remote Sens. 2022, 14, 983. [Google Scholar] [CrossRef]
- Wenny, B.N.; Helder, D.; Hong, J.; Leigh, L.; Thome, K.J.; Reuter, D. Pre- and Post-Launch Spatial Quality of the Landsat 8 Thermal Infrared Sensor. Remote Sens. 2015, 7, 1962–1980. [Google Scholar] [CrossRef]
- Eftekharzadeh Kay, S.; Wenny, B.N.; Thome, K.J.; Yarahmadi, M.; Lampkin, D.J.; Tahersima, M.H.; Voskanian, N. Assessment of Spatial Characterization Metrics for On-Orbit Performance of Landsat 8 and 9 Thermal Infrared Sensors. Remote Sens. 2024, 16, 3588. [Google Scholar] [CrossRef]
- Wang, R.; Gao, W.; Peng, W. Downscale MODIS Land Surface Temperature Based on Three Different Models to Analyze Surface Urban Heat Island: A Case Study of Hangzhou. Remote Sens. 2020, 12, 2134. [Google Scholar] [CrossRef]
- Masek, J.G.; Wulder, M.A.; Markham, B.; McCorkel, J.; Crawford, C.J.; Storey, J.; Jenstrom, D.T. Landsat 9: Empowering open science and applications through continuity. Remote Sens. Environ. 2020, 248, 111968. [Google Scholar] [CrossRef]
- Gascon, F.; Bouzinac, C.; Thépaut, O.; Jung, M.; Francesconi, B.; Louis, J.; Lonjou, V.; Lafrance, B.; Massera, S.; Gaudel-Vacaresse, A.; et al. Copernicus Sentinel-2A Calibration and Products Validation Status. Remote Sens. 2017, 9, 584. [Google Scholar] [CrossRef]
- Barsi, J.A.; Schott, J.R.; Hook, S.J.; Raqueno, N.G.; Markham, B.L.; Radocinski, R.G. Landsat-8 Thermal Infrared Sensor (TIRS) Vicarious Radiometric Calibration. Remote Sens. 2014, 6, 11607–11626. [Google Scholar] [CrossRef]
- Liu, K.; Su, H.; Li, X.; Wang, W.; Yang, L.; Liang, H. Quantifying Spatial–Temporal Pattern of Urban Heat Island in Beijing: An Improved Assessment Using Land Surface Temperature (LST) Time Series Observations From LANDSAT, MODIS, and Chinese New Satellite GaoFen-1. IEEE J. Sel. Top. Appl. Earth Obs. Remote Sens. 2016, 9, 2028–2042. [Google Scholar] [CrossRef]
- Liu, K.; Su, H.; Zhang, L.; Yang, H.; Zhang, R.; Li, X. Analysis of the Urban Heat Island Effect in Shijiazhuang, China Using Satellite and Airborne Data. Remote Sens. 2015, 7, 4804–4833. [Google Scholar] [CrossRef]
- Nichol, J. An Emissivity Modulation Method for Spatial Enhancement of Thermal Sat Ellite Images in Urban Heat Island Analysis. Photogramm. Eng. Remote Sens. 2009, 75, 547–556. [Google Scholar] [CrossRef]
- Bechtel, B.; Zakšek, K.; Hoshyaripour, G. Downscaling Land Surface Temperature in an Urban Area: A Case Study for Hamburg, Germany. Remote Sens. 2012, 4, 3184–3200. [Google Scholar] [CrossRef]
- Shi, C.; Wang, N.; Zhang, Q.; Liu, Z.; Zhu, X. A Comprehensive Flexible Spatiotemporal DAta Fusion Method (CFSDAF) for Generating High Spatiotemporal Resolution Land Surface Temperature in Urban Area. IEEE J. Sel. Top. Appl. Earth Obs. Remote Sens. 2022, 15, 9885–9899. [Google Scholar] [CrossRef]
- Seeberg, G.; Hostlowsky, A.; Huber, J.; Kamm, J.; Lincke, L.; Schwingshackl, C. Evaluating the Potential of Landsat Satellite Data to Monitor the Effectiveness of Measures to Mitigate Urban Heat Islands: A Case Study for Stuttgart (Germany). Urban Sci. 2022, 6, 82. [Google Scholar] [CrossRef]
- Nandi, N.; Dede, M. Urban Heat Island Assessment using Remote Sensing Data in West Java, Indonesia: From Literature Review to Experiments and Analyses. Indones. J. Sci. Technol. 2022, 7, 105–116. [Google Scholar] [CrossRef]
- Liu, H.; Weng, Q. Scaling Effect on the Relationship between Landscape Pattern and Land Surface Temperature. Photogramm. Eng. Remote Sens. 2009, 75, 291–304. [Google Scholar] [CrossRef]
- Wang, F.; Qin, Z.; Song, C.; Tu, L.; Karnieli, A.; Zhao, S. An Improved Mono-Window Algorithm for Land Surface Temperature Retrieval from Landsat 8 Thermal Infrared Sensor Data. Remote Sens. 2015, 7, 4268–4289. [Google Scholar] [CrossRef]
- Dave, J.A.; Pandya, M.R.; Shah, D.B.; Varchand, H.K.; Parmar, P.N.; Trivedi, H.J.; Pathak, V.N.; Singh, M.; Kardani, D.B. Comparative analysis of two parameter-dependent split window algorithms for the land surface temperature retrieval using MODIS TIR observations. J. Agrometeorol. 2023, 25, 510–516. [Google Scholar] [CrossRef]
- Käfer, P.S.; Rolim, S.B.A.; Diaz, L.R.; Rocha, N.S.d.; Iglesias, M.L.; Rex, F.E. Comparative Analysis of Split-Window and Single-Channel Algorithms for Land Surface Temperature Retrieval of a Pseudo-Invariant Target. Bol. CiêNcias GeodéSicas 2020, 26, e2020008. [Google Scholar] [CrossRef]
- Ru, C.; Duan, S.B.; Jiang, X.G.; Li, Z.L.; Jiang, Y.; Ren, H.; Leng, P.; Gao, M. Land Surface Temperature Retrieval From Landsat 8 Thermal Infrared Data Over Urban Areas Considering Geometry Effect: Method and Application. IEEE Trans. Geosci. Remote Sens. 2022, 60, 1–16. [Google Scholar] [CrossRef]
- Liu, H.; Weng, Q. Scaling Effect of Fused ASTER-MODIS Land Surface Temperature in an Urban Environment. Sensors 2018, 18, 4058. [Google Scholar] [CrossRef]
- Zhou, J.; Chen, Y.; Wang, J.; Zhan, W. Maximum Nighttime Urban Heat Island (UHI) Intensity Simulation by Integrating Remotely Sensed Data and Meteorological Observations. IEEE J. Sel. Top. Appl. Earth Obs. Remote Sens. 2011, 4, 138–146. [Google Scholar] [CrossRef]
- Mushore, T.; Odindi, J.; Mutanga, O. “Cool” Roofs as a Heat-Mitigation Measure in Urban Heat Islands: A Comparative Analysis Using Sentinel 2 and Landsat Data. Remote Sens. 2022, 14, 4247. [Google Scholar] [CrossRef]
- Rios, G.; Ramamurthy, P. A novel model to estimate sensible heat fluxes in urban areas using satellite-derived data. Remote Sens. Environ. 2022, 270, 112880. [Google Scholar] [CrossRef]
- Gao, F.; Masek, J.; Schwaller, M.; Hall, F. On the blending of the Landsat and MODIS surface reflectance: Predicting daily Landsat surface reflectance. IEEE Trans. Geosci. Remote Sens. 2006, 44, 2207–2218. [Google Scholar] [CrossRef]
- Liu, M.; Ke, Y.; Yin, Q.; Chen, X.; Im, J. Comparison of Five Spatio-Temporal Satellite Image Fusion Models over Landscapes with Various Spatial Heterogeneity and Temporal Variation. Remote Sens. 2019, 11, 2612. [Google Scholar] [CrossRef]
- Martin, M.A.; Ghent, D.; Pires, A.C.; Göttsche, F.M.; Cermak, J.; Remedios, J.J. Comprehensive In Situ Validation of Five Satellite Land Surface Temperature Data Sets over Multiple Stations and Years. Remote Sens. 2019, 11, 479. [Google Scholar] [CrossRef]
- Trigo, I.F.; Monteiro, I.T.; Olesen, F.; Kabsch, E. An assessment of remotely sensed land surface temperature. J. Geophys. Res. Atmos. 2008, 113, D17108. [Google Scholar] [CrossRef]
- Duan, S.B.; Li, Z.L. Intercomparison of Operational Land Surface Temperature Products Derived From MSG-SEVIRI and Terra/Aqua-MODIS Data. IEEE J. Sel. Top. Appl. Earth Obs. Remote Sens. 2015, 8, 4163–4170. [Google Scholar] [CrossRef]
- Bozorgi, M.; Nejadkoorki, F.; Bihamta Toosi, N. Trend Analysis Development of Urban Heat Island Using Thermal Remote s Ensing. Earth Obs. Geomat. Eng. 2020, 4, 119–131. [Google Scholar] [CrossRef]
- Gloria, S.J.; Gnanasekaran, S.P. Impact of Urban Vegetation Loss on Urban Heat Islands: A Case Study of Chennai Metropolitan Area. Indian J. Sci. Technol. 2024, 17, 134–141. [Google Scholar] [CrossRef]
- Amir Siddique, M.; Wang, Y.; Xu, N.; Ullah, N.; Zeng, P. The Spatiotemporal Implications of Urbanization for Urban Heat Islands in Beijing: A Predictive Approach Based on CA–Markov Modeling (2004–2050). Remote Sens. 2021, 13, 4697. [Google Scholar] [CrossRef]
- Yang, C.; He, X.; Yan, F.; Yu, L.; Bu, K.; Yang, J.; Chang, L.; Zhang, S. Mapping the Influence of Land Use/Land Cover Changes on the Urban Heat Island Effect—A Case Study of Changchun, China. Sustainability 2017, 9, 312. [Google Scholar] [CrossRef]
- Li, Y.; Zhang, H.; Kainz, W. Monitoring patterns of urban heat islands of the fast-growing Shanghai metropolis, China: Using time-series of Landsat TM/ETM+ data. Int. J. Appl. Earth Obs. Geoinf. 2012, 19, 127–138. [Google Scholar] [CrossRef]
- Burnett, M.; Chen, D. Urban Heat Island Footprint Effects on Bio-Productive Rural Land Cover s Surrounding a Low Density Urban Center. Int. Arch. Photogramm. Remote Sens. Spat. Inf. Sci. 2021, 43, 539–550. [Google Scholar] [CrossRef]
- Kumar, A.; Agarwal, V.; Pal, L.; Chandniha, S.K.; Mishra, V. Effect of Land Surface Temperature on Urban Heat Island in Varanasi City, India. J 2021, 4, 420–429. [Google Scholar] [CrossRef]
- Ambinakudige, S. Remote Sensing of Land Cover’s Effect on Surface Temperatures: A Case Study of the Urban Heat Island in Bangalore, India. Appl. GIS 2011, 7, 1–12. [Google Scholar] [CrossRef]
- Fan, C.; Myint, S.W.; Kaplan, S.; Middel, A.; Zheng, B.; Rahman, A.; Huang, H.P.; Brazel, A.; Blumberg, D.G. Understanding the Impact of Urbanization on Surface Urban Heat Islands—A Longitudinal Analysis of the Oasis Effect in Subtropical Desert Cities. Remote Sens. 2017, 9, 672. [Google Scholar] [CrossRef]
- Taheri Otaghsara, M.P.; Arefi, H. Modelling Urban Heat Island Using Remote Sensing and City Morphologica l Parameters. Int. Arch. Photogramm. Remote Sens. Spat. Inf. Sci. 2019, 42, 1035–1040. [Google Scholar] [CrossRef]
- Puche, M.; Vavassori, A.; Brovelli, M.A. Insights into the Effect of Urban Morphology and Land Cover on Land Surface and Air Temperatures in the Metropolitan City of Milan (Italy) Using Satellite Imagery and In Situ Measurements. Remote Sens. 2023, 15, 733. [Google Scholar] [CrossRef]
- Osei, J.D.; Damoah-Afari, P.; Yevugah, L.L.; Mensah, C.; Prempeh, N.A. Impact of land use and land cover dynamics on urban heat island in the Sunyani Municipality using satellite remote sensing. J. Ghana Inst. Eng. 2023, 23, 6–16. [Google Scholar] [CrossRef]
- Zhao, X.; Yang, S.; Shen, S.; Hai, Y.; Fang, Y. Analyzing the relationship between urban heat island and land use/cover changes in Beijing using remote sensing images. In Remote Sensing and Modeling of Ecosystems for Sustainability VI; Gao, W., Jackson, T.J., Eds.; International Society for Optics and Photonics, SPIE: Bellingham, WA, USA, 2009; Volume 7454, p. 74541J. [Google Scholar] [CrossRef]
- Zoran, M.A.; Savastru, R.S.; Savastru, D.M.; Tautan, M.N.; Baschir, L.A. Monitoring of land surface radiative parameters in Bucharest city through thermal infrared remote sensing. In Proceedings of the Eighth International Conference on Remote Sensing and Geoinformation of the Environment (RSCy2020), Paphos, Cyprus, 16–18 March 2020; International Society for Optics and Photonics, SPIE: Bellingham, WA, USA, 2020; Volume 11524, p. 115241T. [Google Scholar] [CrossRef]
- Su, W.; Gu, C.; Yang, G. Assessing the Impact of Land Use/Land Cover on Urban Heat Island Pattern in Nanjing City, China. J. Urban Plan. Dev. 2010, 136, 365–372. [Google Scholar] [CrossRef]
- Alhawiti, R.H.; Mitsova, D. Using Landsat-8 data to explore the correlation between urban heat island and urban land uses. Int. J. Res. Eng. Technol. 2016, 5, 457–466. [Google Scholar] [CrossRef]
- Meng, F.; Liu, M. Remote-sensing image-based analysis of the patterns of urban heat islands in rapidly urbanizing Jinan, China. Int. J. Remote Sens. 2013, 34, 8838–8853. [Google Scholar] [CrossRef]
- Zeng, Y.; Huang, W.; Zhan, F.; Zhang, H.; Liu, H. Study on the urban heat island effects and its relationship with surface biophysical characteristics using MODIS imageries. Geo-Spat. Inf. Sci. 2010, 13, 1–7. [Google Scholar] [CrossRef]
- Ernest, S.; Nduganda, A.R.; Kashaigili, J.J. Urban Climate Analysis with Remote Sensing and Climate Observations: A Case of Morogoro Municipality in Tanzania. Adv. Remote Sens. 2017, 6, 120–131. [Google Scholar] [CrossRef]
- Yang, C.; Yan, F.; Zhang, S. Comparison of land surface and air temperatures for quantifying summer and winter urban heat island in a snow climate city. J. Environ. Manag. 2020, 265, 110563. [Google Scholar] [CrossRef] [PubMed]
- Miles, V.; Esau, I. Seasonal and Spatial Characteristics of Urban Heat Islands (UHIs) in Northern West Siberian Cities. Remote Sens. 2017, 9, 989. [Google Scholar] [CrossRef]
- Costanzini, S.; Boccolari, M.; Vega Parra, S.; Despini, F.; Lombroso, L.; Teggi, S. A comparative analysis of temperature trends at Modena Geophysical Observatory and Mount Cimone Observatory, Italy. Int. J. Climatol. 2024, 44, 4741–4766. [Google Scholar] [CrossRef]
- Jiang, Y.; Huang, J.; Shi, T.; Wang, H. Interaction of Urban Rivers and Green Space Morphology to Mitigate the Urban Heat Island Effect: Case-Based Comparative Analysis. Int. J. Environ. Res. Public Health 2021, 18, 11404. [Google Scholar] [CrossRef]
- Palanisamy, P.A.; Jain, K.; Tiwari, A.; Zawadzka, J.; Bonafoni, S. Evaluating The Persistence Urban Heat Island and Its Impact on Vulnerable Populations. In Proceedings of the IGARSS 2024—2024 IEEE International Geoscience and Remote Sensing Symposium, Athens, Greece, 7–12 July 2024; pp. 4032–4035. [Google Scholar] [CrossRef]
- Zhu, Y.; Myint, S.W.; Schaffer-Smith, D.; Muenich, R.L.; Tong, D.; Li, Y. Formulating Operational Mitigation Options and Examining Intra-Urban Social Inequality Using Evidence-Based Urban Warming Effects. Front. Environ. Sci. 2022, 9, 795474. [Google Scholar] [CrossRef]
- Todeschi, V.; Pappalardo, S.E.; Zanetti, C.; Peroni, F.; Marchi, M.D. Climate Justice in the City: Mapping Heat-Related Risk for Climate Change Mitigation of the Urban and Peri-Urban Area of Padua (Italy). ISPRS Int. J. Geo-Inf. 2022, 11, 490. [Google Scholar] [CrossRef]
- Wong, M.S.; Peng, F.; Zou, B.; Shi, W.Z.; Wilson, G.J. Spatially Analyzing the Inequity of the Hong Kong Urban Heat Island by Socio-Demographic Characteristics. Int. J. Environ. Res. Public Health 2016, 13, 317. [Google Scholar] [CrossRef]
- Yao, N.; Huang, C.; Yang, J.; Konijnendijk van den Bosch, C.C.; Ma, L.; Jia, Z. Combined Effects of Impervious Surface Change and Large-Scale Afforestation on the Surface Urban Heat Island Intensity of Beijing, China Based on Remote Sensing Analysis. Remote Sens. 2020, 12, 3906. [Google Scholar] [CrossRef]
- Xu, C.; Huang, Q.; Haase, D.; Dong, Q.; Teng, Y.; Su, M.; Yang, Z. Cooling Effect of Green Spaces on Urban Heat Island in a Chinese Megacity: Increasing Coverage versus Optimizing Spatial Distribution. Environ. Sci. Technol. 2024, 58, 5811–5820. [Google Scholar] [CrossRef]
- Yan, L.; Jia, W.; Zhao, S. The Cooling Effect of Urban Green Spaces in Metacities: A Case Study of Beijing, China’s Capital. Remote Sens. 2021, 13, 4601. [Google Scholar] [CrossRef]
- Liu, W.; Jia, B.; Li, T.; Zhang, Q.; Ma, J. Correlation Analysis between Urban Green Space and Land Surface Temperature from the Perspective of Spatial Heterogeneity: A Case Study within the Sixth Ring Road of Beijing. Sustainability 2022, 14, 13492. [Google Scholar] [CrossRef]
- Cao, S.Y.; Yin, W.D.; Su, J.Y.; Feng, C.W.; Du, Y.C.; Zhu, J.Y.; Ye, N.; Ding, J.Y.; Li, Y.Z. Spatial and Temporal Evolution of Multi-scale Green Space Environments and Urban Heat Islands: A Case Study of Beijing Sub-center. Sensors Mater. 2023, 35, 589–606. [Google Scholar] [CrossRef]
- Li, H.; Meng, H.; He, R.; Lei, Y.; Guo, Y.; Ernest, A.a.; Jombach, S.; Tian, G. Analysis of Cooling and Humidification Effects of Different Coverage Types in Small Green Spaces (SGS) in the Context of Urban Homogenization: A Case of HAU Campus Green Spaces in Summer in Zhengzhou, China. Atmosphere 2020, 11, 862. [Google Scholar] [CrossRef]
- Shi, D.; Song, J.; Huang, J.; Zhuang, C.; Guo, R.; Gao, Y. Synergistic cooling effects (SCEs) of urban green-blue spaces on local thermal environment: A case study in Chongqing, China. Sustain. Cities Soc. 2020, 55, 102065. [Google Scholar] [CrossRef]
- Sabrin, S.; Karimi, M.; Nazari, R. Developing Vulnerability Index to Quantify Urban Heat Islands Effects Coupled with Air Pollution: A Case Study of Camden, NJ. ISPRS Int. J. Geo-Inf. 2020, 9, 349. [Google Scholar] [CrossRef]
- Gupta, A.; De, B.; Shukla, A.K.; Pignatta, G. Vulnerability Assessment of a Highly Populated Megacity to Ambient Thermal Stress. Sustainability 2024, 16, 3395. [Google Scholar] [CrossRef]
- Smith, I.A.; Fabian, M.P.; Hutyra, L.R. Urban green space and albedo impacts on surface temperature across seven United States cities. Sci. Total Environ. 2023, 857, 159663. [Google Scholar] [CrossRef]
- Despini, F.; Ferrari, C.; Santunione, G.; Tommasone, S.; Muscio, A.; Teggi, S. Urban surfaces analysis with remote sensing data for the evaluation of UHI mitigation scenarios. Urban Clim. 2021, 35, 100761–100773. [Google Scholar] [CrossRef]
- Du, H.; Ai, J.; Cai, Y.; Jiang, H.; Liu, P. Combined Effects of the Surface Urban Heat Island with Landscape Composition and Configuration Based on Remote Sensing: A Case Study of Shanghai, China. Sustainability 2019, 11, 2890. [Google Scholar] [CrossRef]
- Errea, C.L.; Almeida, C.R.d.; Gonçalves, A.; Teodoro, A.C. Remote Sensing Analysis of the Surface Urban Heat Island Effect in Vitoria-Gasteiz, 1985 to 2021. Remote Sens. 2023, 15, 3110. [Google Scholar] [CrossRef]
- Park, Y.; Guldmann, J.M.; Liu, D. Impacts of tree and building shades on the urban heat island: Combining remote sensing, 3D digital city and spatial regression approaches. Comput. Environ. Urban Syst. 2021, 88, 101655. [Google Scholar] [CrossRef]
- Quattrochl, D.; Luvall, J.; Rickman, D.; Estes, M.; Laymon, C.; Howell, B. A decision support information system for urban landscape management using thermal infrared data. Photogramm. Eng. Remote Sens. 2000, 66, 1195–1207. [Google Scholar]
- Sun, Q.; Yun, G.; Ling, T. Identifying Heat Health Risks in the Urban Areas of Western Australia (WA) – An Enhanced Heat Vulnerability Assessment. Abstr. ICA 2019, 1, 356. [Google Scholar] [CrossRef]
- Ma, J.; Shen, H.; Wu, P.; Wu, J.; Gao, M.; Meng, C. Generating gapless land surface temperature with a high spatio-temporal resolution by fusing multi-source satellite-observed and model-simulated data. Remote Sens. Environ. 2022, 278, 113083. [Google Scholar] [CrossRef]
- Adeniran, I.A.; Nazeer, M.; Wong, M.S.; Chan, P.W. An improved machine learning-based model for prediction of diurnal and spatially continuous near surface air temperature. Sci. Rep. 2024, 14, 27342. [Google Scholar] [CrossRef]
- Rosenzweig, C.; Solecki, W.D.; Parshall, L.; Chopping, M.; Pope, G.; Goldberg, R. Characterizing the urban heat island in current and future climates in New Jersey. Glob. Environ. Change Part B Environ. Hazards 2005, 6, 51–62. [Google Scholar] [CrossRef]
- Zhang, Y.; Wang, Y.; Ding, N.; Yang, X. Assessing the Contributions of Urban Green Space Indices and Spatial Structure in Mitigating Urban Thermal Environment. Remote Sens. 2023, 15, 2414. [Google Scholar] [CrossRef]
- Li, K.; Chen, Y.; Gao, S. Uncertainty of city-based urban heat island intensity across 1112 global cities: Background reference and cloud coverage. Remote Sens. Environ. 2022, 271, 112898. [Google Scholar] [CrossRef]
- Yao, Y.; Chang, C.; Ndayisaba, F.; Wang, S. A New Approach for Surface Urban Heat Island Monitoring Based on Machine Learning Algorithm and Spatiotemporal Fusion Model. IEEE Access 2020, 8, 164268–164281. [Google Scholar] [CrossRef]
- Francini, M.; Salvo, C.; Vitale, A. Combining Deep Learning and Multi-Source GIS Methods to Analyze Urban and Greening Changes. Sensors 2023, 23, 3805. [Google Scholar] [CrossRef] [PubMed]
- Ravanelli, R.; Nascetti, A.; Cirigliano, R.V.; Di Rico, C.; Leuzzi, G.; Monti, P.; Crespi, M. Monitoring the Impact of Land Cover Change on Surface Urban Heat Island through Google Earth Engine: Proposal of a Global Methodology, First Applications and Problems. Remote Sens. 2018, 10, 1488. [Google Scholar] [CrossRef]
- Dimitrov, S.; Iliev, M.; Borisova, B.; Semerdzhieva, L.; Petrov, S. A Methodological Framework for High-Resolution Surface Urban Heat Island Mapping: Integration of UAS Remote Sensing, GIS, and the Local Climate Zoning Concept. Remote Sens. 2024, 16, 4007. [Google Scholar] [CrossRef]
- Liu, T.; Fan, C. A Digital Twin Framework to Simulate Urban Microclimates. In ASCE Inspire 2023; American Society of Civil Engineers: Reston, VA, USA, 2023; pp. 617–622. [Google Scholar] [CrossRef]
- Ho, J.Y.; Shi, Y.; Lau, K.K.; Ng, E.Y.; Ren, C.; Goggins, W.B. Urban heat island effect-related mortality under extreme heat and non-extreme heat scenarios: A 2010–2019 case study in Hong Kong. Sci. Total Environ. 2023, 858, 159791. [Google Scholar] [CrossRef]

| Research Questions | Primary Chapters | Supporting Chapters | Specific Contributions | Key Findings/Results |
|---|---|---|---|---|
| RQ1: How can we effectively integrate evolving remote sensing technologies and data processing methods to enhance urban heat island monitoring capabilities? | Section 3: Remote Sensing Technology Evolution | Section 1.2, Section 7.2 |
| |
| RQ2: How can we address the mismatch between spatial-temporal resolution trade-offs in the remote sensing observations and multi-scale characteristics of urban heat islands? | Section 4: Methodological Advances | Section 3.2, Section 3.4 |
| |
| RQ3: How can we establish more effective validation strategies and accuracy assessment systems in complex urban environments? | Section 4.3: Accuracy Assessment and Validation Strategies | Section 4.1, Section 4.2 |
|
|
| RQ4: How can we transform remote sensing monitoring results into practical tools supporting urban planning decisions and heat island mitigation? | Section 6: Heat Island Mitigation Applications | Section 5: Heat Island Characteristic Comparative Studies |
|
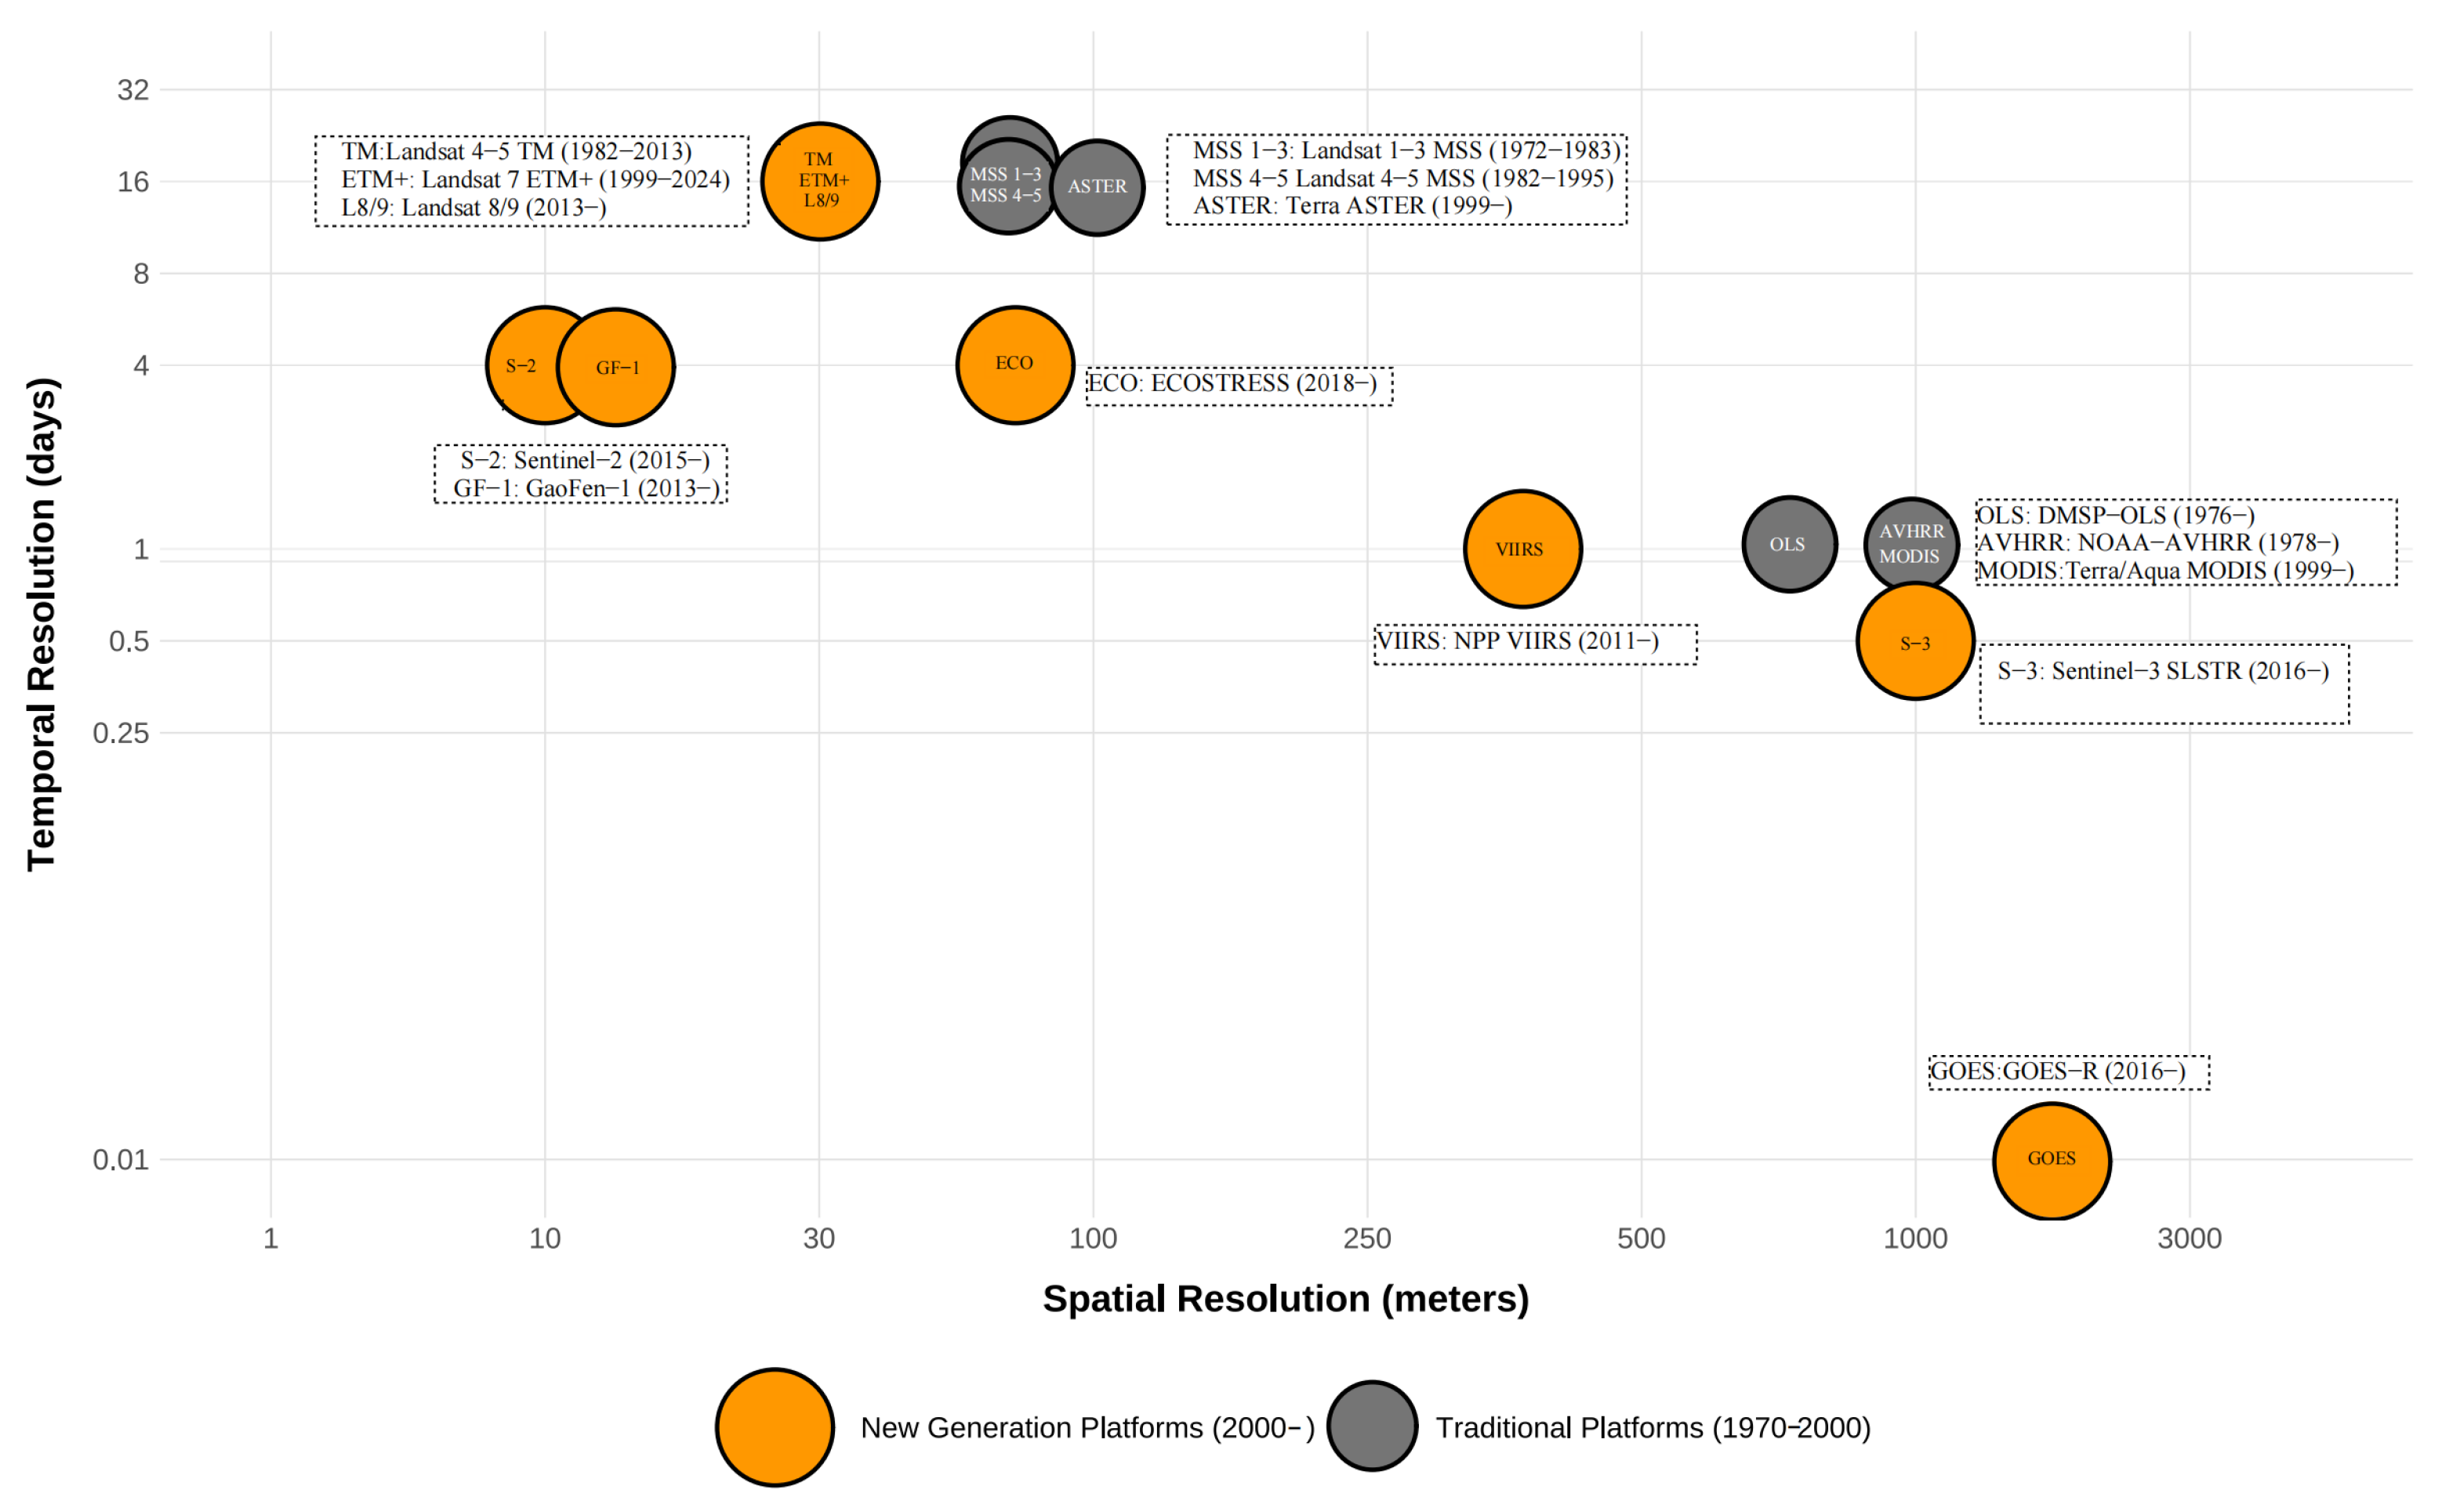
| Platform | Launch/ Operation | Spatial Resolution | Temporal Resolution | Thermal IR Bands | Advantages | Limitations | Applications |
|---|---|---|---|---|---|---|---|
| Traditional Remote Sensing Platforms | |||||||
| Landsat 5/7 | 1984–2013/1999–present | 60–120 m | 16 days | 1 band | Higher spatial res., long-term continuity | Low temporal res., cloud impact | Gallo and Owen [22] multi-sensor comparison |
| NOAA-AVHRR | 1978–present | 1.1 km | Daily | 2 bands | High temporal res., global coverage | Low spatial res., mixed pixels | Huang et al. [43] global UHI climatology |
| ASTER | 1999–present | 90 m | 16 days | 5 bands | High spectral/spatial res. | Non-routine obs., limited coverage | Zhou et al. [15] SUHI platform review |
| MODIS | 1999/2002–present | 1 km | 1–2/day | 16 bands | High-freq. obs., global coverage | Low spatial res. | Li et al. [44] LST series (1985–2019) |
| New Generation Satellite Systems | |||||||
| Landsat 8/9 | 2013/2021–present | 100 m (to 30 m) | 16 days | 2 bands | Improved radiometric res. (12-bit) | Limited temporal res. | Islam et al. [45] high-precision UHI mapping |
| Sentinel-2 | 2015/2017–present | No thermal IR (10–20 m) | 5 days | None | High spatial res., land cover class. | Cannot measure LST | Piestova et al. [46] thermal domains |
| Sentinel-3 | 2016/2018–present | 1 km | Daily | Multiple | High temporal res. | Low spatial res. | Sobrino and Irakulis [47] global UHI |
| ECOSTRESS | 2018–present | 70 m | 3–5 days | 5 bands | Fine spatial/spectral res. | Non-systematic coverage | Hulley et al. [23] fine-scale mapping |
| GOES-R | 2016–present | 2 km | 5–15 min | Multiple | Ultra-high temporal res. | Low spatial res. | Bah et al. [48] spatial downscaling to 30 m |
| NPP VIIRS | 2011–present | 375–750 m | Daily | Medium res. | Enhanced night-time imaging | Mixed pixel issues | Khan et al. [49] UHI and urban expansion |
| Emerging Data Fusion Technologies | |||||||
| Multi-source fusion | - | 30–100 m | Daily+ | Combined | High spatial/temporal res. | Complex processing | Bird et al. [24] 100 m daily LST |
| Spatiotemporal downscaling | - | 30–100 m | Daily+ | Improved low-res | Enhanced resolution | Data quality dependent | Garzón et al. [25] data integration |
| ML fusion | - | Variable | Variable | Intelligent | Nonlinear proc., precision | Large training datasets | Yang and Lee [50] scale separation |
| Scale Level | Spatial Resolution | Primary Data Sources | Typical Sensors | Detection Capabilities | Mitigation Strategy Focus | Research Cases |
|---|---|---|---|---|---|---|
| Urban-Regional Scale | 1 km level | MODIS LST products | MODIS Terra/Aqua |
|
| |
| Neighborhood Scale | 30–100 m | Landsat series | Landsat TM/ETM+/OLI-TIRS |
|
| Liu and Weng [64] landscape-temperature relationship: 30 m suitable for category analysis, 90 m suitable for landscape analysis |
| Microclimate Scale | <30 m | High-resolution satellites, Airborne sensors | ECOSTRESS (70 m), TASI (0.6/1.25 m) |
|
| |
| Cross-Scale Integration | Multi-resolution integration | Multi-source data fusion, Spatiotemporal fusion techniques | Downscaling techniques, Data fusion algorithms, Machine learning models |
|
|
| Method Category | Specific Algorithm | Main Principle | Applicable Conditions | Accuracy Indicators | Advantages | Limitations |
|---|---|---|---|---|---|---|
| Single Window Algorithms | Mono-Window Algorithm (MWA) | Considers parameters such as atmospheric transmittance and land surface emissivity to extract surface temperature from a single thermal infrared band | Landsat series data, moderately complex urban environments | RMSE: 2.39 K [40] | Widely applied, relatively simple calculation | Sensitive to atmospheric water vapor content, decreasing accuracy in humid regions |
| Improved Mono-Window Algorithm (IMW) | Introduces urban geometric shape parameters based on traditional MWA | Complex urban environments, high-density building areas | RMSE: <1.0 K [42] | Better consideration of urban canyon effects | Requires additional urban morphology parameters | |
| Split Window Algorithms | Split Window Algorithm (SWA) | Uses differences between two or more adjacent thermal infrared bands to compensate for atmospheric effects | Multi-band thermal infrared data, such as MODIS, VIIRS | RMSE: 0.51–1.8 K [41, 66] | Lower sensitivity to atmospheric water vapor estimation errors, good robustness | Requires at least two thermal infrared bands |
| Urban Split Window (USW) Algorithm | SWA optimized for urban environments, incorporating urban geometric features | High-density urban areas, especially coastal cities | RMSE: <1.0 K [42] | Stable performance in complex urban environments | Complex algorithm, high parameter requirements | |
| Machine Learning Methods | Local Linear Forest (LLF) | Non-parametric regression method based on machine learning | Data-rich complex urban environments | Data missing | Can handle nonlinear relationships, adapts to complex environments | Requires large training datasets, computationally intensive |
| Random Forest Regression | Ensemble learning method, integrating prediction results from multiple decision trees | Multi-source data fusion, highly heterogeneous urban areas | Data missing | Can process multiple data types, strong noise resistance | Black-box characteristics, weaker physical interpretability | |
| Heat Island Intensity Calculation Methods | Urban-Rural Temperature Difference Method | Temperature difference between urban areas and surrounding rural areas | Regions with clear urban-rural boundaries, medium to large cities | Most commonly used method, widely applied in global research | Clear concept, easy to understand and calculate | Inconsistent urban-rural boundary definitions affect result comparability |
| Time Series Analysis Method | Analyzes heat island intensity changes at different time scales | Long time series data, seasonal and extreme event studies | Can quantify heat island intensification effects under extreme climate conditions [26] | Can capture dynamic changes, suitable for long-term trend analysis | Requires temporally continuous observation data | |
| Machine Learning-Based Heat Island Intensity Calculation | Predicts urban heat island intensity by combining multi-source data | Multi-source data available, fine spatiotemporal scale research | Data missing | Can achieve fine-scale urban prediction, considers multi-factor influences [28] | Depends on high-quality multi-source data, complex models | |
| Accuracy Assessment Strategies | Ground Truth Validation | Compares satellite LST with ground sensor or meteorological station data | Research supported by ground measurement networks | In areas with canopy coverage > 47%, MAE < 3.74 °C, R2 > 0.85 [20] | Direct comparison, reliable results | Spatial representativeness issues, limited ground measurement networks |
| Cross-Platform Validation | Compares data from different satellite sensors | When multi-platform data is available | Uses R2, correlation coefficients, and RMSE to evaluate consistency | Extends spatial coverage, provides consistency checks | Sensor differences, atmospheric effects, and calibration issues | |
| Temporal Validation | Evaluates the consistency and accuracy of UHI measurements over time | Long-term studies, seasonal variation analysis | Usually R2 > 0.73 in winter, R2 about 0.5 in other seasons [29] | Captures temporal dynamic changes | Need to consider seasonal variations, urban development dynamics, and other factors |
| Fusion Method | Technical Approach | Performance Indicators | Applicable Conditions | Spatiotemporal Constraints | Advantages and Limitations |
|---|---|---|---|---|---|
| Spatiotemporal Fusion Technology | STARFM (Spatial and Temporal Adaptive Reflectance Fusion Model) | 100 m spatial resolution with daily temporal resolution [24] | Stable land cover regions; requires paired high and low-resolution data | Simultaneous high spatial precision and high temporal frequency requirements | + Enhanced spatiotemporal continuity
- Performance may decline in rapidly changing urban environments |
| Downscaling Technology | Sophisticated downscaling techniques for geostationary satellite data | 3300 × 6700 m improved to 100 m resolution, maintaining 15 min observation frequency [60] | Large study areas with diverse land cover types | Relies on land cover information, terrain features, and auxiliary high-resolution data | + Significantly enhanced spatial details for high-frequency monitoring
- Typically rely on auxiliary data to construct precise relationship models |
| Machine Learning Methods | Random forests, support vector machines, and other advanced algorithms | 20% of relevant studies employed machine learning techniques [70] SVM regression outperforms traditional methods | Highly heterogeneous urban environments; data-rich scenarios | Requires extensive training datasets and validation | + Effectively handle complex nonlinear relationships
- Do not require extensive physical model support, but need careful model validation |
| Multi-sensor Integration | Panchromatic sharpening technology combining different sensor platforms | 10 m resolution heat island analysis [71] | Multiple sensor platforms available; studies requiring comprehensive coverage | Combination of unique observational advantages from different sensors | + Unprecedented continuous monitoring capabilities
- Faces challenges such as calibration unification of different sensor data |
| Physical Model Integration | Integration with urban energy balance models | RMSE: 47.32 W/m2 with R2 = 0.70 for energy flux simulation [72] | Research focusing on heat island formation mechanisms | Based on solid physical principles; faces computation intensity and parameter complexity | + Deep explanation of underlying mechanisms of heat island formation
- Faces challenges such as computation intensity and parameter complexity |
| Urban Morphology Elements | Impact Relationship | Quantitative Indicators | Case Studies | Regional Differences | Planning Implications |
|---|---|---|---|---|---|
| Impervious Surface | Significant positive correlation with LST | NDISI correlation: 0.59–0.97; Explains > 60% LST variance | Lu et al. [31], Zhang et al. [5] | Major driving factor across climate zones globally | Controlling impervious surface is core UHI mitigation strategy |
| Enhanced with urban expansion | Impervious surface: 143.15 km2 to 577.45 km2, with synchronous UHI increase | Yang et al. [81], Changchun study | Common global phenomenon | Plan mitigation with urban expansion | |
| Long-term cumulative effect | Impervious surface: 9 km2 to 82 km2 (1990–2015), with UHI increase | Ernest et al. [96] | More evident in developing regions | Long-term planning should include thermal assessment | |
| Building Density and 3D Structure | Strong positive correlation with LST | Building Volume coefficient: 6.654 | Otaghsara and Arefi [87], Santa Rosa | Positive correlation across climate zones | Zoning control improves thermal environment |
| Urban canyon effect | Night-time UHI area (410 km2) exceeds daytime warming zones (176 km2), max increase 5.35 °C | Wang et al. [2], Phoenix | Varies by urban morphology | Design ventilation corridors to prevent heat trapping | |
| Heat island spatial pattern | Concentric patterns decreasing from center to periphery | Kumar et al. [84], Li et al. [82] | Smaller cities show irregular patterns, more local influence | Include urban scale in thermal planning | |
| Vegetation Cover | Negative correlation with LST | Coefficient: −0.77; Natural areas 6.7 °C cooler; Green areas 1.2 °C cooler than impervious | Osei et al. [89], Puche et al. [88], Kumar et al. [84] | Cooling effect across regions and scales | Urban green space is effective UHI mitigation |
| Seasonal variations | Summer cooling, possible winter warming | Zhao et al. [90], Beijing | More seasonal differences in temperate cities | Consider seasonal characteristics in planning | |
| Enhanced during heat waves | Significantly enhanced cooling during summer heat waves | Zoran et al. [91], Bucharest | Global phenomenon with climate variations | Vegetation crucial for extreme heat response | |
| Water Bodies | Significant cooling effect | Lowest LST, less seasonal variation | Su et al. [92], Alhawiti and Mitsova [93] | Cooling extends to surrounding areas | Water system planning improves thermal environment |
| Pattern modification | Cities with water bodies have lower core temperatures | Ambinakudige [85] | Challenges traditional concentric pattern | Water layout can alter thermal patterns | |
| Urban Size and UHI Intensity | Positive correlation | Cities > 500 km2: 4.7 °C UHI; 10–50 km2 cities: 2.5 °C | Zhang et al. [5] | Common global phenomenon | Metropolitan areas need systematic mitigation |
| Area expansion effect | Doubling area increases temperature by 0.7 °C | Li et al. [30] | Found across different regions | Consider growth and thermal changes together | |
| Exceptional cases | “Oasis effect”: desert cities 7.8 °C cooler than surroundings | Fan et al. [86] | Unique to arid regions | Adapt strategies to regional climate | |
| Spatiotemporal Variation | Seasonal variations | Seasonal differences: 4–6 °C; US cities: summer 4.3 °C, winter 1.3 °C | Zeng et al. [95] | More variation in temperate cities; Cold regions: winter UHI > summer | Consider seasonal differences in mitigation |
| Diurnal variations | Night-time UHI area (410 km2) larger than daytime zones (176 km2), max increase 5.35 °C | Wang et al. [2] | Different patterns across regions | Night-time UHI needs special attention | |
| Long-term evolution | UHI strengthens with development; Global UHI growth: 0.156 °C/decade | Yang et al. [81], Li et al. [4] | More intense in rapidly urbanizing areas | Long-term planning should predict thermal changes |
| Mitigation Strategy | Specific Measures | Cooling Effect | Implementation Conditions and Limitations | Socioeconomic Benefits | References |
|---|---|---|---|---|---|
| Vegetation-Based Mitigation Strategies | |||||
| Urban Parks and Green Spaces | Urban parks and green spaces | Urban parks can achieve cooling effects of up to 8.28 °C | Requires sufficient land area; requires good water source conditions; larger green spaces have the best effect | Enhances urban aesthetics and livability; increases recreational space; improves air quality; reduces air conditioning energy consumption | Jha et al. [21] |
| Urban Green Spaces | Urban Forests | 10% increase in forest cover can reduce summer temperature by 0.53 °C and winter by 1.11 °C | Requires large land areas; plant species selection must adapt to local climate; requires long-term maintenance | Carbon sequestration and air purification; increases biodiversity; reduces urban noise pollution | Yao et al. [105] |
| Green Corridors and Riparian Vegetation | Riverside green corridors can achieve cooling effects of up to 2.90 °C; forms urban “cool island” areas; facilitates cold air circulation | Requires planning along water bodies or road systems; needs integration with overall urban planning | Improves urban ventilation conditions; provides ecological corridors; enhances urban flood control capacity | Jiang et al. [100] | |
| Green Roofs | Multi-layer structure systems, including waterproofing layer, drainage layer, filter layer, growing medium, and vegetation | In the study area, can reduce surface temperature by an average of 1.96 °C in summer | Requires assessment of roof load-bearing capacity; needs waterproofing layer and drainage system; requires regular maintenance and irrigation | Extends roof lifespan; increases biodiversity; reduces building energy consumption; rainwater retention and purification | Asadi et al. [33] |
| Material-Based Mitigation Strategies | |||||
| High-Albedo Roofs | Using high-reflectivity coatings or materials (white or light-colored) to increase the ability to reflect sunlight | Research in Abu Dhabi, UAE shows surface temperature reduction of up to 4.5 °C | Suitable for flat roofs or low-slope roofs; requires regular cleaning and maintenance to maintain high reflectivity | Relatively low implementation cost; simple maintenance; reduces air conditioning energy consumption; extends roof service life | Đorđević [34] |
| Permeable Pavements | Using permeable concrete, permeable bricks, or gravel surfaces to increase rainwater infiltration | Research reveals strong positive correlation between impervious surfaces and surface temperature, indicating effective temperature reduction | Suitable for sidewalks, parking lots, and other low-traffic areas; requires regular cleaning to prevent clogging | Reduces urban runoff; replenishes groundwater; reduces urban heat accumulation | Fall et al. [35] |
| Water-Based Mitigation Strategies | |||||
| Urban Water Bodies | Lakes, rivers, ponds, and other natural or artificial water bodies | Areas around water bodies are significantly cooler than other urban areas; forms noticeable cool island effects | Requires adequate water sources; requires regular water quality management | Increases landscape value; provides recreational space; increases air humidity; enhances biodiversity | Ambinakudige (2011) [85], Alhawiti and Mitsova [93] |
| Fountains and Misting Systems | Installing fountains and misting systems in public spaces to increase evaporative cooling | Can cool local areas by 1–3 °C; more pronounced cooling effect in hot weather | Requires water resources and energy supply; implementation is limited in arid regions; suitable for high-density pedestrian areas | Improves microclimate comfort; increases attractiveness of public spaces; increases air humidity | Du et al. [116] |
| Comprehensive Mitigation Strategies | |||||
| Multi-Objective Optimization Strategies | Integrated application of multiple mitigation measures, achieving optimal configuration through intelligent algorithms | Application of AI optimization framework can reduce air temperature by 0.7–0.9 °C; can reduce implementation costs by 22.2–42.2% | Requires precise urban thermal environment models; requires multi-department collaboration | Reduces implementation costs; improves resource utilization efficiency; maximizes cooling effects | Qi et al. [6] |
| Urban Morphology Optimization | Optimizing urban thermal environment through planning building density, height, street width, and other morphological elements | Through combined application of urban forestry, green roofs, and high-albedo surfaces, citywide air temperature can be reduced by 0.4 °C | Applicable to new urban area planning or old city renovation; requires interdisciplinary knowledge | Improves urban ventilation environment; increases urban livability; reduces energy consumption | Rosenzweig et al. [36] |
Disclaimer/Publisher’s Note: The statements, opinions and data contained in all publications are solely those of the individual author(s) and contributor(s) and not of MDPI and/or the editor(s). MDPI and/or the editor(s) disclaim responsibility for any injury to people or property resulting from any ideas, methods, instructions or products referred to in the content. |
© 2025 by the authors. Licensee MDPI, Basel, Switzerland. This article is an open access article distributed under the terms and conditions of the Creative Commons Attribution (CC BY) license (https://creativecommons.org/licenses/by/4.0/).
Share and Cite
Zhao, L.; Fan, X.; Hong, T. Urban Heat Island Effect: Remote Sensing Monitoring and Assessment—Methods, Applications, and Future Directions. Atmosphere 2025, 16, 791. https://doi.org/10.3390/atmos16070791
Zhao L, Fan X, Hong T. Urban Heat Island Effect: Remote Sensing Monitoring and Assessment—Methods, Applications, and Future Directions. Atmosphere. 2025; 16(7):791. https://doi.org/10.3390/atmos16070791
Chicago/Turabian StyleZhao, Lili, Xuncheng Fan, and Tao Hong. 2025. "Urban Heat Island Effect: Remote Sensing Monitoring and Assessment—Methods, Applications, and Future Directions" Atmosphere 16, no. 7: 791. https://doi.org/10.3390/atmos16070791
APA StyleZhao, L., Fan, X., & Hong, T. (2025). Urban Heat Island Effect: Remote Sensing Monitoring and Assessment—Methods, Applications, and Future Directions. Atmosphere, 16(7), 791. https://doi.org/10.3390/atmos16070791