Article

Climate-Driven Dynamics of Landscape Patterns and Carbon Sequestration in Inner Mongolia: A Spatiotemporal Analysis from 2000 to 2020

School of Architecture, Inner Mongolia University of Technology, Hohhot 010051, China
*
Author to whom correspondence should be addressed.
Atmosphere 2025, 16(7), 790; https://doi.org/10.3390/atmos16070790 (registering DOI)
Submission received: 13 February 2025 / Revised: 11 March 2025 / Accepted: 18 March 2025 / Published: 28 June 2025

Abstract

Understanding the interplay between climate change, landscape patterns, and carbon sequestration is critical for sustainable ecosystem management. This study investigates the spatiotemporal evolution of vegetation Net Primary Productivity (NPP) and landscape patterns in Inner Mongolia, China, from 2000 to 2020, and evaluates their implications for carbon sink capacity under climate change. Using remote sensing data, meteorological records, and landscape metrics (CONTAG, SPLIT, IJI), we quantified the relationships between vegetation productivity, landscape connectivity, and fragmentation. Results reveal a northeast-to-southwest gradient in NPP, with high values concentrated in forested regions of the Greater Khingan Range and low values in arid western deserts. Over two decades, NPP increased by 73% in high-productivity zones, driven by rising temperatures and ecological restoration policies. Landscape aggregation (CONTAG) and patch connectivity showed strong positive correlations with NPP, while higher fragmentation values (SPLIT, IJI) negatively impacted carbon sequestration. Climate factors, particularly precipitation variability, emerged as critical drivers of NPP fluctuations, with human activities amplifying regional disparities. We propose targeted strategies—enhancing landscape connectivity, regional differentiation management, and optimizing patch structure—to bolster climate-resilient carbon sinks. These findings underscore the necessity of integrating climate-adaptive landscape planning into regional carbon neutrality frameworks, offering feasible alternatives for mitigating climate impacts in ecologically vulnerable regions.

1. Introduction

Landscape pattern, a key spatial attribute of ecosystems, determines the distribution, connectivity, and interactions of land use and cover types. Research has shown that landscape patterns significantly impact ecosystem carbon cycling processes, including carbon sequestration dynamics and carbon flux [1]. In the context of rapid urbanization and intensified land use, the spatial structure of landscapes (e.g., patch size, shape, and connectivity) profoundly affects ecological processes and functions [2]. Agglomeration landscapes characterized by high connectivity and low fragmentation typically enhance ecosystem stability and significantly increase carbon sequestration potential [3].
Although the impact of landscape patterns on carbon sequestration has been widely studied, the regulatory roles of spatial heterogeneity and scale effects on carbon pool dynamics remain poorly understood. For example, in mountainous ecosystems, the synergistic effects of terrain complexity and biodiversity determine the long-term stability of regional carbon sink functions [4]. In addition, rapid urbanization has dramatically transformed urban underlying surfaces, causing a decline in vegetation cover and intensified landscape fragmentation. These alterations not only reduce carbon sequestration capacity but also increase the uncertainty of regional carbon emissions [5]. Optimizing landscape spatial configuration (such as increasing connectivity and reducing fragmentation) is a key strategy for enhancing carbon sequestration functions [6]. Globally, extreme climate events, including prolonged droughts and rainstorms, are accelerating the fragmentation of forests and agricultural landscapes, further changing the original carbon sequestration model [7].
Net Primary Productivity (NPP), a key indicator of the productivity and carbon sequestration capacity of ecosystems [8], reflects both the carbon fixed by vegetation through photosynthesis and the net carbon gain after respiration [9]. Climate conditions (e.g., precipitation and temperature), vegetation types, and soil properties are important drivers of the spatiotemporal variation in NPP [10,11,12]. In particular, precipitation and temperature are identified as key factors strongly correlated with NPP patterns [8]. Recent studies highlight the growing impact of climate change on global NPP dynamics. Between 2000 and 2009, droughts caused by climate change led to a significant decrease in global terrestrial NPP [8], particularly in arid and semi-arid regions where NPP distribution is closely related to seasonal precipitation and exhibits significant regional heterogeneity [13]. In addition, forest age structure, vegetation coverage, and understory composition influence local NPP variations [14]. From an ecological restoration perspective, optimizing landscape patterns positively impacts NPP. Measures such as afforestation and wetland restoration not only increase regional NPP but also enhance carbon sequestration by improving energy and material flows [15]. Highly connected landscapes exhibit superior NPP recovery compared to fragmented ones, underscoring the importance of landscape structure optimization in carbon management [16].
Complex, multi-scale interactions exist among landscape patterns, NPP, and carbon sequestration. Landscapes with high connectivity and cohesion typically promote carbon sequestration by supporting stable vegetation productivity and ecological interactions [3]. However, excessive fragmentation and edge effects may weaken carbon sink functions, especially in areas with high land use intensity [17]. Landscape structure metrics, such as the maximum patch index (LPI) and patch shape index (LSI), provide important tools for quantifying the impact of landscape patterns on carbon sequestration [18]. Research has found that large, clustered patches typically have higher carbon storage and NPP than small, fragmented patches [19]. In addition, the regulatory role of forest types and management strategies on carbon sequestration potential cannot be ignored. In urban forests, the configuration of tree species significantly influences carbon sequestration, with reduced human interference and optimized patch connectivity identified as effective ways to enhance carbon storage [20].
In ecological restoration, policies improving landscape patterns and enhancing carbon sequestration are becoming increasingly significant. For example, China’s afforestation and farmland-to-forest initiatives over the past two decades have significantly improved regional carbon sequestration capacity [21]. In the forest–grassland transition zones of northern China, increasing patch size and reducing fragmentation are considered important means to improve carbon sequestration [22]. For example, areas with higher tree coverage during the late growing season experience a decrease in net carbon absorption due to increased respiration, a seasonal compensatory effect that significantly affects annual carbon budgets [22]. Meanwhile, ecological restoration policies, such as grassland restoration and afforestation, have been proven to optimize landscape patterns and enhance carbon sequestration capacity [21].
As a typical representative of arid and semi-arid regions, Inner Mongolia features diverse ecosystems, including forests, grasslands, and deserts, making it a unique case study for investigating the spatiotemporal dynamics of landscape patterns, NPP, and carbon sequestration. Over the past two decades, rapid urbanization, overgrazing, and climate change have significantly altered the landscape structure and ecological functions of the region [15], leading to increased spatial heterogeneity in landscape patterns and NPP. However, the mechanisms driving changes in landscape patterns and carbon storage in Inner Mongolia under climate influence remain poorly understood. Thus, the research objectives are to (1) analyze the spatiotemporal changes in NPP and landscape patterns in Inner Mongolia from 2000 to 2020; (2) quantify the relationship between key landscape indicators and NPP; (3) identify landscape indices that promote carbon sequestration efficiency; and (4) propose optimized landscape management strategies aligned with regional and global sustainable development goals.

2. Research Area and Data Sources

2.1. Overview of the Research Area

Inner Mongolia Autonomous Region is located on the northern border of China (37°24′–53°23′ N, 97°12′–126°04′ E), with an extension of about 2400 km from east to west, spanning the Ordos Plateau to the Greater Khingan Range from north to south, covering a total area of about 1.183 million square kilometers and abundant natural resources. The average altitude is 1000 m, with the highest peak being 3556 m on Helan Mountain. The terrain is complex and diverse, mainly consisting of plateaus, mountains, and plains. It belongs to a temperate continental monsoon climate with four distinct seasons. The annual precipitation decreases from southeast to northwest, with an average annual precipitation of 300–400 mm in the eastern region and 100 mm in the western region, mainly concentrated in July and August.

2.2. Data Sources

The data used include land use/cover, meteorological, vegetation type data, and NDVI data (Table 1). From the Geospatial Data Cloud Platform (https://www.gscloud.cn, accessed on 14 October 2023), we obtained three remote sensing images from Landsat TM in 2000 and 2010, and Landsat OLI in 2020, with a spatial resolution of 30 m.
Meteorological data such as temperature and precipitation are sourced from the National Earth System Science Data Center (https://www.geodata.cn, accessed on 12 June 2024). The spatial resolution is 0.0083333° (approximately 1 km). The temperature resolution is 0.5°, and the precipitation resolution is 0.1 mm. The raw data were subjected to a series of preprocessing steps, including data screening, correction, validation, and quality control. To ensure uniformity in spatiotemporal resolution, ArcGIS 10.8 was utilized for format and projection transformations, masking operations, and nearest-neighbor resampling.

2.3. Indicator Selection

Annual datasets for the years 2000, 2010, and 2020 were selected for analysis to avoid errors in monthly remote sensing and meteorological data, which may be affected by precision limitations and extreme climatic conditions. The data include land use types, annual average temperature, vegetation index, and NPP, as well as total annual precipitation. NPP was calculated using the CASA (Carnegie–Ames–Stanford Approach) model.

2.3.1. NPP Calculation of CASA Model

Generally, NPP serves as a key biophysical parameter for quantifying and characterizing carbon storage dynamics within ecosystems. The Carnegie Ames Stanford Approach (CASA) model is a commonly used method for estimating the indicator [23]. The calculation formula is as follows:
NPP ( x , t ) = APRA ( x , t ) × ε ( x , t )
NPP(x, t) represents the NPP of vegetation for pixel x in month t (g C m−2 a−1); APRA(x, t) represents the photosynthetically active radiation absorbed by pixel x in month t (g C m−2 month−1); ε(x, t) represents the actual light energy utilization rate of pixel x in month t (g C MJ−1). Light Use Efficiency (LUE) is a constant that is typically set based on vegetation type and environmental conditions.
APRA ( x , t ) = SOL ( x , t ) × FPAR ( x , t ) × 0.5
SOL is the total solar radiation = sunshine hours×sunshine intensity, FPAR represents the absorption ratio of incident light and effective radiation by the vegetation layer, which has a certain linear relationship with the normalized vegetation index NDVI and the specific vegetation index SR. The constant 0.5 represents the proportion of solar effective radiation that vegetation can utilize from total solar radiation.
FPAR ( x , t ) = NDVI max NDVI min NDVI NDVI min
NDVImax and NDVImin represent the best and worst vegetation cover, i.e., areas with dense vegetation and bare land, respectively.
Based on the Google Earth Engine platform, atmospheric correction, geometric correction, and stripe restoration were performed on NPP, vegetation type, and leaf area index. After calculating the annual average values, the raster images were imported into ArcGIS 10.8 software for reclassification, and the NPP distribution maps of Inner Mongolia in 2000, 2010, and 2020 were obtained.

2.3.2. Calculation of Landscape Pattern Index

After preprocessing, the vectorization of land use/cover in the Inner Mongolia Autonomous Region was obtained, and it was divided into six categories: farmland, forest land, grassland, sandy land, water body, and construction land (Figure 1). The Kappa coefficient was used to evaluate and verify the accuracy of the classified images, and the overall accuracy reached 77%, which is higher than the minimum accuracy requirement. Then, the data were converted to TIFF raster format and imported into Fragstats 4.2 software to calculate the landscape pattern index.
Based on the spatial distribution of vegetation in Inner Mongolia, we preselected indices that have a high impact on patches, including patch density (PD), edge density (ED), patch area ratio (PLAND), shape index (LSI), aggregation index (COHESION), fractal dimension index (PAFRAC), aggregation index (AI), sprawl index (CONTAG), dispersion and parallelism index (IJI), and splitting index (SPLIT). The calculation formulas and ecological significance are shown in Table 2. Due to the high spatial heterogeneity and scale dependence of the blue-green spatial pattern in urban areas [24], it is necessary to select an appropriate moving window scale. After comprehensively considering data availability, computational efficiency, and the geographic scale, this study determined that a grain size of 300 m and a moving window size of 900 m are optimally suited for landscape pattern analysis within the study area.

2.3.3. Construction of Correlation Analysis Dataset

Due to the large scale of the study area, which complicates raster-to-vector conversion, a random point sampling method was adopted to eliminate biases arising from uneven point distribution, thereby enhancing the accuracy of correlation analyses between landscape patterns, climatic variables, and NPP. Using ArcGIS 10.8 to create a fishing net tool, we first established a grid of 300 × 300 m, 600 × 600 m, and 900 × 900 m. Then, we used the random point tool to evenly distribute the grid lines and create 20,000, 40,000, and 60,000 random points, respectively. We extracted the NPP data and landscape pattern indices from the points, and used Origin 2024 and MATLAB R2022b to perform Pearson correlation analysis on the resulting data. The results show that 40,000 points are the most significant (p < 0.05), while 60,000 points have overfitting. Therefore, this study used a 600 m resolution sample plot.

3. Results

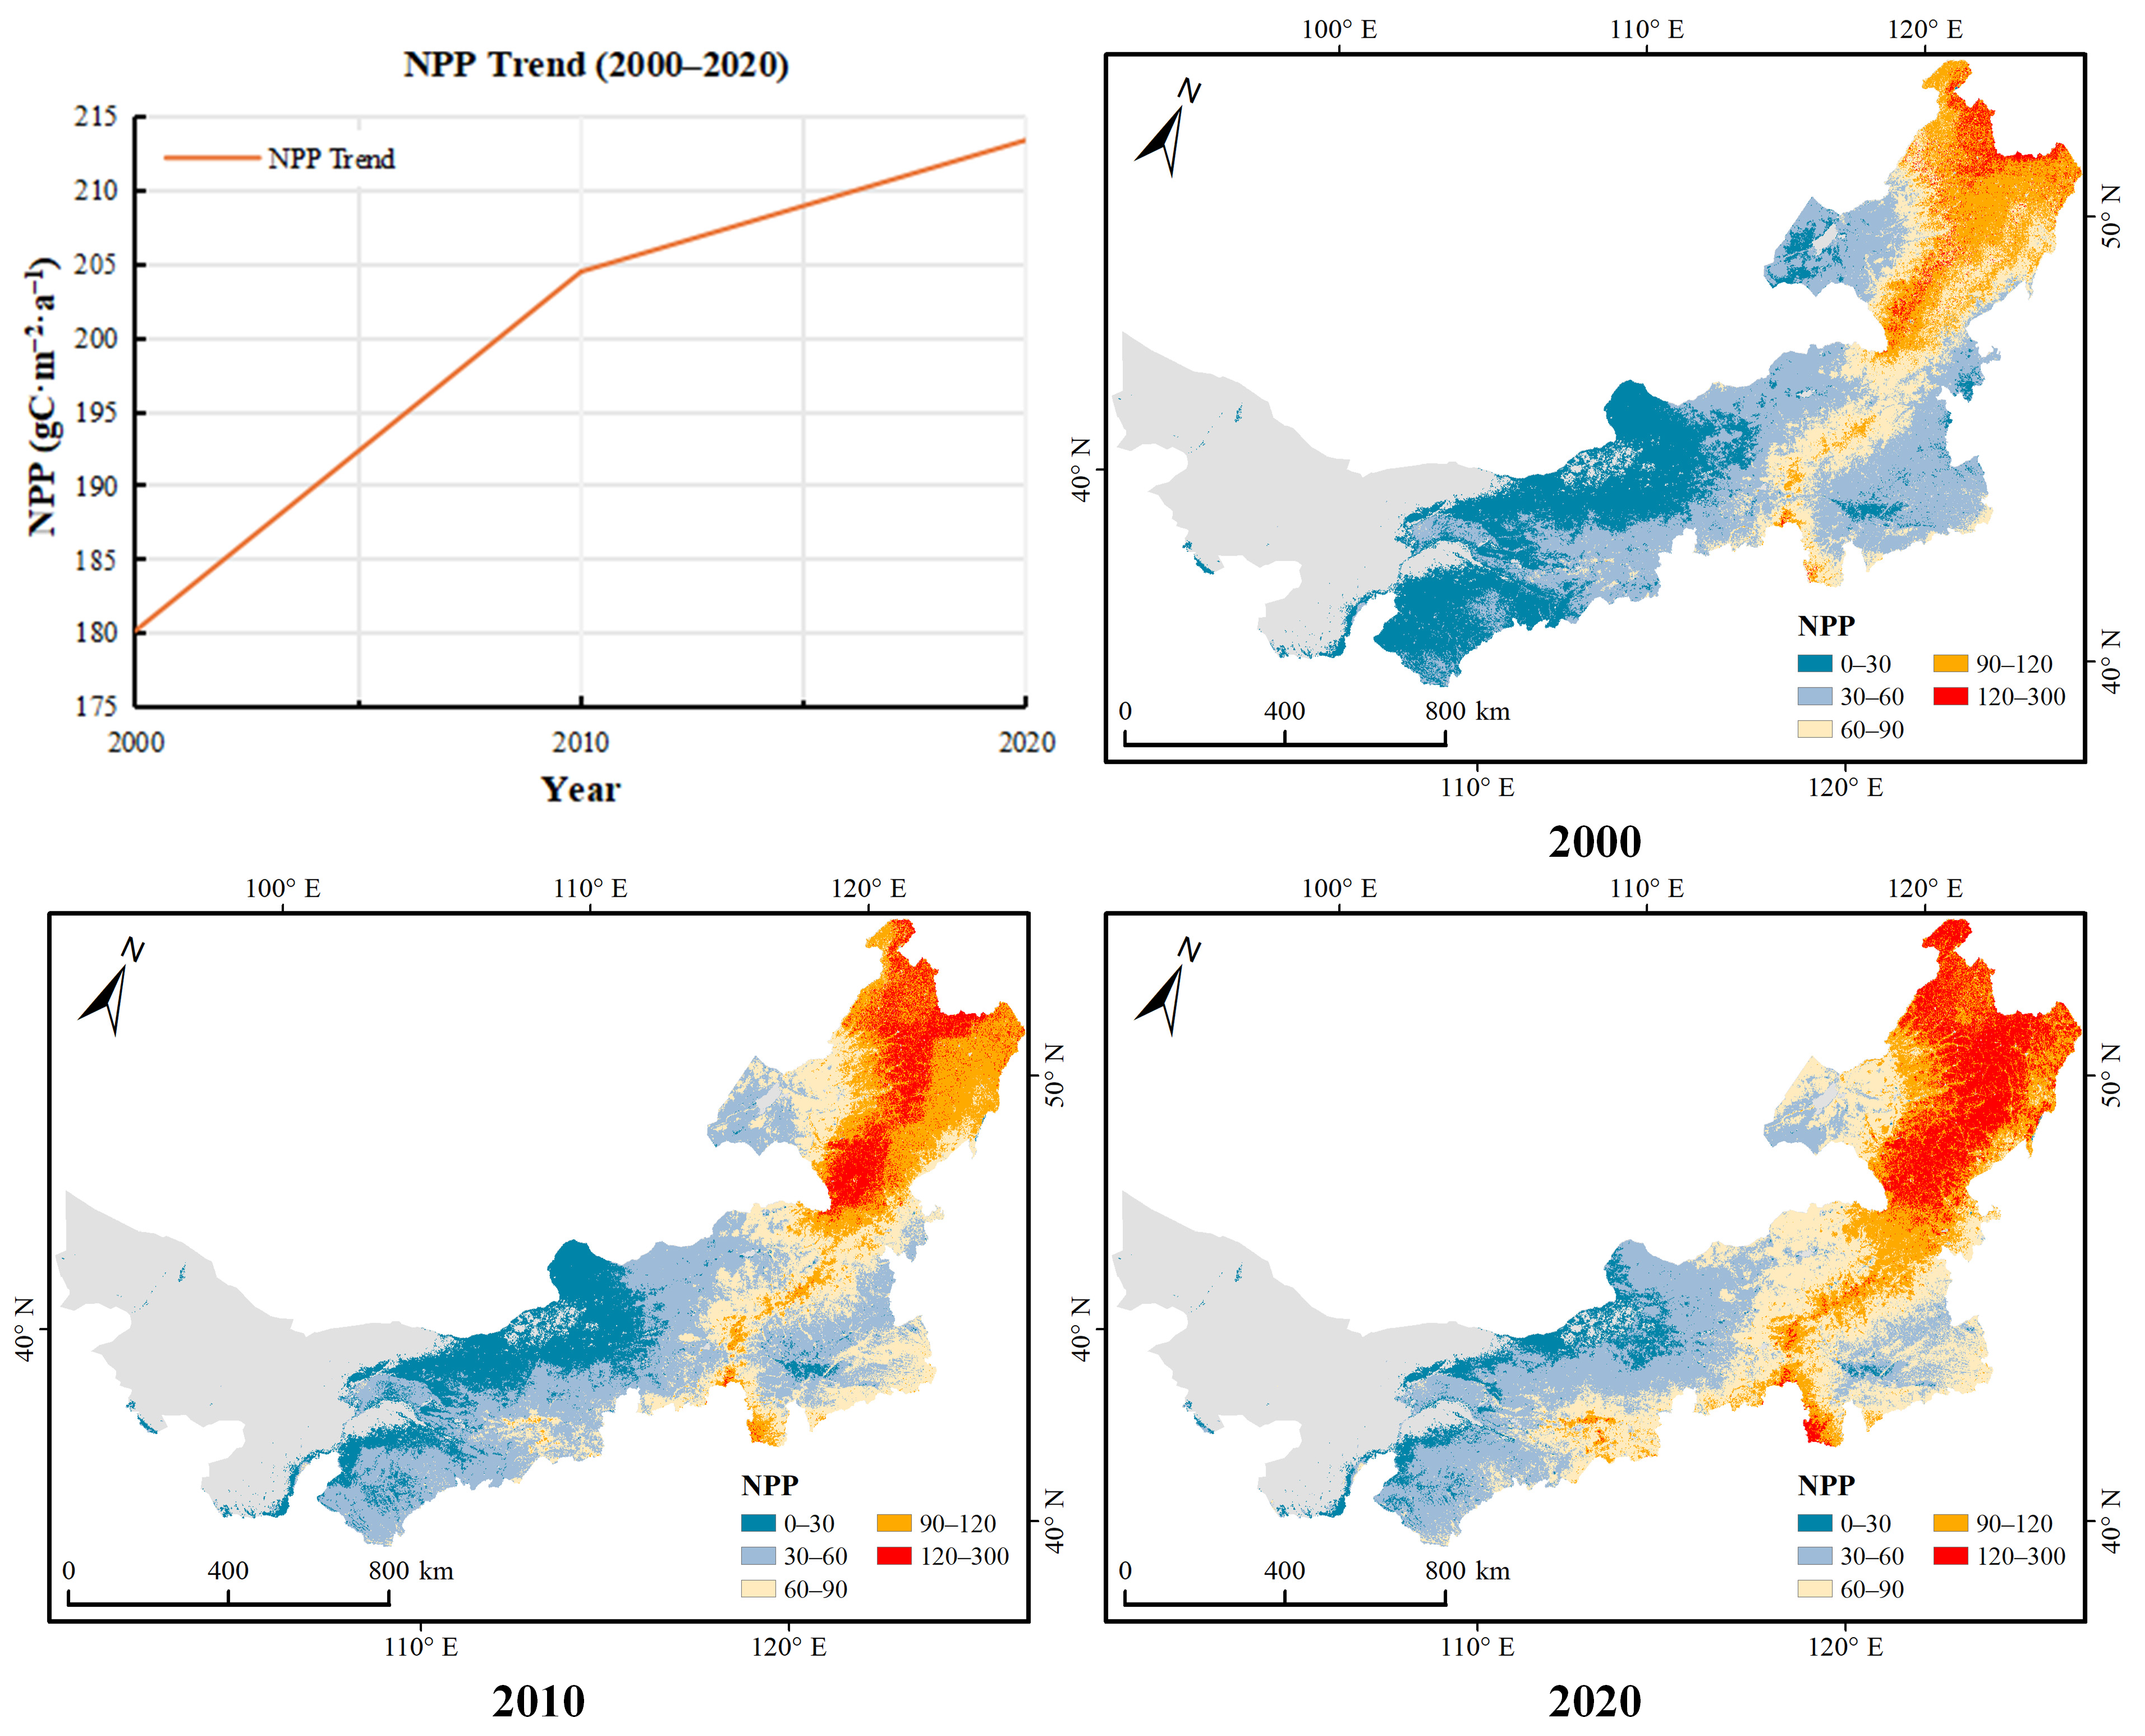
3.1. Spatiotemporal Evolution of Vegetation NPP

The overall trend of NPP in the Inner Mongolia Autonomous Region decreases from northeast to southwest to east to west, as shown in Figure 2. The vegetation NPP in the study area is divided into low 0–30 gC m−2·a−1, low 30–60 gC m−2·a−1, medium 60–90 gC m−2·a−1, high 90–120 gC m−2·a−1, and high 120–300 gC m−2·a−1. The high-value areas are mainly distributed in mountainous areas such as the Greater Khingan Range in the northeast, with the largest proportion of forest land. In some areas, the NPP value exceeds 250 gC m−2·a−1. The low-value areas are mainly distributed in the western Ordos Plateau and sandy areas of Alxa. The terrain in this area is rugged, and the main vegetation includes windproof and sand-resistant plants and cultivated crops. The NPP value tends to 0, and the median area is located in the central part of Inner Mongolia, mainly consisting of grassland and cultivated land. There are significant differences in NPP values among different vegetation types. When analyzed based on vegetation ecosystem types, the trend of NPP changes among different vegetation types is forest > grassland > cultivated land > others.
From a time scale perspective, there was an upward trend from 2000 to 2020. The high-value areas increased threefold from 2000 to 2010, and grew by 73% from 2010 to 2020, but overall, they remained below 300 gC m−2·a−1. From this, it can be seen that the future trend of vegetation NPP changes in most regions is not significant. Overall, the NPP in the western region will show weak positive persistence, while the vegetation NPP in the eastern region will show strong positive persistence.

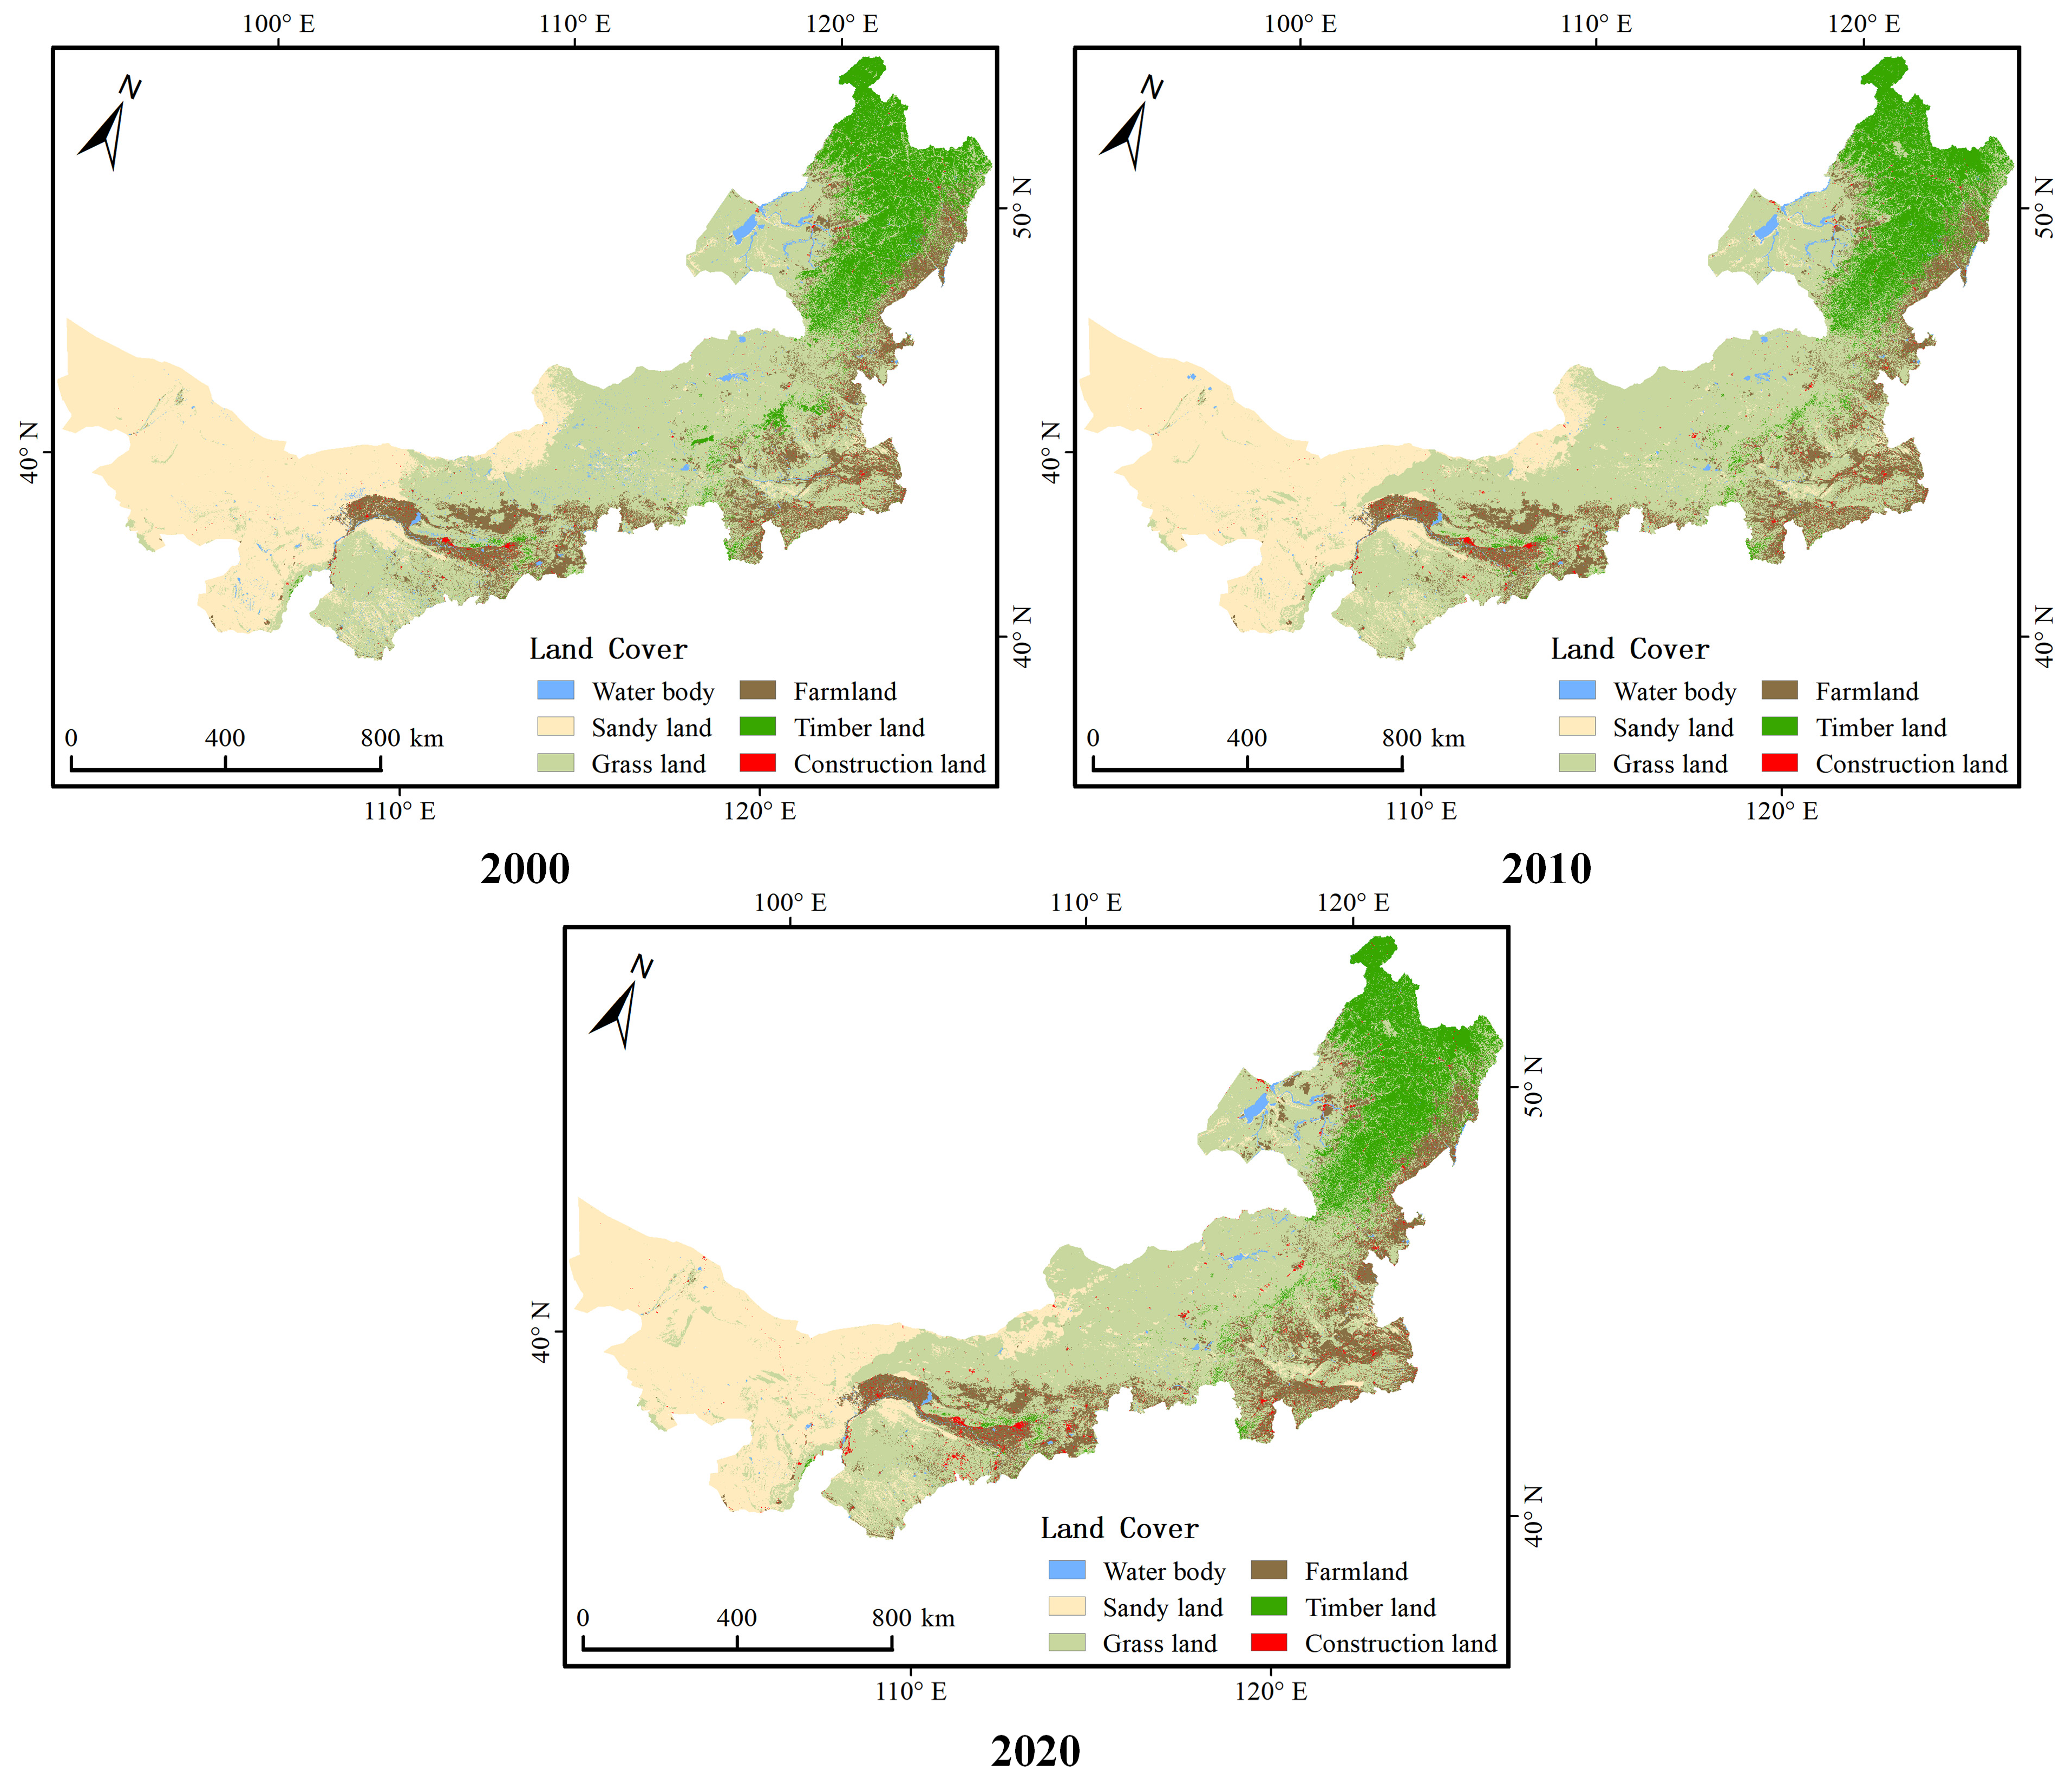
3.2. Changes in Landscape Patterns

The landscape index is calculated on a 100 km grid scale, and Table 3 lists the average values of each index on a 900 m grid scale for the years 2000, 2010, and 2020. From the table, it can be seen that the landscape level index CONTAG shows an upward trend, rising from 49.52 in 2000 to 53.73 in 2020, indicating that the similarity between different patches has been increasing year by year. The IJI decreased from 63.05 in 2000 to 54.73 in 2020, indicating a decrease in overall dispersion and juxtaposition, suggesting an improvement in the distribution of ecosystems severely constrained by certain natural conditions among land use types. Other indices show no significant upward or downward trends, indicating that Inner Mongolia has the highest degree of ecological fragmentation, and on the other hand, the overall landscape pattern is highly complex, with landscape richness and diversity increasing over time.
Analyzing the changes in landscape indices of six types of land use, NPP mainly depends on plants. Therefore, forest land, grassland, and cultivated land were selected as the main components for horizontal feature analysis, as shown in Table 4. In the forest, both NP and TE show an upward trend, while IJI shows a downward trend. This indicates an increase in the fragmentation of forest patches and a decrease in connectivity between patches. The NP and TE of grassland showed an increasing and then decreasing trend, while IJI showed both increasing and decreasing trends. Since 2000, the grassland area has decreased, the degree of its fragmentation has increased, and the connectivity of grassland patches has gradually decreased; the NP, TE, and IJI of cultivated land are inversely proportional to each other, with a relatively low degree of increase or decrease. The degree of fragmentation of the cultivated land landscape has decreased, and the connectivity between patches has improved. There are more patches in farmland and forest land, while the connectivity index percentage of grassland is relatively high. This is related to the area of their respective land use types, with a predominance of grassland over forest and farmland, demonstrating better connectivity. PLAND remains relatively stable, indicating the proportion of a certain type of patch in the total landscape area, which determines important factors such as biodiversity, dominant species, and quantity in the landscape. Therefore, overall, cultivated land and forest patches in the study area became more fragmented during the 20-year period, while grassland fragmentation fluctuated greatly and had high connectivity.

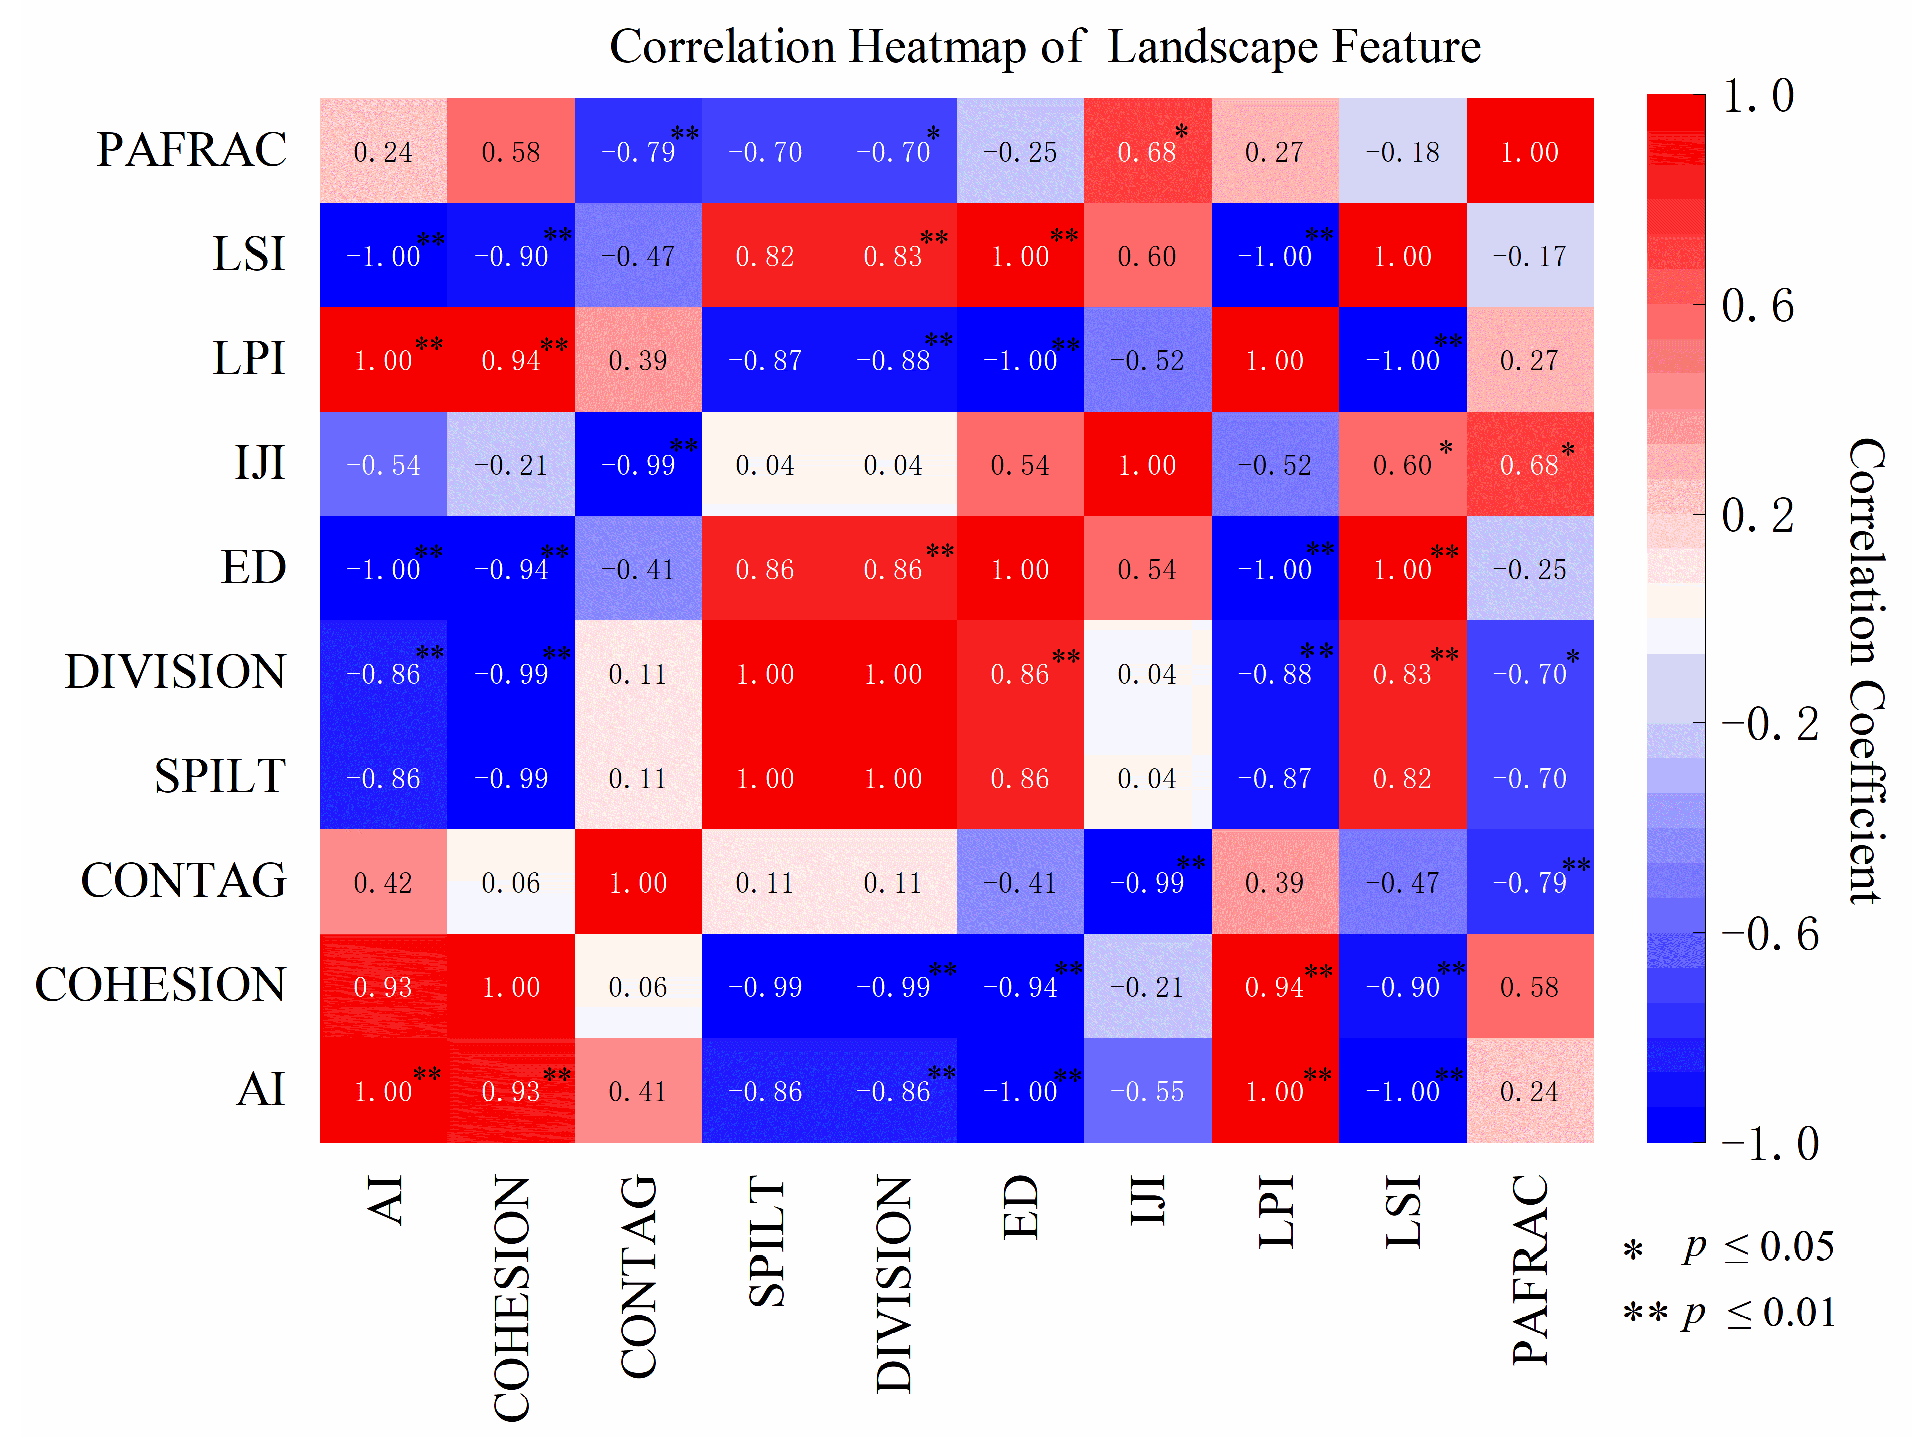
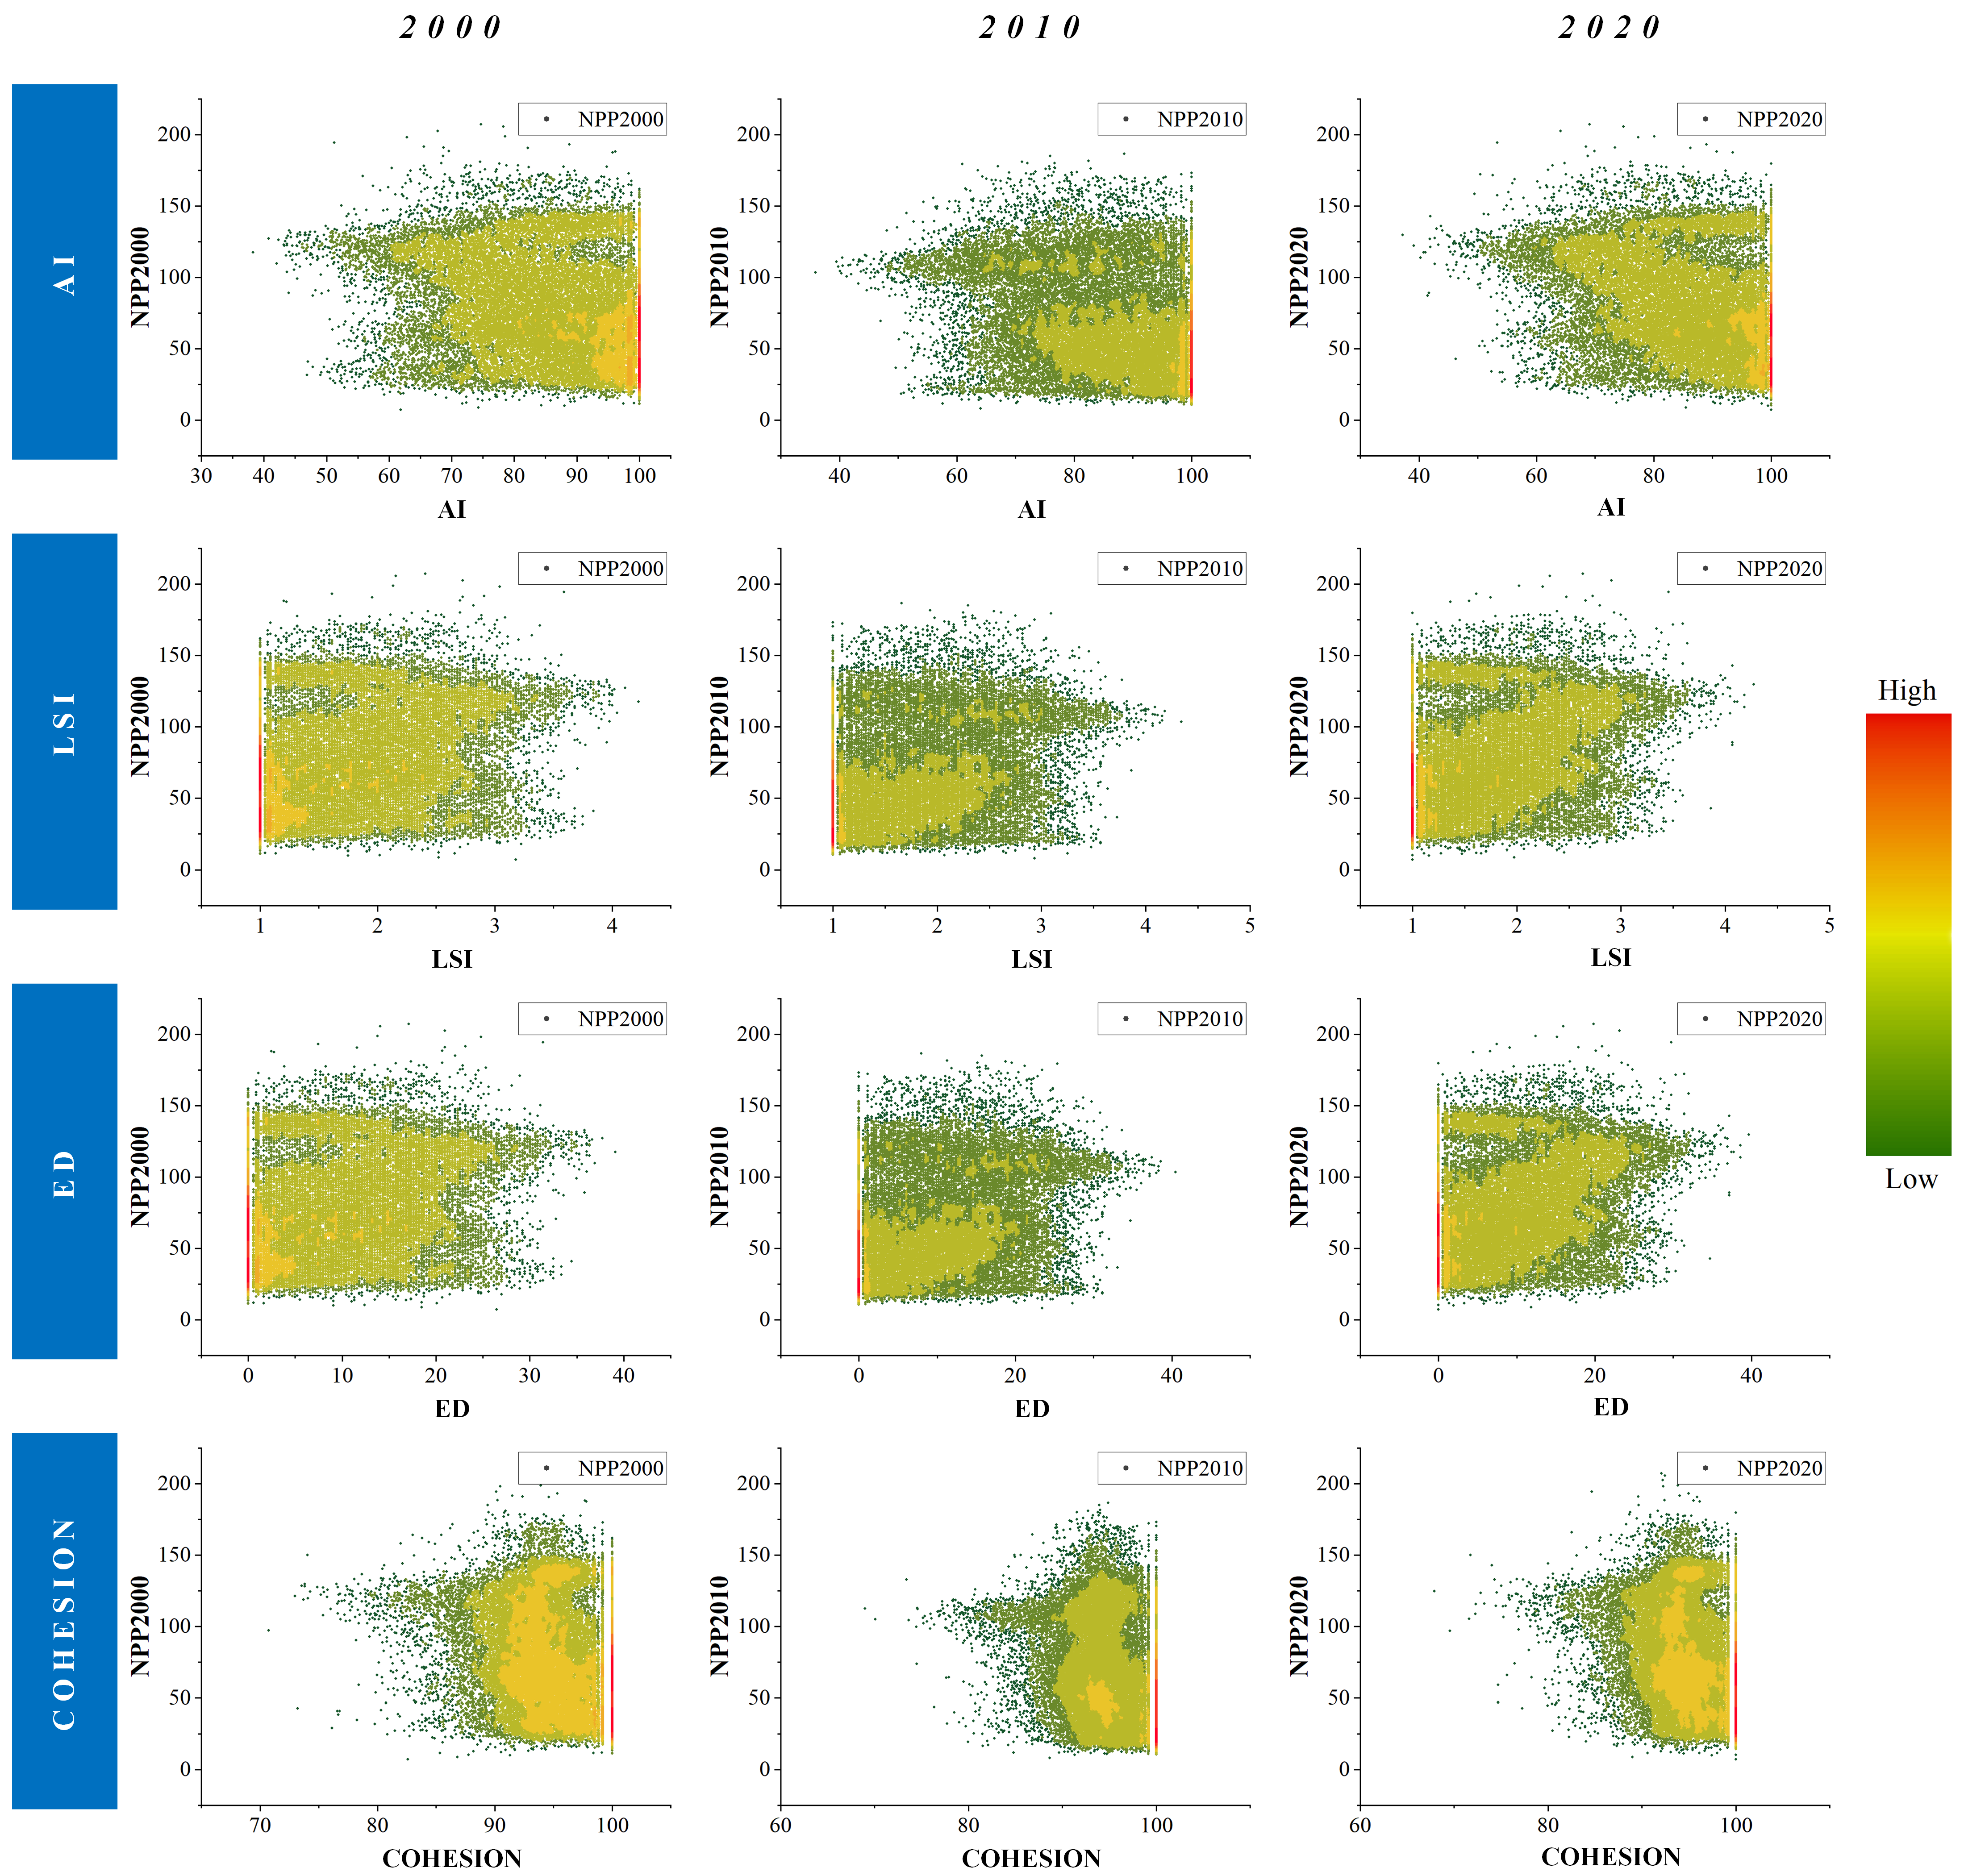
3.3. Correlation Analysis Between Landscape Pattern and NPP

As shown in Figure 3, the impact trend of patch layer indicators on NPP is basically similar. CONTAG, AI, and LPI are positively correlated with NPP, with CONTAG showing a highly significant positive correlation with NPP, indicating that the higher the degree of aggregation or extension trend of different land use patches in the landscape, the better the vegetation growth status. SPLIT, ED, IJI, LSI, which characterize the shape of patches, are negatively correlated with NPP, with SPLIT, IJI, and LSI showing a highly significant negative correlation, that is, the more complete and regular the shape of patches, the more frequent the exchange of material and energy information between patches, the better the vegetation growth condition, and the more favorable it is for plant growth.
Figure 4 shows that the landscape-level metrics SPLIT, CONTAG, and IJI show significant correlations with NPP. SPLIT and IJI represent the separation and dispersion of landscape patches, both of which are strongly negatively correlated with NPP. This indicates that the more dispersed the patches are in space, the lower the carbon sequestration capacity. On the other hand, CONTAG shows a negative correlation with NPP, where lower CONTAG values indicate lower landscape fragmentation and higher patch connectivity, which helps enhance carbon sequestration. However, as patch fragmentation increases and surpasses a certain threshold, even with higher vegetation cover, carbon storage may not be effectively promoted. In contrast, the largest patch index (LPI), which represents the proportion of the landscape covered by the largest patch, shows a positive correlation with NPP. The larger the LPI value, the larger the area of the largest patch, which favors increased carbon sequestration. The scatter plots show a wide range of LPI values, corresponding to a large variation in NPP values, indicating that LPI has a significant impact on carbon storage. Overall, higher landscape connectivity and lower fragmentation levels contribute to increased carbon sequestration, while excessive landscape fragmentation weakens this positive effect.
Figure 5 shows a positive correlation between ED and NPP, indicating that the more complex the landscape pattern, the better the carbon sequestration effect. ED represents the length of the edge of a landscape per unit area, directly reflecting the complexity of the patch edge; AI characterizes the spatial clustering degree of a certain type of landscape patch and neighborhood relationships. Landscape patches with low AI values have a high level of fragmentation, while large-value landscape patches have a good degree of connectivity within them. There is a significant positive correlation with NPP. When the AI value is between 60 and 70, NPP significantly increases. The reason is that the area within this range in the study area is mainly grassland and forest land, and the boundaries of forest and grassland are not clear, which also leads to a certain fluctuation in its relationship with NPP. COHESION represents the connectivity in spatial distribution, but its positive and negative relationships with NPP are not clear, indicating that the connectivity between patches shows a low correlation with NPP.

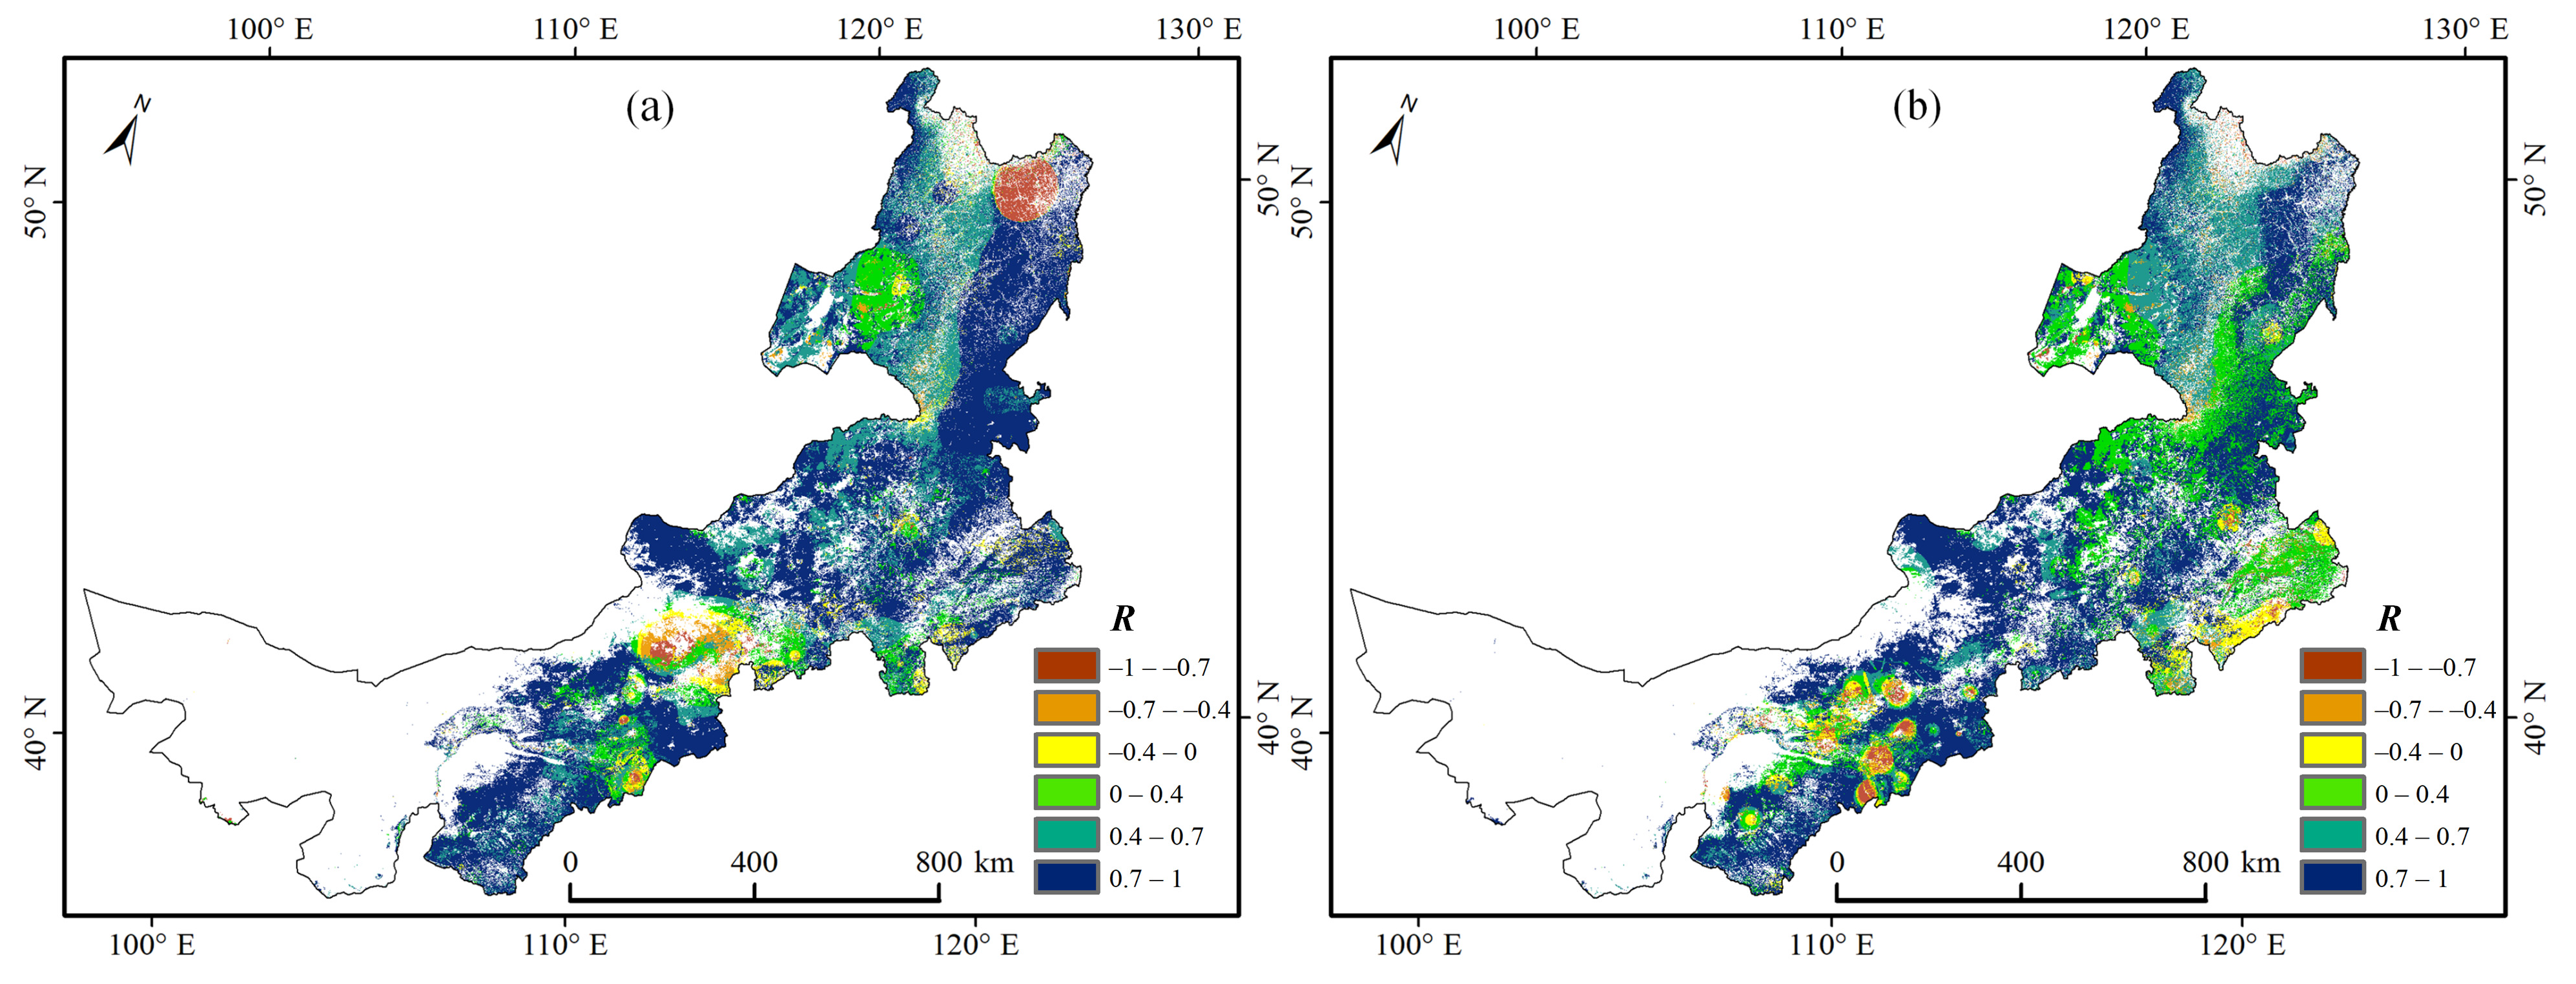
3.4. Correlation Analysis Between Climatic Variables and NPP

To quantify the linear relationships between temperature, precipitation, and NPP, Pearson correlation coefficients were calculated. The correlations were stratified into three levels using threshold values of |R| = 0.4 and |R| = 0.7: low linear correlation, significant linear correlation, and high linear correlation (Figure 6). As depicted in Figure 6, NPP demonstrates a predominantly positive correlation with both temperature and precipitation, encompassing 91.51% and 91.62% of the study area, respectively. At the pixel scale, the correlation coefficient between NPP and precipitation (0.66) slightly exceeds that between NPP and temperature (0.6).
Spatially, Figure 6a shows that regions characterized by a highly linear positive correlation between precipitation and NPP are distributed in “belt” and “patch” configurations, mainly situated in the southern, central, and eastern sectors of the study area. Significant linear positive correlations are interspersed with highly linear positive correlations, with concentrations in central and western Hailar, parts of central Xilinhaote, and the border zones of Tongliao, Ulanhot, and Chifeng. Highly linear negative correlations between precipitation and NPP are localized in northern Hailar and the border regions of Jining and Xilinhaote, while significant linear negative correlations are observed in northeastern Jining and southwestern Xilinhaote.
As shown in Figure 6b, the correlation between temperature and NPP exhibits distinct spatial clustering, particularly for regions with highly linear positive correlations, which are mostly clustered in northern Baotou, central and northern Linate, central and southern Jining and Dongsheng, and northeastern Hailar. Significant linear positive correlations are primarily distributed in Hailar, whereas highly linear negative correlations are confined to small areas in Hohhot and Jining. Significant linear negative correlations are also minimal in extent.

4. Discussion

4.1. Factors Driving the Spatiotemporal Changes in NPP

This study found that the spatiotemporal changes in the NPP of vegetation in Inner Mongolia are driven by multiple factors such as climate change, human activities, and regional differences. Previous studies showed that climate change directly affects the increase in NPP through spatial differences in temperature and precipitation [8,22]. The rapid growth of NPP in areas with abundant precipitation indicates that water supply is the main factor limiting plant growth, while temperature changes have a more significant impact in the cold temperate coniferous forest area [9,25]. In recent years, the frequent occurrence of extreme climate events such as drought and extreme precipitation has had a profound impact on the short-term fluctuations of NPP [26,27].
Human activities, especially alterations in land use and land cover patterns, can exert significant impacts on NPP [8,22]. In some cases, these anthropogenic influences may even surpass the effects of climate change in shaping NPP dynamics [22]. In China, positive national policy interventions such as returning farmland to forests and grassland restoration have significantly increased vegetation coverage and thus improved NPP. In this research, regions with high NPP values were predominantly observed in the eastern areas characterized by extensive forest coverage, largely attributable to effective national environmental policies. However, due to natural conditions such as drought and poor soil, progress in ecological restoration in some regions is relatively slow, indicating that the effectiveness of human activities is largely constrained by regional environmental conditions [28]. In addition, rapid urbanization and land use changes may lead to a decrease in NPP in certain regions, especially when farmland is converted to construction land, resulting in a significant reduction in plant community productivity and carbon sequestration capacity [29].
Regional differences in NPP are closely reflected in the diversity of land use patterns, such as relatively small fluctuations in NPP in forest and grassland systems, while farmland exhibits higher spatiotemporal variability due to the influence of tillage and fertilization [30]. A particularly illustrative case is the accelerated NPP growth in croplands within China’s karst regions, a trend not mirrored in other land cover types [22]. In this research, the strong positive sustainability of NPP in the eastern region in Inner Mongolia indicates that the ecosystem in this area has greater potential for improvement; however, the trend in NPP in the western region is relatively stable, with spatial variations in NPP likely modulated by landscape heterogeneity [15].

4.2. Impact of Landscape Pattern on Carbon Sequestration Capacity

This study suggests that highly aggregated landscapes (such as those with high CONTAG values) can enhance the coherence and connectivity between landscape types, promote material and energy flow, and thus increase regional NPP levels [15]. In addition, concentrated land use patches can significantly enhance vegetation’s carbon sequestration capacity [15,31]. For example, under the same total area, high-density urban green spaces are cooler than fragmented green spaces, and their NPP levels are significantly higher [32]. In contrast, landscape fragmentation (such as high SPLIT values and low IJI values) limits the connections between ecological patches and weakens the flow of matter and energy within the region. This obstacle not only reduces vegetation NPP but also indirectly affects carbon sequestration capacity. This study points out that the negative effects of fragmentation mainly manifest in the blockage of ecological corridors and the damage to the microenvironment, which puts greater environmental pressure on vegetation photosynthesis and growth [33,34].
The impact of patch size on NPP exhibits nonlinear characteristics. This study indicates that a larger proportion of maximum patches (with higher LPI values) significantly increases regional NPP levels, but patches of different land use types, even with similar areas, still exhibit significant differences in carbon sequestration capacity. For example, the NPP of forest patches is usually higher than that of grasslands or cultivated land, indicating that land cover area and landscape composition play a significant role in determining NPP across agricultural, forest, and grassland ecosystems [15]. In addition, the differences in plant species and community structure among different patch types can lead to different manifestations of NPP in patches [35]. Edge complexity (high ED value) shows positive effects in grasslands and forests, helping to enhance biodiversity and ecological activity, thereby increasing NPP levels. However, our findings show that in cultivated land areas, the improvement of connectivity and the reduction in fragmentation are more crucial for the stable growth of NPP. Contrastingly, a study highlighted that ED (edge density) exhibits a significantly stronger effect on built-up areas and unused lands [15]. This difference indicates that the interaction between edge effects and land use types is crucial for understanding the patterns of NPP changes [36].

4.3. Applicability of NPP as a Carbon Sequestration Capacity Indicator

NPP is an important indicator for evaluating ecosystem productivity and carbon absorption capacity, and its trend can reflect fluctuations in ecosystem functions. The indicator directly characterizes the ability of plant communities to fix atmospheric carbon dioxide through photosynthesis as carbon sinks [37]. However, NPP only reflects the carbon fixation capacity of vegetation layers and fails to cover key carbon cycling processes such as soil carbon pool changes, litter decomposition, and soil respiration [38]. In addition, gross primary productivity (GPP) can also quantify the total amount of photosynthetic products or organic carbon fixed by plants through photosynthesis per unit time [39]. However, in comparison, NPP more directly reflects the actual carbon storage capacity of ecosystems, their sensitivity to environmental changes, and the practicality of data acquisition.
Carbon sequestration capacity involves not only the accumulation of fixed carbon but also the re-release of carbon. Some ecosystems with high NPP in the short term, such as farmland, may have lower actual carbon sequestration benefits than expected due to high respiration and decomposition rates [40]. In addition, the NPP of different vegetation types may be differentially affected by climate change. For example, the NPP of alpine grassland systems exhibits higher sensitivity to short-term climate fluctuations, while forest ecosystems have stronger stability and adaptability [41]. Therefore, relying solely on NPP to evaluate carbon sequestration capacity may lead to bias. This study suggests that in future research on carbon sequestration capacity, measurement methods for NPP, soil carbon pool, and other carbon cycling processes should be further integrated to comprehensively evaluate the carbon sequestration capacity of ecosystems [42].

4.4. Implications for Management

To enhance the carbon sequestration capacity of Inner Mongolia, this study proposes the following management suggestions based on the analysis of landscape patterns and ecosystem functions:
1.
Enhancing landscape connectivity
Landscape connectivity is crucial for regional carbon sequestration capacity. Reducing landscape fragmentation (lowering SPLIT values and increasing IJI values) and constructing ecological corridors can effectively improve the connections between patches and promote the flow of matter and energy. This strategy is not only applicable to forests and grasslands but also to urban green space systems, achieving dual benefits of carbon sequestration and regional climate regulation by optimizing green space layout [32,33]. Especially in the central and western regions, priority should be given to repairing severely fragmented ecological patches and incorporating isolated landscape units into the ecological network to enhance overall regional connectivity [36].
2.
Regionally differentiated management
Differentiated management strategies should be adopted based on the different natural conditions and NPP distribution in the eastern and central western regions in the study area. In the high-value areas of the eastern region, the focus is on maintaining the stability of the existing ecosystem and further improving vegetation coverage through moderate policies of returning farmland to forests and grasslands. In the central and western regions, due to limitations in water and soil conditions, priority should be given to restoring vegetation types with strong drought tolerance, such as desert shrubs and drought-tolerant herbaceous plants, and improving the suitability of vegetation growth environment through micro water collection technology and soil improvement measures [26,34]. Especially for arid and nutrient-deficient regions exhibiting slow ecological recovery [23], water resource allocation and drought prevention measures should be tailored based on the dynamic response of NPP to climate change. Moreover, promoting the cultivation of stress-resistant tree and grass species in vulnerable areas is essential for bolstering the climate adaptability of ecosystems [37].
3.
Optimizing patch size and spatial structure
Patch layout should be optimized for different land use types to enhance ecosystem functionality. Specifically, large patches should be concentrated as much as possible and maintain good connectivity with the surrounding landscape, while small patches should enhance the overall carbon sequestration capacity of the ecosystem through landscape integration or optimization of edge complexity [35]. For example, in farmland areas, it is recommended to promote agricultural landscape diversification measures (such as vegetation restoration on embankments and ecological buffer zone construction) to reduce the impact of agricultural production on landscape fragmentation and enhance farmland carbon sequestration capacity.

5. Conclusions

From 2000 to 2020, vegetation NPP in Inner Mongolia showed an overall upward trend, with a significant increase in high-value areas, especially a 73% growth between 2010 and 2020. However, the overall NPP has not exceeded 300 gC m−2·a−1. Spatially, the NPP shows a gradually decreasing trend from northeast to southwest. The high-value areas are concentrated in the Greater Khingan Range region in the northeast, dominated by forests, while the low-value areas are located in the western Ordos Plateau and Alxa Desert, characterized by sandy land and cultivated lands. Grassland and cultivated lands in the central region show moderate NPP levels. The warming and humidification trend in climate has led to an increase in NPP. Moreover, enhanced landscape connectivity and the aggregation of patches have further driven NPP growth, resulting in improved carbon sequestration. Conversely, increased inter-patch distances and intensified landscape fragmentation have been identified as factors that compromise carbon sequestration potential. Additionally, the spatial complexity of transitional zones between grasslands and forests has been found to positively contribute to NPP dynamics. These findings provide novel insights into the climate-mediated interactions between Inner Mongolia’s landscape patterns and carbon sequestration, offering a scientific basis for achieving regional carbon neutrality goals.

Author Contributions

Conceptualization, Q.X. and J.R.; methodology, Q.X.; validation, Q.X. and J.R.; formal analysis, J.R.; writing—review and editing, Q.X.; visualization, J.R.; supervision, J.R.; funding acquisition, J.R. All authors have read and agreed to the published version of the manuscript.

Funding

This research was supported by the 2025 Inner Mongolia University of Technology “College Students’ Innovation and Entrepreneurship Training Program”: Research on the Suitability and Application of Landscape Ecological Environment in Semi-Arid Regions (S202510128026).

Data Availability Statement

Data will be made available on request.

Acknowledgments

The authors would like to appreciate the editors and the reviewers for their valuable comments on this paper.

Conflicts of Interest

The authors declare that they have no known competing financial interests or personal relationships that could have appeared to influence the work reported in this paper.

References

  1. Lafortezza, R.; Sanesi, G.; Chen, J.Q.; Crow, T.R. Patterns and Processes in Forest Landscapes: Multiple Use and Sustainable Management; Springer: Dordrecht, The Netherlands, 2008; pp. 210–217. [Google Scholar] [CrossRef]
  2. Foley, J.A.; DeFries, R.; Asner, G.P.; Barford, C.; Bonan, G.; Carpenter, S.R.; Chapin, F.S.; Coe, M.T.; Daily, G.C.; Gibbs, H.K.; et al. Global consequences of land use. Science 2005, 309, 570–574. [Google Scholar] [CrossRef] [PubMed]
  3. Liu, J.; Wilson, M.; Hu, G.; Liu, J.; Wu, J.; Yu, M. How does habitat fragmentation affect the biodiversity and ecosystem functioning relationship? Landsc. Ecol. 2018, 33, 341–352. [Google Scholar] [CrossRef]
  4. Xu, Q.; Dong, Y.X.; Yang, R. Influence of the geographic proximity of city features on the spatial variation of urban carbon sinks: A case study on the Pearl River Delta. Environ. Pollut. 2018, 243, 354–363. [Google Scholar] [CrossRef]
  5. Xu, Q.; Dong, Y.X.; Yang, R. Influence of different geographical factors on carbon sink functions in the Pearl River Delta. Sci. Rep. 2017, 7, 110. [Google Scholar] [CrossRef]
  6. Wan, Y.S.; Wang, Y.L.; Gao, M.; Jin, L. An empirical assessment of whether urban green ecological networks have the capacity to store higher levels of carbon. Sci. Rep. 2024, 14, 3132. [Google Scholar] [CrossRef]
  7. Shi, N.; Yu, Y.; Liang, S.; Ren, Y.; Liu, M. Effects of urban green spaces landscape pattern on carbon sink among urban ecological function areas at the appropriate scale: A case study in Xi’an. Ecol. Indic. 2024, 158, 112345. [Google Scholar] [CrossRef]
  8. Wang, W.J.; Wang, Y.B.; Zhai, S.Y.; Xia, H.M.; Wang, D.; Song, H.Q. Climate change driven by LUCC reduced NPP in the Yellow River Basin, China. Glob. Planet. Chang. 2024, 242, 104586. [Google Scholar] [CrossRef]
  9. Zhao, M.S.; Running, S.W. Drought-induced reduction in global terrestrial net primary production from 2000 through 2009. Science 2010, 329, 940–943. [Google Scholar] [CrossRef]
  10. Nemani, R.R.; Keeling, C.D.; Hashimoto, H.; Jolly, W.M.; Piper, S.C.; Tucker, C.J.; Myneni, R.B.; Running, S.W. Climate-driven increases in global terrestrial net primary production from 1982 to 1999. Science 2003, 300, 1560–1563. [Google Scholar] [CrossRef]
  11. Lü, Y.; Fu, B.; Feng, X.; Zeng, Y.; Liu, Y.; Chang, R.; Sun, G.; Wu, B. A policy-driven large scale ecological restoration: Quantifying ecosystem services changes in the Loess Plateau of China. PLoS ONE 2017, 7, e31782. [Google Scholar] [CrossRef]
  12. Feng, X.; Fu, B.; Piao, S.; Wang, S.; Ciais, P.; Zeng, Z.; Lü, Y.; Zeng, Y. Revegetation in China’s Loess Plateau is approaching sustainable water resource limits. Nat. Clim. Chang. 2021, 6, 1019–1022. [Google Scholar] [CrossRef]
  13. Yue, C.; Xu, M.; Ciais, P.; Tao, S.; Shen, H.; Chang, J.; Li, W.; Deng, L.; He, J.; Leng, Y.; et al. Contributions of ecological restoration policies to China’s land carbon balance. Nat. Commun. 2024, 15, 9708. [Google Scholar] [CrossRef] [PubMed]
  14. Soliveres, S.; Van Der Plas, F.; Manning, P.; Prati, D.; Gossner, M.M.; Renner, S.C.; Alt, F.; Arndt, H.; Baumgartner, V.; Binkenstein, J.; et al. Biodiversity at multiple trophic levels is needed for ecosystem multifunctionality. Nat. Int. Wkly. J. Sci. 2016, 536, 456–459. [Google Scholar] [CrossRef]
  15. Zhou, Y.Y.; Yue, D.X.; Guo, J.J.; Chen, G.G.; Wang, D. Spatial correlations between landscape patterns and net primary productivity: A case study of the Shule River Basin, China. Ecol. Indic. 2021, 130, 108067. [Google Scholar] [CrossRef]
  16. Zhao, M.S.; Running, S.W. Response to Comments on “Drought-Induced Reduction in Global Terrestrial Net Primary Pro-duction from 2000 Through 2009”. Science 2011, 333, 1093. [Google Scholar] [CrossRef]
  17. Shao, M.; Wu, L.F.; Li, F.Z.; Lin, C.S. Spatiotemporal Dynamics of Ecosystem Services and the Driving Factors in Urban Ag-glomerations: Evidence From 12 National Urban Agglomerations in China. Front. Ecol. Evol. 2022, 10, 804969. [Google Scholar] [CrossRef]
  18. Chang, X.Q.; Xing, Y.Q.; Wang, J.Q.; Yang, H.; Gong, W.S. Effects of land use and cover change (LUCC) on terrestrial carbon stocks in China between 2000 and 2018. Resour. Conserv. Recycl. 2022, 182, 106333. [Google Scholar] [CrossRef]
  19. Wu, C.; Yang, Y.; Yue, T. Review of the Current Status and Development Trend of Global Forest Carbon Storage Research Based on Bibliometrics. Forests 2024, 15, 1498. [Google Scholar] [CrossRef]
  20. Yuan, D.B.; Zhang, L.Y.; Fan, Y.Q.; Yang, R.X. Investigating spatio-temporal variations and contributing factors of land use-related carbon emissions in the Beijing-Tianjin-Hebei Region, China. Sci. Rep. 2024, 14, 18976. [Google Scholar] [CrossRef]
  21. Dong, L.L. Spatio-temporal evolution and prediction of carbon balance in the Yellow River Basin and zoning for low-carbon economic development. Sci. Rep. 2024, 14, 14385. [Google Scholar] [CrossRef]
  22. Ma, B.X.; Jing, J.L.; Liu, B.; Xu, Y.; Dou, S.Q.; He, H.C. Quantitative assessment of the relative contributions of climate change and human activities to NPP changes in the Southwest Karst area of China. Environ. Sci. Pollut. Res. 2022, 29, 80597–80611. [Google Scholar] [CrossRef]
  23. He, L.; Yuan, Y.; He, Z.W.; Pang, J.T.; Zhao, Y.; Zeng, W.T.; Cen, Y.X.; Xiao, Y. Spatiotemporal variations of vegetation NPP based on GF-SG and kNDVI and its response to climate change and human activities: A case study of the Zoigê Plateau. Forests 2024, 16, 32. [Google Scholar] [CrossRef]
  24. Yuan, Y.Y.; Guo, W.; Tang, S.Q.; Zhang, J.Q. Effects of patterns of urban green-blue landscape on carbon sequestration using XGBoost-SHAP model. J. Clean. Prod. 2024, 476, 143640. [Google Scholar] [CrossRef]
  25. Jong, R.D.; Verbesselt, J.; Schaepman, M.E.; Bruin, S. Trend changes in global greening and browning: Contribution of short-term trends to longer-term change. Glob. Change Biol. 2012, 18, 642–655. [Google Scholar] [CrossRef]
  26. Liu, X.; Huang, J.; Zhou, H.; Sun, J.Q.; Wang, Q.; Chen, X.J. Dynamic analysis of provincial forest carbon storage efficiency in China based on DEA Malmquist Index. Forests 2023, 14, 1629. [Google Scholar] [CrossRef]
  27. Yang, Y.H.; Yin, J.B.; Kang, S.Y.; Slater, L.J.; Gu, X.H.; Volchak, A. Quantifying the drivers of terrestrial drought and water stress impacts on carbon uptake in China. Agric. For. Meteorol. 2024, 344, 109817. [Google Scholar] [CrossRef]
  28. Edwards, D.P.; Fisher, B.; Wilcove, D.S. High conservation value or high confusion? Sustainable agriculture and biodiversity conservation in the Tropics. Conserv. Lett. 2012, 5, 20–27. [Google Scholar] [CrossRef]
  29. Lafortezza, R.; Chen, J.Q.; Randrup, T.B.; Bosch, C.K.V.D. Nature-based solutions for resilient landscapes and cities. Environ. Res. 2018, 165, 431–434. [Google Scholar] [CrossRef]
  30. Schweiger, O.; Settele, J.; Kudrna, O.; Klotz, S.; Kühn, I. Climate change can cause spatial mismatch of tropically interacting species. Ecology 2008, 89, 3472–3479. [Google Scholar] [CrossRef]
  31. Xu, C.; Li, C. Correlation between Landscape Pattern and Net Primary Productivity of Vegetation: A Case Study in the Arid and Semi-Arid Regions of Northwest China. Land 2023, 12, 2004. [Google Scholar] [CrossRef]
  32. Chapin, F.S.; Matson, P.A.; Vitousek, P.M. Principles of Terrestrial Ecosystem Ecology; Springer: New York, NY, USA, 2011; p. 529. [Google Scholar]
  33. Bond-Lamberty, B.; Thomson, A. Temperature-Associated Increases in the Global Soil Respiration Record. Nature 2010, 464, 579–582. [Google Scholar] [CrossRef] [PubMed]
  34. Haddad, N.M.; Brudvig, L.A.; Clobert, J.; Davies, K.F.; Gonzalez, A.; Holt, R.D.; Lovejoy, T.E.; Sexton, J.O.; Austin, M.P.; Collins, C.D.; et al. Habitat Fragmentation and Its Lasting Impact on Earth’s Ecosystems. Sci. Adv. 2015, 1, e1500052. [Google Scholar] [CrossRef] [PubMed]
  35. Zomer, R.J.; Trabucco, A.; Bossio, D.A.; Verchot, L.V. Climate change mitigation: A spatial analysis of global land suitability for clean development mechanism afforestation and reforestation. Agric. Ecosyst. Environ. 2008, 126, 67–80. [Google Scholar] [CrossRef]
  36. Piao, S.L.; Fang, J.Y.; Ciais, P.; Peylin, P.; Huang, Y.; Sitch, S.; Wang, T. The carbon balance of terrestrial ecosystems in China. Nature 2009, 458, 1009–1013. [Google Scholar] [CrossRef]
  37. Luo, Y.; Weng, E. Dynamic Disequilibrium of Terrestrial Carbon Cycle under Global Change. Trends Ecol. Evol. 2011, 26, 96–104. [Google Scholar] [CrossRef]
  38. Yao, Y.; Wang, X.; Zeng, Z.; Liu, Y.; Peng, S.; Zhu, Z.; Piao, S. The effect of afforestation on soil moisture content in northeastern China. PLoS ONE 2016, 11, e0160776. [Google Scholar] [CrossRef]
  39. Verbeeck, H.; Samson, R.; Granier, A.; Montpied, P.; Lemeur, R. Multi-year model analysis of GPP in a temperate beech forest in France. Ecol. Model. 2007, 210, 85–103. [Google Scholar] [CrossRef]
  40. Zeng, N.; Yoon, J.; Marengo, J.A.; Subramaniam, A.; Nobre, C.A.; Mariotti, A.; Neelin, J.D. Causes and impacts of the 2005 Amazon drought. Environ. Res. Lett. 2008, 3, 014002. [Google Scholar] [CrossRef]
  41. Churkina, G.; Brown, D.G.; Keoleian, G. Carbon Stored in human settlements: The Conterminous United States. Glob. Change Biol. 2010, 16, 135–143. [Google Scholar] [CrossRef]
  42. Lal, R. Soil Carbon sequestration impacts on global climate change and food security. Science 2004, 304, 1623–1627. [Google Scholar] [CrossRef]
Figure 1. Land use/cover types in Inner Mongolia.
Atmosphere 16 00790 g001
Figure 2. Spatial distribution of vegetation NPP in 2000, 2010, and 2020.
Atmosphere 16 00790 g002
Figure 3. Heat map of the correlation between landscape pattern indices and vegetation NPP.
Atmosphere 16 00790 g003
Figure 4. Scatter plot of key influencing indicators analysis of the patch layer.
Atmosphere 16 00790 g004
Figure 5. Scatter plot of key impact indicators analysis in the type layer.
Atmosphere 16 00790 g005
Figure 6. Correlation between climatic variables and NPP. (a) Precipitation and NPP; (b) temperature and NPP. In this study, R refers to the correlation coefficient.
Atmosphere 16 00790 g006
Table 1. Source of data.
Data TypeSource of DataAccuracy
LULCGeospatial Data Cloud (https://www.gscloud.cn/, accessed on 14 October 2023)30 m
Temperature and PrecipitationNational Earth System Science Data Center (https://www.geodata.cn, accessed on 14 October 2023)30 m
NPPUSGS (https://lpdaac.usgs.gov, accessed on 14 October 2023)30 m
Table 2. Landscape pattern indices and meanings (majority).
IndicatorsNameFormulaImplication
PDPatch density n i A The larger the number of patches per unit area of a landscape, the higher the degree of landscape fragmentation
EDEdge density E A The length of the edge of a landscape per unit area affects the edge effect and species composition. The larger the patch, the higher the degree of fragmentation
PLANDPatch area ratio j = 1 n a i j A The proportion of a certain type of patch in the total landscape area determines important factors such as biodiversity, dominant species, and its quantity in the landscape
LPIMaximum patch index Max ( a 1 , , a n ) A × 100 The maximum patch index helps determine the dominant type of landscape and can reflect the direction and strength of human activities
LSIShape index 0.25 E A Measuring the complexity of patch shapes within a landscape, the larger the value, the more complex the landscape shape
COHESIONAggregation index 1 j = 1 m P i j j = 1 m P i j a i j × 1 1 A 1 × 100 Reflecting the connectivity of different land use patch types within the landscape, the smaller the landscape, the higher the heterogeneity
PAFRACFractal dimension index i 1 N 1 ln ( 0.25 p i j ) ln ( a i j ) N The complexity of the shape of individual landscape patches
AIAggregation index g i i max g i i × 100 The relationship between adjacent types of landscape patches, with small values indicating high fragmentation levels and large values indicating good connectivity within the landscape patches
CONTAGSprawl index 1 + i = 1 m k = 1 m p i ln p i 2 ln ( m ) The degree of aggregation or extension trend of different patch types in the landscape is related to the spatial configuration relationship of landscape components
IJIDispersion and parallelism index k = 1 m ( e i k k = 1 m e i k ) ln ( e i k k = 1 m e i k ) × 100 ln ( m n ) The overall dispersion and juxtaposition of patch types, calculated from the relationship between the length of each edge type (eik) and total edge of the landscape divided by a term based on the number of land use/land cover types (m)
Table 3. Landscape level index for 2000, 2010, and 2020.
YearLandscape Pattern Index
AICOHESIONCONTAGSPILTDIVISIONEDIJILPILSIPAFRAC
200087.11999.89549.5204.5430.7798.55163.05040.109236.9981.527
201087.86999.951.4174.2380.7638.05658.21141.607224.6501.531
202087.46999.89553.7344.5640.7808.32254.72740.769230.5601.511
Table 4. Interannual variation in horizontal landscape pattern indices.
TypesYearTENPIJIPLAND
Timberland200032,113.840,82124.2511.81
201032,745.5143,44023.8511.05
202034,043.9742,31221.8111.92
Grassland200091,428.2186,96683.4446.73
201088,033.0890,60377.1847.76
202087,611.3483,33471.4447.81
Farmland200041,672.2234,07345.312.66
201040,790.9436,04644.511.72
202041,994.7534,69945.3213.55
Disclaimer/Publisher’s Note: The statements, opinions and data contained in all publications are solely those of the individual author(s) and contributor(s) and not of MDPI and/or the editor(s). MDPI and/or the editor(s) disclaim responsibility for any injury to people or property resulting from any ideas, methods, instructions or products referred to in the content.

