Article

The Response of NDVI to Climate Change in the Lowest and Hottest Basin in China

1
State Key Laboratory of Ecological Safety and Sustainable Development in Arid Lands, Xinjiang Institute of Ecology and Geography, Chinese Academy of Sciences, Urumqi 830011, China
2
Cele National Station of Observation and Research for Desert-Grassland Ecosystems, Cele 848300, China
3
Polish-Chinese Centre for Environmental Research, Institute of Earth Sciences, University of Silesia in Katowice, 40-007 Katowice, Poland
4
College of Resources and Environment, University of Chinese Academy of Sciences, Beijing 100049, China
5
School of Environment and Material Engineering, Yantai University, Yantai 264005, China
*
Author to whom correspondence should be addressed.
Atmosphere 2025, 16(7), 778; https://doi.org/10.3390/atmos16070778 (registering DOI)
Submission received: 22 April 2025 / Revised: 15 June 2025 / Accepted: 21 June 2025 / Published: 25 June 2025

Abstract

The response mechanisms of vegetation dynamics to climate change in arid regions, particularly under extreme low-altitude and high-temperature environments, remain unclear. Focusing on China’s lowest and hottest Turpan-Hami Basin, this study investigates the spatiotemporal evolution of vegetation cover (using MODIS NDVI) and its response to temperature, precipitation, and potential evapotranspiration (PET) based on data from 2001 to 2020. Theil–Sen trend analysis, the Mann–Kendall test, and Pearson correlation were employed. Key findings include the following: (1) NDVI exhibited a significant increasing trend, with the largest rise in winter and peak values in summer. Spatially, high NDVI was concentrated in oasis and mountainous forest-grassland zones, while low values prevailed in desert Gobi regions; 34.2% of the area showed significant improvement, though localized degradation occurred. (2) Temperature showed no significant overall correlation with NDVI, except for strong positive correlations in limited high-altitude cold zones (2.9%). Precipitation had minimal influence (no correlation in 75.4% of the area), with localized positive responses in northwestern foothills linked to runoff. PET exhibited positive correlations (weak or strong) with NDVI across nearly half of the region (46.8%), predominantly in oasis-desert and piedmont transition zones. (3) Human activities, notably irrigation and shelterbelt projects, are key drivers of oasis vegetation restoration. Critically, the positive PET-NDVI correlation challenges the conventional paradigm viewing evapotranspiration solely as water stress. This study elucidates the compound responses of vegetation dynamics to climatic and anthropogenic factors in a low-altitude arid region, providing a scientific basis for ecological restoration and water resource management optimization.

1. Introduction

Vegetation, as a critical component of terrestrial ecosystems, plays an irreplaceable role in regulating regional climate, maintaining biodiversity, and facilitating ecosystem material cycling and energy flow [1,2,3]. Its spatiotemporal dynamics not only serve as vital indicators for assessing the health status of terrestrial ecosystems but also represent important research objects for understanding the response mechanisms of land surface processes under global change [4,5]. Against the backdrop of global climate change, vegetation growth dynamics, spatial distribution patterns, and carbon balances are significantly regulated by climatic factors such as temperature and precipitation [6]. In this context, revealing the response mechanisms of vegetation to climatic factors has emerged as a critical scientific proposition for assessing regional environmental evolution and developing adaptive management strategies [7]. It holds substantial scientific and practical significance for uncovering the patterns of regional environmental quality change, refining soil and water conservation strategies, and advancing ecological protection initiatives [4].
The Normalized Difference Vegetation Index (NDVI), as an effective indicator of vegetation coverage and photosynthetic activity, not only effectively reflects vegetation productivity levels and spatial distribution patterns but also provides reliable data support for multi-temporal vegetation dynamics monitoring [8,9] and vegetation variability analysis [10,11], exhibiting unique advantages in ecological monitoring in arid regions. For example, Zhang et al. utilized the Google Earth Engine (GEE) platform and found that NDVI growth rates in Xinjiang, China, were significantly higher than those in five Central Asian countries [12]. This disparity was predominantly attributed to differences in water resource management policies [12]. In arid ecosystem contexts, vegetation growth exhibits typical water-limited characteristics due to the dual stressors of scarce precipitation and intensive evapotranspiration processes, rendering it highly sensitive to global climate change [13,14]. Therefore, establishing a precise vegetation monitoring system and systematically analyzing the dynamics of vegetation coverage, biomass accumulation characteristics, and phenological changes are key scientific issues for understanding the evolutionary mechanisms of ecosystems in arid regions [15].
Currently, theoretical debates persist in research on vegetation-climate responses in arid regions. Global-scale studies indicate that temperature increases significantly enhance vegetation activity by extending the growing season [16]; however, this mechanism may falter in extremely arid areas due to water limitations [17]. For instance, research by Yan et al. has demonstrated that vegetation growth in arid zones is primarily constrained by water availability [18]. Fluctuations in precipitation can directly impact vegetation productivity by altering soil moisture content [18]. At the regional scale, although scholars have conducted in-depth analyses of vegetation cover changes in China’s northwestern arid regions and explored the correlations between these changes and climatic variables [19,20], significant discrepancies exist among research findings. For instance, Li et al. and Li et al. found a significant correlation between NDVI and both precipitation and temperature, suggesting that the synergistic effects of water and heat drive vegetation growth [21,22]. However, Zhao et al. and Cao et al., based on the analysis of multi-year remote sensing data, proposed that NDVI changes are significantly correlated with precipitation but not with temperature [19,20]. Moreover, Guo et al. demonstrated that NDVI has a higher correlation with temperature than with precipitation, indicating that temperature has a more pronounced impact on vegetation growth [23]. These divergences suggest that the response relationship between NDVI and climatic factors may be influenced by various factors such as regional geographical location, climate type, and vegetation type, exhibiting significant regional differences.
As a quintessential example of low-altitude extreme environments in the arid regions of China, the Turpan-Hami Basin, characterized by its unique geographical location (low altitude) and extreme climatic conditions (e.g., high temperatures, low precipitation, and high evaporation), may exhibit distinct vegetation-climate response mechanisms compared to other regions. Currently, systematic research on the spatiotemporal differentiation characteristics of NDVI in the Turpan-Hami Basin and its responses to temperature, precipitation, and PET is limited. To address this gap, this study develops a multi-scale spatiotemporal analysis framework and employs grid data to quantitatively analyze the spatiotemporal coupling relationship between vegetation and climate characteristics in the Turpan-Hami Basin. The objective is to elucidate the dynamic evolution patterns of the climate-vegetation feedback mechanisms at this unique regional scale, thereby providing a scientific basis for adaptive management of ecosystems in arid areas. The major contributions of this research are as follows: (1) deepening the understanding of vegetation-climate response mechanisms in extremely low-altitude environments of China’s arid regions and (2) offering regional empirical references for global arid-zone ecosystem conservation and management.
The paper is organized as follows: Section 2 details the data and methods, covering the study area, data sources, preprocessing, and analysis methods. Section 3 presents the results, including the spatiotemporal distribution of NDVI and vegetation-climate factor response analysis in the Tuha Basin. Section 4 discusses the results, comparing them with previous studies and exploring discrepancies. Section 5 concludes by summarizing the key findings and reiterating the core contributions.

2. Materials and Methods
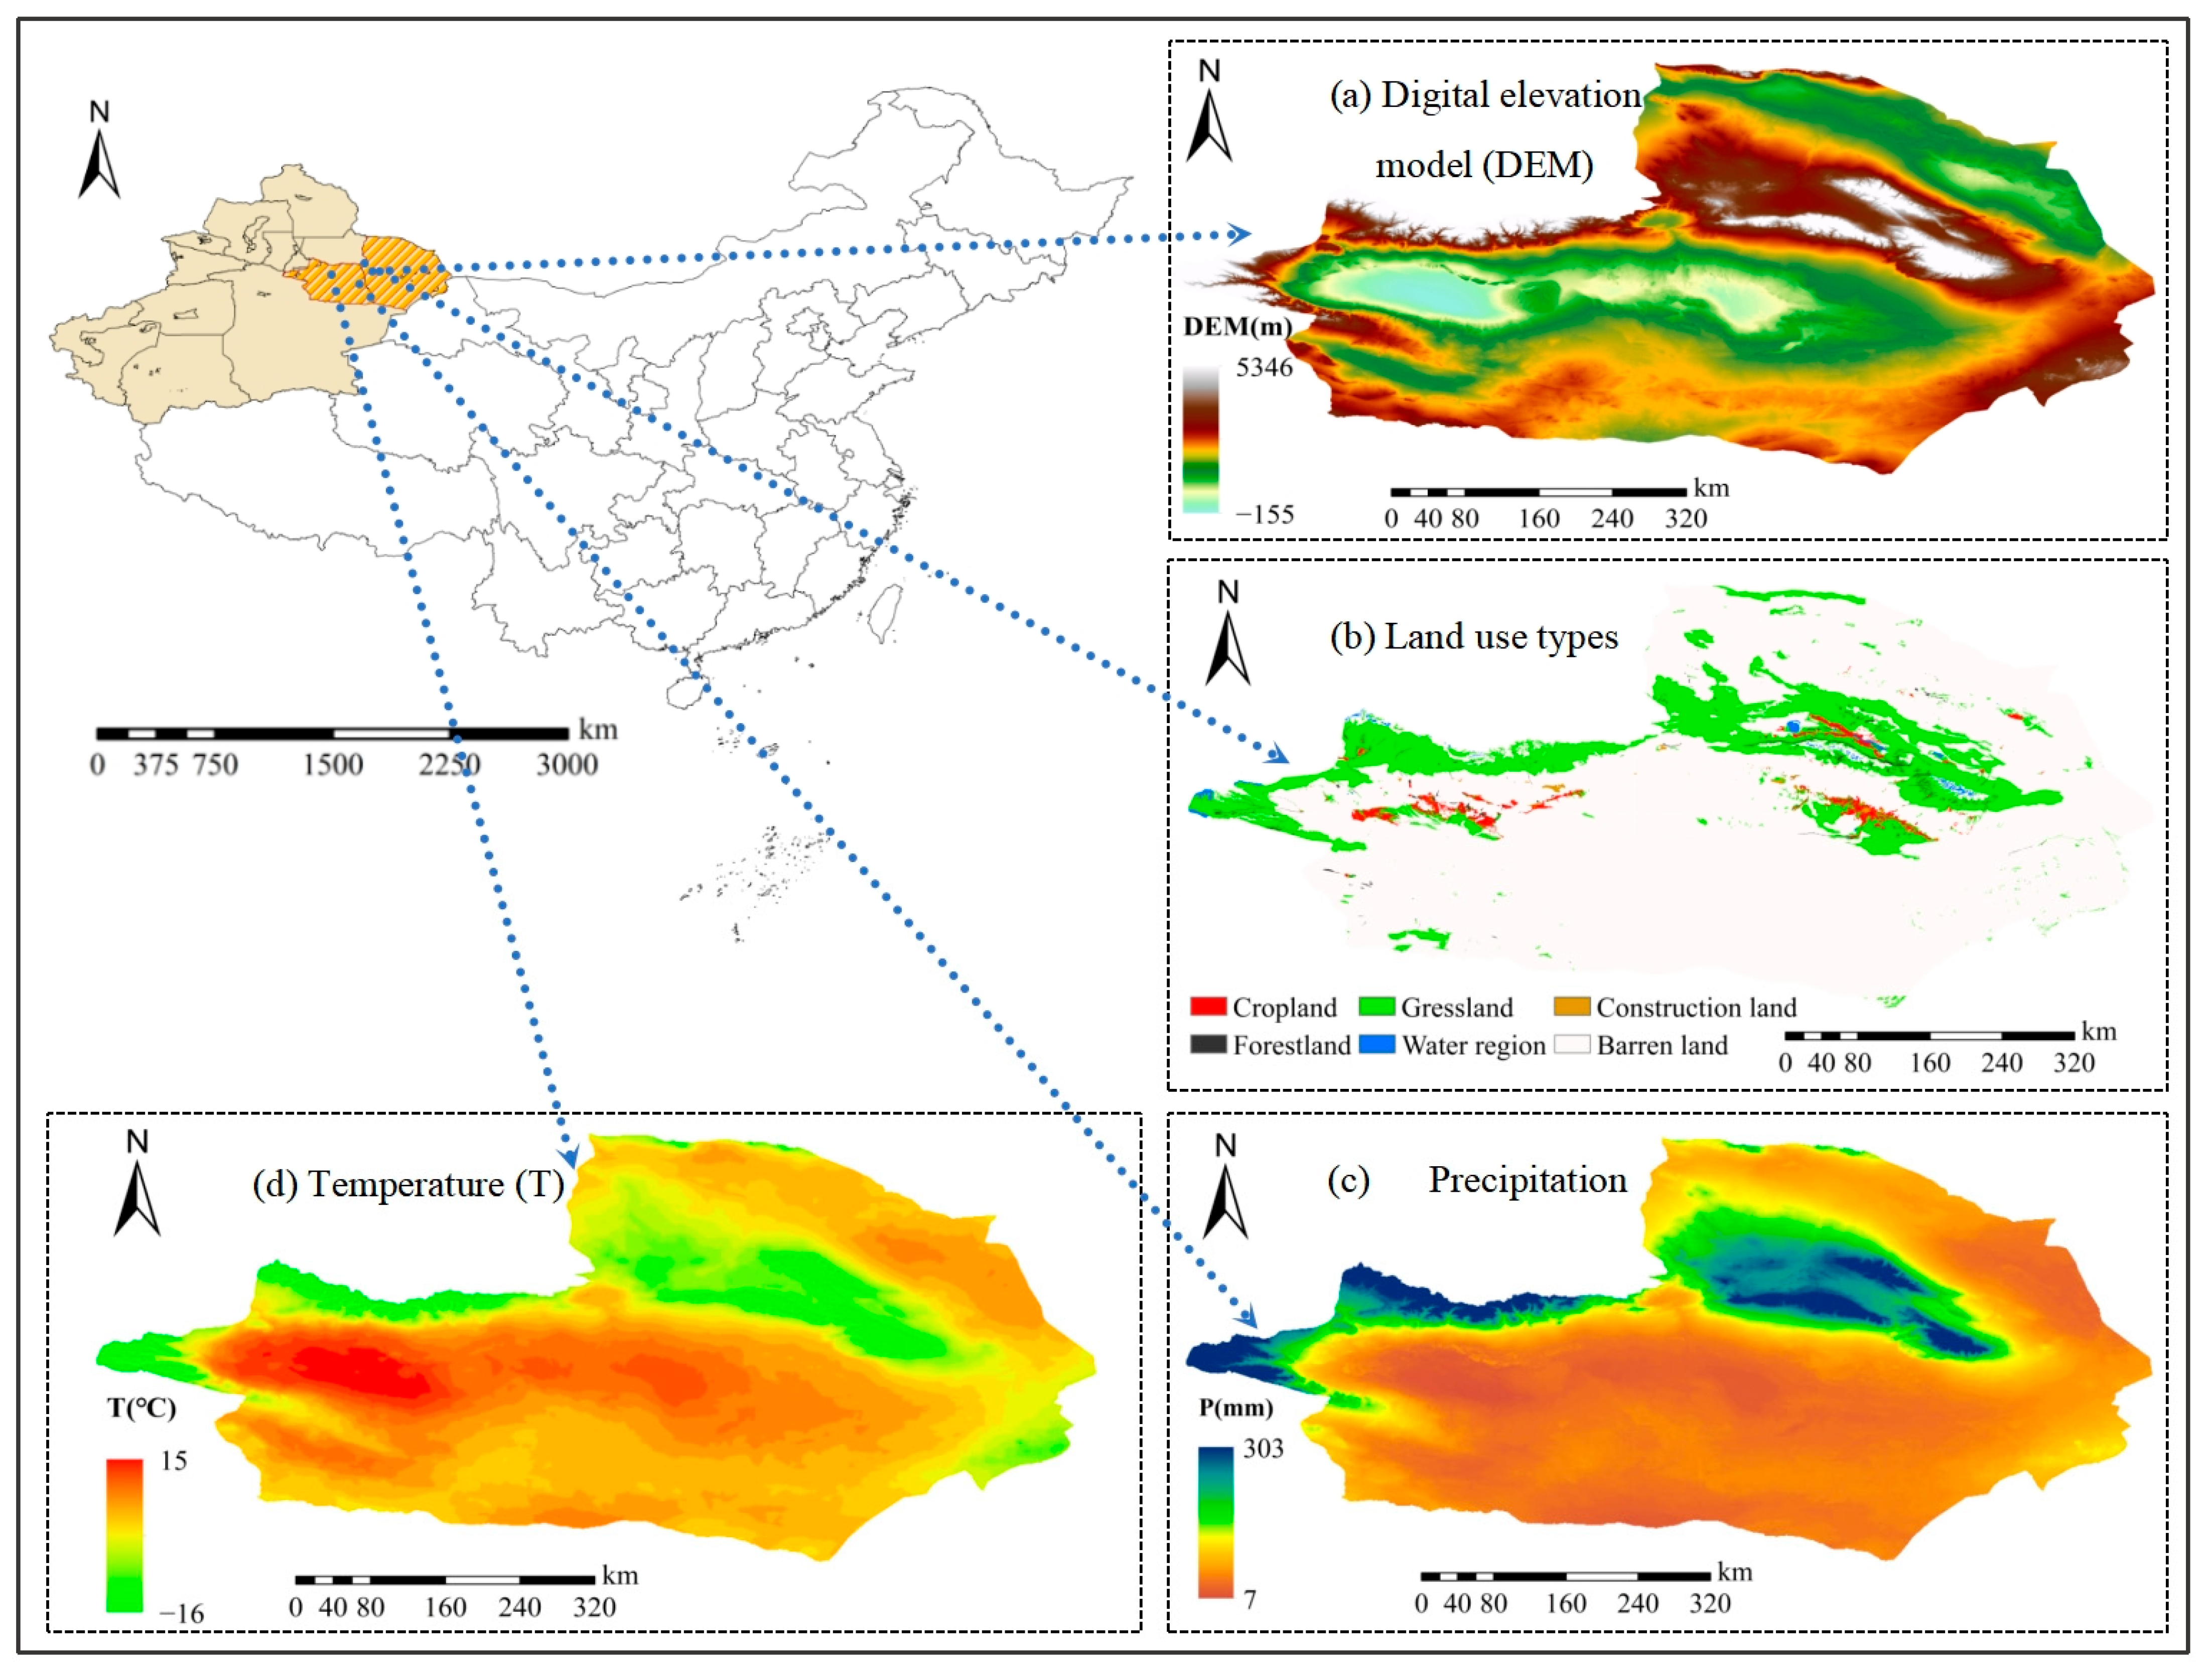
2.1. Study Area

The Turpan-Hami Basin is located in the eastern part of the Xinjiang Uygur Autonomous Region, China (86°40′00″–96°23′00″ E, 40°21′00″–43°43′00″ N) (Figure 1), and comprises two major tectonic units: the Turpan Basin and the Hami Basin. The basin’s landscape is predominantly characterized by the Gobi Desert, stretching in an east-west direction with terrain higher in the north and lower in the south. Aydingkol Lake in the Turpan-Hami, with an altitude of −155 m, is not only the lowest point in China but also the third lowest depression in the world after the Dead Sea and Lake Assal. This unique terrain of extremely low altitude and the enclosed basin structure give rise to distinct regional climatic characteristics. The basin experiences a typical continental arid climate, marked by scarce precipitation (average annual precipitation is approximately 50 mm) and limited surface water resources, leading to a high dependence on groundwater for agricultural irrigation and domestic water supply. Especially in the Turpan region, the climate is hot and arid, with evaporation far exceeding actual precipitation (average annual precipitation is only 16.4 mm, while evaporation reaches as high as over 3000 mm). However, it is precisely these natural conditions that have endowed the region’s unique light and heat resources (annual average sunshine duration >3000 h, and a day-night temperature difference of 14–16 °C). Together with the drought stress environment, these factors have shaped the area’s distinctive ecological pattern and agricultural cultivation practices.

2.2. Data Sources

Within the study area, all spatial data were processed at a resolution of 1 km and using the WGS84 geographic coordinate system. Seasons division in the Northern Hemisphere were defined following the guidelines of the World Meteorological Organization: spring (March–May), summer (June–August), autumn (September–November), and winter (December–February of the following year).

2.2.1. NDVI Data

This study utilized the MOD13A3 dataset from the MODIS Terra satellite (2001–2020), which provides NDVI products with a temporal resolution of 30-days and spatial resolution of 1 km. The data preprocessing workflow included the following: (1) clipping and mosaicking of the study area using the Python 3.9 GDAL library; (2) coordinate system transformation to WGS84 via ArcGIS 10.8; (3) removal of outliers caused by cloud contamination, snow cover, and sensor noise using the Savitzky-Golay (S-G) filtering algorithm combined with the quality assessment (QA) band; and (4) generation of seasonal and interannual NDVI datasets through Maximum Value Composites (MVC).

2.2.2. Climate Data

The climate data were obtained from the CRU TS v4.06 (0.5° spatial resolution) and the worldclim v1.4 datasets (1 km resolution), integrating the parameters such as precipitation (Precipitation), mean temperature (TMean), maximum temperature (TMax), and minimum temperature (TMin) from 2001 to 2020. The datasets were verified by the publisher using data from over 400 weather stations, and the validation results confirmed the reliability of these datasets (https://data.tpdc.ac.cn/, accessed on 2 November 2024).

2.3. Research Methods

2.3.1. Hargreaves Model

Based on the land use types in the study area, potential evapotranspiration (PET), used to quantify the degree of dryness in this study, was estimated using the Hargreaves model [24]:
PET = 0.0023 × T Max T Min × T Mean + 17.8 × S 0
where PET represents potential evapotranspiration (mm/month); TMax refers to the monthly maximum temperature, TMin to the monthly minimum temperature, and TMean to the monthly mean temperature (Table 1); and S0 represents the theoretical solar radiation, which is the radiation reaching the top of the Earth’s atmosphere.
Usually, the calculation of S0 is based on several parameters, including the solar constant, the Earth-Sun distance, the Julian day, and the solar declination. The specific calculation method is implemented through the following formula:
S 0 = 24 × 60 π × G S × 1 + 0.033 × cos 2 π n 3 365 π × d 2
In Formula (2), Gs represents the solar constant; n is the Julian day of the year, where 1 corresponds to January 1st and 365 corresponds to December 31st; and d refers to the distance between Earth and the sun.

2.3.2. Theil–Sen Trend Analysis and Mann–Kendall Significance Test

The vegetation dynamics trends were assessed by combining the Theil–Sen median trend analysis with the Mann–Kendall (M-K) significance test [25]. This combined approach offers the following advantages: (1) no requirement for normality in data distribution; (2) high resistance to outliers; and (3) unaffected by missing values and anomalies. The specific combined approach is as follows:
The Theil–Sen calculation formula is as follows:
β = Median x j x i j i ,   i < j
In Formula (3), β represents the trend of vegetation change, where i and j are time series indices, and xi and xj represent the NDVI values at the i-th and j-th time points in the time series, respectively. When β > 0, it indicates an increasing trend in NDVI within the time series; when β < 0, it indicates an increasing trend in NDVI.
The Mann–Kendall test is a non-parametric statistical method used to judge the significance of trends in data variation [26]. The calculation formula is as follows:
Z = S 1 var ( S ) ,   S > 0 0 ,   S = 0 S + 1 var ( S ) ,   S < 0
where
S = i = 1 n 1 j = i + 1 n sgn ( X j X i )
sgn ( X j X i ) = + 1 ,   X j X i > 0 0 ,   X j X i = 0 1 ,   X j X i < 0
Var ( S ) = n ( n 1 ) ( 2 n + 5 ) 18
In Formulas (4)–(7), Z is the statistic for trend testing, and n is the length of the time series. This study conducts a significance test on the interannual change trends of the NDVI in the Turpan-Hami at a confidence level of α = 0.05, categorizing the NDVI trend levels into 6 grades [27], as detailed in Table 2 below:

2.3.3. Pearson Correlation Analysis

The Pearson coefficient was applied to reflect the correlation between NDVI and temperature, precipitation, and PET, thereby analyzing the impact of climatic factors on NDVI. The calculation formula is as follows:
r xy = i = 1 n ( x i x ¯ ) ( y i y ¯ ) i = 1 n ( x i x ¯ ) 2 i = 1 n ( y i y ¯ ) 2
In Formula (8), the correlation coefficient rxy is within the range of [−1, 1]. If rxy is positive, it indicates a positive correlation between the two variables; if rxy is negative, it indicates a negative correlation. The closer the absolute value of rxy is to 1, the closer the relationship is; the closer it is to 0, the less close the relationship is. x ¯ and y ¯ represent the mean values of a multi-year time series.

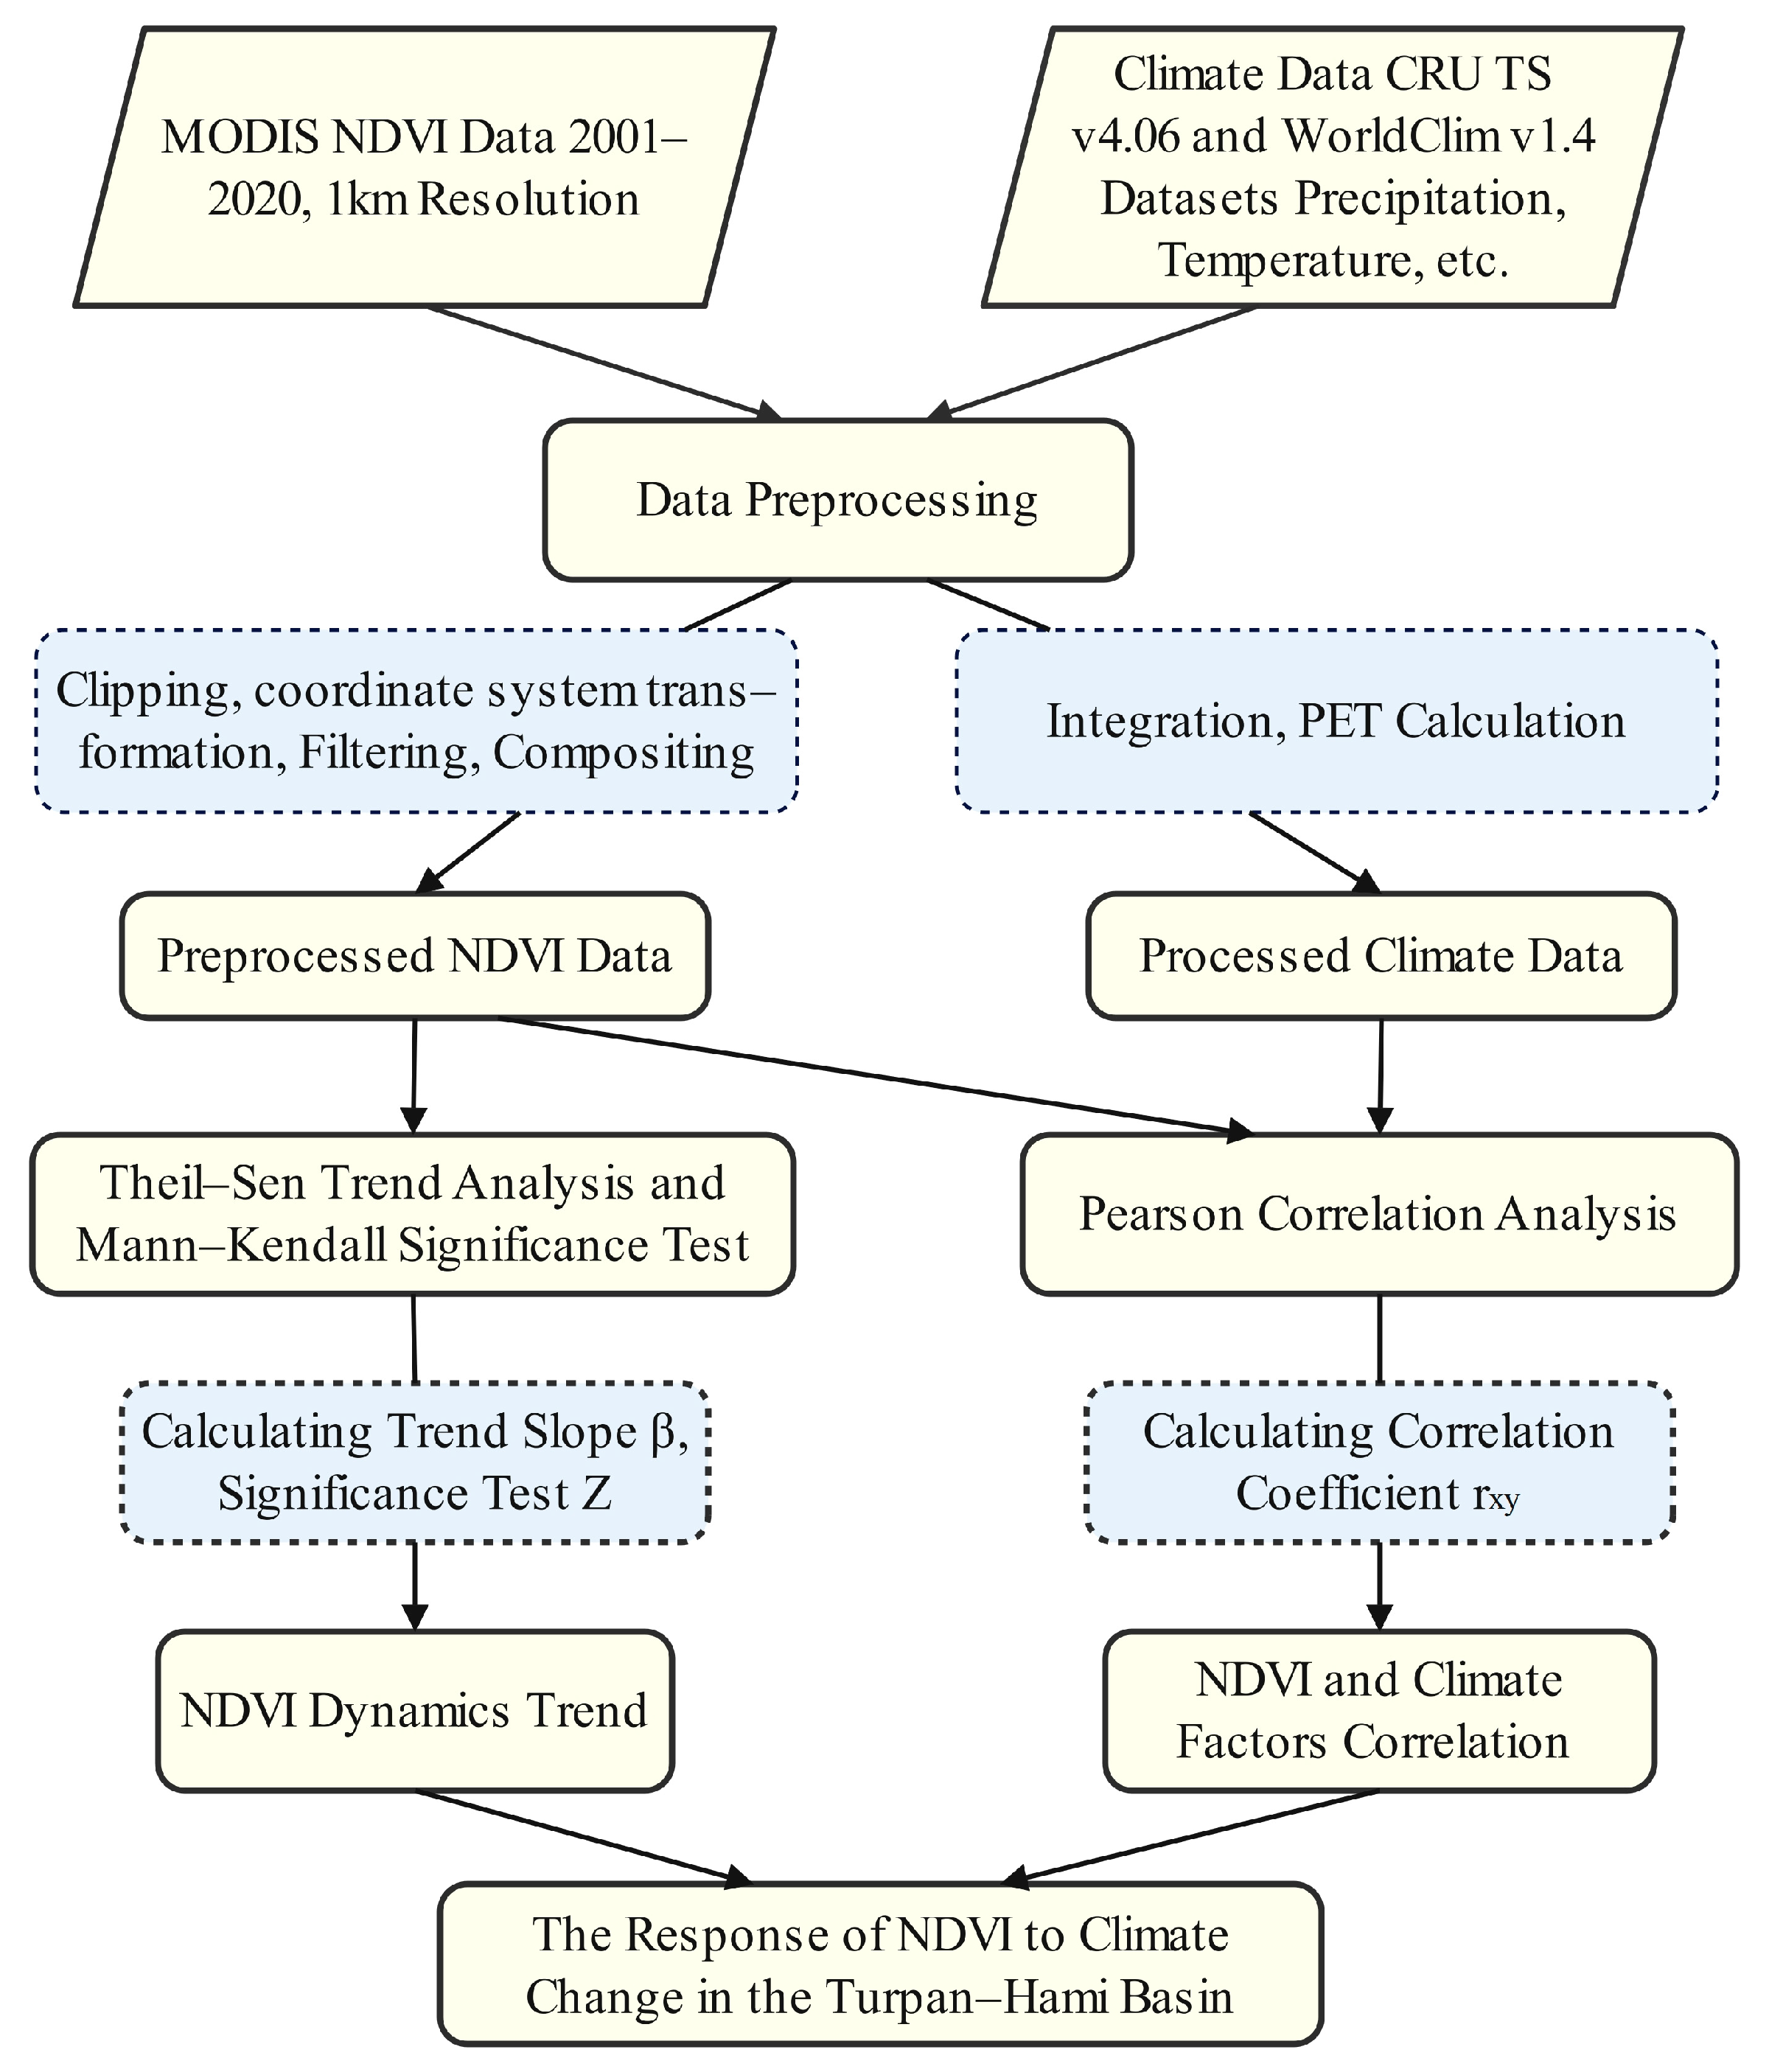
2.4. Research Workflow

Figure 2 shows the flowchart of this study.

3. Results and Analysis

3.1. Characteristics of Climate Factor Variations

Analysis of temperature data in the Turpan-Hami Basin from 2001 to 2020 (Figure 3a) revealed relative stability in the mean annual temperature over the observation period. However, the study area exhibited pronounced seasonal disparities in temperature variations. Data from Figure 3a indicate that autumn was the only season displaying a significant warming trend, with a warming rate of 0.086·a−1, suggesting that autumn serves as the core driving period of regional climate warming. Among the other seasons, summer showed a weak and statistically insignificant warming trend, while spring and winter exhibited slight cooling trends, neither of which reached statistical significance (p = 0.30, p = 0.92), likely attributed to interannual climatic fluctuations.
Interannual and seasonal precipitation in the Turpan-Hami Basin from 2001 to 2020 exhibited no statistically significant increasing or decreasing trends, mainly dominated by interannual fluctuations (Figure 3b). As shown in Figure 3b, although there were fluctuations in the interannual precipitation, there was no obvious long-term trend, with an extremely low mean annual precipitation of 53 mm. Summer experienced relatively higher precipitation (mean: 133 mm), showing a weak and non-significant increasing trend. In contrast, spring, autumn, and winter displayed minor decreasing trends, none of which reached statistical significance (p > 0.05). These results are consistent with the typical features of extremely arid regions, characterized by minimal precipitation and pronounced interannual variability, which is potentially influenced by oscillations in the westerly wind belt or localized topographic effects.
The PET in the Turpan-Hami Basin exhibited a pronounced seasonal variation from 2001 to 2020 (Figure 3c). Autumn PET demonstrated a significant upward trend, with an average annual increase of 4.34 mm·a−1, indicating that autumn was the critical period during which regional evapotranspiration water consumption intensified. This trend may be potentially attributable to elevated temperatures or enhanced wind speeds. While PET showed a marginal upward tendency over the years, it did not pass the significance test, suggesting that its fluctuations were primarily governed by interannual variability. In other seasons, no significant trends were observed in spring, summer, and winter PET, aligning with the seasonal disparities in radiation energy distribution characteristic of extremely arid regions. It is noteworthy that the mean annual PET in the study area surpassed 900 mm, remarkably exceeding the annual precipitation of 53 mm, thereby exacerbating the water supply-demand contradiction to an extreme degree.

3.2. Temporal and Spatial Dynamic Changes in NDVI

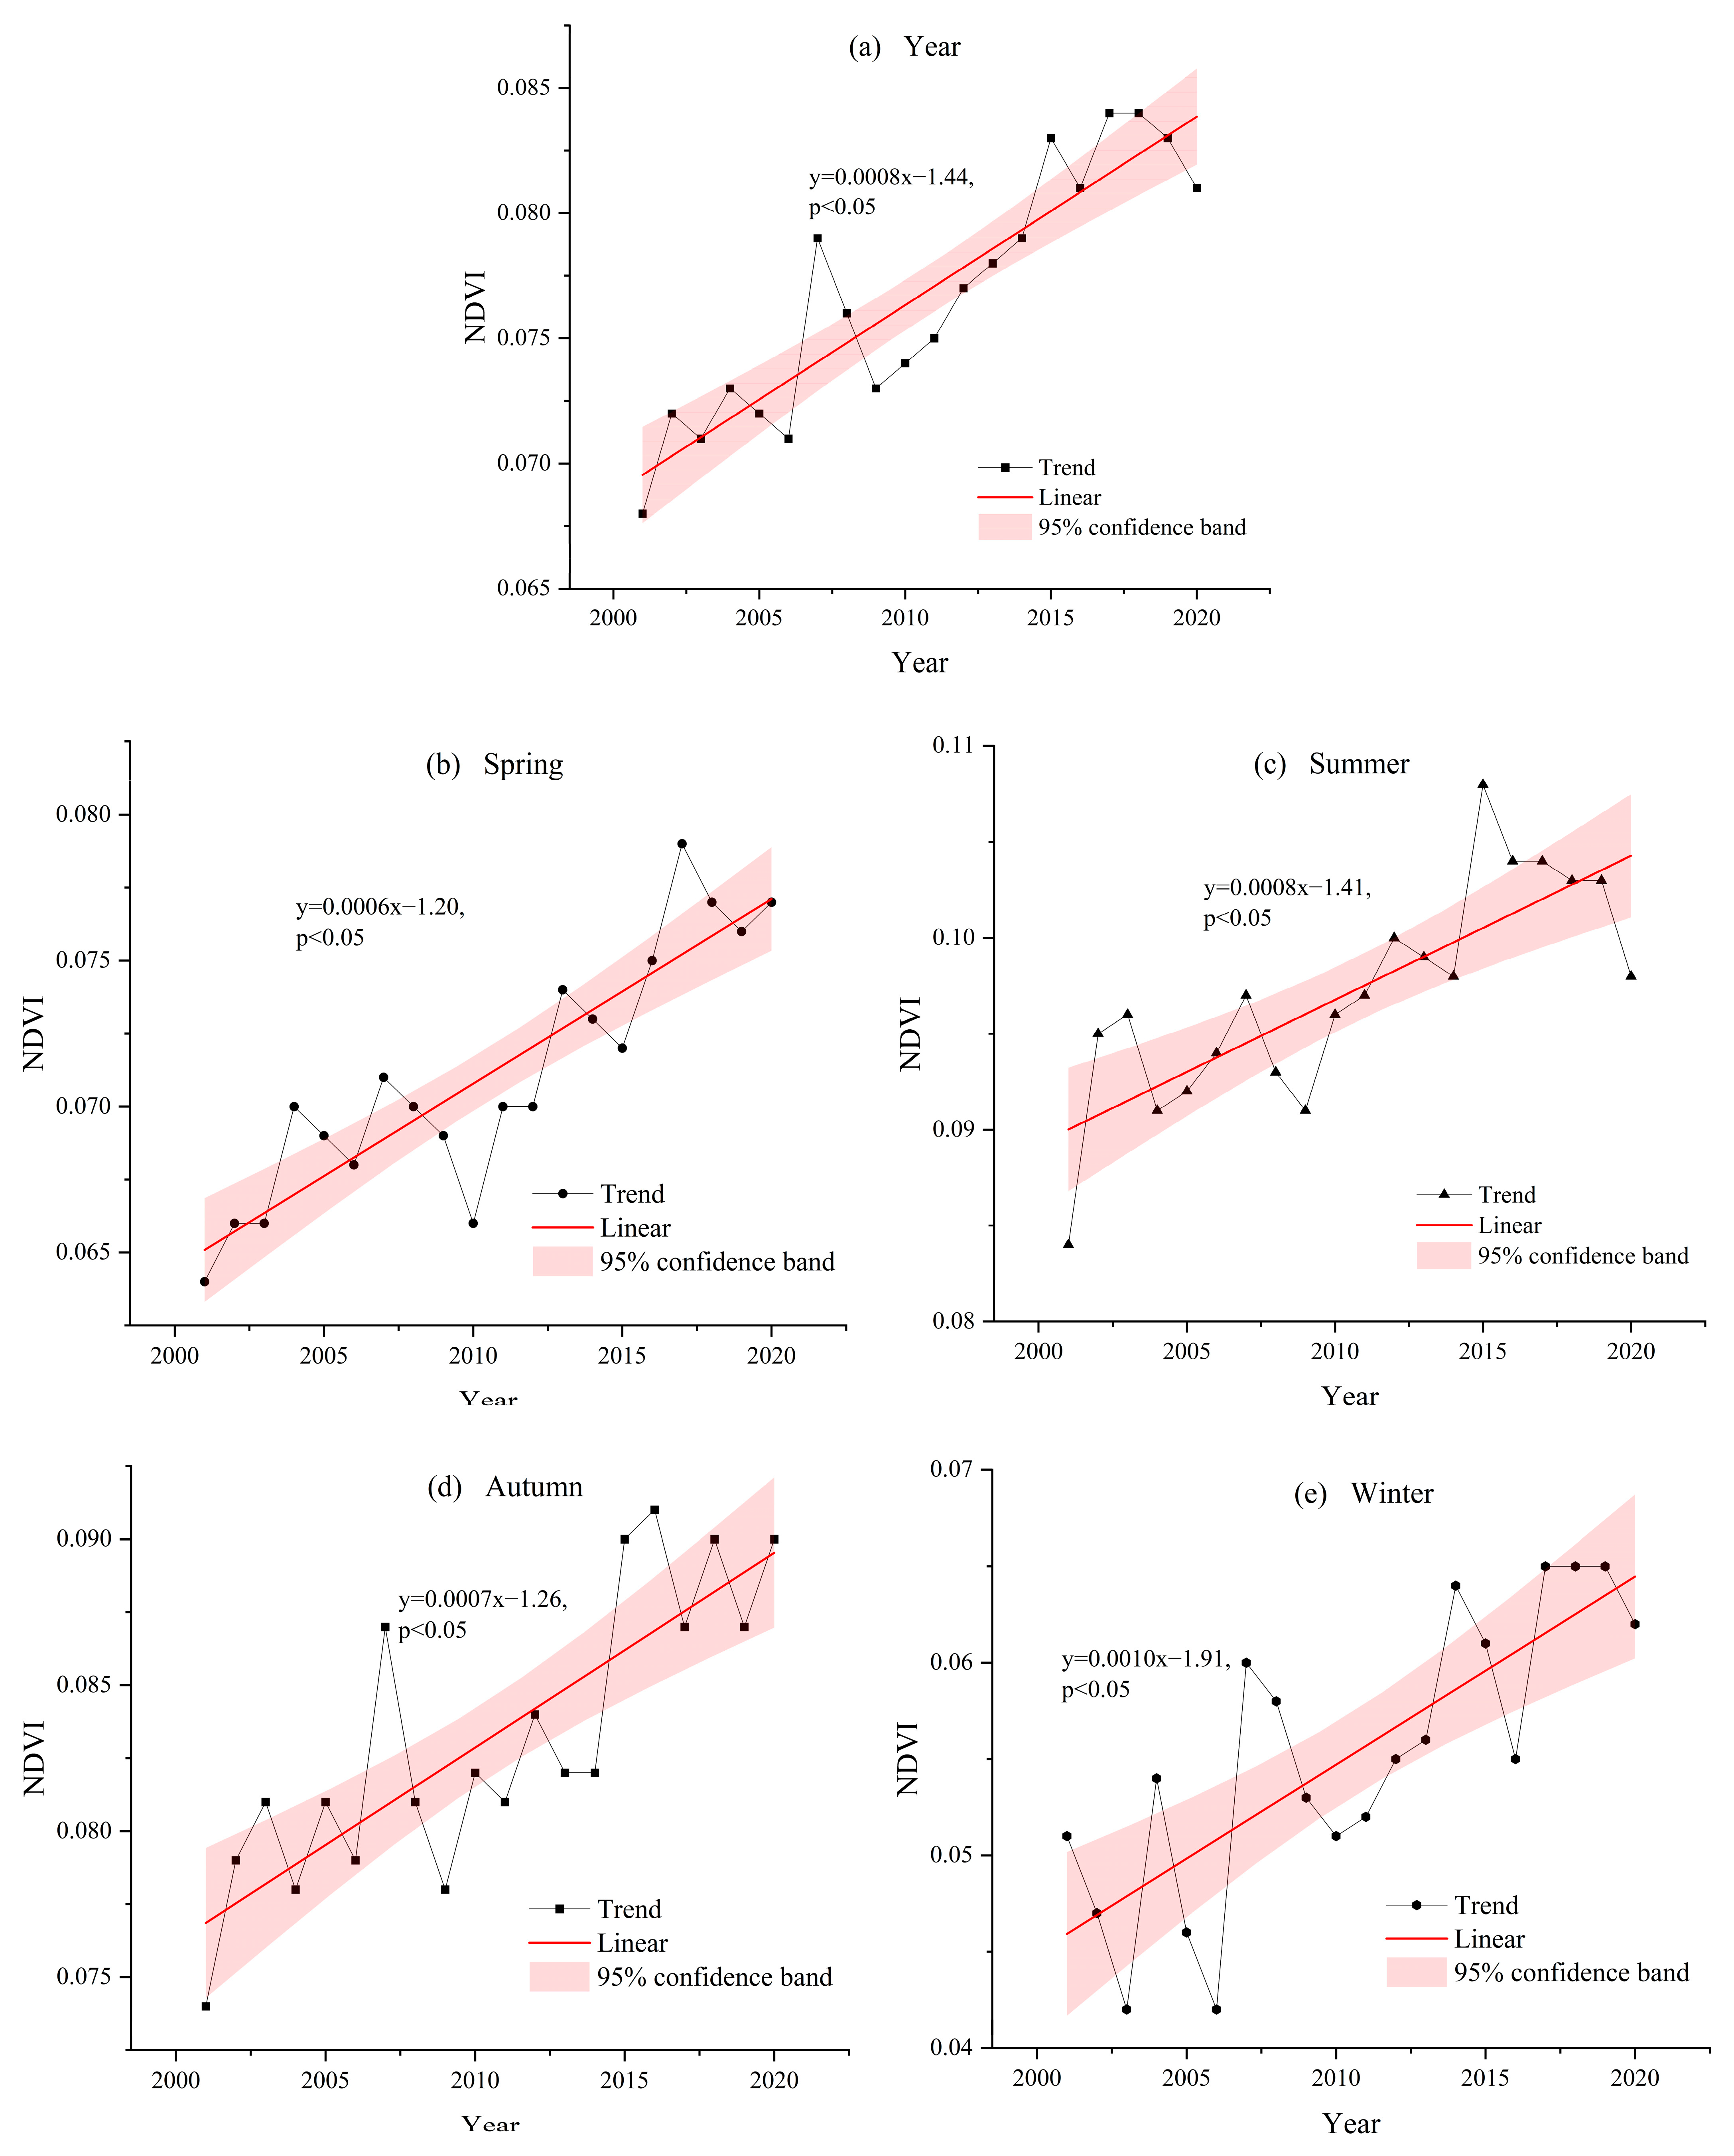
3.2.1. Analysis of Annual Interannual Variation Characteristics in NDVI

From the perspective of interannual variation (Figure 4), the NDVI in the Turpan-Hami Basin ranged between 0.068 and 0.084 from 2001 to 2020, with an average value of 0.077. The annual NDVI trend rate in the Turpan-Hami was 0.0008·a−1, indicating a significant upward trend overall in the context of global warming. Although the annual increase was minimal, the cumulative growth over the 20-year period reached 0.016, indicating that the overall vegetation coverage and growth conditions in the region have gradually improved over the past 20 years. The figure also reveals that while the NDVI values fluctuated significantly between 2001 and 2020, the amplitude of these fluctuations decreased after 2010, showing a relatively stable upward trend. Despite some interannual variations in specific years, the overall upward trend in NDVI values was maintained.
On a seasonal scale, the Turpan-Hami Basin exhibited a significant upward trend in NDVI values from 2001 to 2020, both annually and across all individual seasons (spring, summer, autumn, and winter) (Figure 4). The average NDVI values for spring, summer, autumn, and winter were 0.07, 0.10, 0.08, and 0.06, respectively, with annual growth rates of 0.0006, 0.0008, 0.0007, and 0.0010, respectively. It can be observed that the interannual changes in spring and autumn NDVI were similar, with relatively slower growth rates compared to summer and winter. Summer exhibited the highest NDVI values, while winter had the lowest, consistent with the seasonal growth characteristics of vegetation. Notably, winter exhibited the highest annual growth rate, showing the most significant increase, despite weaker vegetation growth activity during this period. The rise in winter NDVI indicates an improving vegetation ecological environment during that season.

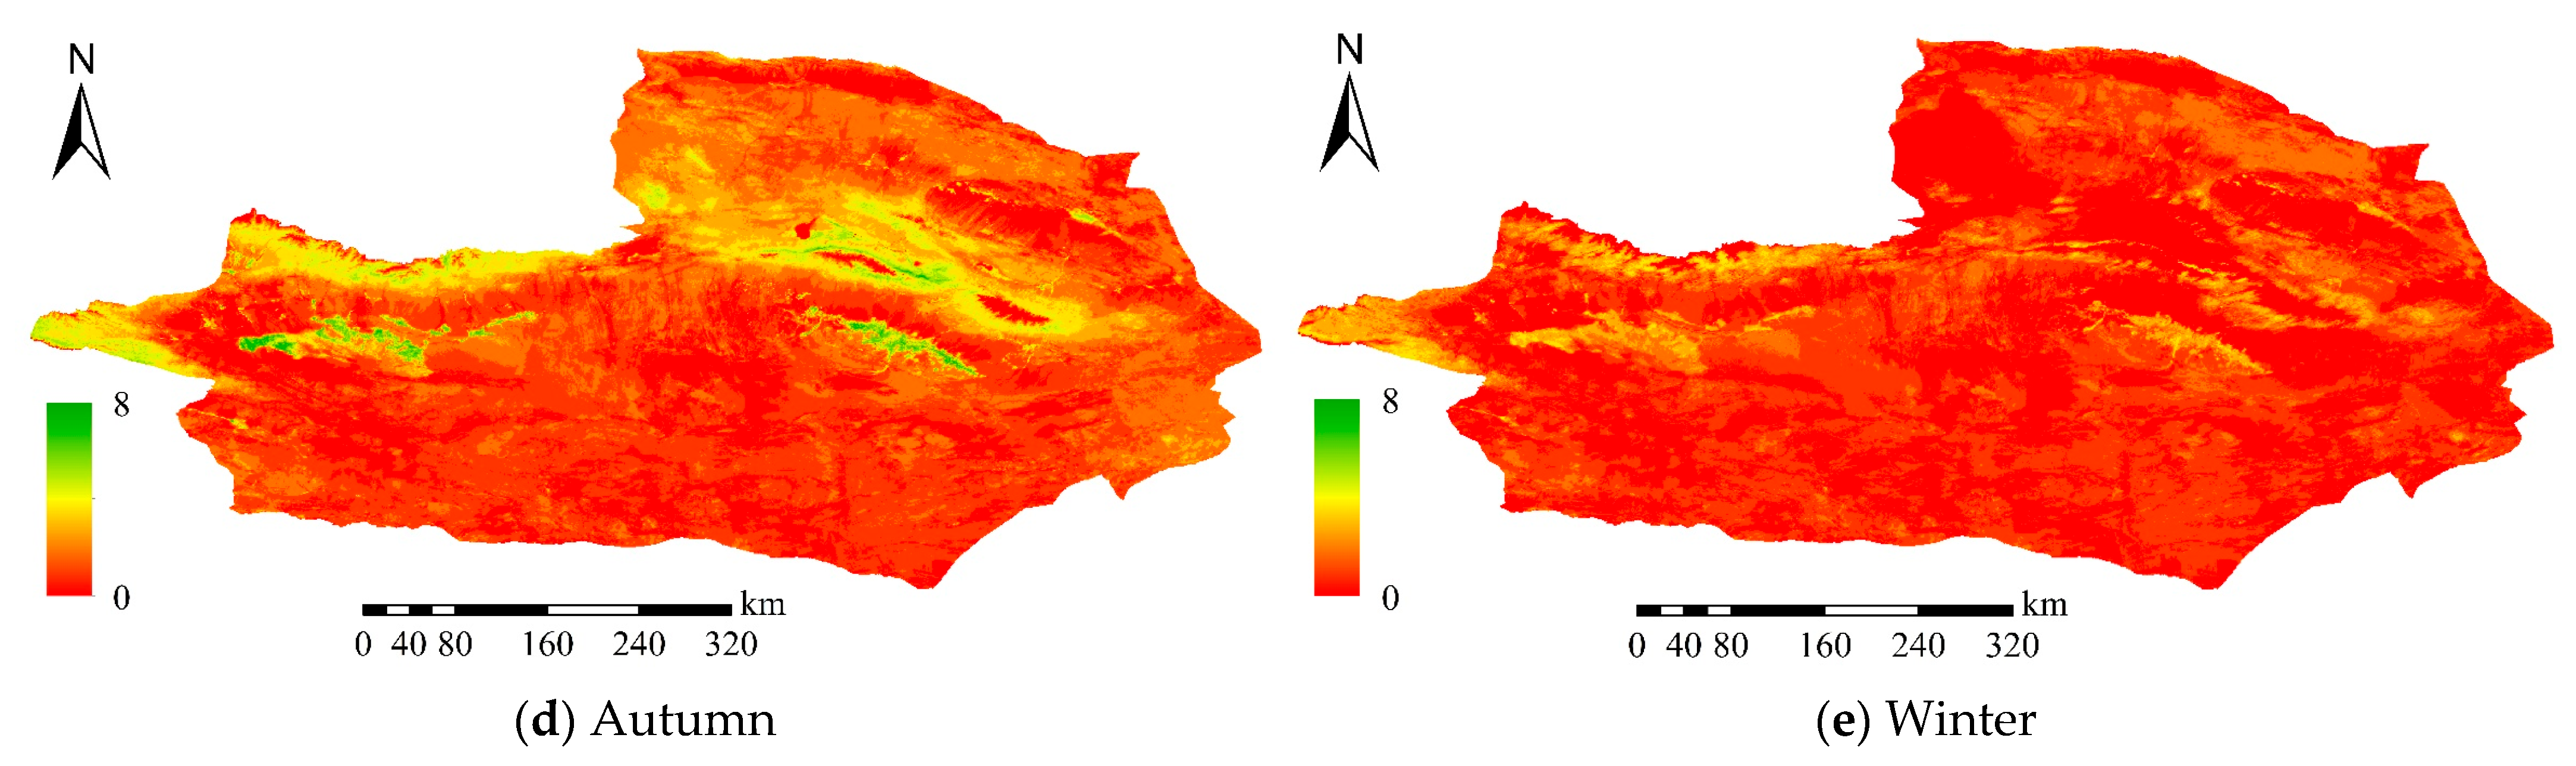
3.2.2. Analysis of Spatial Variations in NDVI

The spatiotemporal distribution characteristics depicted in Figure 5 indicate that the high-value areas of annual average NDVI (Figure 5a) are predominantly concentrated in basin oases and mountainous forest-grass belts, closely aligning with regions abundant in water and heat resources. Conversely, the low-value areas are predominantly situated in desert Gobi regions. Due to the extreme arid environment, the vegetation coverage is minimal, primarily consisting of sparse drought-resistant sand plants like suo suo (Haloxylon ammodendron). On a seasonal scale, summer NDVI (Figure 5c) shows the most significant spatial heterogeneity, with high-value areas widely covering irrigated agricultural zones within oases, underscoring the substantial promoting effect of water resource management and agricultural practices on vegetation growth. In contrast, the low-value areas are mainly distributed in the desert and Gobi regions of the southern basin. Compared to other seasons, the NDVI values in summer show only a slight increase but remain at low levels, resulting in overall minimal vegetation cover. Winter NDVI (Figure 5e), while having the smallest high-value area, demonstrates a trend of expansion toward the desert-oasis transition zone, potentially attributable to the establishment of artificial shelterbelts and the implementation of ecological restoration initiatives. The spatial patterns of spring (Figure 5b) and autumn (Figure 5d) NDVI reflect the transitional dynamics of vegetation during greening and withering periods, respectively, with spring NDVI showing a patchy distribution along oasis margins and autumn NDVI characterized by high-value areas retracting toward drought-resistant vegetation belts. Similarly, in desert and Gobi regions, NDVI values remain at low levels in both spring and autumn. Notably, the spatial distribution of NDVI exhibits a high degree of consistency with the boundaries of regional land use types (e.g., farmland, forest land, and deserts), underscoring the pronounced influence of human activities on local vegetation cover.’

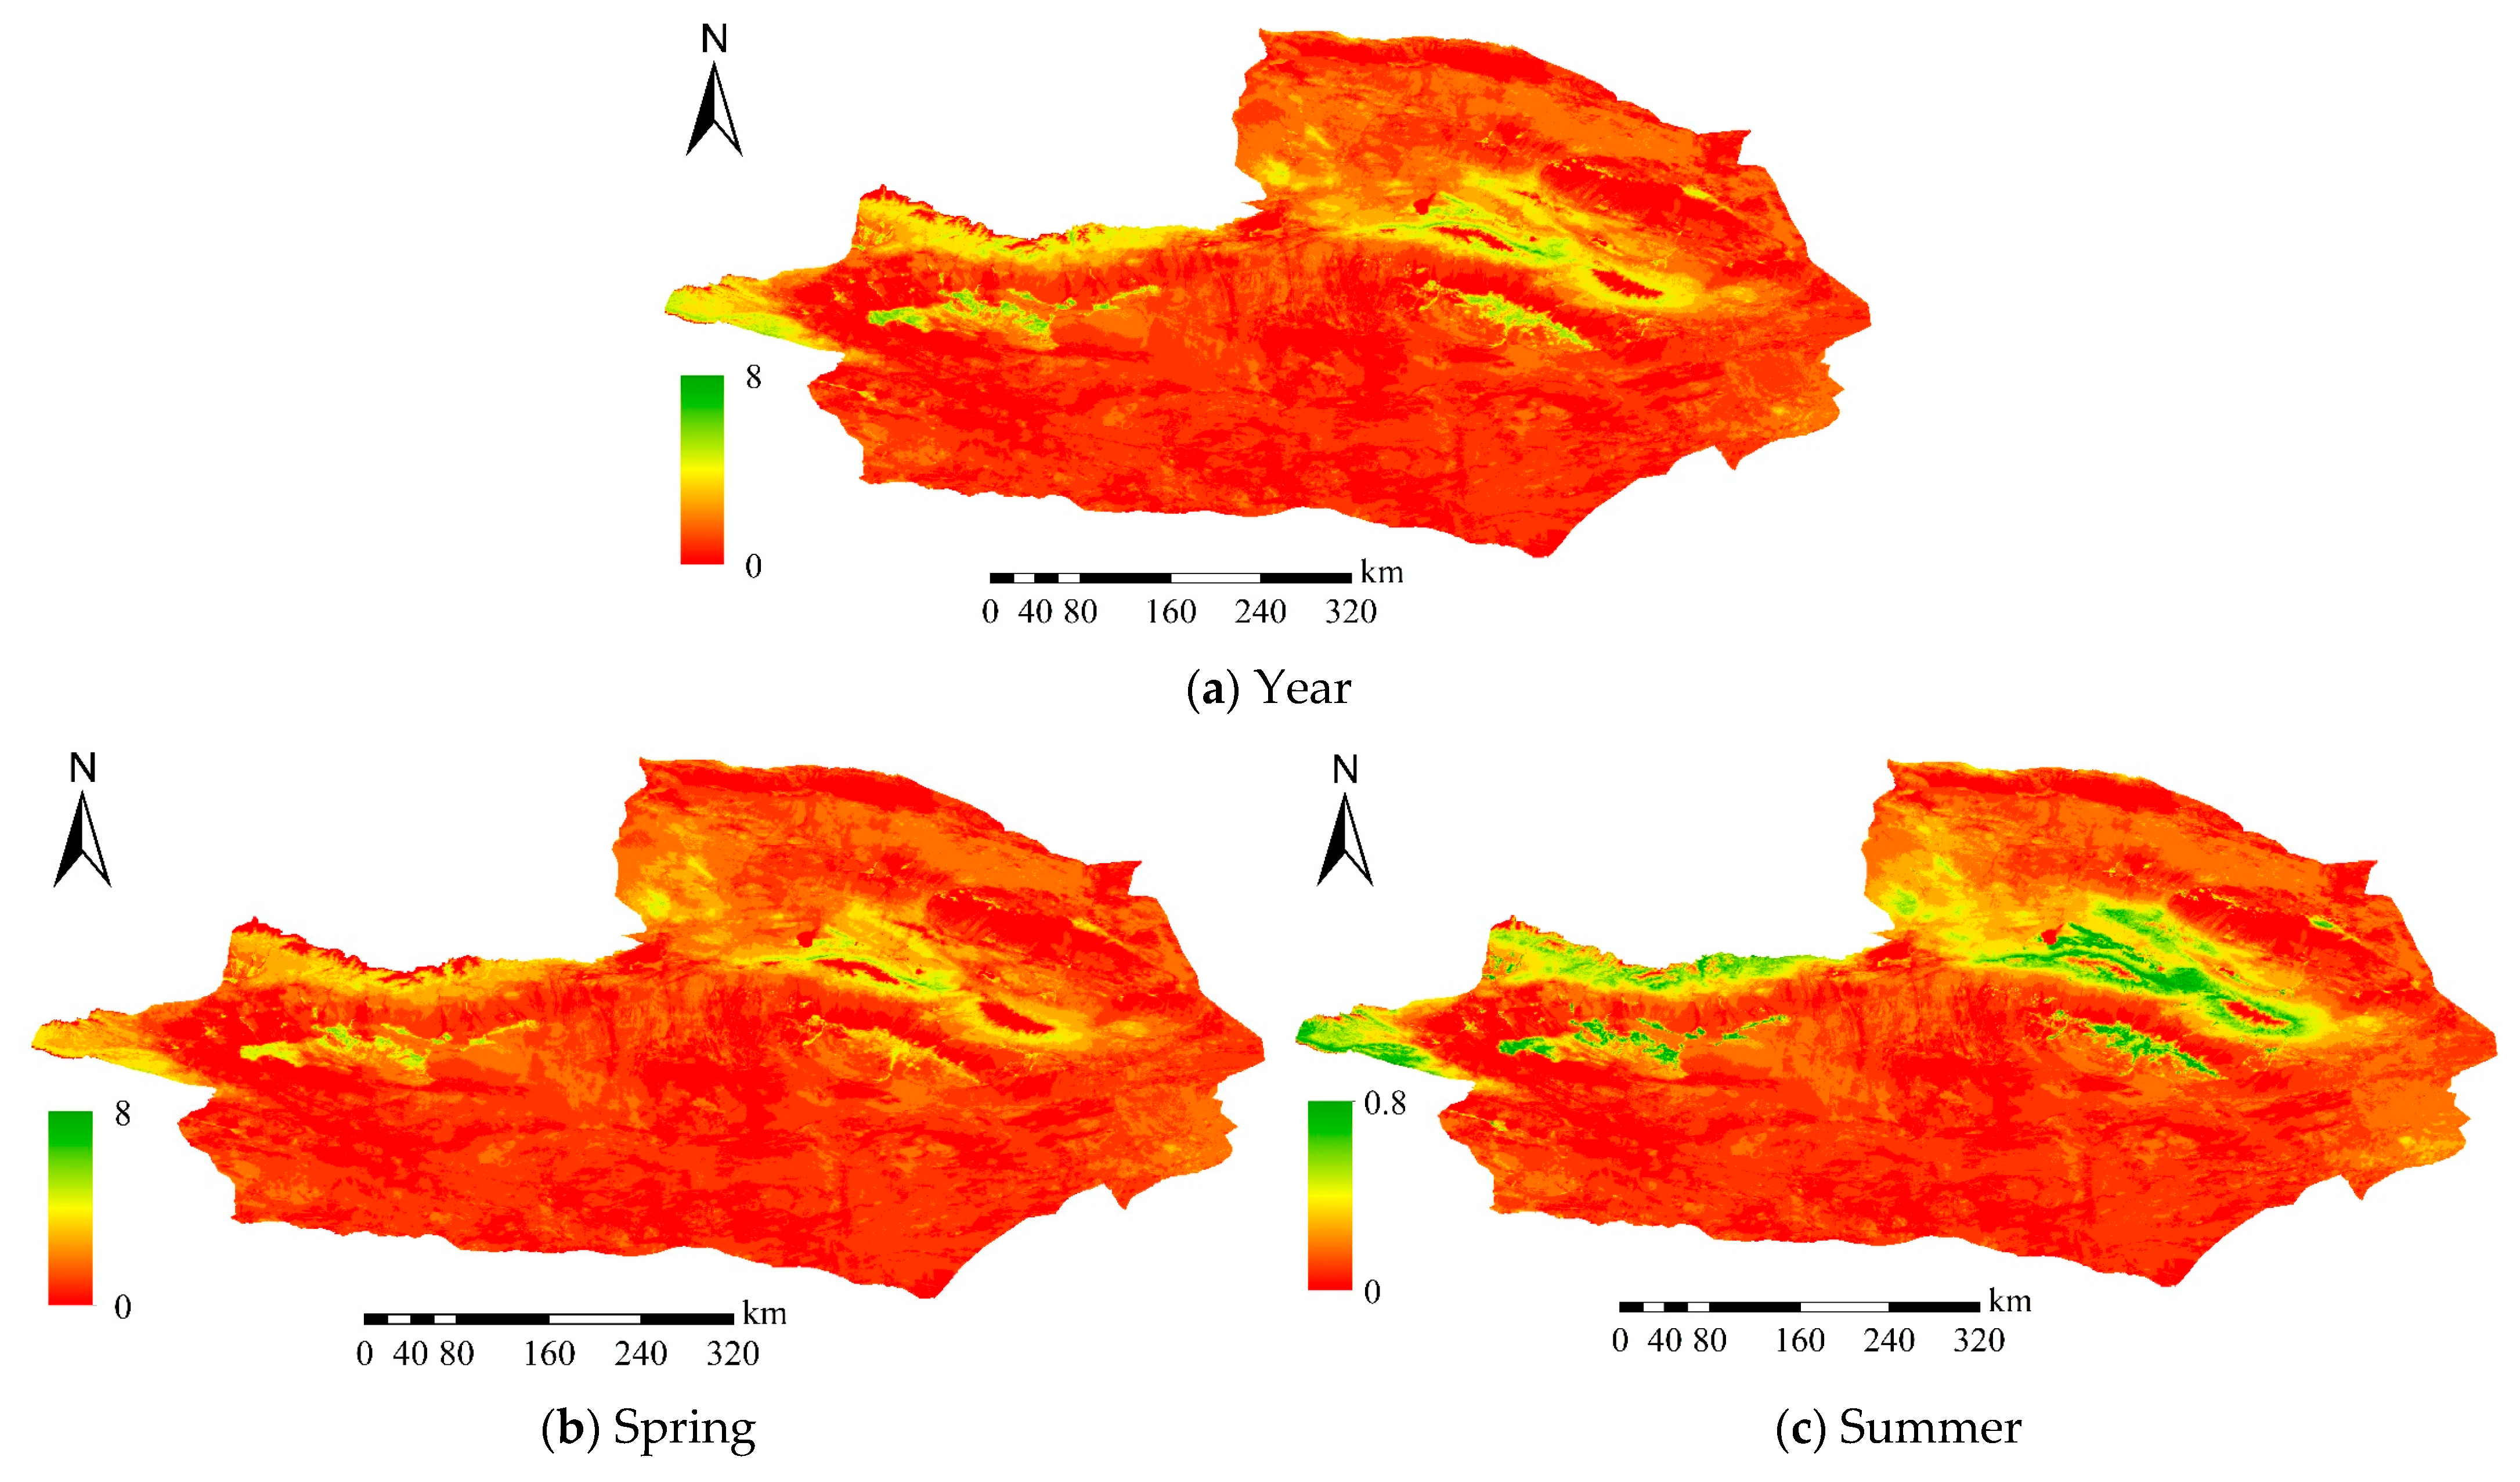
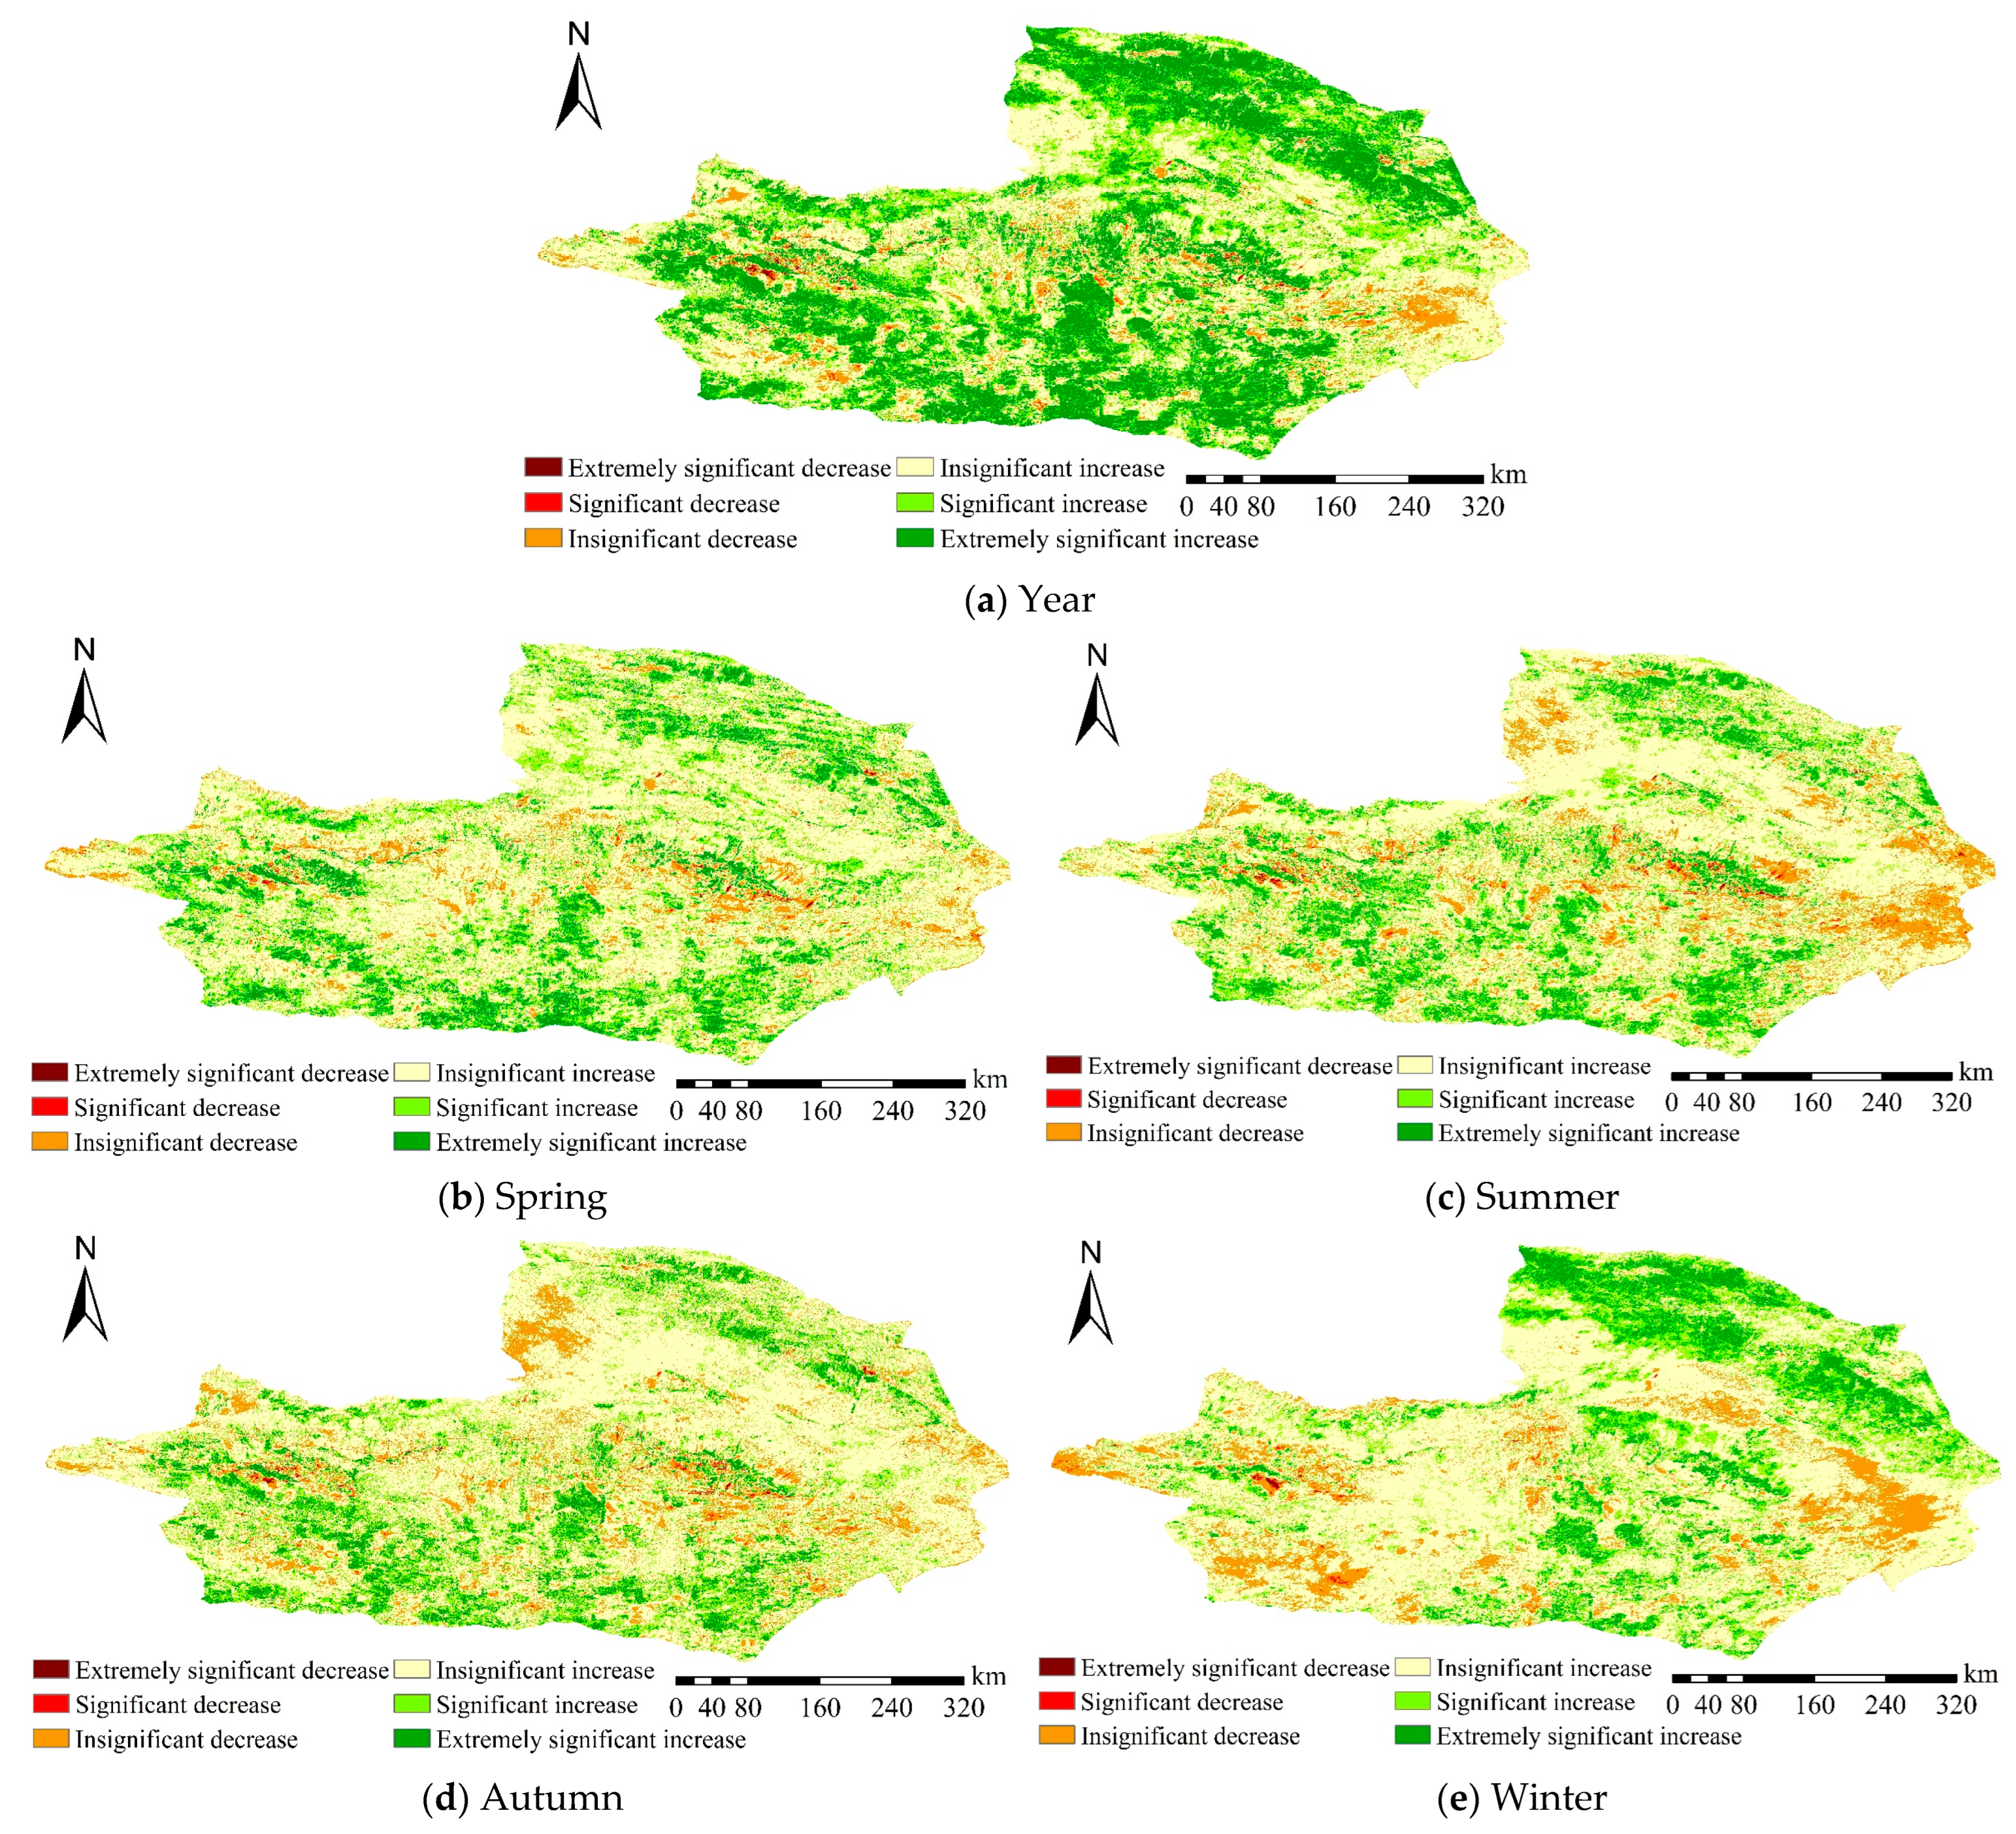
3.3. Analysis of NDVI Spatial Variation Trend

Figure 6 illustrates the spatial distribution of annual and seasonal NDVI trends in the Turpan-Hami Basin from 2001 to 2020. From an interannual perspective (Figure 6a), NDVI across the entire study area generally exhibited an upward trend, particularly in the southwestern and northeastern regions, where areas with significant increases were relatively extensive. However, in the western and central parts of the basin, there were some areas with notable NDVI declines, indicating potential severe vegetation degradation issues in these regions. Compared to seasonal NDVI, annual NDVI showed improvement over a broader area and degradation over a narrower area. Among the seasons, NDVI improvements were dominant in all quarters, yet seasonal NDVI dynamics exhibited significant spatiotemporal heterogeneity (Figure 6). The areas with extremely significant and significant improvements in spring, summer, and autumn NDVI were similar, with the most pronounced improvement trends in the northeastern and southwestern parts of the basin, primarily concentrated in grassland areas (Figure 1 and Figure 6). Additionally, the areas with extremely significant and significant degradation in NDVI during these three seasons were mainly located in the western and central parts of the basin (Figure 6b–d), suggesting that while vegetation recovery was widespread during these seasons, vegetation in some localized areas still faced challenges. Notably, winter NDVI changes (Figure 6e) differed from those in other seasons, with areas of extremely significant and significant improvement primarily distributed in the northeastern and central regions, while areas of significant degradation were predominantly located in the southwestern region.
Figure 7 presents the areal statistics of different changing trends of NDVI in each season. Although the areas of NDVI improvement and degradation vary in different seasons, the total areas of improvement and degradation are similar. Specifically, the extremely significant improvement area ranges between 10% and 11.5%, the significant improvement area ranges between 17.9% and 22.7%, and the area with insignificant improvement constitutes the largest proportion, exceeding 58.6%. In contrast, the total degraded area is less than 12%. Notably, the improved area accounts for over 87% of the total area of the Turpan-Hami Basin, where vegetation improvement is substantially more extensive than vegetation degradation.

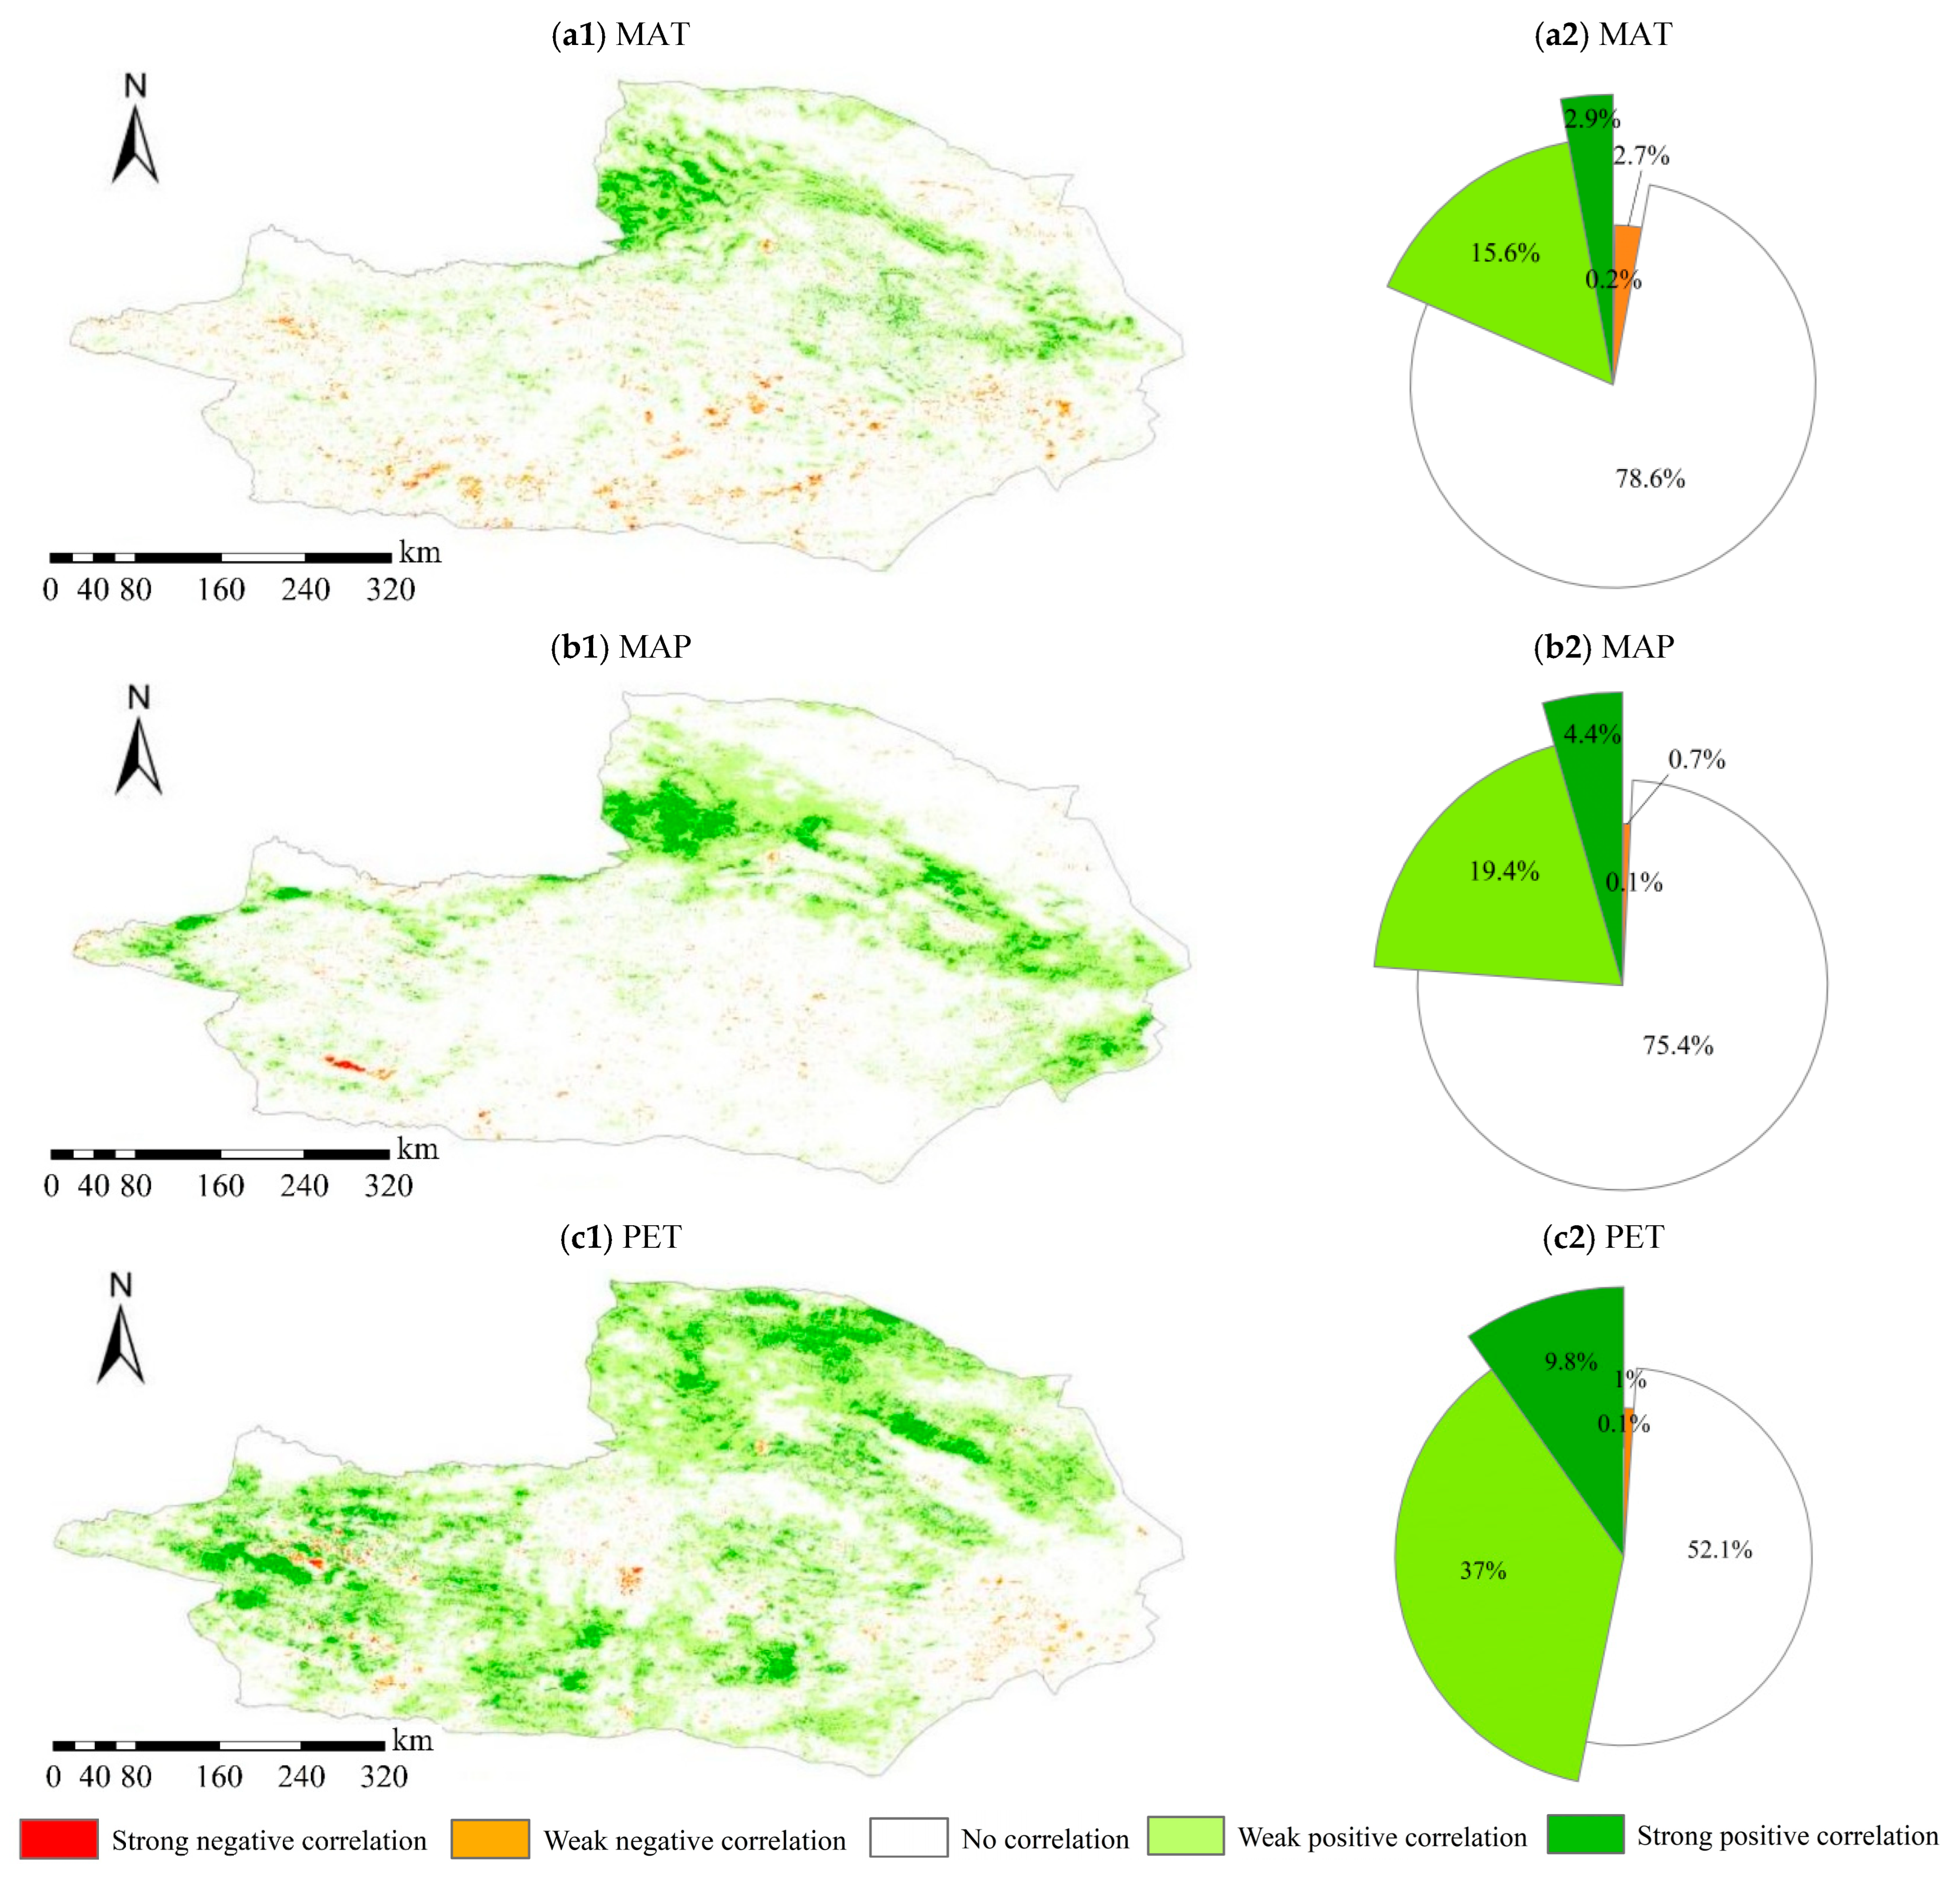
3.4. Correlation Analysis of NDVI and Climate Factors in the Turpan-Hami Basin

Figure 8 shows that the spatial distribution of the correlation between NDVI and climatic factors in the Turpan-Hami Basin from 2001 to 2020 exhibits a significant threshold effect and regional heterogeneity. The relationship between mean annual temperature and NDVI is predominantly non-correlative (78.6%) (Figure 8a), indicating that vegetation response to temperature changes in this region is strongly constrained. Potential promoting effects of temperature increases are only observed in a few high-altitude cool areas (2.9% strongly positively correlated) and the foothill transition zone (15.6% weakly positively correlated), whereas the weak negative correlation in low-lying desert areas (2.9%) suggests that high temperatures may further compress vegetation survival space by intensifying evaporation. The correlation between mean annual precipitation and NDVI is also highly limited (Figure 8b), although the northwestern piedmont area and the northeast riparian grassland zone (4.4% strongly positively correlated, 19.4% weakly positively correlated) show a short-term water activation effect due to precipitation redistribution and runoff recharge. Notably, the weak positive correlation (37%) and strong positive correlation (9.8%) between PET and NDVI account for nearly half (46.8%) of the total, predominantly concentrated in the oasis-desert transition zone and the foothill transition zone (Figure 8c). This may be attributed to the regulation of shallow groundwater and human irrigation vegetation through evapotranspiration or the synchronicity of evapotranspiration and photosynthesis during brief wet periods.

4. Discussion

This study elucidates the spatiotemporal evolution of vegetation coverage in the arid region of the Turpan-Hami Basin and the intricate response mechanisms of vegetation to climatic factors and anthropogenic activities. The relevant conclusions offer multiple implications for the improvement of the theoretical framework of ecological science in arid regions and for guiding ecological restoration practices. Firstly, the significant upward trend in NDVI aligns with the global “greening” phenomenon observed in arid regions [14], yet localized degradation (e.g., in the western part of the basin) underscores the spatial heterogeneity of vegetation dynamics. While traditional studies posit that vegetation dynamics in arid regions are predominantly driven by precipitation [28,29], this study found that in the Turpan-Hami Basin, which is an arid region, the impact of precipitation on NDVI is highly limited due to low precipitation (75.4% of the area shows no correlation). Precipitation only exhibits a short-term water activation effect in the northwestern piedmont zones and northeastern riparian grassland zones, where strong positive correlations account for merely 4.4% of the total area and weak positive correlations account for 19.4%. These results corroborate the “precipitation threshold effect” hypothesis [15], which posits that when precipitation falls below the ecological water requirement threshold, vegetation dynamics are more regulated by non-climatic factors (e.g., groundwater or human irrigation) rather than responding directly to precipitation fluctuations. Jia et al. confirmed through soil moisture observation networks that in extremely arid regions, vegetation water use relies predominantly on groundwater or snowmelt recharge rather than direct precipitation input [30], which also explains the localized positive correlation between NDVI and precipitation in the piedmont area observed in this study (attributable to runoff recharge effects). It is worth noting that the pronounced diurnal variations in shallow soil heat flux (SHF) can indirectly regulate vegetation-available water by influencing soil microclimate and evaporation processes [31]. Furthermore, vegetation responses to temperature changes are also strongly constrained. The positive response of NDVI to temperature is restricted to high-altitude cool regions (2.9%), suggesting that temperature increases may enhance vegetation activity by extending the growing season [32]. However, in low-altitude areas, temperature increases have an inhibitory effect due to heightened evapotranspiration. This altitudinal gradient response pattern aligns closely with the temperature sensitivity ecological threshold theory proposed by Ahlström et al. [33]. Against the backdrop of climate change, Qian et al. pointed out that there is a climate effect on the green development of vegetation in China, and the sensitivity of land surface temperature to vegetation shows significant changing trends, which may play a role in regulating land surface temperature [34]. This is echoed in this study by the complex relationship between vegetation and temperature changes in the arid Turpan-Hami Basin, further indicating that in arid regions, the interaction between vegetation and temperature may present a unique response pattern due to the particularity of the regional ecological environment (such as water availability and elevation).
Secondly, PET exhibited weak positive correlations with NDVI across 37% of the study area and strong positive correlations in 9.8% of the region, challenging the traditional paradigm that evapotranspiration characterizes water stress in research [13]. For instance, Abiye et al. found that increased PET exacerbates water deficits and inhibits vegetation growth in the Sahel region of Africa [35]. However, this study observed a positive correlation between PET and NDVI in the oasis-desert transition zone, which may be attributed to the replenishment of shallow groundwater or the water regulation effects of irrigation systems. This finding aligns with Seddon et al.’s conclusion in the Mongolian Plateau, which indicates that human activities (such as groundwater extraction) can indirectly enhance vegetation adaptability to evapotranspiration by alleviating water limitations [36]. It is crucial to highlight that the PET estimation method employed in this study not only incorporates mean temperature but also integrates critical information like diurnal temperature ranges. This enables a more comprehensive characterization of the pronounced potential evaporation demand in continental arid zones like the Turpan-Hami Basin. The latest study by Zhang et al. confirmed through eddy covariance observations that in arid regions influenced by irrigation, the positive correlation between PET and gross primary productivity (GPP) arises from the adaptive regulation of vegetation stomatal conductance in response to water supply [37]. Indirect support comes from Yisilayili et al.’s research in Xinjiang, which indicates that in areas with significant human impacts, such as croplands and oases, net primary productivity (NPP) shows a marked response to non-climatic factors [38]. Furthermore, land-use conversions, such as the transformation of grasslands to croplands leading to a 94.64 gC/m2 increase in NPP, clearly reflect that human regulation of moisture conditions can surpass natural climatic constraints, thereby potentially altering the apparent response of vegetation to metrics like PET [38]. This suggests that in oasis areas with stronger human intervention, PET reflects the unique mechanism by which vegetation regulates water use through evapotranspiration, rather than merely serving as a simple indicator of water stress. However, some regions within the basin (53.2% of the total area) showed no correlation between PET and NDVI. These regions represent natural ecosystems in the study area that are minimally or not at all influenced by anthropogenic water regulation. In such ecosystems, soil moisture is in a state of long-term depletion, with no regular irrigation to supplement it. Natural precipitation is scarce, evaporation is intense, and shallow groundwater is either too limited or too deep to be effectively utilized by shallow-rooted desert vegetation. Future research should further investigate the spatial heterogeneity of the PET-NDVI relationship across different regions and the underlying reasons to more accurately understand the response mechanisms of vegetation to water changes in arid areas.
Thirdly, the significant contribution of human activities to vegetation restoration, such as the increase in NDVI in oasis areas, confirms the “social-ecological coupling” characteristics of ecosystems in arid regions [20]. For instance, Zhao et al. found that the expansion of farmland in Xinjiang is highly synchronized with the increase in NDVI [19]. This study further reveals, through spatial heterogeneity analysis, that the construction of shelterbelts and irrigation projects are the core driving forces behind oasis vegetation improvement. However, ecological restoration and agricultural development overly dependent on groundwater, especially against the backdrop of a continuous rise in PET, may result in unsustainable water resource consumption. In the Turpan-Hami Basin, agricultural water use accounts for as much as 90% of the total. Should future climate change intensify the water supply-demand contradiction, the existing irrigation mode, which is heavily dependent on groundwater, will face significant challenges, and its long-term sustainability is questionable. The ecological risks arising therefrom need to be guarded against.
It should be noted that this study has several limitations. Although the MODIS NDVI data used were subject to strict quality control via Savitzky-Golay filtering and QA bands to eliminate the effects of clouds, snow, and atmospheric noise, residual noise or missing data may still introduce uncertainties in sparse vegetation areas of extremely arid regions, potentially affecting the accuracy of NDVI trend and correlation analyses. More importantly, this study did not quantitatively isolate the relative contributions of climate change and human activities (e.g., irrigation, shelterbelt construction) to NDVI variations. Additionally, key factors such as latitude, elevation, land use/cover changes, groundwater dynamics, and soil physical properties (e.g., water retention) were not incorporated into the analysis framework. These factors may play a crucial role in modulating vegetation responses to climate, particularly precipitation, in extremely arid regions [39,40]. In subsequent research, we will focus on the following aspects: (1) integrating multi-source data, including high-resolution soil moisture data, detailed land use/cover change data, and groundwater dynamic monitoring data; (2) employing advanced statistical methods, such as residual trend analysis and machine learning techniques, to quantify the relative contributions of natural (climatic) and anthropogenic factors to vegetation changes; (3) introducing time-series deep analysis methods, such as least squares wavelet analysis [41], to reveal the coherence and phase lag relationships between NDVI and climatic variables (e.g., precipitation and land surface temperature) in the time-frequency domain, thereby deepening the understanding of the vegetation-climate coupling dynamics in the Turpan-Hami Basin; and (4) developing more comprehensive models by incorporating key anthropogenic factors (e.g., irrigation, land use changes, and groundwater dynamics) and non-climatic natural factors (e.g., soil and topography) into the vegetation-climate response model framework to enhance the predictive accuracy and applicability of models in arid regions. These improvements will provide a more robust scientific foundation for regional water resource management and ecological restoration strategies and contribute to the development of a globally applicable theoretical framework for ecological restoration in arid regions.
Finally, this study offers methodological inspiration for constructing ecological models in arid regions. Traditional models often neglect the spatial heterogeneity of human activities [42], whereas this study emphasizes that in the arid regions, factors such as irrigation and land-use change should be incorporated into vegetation-climate response models to enhance predictive accuracy. By integrating medium-resolution remote-sensing and climate data, this study provides initial insights into the complexity of their interactions. The development direction of future models should be deepened closely around points 3 and 4 of the above future research directions.

5. Conclusions

This study systematically analyzed the spatiotemporal changes of NDVI in the lowest altitude Turpan-Hami Basin in China from 2001 to 2020 and its response to climate change (temperature, precipitation, and PET), addressing the research gap in vegetation dynamics and driving mechanisms in lowest altitude and highest temperature arid regions of China. It revealed the composite response mechanism of vegetation dynamics to climate and human intervention, providing a scientific basis for ecological restoration and water resource management in arid areas. The specific conclusions are as follows:
  • NDVI in the Turpan-Hami Basin exhibited a significant upward trend from 2001 to 2020, indicating gradual improvements in vegetation coverage and growth conditions. The most substantial increases occurred in winter, while the highest values were observed in summer. Spatially, high-value areas were concentrated in oases and mountainous forest and grassland zones, whereas low-value areas predominated in desert Gobi regions. Notably, 34.2% of the region experienced significant vegetation improvement, yet some areas (particularly the western and central regions) showed marked degradation.
  • Overall, no significant correlation was found between temperature and NDVI, and precipitation exhibited limited influence, with only localized positive responses. In contrast, PET demonstrated a significant positive correlation with NDVI across 46.8% of the study area, challenging the traditional paradigm that evapotranspiration represents water stress.
  • Human activities, such as irrigation and shelterbelt projects, have significantly driven the restoration of oasis vegetation. However, excessive reliance on groundwater may lead to unsustainable water resource consumption, highlighting the need for careful management.

Author Contributions

Conceptualization, C.L. and Y.Y.; data curation, L.S., J.H., H.Z., Y.L., Z.G., L.Z. and I.M.; formal analysis, C.L.; methodology, C.L., Y.Y. and Y.L.; software, L.S. and J.H.; supervision, Y.Y. and R.Y.; validation, C.L., Y.L. and M.W.; visualization, C.L., H.Z., Z.G. and L.Z.; writing—original draft, C.L.; writing—review and editing, C.L. and Y.Y. All authors have read and agreed to the published version of the manuscript.

Funding

This research has been funded by the National Key Research and Development Program of China (2023YFF0805603) and the Third Xinjiang Comprehensive Scientific Research Project on Comprehensive Evaluation and Sustainable Utilization of Land Resources in the Turpan-Hami Basin (2022xjkk1102).

Institutional Review Board Statement

Not applicable.

Informed Consent Statement

Not applicable.

Data Availability Statement

The original contributions presented in the study are included in the article; further inquiries can be directed to the corresponding author.

Conflicts of Interest

The authors declare no conflicts of interest.

References

  1. Deng, C.; Zhang, B.; Cheng, L.; Hu, L.; Chen, F. Vegetation dynamics and their effects on surface water-energy balance over the Three-North Region of China. Agric. For. Meteorol. 2019, 275, 79–90. [Google Scholar] [CrossRef]
  2. Lavergne, A.; Graven, H.; De Kauwe, M.G.; Keenan, T.F.; Medlyn, B.E.; Prentice, I.C. Observed and modelled historical trends in the water-use efficiency of plants and ecosystems. Glob. Change Biol. 2019, 25, 2242–2257. [Google Scholar] [CrossRef] [PubMed]
  3. Xu, Y.J.; Dong, K.; Jiang, M.; Liu, Y.L.; He, L.Y.; Wang, J.L.; Zhao, N.X.; Gao, Y.B. Soil moisture and species richness interactively affect multiple ecosystem functions in a microcosm experiment of simulated shrub encroached grasslands. Sci. Total Environ. 2022, 803, 149950. [Google Scholar] [CrossRef] [PubMed]
  4. Zhang, Z.Q.; Liu, H.; Zuo, Q.; Yu, J.T.; Li, Y. Spatiotemporal change of fractional vegetation cover in the Yellow River Basin during 2000–2019. Resour. Sci. 2021, 43, 849–858. [Google Scholar] [CrossRef]
  5. Sun, W.Y.; Song, X.Y.; Mu, X.M.; Gao, P.; Wang, F.; Zhao, G.J. Spatiotemporal vegetation cover variations associated with climate change and ecological restoration in the Loess Plateau. Agric. For. Meteorol. 2015, 209–210, 87–99. [Google Scholar] [CrossRef]
  6. IPCC. Climate Change 2021: The Physical Science Basis. Contribution of Working Group I to the Sixth Assessment Report; Cambridge University Press: Cambridge, UK, 2021. [Google Scholar] [CrossRef]
  7. Li, Z.; Li, Y.P.; Li, H.W.; Liu, Y.C.; Wang, C. Analysis of drought change and its impact in Central Asia. Adv. Earth Sci. 2022, 37, 37–50. [Google Scholar] [CrossRef]
  8. Olusegun, C.F.; Adeyewa, Z.D. Spatial and temporal variation of normalized difference vegetation index (NDVI) and rainfall in the north east arid zone of Nigeria. Atmos. Clim. Sci. 2013, 3, 421–426. [Google Scholar] [CrossRef]
  9. Sun, R.; Zhang, F.M.; Weng, S.H.; Liu, Q. Spatio-temporal changes of NDVI and its response to climate in China from 2001 to 2021. China Environ. Sci. 2023, 43, 5519–5528. [Google Scholar] [CrossRef]
  10. Myneni, R.B.; Keeling, C.D.; Tucker, C.J.; Aarar, G.; Nemami, R.R. Increased plant growth in the northern high latitudes from 1981 to 1991. Nature 1997, 386, 698–702. [Google Scholar] [CrossRef]
  11. Schmidt, M.; Klein, D.; Conrad, C.; Dech, S.; Paeth, H. On the relationship between vegetation and climate in tropical and northern Africa. Theor. Appl. Climatol. 2014, 115, 341–353. [Google Scholar] [CrossRef]
  12. Zhang, R.H.; Gong, Y.S.; Tan, M.H. Regional comparison of changes in NDVI in arid regions of Central Asia. Res. Environ. Sci. 2025, 38, 90–100. [Google Scholar] [CrossRef]
  13. McGwire, K.; Minor, T.; Fenstermaker, L. Hyperspectral mixture modeling for quantifying sparse vegetation cover in arid environments. Remote Sens. Environ. 2000, 72, 360–374. [Google Scholar] [CrossRef]
  14. Fensholt, R.; Rasmussen, K.; Nielsen, T.T.; Mbow, C. Evaluation of earth observation based long term vegetation trends—Intercomparing NDVI time series trend analysis consistency of Sahel from AVHRR GIMMS, Terra MODIS and SPOT VGT data. Remote Sens. Environ. 2009, 113, 1886–1898. [Google Scholar] [CrossRef]
  15. Wang, X.M.; Zhang, C.X.; Hasi, E.; Dong, Z.B. Has the Three Norths Forest Shelterbelt Program solved the desertification and dust storm problems in arid and semiarid China? J. Arid Environ. 2010, 74, 13–22. [Google Scholar] [CrossRef]
  16. Zhu, Z.; Piao, S.; Myneni, R.B.; Huang, M.; Zeng, Z.; Canadell, J.G.; Zeng, N. Greening of the earth and its drivers. Nat. Clim. Change 2016, 6, 791–795. [Google Scholar] [CrossRef]
  17. Lian, X.; Piao, S.; Chen, A.; Wang, K.; Li, X.; Buermann, W.; Myneni, R.B. Seasonal biological carryover dominates northern vegetation growth. Nat. Commun. 2021, 12, 983. [Google Scholar] [CrossRef]
  18. Yan, X.Y.; Zhang, Q.; Zhang, W.B.; Ren, X.Y.; Wang, S.; Zhao, F.N. Analysis of climate characteristics in the Pan-Central-Asia arid region. Arid Zone Res. 2021, 38, 1–11. [Google Scholar] [CrossRef]
  19. Zhao, X.; Tan, K.; Fang, J.Y. NDVI-based interannual and seasonal variations of vegetation activity in Xinjiang during the period of 1982–2006. Arid Zone Res. 2011, 28, 10–16. [Google Scholar] [CrossRef]
  20. Cao, S.; Chen, L.; Shankman, D.; Wang, C.; Wang, X.; Zhang, H. Excessive reliance on afforestation in China’s arid and semi-arid regions: Lessons in ecological restoration. Earth-Sci. Rev. 2011, 104, 240–245. [Google Scholar] [CrossRef]
  21. Li, X.B.; Shi, P.J. Sensitivity analysis of variation in NDVI, temperature and precipitation in typical vegetation types across China. Chin. J. Plant Ecol. 2000, 24, 379. [Google Scholar] [CrossRef]
  22. Li, X.H.; Shi, Q.D.; Guo, J.; Bayindala, C.S.L.; Qi, J.G. The response of NDVI to climate variability in northwest arid of China from 1981 to 2001. J. Arid Land Resour. Environ. 2009, 23, 12–16. [Google Scholar] [CrossRef]
  23. Guo, N.; Zhu, Y.J.; Wang, J.M.; Deng, C.P. The relationship between NDVI and climate element for 22 years in different vegetation areas of northwest China. Chin. J. Plant Ecol. 2008, 32, 319–327. [Google Scholar] [CrossRef]
  24. Hargreaves, G.H.; Samani, Z.A. Reference crop evapotranspiration from temperature. Appl. Eng. Agric. 1985, 1, 96–99. [Google Scholar] [CrossRef]
  25. Ali, R.; Kuriqi, A.; Abubaker, S.; Kisi, O. Long-term trends and seasonality detection of the observed flow in Yangtze River using Mann-Kendall and Sen’s innovative trend method. Water 2019, 11, 1855. [Google Scholar] [CrossRef]
  26. Li, P.; Wang, J.; Liu, M.; Xue, Z.; Bagherzadeh, A.; Liu, M. Spatio-temporal variation characteristics of NDVI and its response to climate on the Loess Plateau from 1985 to 2015. Catena 2021, 203, 105331. [Google Scholar] [CrossRef]
  27. Chen, W.Y.; Xia, L.H.; Xu, G.L.; Yu, S.Q.; Chen, H.; Chen, J.F. Dynamic variation of NDVI and its influencing factors in the Pearl River Basin from 2000 to 2020. Ecol. Environ. 2022, 31, 1306–1316. [Google Scholar] [CrossRef]
  28. Emmett, K.D.; Renwick, K.M.; Poulter, B. Disentangling climate and disturbance effects on regional vegetation greening trends. Ecosystems 2019, 22, 873–891. [Google Scholar] [CrossRef]
  29. Liu, D.D.; Pan, P.; Fu, J.; Ouyang, X.Z. Spatiotemporal variation and driving factors of vegetation coverage from 2000 to 2020 in southern Jiangxi Province, China. Chin. J. Appl. Ecol. 2023, 34, 2919–2928. [Google Scholar]
  30. Jia, X.; Shao, M.A.; Zhu, Y.; Luo, Y. Soil moisture decline due to afforestation across the Loess Plateau, China. J. Hydrol. 2017, 546, 113–122. [Google Scholar] [CrossRef]
  31. Aliabad, F.A.; Ghaderpour, E. Modeling soil heat flux from MODIS products for arid regions. Ecol. Inform. 2025, 86, 5. [Google Scholar] [CrossRef]
  32. Piao, S.; Fang, J.; Zhou, L.; Ciais, P.; Zhu, B. Variations in satellite-derived phenology in China’s temperate vegetation. Glob. Change Biol. 2006, 12, 672–685. [Google Scholar] [CrossRef]
  33. Ahlström, A.; Raupach, M.R.; Schurgers, G.; Smith, B.; Arneth, A.; Jung, M.; Reichstein, M.; Canadell, J.G.; Friedlingstein, P.; Jain, A.K.; et al. The dominant role of semi-arid ecosystems in the trend and variability of the land CO2 sink. Science 2015, 348, 895–899. [Google Scholar] [CrossRef] [PubMed]
  34. Qian, Z.; Sun, Y.; Chen, Z.; Ji, F.; Feng, G.; Ma, Q. Analysis of land surface temperature sensitivity to vegetation in China. Remote Sens. 2023, 15, 4544. [Google Scholar] [CrossRef]
  35. Abiye, O.E.; Matthew, O.J.; Sunmonu, L.A.; Babatunde, O.A. Potential evapotranspiration trends in West Africa from 1906 to 2015. SN Appl. Sci. 2019, 1, 1434. [Google Scholar] [CrossRef]
  36. Seddon, A.W.R.; Macias-Fauria, M.; Long, P.R.; Benz, D.; Willis, K.J. Sensitivity of global terrestrial ecosystems to climate variability. Nature 2016, 531, 229–232. [Google Scholar] [CrossRef] [PubMed]
  37. Zhang, Z.; Li, X.; Ju, W.; Zhou, Y.; Cheng, X. Improved estimation of global gross primary productivity during 1981–2020 using the optimized P model. Sci. Total Environ. 2022, 838, 156172. [Google Scholar] [CrossRef]
  38. Yisilayili, G.; He, B.; Song, Y.; Luo, X.; Yang, W.; Chen, Y. Simulation of vegetation NPP in typical Arid regions based on the CASA model and quantification of its driving factors. Land 2025, 14, 371. [Google Scholar] [CrossRef]
  39. Wang, L.; d’Odorico, P.; Evans, J.P.; Eldridge, D.J.; McCabe, M.F.; Caylor, K.K.; King, E.G. Dryland ecohydrology and climate change: Critical issues and technical advances. Hydrol. Earth Syst. Sci. 2012, 16, 2585–2603. [Google Scholar] [CrossRef]
  40. Reynolds, J.F.; Smith, D.M.S.; Lambin, E.F.; Turner, B.L.; Mortimore, M.; Batterbury, S.P.; Downing, T.E.; Dowlatabadi, H.; Fernández, R.J.; Herrick, J.E.; et al. Global desertification: Building a science for dryland development. Science 2007, 316, 847–851. [Google Scholar] [CrossRef]
  41. Ghaderpour, E.; Mazzanti, P.; Scarascia Mugnozza, G.; Bozzano, F. Coherency and phase delay analyses between land cover and climate across Italy via the least-squares wavelet software. Int. J. Appl. Earth Obs. Geoinf. 2023, 118, 103241. [Google Scholar] [CrossRef]
  42. Chen, X.P.; Zhao, X.Y.; Zhang, J.; Wang, R.X.; Lu, J.N. Variation of NDVI spatio-temporal characteristics and its driving factors based on geodetector model in Horqin Sandy Land, China. Chin. J. Plant Ecol. 2023, 47, 1082–1093. [Google Scholar] [CrossRef]
Figure 1. Situations of the study area: (a) digital elevation model (DEM); (b) land use types; (c) precipitation (P); and (d) emperature (T). Note: The base map is made from the standard map of the Ministry of Natural Resources, with the review number GS (2025) 1508, and no changes have been made to the boundary of the base map. The same applies below.
Atmosphere 16 00778 g001
Figure 2. Flowchart of this work.
Atmosphere 16 00778 g002
Figure 3. Annual and seasonal decadal change trends of MAT (a), MAP (b), and PET (c) in the Turpan-Hami Basin from 2001 to 2020.
Atmosphere 16 00778 g003
Figure 4. Interannual variation trends of annual and seasonal NDVI in the Turpan-Hami Basin from 2001 to 2020: (a) annual average NDVI; (b) spring average NDVI; (c) summer average NDVI; (d) autumn average NDVI; (e) winter average NDVI.
Atmosphere 16 00778 g004
Figure 5. Spatiotemporal distribution of annual and seasonal NDVI in the Turpan-Hami Basin from 2001 to 2020: (a) annual average NDVI; (b) spring average NDVI; (c) summer average NDVI; (d) autumn average NDVI; (e) Wwinter average NDVI.
Atmosphere 16 00778 g005aAtmosphere 16 00778 g005b
Figure 6. Spatial distribution of the changing trends of annual and seasonal NDVI in the Turpan-Hami Basin from 2001 to 2020.
Atmosphere 16 00778 g006
Figure 7. Area ratio statistics of seasonal NDVI changes in Turpan-Hami Basin from 2001 to 2021 (%).
Atmosphere 16 00778 g007
Figure 8. Spatial distribution and proportion of the correlation degree between NDVI and MAT (a), MAP (b), and PET (c) in the Turpan-Hami Basin from 2001 to 2020.
Atmosphere 16 00778 g008
Table 1. Data sources and basic parameters.
ParameterAbbreviationUnitOriginal ResolutionData Source
Mean annual temperatureMAT°C1 kmhttps://cstr.cn/18406.11.Meteoro.tpdc.270961
accessed on 2 November 2024
Mean annual precipitationMAPmm1 kmhttps://doi.org/10.5281/zenodo.3114194
accessed on 3 November 2024
Maximum temperatureMax-T°C1 kmhttps://doi.org/10.5281/zenodo.3185722
accessed on 2 November 2024
Minimum temperatureMin-T°C1 kmhttps://doi.org/10.5281/zenodo.3185722
accessed on 2 November 2024
Table 2. Theil–Sen trend analysis and Mann–Kendall significance test classification.
SNDVI|Z|Change Trends
1S > 0|Z| ≧ 2.58Extremely significant decrease
2S > 01.96 ≦ |Z| < 2.58Significant decrease
3S > 0|Z| < 1.96Insignificant decrease
4S < 0|Z| ≧ 2.58Extremely significant increase
5S < 01.96 ≦ |Z| < 2.58Significant increase
6S < 0|Z| < 1.96Insignificant increase
Disclaimer/Publisher’s Note: The statements, opinions and data contained in all publications are solely those of the individual author(s) and contributor(s) and not of MDPI and/or the editor(s). MDPI and/or the editor(s) disclaim responsibility for any injury to people or property resulting from any ideas, methods, instructions or products referred to in the content.

