Article

Evaluation of the Influence of Wind-Induced Dune Movement on Transmission Tower Lines

1
Gansu Electric Power Corporation, State Grid, Lanzhou 730000, China
2
Key Laboratory of Mechanics on Disaster and Environment in Western China, Lanzhou University, Lanzhou 730000, China
3
College of Civil Engineering and Mechanics, Lanzhou University, Lanzhou 730000, China
*
Author to whom correspondence should be addressed.
Atmosphere 2025, 16(7), 779; https://doi.org/10.3390/atmos16070779
Submission received: 13 March 2025 / Revised: 1 June 2025 / Accepted: 10 June 2025 / Published: 25 June 2025

Abstract

Thorough investigation into dune morphology is pivotal for grasping the intricacies of constructing and operating power transmission lines in desert terrains. However, there remains a notable gap in the quantitative analysis and assessment of how dune dynamics evolve under the influence of transmission infrastructure. In this study, the Real-Space Cellular Automaton Laboratory is deployed to explore how transverse dunes evolve around transmission towers under diverse wind velocities and varying dune dimensions. The results reveal that, beyond the immediate vicinity of the transmission tower, the height of the transverse dune remains largely stable across broad spatial scales, unaffected by the transmission line. As wind velocities wane, the structural integrity of the transverse dunes is compromised, leading to an expansion in the size of the trail structures. Initially, the height of the dune surges, only to decline progressively over time, with the maximum fluctuation reaching nearly 1 m . The height of larger dunes escalates gradually at first, peaks, and then subsides, with the pinnacle height nearing 6.5 m . As a critical metric for safety evaluation, the height of the transmission line above ground initially plummets, then gradually rebounds, and shifts backward over time after hitting its nadir.

1. Introduction

As a clean and efficient secondary energy, solar power generation will not only play a key role in supporting social and economic development and serving people’s energy needs but also actively build a clean, low-carbon, safe, and efficient energy system [1,2,3,4]. China’s proposed dual carbon goals will aim to peak carbon dioxide emissions by 2030 and achieve carbon neutrality by 2060. By the end of June 2024, China’s wind power and photovoltaic power generation capacity reached 1.653 billion kilowatts, an increase of 25% year-on-year, accounting for about 53.8% of China’s total installed power generation capacity [5]. As a clean energy export area, the northwest of China transmits electricity to all parts of the country through transmission lines, and transmission towers are an important part. However, the power grid in Northwest China mostly passes through the Gobi and desert and is threatened by strong winds and sandstorms in the annual wind season. These extremely harsh environments bring great challenges to the construction of power grids, including the wind erosion of transmission poles and towers under sandstorm weather and even lead to the erosion and wear of tower rods and tower topsides. They seriously threaten the safety and stability of transmission towers [6].
The wind flow and sandstorm around the mountain has a significant influence on the transmission tower [7,8,9,10,11]. The results of wind tunnel experiments show that the wind direction on the lee slope of the mountain has a great effect on the structural response [12]. The dynamic response of a transmission tower under extreme weather such as a tornado is very important information. The laboratory simulation of the aeroelasticity of a transmission tower under a tornado vortex condition can provide the structural response in terms of the shear force, the overturning moment, and the lateral acceleration [13]. In the study of the dynamic response of a power transmission tower to a thunderstorm, the wind field data obtained by the computational fluid dynamics (CFD) model can be used to study the performance of the nonlinear frame element. With the increase in the sandstorm load intensity, the coupling effect of wind and sand on transmission towers gradually increases, which may even lead to the damage of the poles [14,15,16,17,18].
Sand dunes are a common geomorphological feature found around power transmission towers in arid and semi-arid regions (Figure 1). Among these, a transverse dune is one of the most prevalent types observed in natural environments [19,20,21]. The evidence from field investigations show that the desert interior is mainly distributed with large scale transverse dunes, which decrease in scale and gradually change into a barchan dune chain as the flow direction approaches the edge of the desert [22]. This shows that the transverse dune morphology is characterized by instability, and defects will occur when the sand supply is relatively small, breaking into a barchan dune chain [23,24]. It is generally believed that the wind direction and the thickness of the sand source are the two most important factors affecting the shape of sand dunes. When the wind direction is single, and the sand source is insufficient, the dune form is dominated by isolated barchan dunes, and when the sand source is sufficient, the individual barchan dunes will connect with each other to form barchan dune chains or larger transverse dunes [25]. Recent research has specifically pointed out that the critical sand source thickness between the barcrescent dune field and the transverse dune field is about 1.1 m under the action of a unidirectional wind [26].
Numerical simulation is not affected by the complexity of the field environment, and it is easy to separate and control a single variable, which becomes an effective tool to conduct a highly efficient long-term study on the evolution of aeolian landforms and their formation mechanisms [28,29]. In earlier work based on the continuous dune model, to calculate the sand volume exchange between dunes, a one-dimensional transverse dune field evolution model was established. The simulation results showed that the dunes in the dune field usually have a similar height and moving speed, which is consistent with some field measurements. In addition, the work showed that the merging behavior between dunes caused the number of dunes in the dune field to decrease regularly over time and to remain stable after the last merging behavior [30]. However, the dune field model derived from the continuous dune model has a certain preset number of small crescent dunes with typical morphological characteristics in the dune field at the initial time of simulation; so, these models cannot accurately depict the initial formation and development process of dune morphology [31]. Apart from the continuous dune model and its derived dune field simulation methods, the discrete cellular dune model is another widely recognized tool for simulating dune and dune field evolution. Based on the cellular automation method, the influence of the variation range of the angle between the second wind direction and the main wind direction on the dune field morphology was analyzed. The simulation results showed that there were two types of attractors in a dune field: a transverse dune and a longitudinal dune. The former is generated when the range of the wind direction angle is small, while the latter corresponds to a large range of the wind direction angle [32]. In the realm of dune simulation, a pivotal advancement has been made by Narteau et al. They developed a real-space cellular automaton model that couples sediment transport modeling through cellular automata with flow modeling through lattice gas cellular automata, thereby enabling the accurate simulation of the evolution of various natural dunes [33]. Based on this model, Lv et al. [34] analyzed the degree of influence of the wind conditions and sediment availability (i.e., sand supply) on the direction of dunes and clarified the mechanism by which different types of dunes can coexist in the same area in nature.
Based on the ReSCAL model, this study systematically analyzes the formation and development mechanisms of dune morphology, as well as the burial process of sand grains around transmission tower lines. On this basis, it further investigates the evolution patterns of dune morphology and ridge trends under complex conditions of multiple wind velocities and varying dune sizes.

2. Numerical Simulation Method

2.1. Real-Space Cellular Automaton Laboratory

The model employed in this research is the ReSCAL model, which integrates a cellular automata module with a lattice gas automata module. Utilizing this model, we successfully simulated the burial of a transmission tower by a transverse dune. The primary iteration mechanism of this model can be viewed as a generalized Poisson process or a particular instance of a continuous-time Markov process [35]. In the model, two adjacent cells form a double unit, and all the conversion processes simulating the physical processes occur within these double units. During the iteration process, assuming that there are n conversion processes T 1 , , T n taking place in the model, with their corresponding conversion rates being Λ 1 , , Λ n , we use t 0 1 to represent the conversion rate of the model, where t 0 represents the characteristic time scale of the model, that is, the unit time. Thus, at time t, the total rate of the conversion process in the model is
Λ ( t ) = i = 1 n N i ( t ) Λ i ,
where N i ( t ) is the count of active double units undergoing transformation. So, the probability of a transformation occurring Δ t between two time steps is
P ( t , Δ t ) = 1 exp ( Λ ( t ) Δ t ) .
Then, the value of Δ t can be obtained as
Δ t = 1 Λ ( t ) ln ( 1 p ) ,
where p is a value within the range of 0 to 1 obtained from a random seed.
To determine which type of transformation will occur, the model introduces a weight value
w i ( t ) = N i ( t ) Λ i Λ ( t ) .
This value reflects the relative significance of various conversion processes within the overall conversion. By statistically analyzing the weights of each conversion process, the model selects which type of conversion will occur.
To authentically replicate the gravity-induced collapse of sand particles, the model features a dedicated collapse mechanism. If the accumulated angle surpasses the angle of repose for a sand particle cluster, the cluster will collapse. Subsequently, the collapsed particles will descend along the dune’s edge due to gravitational pull. Within the model, the collapse rate, denoted as Λ θ , is predominantly determined by the local slope, θ . When the accumulated angle of a sand particle microcluster exceeds its angle of rest, the microcluster collapses, and the particles slide down the dune edge due to gravity.
The model aligns with reality in terms of space and time [33]. By comparing the real-world dune field’s characteristic wavelength λ r with the model’s characteristic wavelength size λ max [36], the model’s unit length is determined as
l 0 = λ r λ max .
By conducting field studies of real-world sand dunes, we can determine the characteristic wavelength of natural sand dunes:
λ r = 2 π L sat A / B u c / u * ¯ 2 / .
The saturation length in the formula is given by L sat = 2.2 d ρ s / ρ f , where A and B are fluid dynamics constants with values of 3.6 and 1.9, respectively. The symbol μ represents the friction angle, which researchers have found to be slightly larger than the avalanche slipface slope [37]. By comparing the simulated data from the model with experimental data, the unit time scale in the model t 0 can be determined [33] as
t 0 = Q s a t τ 1 Q s a t l 0 2 ,
where Q s a t τ 1 represents the saturated sediment transport flux calculated within the model, and Q s a t is the actual saturated sediment transport flux calculated from the local wind velocity. It uses the formula of Iversen and Rasmussen [38]:
Q s a t = 22 ρ f ρ s d g u * 2 u c 2 ,
where ρ f signifies the air density, while ρ s indicates the sand grain density; d corresponds to the sand grain diameter; g represents the gravitational acceleration, and it is assigned a value of 9.8 m / s 2 . u * and u c stand for the frictional wind velocity and the critical threshold wind velocity for motion initiation, respectively. The critical threshold wind velocity for motion initiation is determined using the formula proposed by Iversen [39]:
u c = 0.1 ρ s ρ f g d .

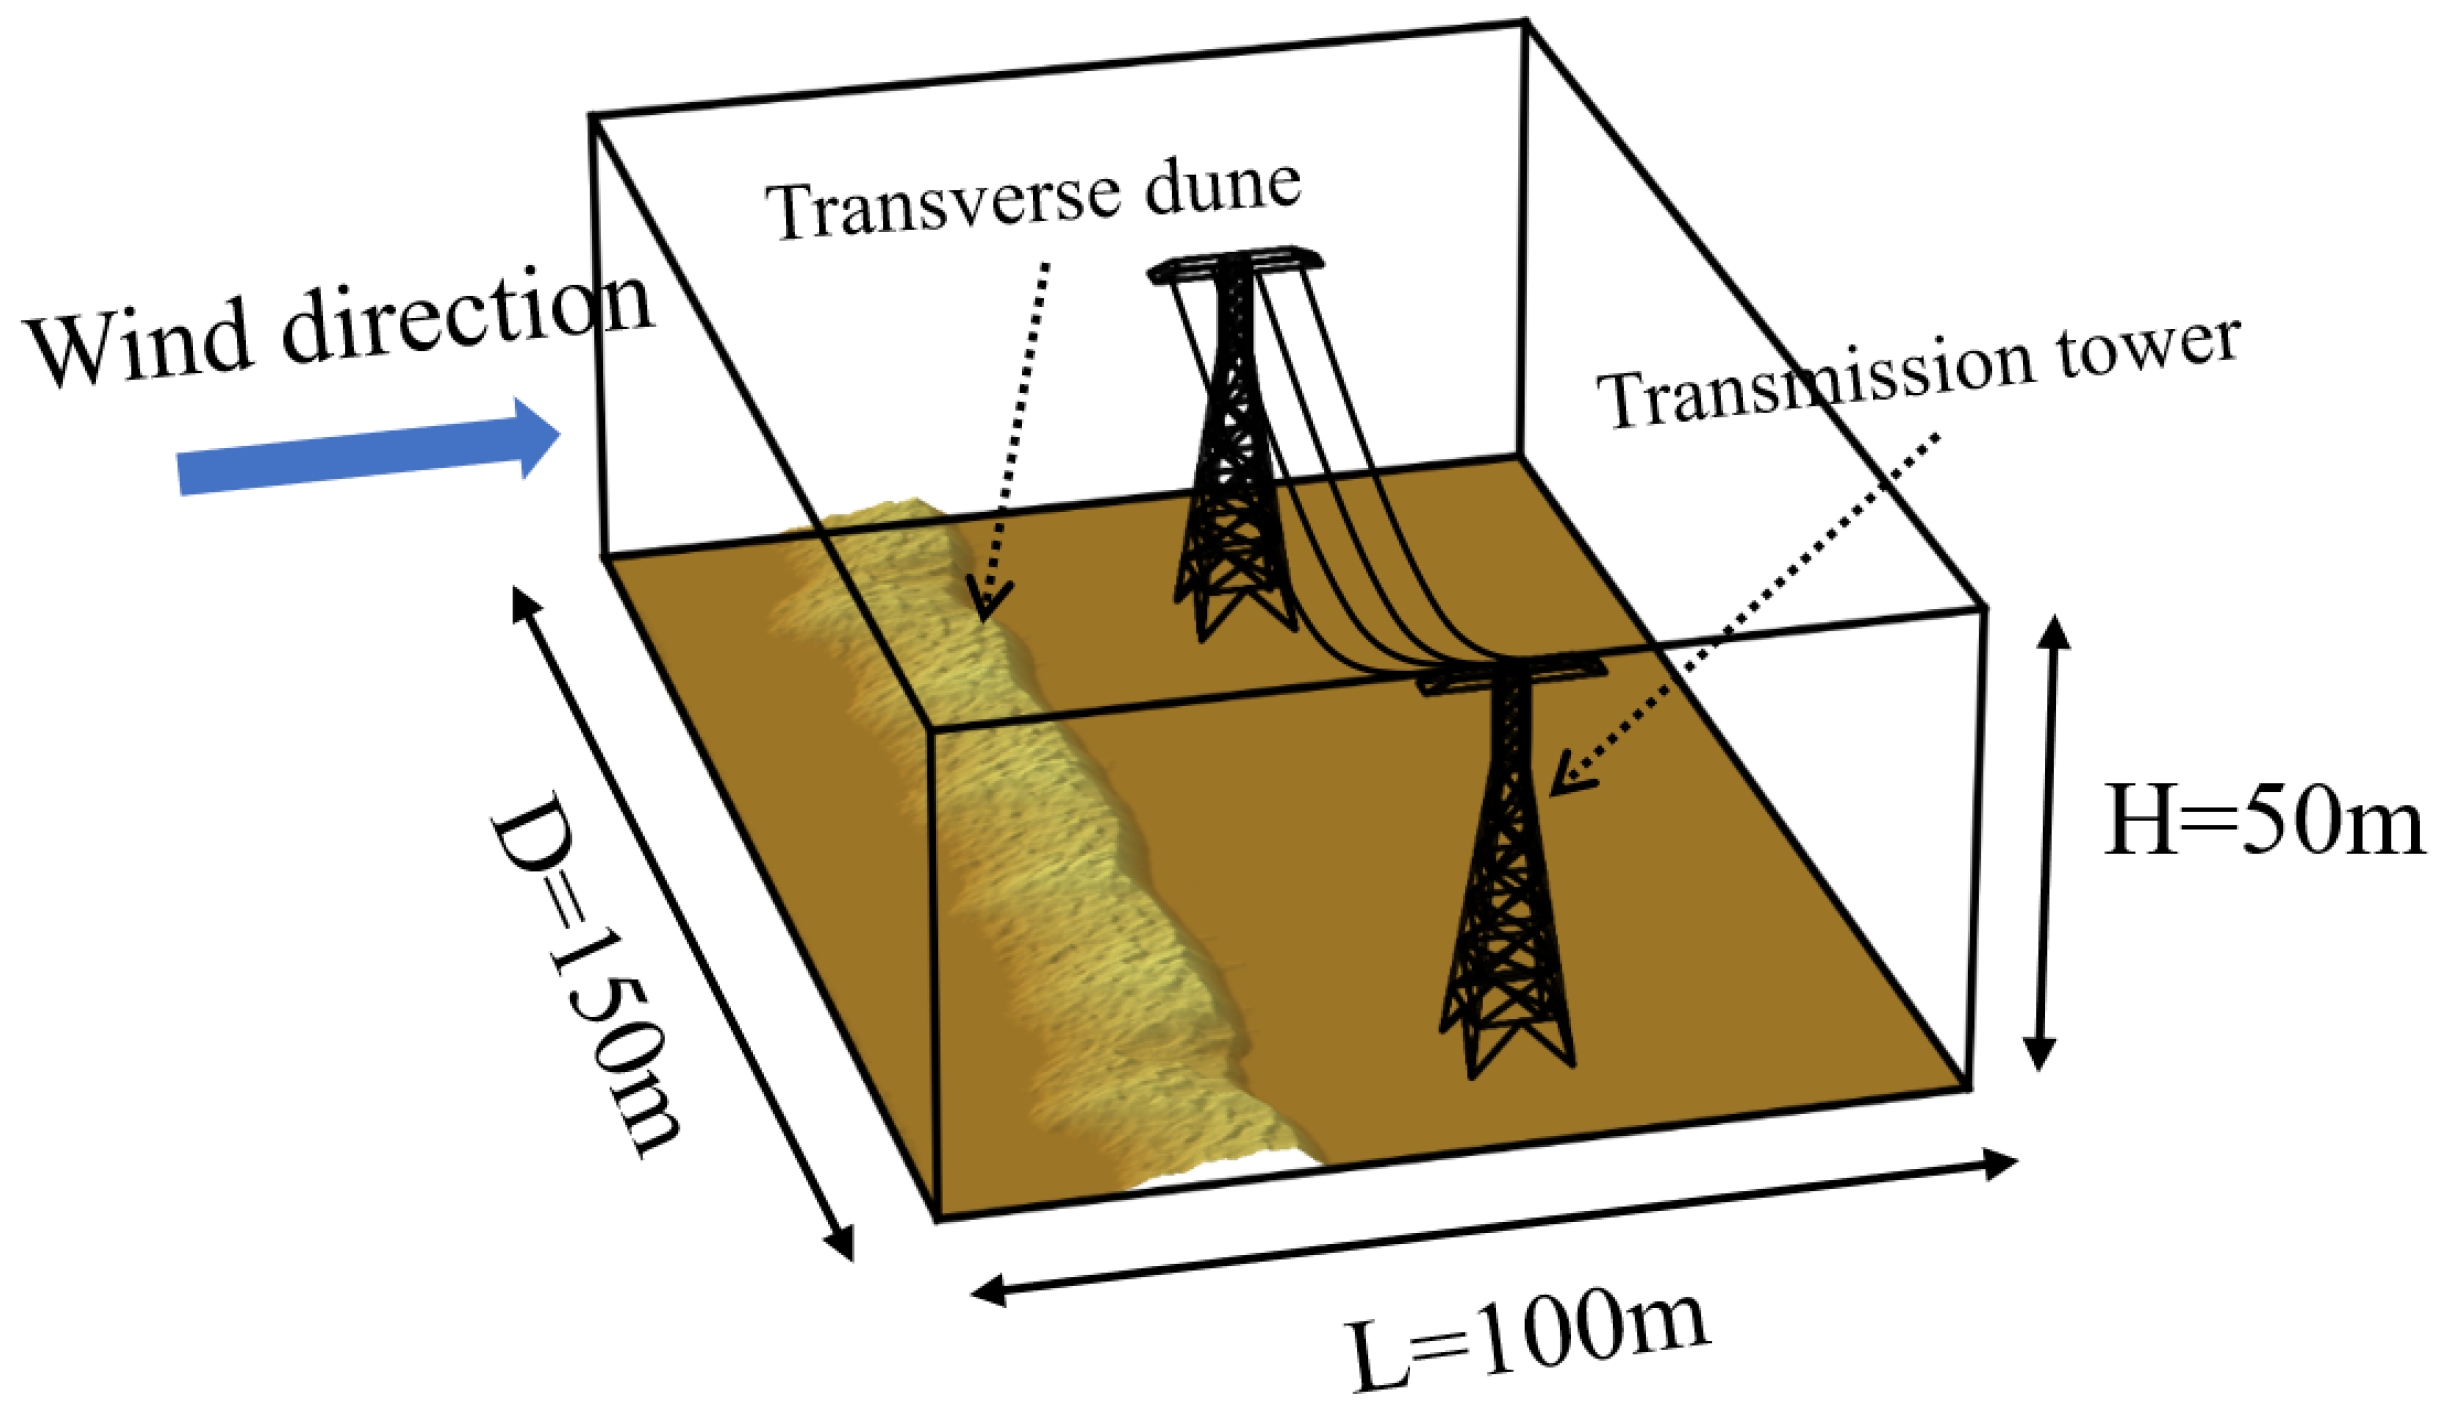
2.2. Study Site and Model Parameter Configuration and Validation

China has eight major deserts and four major sandy areas, with a total area of approximately 63.04 km 2 . Except for the Kubuqi Desert, which is located in the semi-arid region on the northern edge of the Ordos Plateau, the other seven deserts in China are all situated in arid regions. This study focuses on the area surrounding the desert photovoltaic industrial park in the southeastern part of the Tengger Desert, near Zhongwei City. The Tengger Desert, located in the southeastern part of the Alxa Plateau, is the fourth largest desert in China. The desert is characterized by a high percentage of dunes, which account for 95.3 % of the area, sparse vegetation, and a severe shortage of water throughout the year. Summer precipitation accounts for approximately 58 % of the annual rainfall. The average annual temperature ranges between 9   ° C and 11   ° C . Influenced by the East Asian monsoon system, the Tengger Desert experiences prevailing northwesterly winds in winter and southeasterly winds in summer. In some areas, the wind conditions are more complex due to topographical influences. The composition of the dune sediments is as follows: fine sand (125–250 μ m) accounts for 71.39 ± 17.65 % , medium sand (250–500 μ m) accounts for 19.77 ± 18.62 % , very fine sand (62.5–125 μ m) and silt (3.9–62.5 μ m) together account for an average of 8.59 % , while very coarse sand (1000–2000 μ m) and coarse sand (500–1000 μ m) together account for only 0.25 % [40]. Therefore, we selected the median grain size of fine sand (180 μ m) for the calculations.
For the simulation scenario involving a transverse sand dune interacting with a transmission tower, a computational domain measuring 1000 l 0 × 1500 l 0 × 500 l 0 was configured in this research, with a unit length of 0.1 m , as shown in Figure 2, the model includes two transmission towers and a transverse dune in front of the transmission lines. Table 1 outlines the definitions of various parameters within the model, which include three threshold shear stress values: τ 1 = [ 125 τ 0 , 150 τ 0 , 175 τ 0 ] . Here, τ 0 signifies the unit stress in the model. To ascertain the unit time within the model, the simulated frictional wind velocity was established as u * = [ 0.295 m / s , 0.2694 m / s , 0.2496 m / s ] , drawing on the work of Narteau et al. [33]. Consequently, the unit time scale was determined to be t 0 = [ 31.3 h , 37.5 h , 43.7 h ] .
Accurately simulating the development of dune morphology is crucial for quantitatively modeling dune formation and evolution. To verify the accuracy of our dune model, we used a simulated transverse dune as an example to check the large-scale 3D shape and the relationships between different shape features of sand dunes. We compared the results from our model with pictures taken from space of the Tengger Desert in China. We obtained the morphology and height (approximately 4 m) of the transverse dunes near the photovoltaic site shown in Figure 3 using remote sensing data. By comparing the simulation results with the actual data, we found that the morphology and height of the simulated transverse dunes closely match those of the real dunes in the remote sensing data. This finding validates the accuracy of our simulation results.

3. Results and Discussion

3.1. Impact of the Presence and Absence of a Transmission Tower Line System on Dune Migration

The impact of the transmission tower line system on the movement of the transverse dune is visually presented in 3D in Figure 4. The transmission tower alters the local sand flow dynamics. The wind velocity at the front of the tower drops, causing sand particles to deposit in front of the towers, thus blocking the forward migration of the dunes. The rear of the tower is shielded by the transmission towers, and the wind velocity is low, forming a wind shadow area, resulting in the sand deposition in this area being reduced, and the dune cannot extend backwards. The change in the local wind field leads to the change in the dune morphology around transmission towers and a decrease in the migration speed. On the rear side of the tower, some small tail structures are formed as a result of the altered wind field, which were not observed in the simulation cases without a transmission tower [28]. With the passage of time, the sand in front of the tower gradually accumulates, leading to the gradual burial of the tower; in areas with frequent dune activities, the problem of burying the foundation of the transmission tower may be more serious. In the design of the transmission tower, the structure of the tower can be optimized to reduce its obstruction to the flow of wind sand, to avoid the excessive accumulation of dunes in the front of the tower. At the same time, in the area where dunes can easily accumulate in front of the tower, sand prevention facilities should be considered, such as the setting of sand retaining walls or wind flow guiding devices, to reduce the impact of sand accumulation in front of the tower [10,41].
Figure 5 quantitatively illustrates the temporal variations in the length and height of transverse dunes. It can be seen that in the initial stage, the change in the dune mean height under the two conditions is relatively consistent. The height of the dune gradually increases over time and reaches its peak at about 4000 h. This indicates that, except for the area around the transmission tower, the transverse dune height is little affected by the transmission line as a whole. This is mainly because the transmission tower itself is a hollow truss structure, and it is difficult to affect the sand transport process further away. The increasing trend of the dune length is similar in the presence and absence of towers, but the increase in the dune length is slightly slower in the presence of transmission towers. This may be due to the blocking effect of the transmission tower, which slows down the moving speed of the dune and increases the sand accumulation in the front, affecting the overall moving speed of the dune.

3.2. Effects of Different Wind Velocities on Dune Movement

In the model, the lattice gas automata calculations yield shear stress values at different locations on the dune surface. These values are primarily influenced by the topography. Therefore, the wind speed in the model is effectively adjusted by setting the threshold for motion inception ( τ 1 ). Specifically, as τ 1 increases, the incoming wind speed represented in the model decreases [33,42,43]. Figure 6 illustrates how transverse dunes interact with the transmission tower line system at different wind speeds. With decreasing wind speed, the time for dunes to encounter the transmission tower grows, echoing the fundamental patterns of dune movement [44]. When the wind velocity is high, the barrier effect of the transmission tower on the dune is relatively low. The dunes begin to accumulate in front of the tower, but the shape of the dunes behind the tower changes little, indicating that the influence of the transmission tower on the dunes is weak. With the decrease in the wind velocity, the trail structures begin to appear behind the transmission tower, and its size increases. This phenomenon may occur because, at low wind velocities, the wind field and sand particles are more easily disturbed by the structure of the transmission tower. This leads to sand deposition behind the tower, forming these slender trail structures. Therefore, wind guidance facilities can be set up at the rear of the tower to help the sand particles move better, reduce the influence of the wind shadow area behind the tower, and avoid the accumulation of dunes behind the tower.
In Figure 7, we present the quantitative statistical results of the changes in dune length and height over time under three different wind velocities. The process of dune movement and burial is closely related to the wind field disturbances caused by the transmission tower structure. When the wind velocity is high, the dune height increases swiftly, and the peak height achieved is relatively higher, indicating that the tower may become progressively buried. With the decrease in the wind velocity, the peak of the dune height decreases gradually, resulting in the decrease in the height of dune accumulation. The maximum difference value reaches about 1 m , indicating that the wind velocity is the dominant factor affecting the height of the dune [45,46]. The variation in the dune length is consistent under different wind velocity. Therefore, when designing the transmission tower, it is recommended to raise the height of the tower and set up sand prevention facilities to prevent the dune accumulation from producing excessive pressure on the tower and to avoid the tower being gradually buried by the dune.

3.3. Influence of Dune Size on Dune Movement

The results shown in Figure 8 detail the influence of the dune size on the transverse dune movement. The large sand dunes gradually pile up in front of the transmission tower as they approach it, forming a tall sand dune in front of the tower, preventing the dune from moving forward. With the increase in time, the dune gradually becomes gentle, and there is almost no dune accumulation in the area behind the tower. This phenomenon may arise from the reduction in the scale of the paired symmetrical reversing flows, which prevents the merging of these reversing flows and entrains the sediments away from the wake region, thereby forming a wind shadow area [47]. The height of the dunes in front of the tower increases significantly, and the tower is gradually buried by the dunes. The base is relatively safe because there is less sand accumulation behind the tower. In the case of small sand dunes, the influence of the transmission tower on the sand dunes is equally significant. As time goes by, the small dunes gradually accumulate in front of the tower, and a wind shadow area is formed behind the tower. However, due to the small size of the small dunes, the influence of the wind shadow area is relatively weak, and the accumulation height in front of the tower is not as obvious as that of the large dunes. The burial speed of the tower is slower, but there is still a trend of being gradually buried; under long-term action, the height of the dune in front of the tower also increases.
Figure 9 presents the temporal variations in the height and length of sand dunes of different sizes. It can be observed that the height of the large dunes initially increases gradually, peaks, and then begins to decline, with the highest value nearing 6.5 m . This indicates that the sand in front of the tower is gradually accumulating, and the tower may be gradually buried. The small dunes are slightly lower in height, peaking at about 5 m , and they also begin to decline after the peak. The accumulation trend is similar to that of large sand dunes, but the accumulation height is smaller. In general, the larger dunes accumulate more near the transmission tower, and the tower has a more significant blocking effect on them. Over time, the length of the large dune increases significantly faster than that of the small dune, indicating that the transmission tower has a stronger blocking effect on the larger dune, resulting in a slower forward speed. Smaller dunes can pass over transmission towers relatively easily and keep moving behind the tower, leading to their length increasing more slowly. From the point of view of transmission line design and maintenance, although the accumulation of small sand dunes is not as obvious as that of large sand dunes, its rapid migration may affect the tower structure within a short time, potentially causing significant economic losses due to damage to the transmission tower structure [48]; so, it should be monitored and cleaned up in time.

3.4. Change in the Height of Transmission Lines from the Ground

The height of the transmission line from the ground is a parameter that needs to be paid attention to at the beginning of the transmission line design, as it directly affects the operation of the transmission line and may cause safety accidents if it is lower than a specific threshold [49]. Figure 10 shows the height of a power line above the earth over time in different wind velocity simulation cases. It can be seen that under each time and wind velocity condition, the trend of the height of the power line from the ground first shows a downward trend, gradually recovers, and moved backward after reaching the lowest point. The structure of the transmission tower can cause disturbances in the wind field [50]. With the increase in the wind velocity, the height of the transmission line from the ground increases faster, indicating that the transmission tower has a stronger disturbance effect on the wind field. This results in more sand dunes piling up in front of the tower and affects its normal migration process. In the case of large sand dunes, the change speed of the height of the transmission line from the ground is relatively slow; after the minimum distance point, the speed of recovery is slow. However, in the case of small sand dunes, the speed of the height change is faster, and the trend of the height increase is more obvious. This shows that a larger dune is more significantly affected by the transmission tower, and its accumulation degree is higher, while smaller sand dunes experience less obstruction from the transmission tower and can more easily move past it [43]. In view of the problem that the height of the transmission line from the ground can easily be reduced with large sand dunes, it is suggested to raise the height of the tower when designing the transmission tower line system and set a sand barrier in front of the tower to prevent the height reduction caused by the sand dunes. At the same time, the accumulation of sand in front of the tower should be regularly monitored and cleaned to avoid long-term accumulation leading to power line safety accidents.

4. Conclusions

Understanding the construction and operation of power transmission tower line systems in desert regions is greatly enhanced by an in-depth study of dune morphology. In recent decades, the field of aeolian sand geomorphology and desert environment evolution has seen significant progress. Yet, knowledge regarding the impact of transmission tower line systems on dune development mechanisms is still limited. This study employs the ReSCAL dune model, which integrates cellular automata with lattice gas automata, to investigate the evolution of transverse dunes around transmission lines under various wind velocities and dune sizes.
The transmission tower modifies the local wind patterns, leading to gradual sand burial by impeding the forward migration of dunes. On the tower’s leeward side, small tail structures emerge due to wind field alterations. Excluding the vicinity of the transmission tower, the transverse dune height remains largely unaffected by the transmission line across extensive areas. With decreasing wind velocity, transverse dunes become less stable, and the size of the tail structures correspondingly increases. Over time, the dune height initially surges and then progressively declines, with the maximum difference reaching approximately 1m under varying wind velocities. As large dunes approach the transmission tower, they accumulate in front of it, forming a tall sand dune that halts further movement. Initially, the height of the large dune rises, peaks, and then declines, with the highest point nearing 6.5m. A crucial indicator for safety assessment is the height of the power line from the ground, which initially decreases, gradually recovers, and then moves backward after reaching the lowest point over time.
In reality, the shapes of sand dunes are diverse and irregular, influenced by a variety of factors. Currently, this study has only conducted simulation analysis on transverse dunes, which are a common type of sand dune. Different types of dunes, such as longitudinal dunes, barchan dunes, and star dunes, as well as compound dunes formed by combinations of various dune shapes, exhibit significant differences in their movement characteristics, accumulation patterns, and interactions with the surrounding environment. Future research will gradually expand to investigate the impacts of different dune shapes, sizes, and compound dune forms on transmission line towers, providing more targeted scientific basis for the planning, design, operation, and maintenance of transmission lines, as well as the optimization of windbreak and sand fixation measures.

Author Contributions

Conceptualization, S.W. and W.B.; methodology, S.W. and H.D.; software, S.W. and H.D.; validation, Y.T.; formal analysis, Y.T.; investigation, H.Z.; resources, S.W.; data curation, W.B.; writing—original draft preparation, S.W. and W.B.; writing—review and editing, H.D.; visualization, S.W. and W.B.; supervision, Y.T.; project administration, H.Z. All authors have read and agreed to the published version of the manuscript.

Funding

This research received no external funding.

Institutional Review Board Statement

Not applicable.

Informed Consent Statement

Not applicable.

Data Availability Statement

The original contributions presented in this study are included in the article. Further inquiries can be directed to the corresponding author.

Acknowledgments

We would like to thank the developers of the ReSCAL model.

Conflicts of Interest

Authors Shijun Wang, Wenyuan Bai, Yunfei Tian and Hailong Zhang were employed by the Gansu Electric Power Corporation. The remaining author declares that the research was conducted in the absence of any commercial or financial relationships that could be construed as a potential conflict of interest.

References

  1. Zhou, X.; Xu, Y. Solar updraft tower power generation. Solar Energy 2016, 128, 95–125. [Google Scholar] [CrossRef]
  2. Qin, J.; Hu, E.; Nathan, G.J.; Chen, L. Concentrating or non-concentrating solar collectors for solar Aided Power Generation? Energy Convers. Manag. 2017, 152, 281–290. [Google Scholar] [CrossRef]
  3. Cui, C.; Li, Z. Improvement of power quality stability control method in solar power generation. Int. J. Crit. Infrastruct. 2021, 17, 289–297. [Google Scholar] [CrossRef]
  4. Dai, W.; Shi, B.; Li, T.; Goh, H.; Li, J. Power flow analysis considering solar road generation. Energy Rep. 2022, 8, 531–536. [Google Scholar] [CrossRef]
  5. The Installed Capacity of Wind Power and Photovoltaic Power Generation in China Exceeds That of Coal Power. 2024. Available online: https://www.nea.gov.cn/2024-08/02/c_1310783697.htm (accessed on 31 July 2024).
  6. Hongnan, L.I.; Haifeng, B. High-voltage transmission tower-line system subjected to disaster loads. Prog. Nat. Sci. Mater. Int. 2006, 16, 899–911. [Google Scholar] [CrossRef]
  7. Shao, Y.; Wyrwoll, K.H.; Chappell, A.; Huang, J.; Lin, Z.; McTainsh, G.H.; Mikami, M.; Tanaka, T.Y.; Wang, X.; Yoon, S. Dust cycle: An emerging core theme in Earth system science. Aeolian Res. 2011, 2, 181–204. [Google Scholar] [CrossRef]
  8. Zhang, J.; Teng, Z.; Huang, N.; Guo, L.; Shao, Y. Surface renewal as a significant mechanism for dust emission. Atmos. Chem. Phys. 2016, 16, 15517–15528. [Google Scholar] [CrossRef]
  9. Dun, H.; Huang, N.; Zhang, J.; He, W. Effects of Shape and Rotation of Sand Particles in Saltation. J. Geophys.-Res.-Atmos. 2018, 123, 13462–13471. [Google Scholar] [CrossRef]
  10. Dun, H.; Huang, N.; Zhang, J. Optimization designs of artificial facilities in deserts based on computational simulation. J. Arid. Land 2021, 13, 290–302. [Google Scholar] [CrossRef]
  11. Dun, H.; Yue, P.; Huang, N.; Zhang, J. Discrete Element Simulation on Sand-Bed Collision Considering Surface Moisture Content. Processes 2022, 10, 52. [Google Scholar] [CrossRef]
  12. Okamura, T.; Ohkuma, T.; Hongo, E.; Okada, H. Wind response analysis of a transmission tower in a mountainous area. J. Wind. Eng. Ind. Aerodyn. 2003, 91, 53–63. [Google Scholar] [CrossRef]
  13. Ezami, N.; El Damatty, A.; Hamada, A.; Hangan, H. Aeroelastic testing of a self-supported transmission tower under laboratory simulated tornado-like vortices. Wind. Struct. 2022, 34, 199–213. [Google Scholar] [CrossRef]
  14. Gani, F.; Legeron, F. Dynamic response of transmission lines guyed towers under wind loading. Can. J. Civ. Eng. 2010, 37, 450–464. [Google Scholar] [CrossRef]
  15. Alminhana, F.; Mason, M.; Albermani, F. A compact nonlinear dynamic analysis technique for transmission line cascades. Eng. Struct. 2018, 158, 164–174. [Google Scholar] [CrossRef]
  16. Bhowmik, C.; Chakraborti, P. Analytical and Experimental Modal Analysis of Electrical Transmission Tower to Study the Dynamic Characteristics and Behaviors. KSCE J. Civ. Eng. 2020, 24, 931–942. [Google Scholar] [CrossRef]
  17. Nezamolmolki, D.; Shooshtari, A. The Effect of Nonlinear Behavior of Bolted Connections on Dynamic Analysis of Steel Transmission Towers. Int. J. Steel Struct. 2021, 21, 634–649. [Google Scholar] [CrossRef]
  18. Ma, L.; Khazaali, M.; Bocchini, P. Component-based fragility analysis of transmission towers subjected to hurricane wind load. Eng. Struct. 2021, 242, 112586. [Google Scholar] [CrossRef]
  19. Herrmann, H.; Kroy, K.; Sauermann, G. Saturation transients in saltation and their implications on dune shapes. Phys. A-Stat. Mech. Its Appl. 2001, 302, 244–254. [Google Scholar] [CrossRef]
  20. Bourke, M.C.; Goudie, A.S. Varieties of barchan form in the Namib Desert and on Mars. Aeolian Res. 2009, 1, 45–54. [Google Scholar] [CrossRef]
  21. Hugenholtz, C.H.; Barchyn, T.E. Real barchan dune collisions and ejections. Geophys. Res. Lett. 2012, 39, L02306. [Google Scholar] [CrossRef]
  22. Bo, T.L.; Zheng, X.J. Numerical simulation of the evolution and propagation of aeolian dune fields toward a desert-oasis zone. Geomorphology 2013, 180, 24–32. [Google Scholar] [CrossRef]
  23. Endo, N.; Kubo, H.; Sunamura, T. Barchan-shaped ripple marks in a wave flume. Earth Surf. Process. Landforms 2004, 29, 31–42. [Google Scholar] [CrossRef]
  24. Parteli, E.J.R.; Andrade, J.S., Jr.; Herrmann, H.J. Transverse Instability of Dunes. Phys. Rev. Lett. 2011, 107, 188001. [Google Scholar] [CrossRef]
  25. Wasson, R.J.; Hyde, R. Factors determining desert dune type (reply). Nature 1984, 309, 92. [Google Scholar] [CrossRef]
  26. Bo, T.L.; Zheng, X.J. The formation and evolution of aeolian dune fields under unidirectional wind - ScienceDirect. Geomorphology 2011, 134, 408–416. [Google Scholar] [CrossRef]
  27. “Hand in Hand” with the Sun, New Green Grows in the Depths of the Desert. 2023. Available online: http://www.news.cn/2023-06/04/c_1129668592.htm (accessed on 4 June 2023).
  28. Xiao, X.; Liu, H.; Zheng, X. Temporal Evolution of Dune Number Density in a Barchan Dune Field. J. Geophys.-Res.-Earth Surf. 2023, 128, e2022JF007036. [Google Scholar] [CrossRef]
  29. Xiao, X.; Liu, H.; Zheng, X. Coherent structure and energy distribution of atmospheric surface layer turbulent flow over a barchan dune in Minqin, China. Atmos. Res. 2024, 307, 107503. [Google Scholar] [CrossRef]
  30. Parteli, E.; Herrmann, H. A simple model for a transverse dune field. Phys. A-Stat. Mech. Its Appl. 2003, 327, 554–562. [Google Scholar] [CrossRef]
  31. Diniega, S.; Glasner, K.; Byrne, S. Long-time evolution of models of aeolian sand dune fields: Influence of dune formation and collision. Geomorphology 2010, 121, 55–68. [Google Scholar] [CrossRef]
  32. Anderson, R. The attraction of sand dunes. Nature 1996, 379, 24–25. [Google Scholar] [CrossRef]
  33. Narteau, C.; Zhang, D.; Rozier, O.; Claudin, P. Setting the length and time scales of a cellular automaton dune model from the analysis of superimposed bed forms. J. Geophys. Res. Earth Surf. 2009, 114, F03006. [Google Scholar] [CrossRef]
  34. Lu, P.; Dong, Z.; Rozier, O. The Combined Effect of Sediment Availability and Wind Regime on the Morphology of Aeolian Sand Dunes. J. Geophys.-Res.-Earth Surf. 2018, 123, 2878–2886. [Google Scholar] [CrossRef]
  35. Rozier, O.; Narteau, C. A real-space cellular automaton laboratory. Earth Surf. Process. Landforms 2013, 39, 98–109. [Google Scholar] [CrossRef]
  36. Gunn, A.; Casasanta, G.; Liberto, L.D.; Falcini, F.; Lancaster, N.; Jerolmack, D.J. What sets aeolian dune height? Nat. Commun. 2022, 13, 2401. [Google Scholar] [CrossRef]
  37. Andreotti, B.; Claudin, P.; Pouliquen, O. Measurements of the aeolian sand transport saturation length. Geomorphology 2010, 123, 343–348. [Google Scholar] [CrossRef]
  38. Iversen, J.D.; Rasmussen, K.R. The effect of wind speed and bed slope on sand transport. Sedimentology 1999, 46, 723–731. [Google Scholar] [CrossRef]
  39. Iversen, J.D.; Greeley, R.; Marshall, J.R.; Pollack, J.B. Aeolian saltation threshold: The effect of density ratio. Sedimentology 1987, 34, 699–706. [Google Scholar] [CrossRef]
  40. Gulayisaimu, A.; Zhang, F.; Wu, F.; Wu, S.; Zhang, J.; Sun, T. Grain size characteristics of dune sands and spatial variation in the Tengger Desert. J. Desert Res. 2022, 42, 133. [Google Scholar] [CrossRef]
  41. Dun, H.; Xin, G.; Huang, N.; Shi, G.; Zhang, J. Wind-Tunnel Studies on Sand Sedimentation Around Wind-Break Walls of Lanxin High-Speed Railway II and Its Prevention. Appl. Sci. 2021, 11, 5989. [Google Scholar] [CrossRef]
  42. Lin, Y.; Guan, K.; Zhang, Y.; Gao, X.; Yang, B.; He, N. The impact of inter-dune space and volume ratio on barchan dune collision patterns: A numerical simulation study. Phys. Fluids 2024, 36, 011703. [Google Scholar] [CrossRef]
  43. Wang, S.; Bai, W.; Tian, Y.; Zhang, H.; Fu, Y. Numerical Simulation of Barchan Dune Movement and Burial Around Transmission Tower. In Application and Development of Data Simulation and Mechanical Analysis in Civil Engineering; Feng, G., Zhang, B., Wang, X.Y., Zhao, J., Almerich-Chulia, A., Eds.; Springer Nature: Cham, Switzerland, 2025; pp. 241–253. [Google Scholar]
  44. Sauermann, G.; Rognon, P.; Poliakov, A.; Herrmann, H. The shape of the barchan dunes of Southern Morocco. Geomorphology 2000, 36, 47–62. [Google Scholar] [CrossRef]
  45. Cornish, V. Limits of Form and Magnitude in Desert Dunes. Nature 1928, 121, 620–622. [Google Scholar] [CrossRef]
  46. Andreotti, B.; Claudin, P.; Douady, S. Selection of dune shapes and velocities—Part 1: Dynamics of sand, wind and barchans. Eur. Phys. J. B 2002, 28, 321–339. [Google Scholar] [CrossRef]
  47. Zhao, Y.; Gao, X.; Lei, J. Vortex core regions of nebkhas and their implications on shadow dune formation. Aeolian Res. 2024, 67–69, 100926. [Google Scholar] [CrossRef]
  48. Chen, D.; Zhang, Y.; Cheng, J.; Zhang, R.; Jiang, Z. Characteristics and Prevention Measures of Wind-Sand Disaster Along the Transmission Corridor in Desert Areas. Land Degrad. Dev. 2025, 1–17. [Google Scholar] [CrossRef]
  49. Hou, J.; Sun, Z.; Wu, X. Simulation of Turbulent Wind Velocity for Transmission Tower Based on Linear Filter Method. In Proceedings of the 2010 International Conference on E-Product E-Service and E-Entertainment, Zhengzhou, China, 7–9 November 2010; pp. 1–4. [Google Scholar] [CrossRef]
  50. Liu, Y.; Zhao, P.; Xu, J.; Meng, X.; Yang, H.; He, B. Paradigm of Numerical Simulation of Spatial Wind Field for Disaster Prevention of Transmission Tower Lines. Struct. Durab. Health Monit. 2023, 17, 521–539. [Google Scholar] [CrossRef]
Figure 1. Power transmission lines and photovoltaic facilities are threatened by migrating sand dunes in desert areas. (A) The transmission lines near the photovoltaic power base in Zhongwei City, at the southeast edge of the Tengger Desert, and the mobile dunes in the vicinity. (B) The transmission towers in the desert are encircled by mobile dunes [27].
Atmosphere 16 00779 g001
Figure 2. This study’s simulation domain features a transverse dune along with a transmission tower line system. For a more detailed visualization of the dune’s structure, the upper portion of the transmission tower will be excluded from the 3D morphological renderings in the results.
Atmosphere 16 00779 g002
Figure 3. Comparison of model simulation results with real-world dune morphology. (a) 3D transverse dune diagrams obtained from the simulation. (b) A transverse dune in Tengger Desert, China.
Atmosphere 16 00779 g003
Figure 4. (a) In the absence of a transmission line system, the transverse dune moves in the downwind direction with its shape largely preserved. (b) In the presence of a transmission line system, the transverse dune moves towards the transmission tower, undergoes some morphological changes, and forms small tails at the rear of the tower.
Atmosphere 16 00779 g004
Figure 5. The quantitative statistics of the variation in transverse dune morphological parameters over time. (a) Height. (b) Length.
Atmosphere 16 00779 g005
Figure 6. Three-dimensional visualizations of the movement of transverse dunes towards the transmission line under different wind velocities. (a) τ 1 = 125 τ 0 . (b) τ 1 = 150 τ 0 . (c) τ 1 = 175 τ 0 .
Atmosphere 16 00779 g006
Figure 7. A detailed quantitative assessment of temporal variations in dune morphological parameters under three distinct wind velocity conditions. (a) Height. (b) Length.
Atmosphere 16 00779 g007
Figure 8. The influence of dune size on transverse dune movement with different wind velocities. (a) Large dune. (b) Small dune.
Atmosphere 16 00779 g008
Figure 9. Statistical analysis of temporal changes in dune morphological parameters across three wind velocity scenarios. (a) Height. (b) Length.
Atmosphere 16 00779 g009
Figure 10. (a) The change in height of the transmission line above the ground over time under three different wind velocities. (b) The variation in height of the transmission line above the ground over time under different dune sizes.
Atmosphere 16 00779 g010
Table 1. Model parameter configuration.
VariableDescriptionValues
τ 1 Critical threshold stress for motion initiation 125 τ 0 , 150 τ 0 , 175 τ 0
l 0 Unit length 0.1 m
t 0 Unit time 31.3 h , 37.5 h , 43.7 h
LSystem length 1000 l 0
HSystem width 500 l 0
DSystem height 1500 l 0
[ L 1 , H 1 , D 1 ] Transmission tower dimensions [ 100 l 0 , 100 l 0 , 450 l 0 ]
ρ f Air density 1.293 kg / m 3
ρ s Sand density 2650 kg / m 3
z 0 Aerodynamic roughness 0.001 m
gGravitational acceleration 9.81 m / s 2
kvon Karman constant 0.4
dSand particle diameter 1.8 × 10 6 m
Disclaimer/Publisher’s Note: The statements, opinions and data contained in all publications are solely those of the individual author(s) and contributor(s) and not of MDPI and/or the editor(s). MDPI and/or the editor(s) disclaim responsibility for any injury to people or property resulting from any ideas, methods, instructions or products referred to in the content.

