Article

Characterization of Hybrid Lightning Flashes Observed by Fast Antenna Lightning Mapping Array in Summer Thunderstorms

1
College of Electrical, Energy and Power Engineering, Yangzhou University, Yangzhou 225001, China
2
Key Laboratory of Middle Atmosphere and Global Environment Observation, Institute of Atmospheric Physics, Chinese Academy of Sciences, Beijing 100029, China
3
Department of Electrical, Electronic and Computer Engineering, Gifu University, Gifu 5011193, Japan
*
Author to whom correspondence should be addressed.
Atmosphere 2025, 16(7), 765; https://doi.org/10.3390/atmos16070765
Submission received: 27 May 2025 / Revised: 14 June 2025 / Accepted: 20 June 2025 / Published: 22 June 2025
(This article belongs to the Section Atmospheric Techniques, Instruments, and Modeling)

Abstract

Using the observation data from Fast Antenna Lightning Mapping Array, we have sub-divided 288 hybrid flashes that are obviously different from traditional intracloud (IC) and negative cloud-to-ground (NCG) flashes into three types: IC–NCG lightning (85), NCG–IC lightning (95), and the flashes (108) with negative leaders originating from the upper parts of bi-level structures of IC flashes. Hereinafter, we refer to these hybrid flashes as hybrid A, B, and C, respectively. The statistical comparisons indicate that characteristics from preliminary breakdown (PB) to return stroke (RS) are significantly different. On average, hybrid A and C flashes have higher initiation altitudes, larger PB–RS intervals, and longer propagation lengths than hybrid B flashes (7.9, 7.8 vs. 5.7 km; 430.3, 239.3 vs. 54.4 ms; 6.4, 7.8 vs. 2.3 km). Compared to 1562 IC and 844 CG flashes, hybrid flashes unsurprisingly have much larger horizontal flash sizes (189, 210, and 126.9 km2 vs. 86.1 and 80.2 km2). In addition, hybrid B flashes tend to produce more RSs and larger RS1st peak currents. The striking points of hybrid C flashes appear to be close to or out of the cloud edge. Based on these statistical results, we discuss the formation mechanisms of three types of hybrid flashes.

1. Introduction

Lightning discharges can be generally classified into intracloud (IC) and cloud-to-ground (CG) flashes according to whether there is a return strike (RS) hitting on the ground or not. Any flashes that contain RSs are usually called CG lightning. Otherwise, they are called IC lightning. However, some CG lightning flashes apparently contain significantly long and distinct IC discharge processes, particularly before their return strokes, and are often named as hybrid lightning flashes (Mecikalski et al. [1]; Mecikalski and Carey [2]).
Hybrid flashes have been traditionally studied using their electric field change (E-change) waveforms, in which RS pulses always occur before or after IC discharge processes (e.g., Qie et al. [3]; Zhang et al. [4]). Qie et al. [3] found that 36.2% of positive CG flashes in Da Hinggan Ling of northeastern China were related to hybrid flashes, and about 15.14% of the recorded positive CG flashes were byproducts of IC components of hybrid flashes. Zhang et al. [4] found that hybrid flashes (an IC discharge process followed by a negative RS) in Beijing and Guangzhou roughly accounted for 8.2% and 2.7% of all the analyzed flashes, respectively. These early research results suggest that hybrid flashes could be either negative or positive CG flashes, and the percentages vary significantly between different regions.
Recent studies on hybrid lightning have paid more attention to their location results with the rapid development of lightning mapping arrays. Mecikalski et al. [1] used the two-sample Kolmogorov–Smirnov test to verify that hybrid flashes have statistically different properties (e.g., flash size, initiation altitude, and propagation altitude) from IC and typical CG flashes and, thus, suggested that hybrid flashes should be separately classified. Further, Mecikalski and Carey [2,5] used plenty of flashes to compare the difference in where lightning initiated and propagated relative to altitude and reflectivity between storm types and between flash types. The results show that there are more lightning sources of IC and hybrid flashes than typical CG flashes at regions with a radar echo less than 20 dBZ. Now, it is very clear that hybrid flashes are indeed statistically different from IC and typical CG flashes.
IC or typical CG flashes can be divided into subtypes (e.g., normal and inverted IC; downward and upward CG); likewise, hybrid flashes can also be sub-classified into hybrid CG–IC (Lu et al. [6]), hybrid IC–CG (Lang et al. [7]; Biter et al. [8]; Yoshida et al. [9]; Wu et al. [10]), and bolt-from-the-blue lightning (Krehbiel et al. [11]; Boggs et al. [12]; Fan et al. [13]),as described by Lu et al. [6]. However, it has been rare for previous studies to provide the statistics on distinguishing the hybrid types. Hence, the detailed characteristics of different hybrid types are still not fully understood. In this paper, for each sub-divided type of hybrid flash, we will first show an example of a high-quality location result to briefly introduce the characteristics from lightning initiation to RS. Then, we will study the statistics of these characteristics and discuss possible formation mechanisms of hybrid flashes.

2. Data Processing

The data in this study were collected from a low-frequency mapping system called Fast Antenna Lightning Mapping Array (FALMA) (Wu et al. [10]), which was deployed around Gifu, Japan. For more details about FALMA in summer and winter observations, we refer to new reports (e.g., Wu et al. [14,15]). In the summer of 2017, FALMA recorded thousands of lightning flashes with clear three-dimensional (3D) channel structures on several thunderstorm days, allowing for us to accurately identify the flash types. Eventually, we selected 288 hybrid flashes from 19 thunderstorm days. Following the classification proposed by Lu et al. [6], we sub-classified these hybrid flashes into three types, as illustrated in Figure 1.
The first type, shown in Figure 1a, is the flash that first starts as normal IC lightning and then produces RSs originating from downward leaders in negative charge regions. The second type, shown in Figure 1b, is the flash that first generates negative RSs and then develops upward into upper positive charge regions. Figure 1c shows the third type that begins as classical IC lightning but with the negative leaders propagating in the upper positive charge regions, extending close to or outside the cloud edge and ultimately contacting the ground relatively far from a storm’s convection core. To be convenient, we hereinafter refer to the hybrid flashes in Figure 1a–c as hybrid A, hybrid B, and hybrid C.
As seen from the distributions of their striking points in Figure 1d, the majority of the selected 288 hybrid flashes were inside the observation network, which makes us confident enough to distinguish the hybrid lightning types based on their fine 3D locations. Finally, we recognized 85 hybrid A flashes, 95 hybrid B flashes, and 108 hybrid C flashes, respectively.
In addition, the C-band Doppler radar data from the Japan Meteorological Agency are used in this study. These radar data have spatial and temporal resolutions of 1 km and 10 min, respectively. Compared to the spatiotemporal scale of the lightning flashes, the resolution of the radar data is relatively low. Therefore, we can only acquire a general picture of the thunderstorm structure and roughly study the statistics of composite radar echoes where the RS occurs.

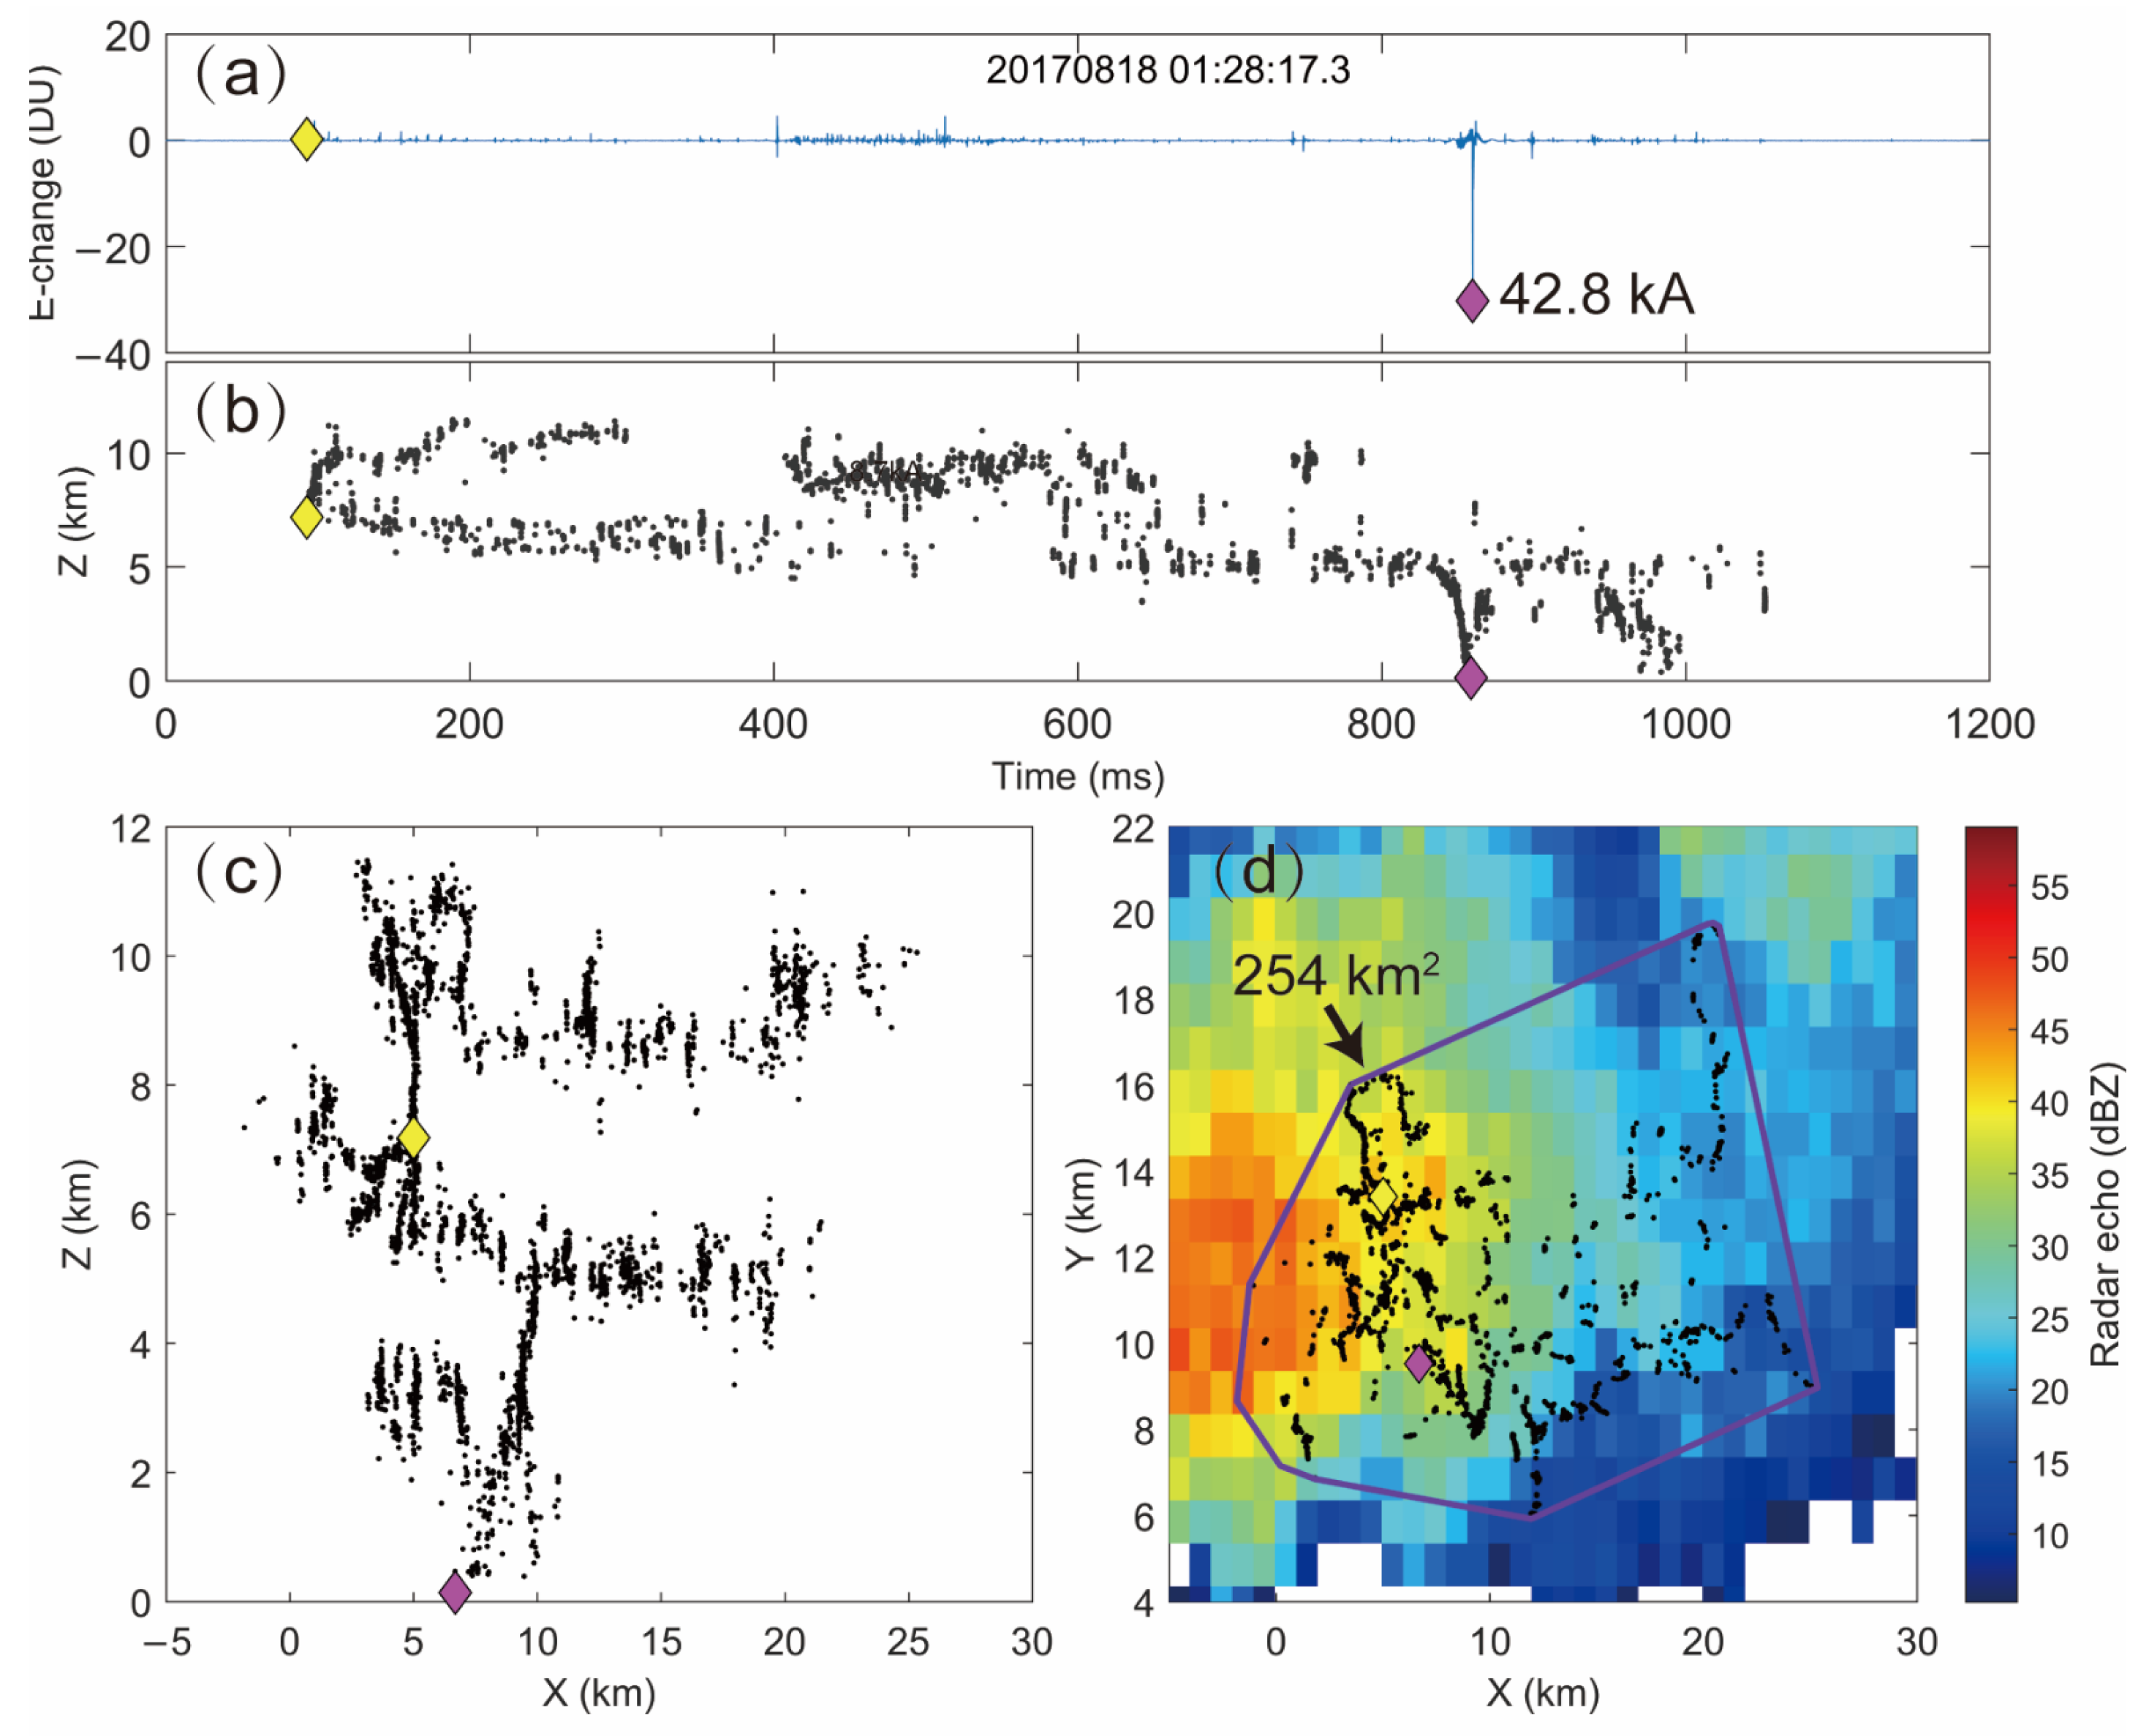
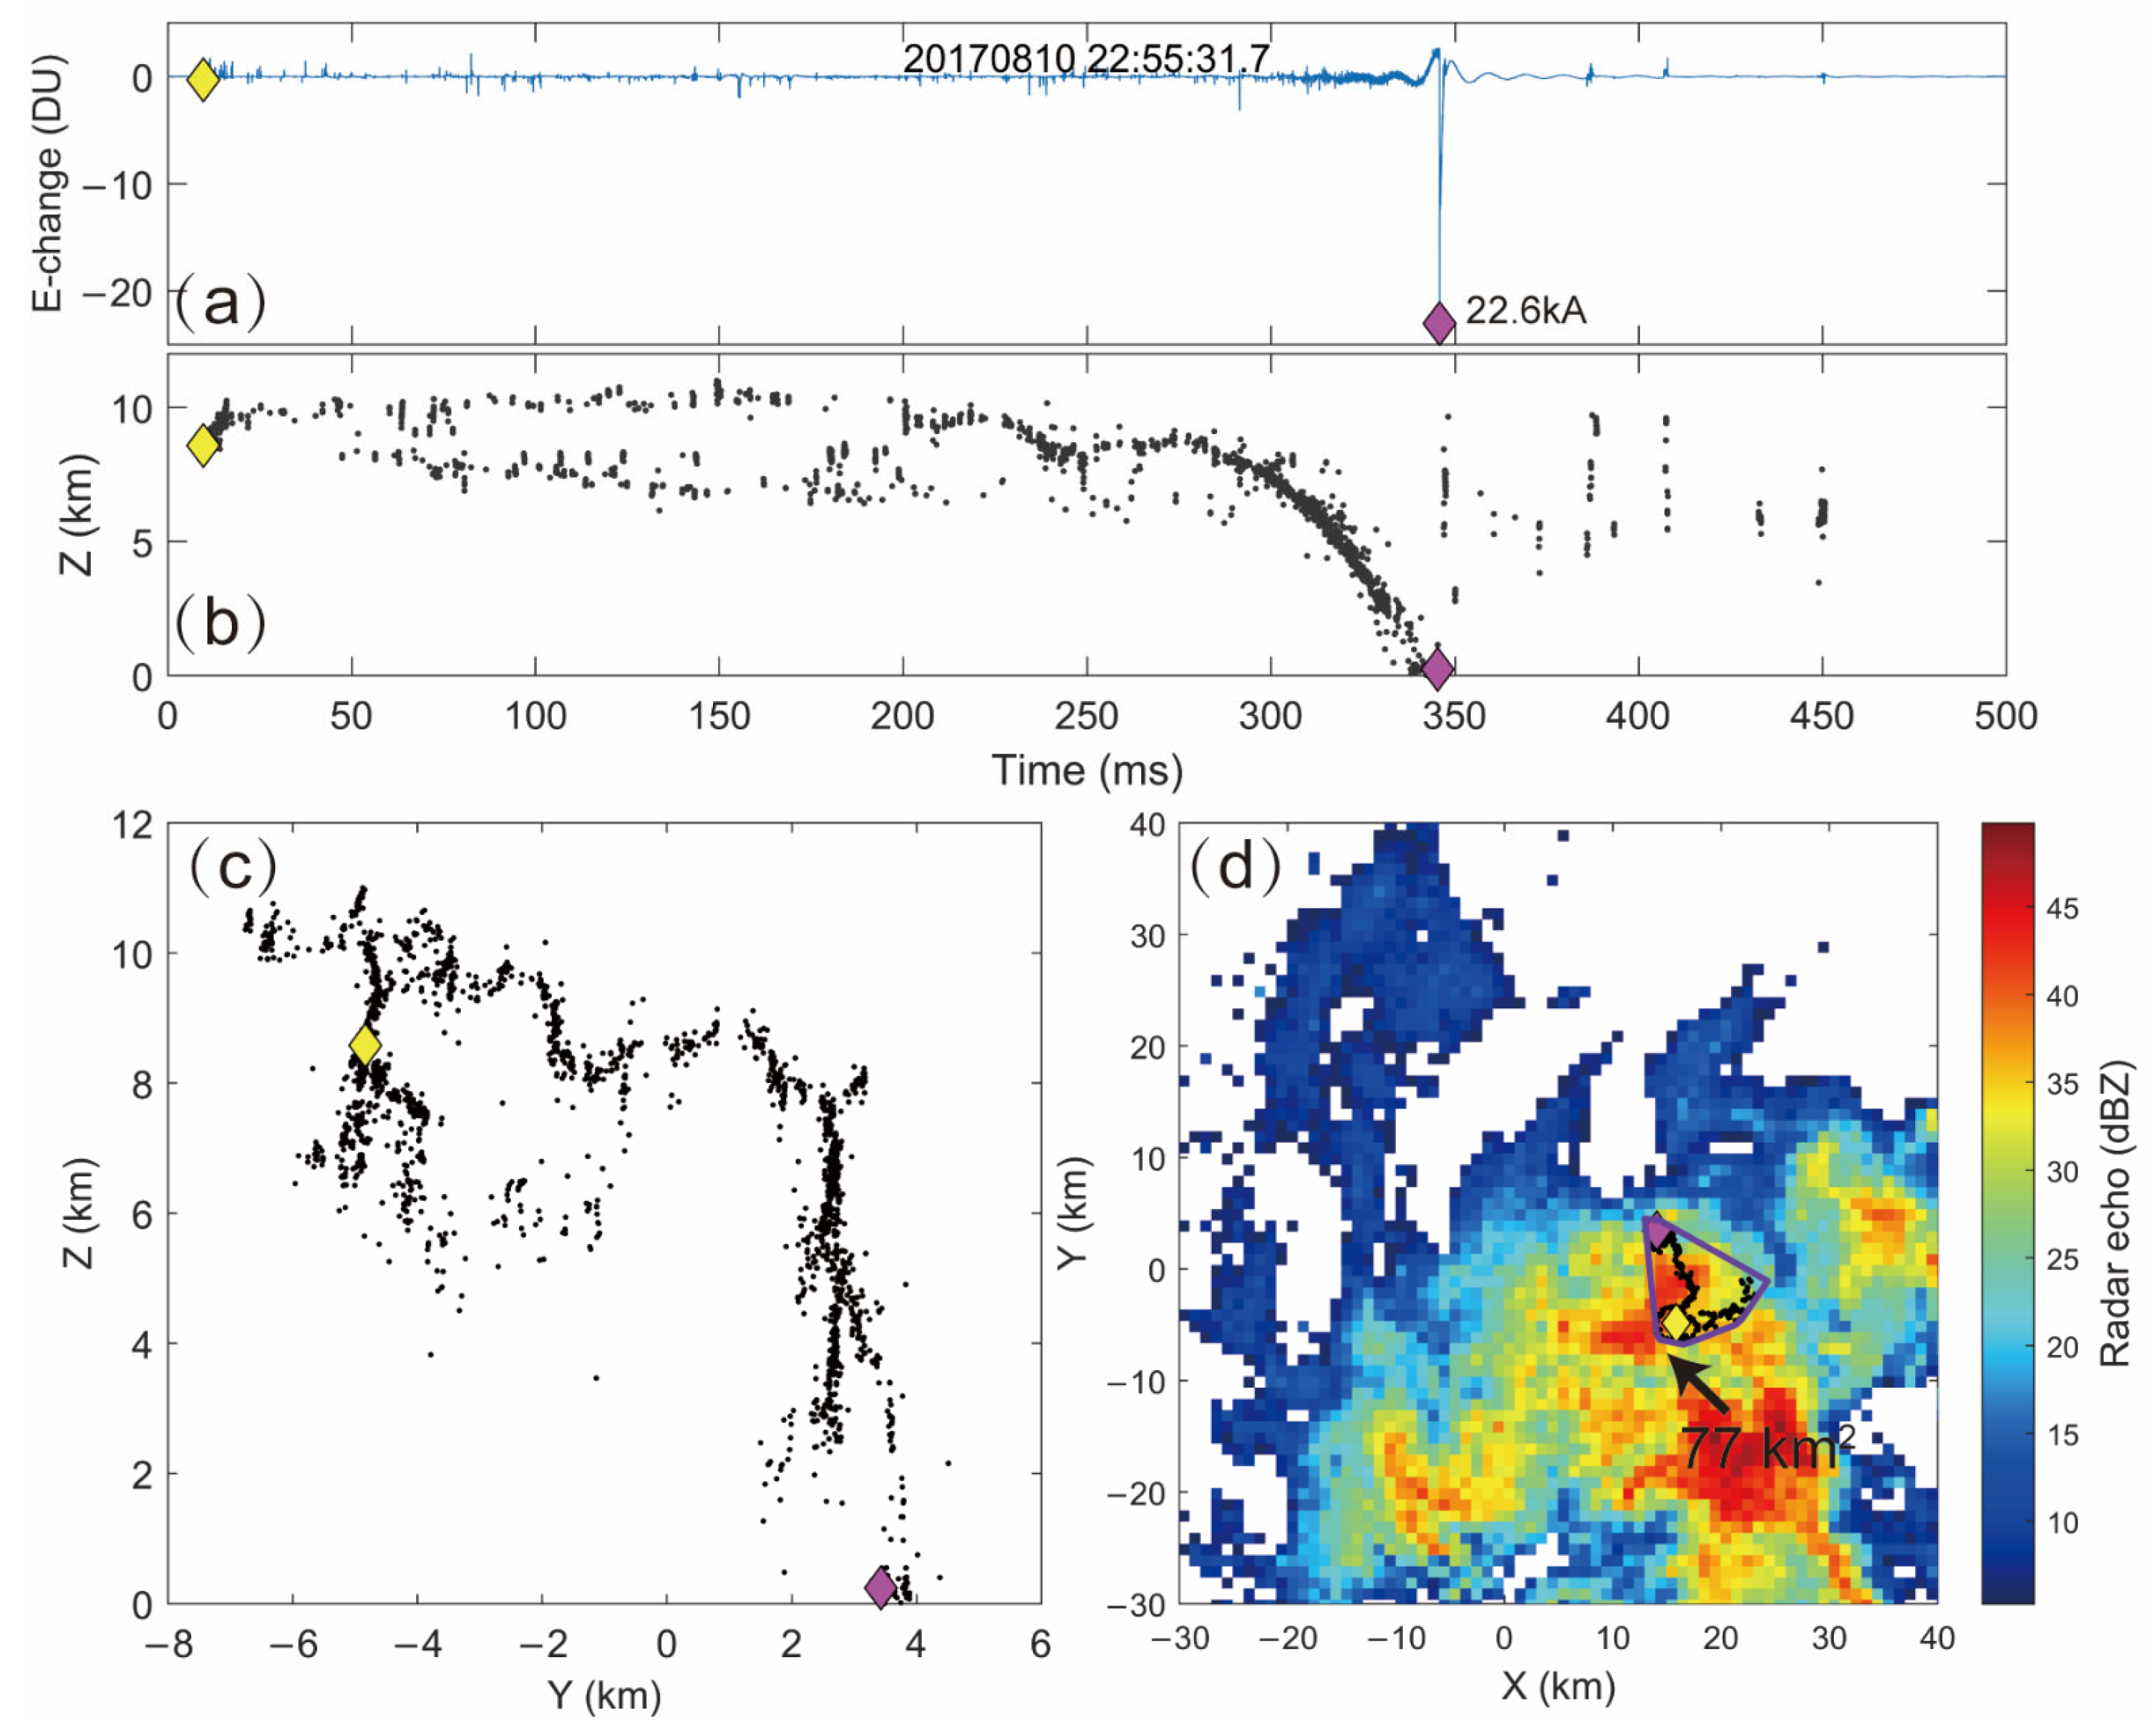
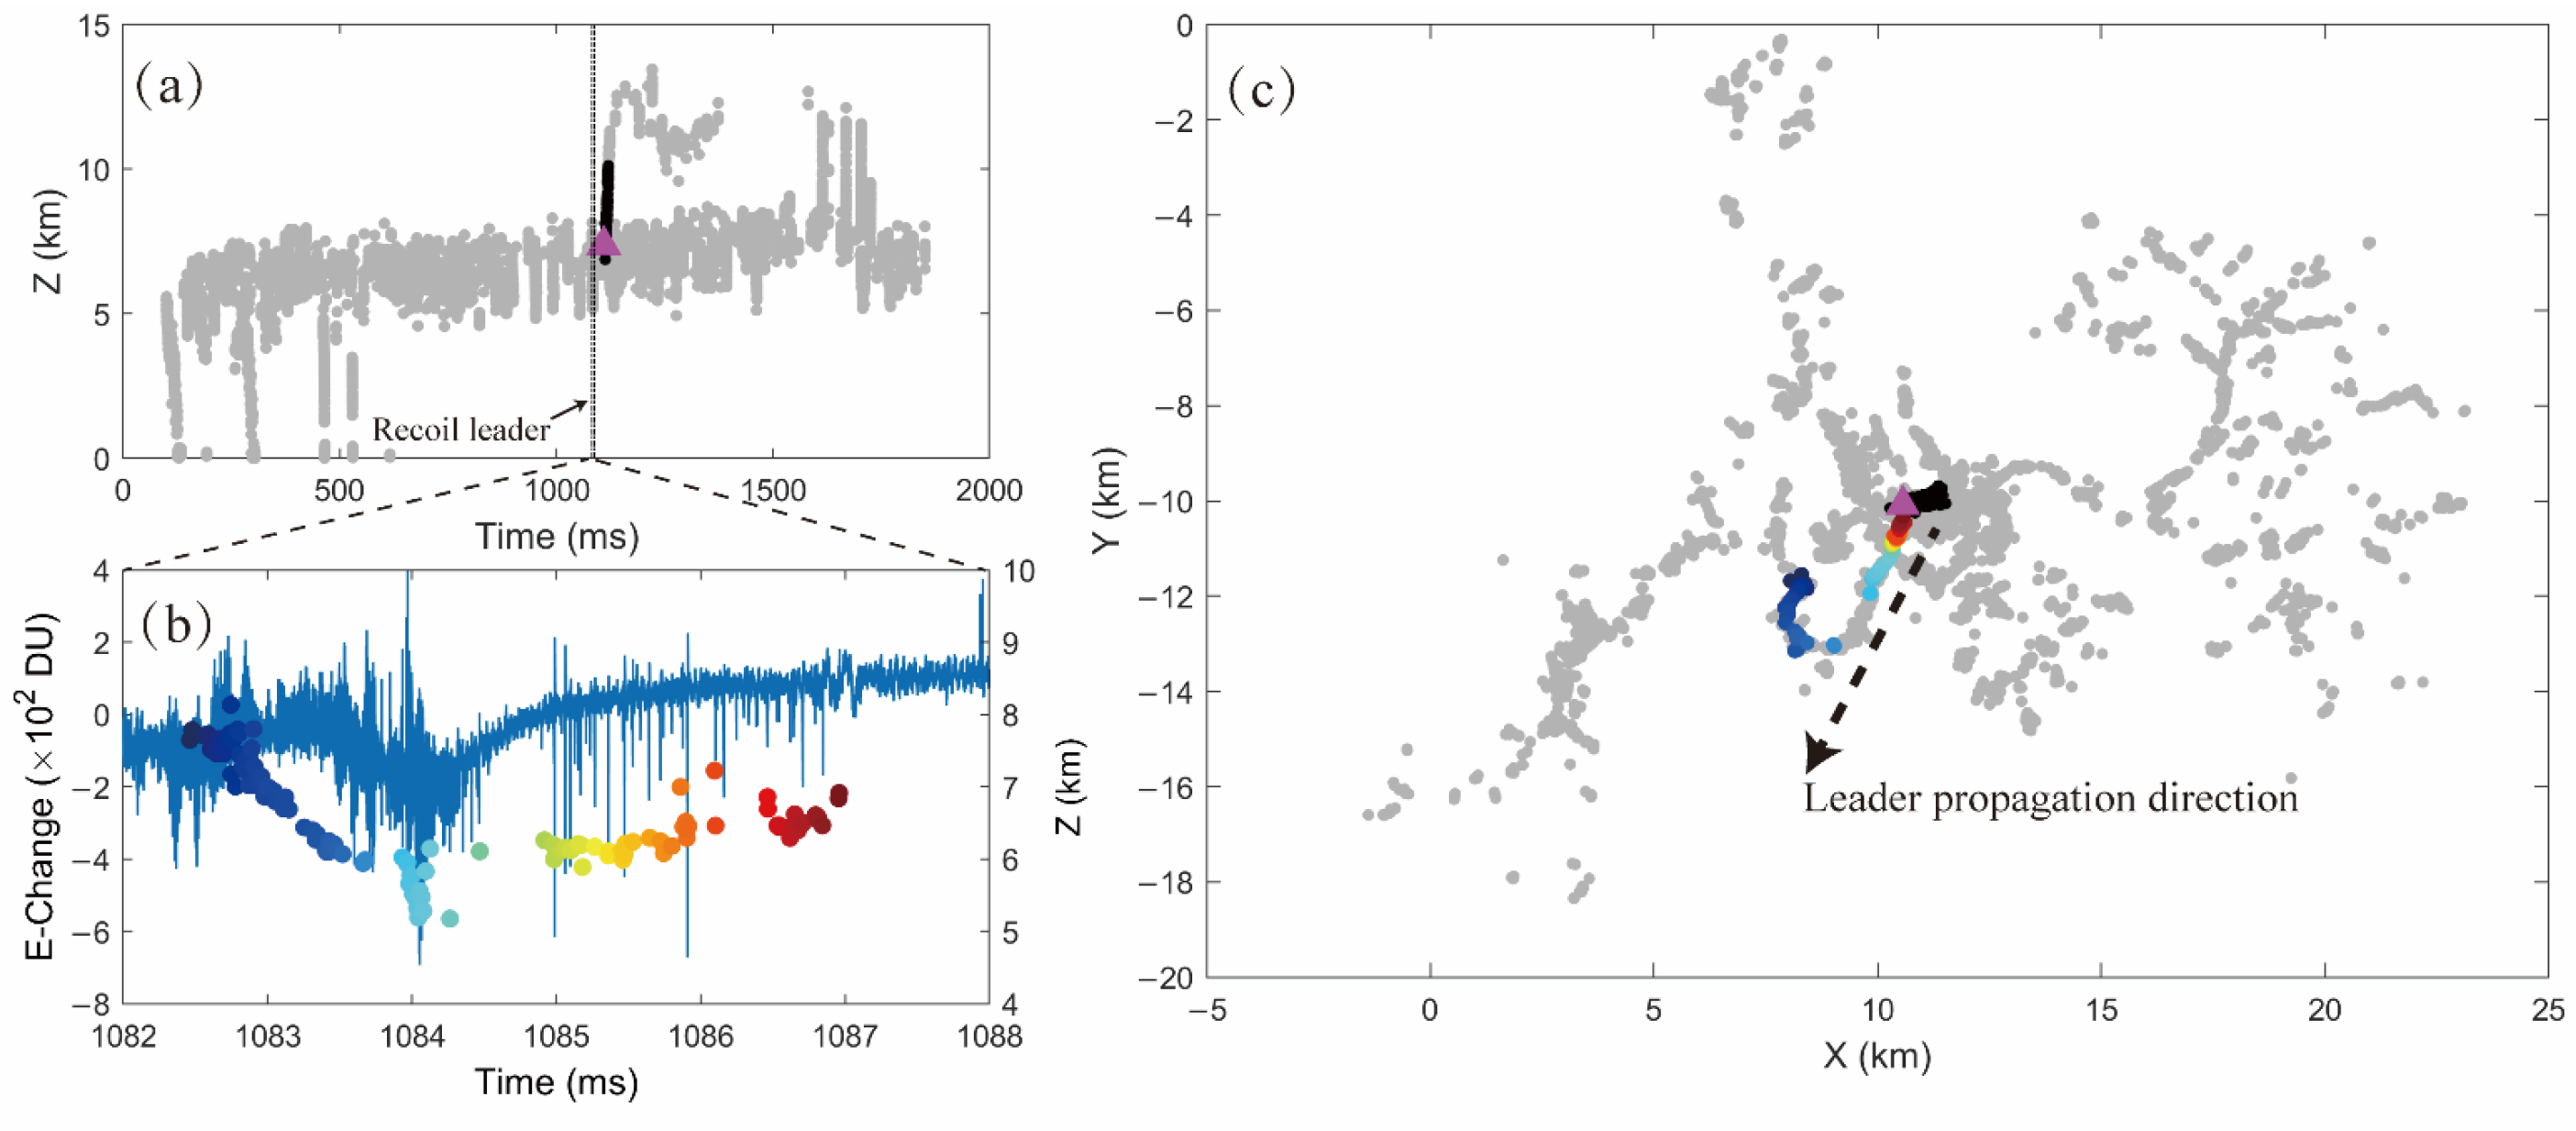
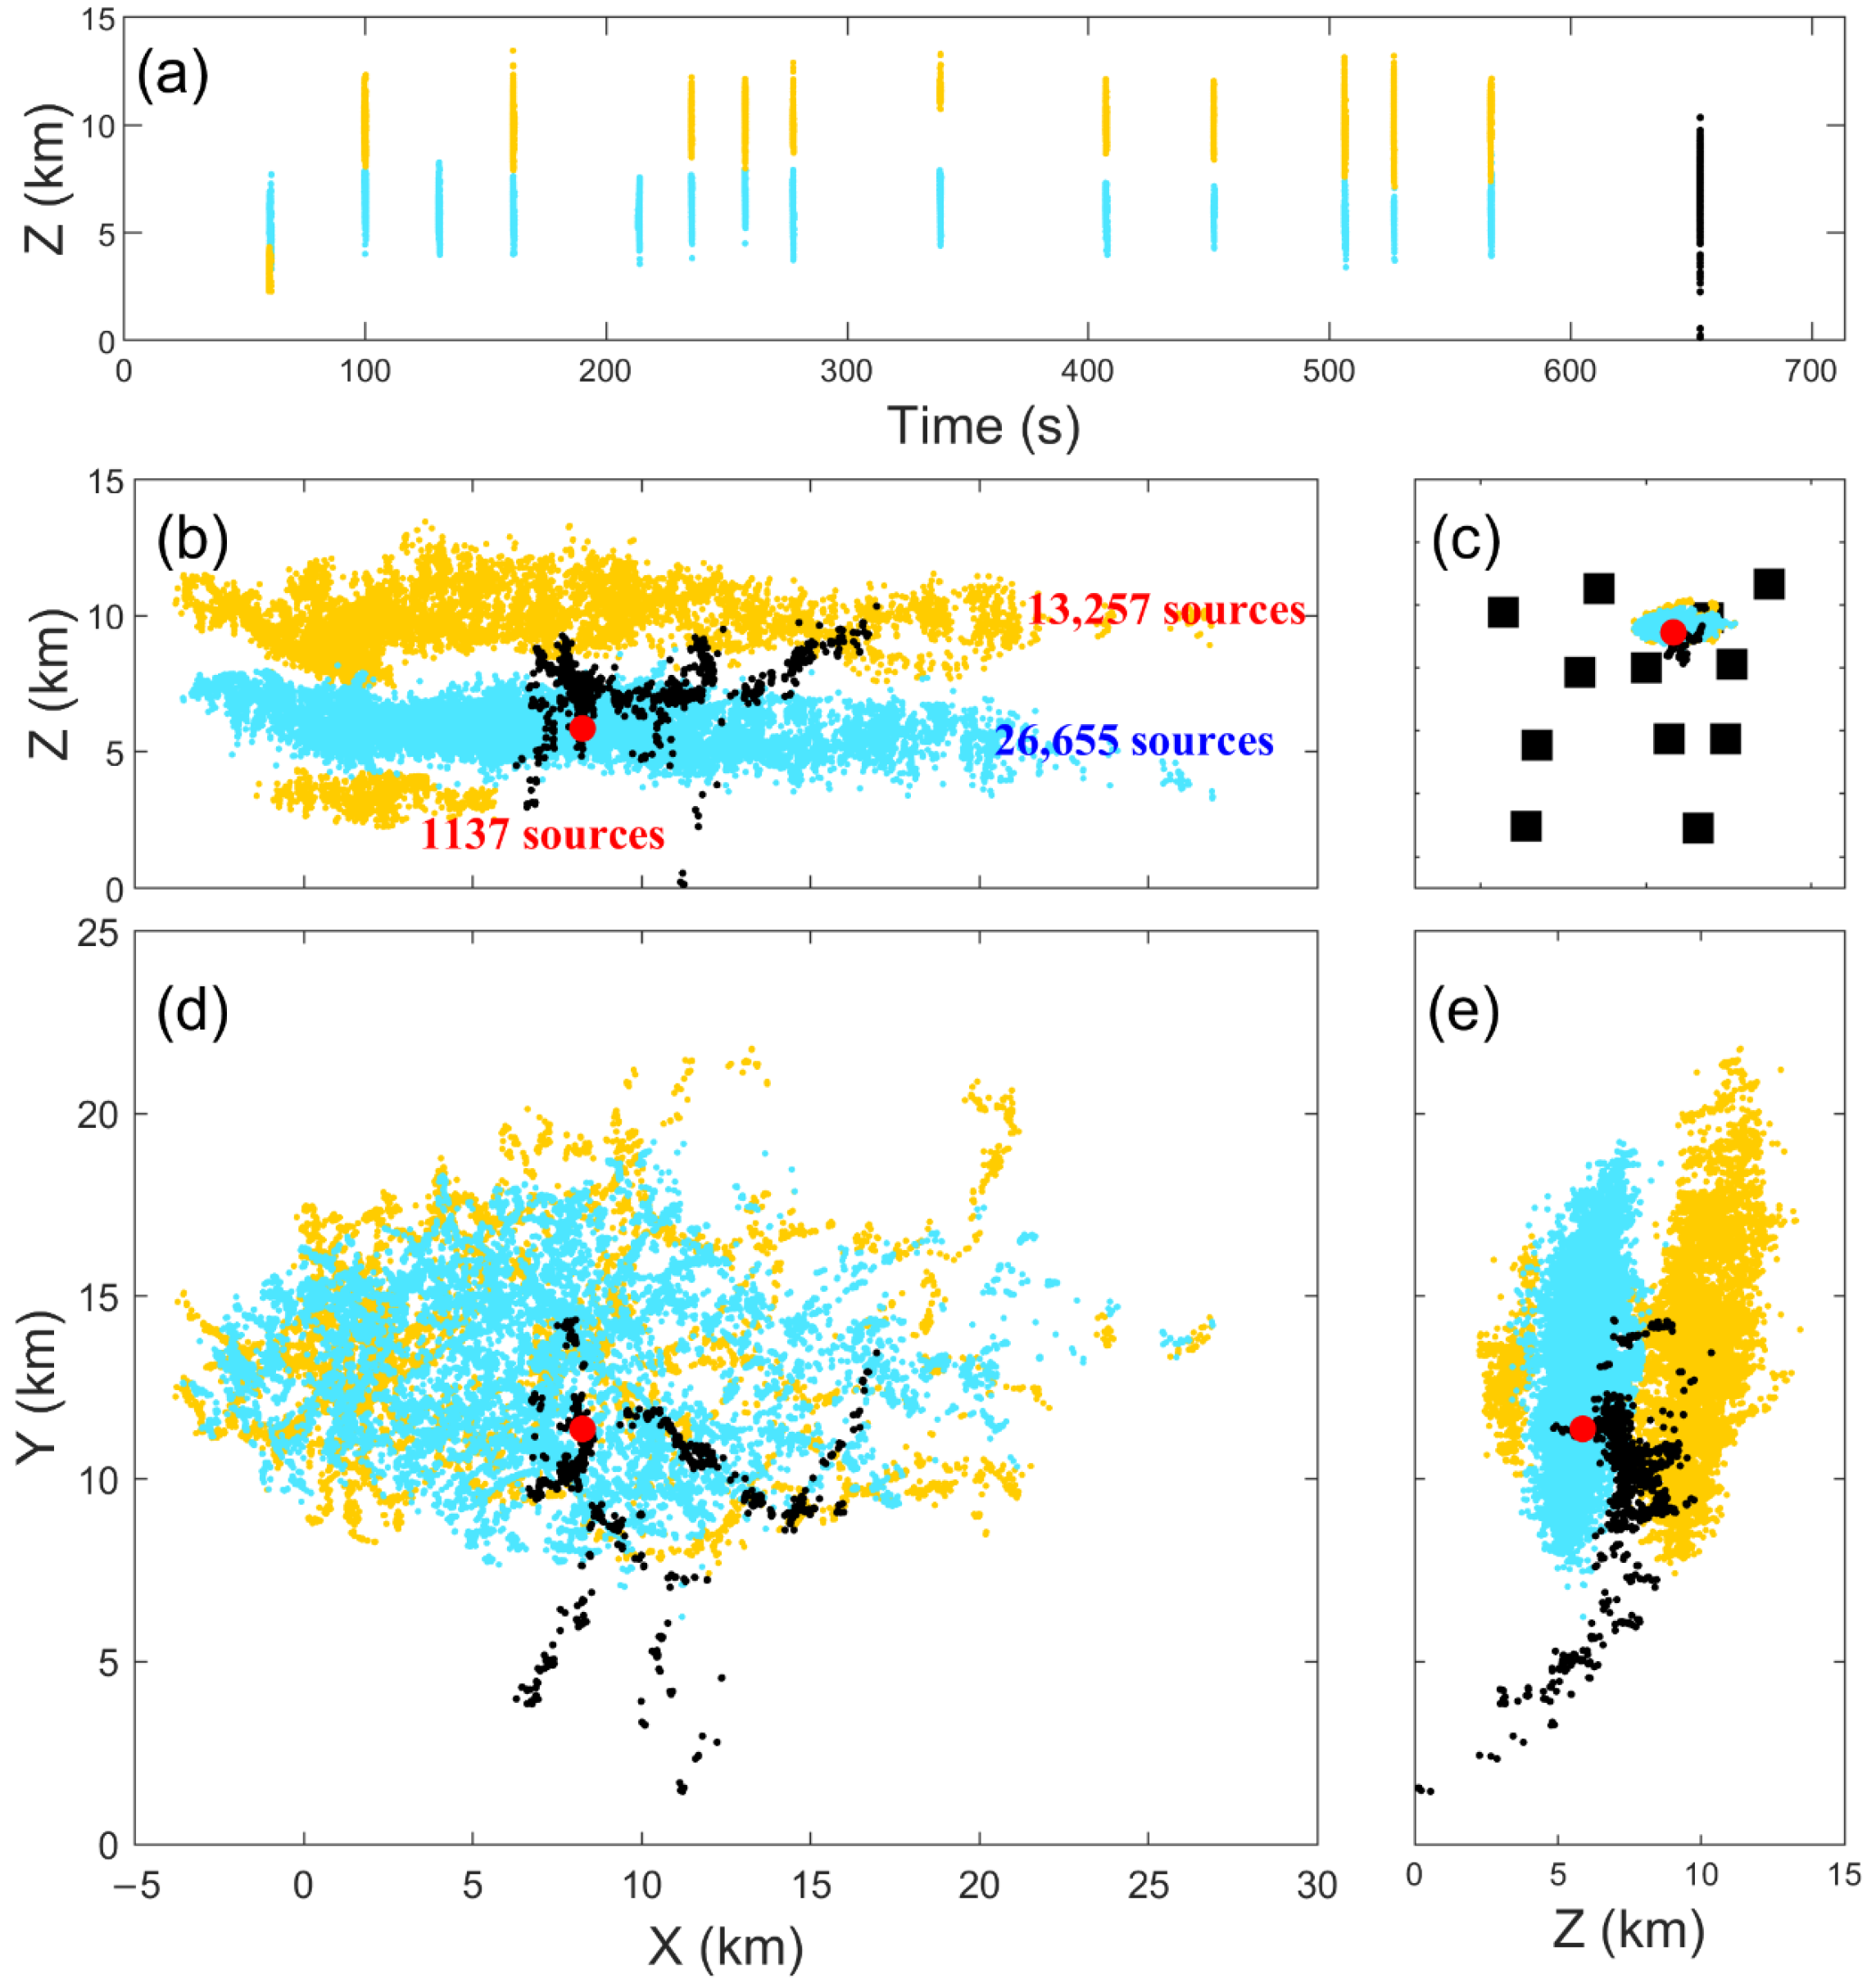
3. Examples of Hybrid Lightning Flashes

3.1. Hybrid A

The E-change waveform and 3D mapping of one hybrid A flash example are given in Figure 2. It occurred at 01:28:17.3 on 18 August 2017 and lasted for more than 1 s. Note that all timestamps in this study are recorded in UTC+9, which aligns with Japan Standard Time. The first PB source, as represented by yellow diamonds in Figure 2a,b, was located at an altitude of 7.2 km. Figure 2c is the source location in the x-z view. We can see that the initial PB leader shows a vertical propagation up to an altitude of about 9.7 km and then turns to the horizontal extension in the upper positive and middle negative charge regions, exhibiting a classical bi-level structure. All of these features are similar to a normal IC flash.
However, at 837 ms, one negative leader originated from the lower positive leader channels of the IC components. This negative leader propagated through the cloud base and stroke to the ground at 859.7 ms, ultimately producing one negative RS, which was marked by a pink diamond in Figure 2a–c. This RS has an intensity of about 42.8 kA, larger than the average first RS (RS1st) currents reported in previous literature (e.g., Cummins et al. [16]; Nag and Cummins [17]). The interval between the first PB source and the RS1st was about 767 ms, which was much longer than the previously reported values in typical negative CG flashes (e.g., Baharudin et al. [18]; Marshall et al. [19]; Shi et al. [20]). This implies that the characteristics of the CG component in hybrid flashes are not exactly the same as in negative CG flashes.
As seen from the horizontal view in Figure 2d, both the PB initiation and RS are in the convective regions with a composite radar echo larger than 30 dBZ. The horizontal distance between the PB initiation and RS is 4.2 km. Similar to Burning and Macgorman [21] and Zheng et al. [22], we use the convex full area to indicate the flash horizontal size. For this hybrid A example, the flash horizontal size is 254 km2, as marked in Figure 2d.

3.2. Hybrid B

Figure 3 shows an example of a hybrid B flash that occurred at 22:08:04.6 on 18 August 2017 and lasted more than 1.6 s. As seen in Figure 3a–c, the PB leader is initiated at a height of 5.5 km and goes downward directly to terminate at the ground with two striking points, causing a total of seven RSs. Six negative RSs share the same channel, and one RS establishes a new channel. The first negative RS is 21.2 kA, while the intensity of the fifth RS has a maximum value of 39.3 kA. The period between the PB initiation and the RS1st is 29 ms. The RS interval varies from 37 to 159 ms. All of these parameters follow the characteristics of a typical CG flash or multi-termination CG flashes (e.g., Rakov et al. [23]; Zhu et al. [24]; Gao et al. [25]).
After the 7th RS ends at 635 ms, some leaders continue to propagate at an altitude of 6 km, as shown in Figure 3b,c. Occasionally, at 1109 ms, one of the negative leaders progresses out of the negative charge regions and shows an obvious upward propagation, which is similar to the PB process of normal IC flashes. After that, lightning sources are respectively located at heights of 12 and 7 km, exhibiting a bi-level structure that is also commonly seen in normal IC flashes.
As shown by the horizontal view in Figure 3d, the distance between the PB and RS1st is 3 km. Similar to the hybrid A flash example, both the PB and RS are in the convective region where the radar echo is larger than 50 dBZ. The area circled by the pink line in Figure 3d indicates the horizontal flash size. For this hybrid B flash, the horizontal flash size is 293 km2.

3.3. Hybrid C

Figure 4 gives an example of a hybrid C flash. It occurred at 22:55:31.7 on 10 August 2017 and lasted for more than 400 ms, as indicated by Figure 4a. In Figure 4b,c, this hybrid flash first behaves as a typical IC flash, with the PB initiation at an altitude of 8.6 km, followed by a bi-level leader progression until 300 ms. Unlike the negative leader of a typical IC flash propagating in the upper positive charge regions all the time, the negative leader of this hybrid C flash turns to develop downward to the ground and causes only one RS at 345 ms. The RS intensity is 22.6 kA.
The horizontal view of the lightning source locations superposed by the radar echo is shown in Figure 4d. The horizontal flash size of the hybrid C flash example is 77 km2. We can see that there are some apparent differences from the hybrid A or B flash examples. First, the distance between lightning initiation and RS is 9 km, which is two or three times longer than the values described in the hybrid A and B flash examples. Second, the RS of this hybrid C flash example is located far away from the convective region and much closer to the cloud edge, while the RSs of both the hybrid A and B flash examples are in the convective regions. All of these differences imply that hybrid A, B, and C flashes should be treated separately. As to the specific parameter statistics of the three types of hybrid flashes, it can be found and is discussed in the following sections.

4. Statistical Analysis

The three examples in Section 3 show the differences between the three types of hybrid flashes. In this section, to further investigate the differences, we are going to present the statistics of the parameters in the hybrid flashes. These parameters are mainly extracted from three development stages: (1) PB process, (2) leader progressions after the PB process, and (3) RS.
Additionally, as stated in Section 2, one radar scan is about 10 min, and this temporal resolution is relatively low compared with the lightning data. To study the characteristics of the radar echo, we manually organized the lightning data into groups every 10 min, which is the same as the radar scan data. The 288 hybrid flashes analyzed in this study are ultimately grouped into 122 radar scans. As a comparison, we also selected the CG and IC flashes that happened in the same grouped radar scan. Note that, since hybrid A, B, and C in this study do not involve the components of positive CG and inverted IC flashes, we intentionally chose the negative CG and normal IC flashes. In total, there are 844 negative CG and 1562 normal IC flashes, respectively. The statistical results are described as follows.

4.1. Parameters During the PB Process

Initiation Altitude

We calculate the altitude of the first pulses in the PB pulse trains as their initiation altitude. Figure 5 gives the time series of lightning initiation altitude on 19 thunderstorm days, and the detailed statistical results of lightning initiation altitude are shown in Figure 6.
As seen in Figure 5, IC flashes have a higher initiation altitude, and CG flashes appear to have a lower initiation altitude. Hybrid flashes tend to have initiation altitudes between CG and IC flashes. Such a tendency can be verified by the statistical results in Figure 6. The arithmetic mean (AM) initiation altitudes of IC flashes, hybrid flashes, and CG flashes are 8.8 km, 7.1 km, and 5.9 km, respectively. As seen in Figure 6a–c, the histogram distribution of hybrid flashes significantly differs from that of IC and CG flashes. Both IC and CG flashes have only one peak, but the hybrid flashes have double peaks, respectively, at the height of 5.5 km and 8.0 km.
Furthermore, there are also some noticeable differences between the histogram distributions of the three types of hybrid flashes, as shown in Figure 6d–f. We can see that both hybrid B and C flashes present a single-peak distribution. The maximum counts for hybrid B and C flashes are in the intervals of [5, 6] km and [8, 8.5] km, respectively. However, hybrid A flashes show double peaks, and the maximum counts are in the intervals of [5.5, 6.0] and [8.5, 9.0] km. These results indicate that the initiation altitudes vary significantly between the three types of hybrid flashes.

4.2. Parameters After the PB Process

In this section, the parameters after the PB process include (1) the interval from the PB initiation to the RS1st, (2) the horizontal propagation length between the lightning initiation and the RS1st location, and (3) the horizontal flash size that is indicated by the convex full area. The statistical results are discussed as follows.

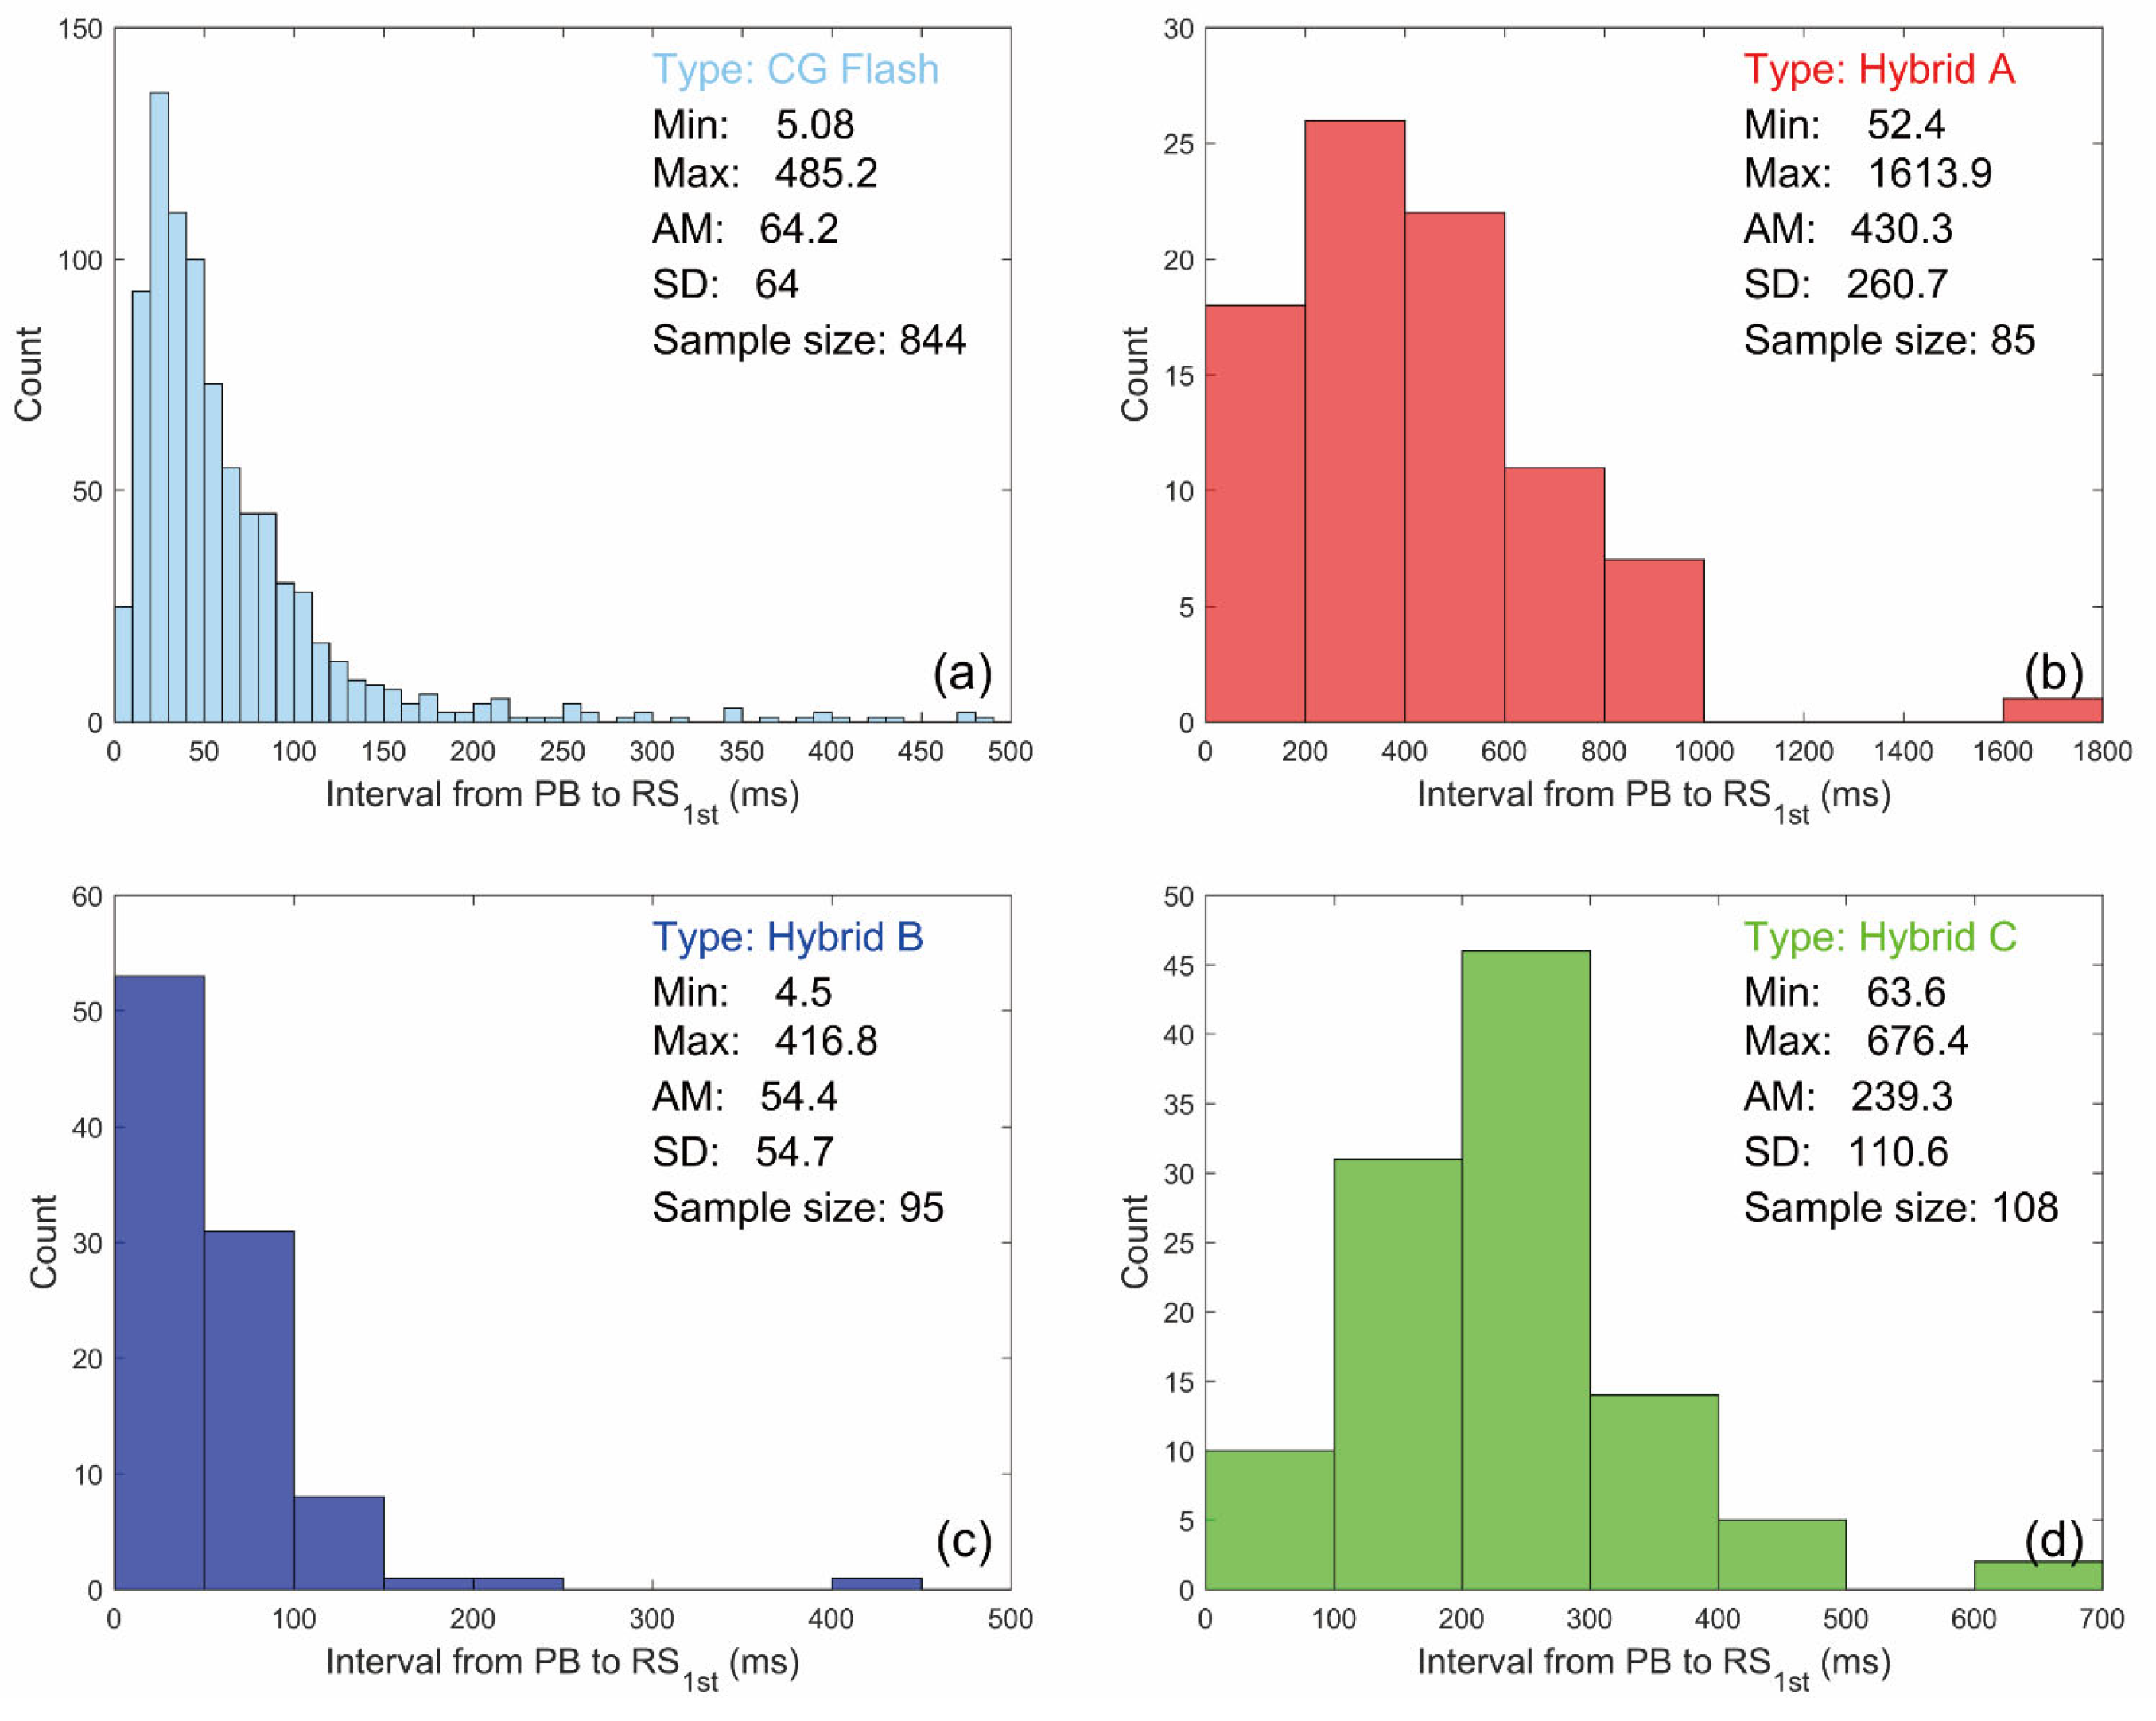
4.2.1. Interval from the PB Initiation to the RS1st

Figure 7 shows the histograms of the interval from the PB initiation to the RS1st. As a comparison, the statistical results of typical CG flashes are given as well. The hybrid A flash has an extremely large interval from the PB initiation to the RS1st. The corresponding AM value is 430.3 ms, nearly seven times that of typical CG flashes. The interval of hybrid B flashes is comparable to that of typical CG flashes (AM value: 54.4 vs. 64.2 ms). The interval of hybrid C flashes is smaller than that of hybrid A flashes (AM value: 239.3 vs. 430.3 ms) but much larger than that of hybrid B flashes (AM value: 239.3 vs. 54.4 ms). Overall, the statistics of this parameter obviously vary between the three types of hybrid flashes.

4.2.2. Propagation Length
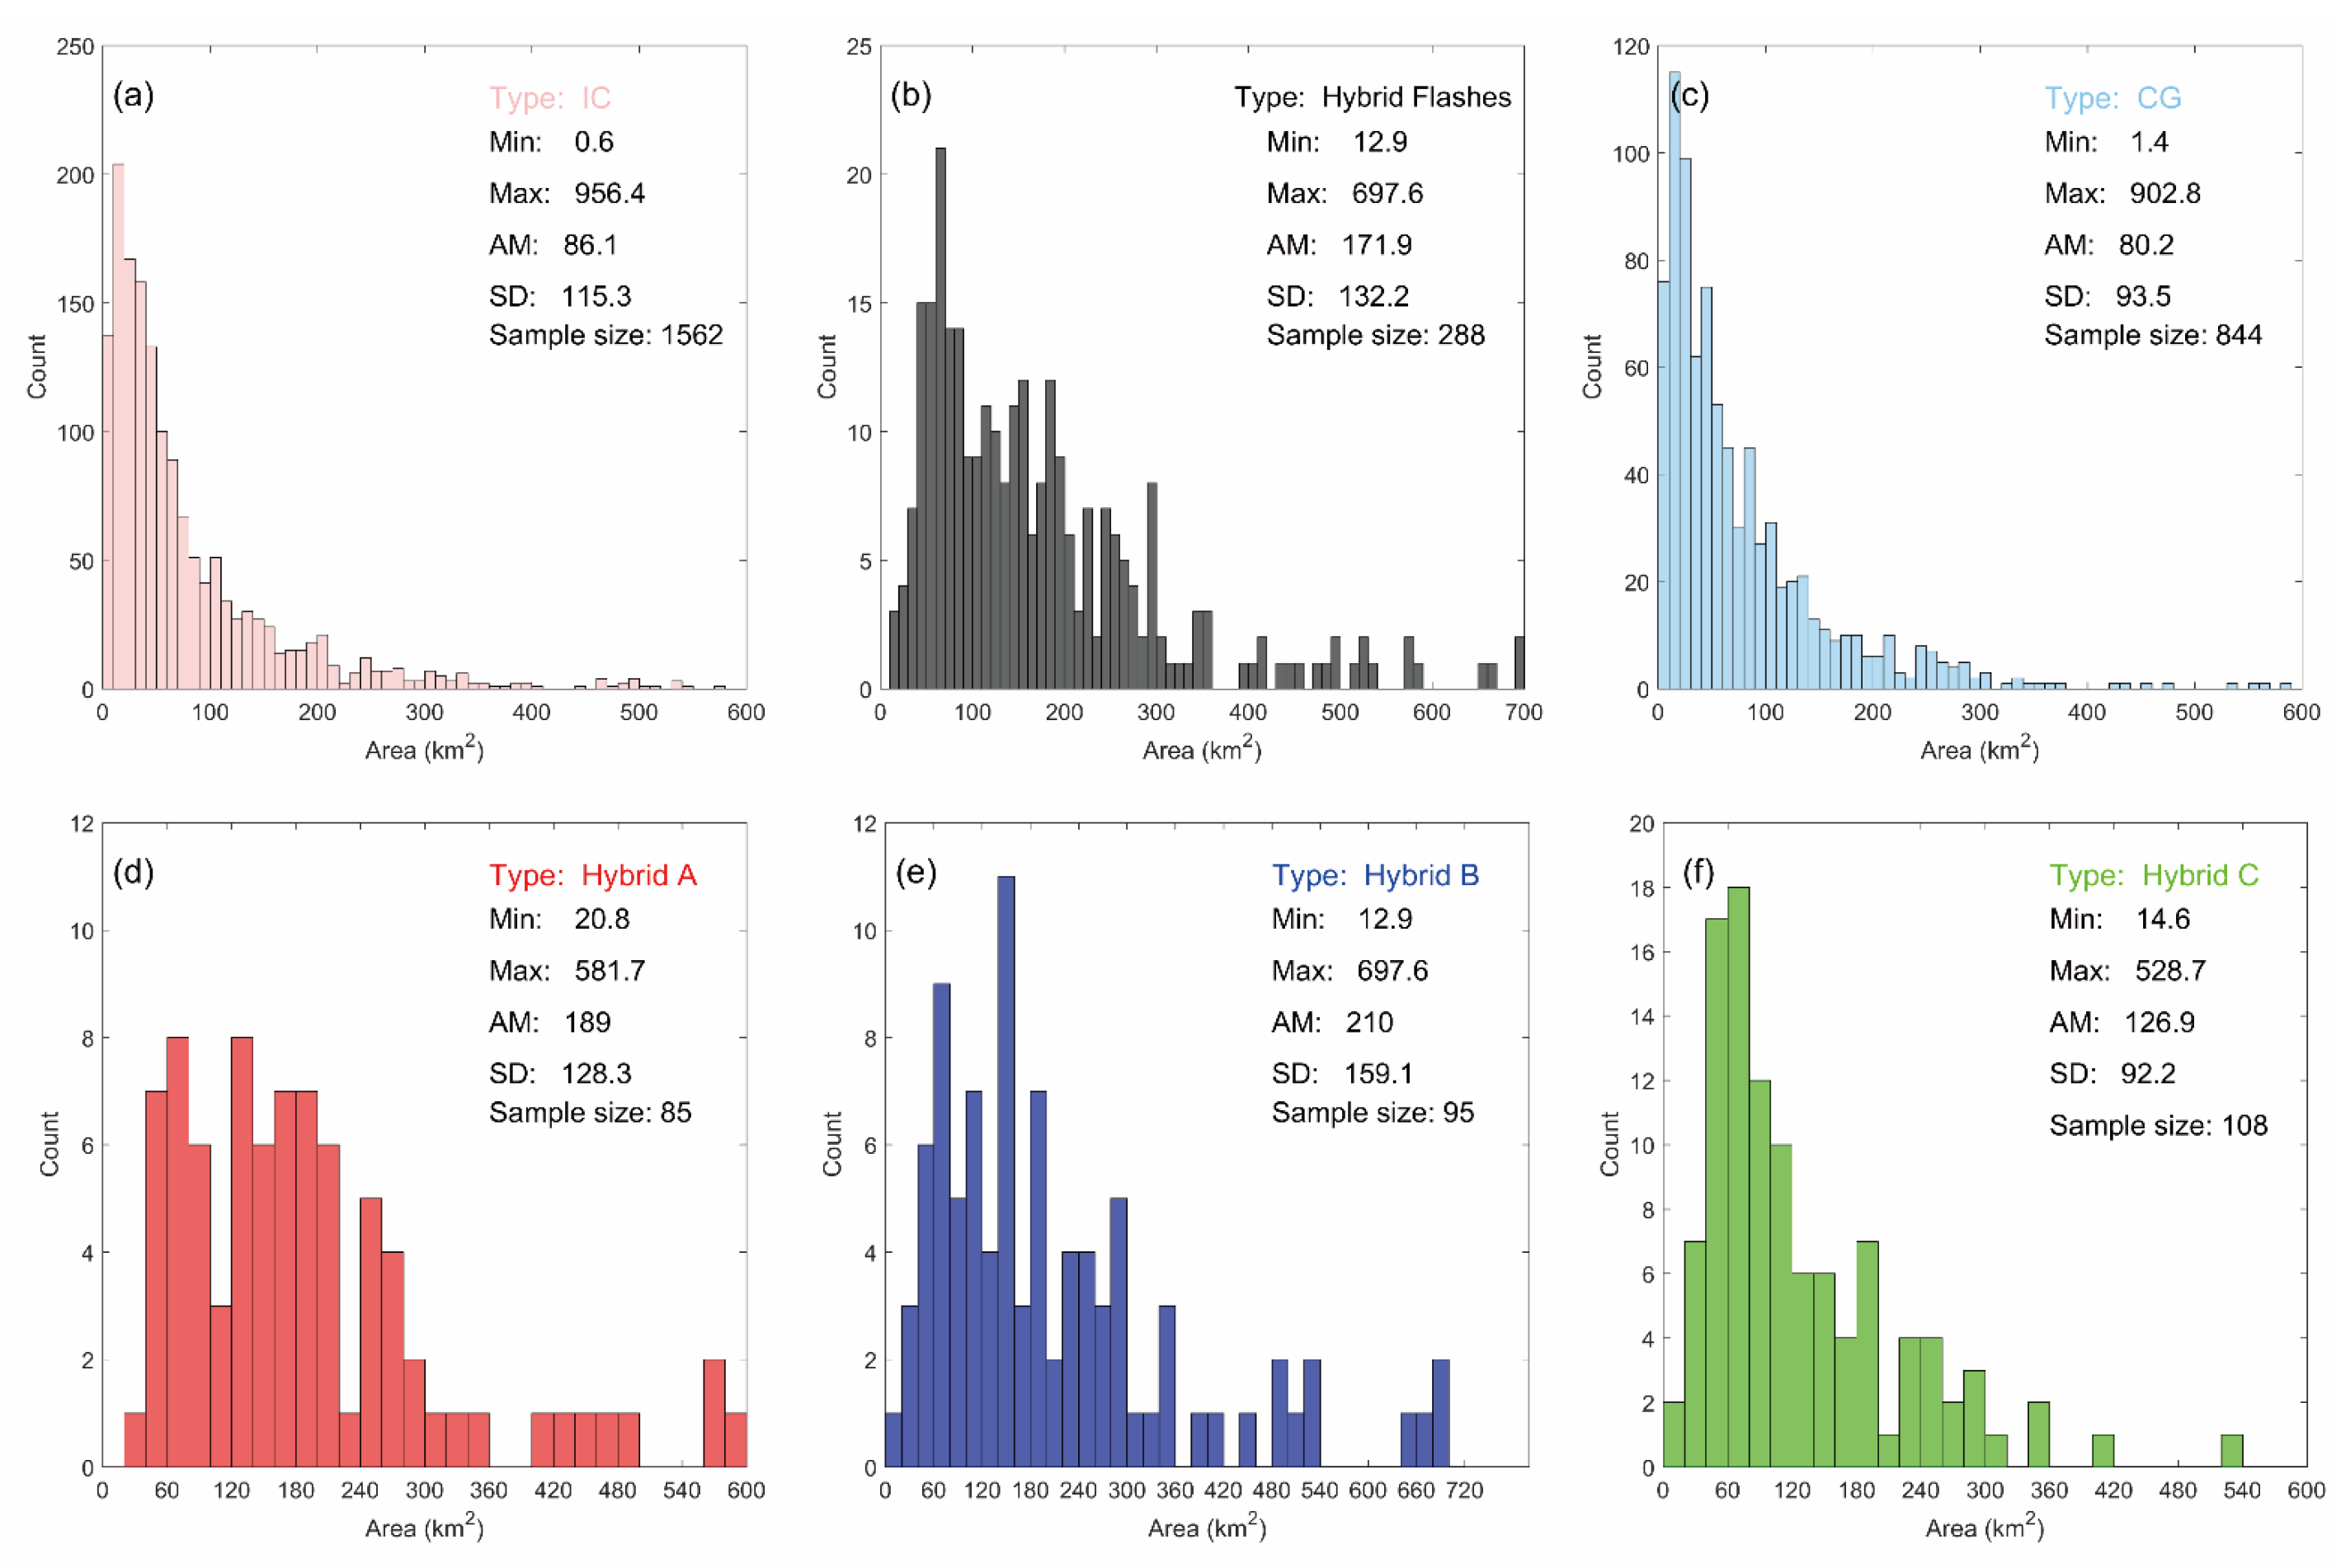
Figure 8 shows the histograms of the propagation length between the lightning initiation and the RS1st location. The statistical results of hybrid B flashes are similar to typical CG flashes in the aspects of both AM values (2.3 vs. 2.2 km) and histogram distributions. However, the statistics of hybrid A and C flashes differ from those of hybrid B flashes. The AM propagation length for hybrid A and C flashes is twice as long as that for hybrid B flashes (6.4 and 7.8 km vs. 2.3 km). The histogram distributions between the three types of hybrid flashes are apparently different. Hybrid B flashes have the maximum count in a range of [1, 2] km, while hybrid A and C flashes have the maximum count in a range of [3, 4] km and [6, 7] km, respectively. Hence, as to the parameter of the horizontal propagation length, hybrid A and C flashes show noticeable differences from hybrid B and CG flashes.

4.2.3. Flash Size

The histograms of the horizontal flash size are shown in Figure 9. Due to having the components of both IC and CG flashes, hybrid flashes unsurprisingly have the largest horizontal size, with AM values of about 171.9 km2, which is twice as large as IC or CG flashes (171.9 vs. 86.1 or 80.2 km2). Correspondingly, both IC and CG flashes have the maximum count in the range of [10, 20] km2, while hybrid flashes reach the maximum count at the interval of [60, 70] km2.
The histogram distributions of the three types of hybrid flashes are given in Figure 9d–f. The flash size of hybrid A lightning shows a scattered histogram distribution, while the histogram distributions of hybrid B and C flashes tend to be more concentrated. The maximum count of hybrid A flashes can be found in the range of both [60, 80] and [120, 140] km2. The peak of the histogram for hybrid B flashes is located in the range of [140, 160] km2, while hybrid C flashes have the maximum count at the interval of [60, 80] km2. As a result, hybrid B lightning has the largest flash size on average, with an AM value of 210 km2. The AM size of hybrid C flashes is the smallest, with a value of 127 km2.

4.3. Parameters Associated with RS

In this section, we will analyze the parameters associated with RS. These parameters include RS multiplicity, peak currents of first and subsequent RSs, RS interval, and radar echo where RS is located. The statistical results are as follows.

4.3.1. RS Multiplicity

Figure 10 shows the histogram of RS multiplicity. The average RS multiplicity of typical CG flashes in the same radar scan is 4.4. On average, for hybrid lightning flashes, hybrid B flashes have the largest RS multiplicity, with an AM value of 5.3. The average RS multiplicity of hybrid A and C flashes tends to be smaller, respectively, with AM values of 3.3 and 2.
Apart from hybrid B flashes having the maximum count at six RSs, all of the CG flashes and hybrid A and C flashes reach the maximum count at one RS. The flashes with only one RS account for 17.9% (151/844), 32.9% (28/85), 6.3% (6/95), and 58.3% (63/108), respectively, in traditional CG flashes and the three types of hybrid flashes. This indicates that hybrid C flashes prefer to produce one RS.

4.3.2. RS Currents

The histograms of peak currents of the first and subsequent RSs are given in Figure 11 and Figure 12. For the first RS, the AM peak currents of the hybrid flashes appear to be slightly larger than that of typical CG flashes (26.8, 34.4, and 26.7 vs. 24.4 kA). Shi et al. [20] has demonstrated that RS1st intensity is positively correlated to the vertical speed of stepped leaders (SL). To check whether the hybrid flashes follow the positive correlations, we calculated the SL vertical speed for the hybrid flashes as well. The results, shown in Figure 13, show that hybrid B flashes with stronger RS1st correspondingly have faster SL vertical speeds than hybrid A and C flashes (3.8 × 10⁵ vs. 2.4 × 10⁵, 2.7 × 10⁵ m/s). As stated by Shi et al. [20], the SLs with faster vertical speed are driven by the stronger electric field. Combining this factor, we further suggest that the background vertical electric field for producing hybrid B flashes should be much stronger than other types of lightning flashes.
Compared to the first RS, the peak currents of the subsequent RSs vary insignificantly. The AM values for CG and hybrid A, B, and C flashes are 13.1, 11.6, 14.5, and 12.6 kA, respectively. All of the histograms in Figure 12 reach the maximum count at the range of [5, 10] kA. It further verifies that there are no meaningful differences in the subsequent RS currents between CG and hybrid flashes.

4.3.3. RS Interval

Figure 14 shows the histograms of the RS interval. We can see that the AM values are 92.3, 102.3, 117.6, and 139 ms, respectively, for CG flashes and hybrid A, B, and C flashes. Although the AM values vary slightly, the histogram distributions of the different types of flashes are similar, with the highest count at the range of [50, 100] ms. No significant differences are found after comparing the statistics of RS interval among the hybrid lightning flashes.

4.3.4. Radar Echo Where the RS Is Located

Figure 15 shows the histogram of the radar echo where the RS is located. The value “Nan” means that there is no available radar data in the regions where the RS is located. The AM value of the radar echo for traditional CG flashes is relatively larger than those for hybrid A, B, and C flashes (40.3 vs. 34.6, 37.8, and 32.3 dBZ). The maximum counts for CG flashes and hybrid A and B flashes are all located in the range of [40, 50] dBZ, indicating that these three types of lightning flashes prefer to produce the RSs in the convective region.
Hybrid C flashes show an interesting histogram distribution. The majority (29%, 31/108) of them are surprisingly found in the regions without a radar echo. The second largest count is in the range of [20, 30] dBZ. All of these statistical results suggest that the RSs of hybrid C flashes appear to be located far away from the convective region and probably closer to or out of the cloud edge. The possible formation of hybrid C flashes will be discussed in the following section.

5. Discussion

Compared to typical IC and typical CG flashes, the statistical results of the hybrid flashes in Section 4 show significant parameter differences (e.g., flash size, interval, and horizontal propagation length from PB to RS). It is obvious that these mentioned parameter differences are due to the hybrid flashes having both IC and CG components. As typical CG and IC flashes are usually independent of time and space, we are very curious about how the additional leader of the former IC or CG components are produced to initiate the latter components and finally form hybrid flashes. The additional leaders that initiate the latter components of hybrid flashes can originate from the middle negative (hybrid A and hybrid B) and upper positive (hybrid C) charge regions, as seen from the 3D location results of the hybrid flashes in Figure 2, Figure 3 and Figure 4. Therefore, we have separately studied their possible formation mechanisms. The detailed discussions are as follows.

5.1. The Formation Mechanism of Hybrid A and B Flashes

Take the hybrid cases in Section 3 as examples. Figure 16 shows the detailed discharge process of the hybrid A example. The pink downward-pointing triangle indicates the initiation of the latter CG component. About 116 ms before the CG initiation, there is an apparent negative recoil leader. The corresponding waveform and 3D locations are seen in Figure 16b,c. We can see that the original leader, shown by gray dots, propagates from the left to the right direction, as indicated by a black arrow. On the contrary, the recoil leader lasts more than 4 ms (from 721 to 725 ms) and propagates backward to the CG initiation. The leader discharge process of the hybrid B example, shown in Figure 17, also presents a similar phenomenon. A recoil leader lasts about 5 ms (from 1082 to 1087 ms) and propagates backward to the position where the IC component will be initiated, as seen in Figure 17b,c.
Hence, we suggest that the formations of both hybrid A and B flashes are associated with recoil leaders. Unlike common recoil leaders that retrace all along the pre-existing channel, recoil leaders in the former component (IC or CG) sometimes turn to propagate out of the old channel, initiate the latter component (CG or IC), and eventually form hybrid flashes.

5.2. The Possible Charge Structure in Favor of Producing Hybrid C Flashes

Unlike hybrid A and B flashes, IC and CG components of hybrid C flashes share the same negative leader channel from the upper positive charge regions. A natural confusion is raised as to what kind of structure is in favor of the subsequent negative leader first propagating almost horizontally and then turning downward to the ground instead of terminating in the upper positive charge region. To address this issue, we have used the lightning sources occurring 10 min before each hybrid C flash to retrieve the charge structure in the thunderstorms. By analyzing the retrieved charge structures, we eventually found two types, as shown in Figure 18 and Figure 19. One is the tilted charge structure. The other is a classical tripolar charge structure.
The special form of the hybrid C flashes is the bolt-from-the-blue lightning (BFB) if the stroke points occurred outside the cloud edge, as indicated by the radar echo of the “Nan” value in Figure 15. Hence, we believe that hybrid C flashes can be seen as an extended BFB form. As previous studies reported, BFB is associated with an asymmetrical charge structure (e.g., Krehibel et al. [11]; Edens [26]), which is strongly supported by the results in Figure 16. Such an asymmetry, as presented in this study, is, in fact, produced by a tilt of both the upper positive and middle negative charges rather than a lateral displacement of charges or a tilt of only the mid-level negative charge, as described by the conceptual model in Boggs et al. [12].
A classical tripolar charge structure can also result in hybrid C flashes, as seen in Figure 19. Upper positive and middle negative charge regions are marked by 13,257 and 26,655 sources, respectively. The source amount indirectly indicates that the charge amount in the upper positive regions should be smaller than that in the middle negative regions. Hence, similar to Krehbiel et al. [11] and Qie et al. [27], we suggest that the occurrence of hybrid C flashes is related to a charge imbalance in which the positive charge is depleted in magnitude relative to the negative charge.
In addition, hybrid C flashes are sometimes clustered in certain thunderstorms, as shown in Figure 5 (e.g., August 18). We find that frequent hybrid C flashes are prone to be produced in the tilted charge structures. Whether this interesting phenomenon is applicable to thunderstorms in other regions needs to be examined. Furthermore, as simulated by Krehbiel et al. [11], a substantial mid-level lateral positive charge is required to make the negative leader in the upper positive charge layer turn downward to the ground. So far, we have not found such charge structures in our results. More observations are also deserved in a future study.

6. Conclusions

In this paper, we have studied the characteristics of 288 hybrid lightning flashes recorded by FALMA in the Japanese summer thunderstorms. These characteristics are extracted from three lightning development stages: PB process, leader progressions after the PB process, and RS. The main statistical results are as follows.
(1)
The hybrid flashes have an AM initiation height of 7.1 km, lower than IC flashes (8.8 km) but apparently higher than typical CG flashes (5.9 km). Histograms show that both hybrid B and C flashes present a single peak, respectively, in the interval of [5, 6] km and [8, 8.5] km. However, hybrid A flashes show double peaks, which may be due to a small sample size.
(2)
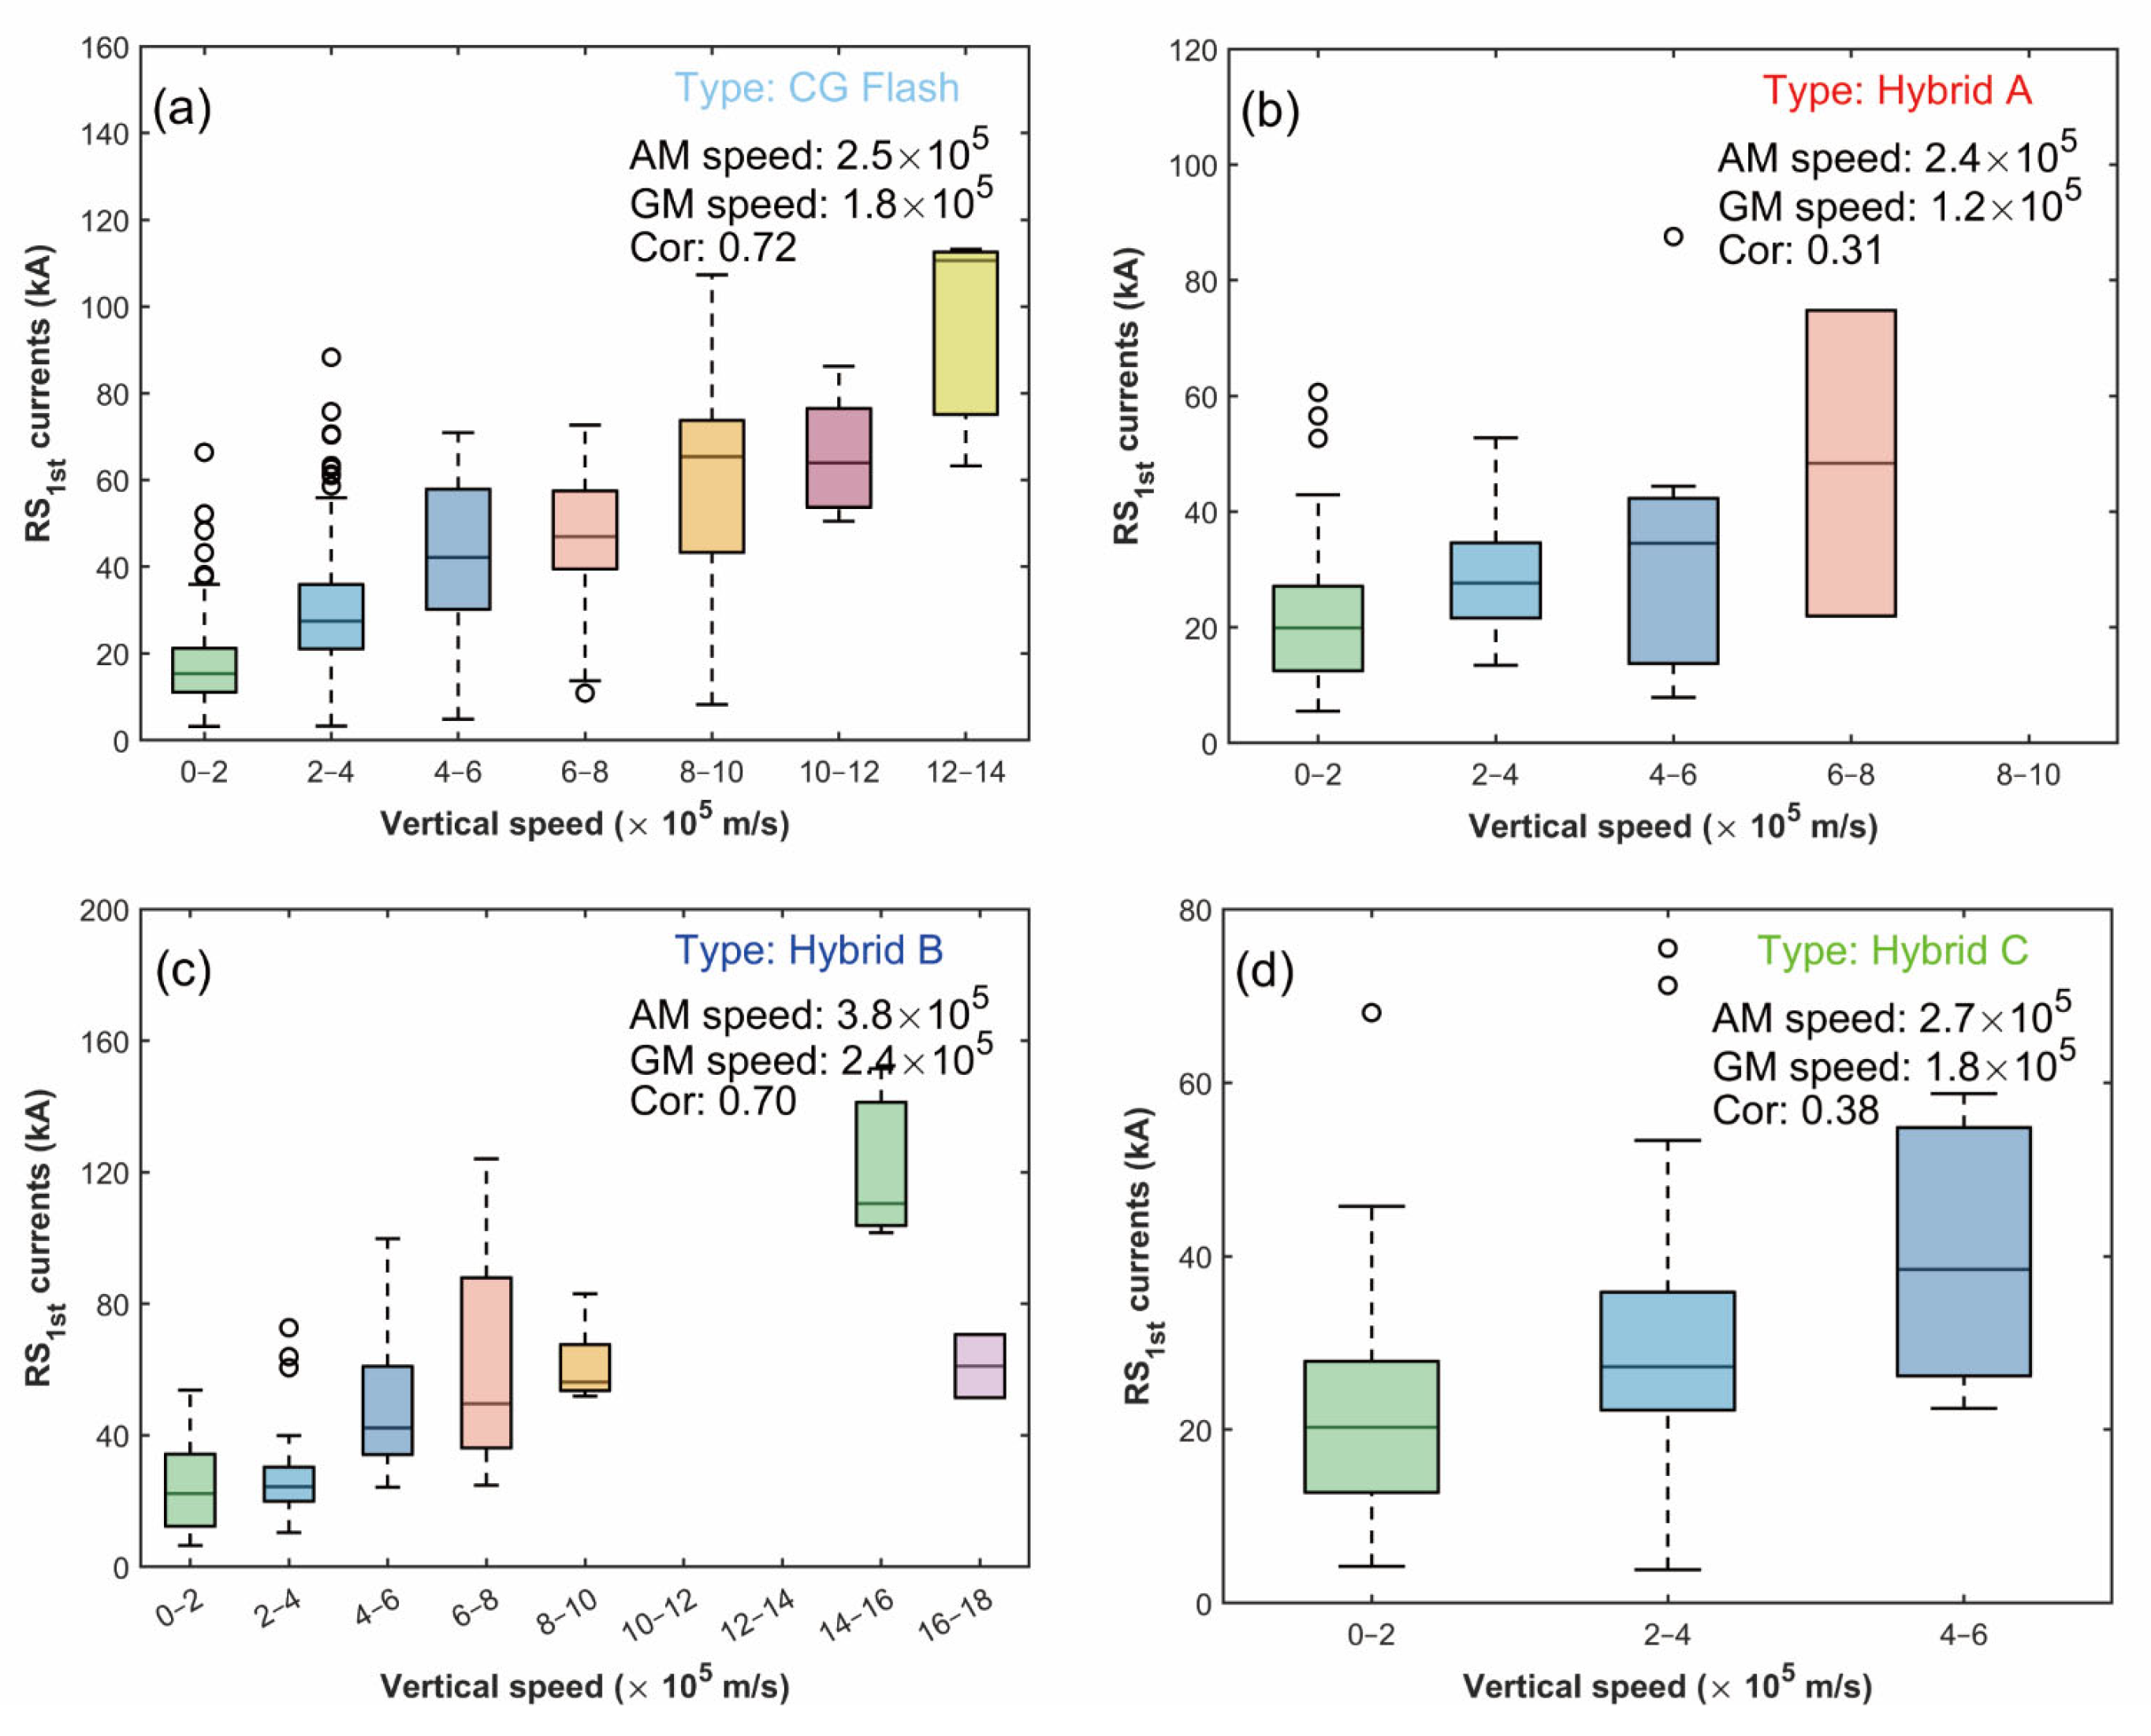
During the stage of the leader progressions after the PB process, we calculated the interval and propagation length from PB to RS1st and the horizontal flash size. Relative to hybrid B flashes, hybrid A and hybrid C flashes have a larger interval (AM value: 430.3, 239.3 vs. 54.4 ms) and longer propagation length (AM value: 6.4, 7.8 vs. 3.0 km). Compared to IC and CG flashes, hybrid flashes unsurprisingly have the largest horizontal size: the AM values of hybrid A, B, and C flashes are 189, 210, and 126.9 km2, respectively.
(3)
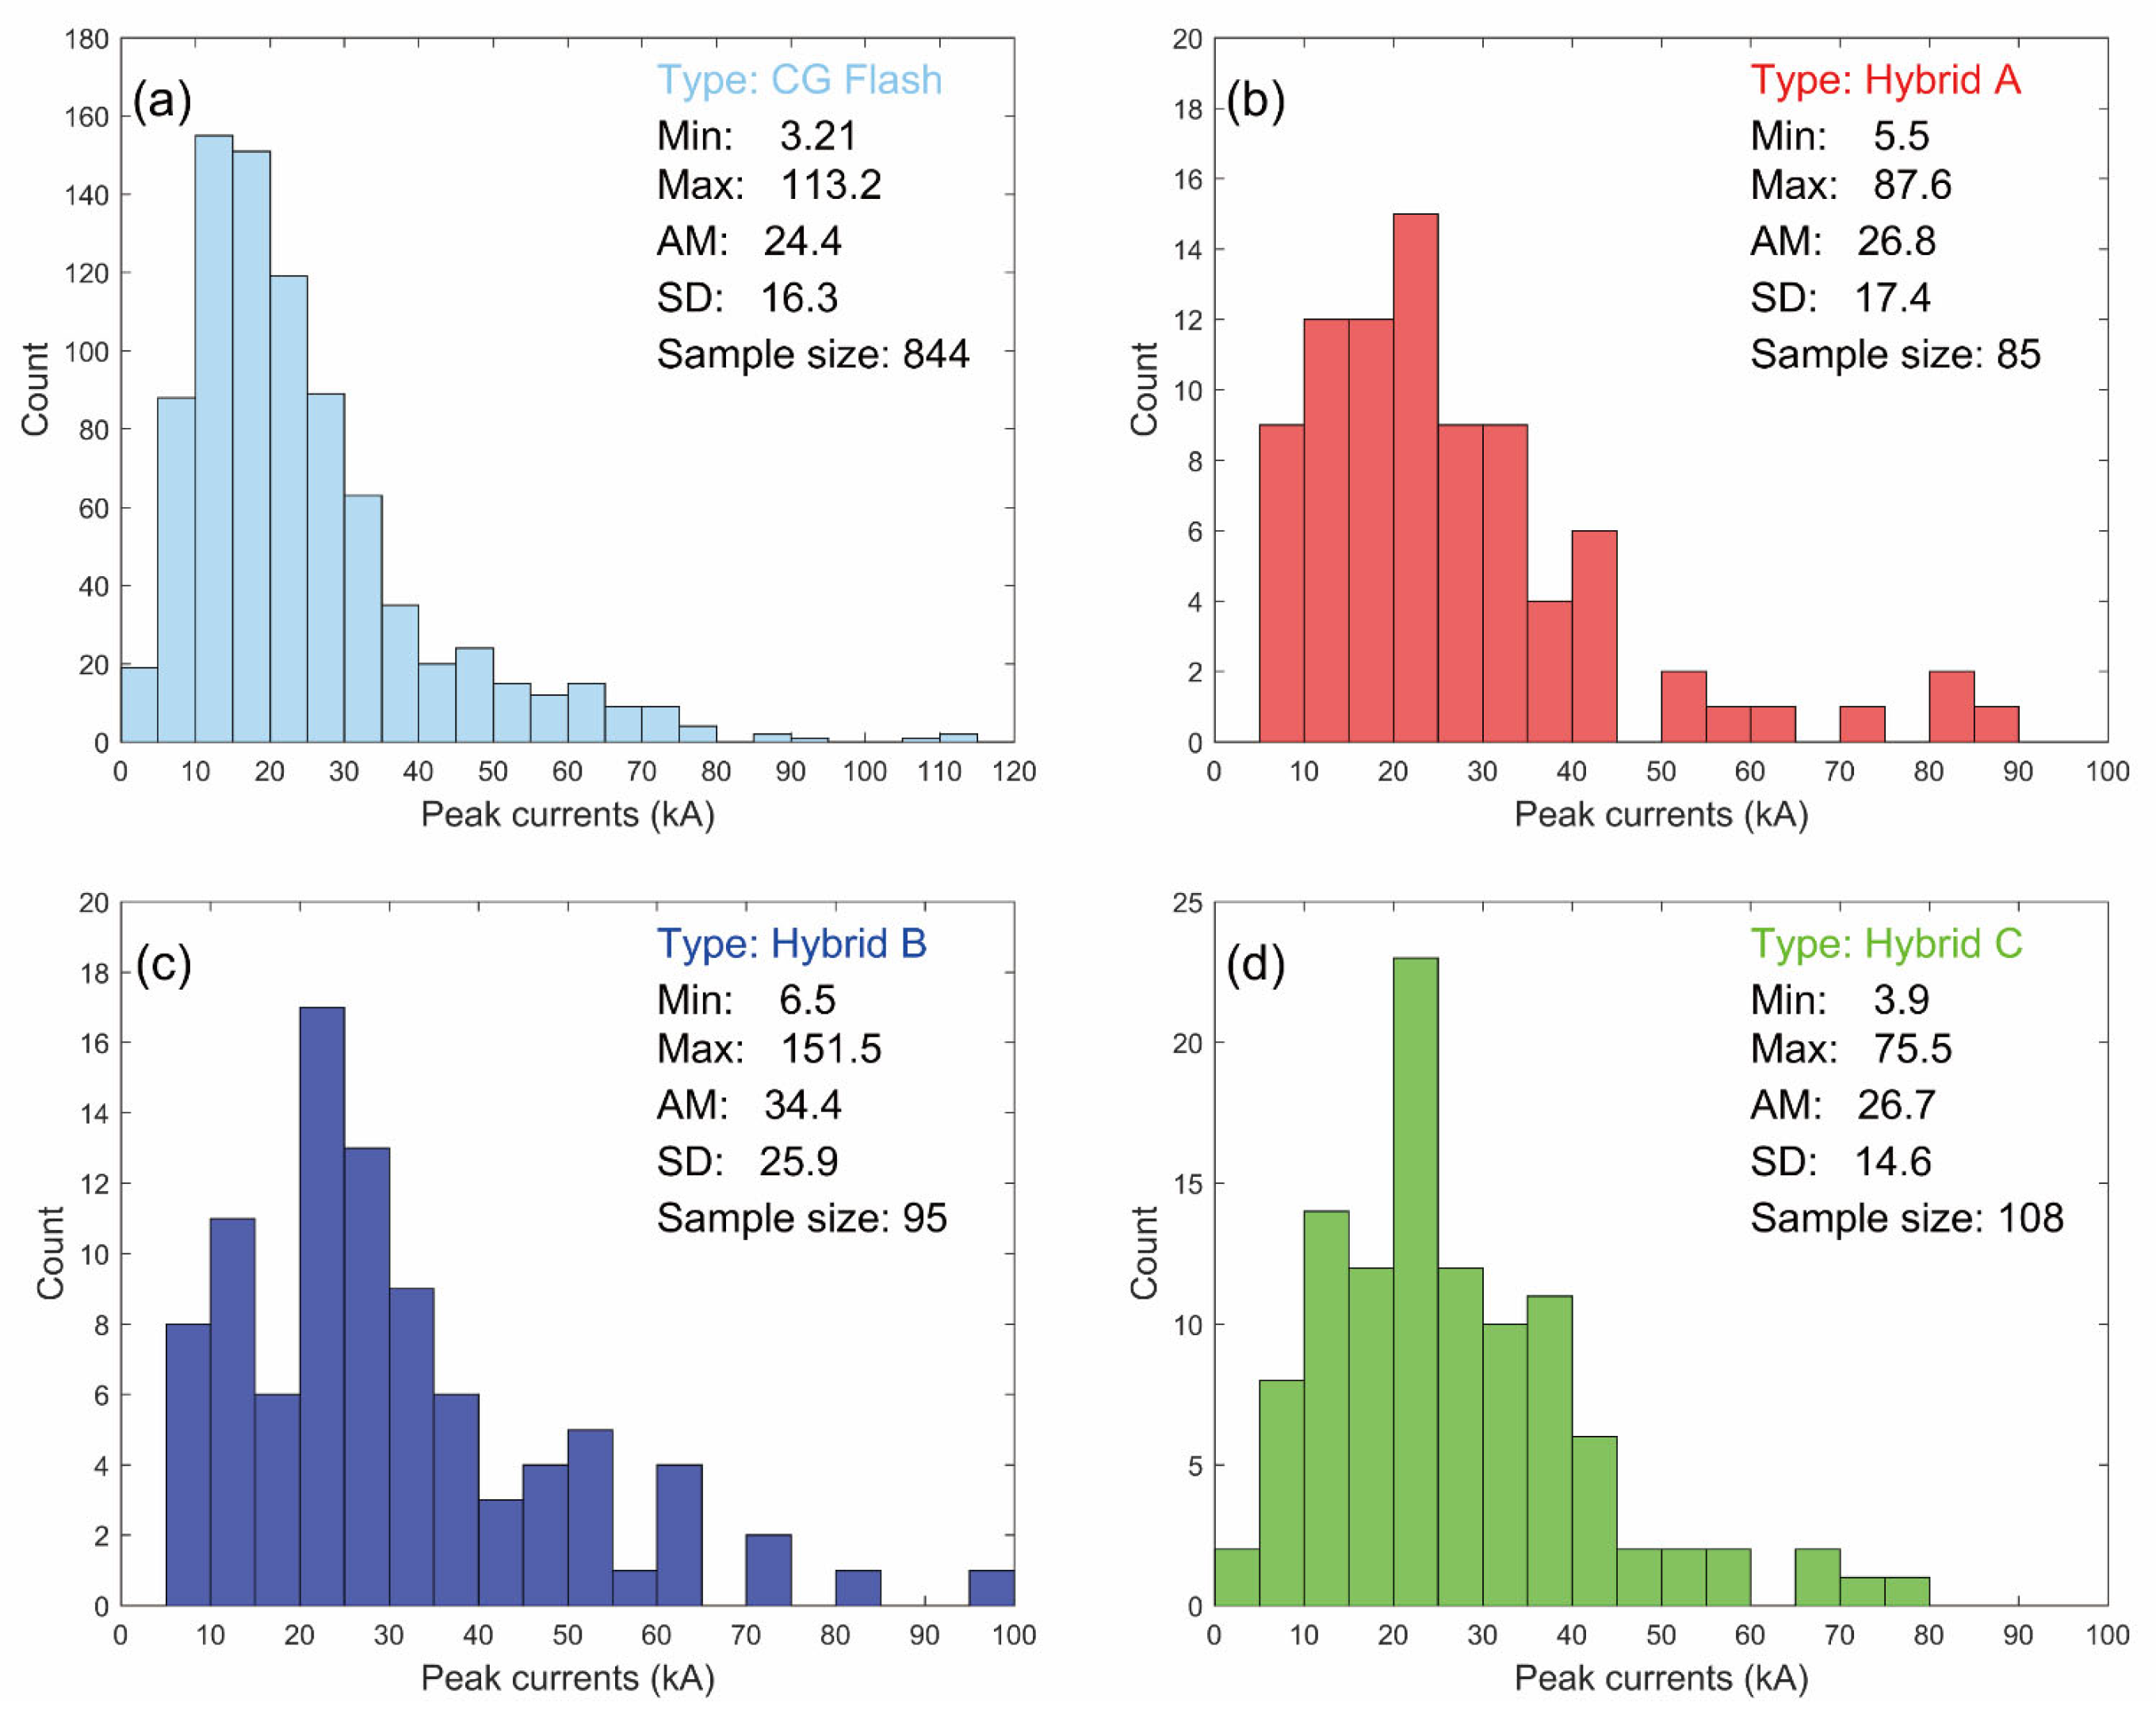
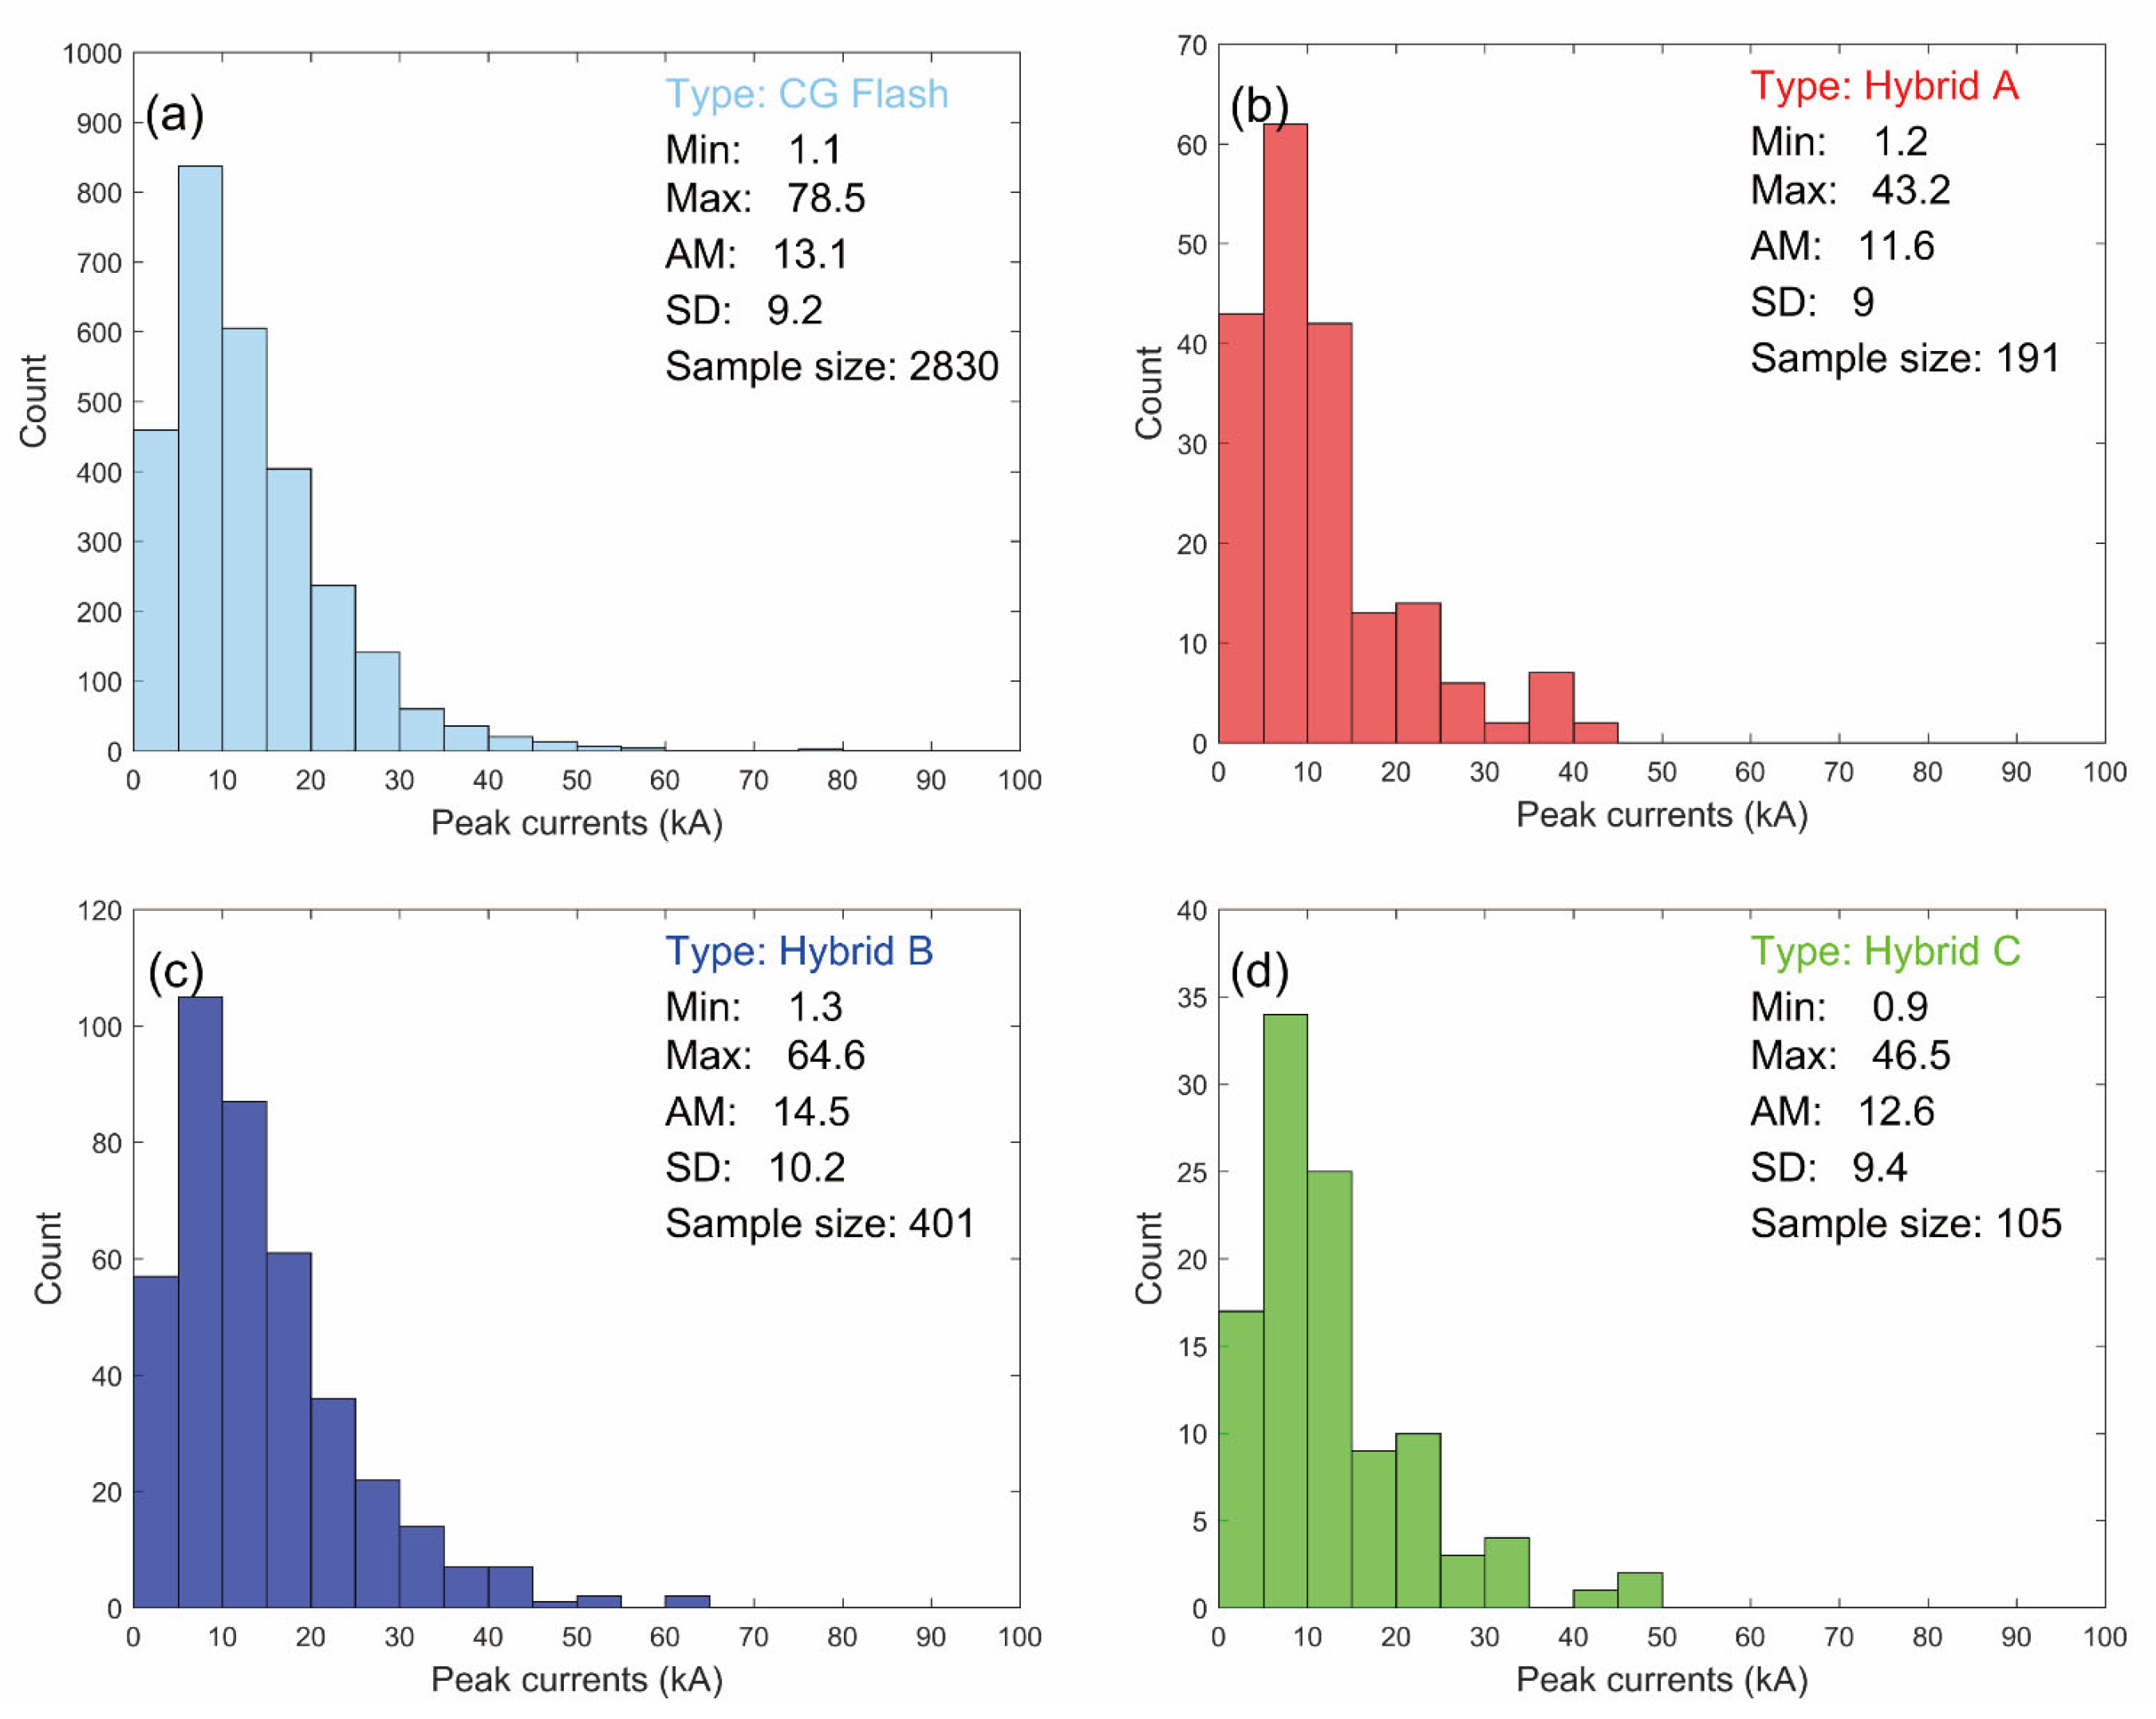
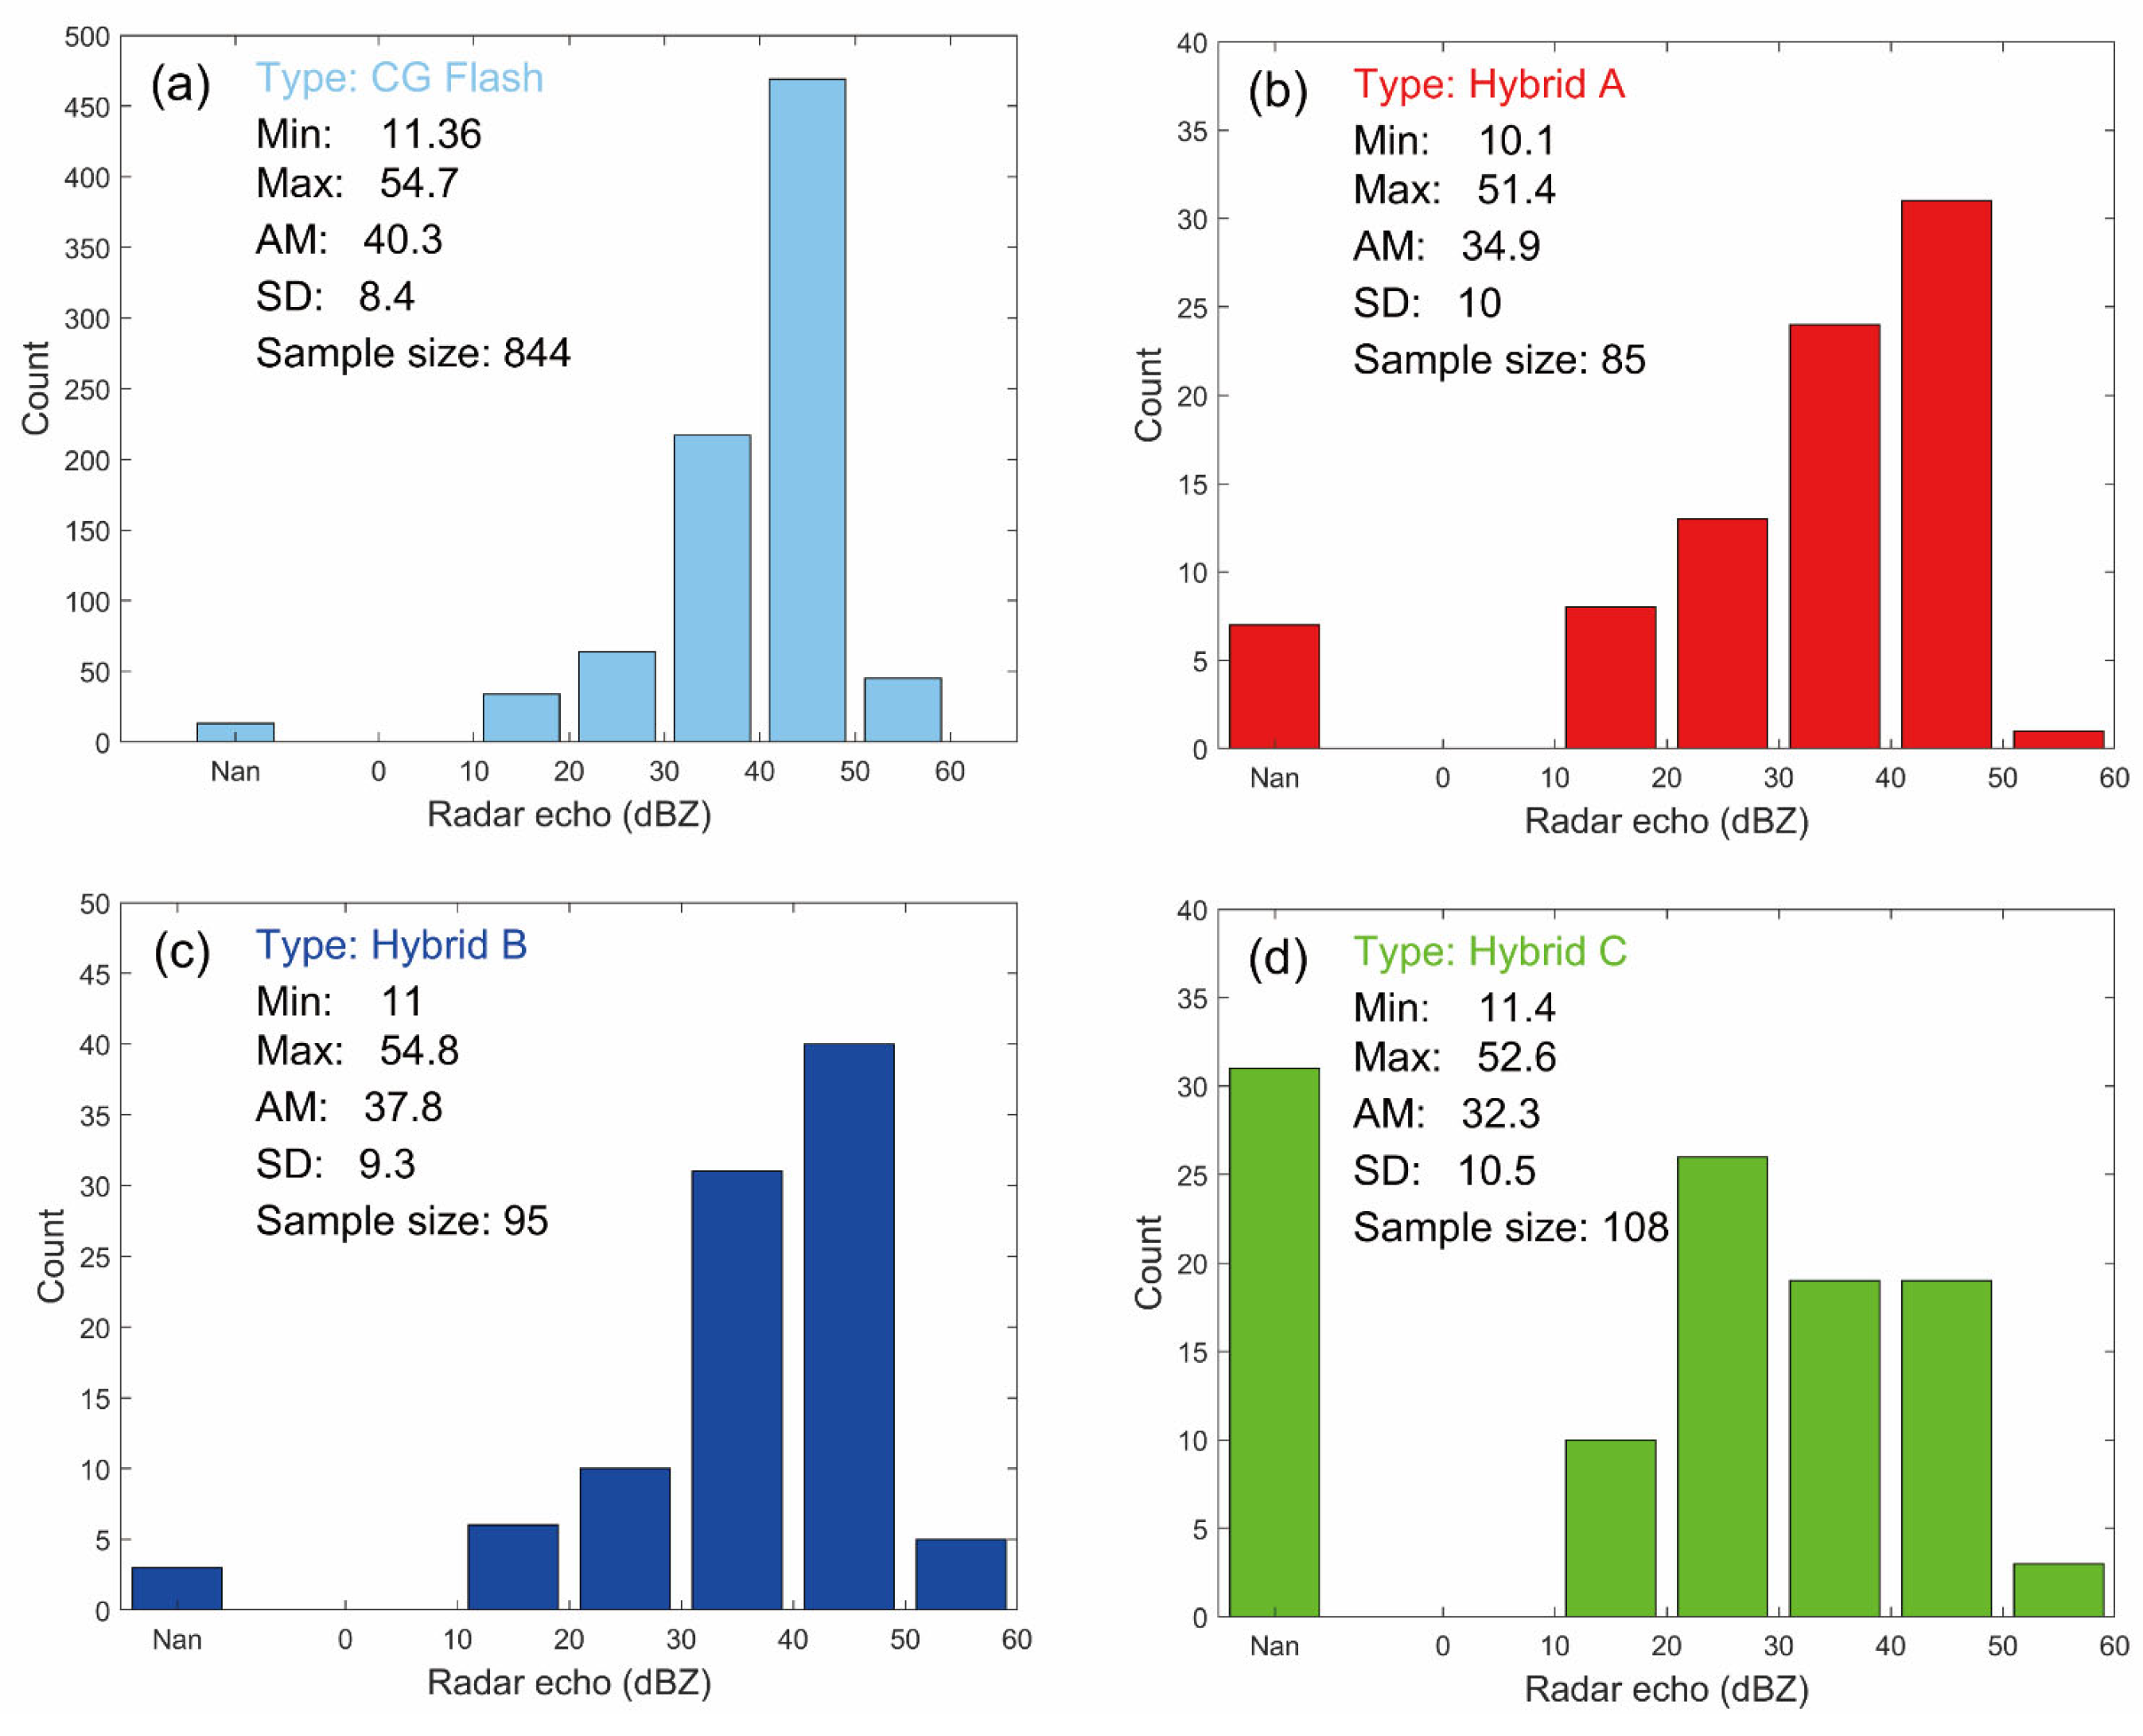
Parameters associated with RS include RS multiplicity, peak currents of first and subsequent RSs, RS interval, and radar echo where the RS is located. Compared to hybrid A and C flashes, we have found that hybrid B flashes tend to produce more RSs (AM: 5.3 vs. 3.3 and 2) and larger RS1st peak currents (AM: 34.4 vs. 26.8 and 26.7 kA). Hybrid C flashes appear to be close to or out of the cloud edge, in which 29% (31/108) of them are in the regions without a radar echo. As to subsequent RS currents and RS interval, there is no significant difference after comparing the three types of hybrid flashes.
Based on the high-quality 3D locations, we discussed the possible formation mechanisms of the three types of hybrid flashes. We suggest that the formations of hybrid A and B flashes are associated with the recoil leaders, while hybrid C flashes are related to the charge structure with an asymmetrical shape (e.g., tilted structure) or in the charge magnitude.

Author Contributions

Formal analysis, D.S. and J.S.; Funding acquisition, R.J. and L.W.; Methodology, D.S.; Resources, D.W. and T.W.; Software, D.S.; Validation, D.S.; Writing—original draft, D.S.; Writing—review and editing, D.W. All authors have read and agreed to the published version of the manuscript.

Funding

This research was supported in part by the Key Laboratory of Middle Atmosphere and Global environment Observation (LAGEO-2022-06) and the National Natural Science Foundation of China (grant 42305070).

Institutional Review Board Statement

Not applicable.

Informed Consent Statement

Not applicable.

Data Availability Statement

The original contributions presented in this study are included in the article; further inquiries can be directed to the corresponding author.

Acknowledgments

The lightning observation experiments around Gifu, Japan, were carried out by researchers at Gifu University, including both current and retired staff (e.g., Nobuyuki Takagi). We extend our sincere gratitude to all those involved for their invaluable contributions to this work.

Conflicts of Interest

The authors declare no conflicts of interest.

References

  1. Mecikalski, R.M.; Bitzer, P.M.; Carey, L.D. Why flash type matters: A statistical analysis. Geophys. Res. Lett. 2017, 44, 9505–9512. [Google Scholar] [CrossRef]
  2. Mecikalski, R.M.; Carey, L.D. Radar reflectivity and altitude distributions of lightning as a function of IC, CG, and HY flashes: Implications for LNOx production. J. Geophys. Res. Atmos. 2018, 123, 12796–12813. [Google Scholar] [CrossRef]
  3. Qie, X.; Wang, Z.; Wang, D.; Liu, M. Characteristics of positive cloud-to-ground lightning in Da Hinggan Ling forest region at relatively high latitude, northeastern China. J. Geophys. Res. Atmos. 2013, 118, 13393–13404. [Google Scholar] [CrossRef]
  4. Zhang, Y.; Zhang, Y.; Zheng, D.; Lu, W. Preliminary breakdown, following lightning discharge processes and lower positive charge region. Atmos. Res. 2015, 161, 52–56. [Google Scholar] [CrossRef]
  5. Mecikalski, R.M.; Carey, L.D. Lightning characteristics relative to radar, altitude and temperature for a multicell, MCS and supercell over northern Alabama. Atmos. Res. 2017, 191, 128–140. [Google Scholar] [CrossRef]
  6. Lu, G.; Cummer, S.A.; Blakeslee, R.J.; Weiss, S.; Beasley, W.H. Lightning morphology and impulse charge moment change of high peak current negative strokes. J. Geophys. Res. Atmos. 2012, 117, D04212. [Google Scholar] [CrossRef]
  7. Lang, T.J.; Cummer, S.A.; Rutledge, S.A.; Lyons, W.A. The meteorology of negative cloud-to-ground lightning strokes with large charge moment changes: Implications for negative sprites. J. Geophys. Res. Atmos. 2013, 118, 7886–7896. [Google Scholar] [CrossRef]
  8. Bitzer, P.M.; Christian, H.J.; Stewart, M.; Burchfield, J.; Podgorny, S.; Corredor, D.; Hall, J.; Kuznetsov, E.; Franklin, V. Characterization and applications of VLF/LF source locations from lightning using the Huntsville Alabama Marx Meter Array. J. Geophys. Res. Atmos. 2013, 118, 3120–3138. [Google Scholar] [CrossRef]
  9. Yoshida, S.; Wu, T.; Ushio, T.; Kusunoki, K.; Nakamura, Y. Initial results of LF sensor network for lightning observation and characteristics of lightning emission in LF band. J. Geophys. Res. Atmos. 2014, 119, 12034–12051. [Google Scholar] [CrossRef]
  10. Wu, T.; Wang, D.; Takagi, N. Lightning mapping with an array of fast antennas. Geophys. Res. Lett. 2018, 45, 3698–3705. [Google Scholar] [CrossRef]
  11. Krehbiel, P.R.; Riousset, J.A.; Pasko, V.P.; Thomas, R.J.; Rison, W.; Stanley, M.A.; Edens, H.E. Upward electrical discharges from thunderstorms. Nat. Geosci. 2008, 1, 233–237. [Google Scholar] [CrossRef]
  12. Boggs, L.D.; Liu, N.; Splitt, M.; Lazarus, S.; Glenn, C.; Rassoul, H.; Cummer, S.A. An analysis of five negative sprite-parent discharges and their associated thunderstorm charge structures. J. Geophys. Res. Atmos. 2016, 121, 759–784. [Google Scholar] [CrossRef]
  13. Fan, X.P.; Zhang, Y.J.; Zheng, D.; Zhang, Y.; Lyu, W.T.; Liu, H.Y.; Xu, L.T. A new method of three-dimensional location for low-frequency electric field detection array. J. Geophys. Res. Atmos. 2018, 123, 8792–8812. [Google Scholar] [CrossRef]
  14. Wu, T.; Smith, D.M.; Wada, Y.; Nakazawa, K.; Oguchi, M.; Kamogawa, M.; Suzuki, T.; Yang, Q.; Wang, D. Energetic compact strokes as the major source of downward terrestrial gamma-ray flashes in winter thunderstorms. Geophys. Res. Lett. 2025, 52, e2024GL113194. [Google Scholar] [CrossRef]
  15. Wu, T.; Wang, D.; Takagi, N. High-accuracy classification of radiation waveforms of lightning return strokes. J. Geophys. Res. Atmos. 2023, 128, e2023JD038715. [Google Scholar] [CrossRef]
  16. Cummins, K.L.; Wilson, J.G.; Eichenbaum, A.S. The impact of cloud-to-ground lightning type on the differences in return stroke peak current over land and ocean. IEEE Access 2019, 7, 174774–174781. [Google Scholar] [CrossRef]
  17. Nag, A.; Cummins, K.L. Negative first stroke leader characteristics in cloud-to-ground lightning over land and ocean. Geophys. Res. Lett. 2017, 44, 1973–1980. [Google Scholar] [CrossRef]
  18. Baharudin, Z.A.; Ahmad, N.A.; Fernando, M.; Cooray, V.; Mäkelä, J.S. Comparative study on preliminary breakdown pulse trains observed in Johor, Malaysia and Florida, USA. Atmos. Res. 2012, 117, 111–121. [Google Scholar] [CrossRef]
  19. Marshall, T.; Schulz, W.; Karunarathna, N.; Karunarathne, S.; Stolzenburg, M.; Vergeiner, C.; Warner, T. On the percentage of lightning flashes that begin with initial breakdown pulses. J. Geophys. Res. Atmos. 2014, 119, 445–460. [Google Scholar] [CrossRef]
  20. Shi, D.; Wang, D.; Wu, T.; Takagi, N. Correlation between the first return stroke of negative CG lightning and its preceding discharge processes. J. Geophys. Res. Atmos. 2019, 124, 8501–8510. [Google Scholar] [CrossRef]
  21. Bruning, E.C.; MacGorman, D.R. Theory and observations of controls on lightning flash size spectra. J. Atmos. Sci. 2013, 70, 4012–4029. [Google Scholar] [CrossRef]
  22. Zheng, D.; MacGorman, D.R. Characteristics of flash initiations in a supercell cluster with tornadoes. Atmos. Res. 2016, 167, 249–264. [Google Scholar] [CrossRef]
  23. Rakov, V.A.; Uman, M.A.; Thottappillil, R. Review of lightning properties from electric field and TV observations. J. Geophys. Res. Atmos. 1994, 99, 10745–10750. [Google Scholar]
  24. Zhu, Y.; Rakov, V.A.; Mallick, S.; Tran, M.D. Characterization of negative cloud-to-ground lightning in Florida. J. Atmos. Sol.-Terr. Phys. 2015, 136, 8–15. [Google Scholar] [CrossRef]
  25. Gao, P.; Wang, D.; Shi, D.; Wu, T.; Takagi, N. Characterization of Multitermination CG Flashes Using a 3D Lightning Mapping System (FALMA). Atmosphere 2019, 10, 625. [Google Scholar] [CrossRef]
  26. Edens, H. Bolts from the Blue. Doctor Thesis, New Mexico Institute of Mining and Technology, Socorro, NM, USA, 10 June 2011. [Google Scholar]
  27. Qie, X.; Liu, D.; Li, F.; Sun, Z.; Wei, L.; Sun, C.; Zhu, K.; Lü, H.; Tang, G.; Yuan, S.; et al. Charge structure of an isolated thunderstorm on the Tibetan Plateau and the formation of bolt-from-the-blue lightning. Chin. Sci. Bull. 2025, 70, 944–954. (In Chinese) [Google Scholar] [CrossRef]
Figure 1. Illustration of hybrid flashes of three types (ac) and their RS horizontal locations (d). The symbols of red pluses and short blue dashes indicate positive and negative charges in the thunderstorm, respectively. Red and blue lines represent the positive and negative leaders, with the arrows showing the stroke points. In subplots, the labeled numbers indicate the leader’s occurrence order. The black squares in (d) indicate the 12 FALMA sites during the summer of 2017. The latitude and longitude of site (0, 0) are 35.475 °N and 136.960 °E.
Atmosphere 16 00765 g001
Figure 2. E-change waveform (a) and 3D mapping (bd) of a hybrid A flash example that occurred at 01:28:17.3 on 18 August 2017. (bd) are source locations in the views of t-z, x-z, and x-y, respectively. The yellow and pink diamonds mark the first radiation source of PB and the first negative RS peak. The shading area in (d) represents the composite radar reflectivity, with the color bar marked on the right side.
Atmosphere 16 00765 g002
Figure 3. E-change waveform (a) and 3D mapping (bd) of a hybrid B flash example that occurred at 22:08:04.6 on 18 August 2017. Two terminating points are marked by a pink diamond and a pink circle. The other symbols are the same as those in Figure 2.
Atmosphere 16 00765 g003
Figure 4. E-change waveform (a) and 3D mapping (bd) of a hybrid C flash example that occurred at 22:55:31.7 on 10 August 2017. The other symbols are the same as those in Figure 2.
Atmosphere 16 00765 g004
Figure 5. The time series of lightning initiation altitude on 19 thunderstorm days analyzed in this study. Pink and blue dots represent IC and CG initiations. The red triangles, the blue inverted triangles, and the green diamonds represent hybrid A, B, and C lightning initiations, respectively. Different thunderstorm days are divided by the color-filled block at the bottom of the picture. The x-axis resolution equals one radar scan, namely about 10 min. There are a total of 122 radar scans.
Atmosphere 16 00765 g005
Figure 6. Histograms of initiation altitude of IC flashes (a), hybrid flashes (b), CG flashes (c), hybrid A flashes (d), hybrid B flashes (e), and hybrid C flashes (f). Here, Min, Max, AM, and SD are abbreviations for minimum, maximum, arithmetic mean, and standard deviation, respectively.
Atmosphere 16 00765 g006
Figure 7. Histograms of the interval from the PB initiation to the RS1st. (a) CG flashes, (b) hybrid A flashes, (c) hybrid B flashes, (d) hybrid C flashes. Here, Min, Max, AM, and SD are abbreviations for minimum, maximum, arithmetic mean, and standard deviation, respectively.
Atmosphere 16 00765 g007
Figure 8. Histograms of the propagation length between the lightning initiation and the RS1st location. (a) CG flashes, (b) hybrid A flashes, (c) hybrid B flashes, (d) hybrid C flashes. Here, Min, Max, AM, and SD are abbreviations, respectively, for minimum, maximum, arithmetic mean, and standard deviation.
Atmosphere 16 00765 g008
Figure 9. Histograms of the horizontal flash size of IC flashes (a), hybrid flashes (b), CG flashes (c), hybrid A flashes (d), hybrid B flashes (e), and hybrid C flashes (f). Here, Min, Max, AM, and SD are abbreviations for minimum, maximum, arithmetic mean, and standard deviation, respectively.
Atmosphere 16 00765 g009
Figure 10. Histograms of RS multiplicity. (a) CG flashes, (b) hybrid A flashes, (c) hybrid B flashes, (d) hybrid C flashes. Here, Min, Max, AM, and SD are abbreviations for minimum, maximum, arithmetic mean, and standard deviation, respectively.
Atmosphere 16 00765 g010
Figure 11. Histograms of the first RS peak currents. (a) CG flashes, (b) hybrid A flashes, (c) hybrid B flashes, (d) hybrid C flashes. Here, Min, Max, AM, and SD are abbreviations for minimum, maximum, arithmetic mean, and standard deviation, respectively.
Atmosphere 16 00765 g011
Figure 12. Histograms of the subsequent RS peak currents. (a) CG flashes, (b) hybrid A flashes, (c) hybrid B flashes, (d) hybrid C flashes. Here, Min, Max, AM, and SD are abbreviations for minimum, maximum, arithmetic mean, and standard deviation, respectively.
Atmosphere 16 00765 g012
Figure 13. Boxplots of RS1st currents with the SL vertical speed in the interval of 2 × 10⁵ m/s. (a) CG flashes, (b) hybrid A flashes, (c) hybrid B flashes, (d) hybrid C flashes. Here, AM, GM, and Cor are abbreviations for arithmetic mean, geometric mean, and correlation coefficients, respectively.
Atmosphere 16 00765 g013
Figure 14. Histograms of RS intervals. (a) CG flashes, (b) hybrid A flashes, (c) hybrid B flashes, (d) hybrid C flashes. Here, Min, Max, AM, and SD are abbreviations for minimum, maximum, arithmetic mean, and standard deviation, respectively.
Atmosphere 16 00765 g014
Figure 15. Histograms of the radar echoes where the RSs are located. (a) CG flashes, (b) hybrid A flashes, (c) hybrid B flashes, (d) hybrid C flashes. Here, Min, Max, AM, and SD are abbreviations for minimum, maximum, arithmetic mean, and standard deviation, respectively.
Atmosphere 16 00765 g015
Figure 16. The 3D locations of a recoil leader that initiates the latter CG component of the hybrid A example. (a) Lightning source locating height with time, (b) the E-change waveform of the recoil leader superposed with the source locating height, (c) the source distribution in the x-z view. Black dots represent the CG components with the initiation marked by a pink downward-pointing triangle. Colorful dots indicate the recoil leader locations, and other parts of hybrid flashes are shown by gray dots. The black line with the arrow indicates the previous leader propagation direction.
Atmosphere 16 00765 g016
Figure 17. The 3D locations of a recoil leader that initiates the IC component of the hybrid B example. (a) Lightning source locating height with time, (b) the E-change waveform of the recoil leader superposed with the source locating height, (c) the source distribution in the x-y view. The other symbols are the same as those in Figure 16.
Atmosphere 16 00765 g017
Figure 18. The tilted charge structure that produces the hybrid C flashes. Sources are colored by charge, with yellow (blue) dots representing negative (positive) breakdown in positive (negative) charge. Black dots indicate the hybrid C flash sources, with the PB initiation marked by a red circle point. (a) Time series of sources with altitude. (b) Source points in the x-z view. (c) All sources located in FALMA, with black squares indicating the observation sites. (d) Source points in the x-y view. (e) Source points in the z-y view.
Atmosphere 16 00765 g018
Figure 19. The classical tripolar charge structure that produces hybrid C flashes. (a) Time series of sources with altitude. (b) Source points in the x-z view. (c) All sources located in FALMA, with black squares indicating the observation sites. (d) Source points in the x-y view. (e) Source points in the z-y view. The other symbols are the same as those in Figure 18.
Atmosphere 16 00765 g019
Disclaimer/Publisher’s Note: The statements, opinions and data contained in all publications are solely those of the individual author(s) and contributor(s) and not of MDPI and/or the editor(s). MDPI and/or the editor(s) disclaim responsibility for any injury to people or property resulting from any ideas, methods, instructions or products referred to in the content.

