Article

Characterizing CO2 Emission from Various PHEVs Under Charge-Depleting Conditions

by
Nan Yang
1,2,†,
Xuetong Lian
3,†,
Zhenxiao Bai
3,*,
Liangwu Rao
3,
Junxin Jiang
3,
Jiaqiang Li
2,
Jiguang Wang
4 and
Xin Wang
1,*
1
National Laboratory of Automotive Performance & Emission Test, School of Mechanical Engineering, Beijing Institute of Technology, Beijing 100081, China
2
School of Mechanics and Transportation, Southwest Forestry University, Kunming 650224, China
3
Guangzhou Automobile Group Co., Ltd., Guangzhou 510000, China
4
CATARC Automotive Test Center (Kunming) Co., Ltd., Kunming 651701, China
*
Authors to whom correspondence should be addressed.
These authors contributed equally to this work.
Atmosphere 2025, 16(8), 946; https://doi.org/10.3390/atmos16080946
Submission received: 7 July 2025 / Revised: 3 August 2025 / Accepted: 5 August 2025 / Published: 7 August 2025
(This article belongs to the Special Issue Traffic Related Emission (3rd Edition))

Abstract

With the significant growth in the number of PHEVs, conducting in-depth research on their CO2 emission characteristics is essential. This study used the Horiba OBS-ONE Portable Emission Measurement System (PEMS) to measure the CO2 emissions of three Plug-in Hybrid Electric Vehicle (PHEV) types: one Series Hybrid Electric Vehicle (S-HEV), one Parallel Hybrid Electric Vehicle (P-HEV), and one Series-Parallel Hybrid Electric Vehicle (SP-HEV), during real driving conditions. The findings show a correlation between acceleration and increased CO2 emissions for P-HEV, while acceleration has a relatively minor impact on S-HEV and SP-HEV emissions. Under urban driving conditions, the SP-HEV displays the lowest average CO2 emission rate. However, under suburban and highway conditions, the average CO2 emission rates follow the order S-HEV > SP-HEV > P-HEV. An analysis of CO2 emission factors across different road types and vehicle-specific power (VSP) ranges indicates that within low VSP intervals (VSP ≤ 0 for urban, VSP ≤ 5 for suburban, and VSP ≤ 15 for highway roads), the P-HEV exhibits the best CO2 emission control. As VSP increases, the P-HEV’s emission factors rise under all three road conditions, with its emission control capability weakening when VSP exceeds 5 in urban, 15 in suburban, and 20 on highway roads. For the SP-HEV, CO2 emission factors increase with VSP in urban and suburban areas but remain stable on highways. The S-HEV shows minimal changes in emission factors with varying VSP. This research provides valuable insights into the CO2 emission patterns of PHEVs, aiding vehicle optimization and policy development.

1. Introduction

As global concern over climate change continues to escalate and the urgent need to mitigate greenhouse gas emissions becomes increasingly apparent, the transportation sector, which accounts for over 20% of global CO2 emissions [1], is coming under intense scrutiny. As one of the major contributors to environmental pollution and energy consumption, the development and adoption of cleaner and more efficient vehicle technologies have become a top priority [2,3,4]. In this context, PHEVs have emerged as a promising solution [1,5], bridging the gap between traditional Internal Combustion Engine Vehicles (ICEVs) and Battery Electric Vehicles (EVs). In 2023, the sales of PHEVs in China reached 2.804 million units, representing a year-on-year increase of 84.7%. This data clearly demonstrates the market’s recognition of and rapidly growing demand for PHEVs.
Based on the architecture and driving mode of their power systems, PHEVs can be primarily categorized into three types: S-HEVs, P-HEVs, and SP-HEVs [6,7]. S-HEVs are mostly designed with the primary aim of enhancing the driving range of electric vehicles [8]. Consequently, in terms of structure and control, S-HEVs more closely resemble pure electric vehicles equipped with an additional fuel-based power generation system [9]. In this architecture, the engine does not directly drive the wheels; instead, it acts as a generator to charge the battery or directly supply power to the electric motor [4,10]. The vehicle is entirely driven by the electric motor, similar to a pure electric vehicle, but is equipped with an Internal Combustion Engine (ICE) capable of generating electricity. P-HEVs, on the other hand, differ in that their engines and electric motors can drive the wheels either independently or together [11,12], with power coupling achieved through mechanical connections (such as clutches and transmissions). This design allows P-HEVs to offer greater flexibility in terms of power performance [13]. SP-HEVs combine the advantages of both series and parallel configurations. In this architecture, the engine and electric motor can drive the wheels through mechanical connections, as well as power a generator to charge the battery or supply electricity to the electric motor [14,15]. This design enables SP-HEVs to achieve more efficient and flexible power distribution and energy utilization [15]. Given the significant differences in the power system architectures and driving modes of these three types of PHEVs, it is crucial to study and compare their CO2 emission characteristics. This will not only help us gain a deeper understanding of the environmental performance of various PHEVs but also provide robust data support for the future development of vehicle technologies and policy formulation.
In order to evaluate the CO2 emission levels of vehicles with greater precision, researchers have extensively employed the PEMS for conducting on-road tests. Multiple studies have been conducted on different types of vehicles, revealing the advantages and characteristics of hybrid vehicles in terms of emission reduction. He et al. [16] carried out a study in Macao, China, using PEMS to measure ten gasoline vehicles, four diesel vehicles, and six hybrid light-duty passenger vehicles (LDPVs). The results indicated that, when the engine was in a warm state, hybrid vehicles were expected to achieve approximately a 30% reduction in CO2 emissions compared to their corresponding conventional gasoline vehicles; O’Driscoll et al.’s research [17] further expanded the vehicle sample range. They employed PEMS to compare the CO2 emissions of 149 diesel vehicles, gasoline vehicles, and hybrid passenger vehicles that met Euro 5 and Euro 6 emission standards. The findings showed that, regardless of the type, hybrid vehicles outperformed gasoline and diesel vehicles in terms of CO2 emissions; Tansini et al.’s study [18] focused on PHEVs. They tested four PHEVs that met Euro 6 standards under both laboratory and real driving conditions to thoroughly examine their CO2 emissions and energy consumption. The experimental results revealed significant variations in the CO2 emissions of PHEVs in actual use, with emission values ranging from 0 times to 6 times the official type-approval CO2 values; Wu et al. [19] measured the gaseous pollutant emissions of two hybrid electric vehicles (Toyota Prius Gen II and Gen III, Toyota Motor Corporation, Toyota City, Japan) on actual roads in Macao using PEMS. They found that, compared to previous road test results of conventional gasoline and diesel vehicles, these two HEVs demonstrated significant advantages in reducing CO2 emissions and fuel consumption, particularly under low-speed traffic conditions, where this advantage was more pronounced; In Kunming, China, Yang et al. [20] conducted Real Driving Emission (RDE) tests on three hybrid vehicles using PEMS. The results indicated that for REEVs and PHEVs, engine speed was a key factor affecting their CO2 emissions, while for HEVs, VSP had a significant impact on their CO2 emissions. Moreover, with regard to fuel consumption, in scenarios where the battery charge levels of REEVs and PHEVs were depleted, their fuel consumption exhibited a tendency to surpass that of HEVs. Tan et al.’s research [21], from the perspective of test cycles, conducted the Worldwide Light-duty Driving Test Cycle (WLTC), the China Light-duty Vehicle Test Cycle (CLTC-P), and RDE tests on eight conventional fuel vehicles and two PHEVs. The study found that the reference CO2 emission factors for conventional vehicles and PHEVs were 9.59–27.36% and 32.30–45.01% higher, respectively, than the actual tested CO2 emissions. This finding suggests that setting CO2 emission limits based on the methods in fuel consumption regulations cannot effectively reduce CO2 emissions, especially for PHEVs, where this issue is more prominent.
In conclusion, a large number of studies have confirmed that hybrid vehicles offer significant advantages in reducing CO2 emissions. However, there are still obvious research gaps in the relevant literature. Specifically, the emission characteristics vary considerably among different types of hybrid vehicles, yet in-depth comparative analyses of their CO2 emissions are relatively scarce at present. This study has two main objectives. Firstly, we will conduct RDE tests in Kunming using PEMS. Leveraging these tests, we are capable of precisely quantifying and contrasting the disparities in CO2 emissions among three distinct categories of hybrid vehicles under a variety of road conditions and speed intervals, thus addressing the prevailing research lacunae in this domain. Secondly, an exhaustive evaluation will be carried out regarding the combined influence of driving traits on the CO2 emissions of hybrid vehicles. Through scrutinizing the way in which elements like speed and acceleration interact with vehicle performance to affect CO2 emissions, our objective is to acquire a more nuanced comprehension of the emission mechanism. In practical applications, the results of this study can provide valuable references. For example, when forming vehicle fleets under different operating conditions, policymakers and fleet managers can make more informed decisions based on our detailed analysis of the CO2 emissions of various hybrid vehicles in different driving scenarios, thus optimizing the environmental performance of the fleets.

2. Materials and Methods

2.1. Test Equipment

During the RDE testing process, as shown in Figure 1, the Horiba OBS-ONE PEMS was employed, consisting primarily of three modules: the gas unit, the PN unit, and the central control unit. Firstly, the gas unit utilizes Non-Dispersive Infrared (NDIR) technology to measure emissions of CO, CO2, and NOX in exhaust gases [22,23]. Secondly, the PN unit employs Condensation Particle Counter (CPC) methodology to record the concentration of solid PN within specified particle size ranges [24,25]. Concurrently, the OBS-ONE PEMS incorporates a built-in Global Positioning System (GPS) that captures real-time vehicle speed, longitude, latitude, and altitude information, comprehensively documenting driving conditions [26,27,28]. Additionally, the system is equipped with a meteorological station that monitors and records crucial environmental parameters during testing, such as humidity, ambient temperature, and barometric pressure [29,30]. All devices are powered by a 24 V battery, and the output frequency of all analyzers is set to 1 Hz. The system is installed within the trunk of the test vehicle, directly sampling raw exhaust gases from the exhaust pipe. Prior to and after each test, a comprehensive calibration process, including leak checks, zero calibrations, and span calibrations, is rigorously executed to ensure the accuracy and reliability of test results. During testing, the Kvaser Leaf Light HS V2 (Kvaser AB, Eskilstuna, Sweden) plays a pivotal role. One end of the device connects to the PEMS, capturing key data output from the vehicle’s ECU in real-time, while the other end interfaces seamlessly with a computer via USB, ensuring that all captured data is transmitted to dedicated analysis software at high speed and with precision [31]. Capable of processing up to 8000 messages per second and featuring a timestamp accuracy of 100 µs, this device fully guarantees the real-time nature and accuracy of the data, underpinning subsequent data analysis and research efforts [20].
Compared with laboratory equipment, PEMS exhibits greater uncertainty. To enhance the value of RDE equipment, it is necessary to conduct verification on PEMS, which includes PEMS laboratory comparison verification and uncertainty assessment. The PEMS laboratory comparison (Validation Test) involves conducting WLTC (Worldwide Harmonized Light Vehicles Test Cycle) comparisons with laboratory sampling and analysis equipment on a chassis dynamometer. It is also known as the “PEMS validity check” to ensure that the device status and installation are correct during RDE testing. Cao Lei [32] from Jilin University used six sets of PEMS equipment (three sets of HORIBA OBS ONE, two sets of AVL MOVE, and one set of SENSORS) to carry out 12 comparison tests. After each installation, verification could be conducted before and after the tests, with the installation remaining unchanged during this period. The comparisons revealed differences among devices of different models as well as those of the same model, with a non-compliance rate of up to 25%. Simply conducting drift checks before and after the tests and ensuring that the device has no faults cannot guarantee measurement accuracy. Although not mandated by standards, it is necessary to conduct comparisons before and after RDE tests from the perspective of improving RDE test quality. In addition, 14 zero-drift verification tests were conducted using three sets of PEMS equipment in six test cities. The vehicles were driven according to RDE requirements, with intermittent zero-gas injection and recording. The results showed that the zero drift of the analyzer exhibited no obvious trend and remained within the standard range (e.g., 5 ppm for NOX). Finally, laboratory WLTC data was used to evaluate the deviation caused by PEMS zero drift and its uncertainty regarding emission results.

2.2. Test Vehicles

This study selected three PHEVs compliant with the China VI emission standard as test subjects: one S-HEV, one SP-HEV, and one P-HEV, aiming to delve into the specific impacts of different hybrid drive connection methods on CO2 emissions. Detailed information about all test vehicles has been thoroughly listed in Table 1. Prior to the experiments, the odometer readings of all vehicles were uniformly adjusted to approximately 10,000 km, eliminating potential interference from differences in vehicle usage. Before each test, the batteries of the three PHEVs were discharged to their respective minimum state-of-charge (SOC) thresholds specified by their manufacturers. To standardize the SOC thresholds across models, we first collected the minimum SOC values recommended by each manufacturer. For the S-HEV, the minimum SOC was set at 15% as per the manufacturer’s guidelines; for the SP-HEV, it was 12%; and for the P-HEV, it was 18%. The vehicles then enter a charge-sustaining mode, enabling an assessment of the CO2 emission performance of different PHEVs during actual road driving under battery-depleted conditions. All tests were initiated under cold start conditions, and the “Normal Mode” was chosen as the initial test setting because its performance and emission characteristics are considered the most representative of vehicles’ actual conditions during daily road driving. During the testing process, the load conditions were limited to one driver and one test data recorder. On 20 May 2024, these three RDE tests were carried out by an identical driver, thereby guaranteeing a significant level of uniformity in the testing procedure and data comparability.

2.3. Test Route

The test route for this study is located in Kunming City, Yunnan Province, China. Kunming serves not only as a pivotal junction for the China-ASEAN Free Trade Area, the Lancang-Mekong Cooperation Region, and the Pan-Pearl River Delta Economic Zone, but also as an important gateway connecting South Asia, Southeast Asia, and even the Middle East, Southern Europe, and Africa. As illustrated in Figure 2, the test route commences at the Kunming Test Center of the China Automotive Technology and Research Center, situated at an altitude of 1920 m, and concludes at the Xiaoxin Street Expressway Toll Station, where the altitude slightly decreases to 1900 m, spanning a total distance of 81 km. This diverse test route is designed to comprehensively evaluate the CO2 emission performance of PHEVs under varying driving conditions. To ensure the accuracy and reliability of test results, this study deliberately conducted RDE tests during off-peak hours on weekdays. During this period, road traffic flow is relatively low, effectively mitigating potential biases in test outcomes caused by external factors such as traffic congestion, frequent acceleration, and braking. This approach enables a more precise capture and recording of the carbon emission characteristics of different PHEVs under conditions that are closer to real driving scenarios.

2.4. Data Processing

By analyzing and handling the experimental data obtained via the PEMS and the Kvaser Leaf Light HS V2 device, we can accurately calculate the instantaneous mass emissions of pollutants [33], emission factors [34], and VSP [35]. These calculations are all carried out based on the following formulas:
m g a s , i =   ρ g a s , i ρ g a s , e   × c g a s , i   × q m e w , i   × 10 3
where m g a s , i is the mass of the gaseous pollutant component (g/s); ρ g a s , i is the density of the gaseous pollutant component (kg/m3); ρ g a s , e is the density of the exhaust gas (kg/m3); c g a s , i is the measured concentration of the gaseous pollutant component in the exhaust gas (ppm); q m e w , i   is the measured mass flow rate of the exhaust gas (kg/s); gas is the corresponding pollutant; and i is the number of seconds from 0 to the end of the RDE test (1 Hz).
E F i , j   = m i , j   · t s i , j                              
where t is the sample time, equal to 1 s, and m is the instantaneous CO2 emission (in g/s) produced during distance s (in km). The emission factors were compared with the average exhaust gas temperatures to explain the aftertreatment performance.
V S P = V 1.1 a + 9.8 r + 0.132 + 0.000302 V 3
where V is the motor vehicle driving speed, m/s; a is the motor vehicle driving instantaneous acceleration, m/s2; r is the slope (dimensionless); due to the GPS acquisition data does not include the hill, with the driving process every second longitude, latitude, and altitude joint run on the slope quantification.

3. Results

3.1. Test Cycles

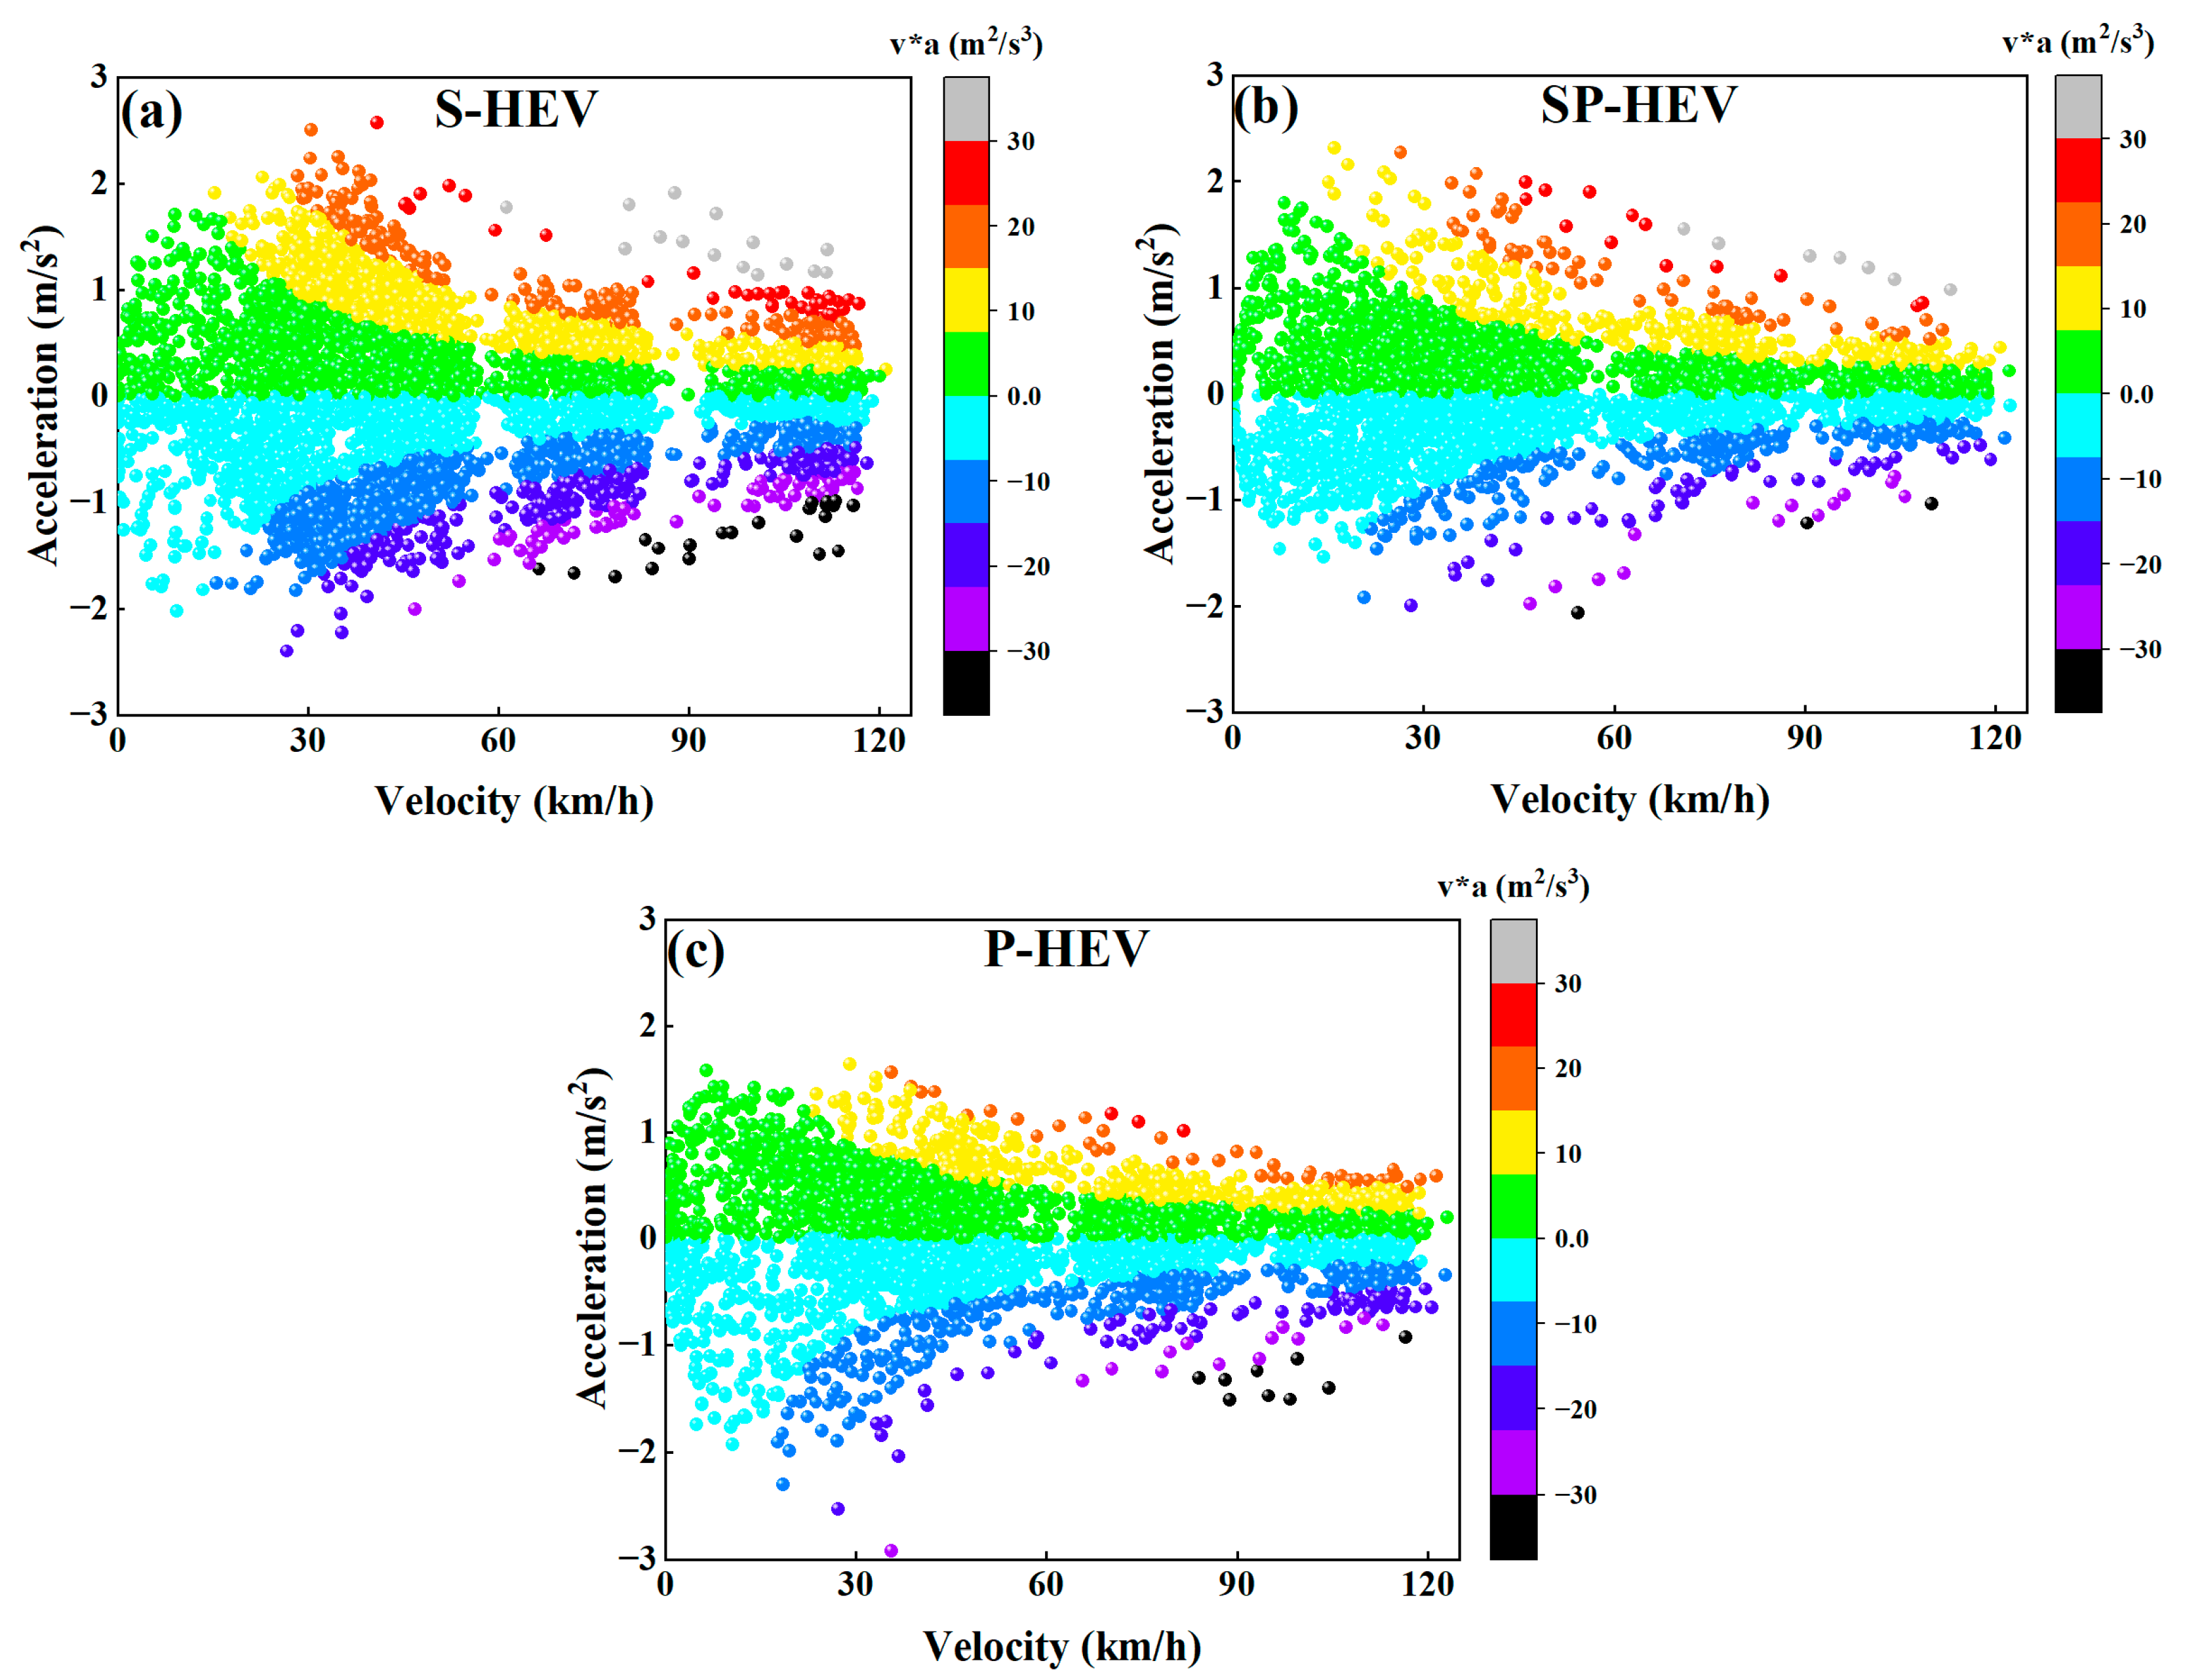
Figure 3 illustrates the specific distribution of acceleration across three RDE tests. By examining the scatter plots for the three typical driving scenarios covered in the RDE tests—urban roads, suburban roads, and highways—it is visually evident that the distribution patterns of speed and acceleration in each scenario exhibit distinct characteristics and clear boundaries. Moreover, the speed ranges in all scenarios are strictly regulated within the thresholds set by RDE regulations.
In urban driving environments, due to the intricate road networks and the dense arrangement of traffic signals, vehicles experience significant fluctuations in acceleration. On the other hand, suburban areas, connecting cities and highways, have better roads and not as much traffic. Consequently, when driving in suburban areas, the extent of acceleration fluctuations in vehicles is comparatively limited. As for highways, given their lower traffic volume and relatively stable traffic conditions, vehicles can typically maintain a more consistent speed range.

3.2. The Variation of CO2 Emissions on Different Road Types

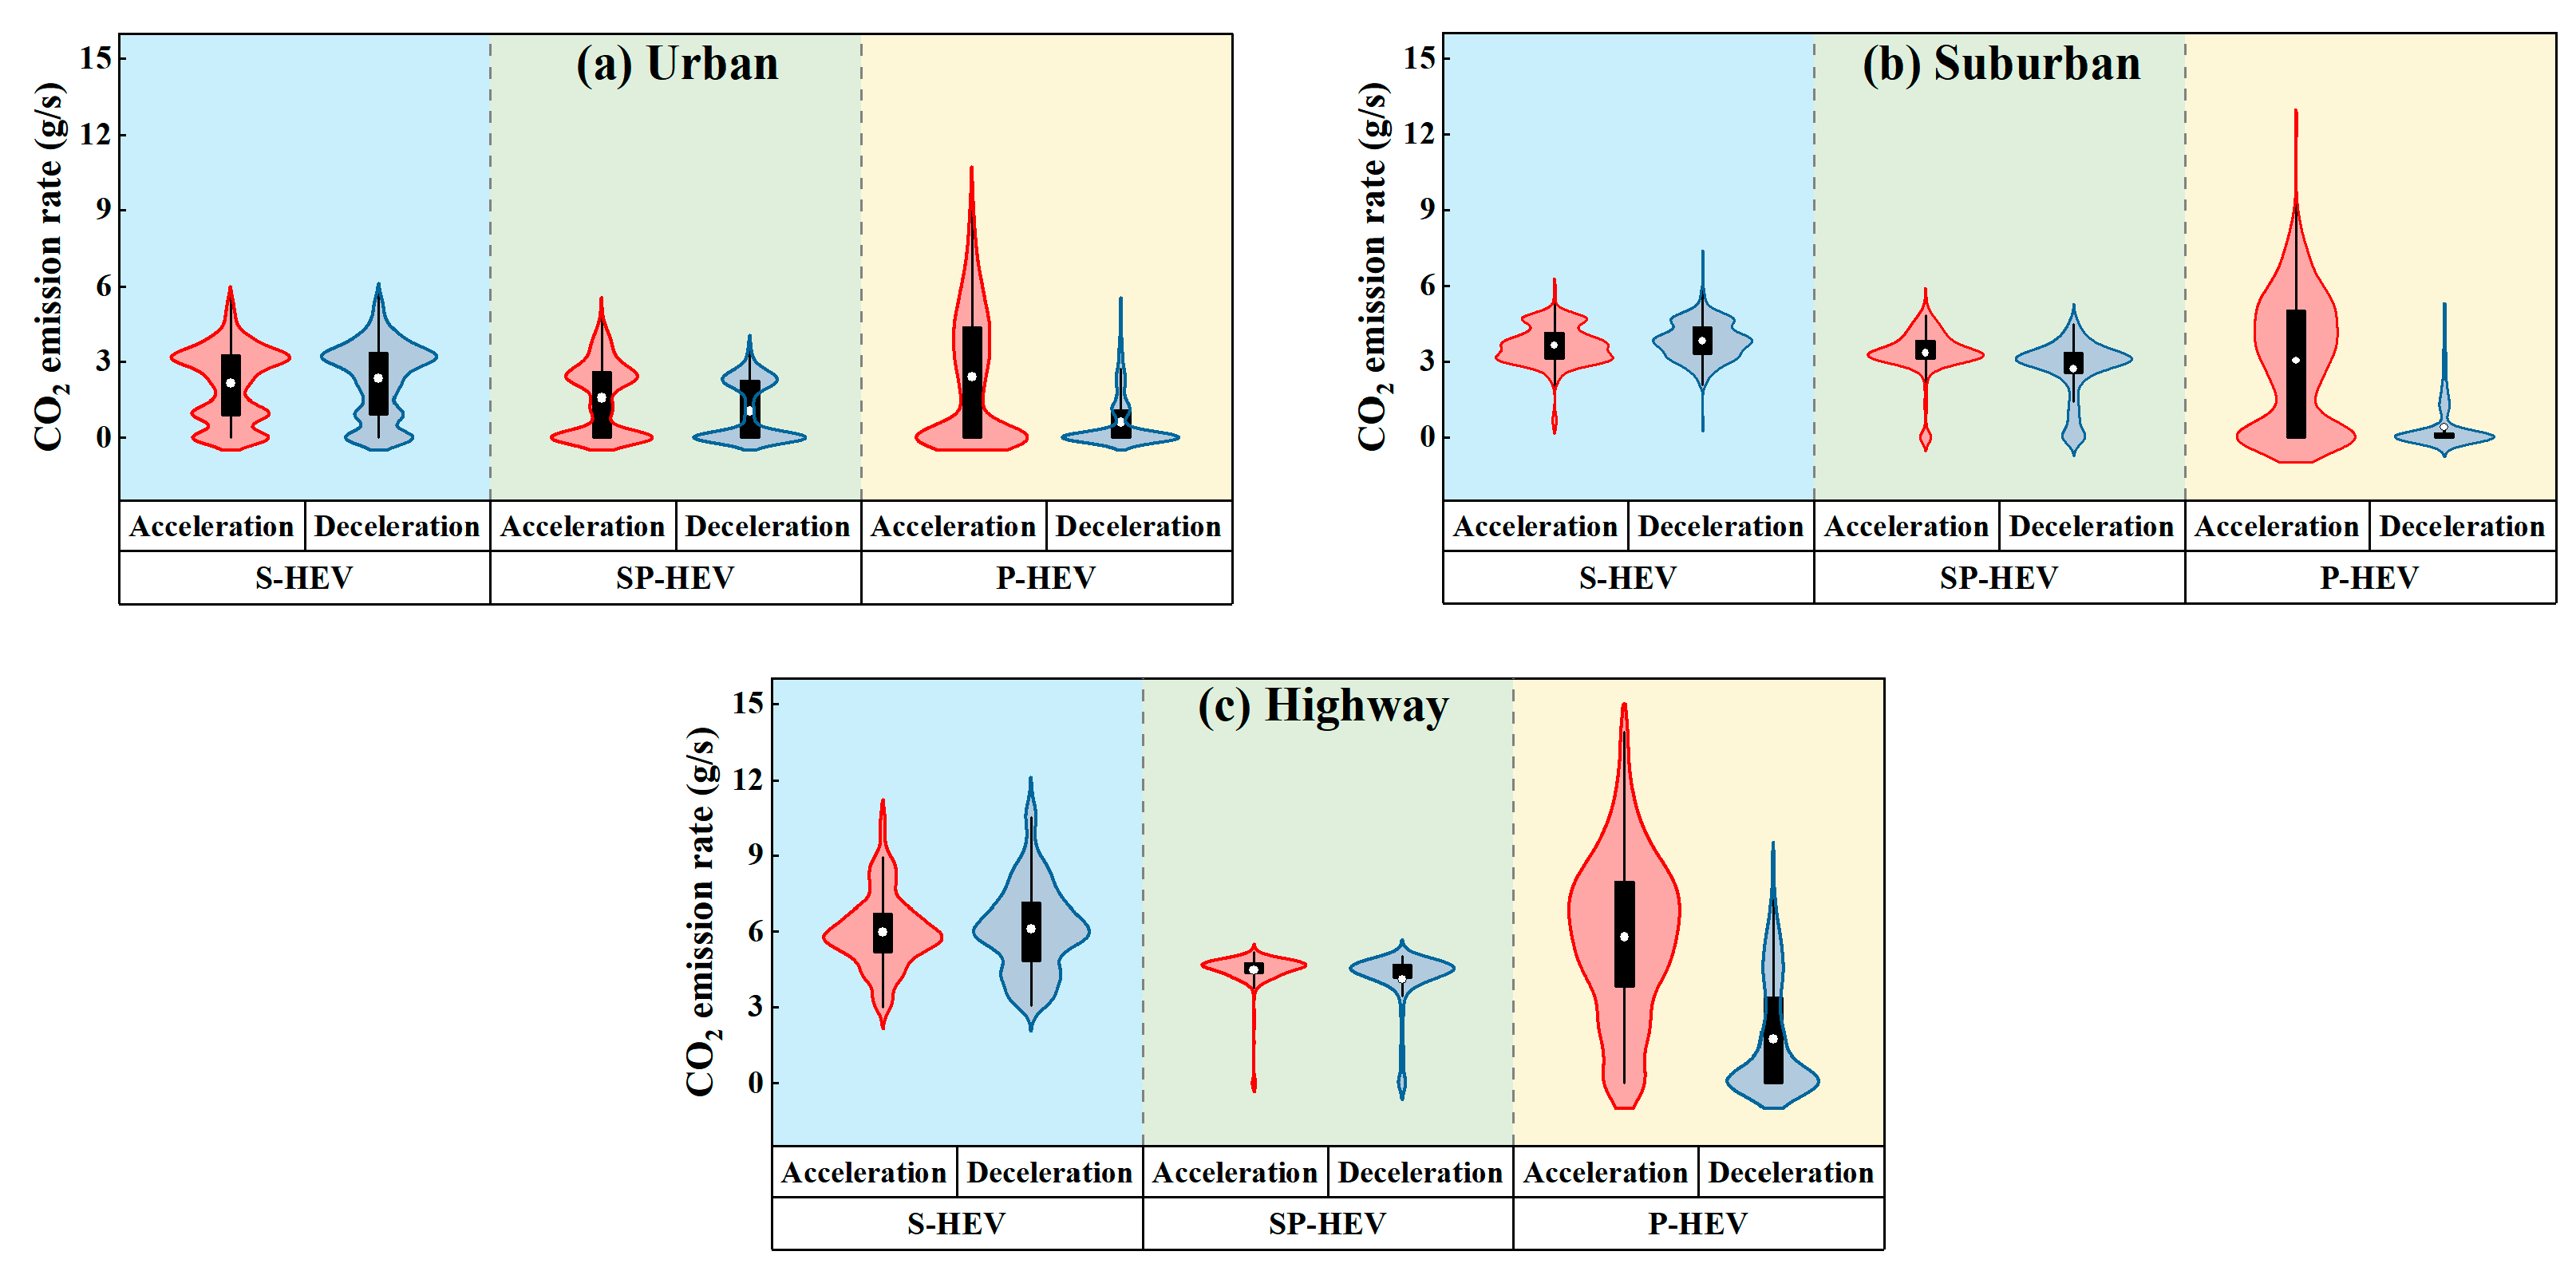
After testing the exhaust emissions generated by three types of hybrid vehicles during acceleration and deceleration on different road types, it was found that there is a correlation between acceleration and the increase in CO2 emission levels of P-HEV. However, acceleration has little impact on the CO2 emissions of S-HEV and SP-HEV. As the State of Charge (SOC) of the vehicle’s battery is already close to its minimum limit at the initial state, the engine will quickly kick in when driving in urban areas. As shown in Figure 4, during the acceleration process, P-HEV emits significantly more CO2 compared to the deceleration operation mode. This is because in the P-HEV, the engine and the motor can drive the vehicle simultaneously or independently. During acceleration, the engine often needs to output greater power to meet the vehicle’s power demand, which leads to an increase in fuel combustion and may also result in more incomplete combustion, thereby causing a significant rise in CO2 emissions [36,37,38]. In contrast, in the S-HEV, the engine mainly serves as a generator to supply power to the motor and does not directly participate in driving. Its operating state is relatively independent of the vehicle’s acceleration and deceleration processes [39,40], resulting in a small influence of acceleration on CO2 emissions. Although the SP-HEV can flexibly switch between driving modes, the engine does not always directly drive the vehicle, and its power distribution strategy aims to optimize fuel economy [41,42,43,44]. Therefore, the impact of acceleration on its CO2 emissions is not as pronounced as that on P-HEV.
Figure 5 presents a visual depiction of the CO2 emission rates exhibited by three vehicle types across varying road conditions. In urban driving conditions (Figure 5a), the SP-HEV has the lowest average CO2 emission rate, which is 20.94% lower than that of the P-HEV and 80.69% lower than that of the S-HEV. This is because the SP-HEV combines the advantages of both series and parallel hybrid systems, enabling it to flexibly switch between driving modes according to the vehicle’s driving state and power demand. In urban driving, where vehicles frequently start, stop, accelerate, and decelerate, the SP-HEV can optimize the collaborative operation of the engine and the motor, allowing the engine to operate more frequently in its efficient range, reducing unnecessary fuel consumption and incomplete combustion, and thus significantly lowering CO2 emissions. Although the P-HEV can also achieve collaborative driving of the engine and the motor, under complex urban driving conditions, its engine may not always be able to maintain the optimal operating state, resulting in relatively higher CO2 emissions. The engine of the S-HEV is mainly used as a generator. In urban driving, due to the large variations in the vehicle’s power demand, the engine needs to frequently start, stop, or adjust its output power, which also affects its fuel economy and CO2 emission performance.
Under suburban and highway driving conditions (Figure 5b,c), the average CO2 emission rates of the three types of vehicles exhibit the following pattern: S-HEV > SP-HEV > P-HEV. Specifically, the CO2 emission rate of the S-HEV is 22.77–40.96% higher than that of the SP-HEV and 49.14–86.75% higher than that of the P-HEV. This is because under suburban and highway driving conditions, vehicles need to continuously and steadily output high power. The engine of the S-HEV is only used for generating electricity, and the energy undergoes two conversion processes, resulting in significant losses. Moreover, at high speeds, the engine struggles to operate efficiently, leading to high CO2 emissions. The SP-HEV can flexibly switch between driving modes, with the engine directly driving the vehicle at certain times, reducing energy conversion and improving efficiency, resulting in relatively lower CO2 emissions. The engine of the P-HEV can directly drive the vehicle, with a shorter power transmission path and smaller losses. It is also better adapted to highway driving conditions, allowing the engine to operate more efficiently, with good fuel economy and the lowest CO2 emissions among the three types of vehicles.

3.3. Investigating the Impact of Driving Characteristics on CO2 Emission Rates

3.3.1. Examining the Impact of VSP on CO2 Emission Rates

Figure 6 illustrates the CO2 emission rates across different VSP intervals under three road types. The VSP values are mainly concentrated within the interval of −20 kW/t to 30 kW/t. Regarding the three vehicles, for S-HEV, the change in CO2 emission rate with increasing VSP is relatively small across all three road types. For SP-HEV, the CO2 emission rate rises with increasing VSP under urban driving conditions but shows little variation with increasing VSP under suburban and highway driving conditions. For P-HEV, VSP has a significant impact on its CO2 emission rate across all three road types, with the CO2 emission rate increasing as VSP rises. Therefore, it is recommended that drivers avoid aggressive driving behaviors such as rapid acceleration or sudden starts during actual road driving. By reducing the occurrence of high-VSP operating conditions, drivers can make a significant contribution to reducing CO2 emissions and ultimately improving urban air quality.

3.3.2. Evaluating the Effect of Speed and Acceleration on CO2 Emission Rates

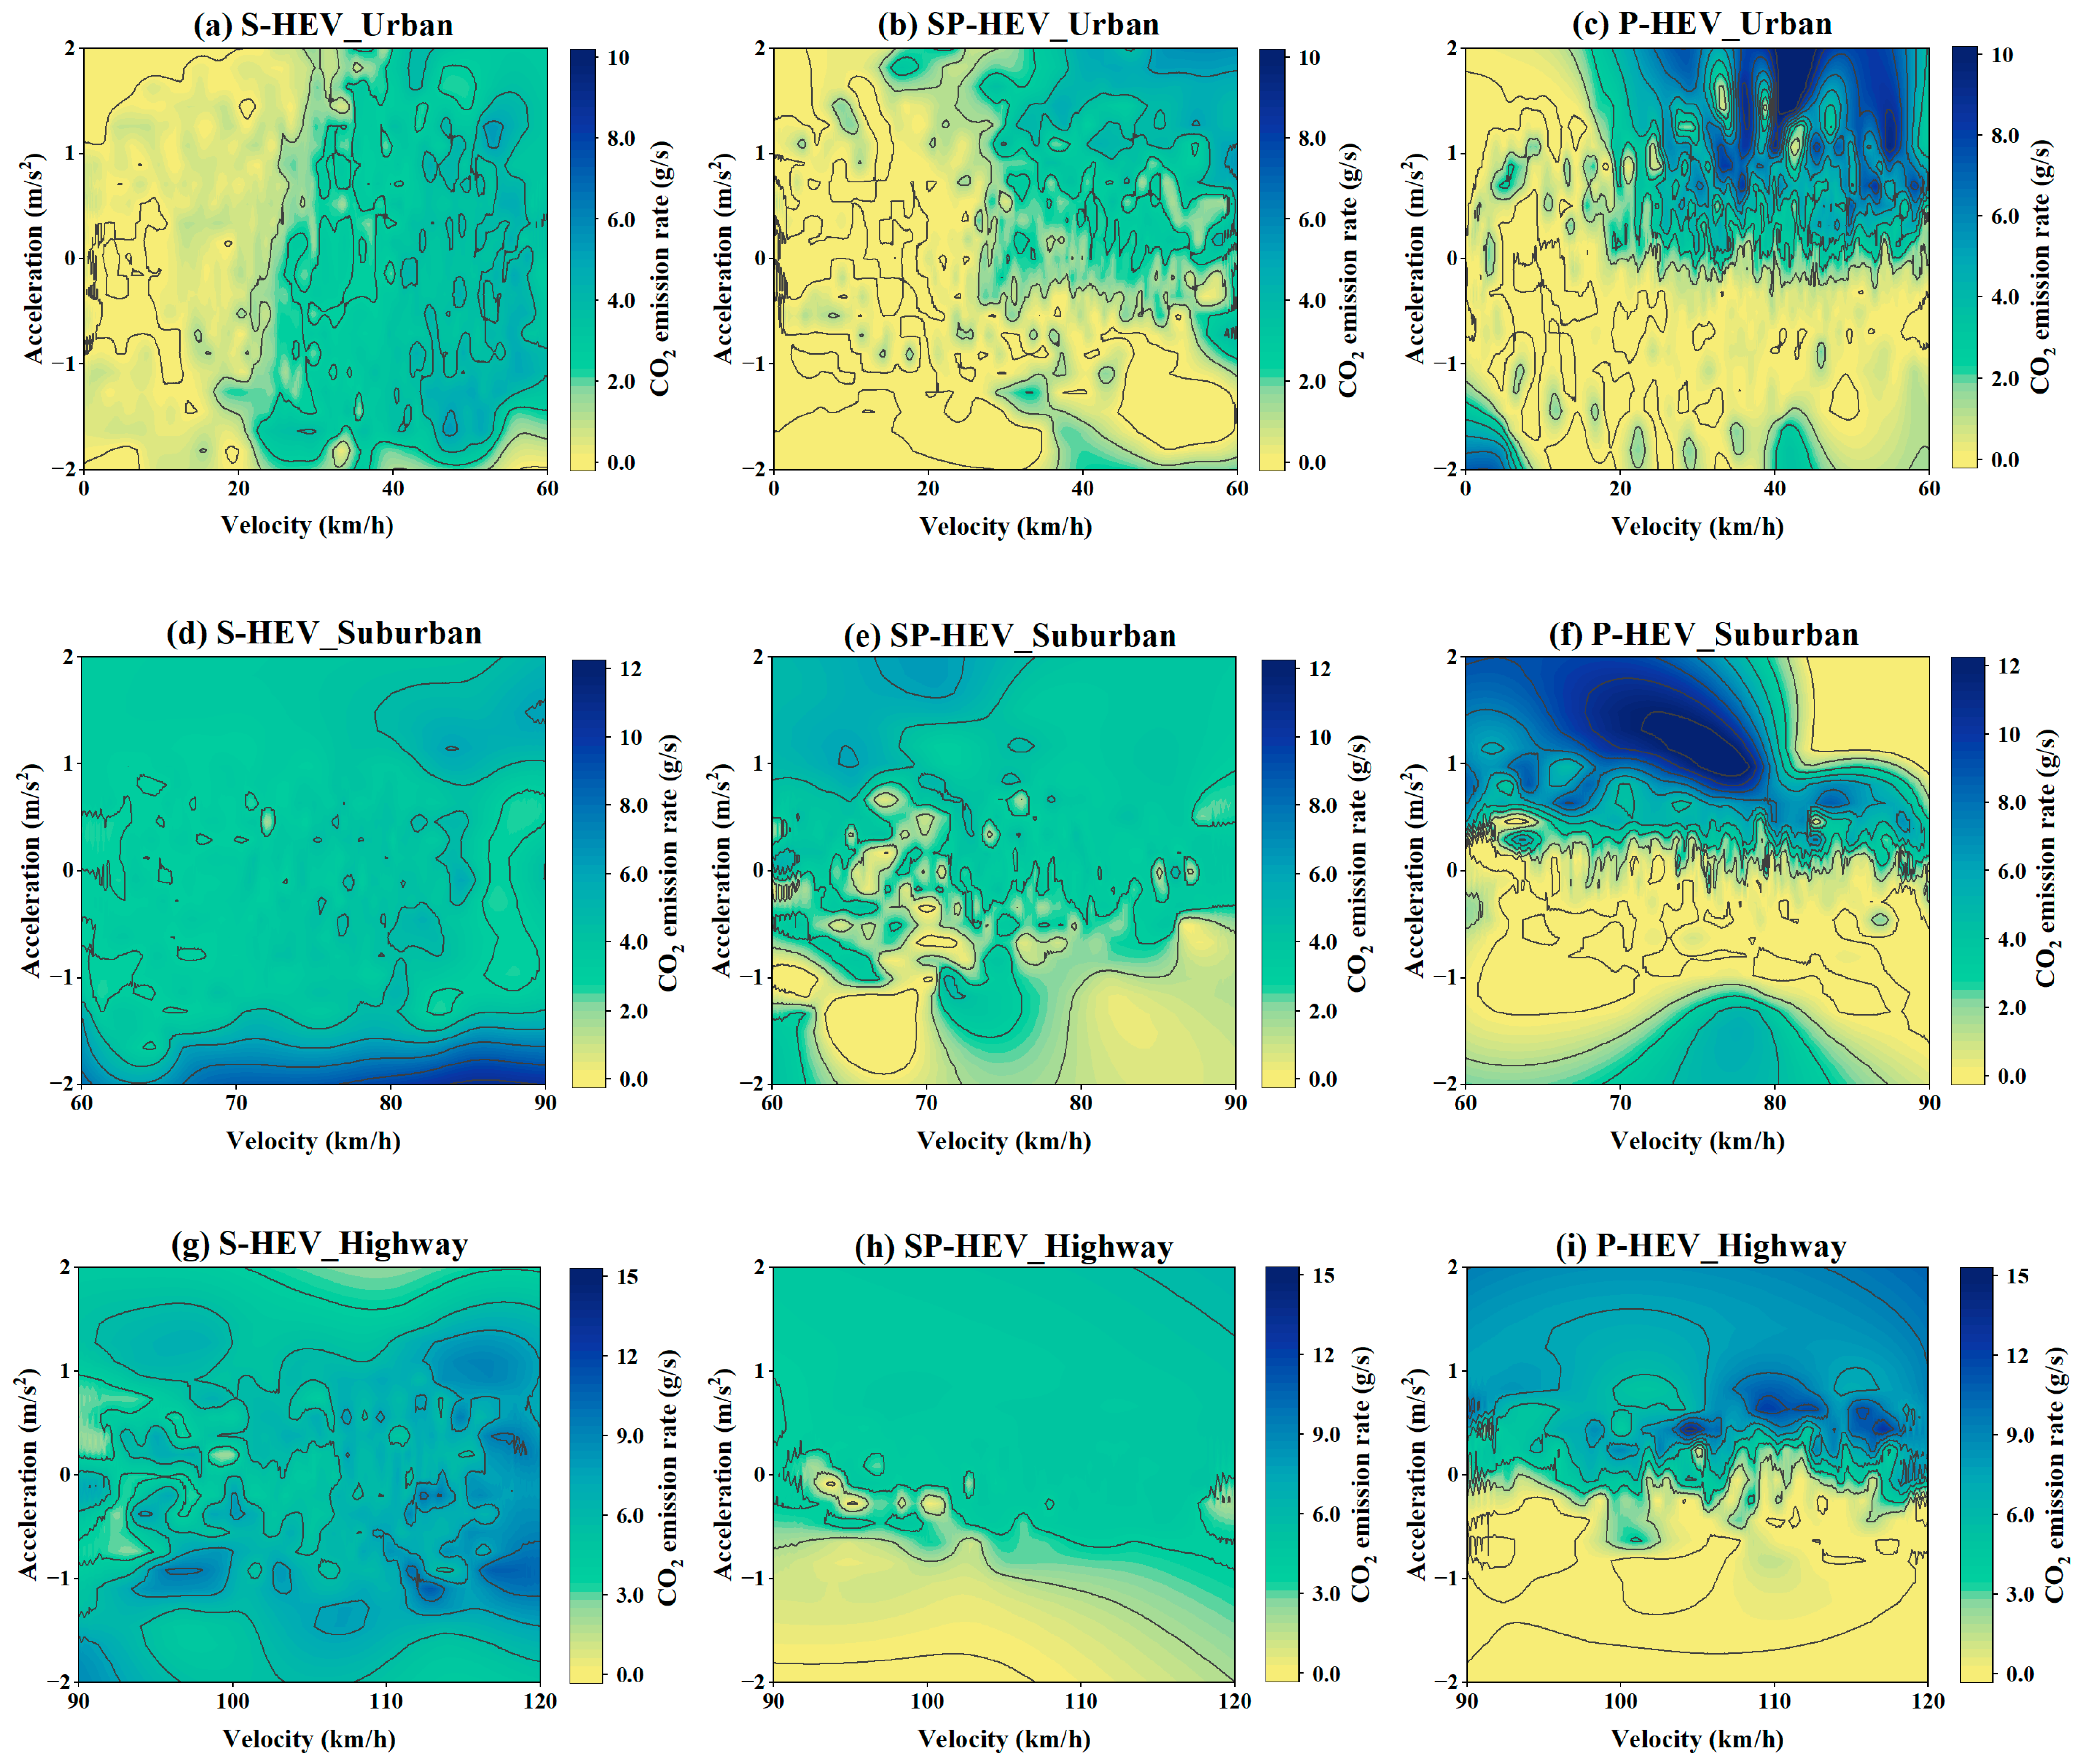
To thoroughly investigate the correlations among vehicle speed, acceleration, and CO2 emission rate, we conducted a comprehensive study, with the specific analysis results shown in Figure 7. Under urban road conditions, for S-HEV, when the vehicle speed is within the low-speed range of less than 20 km/h, the vehicle can make relatively full use of the electric drive system. As a result, the ICE does not need to start frequently or operate at a low load, and the CO2 emission rate is almost negligible. However, when the vehicle speed exceeds 20 km/h and the acceleration remains constant, as the vehicle speed gradually increases, the demand for power from the vehicle rises. Consequently, the ICE needs to output more power, leading to a significant increase in the CO2 emission rate. For SP-HEV and P-HEV, when the vehicle speed is less than 20 km/h, their CO2 emission rates are also almost zero. This indicates that during the low-speed driving phase, these two types of hybrid vehicles can better leverage the advantages of the electric drive system and reduce their reliance on the ICE. Nevertheless, when the vehicle speed exceeds 20 km/h, as both the vehicle speed and acceleration increase, the vehicle’s energy demand rises sharply, and the load on the ICE increases. As a result, the CO2 emission rate reaches a peak value. Under suburban road conditions, the CO2 emission rate of S-HEV models remains relatively stable, demonstrating a consistent emission characteristic. SP-HEV exhibits a lower CO2 emission rate when the deceleration is greater than 0.5 m/s2, indicating that they have good emission control performance during the deceleration process. P-HEVs show a lower CO2 emission rate when the acceleration is less than 0.3 m/s2 and during deceleration, demonstrating their low-emission advantages under conditions of low acceleration and deceleration. Under highway road conditions, the CO2 emission rate of S-HEVs remains relatively stable. SP-HEVs have a lower CO2 emission rate when the deceleration is greater than 0.8 m/s2, showing that they can effectively control emissions even during high-speed deceleration. P-HEVs maintain a lower CO2 emission rate during deceleration, further verifying their low-emission characteristics in the deceleration state.

3.4. Quantifying CO2 Emission Factors Based on Distance for Different PHEVS

3.4.1. Assessment of Emission Factors on Various Road Types

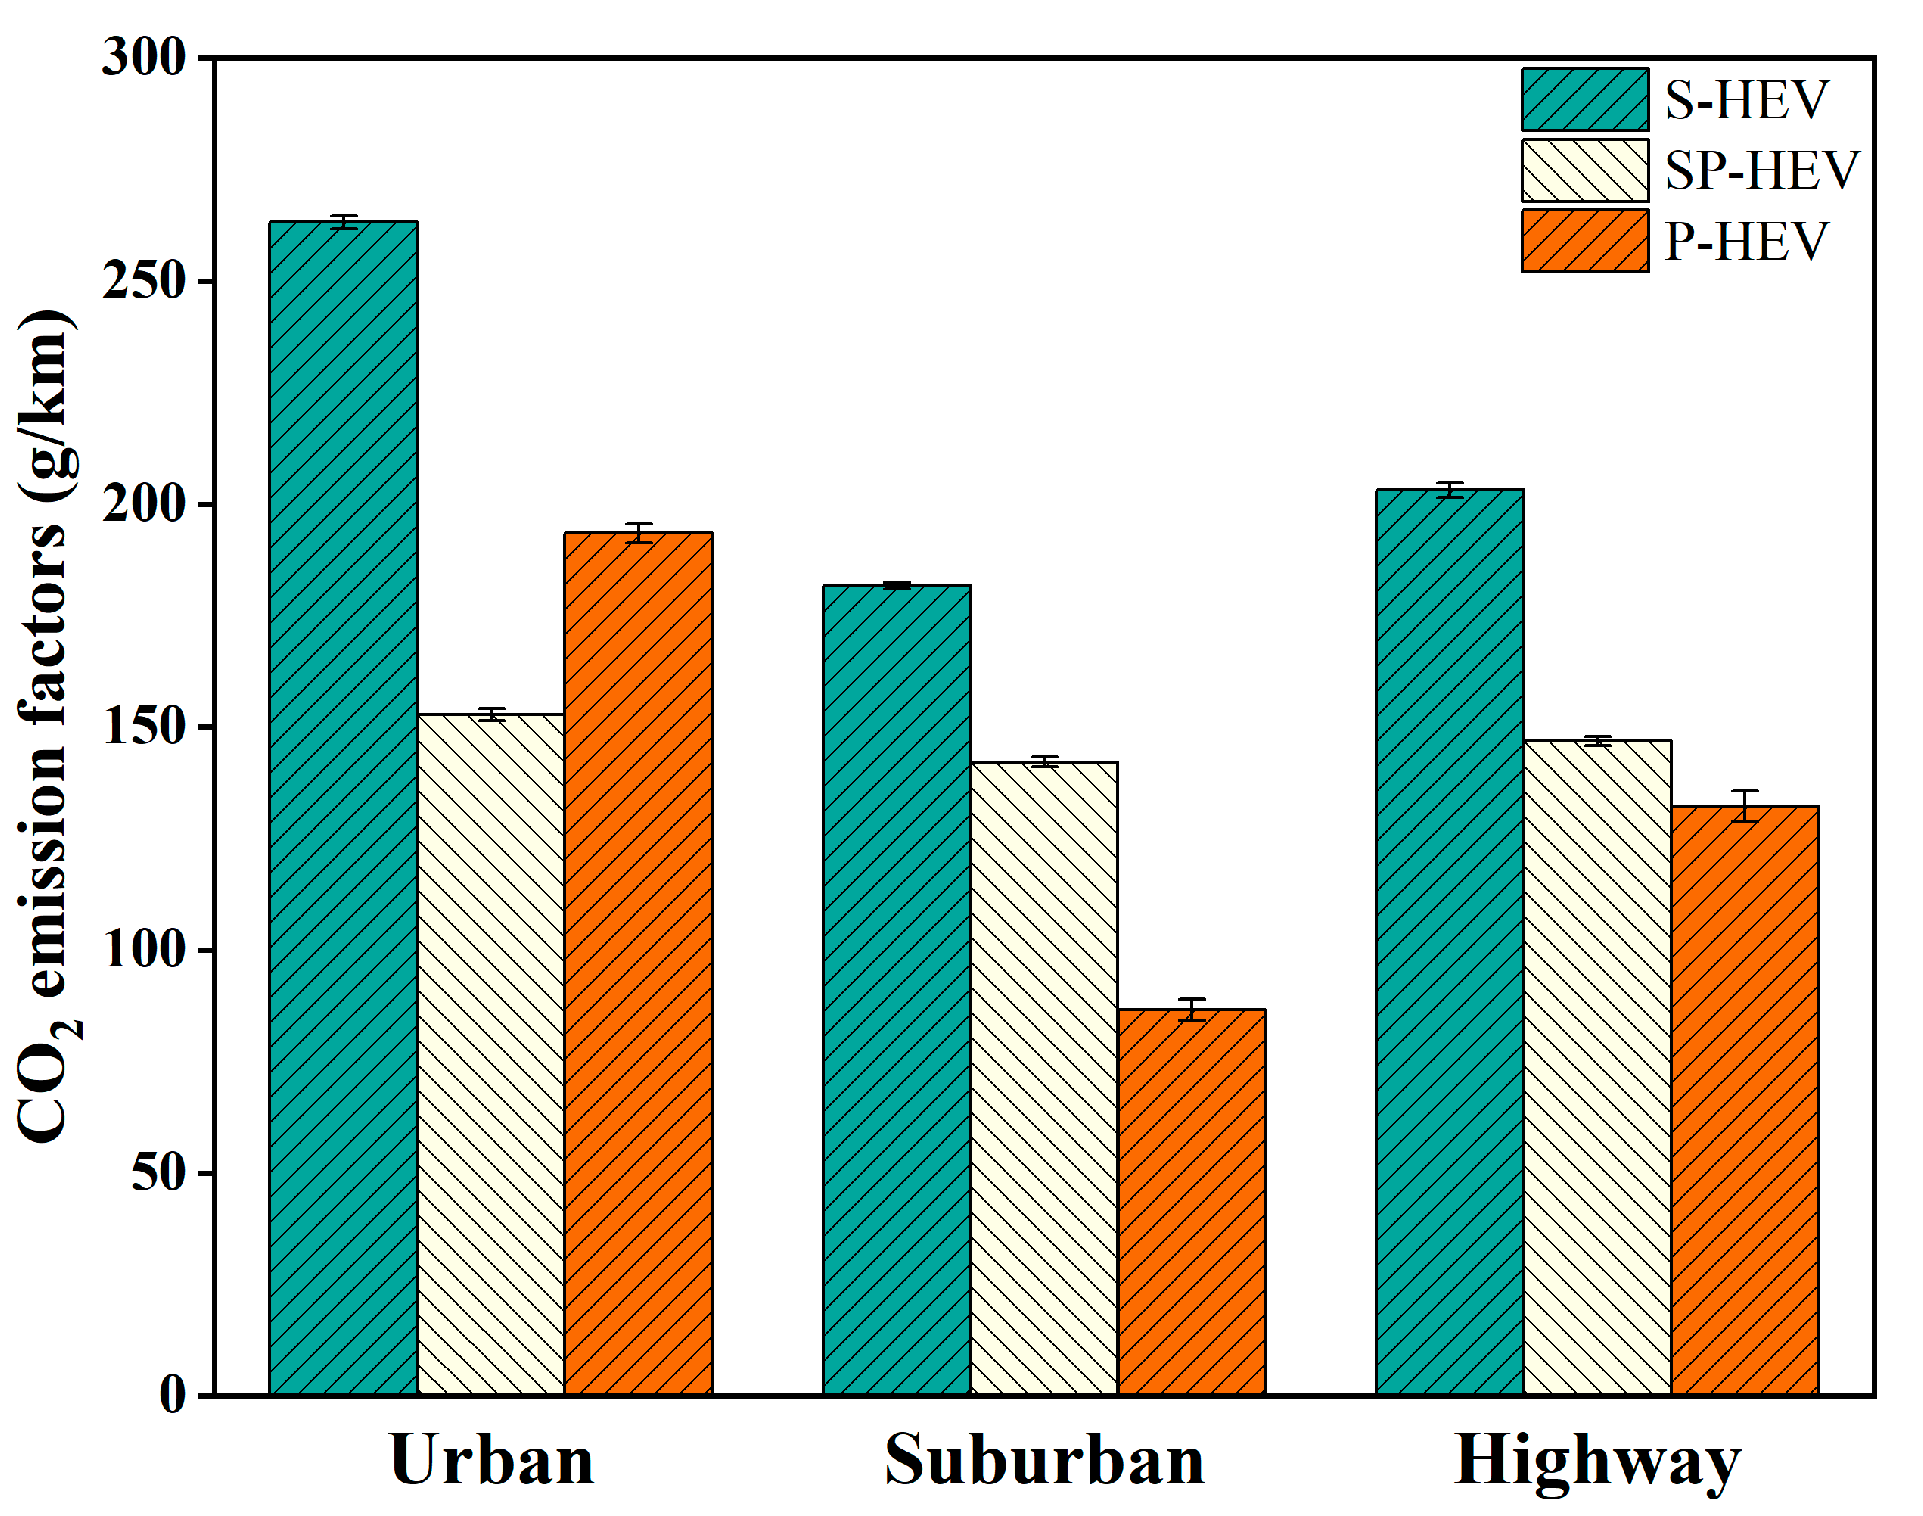
Figure 8 illustrates the CO2 emissions measured by the PEMS for three types of PHEVs under different road types. The height of the bars in the figure represents the emission factors. It can be observed from Figure 8 that the road type has a significant impact on CO2 emissions. Compared to urban driving conditions, the CO2 emissions of these three types of PHEVs decreased by 6.97% to 55.27% when driving on suburban roads and by 3.90% to 31.64% when driving on highways. The CO2 emissions of these three vehicles under different road types exhibit a certain regularity. Specifically, the CO2 emissions are the highest on urban roads, followed by highways, while suburban roads have relatively lower emissions. This difference mainly stems from the unique traffic conditions in urban areas. In urban environments, traffic congestion and frequent traffic lights require vehicles to start, stop, accelerate, and decelerate frequently, thereby increasing energy consumption. Under these specific driving circumstances, the constant toggling between the ICE and the electric motor in hybrid cars undermines the effectiveness of the energy transformation process, which eventually causes a rise in CO2 discharges. Moreover, it is important to point out that prior to the test, the battery capacities of the three hybrid vehicles had all been depleted to the lowest level specified by the manufacturers. This pre-test preparation meant that the vehicles depended more heavily on the ICE for power at the start of the test. Owing to the low battery charge, the hybrid system had no choice but to rely more on the ICE, leading to an uptick in CO2 emissions during this initial phase. However, as the test went on and the battery charge slowly started to replenish, the energy-saving benefits of the hybrid system became increasingly evident. The coordinated work between the ICE and the electric motor grew more efficient, contributing to a decrease in CO2 emissions.
In Figure 8, a comparative analysis is conducted on the CO2 emission factors of three hybrid vehicles under different road conditions. The results indicate that, compared with S-HEV, the CO2 emission factors of SP-HEVs and P-HEVs are reduced by 41.96% and 26.54%, respectively. This is because in urban driving conditions where vehicles travel at low speeds and experience frequent starts and stops, S-HEV’s engine does not directly drive the vehicle; instead, it generates electricity first, which is then converted into mechanical energy by the electric motor to drive the vehicle. This process involves multiple energy conversions, resulting in significant energy losses and high CO2 emissions. In contrast, the SP-HEV has a flexible power distribution system that enables it to efficiently utilize the electric motor for driving, reducing the involvement of the engine. It can also precisely control the output power of the engine and the electric motor according to actual demands, allowing the engine to operate in its most efficient range as much as possible, thereby reducing CO2 emissions. P-HEV’s engine and electric motor are mainly connected mechanically, with relatively poor flexibility in power distribution. Under low-speed and frequent start-stop conditions, the engine struggles to maintain an efficient operating state, leading to incomplete fuel combustion and relatively high CO2 emissions. Under suburban and highway driving conditions, the CO2 emissions of the three hybrid electric vehicles follow the pattern of S-HEV > SP-HEV > P-HEV. The emission factors of SP-HEVs are 21.80–27.71% lower than those of S-HEVs, while the emission factors of P-HEVs are 34.90–52.39% lower than those of S-HEVs. This is because although S-HEV operates in the efficient range of the ICE under medium- to high-speed conditions, the efficiency of its electric motor significantly deteriorates, and there are two unnecessary energy conversions, resulting in the overall efficiency of electric drive being inferior to that of direct ICE drive. This is the fundamental reason for S-HEV’s poor fuel economy under high-speed conditions. In suburban and highway driving scenarios, vehicles require high power output to maintain high speeds. Although SP-HEVs can achieve collaborative operation between the ICE and the electric motor, due to low battery charge, the ICE has to take on more power generation tasks, which may cause it to deviate from the efficient operating range, increasing fuel consumption and CO2 emissions. In contrast, under high-speed conditions, the engine of a P-HEV can directly drive the vehicle through the mechanical transmission system, reducing energy conversion losses between the battery and the motor. When additional power is needed, the electric motor can quickly intervene to provide assistance, enabling the engine to run as efficiently as possible. Moreover, the parallel hybrid system has a relatively simple structure, and its energy transfer efficiency is higher during high-speed, stable driving, further reducing CO2 emissions.

3.4.2. Evaluation of CO2 Emission Factors in Different VSP Intervals

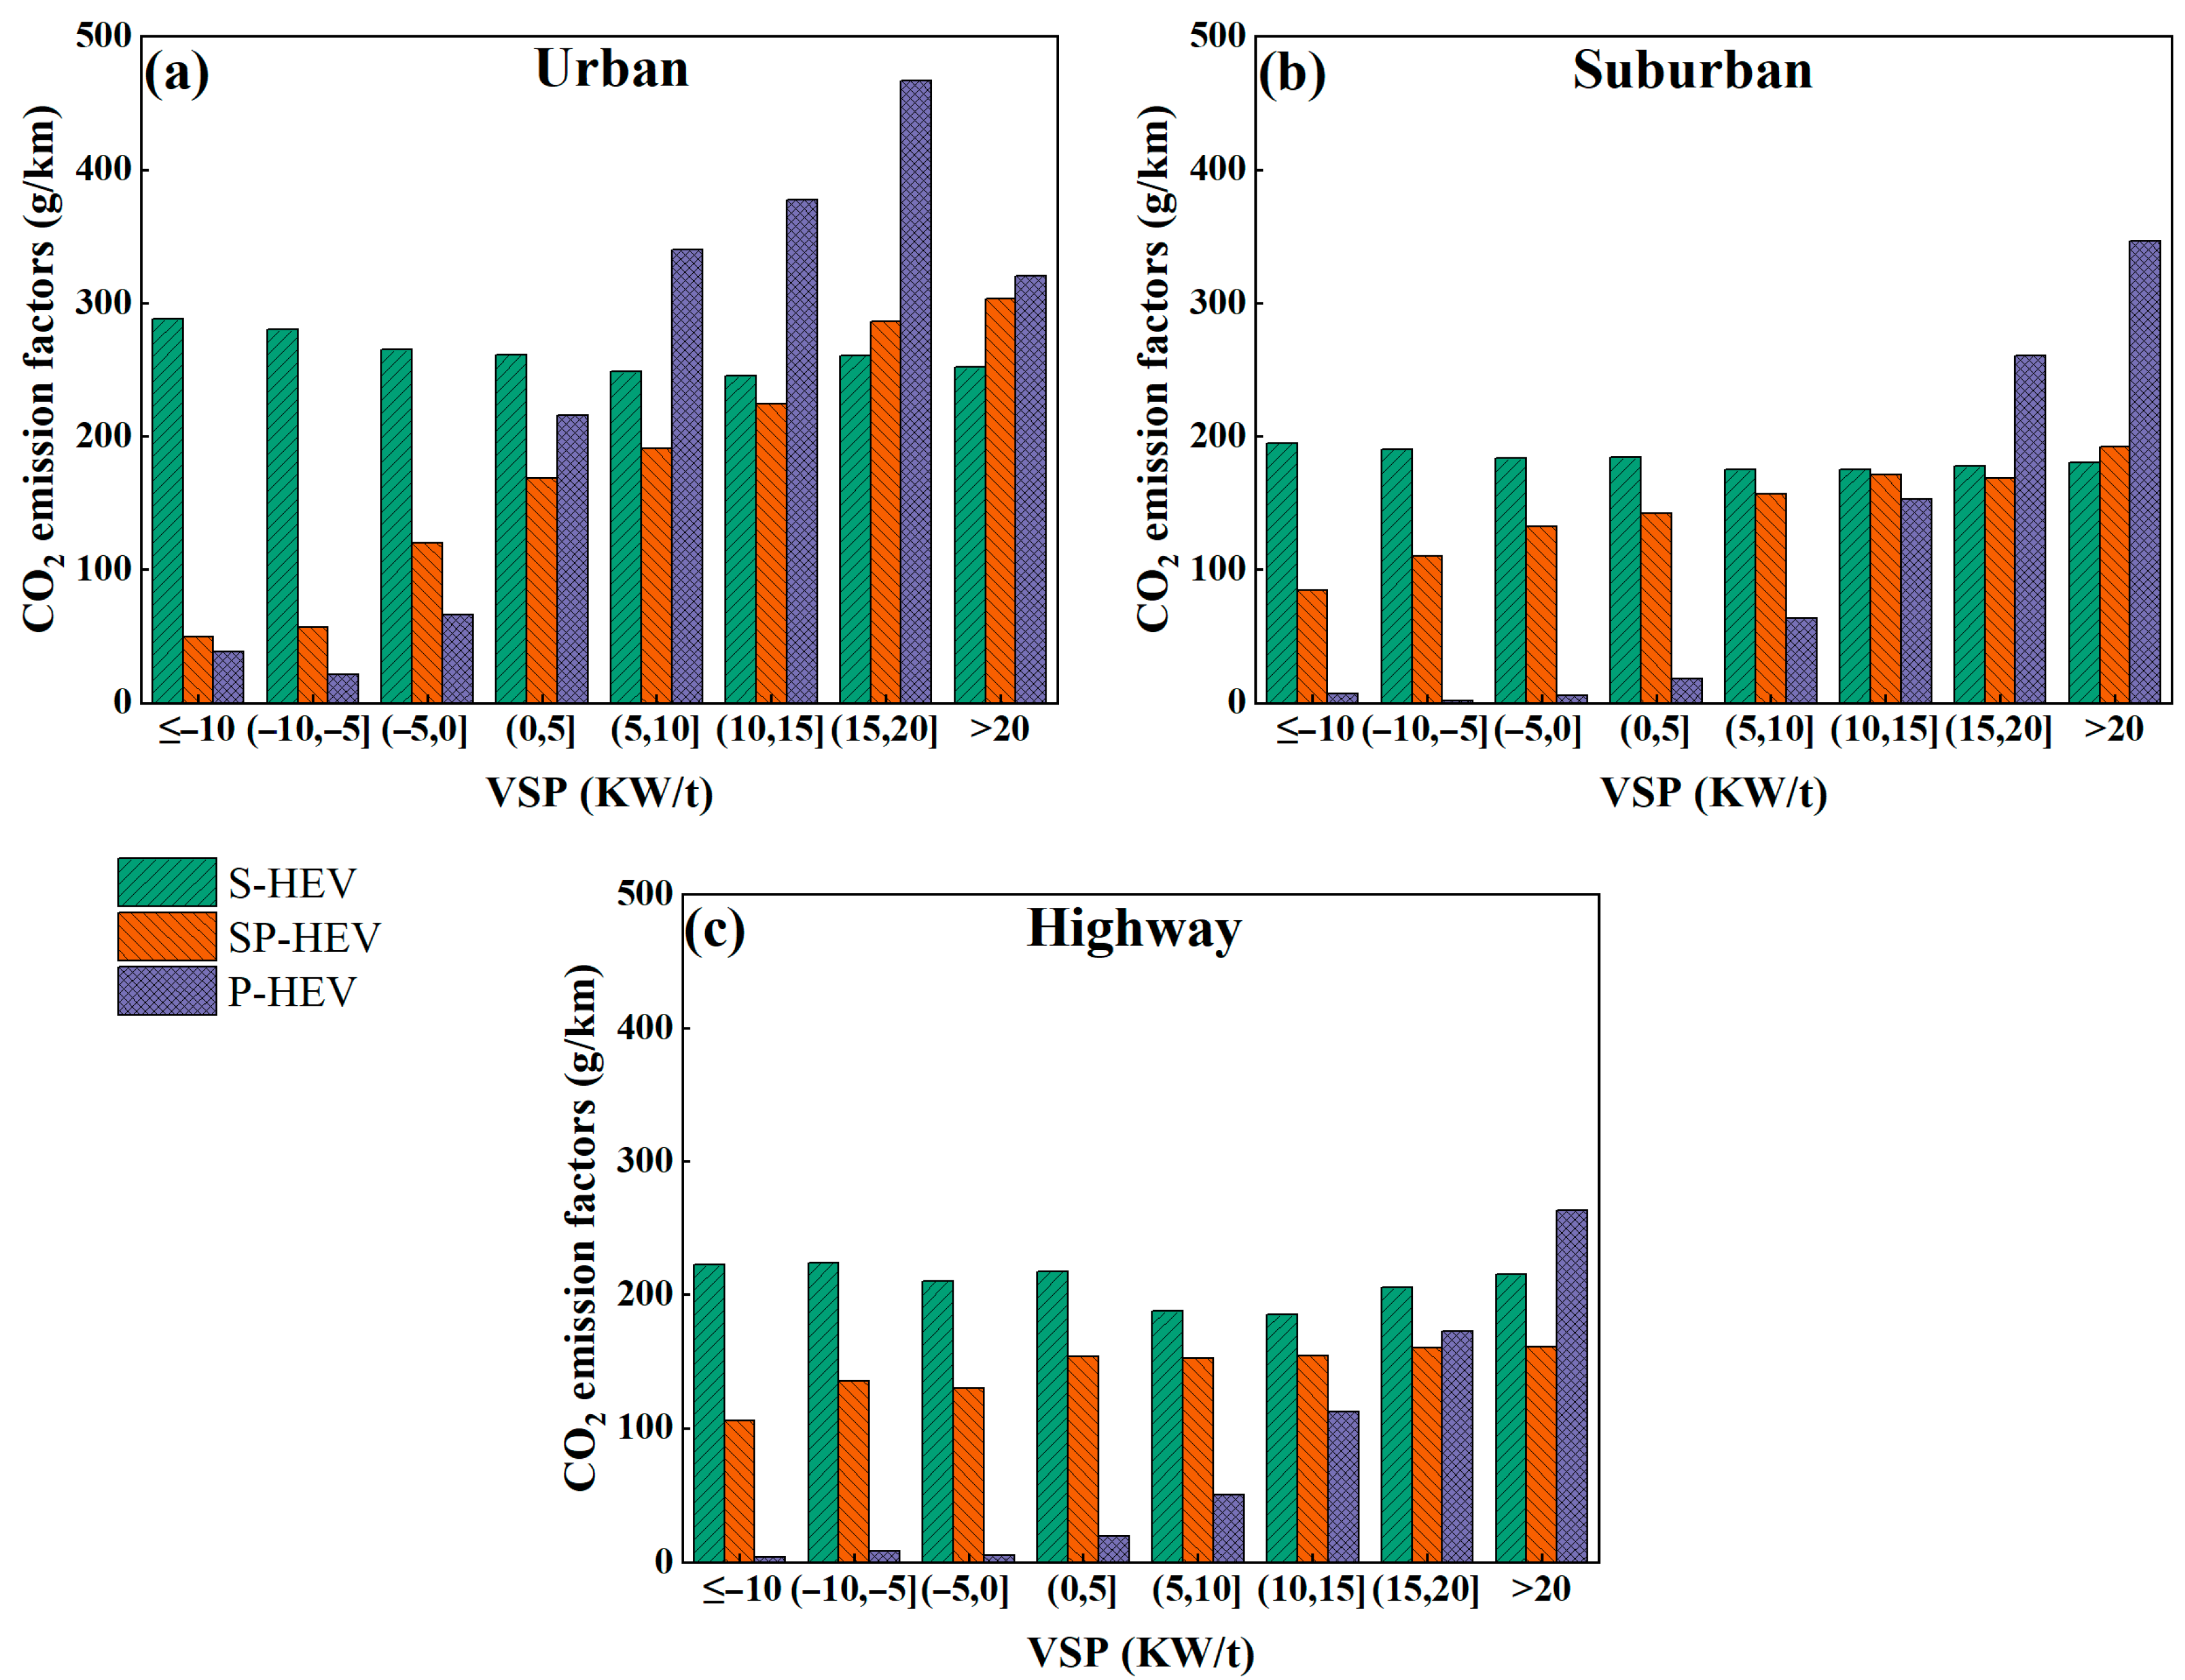
Figure 9 illustrates the CO2 emission factors within different VSP intervals. The research results reveal that under various road types and corresponding VSP ranges, the CO2 emission factors for the three types of hybrid vehicles present certain patterns.
Specifically, under urban road conditions when VSP ≤ 0; under suburban road conditions when VSP ≤ 5; and under highway road conditions when VSP ≤ 15, the order of CO2 emission factors is S-HEV > SP-HEV > P-HEV. This indicates that within these relatively low VSP intervals, P-HEV performs the best in controlling CO2 emissions, with the lowest emission factor, while S-HEV has a relatively higher emission factor. Further analysis shows that the CO2 emission factor of P-HEV increases with the rise in VSP under all three road types: urban, suburban, and highway. When VSP exceeds 5 in urban roads, 15 in suburban roads, and 20 in highway roads, the CO2 emission factor of P-HEV will surpass those of S-HEV and SP-HEV. This implies that when VSP goes beyond a certain threshold, P-HEV’s ability to control CO2 emissions relatively weakens, with its emission factor showing a significant increase and even exceeding the other two vehicle types. For SP-HEV, under urban and suburban road conditions, its CO2 emission factor shows an upward trend as VSP increases. This suggests that in these two road types, as the vehicle’s specific power rises, the CO2 emissions of SP-HEV also increase accordingly. However, under highway road conditions, the CO2 emission factor of SP-HEV tends to stabilize and no longer changes significantly with the increase in VSP. This indicates that SP-HEV has relatively stable control over CO2 emissions on highways and can adapt to higher VSP conditions to a certain extent. As for S-HEV, under urban, suburban, and highway road conditions, its CO2 emission factor does not change significantly with the variation in VSP. This shows that S-HEV has relatively stable CO2 emission characteristics and is less affected by VSP changes. However, it also means that its emission control capability across different VSP intervals is relatively average, without showing the obvious advantage that P-HEV has in low VSP intervals.

4. Conclusions

This study utilized the OBS-ONE PEMS to conduct RDE tests in Kunming. The primary objective of these tests was to investigate the CO2 emission characteristics of different types of PHEVs. After thorough research and analysis, the following main conclusions were drawn:
(1)
In this study, we conducted RDE tests on S-HEV, SP-HEV, and P-HEV. During the tests, the vehicle batteries were discharged to the minimum charge limit specified by the manufacturers. The research findings indicate that there is a correlation between acceleration and the increase in CO2 emission levels of P-HEV. However, acceleration has a relatively minor impact on the CO2 emissions of the S-HEV and SP-HEV. Under urban driving conditions, the SP-HEV exhibited the lowest average CO2 emission rate, which was 20.94% lower than that of the P-HEV and 80.69% lower than that of the S-HEV. In contrast, under suburban and highway driving conditions, the average CO2 emission rates of the three vehicle types followed the pattern of S-HEV > SP-HEV > P-HEV. Specifically, the CO2 emission rate of S-HEV was 22.77% to 40.96% higher than that of SP-HEV and 49.14% to 86.75% higher than that of P-HEV.
(2)
The experimental results demonstrate that for S-HEV across three road types, the CO2 emission rate changes relatively little with an increase in VSP. Moreover, when driving at low speeds (<20 km/h) in urban areas, S-HEVs can fully utilize their electric drive systems, resulting in nearly negligible CO2 emission rates. However, once the vehicle speed exceeds 20 km/h, the emission rate rises significantly as the demand for power increases. For SP-HEVs, the CO2 emission rate increases with VSP during urban driving but remains relatively stable during suburban and highway driving. Additionally, SP-HEVs exhibit lower emission rates when the deceleration exceeds 0.5 m/s2 in suburban areas or 0.8 m/s2 on highways, indicating good emission control performance during deceleration. For P-HEVs, the CO2 emission rate is significantly influenced by VSP across all three road types, rising with an increase in VSP. Nevertheless, their emission rates are also almost zero at low urban speeds (<20 km/h) and remain lower when the acceleration is less than 0.3 m/s2 or during deceleration, showcasing their low-emission advantages under low-acceleration and deceleration conditions. Therefore, it is recommended that drivers avoid aggressive driving behaviors to reduce high-VSP operating conditions, thereby lowering CO2 emissions and ultimately improving urban air quality. Although directly monitoring individual driving behaviors in real time is challenging, the following measures can be taken to facilitate progress: Automobile manufacturers can install feedback systems in vehicles, enabling drivers to stay informed in real time about their driving styles and the impact on carbon dioxide emissions, thereby guiding them toward eco-friendly driving. Traffic management authorities can utilize traffic monitoring facilities to analyze traffic flow patterns, identify areas with a high incidence of aggressive driving, and carry out targeted publicity and education campaigns or implement traffic management interventions.
(3)
Under different road types and corresponding VSP ranges, the CO2 emission factors of the three hybrid vehicles exhibit specific patterns: when VSP ≤ 0 on urban roads, VSP ≤ 5 on suburban roads, and VSP ≤ 15 on highways, the order of CO2 emission factors is S-HEV > SP-HEV > P-HEV, indicating that P-HEV performs best in controlling CO2 emissions within these low VSP intervals. The CO2 emission factors of P-HEV increase with rising VSP across all three road types. When VSP exceeds thresholds of 5 on urban roads, 15 on suburban roads, and 20 on highways, the emission factors of P-HEVs will surpass those of S-HEVs and SP-HEVs, demonstrating a weakening of their emission control capability. For SP-HEVs, the CO2 emission factors rise with increasing VSP on urban and suburban roads, but stabilize on highways, indicating relatively stable control over CO2 emissions on highways and the ability to adapt to higher VSP conditions to a certain extent. In contrast, the CO2 emission factors of S-HEVs do not change significantly with VSP variations across all three road types, showing relatively stable emission characteristics but a relatively average emission control capability that does not exhibit the distinct advantage of P-HEVs in low VSP intervals.
(4)
This study has several limitations. Firstly, the sample is confined to three common types of PHEVs, potentially failing to fully represent all PHEV models due to the vast diversity in their designs across brands. Secondly, the driving routes, while covering urban, suburban, and highway conditions, omit special scenarios like mountainous and extremely congested roads, which may lead to deviations when applying results to other situations. Thirdly, the research is temporally constrained as it does not account for seasonal and weather impacts on CO2 emissions, which can vary significantly between winter and summer.

Author Contributions

Conceptualization, N.Y. and X.L.; methodology, X.W.; software, J.W.; validation, Z.B., L.R. and J.J.; formal analysis, X.W.; investigation, X.L.; resources, L.R.; data curation, X.W.; writing—original draft preparation, N.Y.; writing—review and editing, L.R.; visualization, J.J.; supervision, Z.B.; project administration, J.L.; funding acquisition, X.W. All authors have read and agreed to the published version of the manuscript.

Funding

This work is financially supported by the FAW—Volkswagen and China Environmental Protection Foundation Automotive Environmental Protection Innovation Leadership Program.

Institutional Review Board Statement

Not applicable.

Informed Consent Statement

Not applicable.

Data Availability Statement

Data sharing for reproducibility.

Conflicts of Interest

Author Xuetong Lian, Zhenxiao Bai, Liangwu Rao, Junxin Jiang was employed by the company Guangzhou Automobile Group Co., Ltd. Author Jiguang Wang was employed by the company CATARC Automotive Test Center (Kunming) Co., Ltd. The remaining authors declare that the research was conducted in the absence of any commercial or financial relationships that could be construed as a potential conflict of interest.

References

  1. Lv, Z.; Guo, J.; Mao, H.; Dong, Y. Comparative analysis of energy flow and emissions in electric and engine-driven modes of a plug-in hybrid electric vehicle. Appl. Therm. Eng. 2025, 274, 126735. [Google Scholar] [CrossRef]
  2. Chen, J.; Wang, K.; Yu, H.; Chen, H.; Zhao, F.; Yu, W. A novel VSP-based CO2 emission model for ICEs and HEVs based on internally observable variables: Engine operating speeds. Energy 2024, 313, 133892. [Google Scholar] [CrossRef]
  3. Jeong, J.W.; In Lee, D.; Woo, S.; Lim, Y.; Lee, K. Analysis of energy consumption efficiency and emissions according to urban driving of hybrid electric vehicles in Korea. Appl. Energy 2024, 371, 123686. [Google Scholar] [CrossRef]
  4. Karjalainen, P.; Leinonen, V.; Olin, M.; Vesisenaho, K.; Marjanen, P.; Järvinen, A.; Simonen, P.; Markkula, L.; Kuuluvainen, H.; Keskinen, J.; et al. Real-world emissions of nanoparticles, particulate mass and black carbon from a plug-in hybrid vehicle compared to conventional gasoline vehicles. Environ. Adv. 2024, 15, 100454. [Google Scholar] [CrossRef]
  5. Li, B.-W.; Chen, Z.-H.; Zhu, X.-H.; Zhang, Z.; Peng, Z.-R.; Zhao, H.-M.; He, H.-D. Assessment of eco-driving strategies on carbon emissions for hybrid vehicles through portable emissions measurement systems. Atmos. Pollut. Res. 2025, 16, 102365. [Google Scholar] [CrossRef]
  6. Suthar, C.; Sangiri, J.B.; Maiti, S.; Chakraborty, C. A Pulse density modulated LLC resonant converter based battery charger for HEV/PHEV application. In Proceedings of the 2019 IEEE International Conference on Electrical, Computer and Communication Technologies (ICECCT), Coimbatore, India, 20–22 February 2019; pp. 1–7. [Google Scholar]
  7. Nguyen, K.D.; Bideaux, E.; Pham, M.T.; Le Brusq, P. Game theoretic approach for electrified auxiliary management in high voltage network of HEV/PHEV. In Proceedings of the 2014 IEEE International Electric Vehicle Conference (IEVC), Florence, Italy, 17–19 December 2014; pp. 1–8. [Google Scholar]
  8. Axsen, J.; Kurani, K.S. Hybrid, plug-in hybrid, or electric—What do car buyers want? Energy Policy 2013, 61, 532–543. [Google Scholar] [CrossRef]
  9. Broussely, M. Battery Requirements for HEVs, PHEVs, and EVs. In Electric and Hybrid Vehicles; Elsevier B.V.: Amsterdam, the Netherlands, 2010; pp. 305–345. [Google Scholar]
  10. Okawara, J.; Senoo, M.; Nishiwaki, T.; Yamashita, Y.; Machida, S.; Kagata, Y.; Konishi, M. Design of 1200-V RC-IGBT for TOYOTA’s 5th generation HEV/PHEV systems. In Proceedings of the 2023 35th International Symposium on Power Semiconductor Devices and ICs (ISPSD), Hong Kong, China, 28 May–1 June 2023; pp. 151–154. [Google Scholar]
  11. Squalli, J. Environmental hypocrisy? Electric and hybrid vehicle adoption and pro-environmental attitudes in the United States. Energy 2024, 293, 130670. [Google Scholar] [CrossRef]
  12. Squalli, J. Greening the roads: Assessing the role of electric and hybrid vehicles in curbing CO2 emissions. J. Clean. Prod. 2024, 434, 139908. [Google Scholar] [CrossRef]
  13. Suppes, G. Roles of plug-in hybrid electric vehicles in the transition to the hydrogen economy. Int. J. Hydrogen Energy 2006, 31, 353–360. [Google Scholar] [CrossRef]
  14. Veza, I.; Asy’ari, M.Z.; Idris, M.; Epin, V.; Rizwanul Fattah, I.M.; Spraggon, M. Electric vehicle (EV) and driving towards sustainability: Comparison between EV, HEV, PHEV, and ICE vehicles to achieve net zero emissions by 2050 from EV. Alex. Eng. J. 2023, 82, 459–467. [Google Scholar] [CrossRef]
  15. Zhang, F.; Hu, X.; Langari, R.; Cao, D. Energy management strategies of connected HEVs and PHEVs: Recent progress and outlook. Prog. Energy Combust. Sci. 2019, 73, 235–256. [Google Scholar] [CrossRef]
  16. He, L.; You, Y.; Zheng, X.; Zhang, S.; Li, Z.; Zhang, Z.; Wu, Y.; Hao, J. The impacts from cold start and road grade on real-world emissions and fuel consumption of gasoline, diesel and hybrid-electric light-duty passenger vehicles. Sci. Total Environ. 2022, 851, 158045. [Google Scholar] [CrossRef]
  17. O’Driscoll, R.; Stettler, M.E.J.; Molden, N.; Oxley, T.; ApSimon, H.M. Real world CO2 and NOx emissions from 149 Euro 5 and 6 diesel, gasoline and hybrid passenger cars. Sci. Total Environ. 2018, 621, 282–290. [Google Scholar] [CrossRef]
  18. Tansini, A.; Pavlovic, J.; Fontaras, G. Quantifying the real-world CO2 emissions and energy consumption of modern plug-in hybrid vehicles. J. Clean. Prod. 2022, 362, 132191. [Google Scholar] [CrossRef]
  19. Wu, X.; Zhang, S.; Wu, Y.; Li, Z.; Ke, W.; Fu, L.; Hao, J. On–road measurement of gaseous emissions and fuel consumption for two hybrid electric vehicles in Macao. Atmos. Pollut. Res. 2015, 6, 858–866. [Google Scholar] [CrossRef]
  20. Yang, N.; Li, J.; He, C.; Wang, J.; Chen, Y.; Yao, Y. CO2 emission characteristics of China VI hybrid vehicles. Transp. Res. Part D Transp. Environ. 2024, 135, 104377. [Google Scholar] [CrossRef]
  21. Tan, D.; Tan, J.; Liu, M.; Xu, H.; Ge, Y. A combined vehicle specific power and laboratory emissions approach to real driving CO2 emission estimation for light-duty vehicle. Sustain. Energy Technol. Assess. 2025, 75, 104265. [Google Scholar] [CrossRef]
  22. Chen, L.; Du, B.; Zhang, L.; Han, J.; Chen, B.; Zhang, X.; Li, Y.; Zhang, J. Analysis of real-driving emissions from light-duty gasoline vehicles: A comparison of different evaluation methods with considering cold-start emissions. Atmos. Pollut. Res. 2021, 12, 101065. [Google Scholar] [CrossRef]
  23. Wu, X.; Zhao, H.; He, L.; Yang, X.; Jiang, H.; Fu, M.; Yin, H.; Ding, Y. Impacts on real-world extra cold start emissions: Fuel injection, powertrain, aftertreatment and ambient temperature. Environ. Pollut. 2023, 324, 121339. [Google Scholar] [CrossRef]
  24. Kontses, A.; Triantafyllopoulos, G.; Ntziachristos, L.; Samaras, Z. Particle number (PN) emissions from gasoline, diesel, LPG, CNG and hybrid-electric light-duty vehicles under real-world driving conditions. Atmos. Environ. 2020, 222, 117126. [Google Scholar] [CrossRef]
  25. Zheng, F.; Zhang, H.; Yin, H.; Fu, M.; Jiang, H.; Li, J.; Ding, Y. Evaluation of real-world emissions of China V heavy-duty vehicles fueled by diesel, CNG and LNG on various road types. Chemosphere 2022, 303, 135137. [Google Scholar] [CrossRef]
  26. Lv, L.; Ge, Y.; Ji, Z.; Tan, J.; Wang, X.; Hao, L.; Wang, Z.; Zhang, M.; Wang, C.; Liu, H. Regulated emission characteristics of in-use LNG and diesel semi-trailer towing vehicles under real driving conditions using PEMS. J. Environ. Sci. 2020, 88, 155–164. [Google Scholar] [CrossRef]
  27. Yao, Y.; Li, J.; He, C.; Chen, Y.; Yu, H.; Wang, J.; Yang, N.; Zhao, L. Research on particle emissions of light-duty hybrid electric vehicles in real driving. Atmos. Pollut. Res. 2025, 16, 102332. [Google Scholar] [CrossRef]
  28. Yang, Z.; Ge, Y.; Thomas, D.; Wang, X.; Su, S.; Li, H.; He, H. Real driving particle number (PN) emissions from China-6 compliant PFI and GDI hybrid electrical vehicles. Atmos. Environ. 2019, 199, 70–79. [Google Scholar] [CrossRef]
  29. Prati, M.V.; Costagliola, M.A. Real driving emissions of Euro 6 electric/gasoline hybrid and natural gas vehicles. Transp. Res. Part D Transp. Environ. 2022, 113, 103509. [Google Scholar] [CrossRef]
  30. Prati, M.V.; Costagliola, M.A.; Giuzio, R.; Corsetti, C.; Beatrice, C. Emissions and energy consumption of a plug-in hybrid passenger car in Real Driving Emission (RDE) test. Transp. Eng. 2021, 4, 100069. [Google Scholar] [CrossRef]
  31. Rohrer, R.A.; Pitla, S.K.; Luck, J.D. Tractor CAN bus interface tools and application development for real-time data analysis. Comput. Electron. Agric. 2019, 163, 104847. [Google Scholar] [CrossRef]
  32. Xia, Y.; Liao, C.; Chen, X.; Zhu, Z.; Chen, X.; Wang, L.; Jiang, R.; Stettler, M.E.J.; Angeloudis, P.; Gao, Z. Future reductions of China’s transport emissions impacted by changing driving behaviour. Nat. Sustain. 2023, 6, 1228–1236. [Google Scholar] [CrossRef]
  33. Qiao, P.; Ni, J.; Huang, R.; Cheng, Z. Prediction of instantaneous particle number for light-duty gasoline vehicles under real driving conditions based on ensemble learning. J. Clean. Prod. 2024, 434, 139859. [Google Scholar] [CrossRef]
  34. Jiang, Z.; Wu, L.; Niu, H.; Jia, Z.; Qi, Z.; Liu, Y.; Zhang, Q.; Wang, T.; Peng, J.; Mao, H. Investigating the impact of high-altitude on vehicle carbon emissions: A comprehensive on-road driving study. Sci. Total Environ. 2024, 918, 170671. [Google Scholar] [CrossRef]
  35. Zhu, X.-H.; He, H.-D.; Lu, K.-F.; Peng, Z.-R.; Gao, H.O. Characterizing carbon emissions from China V and China VI gasoline vehicles based on portable emission measurement systems. J. Clean. Prod. 2022, 378, 134458. [Google Scholar] [CrossRef]
  36. Cui, W.; Cui, N.; Li, T.; Du, Y.; Zhang, C. Multi-objective hierarchical energy management for connected plug-in hybrid electric vehicle with cyber–physical interaction. Appl. Energy 2024, 360, 122816. [Google Scholar] [CrossRef]
  37. Gao, K.; Luo, P.; Xie, J.; Chen, B.; Wu, Y.; Du, R. Energy management of plug-in hybrid electric vehicles based on speed prediction fused driving intention and LIDAR. Energy 2023, 284, 128535. [Google Scholar] [CrossRef]
  38. Hu, D.; Xie, H.; Song, K.; Zhang, Y.; Yan, L. An apprenticeship-reinforcement learning scheme based on expert demonstrations for energy management strategy of hybrid electric vehicles. Appl. Energy 2023, 342, 121227. [Google Scholar] [CrossRef]
  39. Adedeji, B.P. A multivariable output neural network approach for simulation of plug-in hybrid electric vehicle fuel consumption. Green Energy Intell. Transp. 2023, 2, 100070. [Google Scholar] [CrossRef]
  40. Chakraborty, A.; Ray, S. Operational cost minimization of a microgrid with optimum battery energy storage system and plug-in-hybrid electric vehicle charging impact using slime mould algorithm. Energy 2023, 278, 127842. [Google Scholar] [CrossRef]
  41. Hu, J.; Zhu, P.; Wu, Z.; Tian, J. A real-time multi-objective optimization method in energy efficiency for plug-in hybrid electric vehicles considering dynamic electrochemical characteristics of battery and driving conditions. J. Energy Storage 2024, 84, 110779. [Google Scholar] [CrossRef]
  42. Kong, Y.; Xu, N.; Liu, Q.; Sui, Y.; Jia, Y. Variable horizon-based predictive energy management strategy for plug-in hybrid electric vehicles and determination of a suitable predictive horizon. Energy 2024, 294, 130809. [Google Scholar] [CrossRef]
  43. Lei, Z.; Cai, J.; Li, J.; Gao, D.; Zhang, Y.; Chen, Z.; Liu, Y. Hierarchical eco-driving control for plug-in hybrid electric vehicles under multiple signalized intersection scenarios. J. Clean. Prod. 2023, 420, 138420. [Google Scholar] [CrossRef]
  44. Liu, W.; Yang, C.; Wang, W.; Ma, Y.; Yang, L.; Du, X. Efficient energy management for a plug-in hybrid electric vehicle considering motor current alert mechanism. J. Clean. Prod. 2023, 406, 137072. [Google Scholar] [CrossRef]
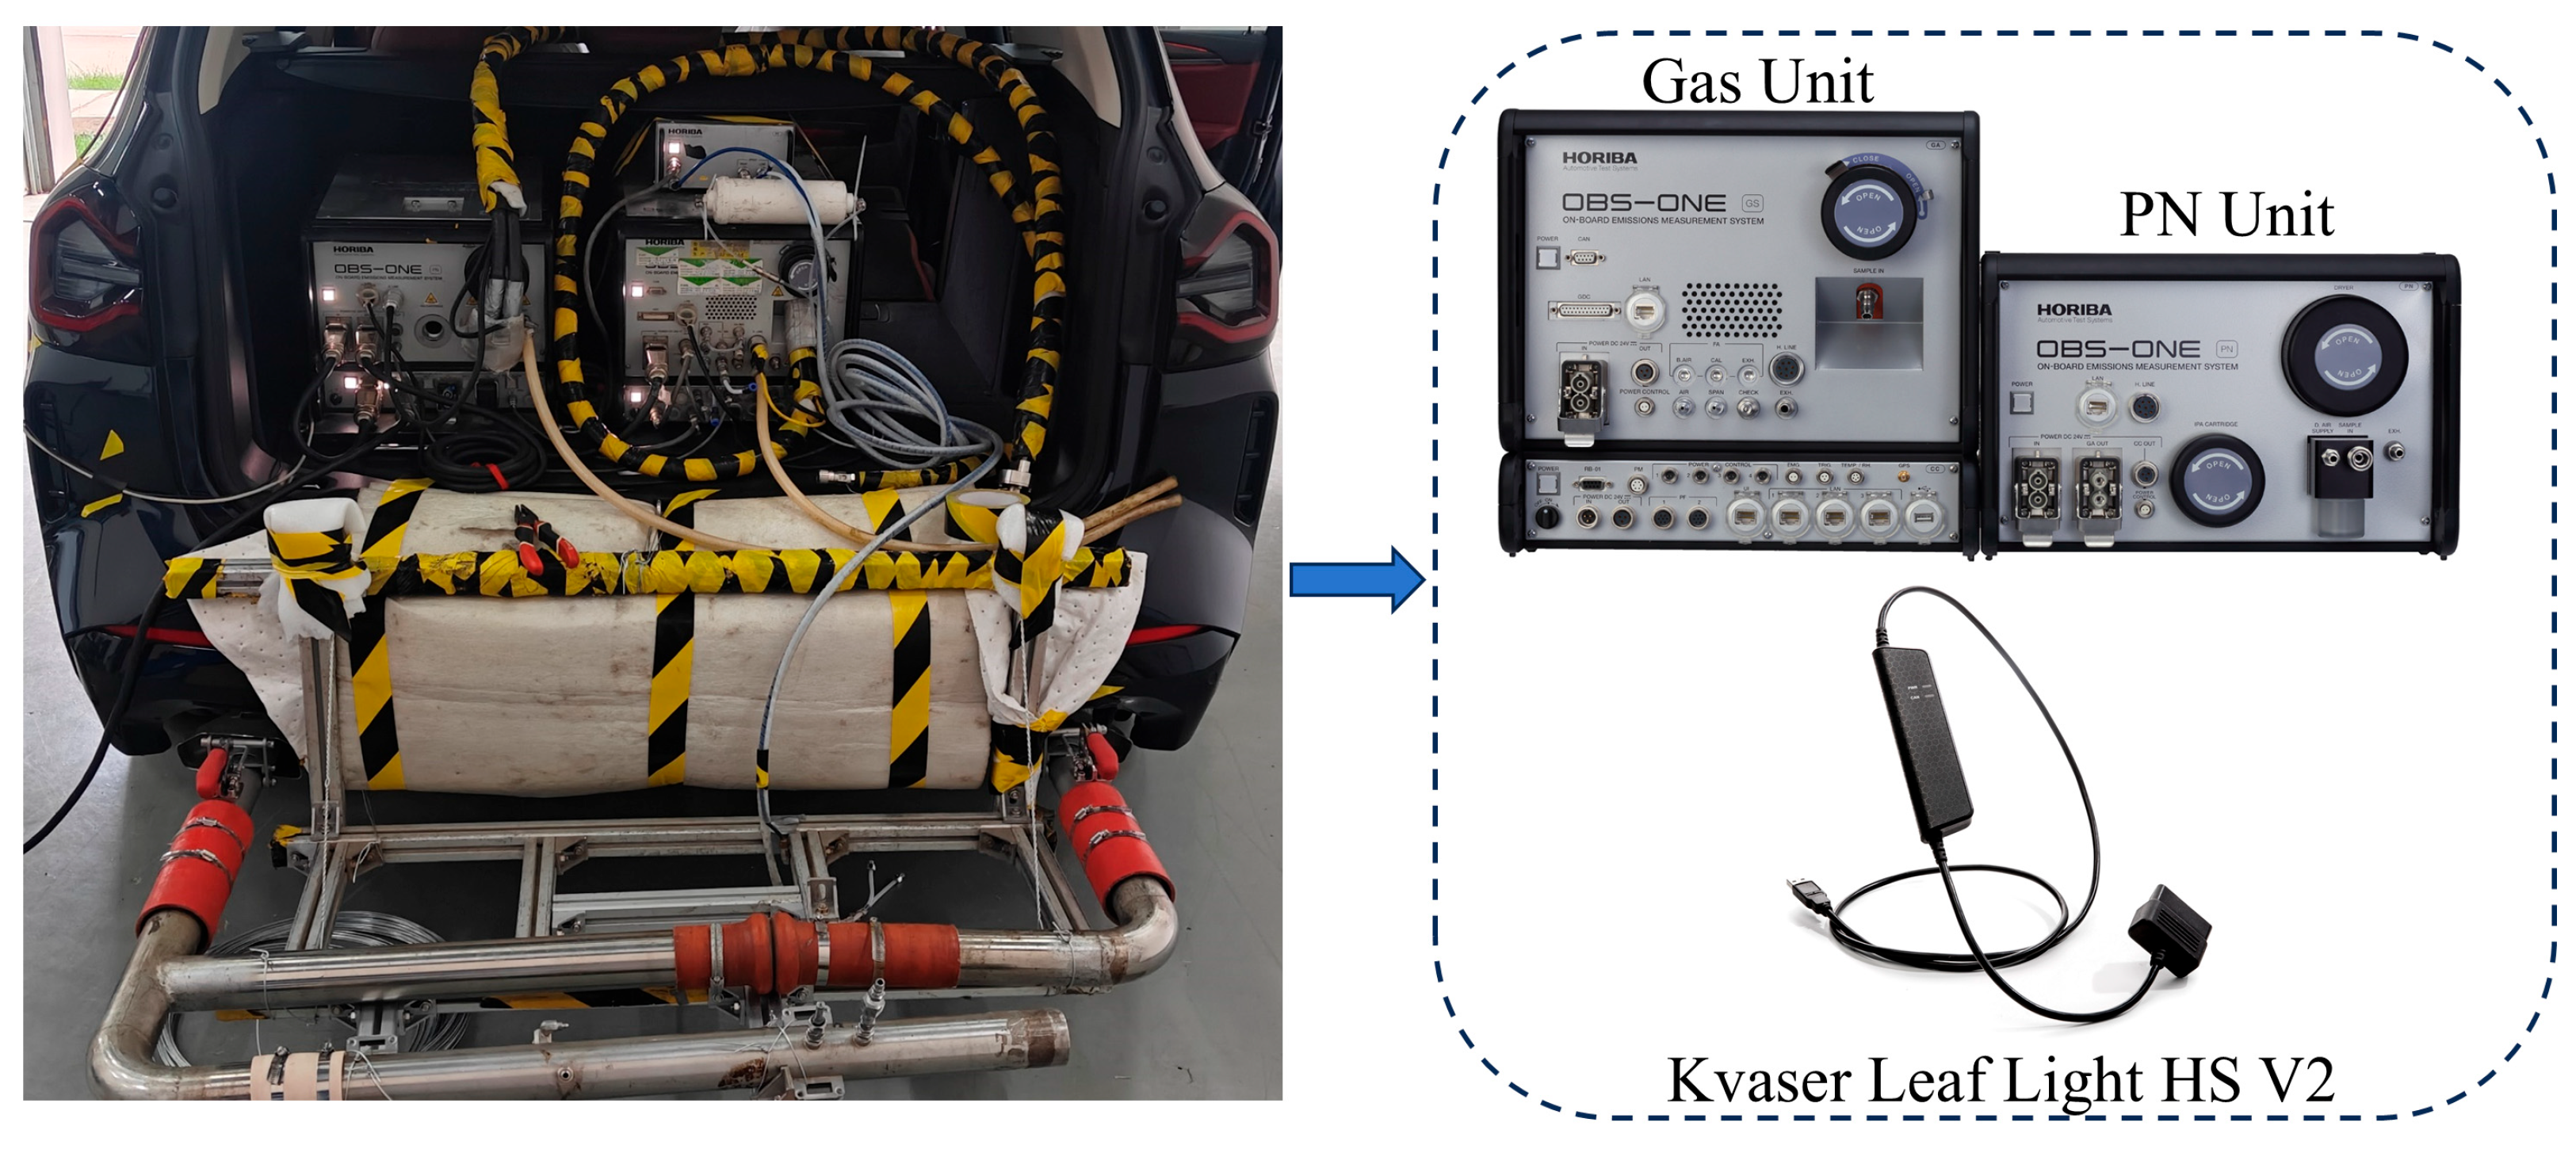
Figure 1. Installation diagram of test equipment.
Atmosphere 16 00946 g001
Figure 2. The route of RDE test in Kunming. (a) Indicates the location of Kunming on the map of China; (b) Illustrates the altitude variation along the entire route; (c) Depicts the RDE test route.
Atmosphere 16 00946 g002
Figure 3. Correlation of acceleration and velocity for three RDE tests.
Atmosphere 16 00946 g003
Figure 4. Emission rate comparison for vehicles in acceleration and deceleration conditions: (ac) represent varying CO2 emission rates for vehicles on different roads.
Atmosphere 16 00946 g004
Figure 5. Comparison of CO2 emission rates on different road types.
Atmosphere 16 00946 g005
Figure 6. CO2 emission rates of three types of PHEVs in various VSP intervals.
Atmosphere 16 00946 g006
Figure 7. The interactive effects of speed and acceleration on the levels of CO2 emissions.
Atmosphere 16 00946 g007
Figure 8. CO2 emissions factors on different road types.
Atmosphere 16 00946 g008
Figure 9. Emission factors of CO2 within different VSP intervals.
Atmosphere 16 00946 g009
Table 1. The main parameters of the test vehicles.
ParameterS-HEVSP-HEVP-HEV
Model YearJuly 2023February 2024December 2021
Emission StandardChina ⅥChina ⅥChina Ⅵ
Curb Weight/(kg)222020471750
Displacement/(L)1.51.51.4
Intake TypeTurbochargingTurbochargingTurbocharging
Fuel Delivery SystemMulti-point injectionDirect injectionDirect injection
Fuel TypeGasolineGasolineGasoline
Octane Rating Research Octane Number959295
ICE Maximum Power/(kW)112102110
ICE Maximum Torque/(N.m)205231250
Electric Motor Power(kW)20014585
Total Torque of Electric Motor (N.m)360316330
Total Horsepower of the Motor (ps)272197116
Electric MotorsSingle motorSingle motorSingle motor
Battery Power (kWh)4218.313
Battery Cooling MethodLiquid coolingLiquid cooling--
Disclaimer/Publisher’s Note: The statements, opinions and data contained in all publications are solely those of the individual author(s) and contributor(s) and not of MDPI and/or the editor(s). MDPI and/or the editor(s) disclaim responsibility for any injury to people or property resulting from any ideas, methods, instructions or products referred to in the content.