
Insights into the Optical and Physical Characteristics of Low Clouds and Aerosols in Africa from Satellite Lidar Measurements


Abstract
1. Introduction
2. Methodology
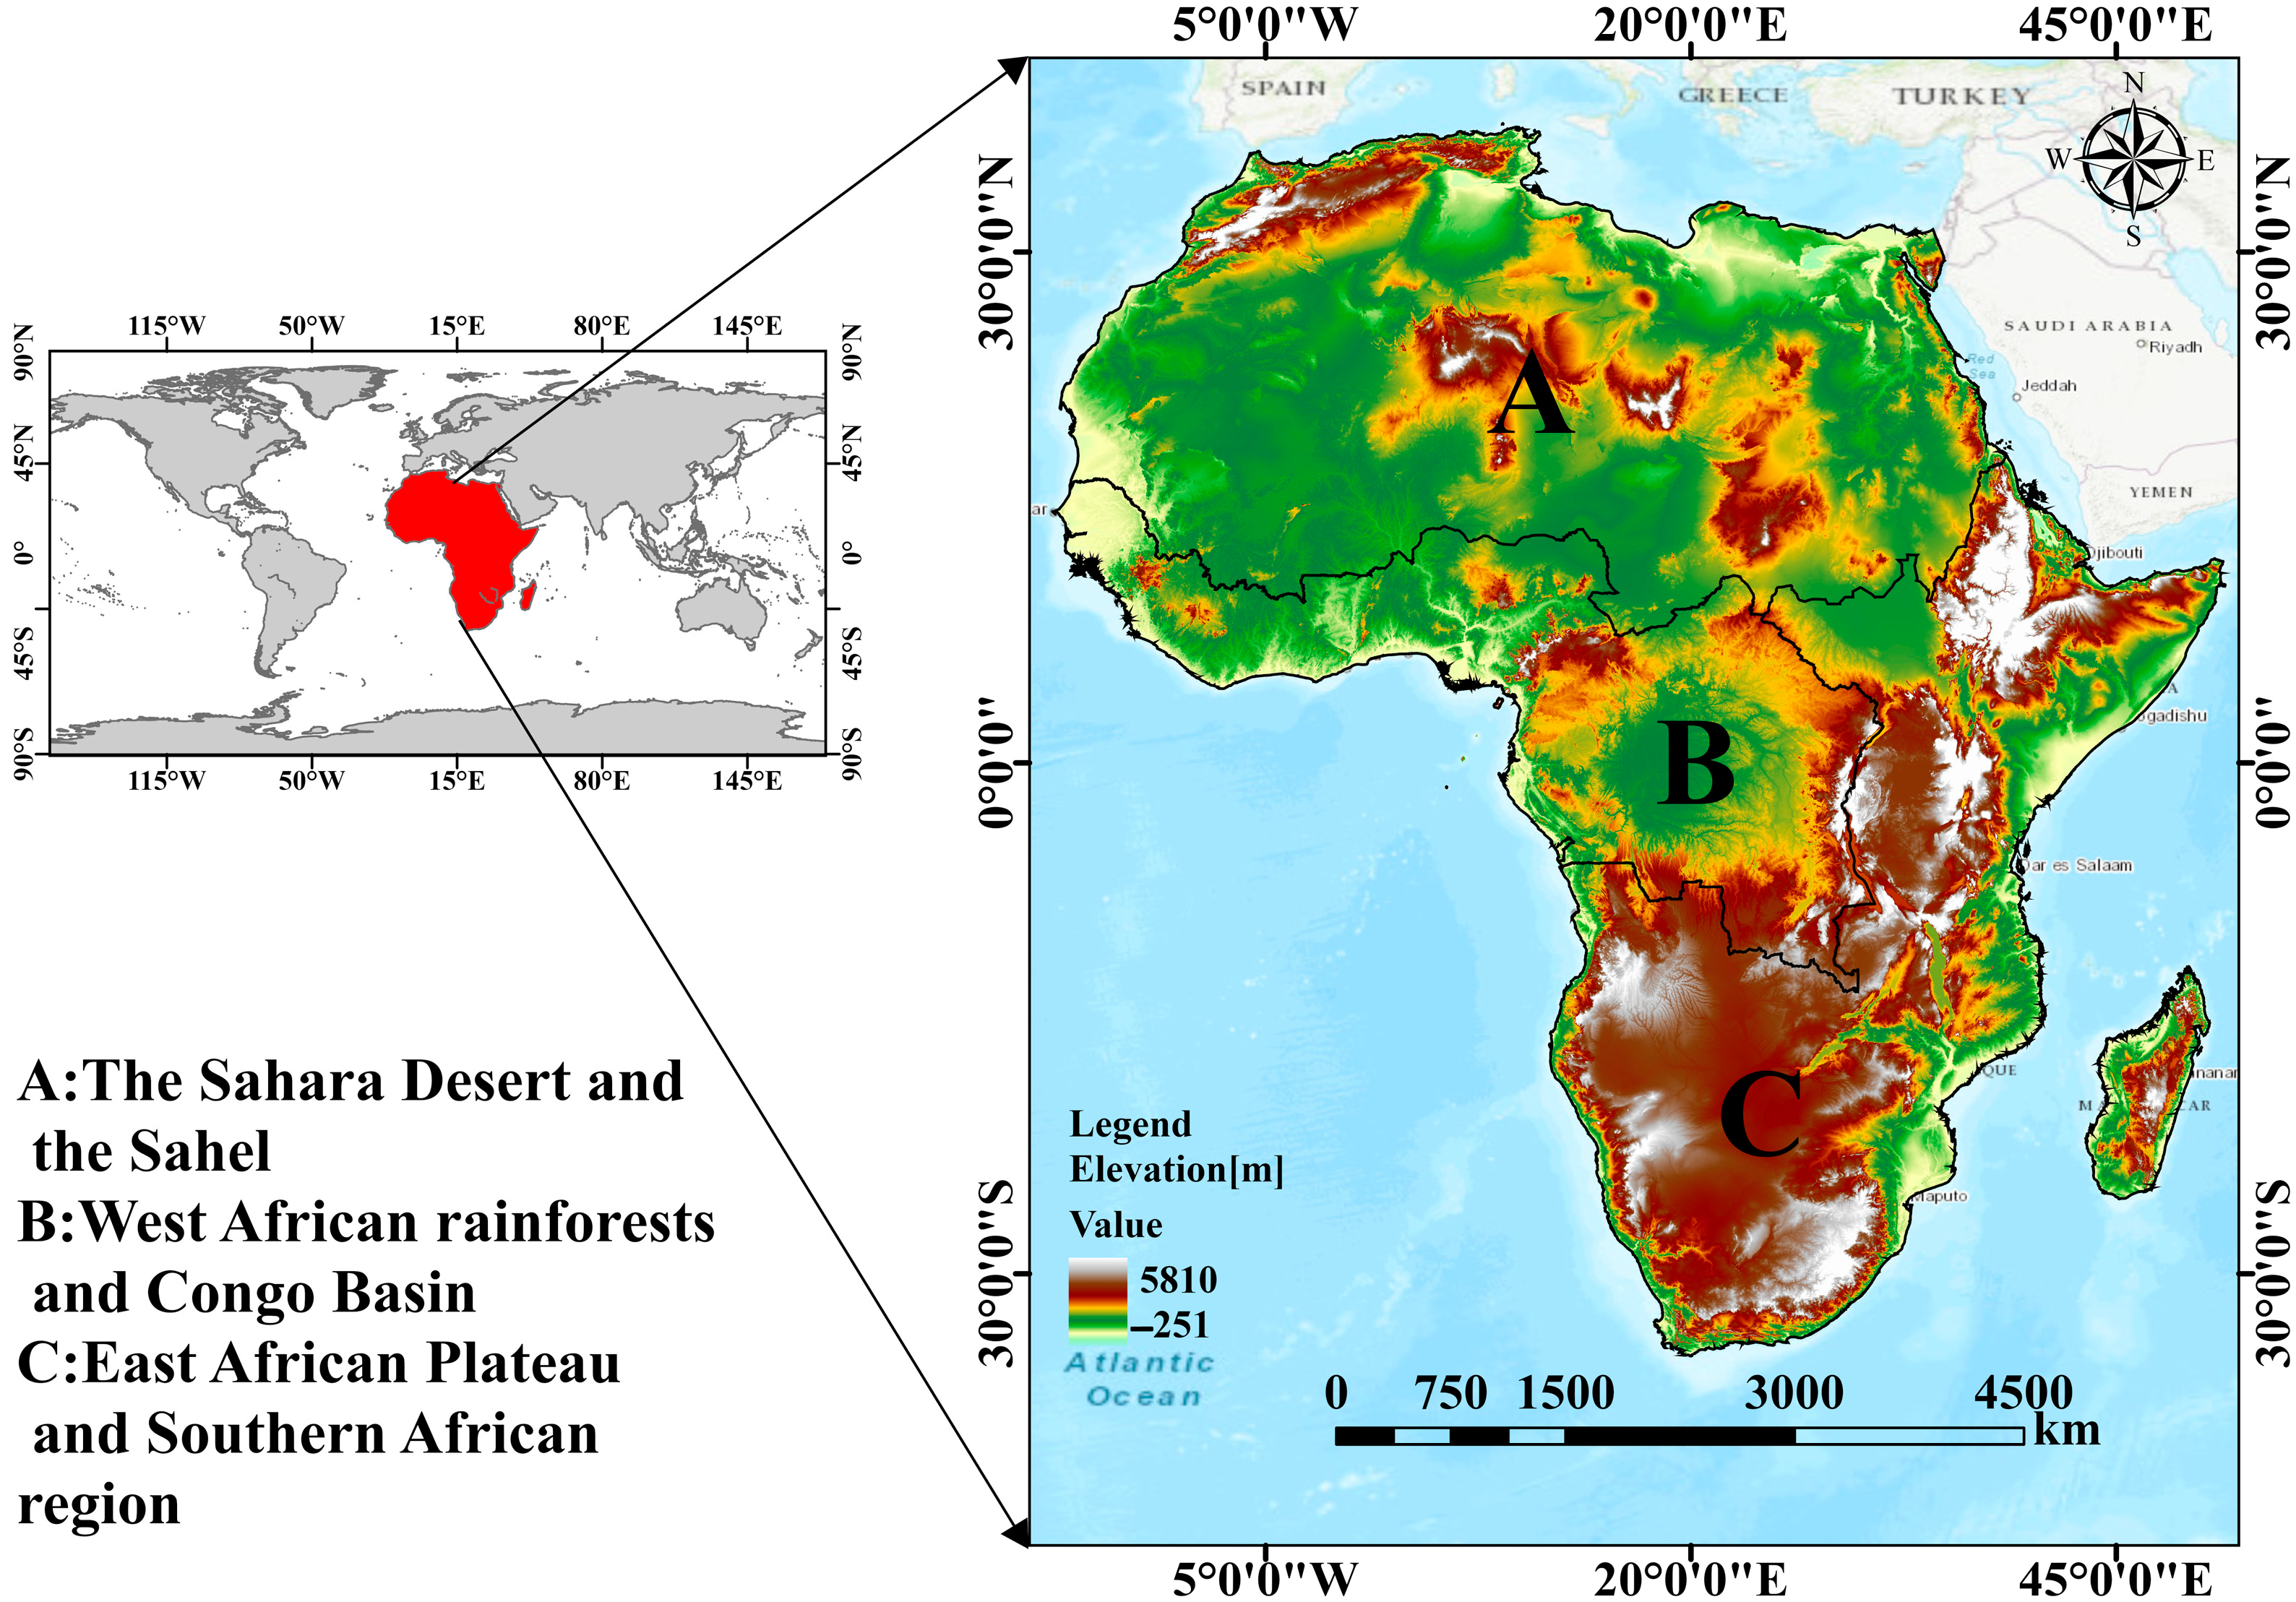
2.1. Study Area
2.2. Materials and Methods
- (1)
- Data Acquisition and Quality Control. Data were obtained from authoritative sources including NASA Langley Atmospheric Science Research Center. Stringent parameter screening (see Appendix A Table A2) was applied to ensure reliability, with only low-cloud data (base height < 2.5 km) retained for subsequent analysis.
- (2)
- Data Preprocessing. Spatiotemporal matching was performed after categorising data by the African sub-regions, to ensure temporal and spatial consistency between the cloud and aerosol datasets to establish a unified analytical framework.
- (3)
- Spatiotemporal Variation Analysis. In-depth analyses of the optical-physical parameters of low clouds were conducted, with a focus on their diurnal/seasonal variations across three representative African regions using seasonal statistics.
- (4)
- Statistical Analysis. Correlation analyses were conducted to elucidate the intrinsic relationships among low-cloud parameters and their interactions with aerosol metrics, and to reveal potential coupling mechanisms between low-cloud systems and aerosol layers.
- (5)
- Interpretation. The optical-physical properties of low clouds/aerosols and their dynamics were systematically evaluated within the geographic, meteorological, and environmental context of Africa. The impacts of aerosols on cloud microphysics, radiative effects, and cascading climatic feedbacks were critically examined.
3. Results and Discussion
3.1. Seasonal and Spatial Patterns in the Radiative Characteristics of Africa
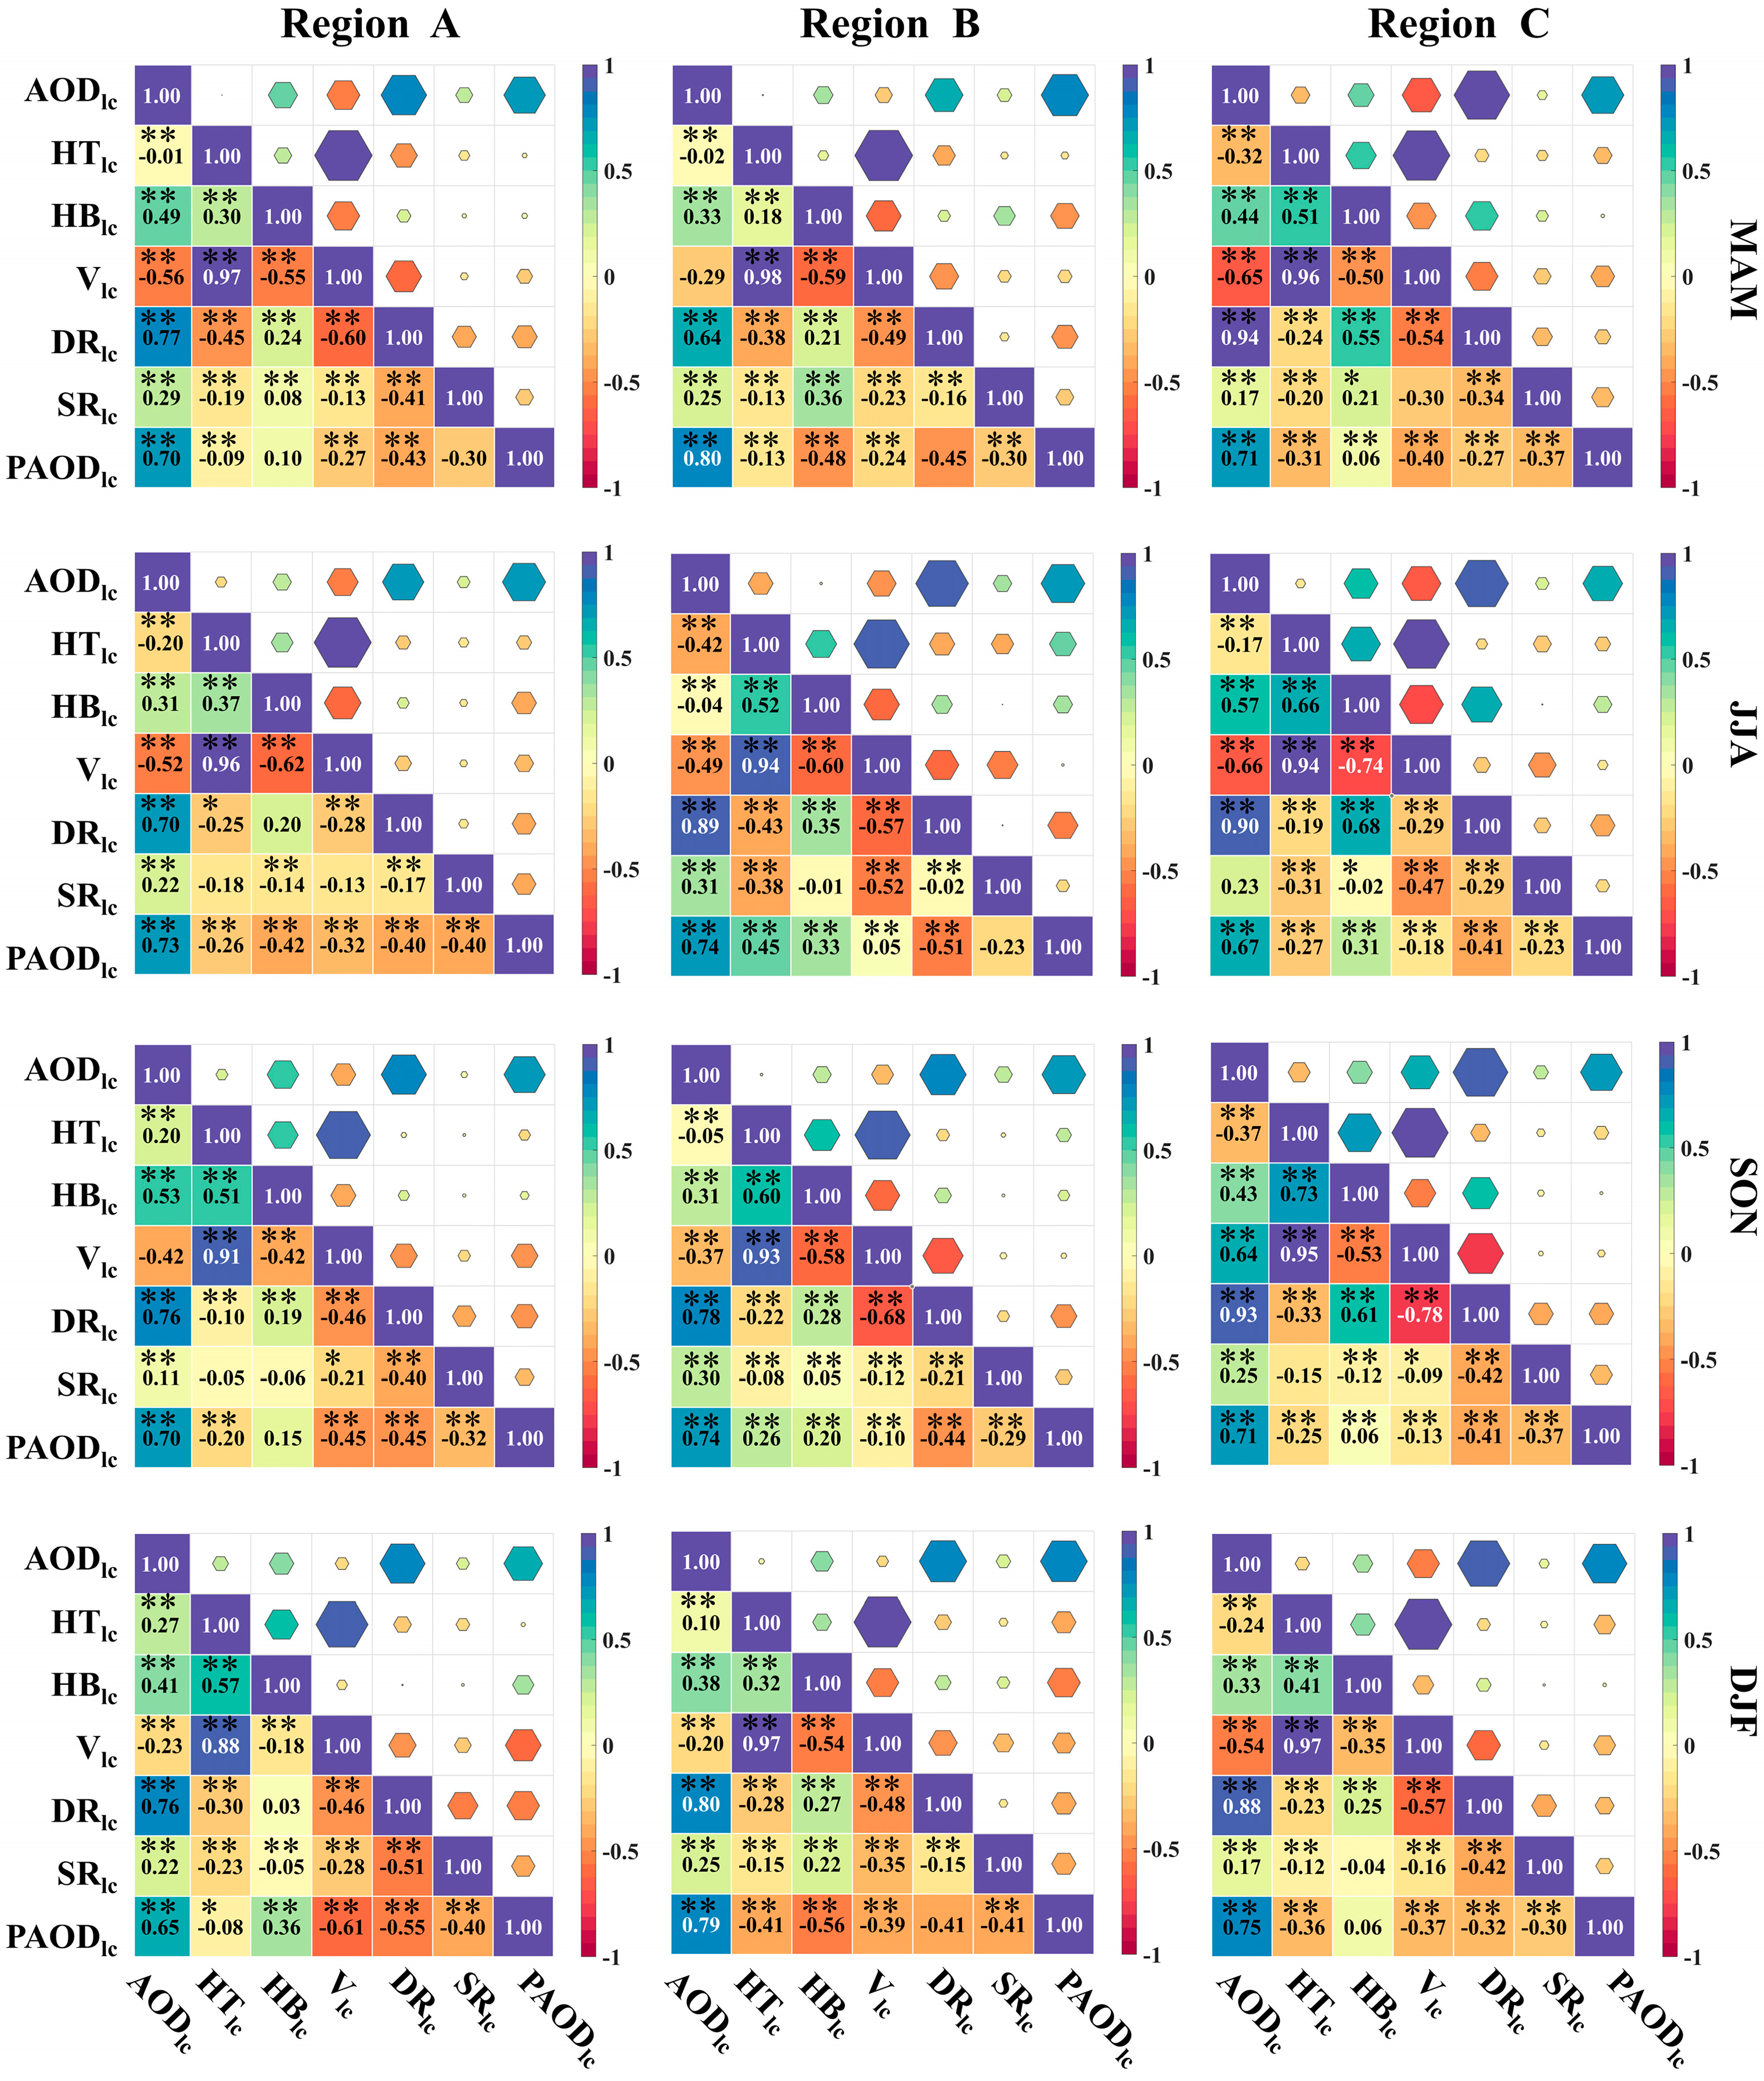
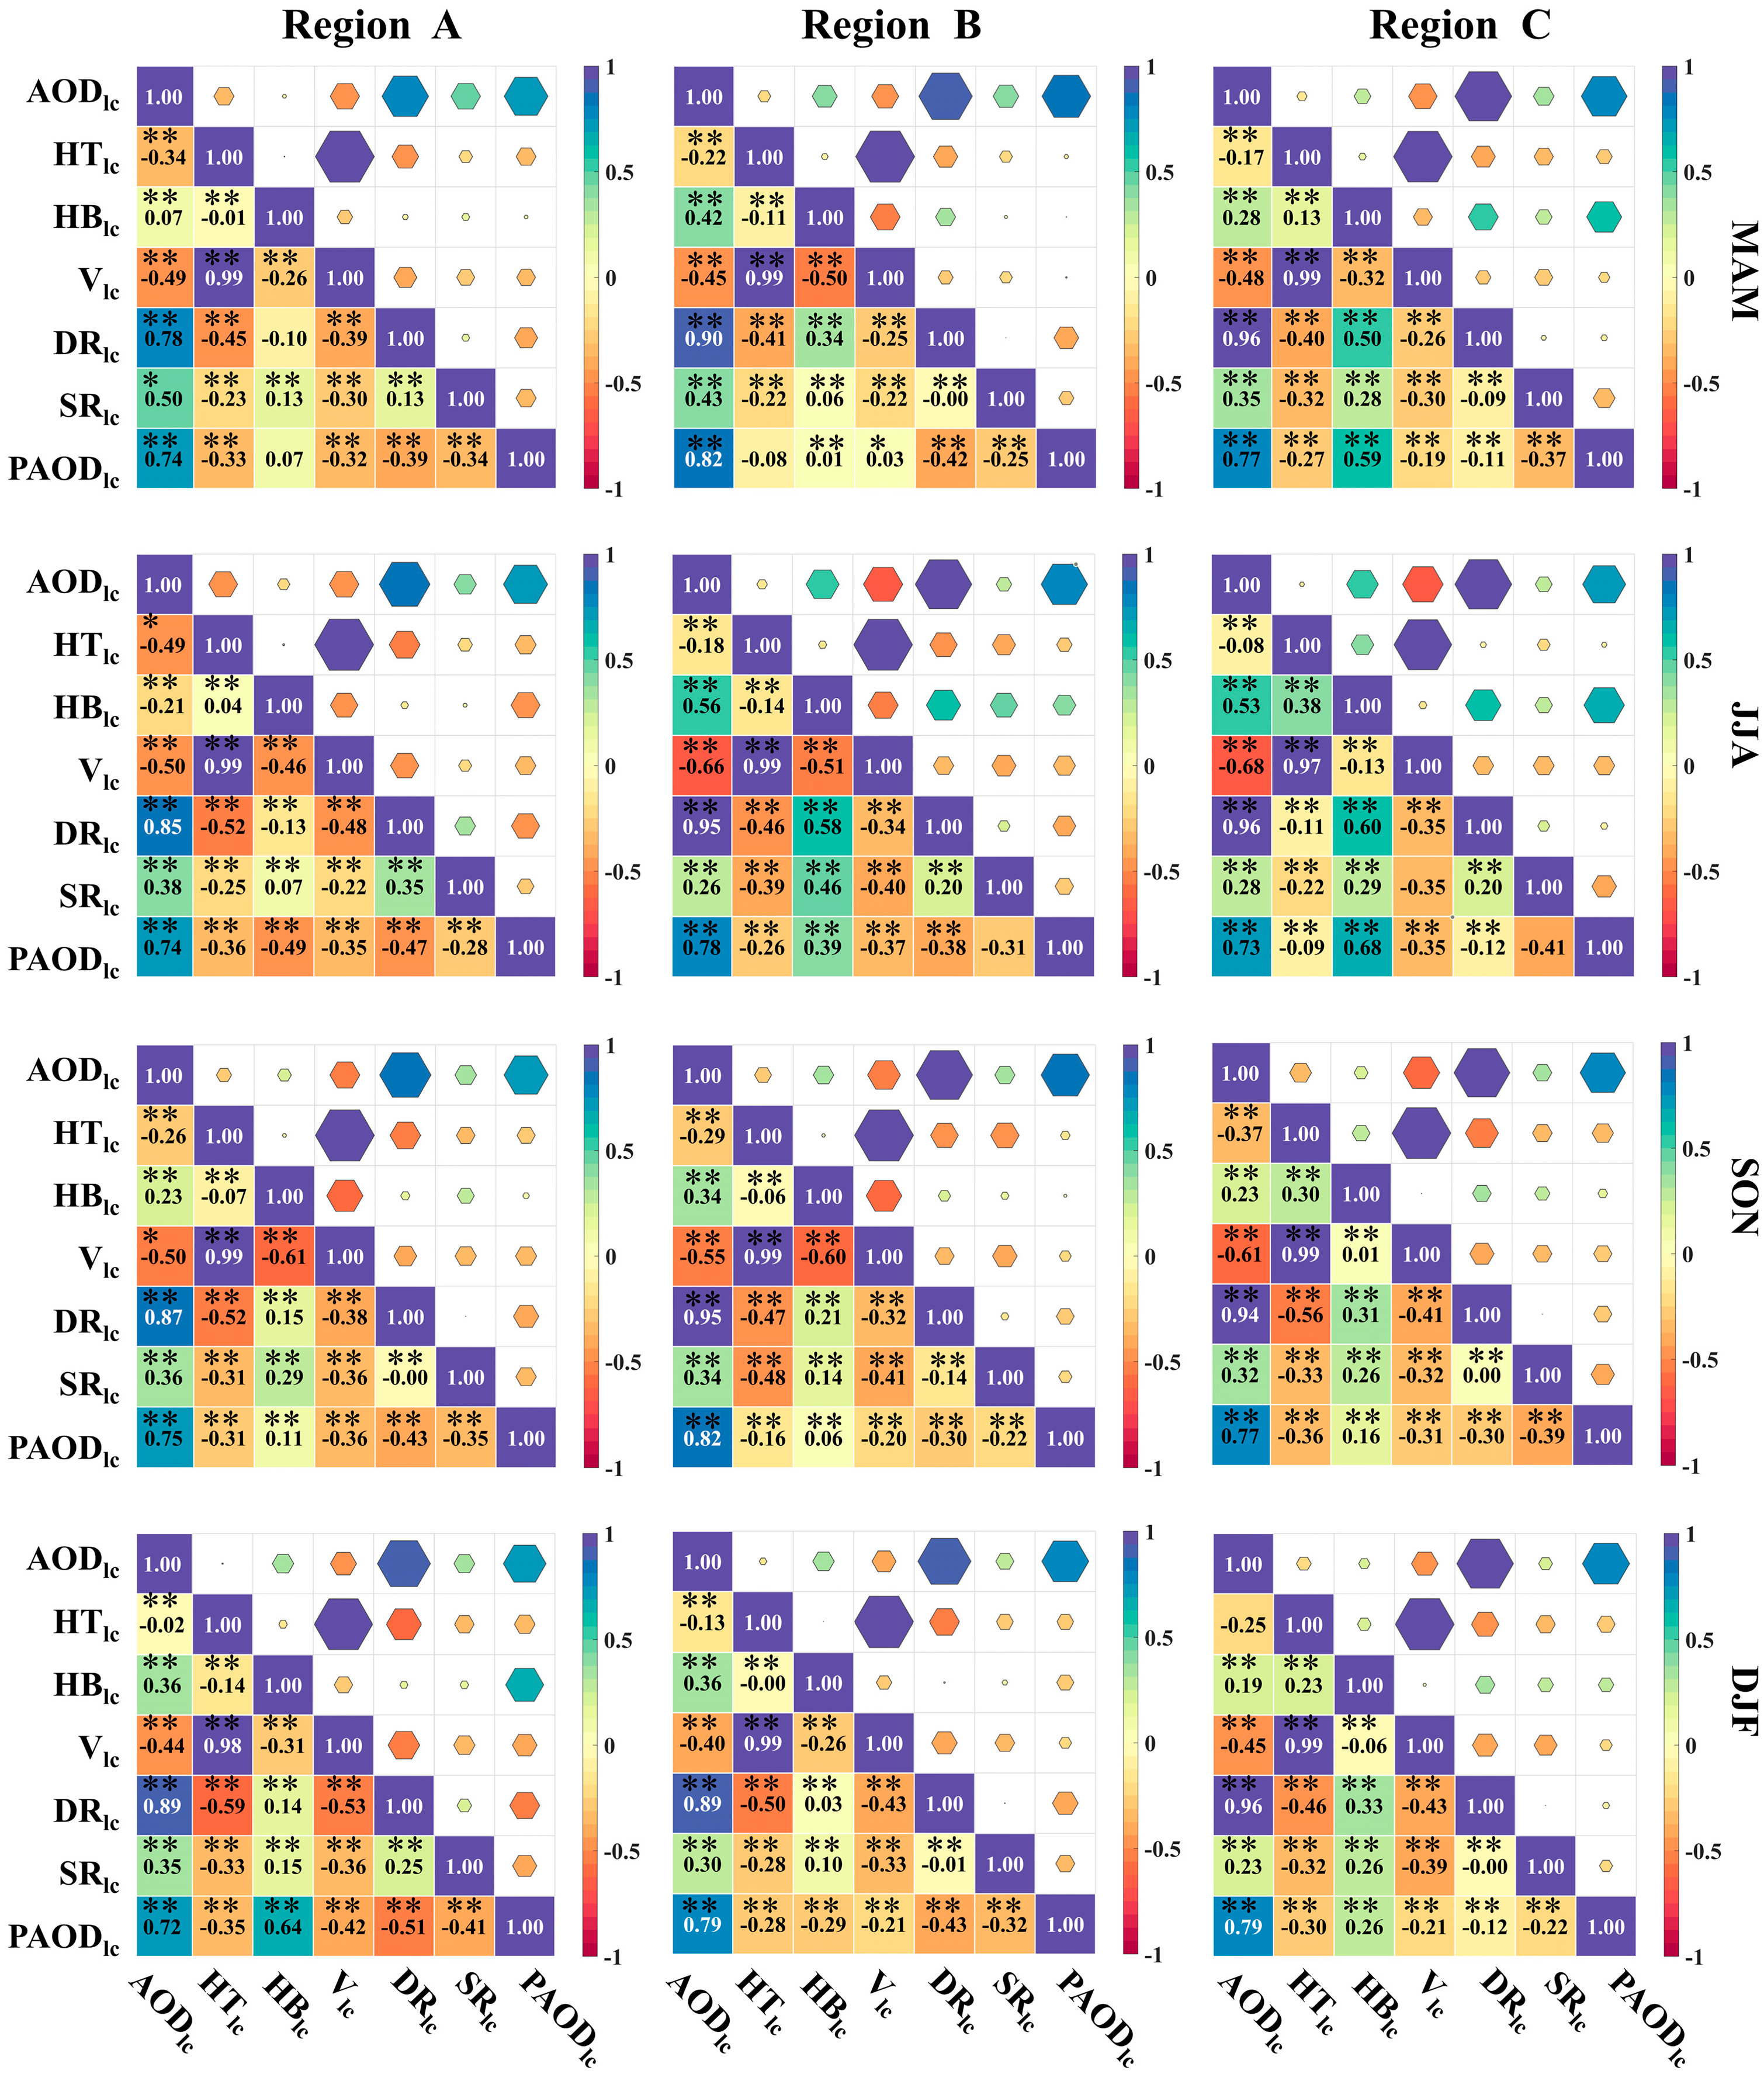
3.2. Spatiotemporal Correlation Analysis of the Optical Properties of Low Clouds
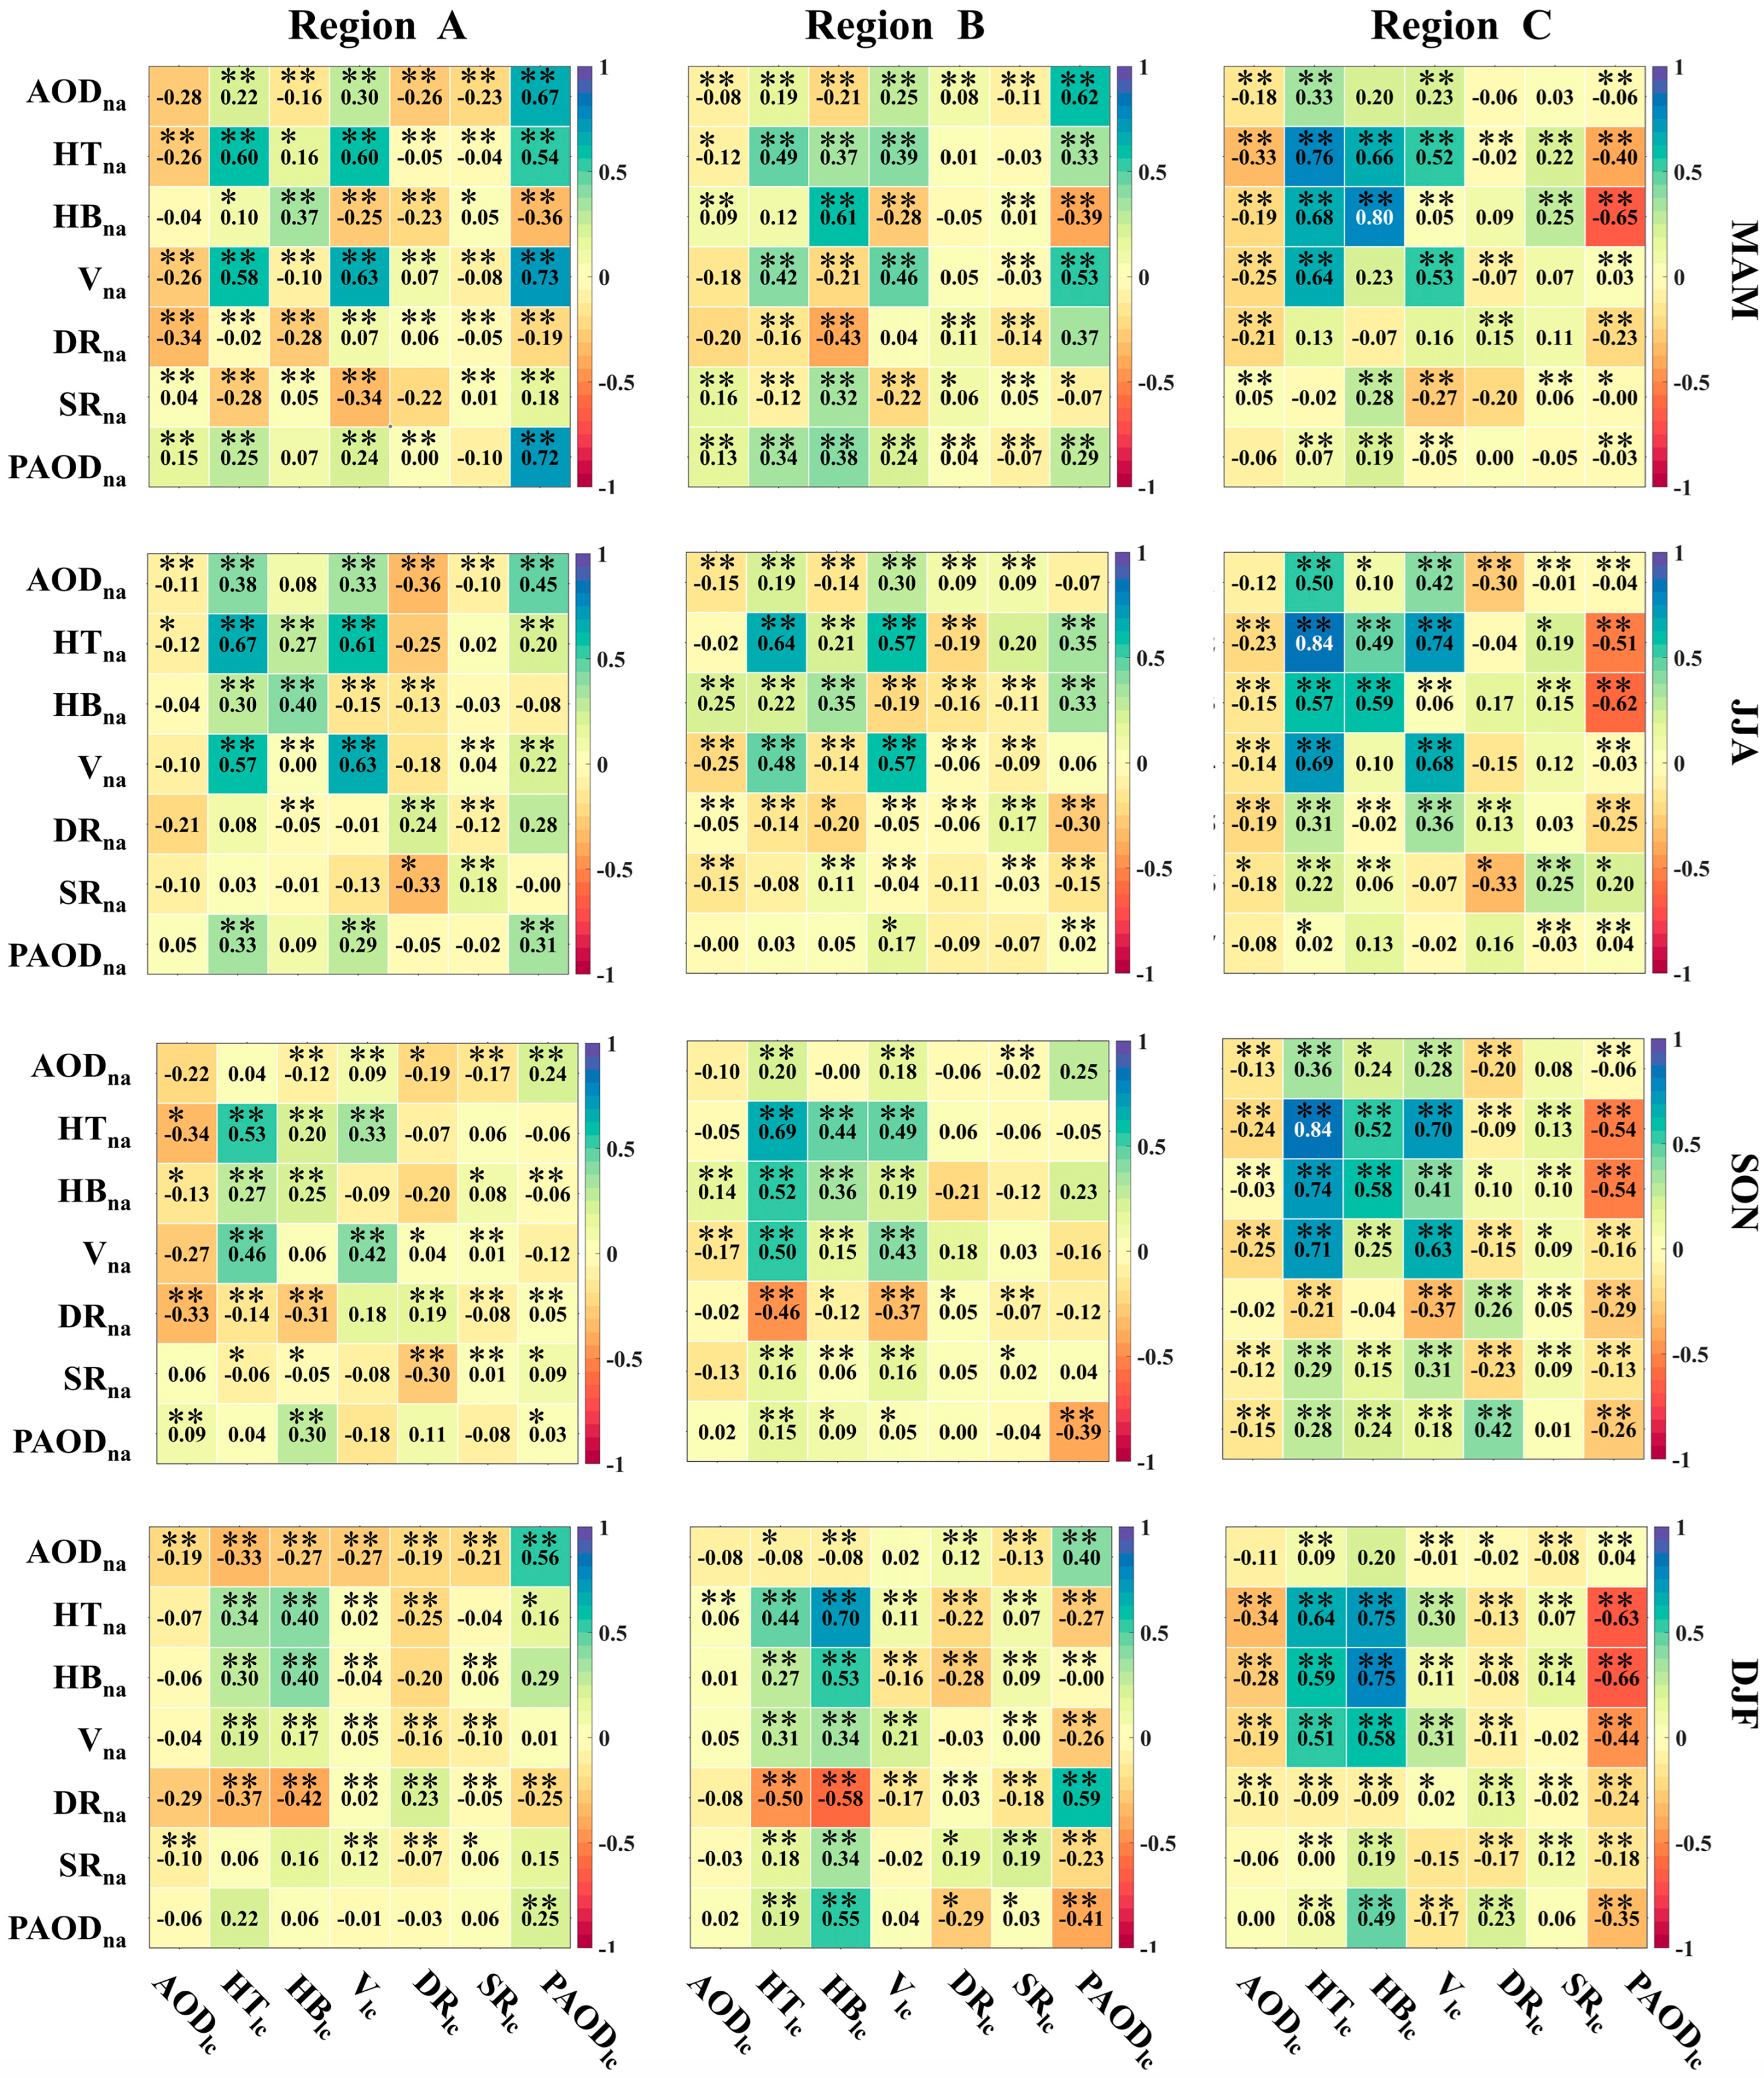
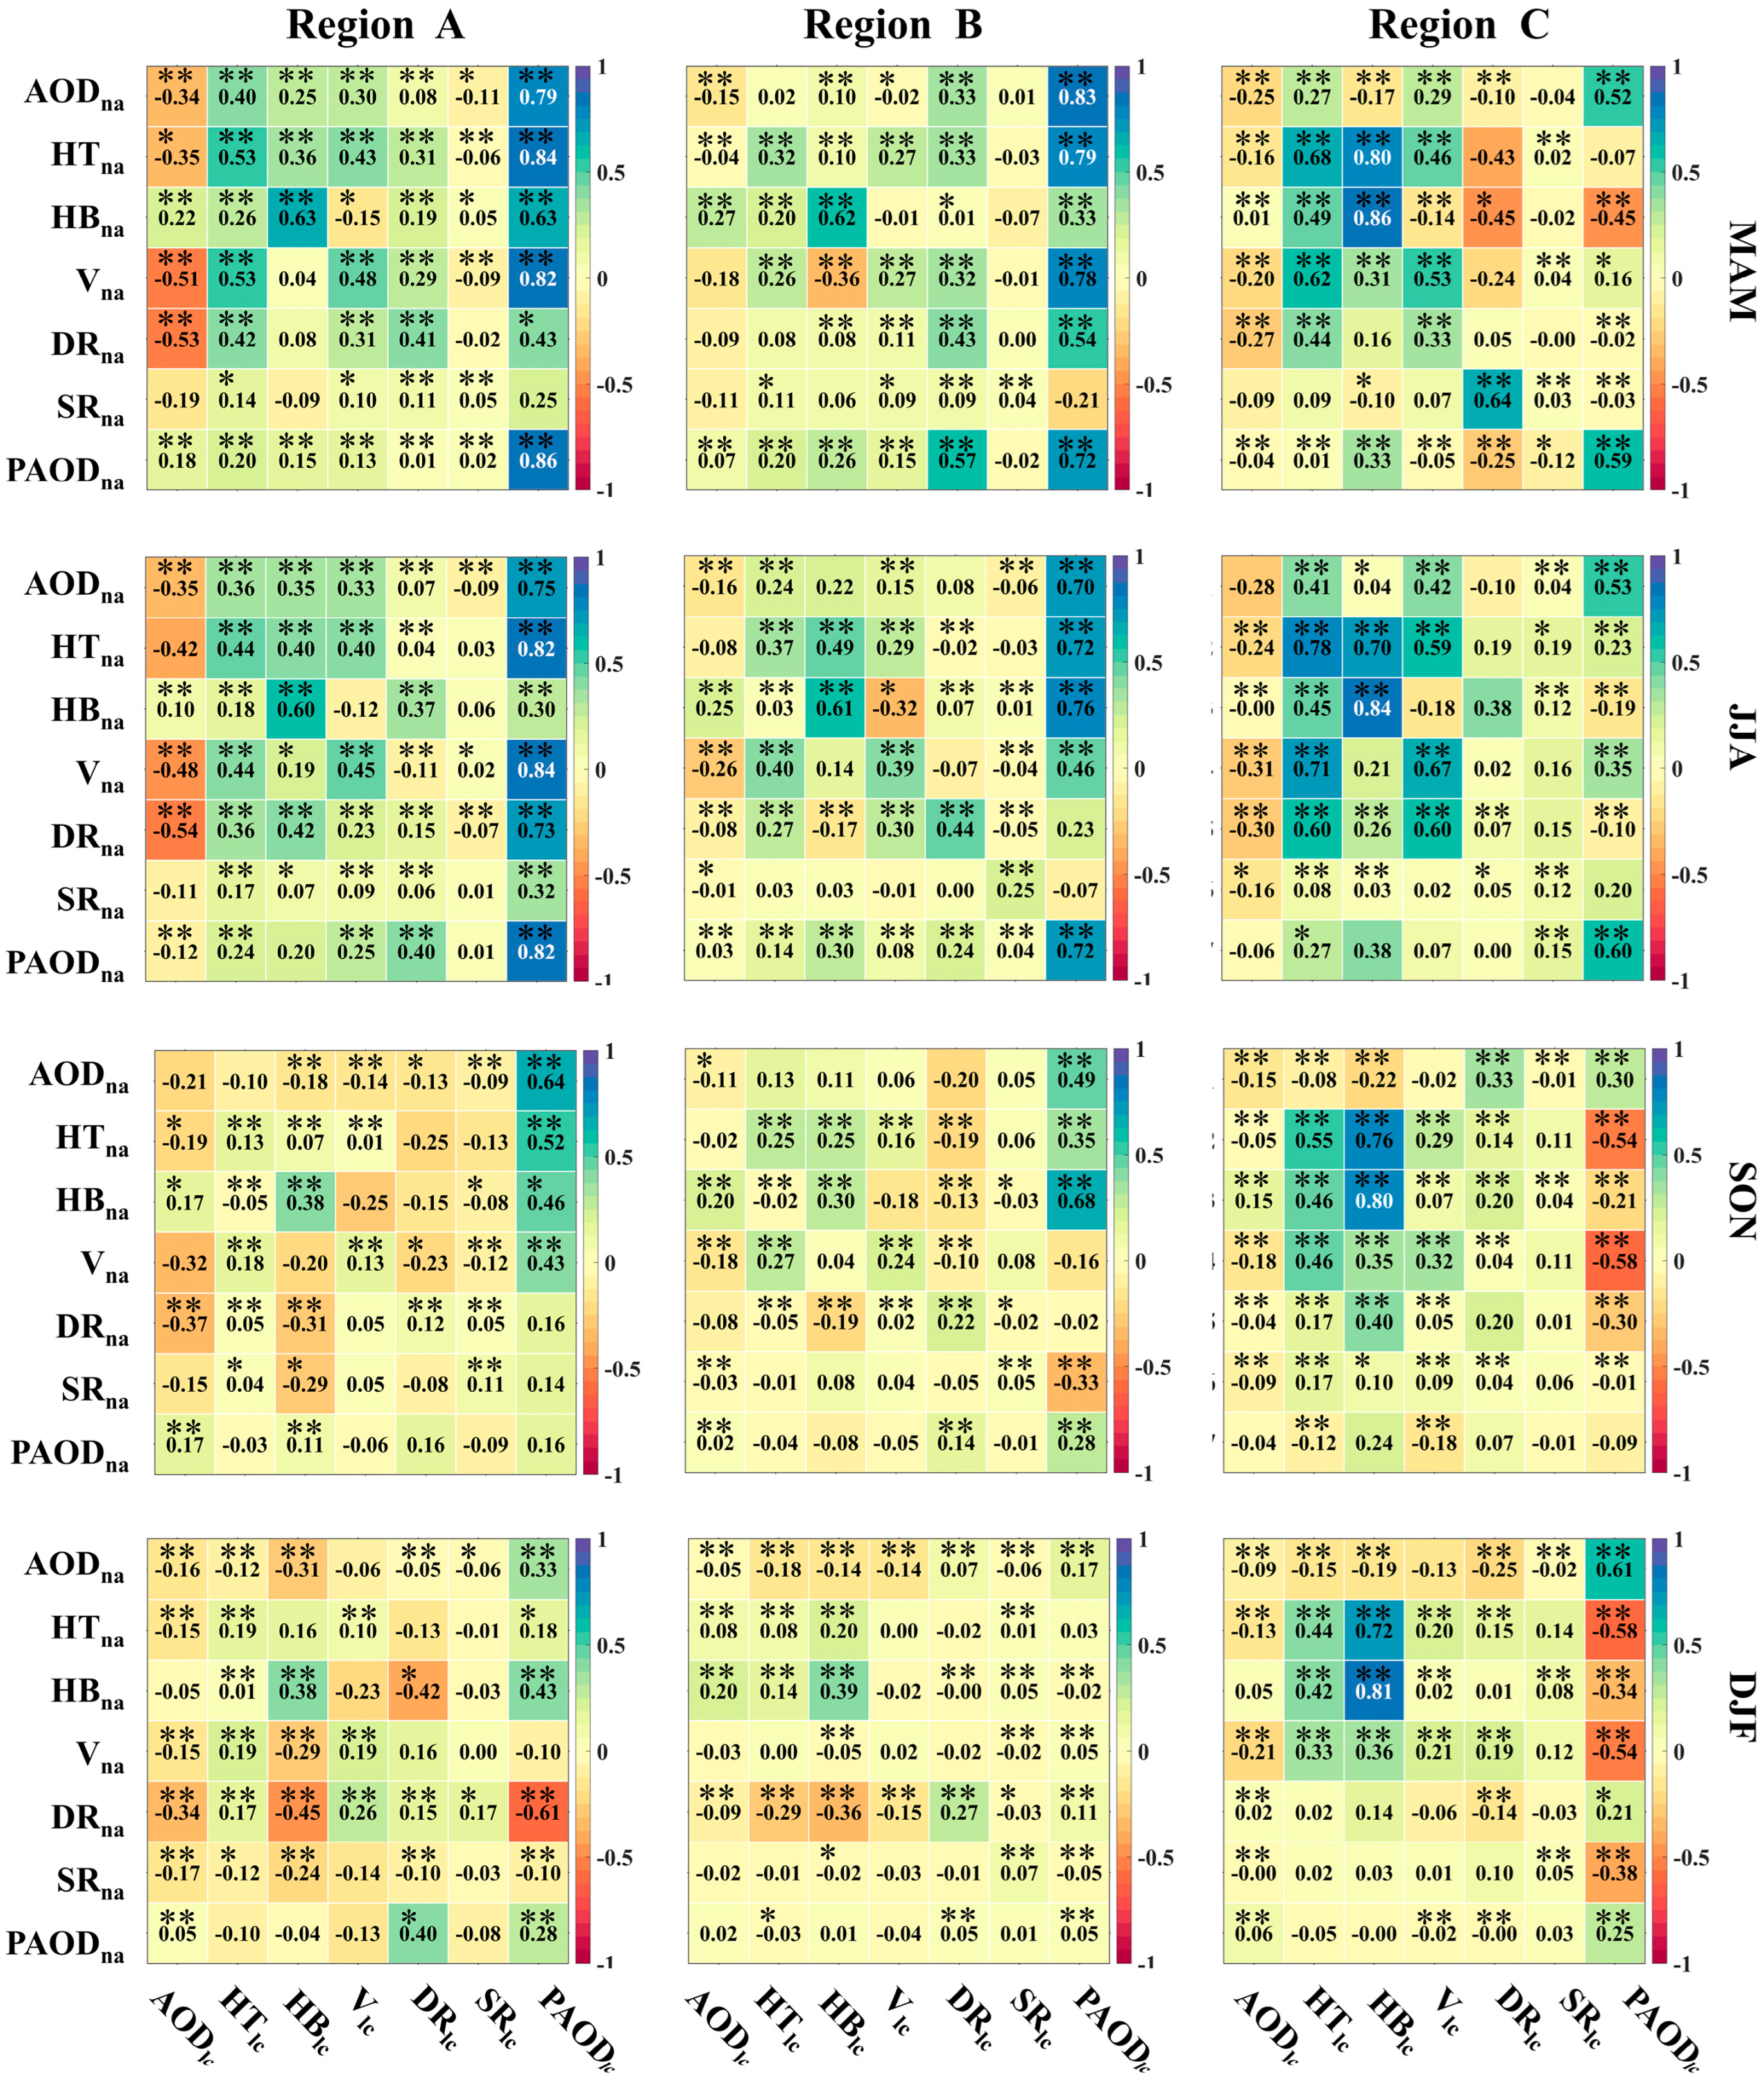
3.3. Interrelation of Properties Between Low Clouds and the Lowest Aerosol Layer
4. Conclusions
- (1)
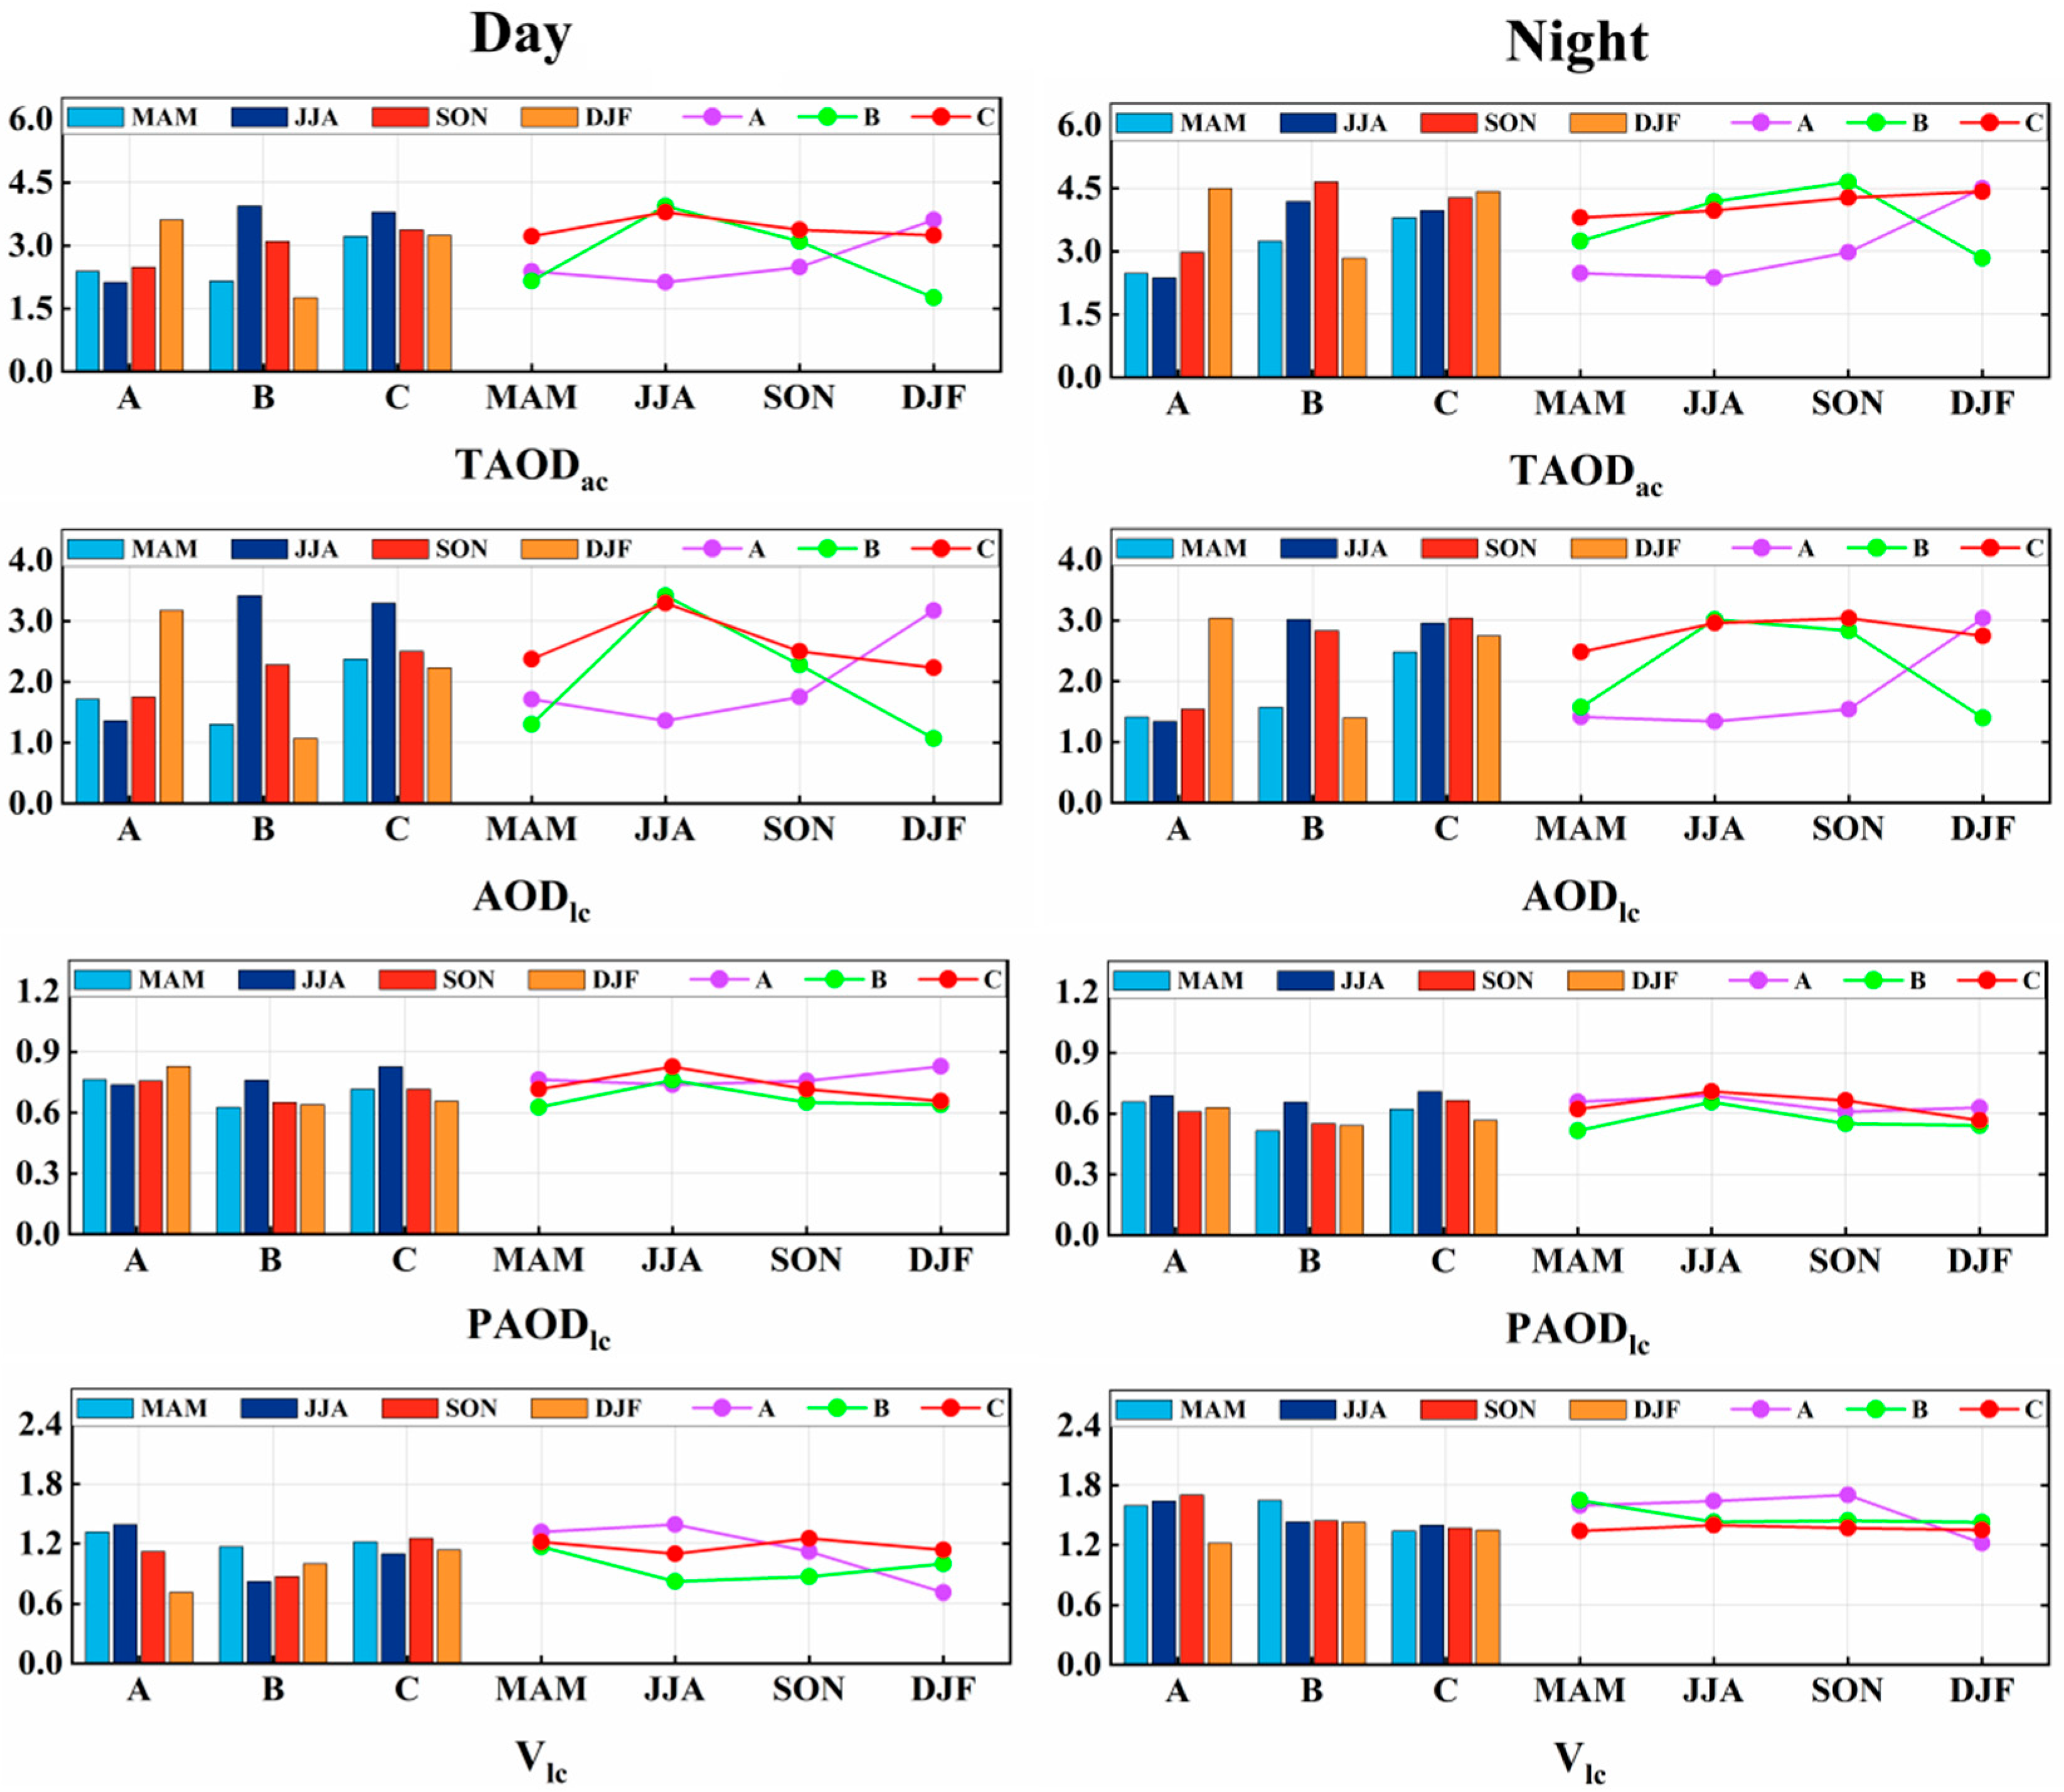
- AODlc (Low-cloud AOD) exhibited distinct seasonal patterns, peaking in the DJF season in Region A, June–November in Regions B and C, and dry seasons overall. The PAODlc (Low-cloud AOD Proportion) results mirrored this trend, with significant increases in the dry seasons across North and Southern Africa but remaining stable in Central Africa. Both parameters showed diurnal variation with higher values in the daytime, probably driven by solar radiation and thermal convection. A strong positive correlation between AODlc and PAODlc persisted continent-wide.
- (2)
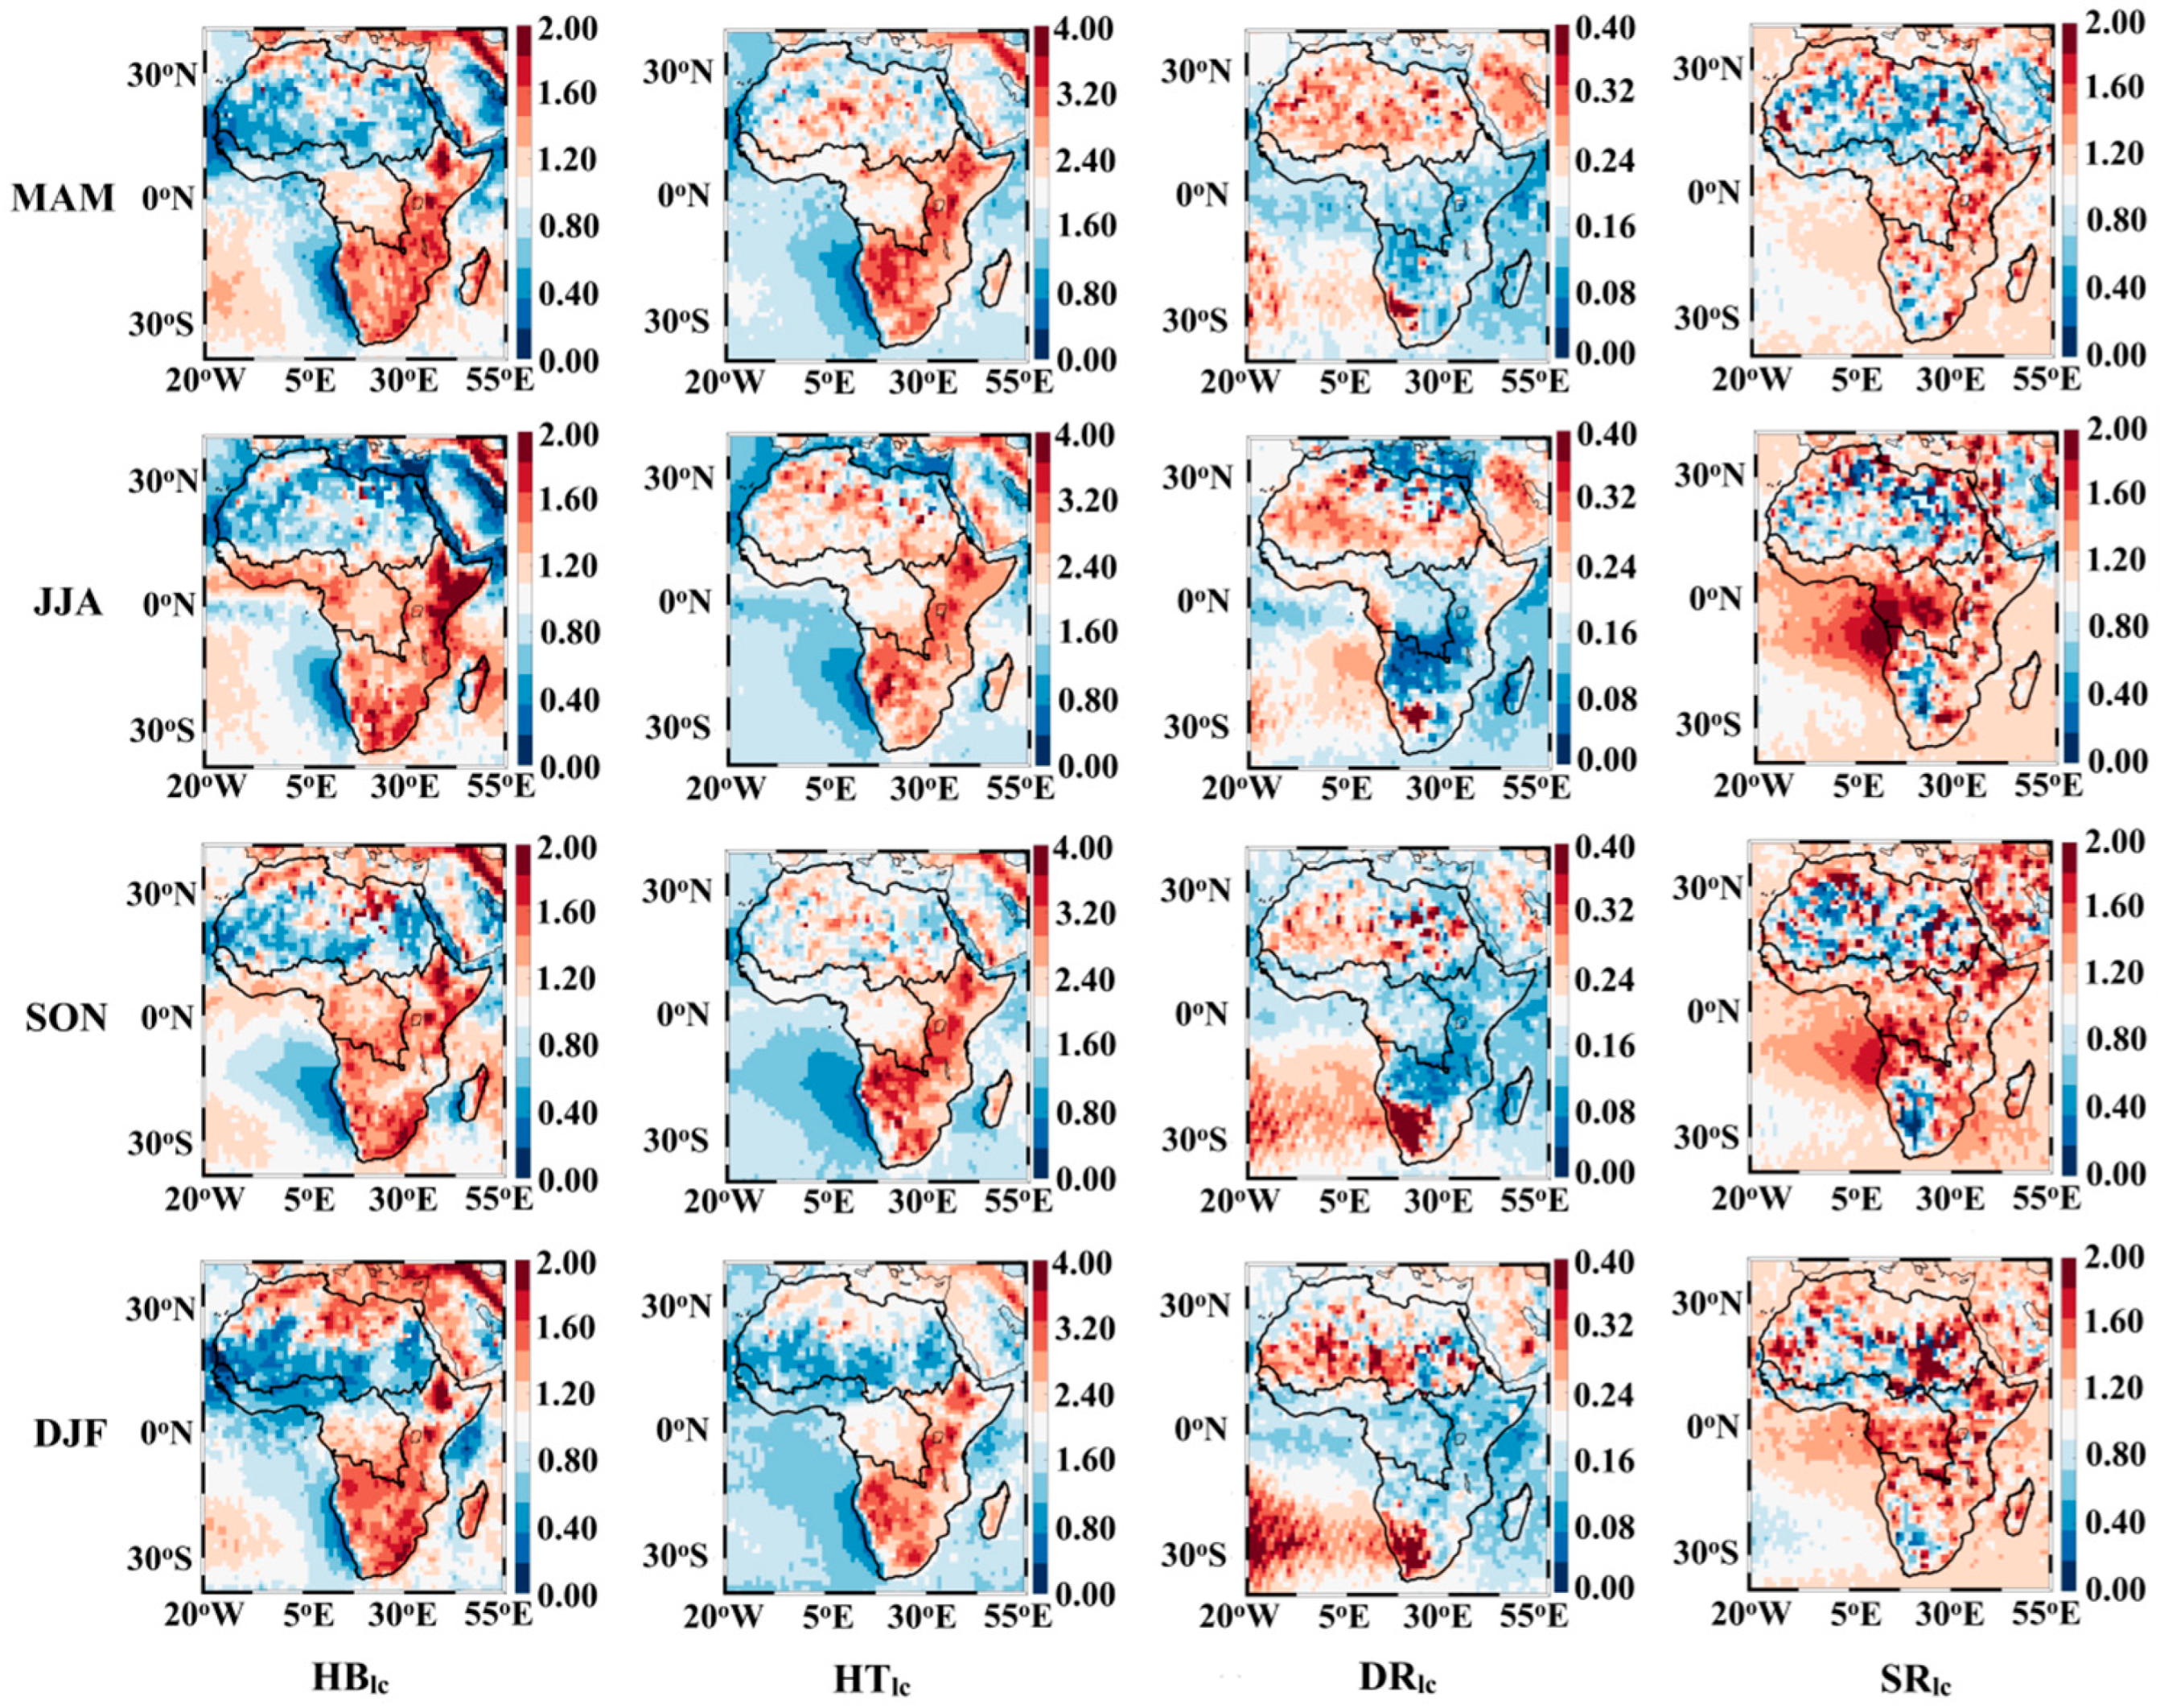
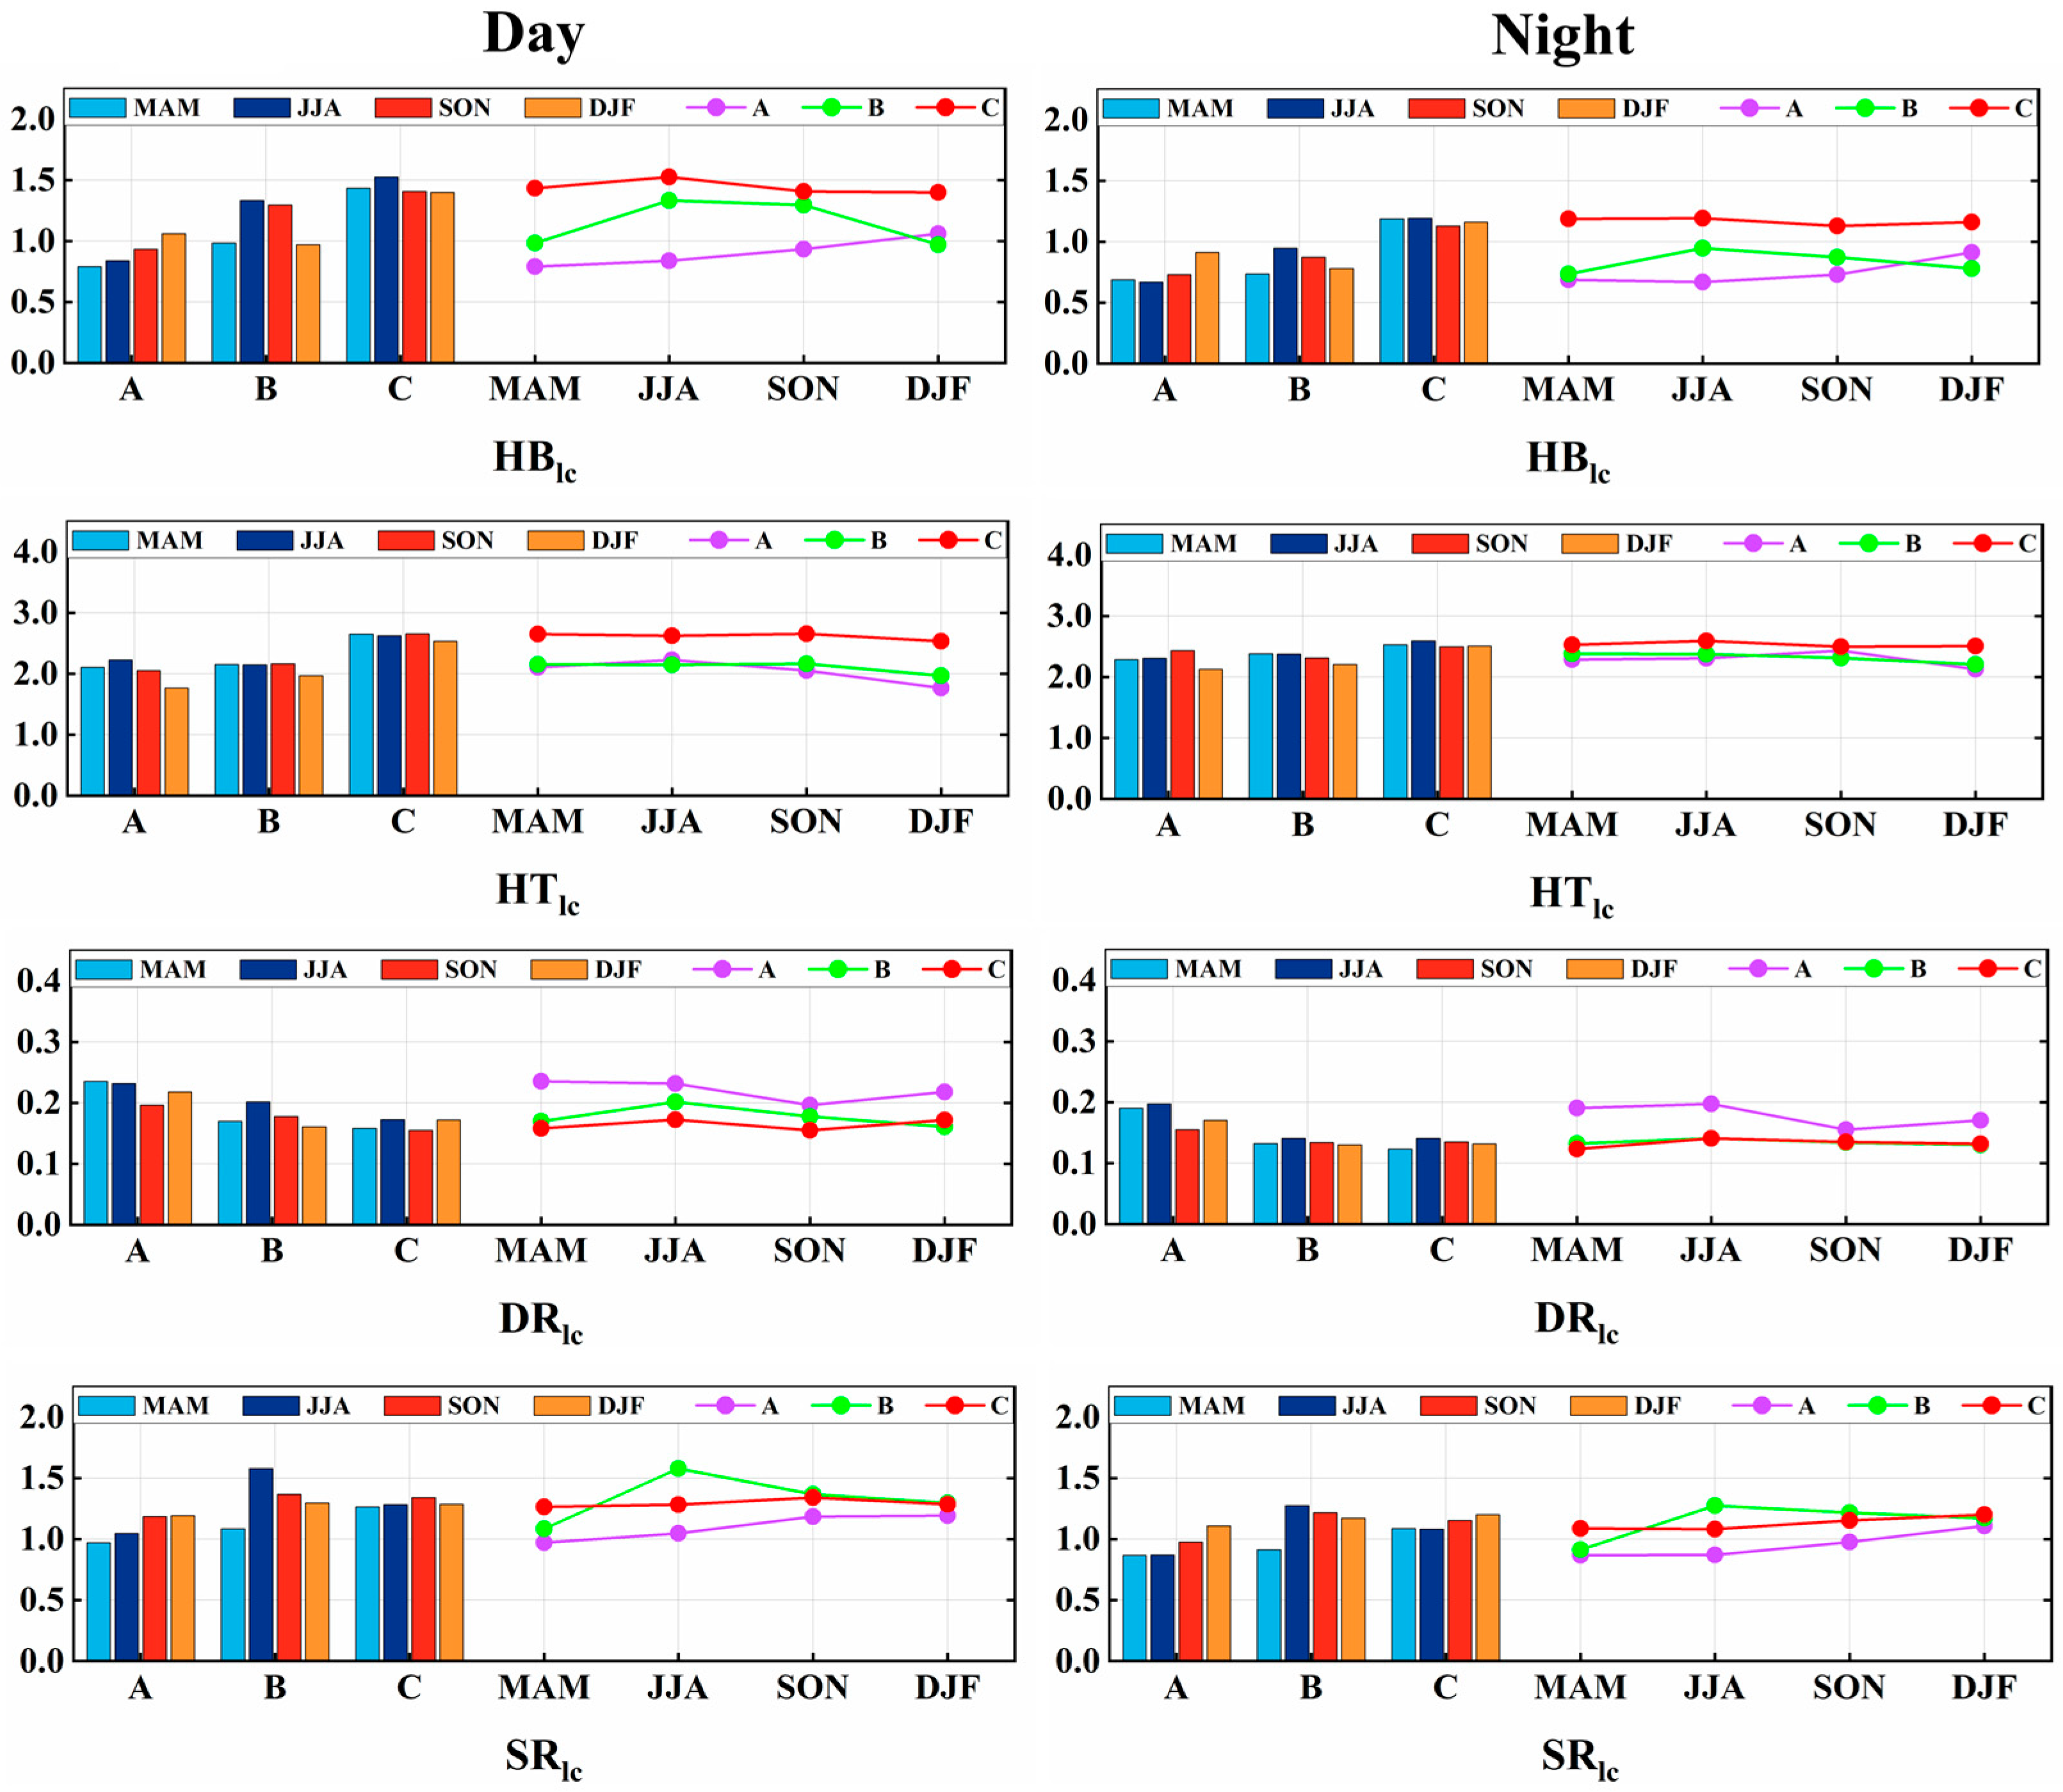
- HBlc (Low-cloud base height) and HTlc (Low-cloud top height) showed significant regional disparities over Africa. Seasonally averaged values were highest in Region C and lowest in Region A, with Region B showing intermediate values. In temporal terms, HBlc peaked during the daytime, an effect that is likely to be associated with surface heating and temperature inversion layers, while HTlc increased at night under stable atmospheric conditions enhanced by radiative cooling. Strong positive correlations emerged between HTlc and Vlc (Low-cloud vertical depth) indicating vertical expansion with cloud deepening. Conversely, HBlc displayed moderate negative correlations with Vlc, with notable seasonal and regional variations.
- (3)
- A spatial analysis of DRlc (Low-cloud depolarization ratio) revealed distinct patterns: elevated values over desert regions contrasted with lower DRlc in the Central African rainforest, East African Plateau, and coastal zones. In temporal terms, nighttime DRlc values generally exceeded those during the daytime, a finding that is likely to be linked to nocturnal cloud stabilisation promoting a more spherical cloud particle morphology. Regional variations emerged in the positive correlations between AODlc and DRlc; these peaked in Region C, followed by Region B, and were minimal in Region A. Vlc showed an overall negative correlation with DRlc, with stronger associations during dry seasons than rainy seasons.
- (4)
- A spatiotemporal analysis of SRlc (Low-cloud spectral reflectance ratio) demonstrated distinct geographical gradients: The maximum values occurred in Region B, followed by Region C, while Region A had minimal SRlc values. All three regions showed consistent seasonal patterns, with higher wet-season SRlc compared to dry-season values. On a diurnal basis, enhanced solar radiation and intensified convective activity during the daytime probably promoted water vapor evaporation and the formation of larger cloud particles, resulting in systematically higher daytime SRlc than nocturnal measurements.
- (5)
- Observational analyses revealed pronounced positive correlations between AODna (Near-surface aerosol AOD) and PAODlc in North Africa (Region A) and Central Africa (Region B). Simultaneously, HTna (Near-surface aerosol layer top height) showed positive correlations with HBlc and Vlc across all three regions, while HBna (Near-surface aerosol layer top height) was positively correlated with HBlc, with these relationships demonstrating analogous regional and seasonal patterns. In addition, there were negative correlations in Region C between HBna/HTna and PAODlc. During spring in Region A, strong positive correlations emerged between Vna (Near-surface aerosol layer vertical depth) and PAODlc, as well as between PAODna and PAODlc.
Author Contributions
Funding
Institutional Review Board Statement
Informed Consent Statement
Data Availability Statement
Acknowledgments
Conflicts of Interest
Appendix A

| Type | Parameter | Abbreviation |
|---|---|---|
| Aerosol | Total AOD across all aerosol layers | TAODaa |
| Near-surface aerosol AOD | AODna | |
| Near-surface aerosol proportion | PAODna | |
| Near-surface aerosol layer bottom height | HBna | |
| Near-surface aerosol layer top height | HTna | |
| Near-surface aerosol layer vertical depth | Vna | |
| Near-surface aerosol layer depolarization ratio | DRna | |
| Near-surface aerosol layer spectral reflectance ratio | SRna | |
| Cloud | Total AOD across all cloud layers | TAODac |
| All Cloud sampling data from satellite observations | SDac | |
| Low-cloud sampling data from satellite observations | SDlc | |
| Low-cloud occurrence frequency | OFlc | |
| Low-cloud AOD | AODlc | |
| Low-cloud top height | HTlc | |
| Low-cloud base height | HBlc | |
| Low-cloud vertical depth | Vlc | |
| Low-cloud depolarization ratio | DRlc | |
| Low-cloud spectral reflectance ratio | SRlc | |
| Low-cloud AOD Proportion | PAODlc |
| Parameter | Elevation Selection Range (km) |
|---|---|
| HBlc, HBna | 0~2.5 |
| DRlc, DRna | 0~5 |
| SRlc, SRla | 0~10 |
| AODlc, AODna | 0~20 |
| TAODc, TAODa | 0~30 |
| Vlc, Vna | 0~30 |
Appendix B
| Region | Season | Day | |||||||
|---|---|---|---|---|---|---|---|---|---|
| TAODac | AODlc | HTlc | HBlc | Vlc | DRlc | SRlc | PAODlc | ||
| A | MAM | 2.38 ± 3.16 | 1.71 ± 2.89 | 2.11 ± 0.62 | 0.79 ± 0.62 | 1.32 ± 1.00 | 0.24 ± 0.15 | 0.97 ± 1.18 | 0.76 ± 0.31 |
| JJA | 2.13 ± 2.45 | 1.36 ± 1.90 | 2.23 ± 0.95 | 0.84 ± 0.60 | 1.39 ± 1.00 | 0.23 ± 0.16 | 1.05 ± 1.37 | 0.74 ± 0.32 | |
| SON | 2.48 ± 3.24 | 1.75 ± 2.94 | 2.05 ± 0.90 | 0.93 ± 0.67 | 1.12 ± 0.86 | 0.20 ± 0.17 | 1.18 ± 1.30 | 0.76 ± 0.32 | |
| DJF | 3.61 ± 4.54 | 3.17 ± 4.56 | 1.77 ± 0.84 | 1.06 ± 0.74 | 0.71 ± 0.53 | 0.22 ± 0.17 | 1.19 ± 0.94 | 0.83 ± 0.30 | |
| B | MAM | 2.16 ± 2.76 | 1.30 ± 2.23 | 2.16 ± 0.86 | 0.99 ± 0.64 | 1.17 ± 0.95 | 0.17 ± 0.16 | 1.08 ± 1.20 | 0.63 ± 0.33 |
| JJA | 3.94 ± 4.77 | 3.42 ± 4.76 | 2.15 ± 0.72 | 1.34 ± 0.56 | 0.82 ± 0.76 | 0.20 ± 0.18 | 1.58 ± 1.17 | 0.76 ± 0.31 | |
| SON | 3.10 ± 3.90 | 2.28 ± 3.75 | 2.16 ± 0.79 | 1.30 ± 0.61 | 0.87 ± 0.79 | 0.18 ± 0.20 | 1.37 ± 1.16 | 0.65 ± 0.34 | |
| DJF | 1.76 ± 2.52 | 1.07 ± 2.06 | 1.97 ± 0.88 | 0.97 ± 0.64 | 1.00 ± 0.83 | 0.16 ± 0.16 | 1.30 ± 1.27 | 0.64 ± 0.33 | |
| C | MAM | 3.22 ± 3.84 | 2.38 ± 3.71 | 2.65 ± 0.86 | 1.44 ± 0.63 | 1.22 ± 0.89 | 0.16 ± 0.20 | 1.27 ± 1.28 | 0.72 ± 0.34 |
| JJA | 3.80 ± 4.63 | 3.30 ± 4.64 | 2.62 ± 0.78 | 1.53 ± 0.66 | 1.10 ± 0.84 | 0.17 ± 0.17 | 1.28 ± 1.08 | 0.83 ± 0.29 | |
| SON | 3.37 ± 4.04 | 2.50 ± 3.94 | 2.66 ± 0.89 | 1.41 ± 0.62 | 1.25 ± 0.92 | 0.16 ± 0.22 | 1.34 ± 1.31 | 0.72 ± 0.34 | |
| DJF | 3.24 ± 3.66 | 2.23 ± 3.47 | 2.53 ± 0.92 | 1.40 ± 0.63 | 1.13 ± 0.87 | 0.17 ± 0.24 | 1.29 ± 1.30 | 0.66 ± 0.35 | |
| Region | Season | Night | |||||||
|---|---|---|---|---|---|---|---|---|---|
| TAODac | AODlc | HTlc | HBlc | Vlc | DRlc | SRlc | PAODlc | ||
| A | MAM | 2.47 ± 2.93 | 1.42 ± 2.33 | 2.29 ± 1.46 | 0.69 ± 0.51 | 1.60 ± 1.41 | 0.19 ± 0.09 | 0.87 ± 1.26 | 0.66 ± 0.36 |
| JJA | 2.37 ± 2.68 | 1.34 ± 1.98 | 2.31 ± 1.50 | 0.67 ± 0.50 | 1.64 ± 1.45 | 0.20 ± 0.08 | 0.87 ± 1.24 | 0.69 ± 0.35 | |
| SON | 2.97 ± 3.06 | 1.54 ± 2.40 | 2.43 ± 1.54 | 0.73 ± 0.56 | 1.70 ± 1.52 | 0.16 ± 0.10 | 0.98 ± 1.35 | 0.61 ± 0.38 | |
| DJF | 4.49 ± 4.02 | 3.04 ± 4.11 | 2.13 ± 1.25 | 0.91 ± 0.66 | 1.22 ± 1.19 | 0.17 ± 0.11 | 1.11 ± 1.24 | 0.63 ± 0.40 | |
| B | MAM | 3.24 ± 3.27 | 1.57 ± 2.39 | 2.38 ± 1.76 | 0.73 ± 0.54 | 1.65 ± 1.73 | 0.13 ± 0.09 | 0.13 ± 1.25 | 0.52 ± 0.34 |
| JJA | 4.18 ± 4.16 | 3.02 ± 3.95 | 2.38 ± 1.33 | 0.77 ± 0.60 | 1.43 ± 1.24 | 0.14 ± 0.11 | 1.28 ± 1.26 | 0.66 ± 0.35 | |
| SON | 4.65 ± 3.89 | 2.83 ± 3.60 | 2.32 ± 1.54 | 0.87 ± 0.59 | 1.44 ± 1.49 | 0.13 ± 0.11 | 1.22 ± 1.34 | 0.55 ± 0.36 | |
| DJF | 2.82 ± 3.12 | 1.40 ± 2.29 | 2.21 ± 1.53 | 0.78 ± 0.56 | 1.43 ± 1.46 | 0.13 ± 0.09 | 1.17 ± 1.42 | 0.54 ± 0.35 | |
| C | MAM | 3.80 ± 3.66 | 2.48 ± 3.46 | 2.53 ± 1.27 | 1.19 ± 0.62 | 1.34 ± 1.16 | 0.12 ± 0.11 | 1.09 ± 1.21 | 0.62 ± 0.37 |
| JJA | 3.97 ± 4.03 | 2.96 ± 4.04 | 2.59 ± 1.19 | 1.19 ± 0.65 | 1.40 ± 1.02 | 0.14 ± 0.11 | 1.08 ± 1.14 | 0.71 ± 0.36 | |
| SON | 4.27 ± 4.10 | 3.04 ± 4.07 | 2.50 ± 1.29 | 1.13 ± 0.60 | 1.37 ± 1.13 | 0.14 ± 0.12 | 1.15 ± 1.25 | 0.67 ± 0.37 | |
| DJF | 4.42 ± 3.85 | 2.75 ± 3.69 | 2.51 ± 1.35 | 1.16 ± 0.60 | 1.35 ± 1.22 | 0.13 ± 0.12 | 1.20 ± 1.32 | 0.57 ± 0.37 | |
References
- Kaufman, Y.J.; Tanre, D.; Boucher, O. A satellite view of aerosols in the climate system. Nature 2002, 419, 215–223. [Google Scholar] [CrossRef] [PubMed]
- Stevens, B.; Feingold, G. Untangling aerosol effects on clouds and precipitation in a buffered system. Nature 2009, 461, 607–613. [Google Scholar] [CrossRef]
- Novakov, T.; Penner, J.E. Large contribution of organic aerosols to cloud-condensation-nuclei concentrations. Nature 1993, 365, 823–826. [Google Scholar] [CrossRef]
- Jimenez, J.L.; Canagaratna, M.R.; Donahue, N.M.; Prevot, A.S.H.; Zhang, Q. Evolution of Organic Aerosols in the Atmosphere. Science 2009, 326, 1525–1529. [Google Scholar] [CrossRef]
- Bellouin, N.; Boucher, O.; Haywood, J.; Reddy, M.S. Global estimate of aerosol direct radiative forcing from satellite measurements. Nature 2005, 438, 1138–1141. [Google Scholar] [CrossRef] [PubMed]
- Ramanathan, V.; Crutzen, P.J.; Kiehl, J.T.; Rosenfeld, D. Aerosols, Climate, and the Hydrological Cycle. Science 2001, 294, 2119–2124. [Google Scholar] [CrossRef]
- Anderson, T.L. Atmospheric science. Climate forcing by aerosol—A hazy picture. Science 2003, 300, 1103–1104. [Google Scholar] [CrossRef]
- Li, Z.; Guo, J.; Ding, A.; Liao, H.; Zhu, B. Aerosol and boundary-layer interactions and impact on air quality. Natl. Sci. Rev. 2017, 4, 810–833. [Google Scholar] [CrossRef]
- Sherwood, S.; Rosenfeld, D.; Donner, L.; Wood, R. Climate Effects of Aerosol-Cloud Interactions. Science 2014, 343, 379–380. [Google Scholar]
- Claeys, M.; Graham, B.; Vas, G.; Wang, W.; Vermeylen, R.; Pashynska, V.; Cafmeyer, J.; Cuyon, P.; Andreae, M.O.; Artaxo, P. Formation of Secondary Organic Aerosols Through Photooxidation of Isoprene. Science 2004, 303, 1173–1176. [Google Scholar] [CrossRef]
- Johnson, B.T.; Heese, B.; Mcfarlane, S.A.; Chazette, P.; Jones, A.; Bellouin, N. Vertical distribution and radiative effects of mineral dust and biomass burning aerosol over West Africa during DABEX. J. Geophys. Res. 2008, 113, D00C12. [Google Scholar] [CrossRef]
- Lee, S.S.; Donner, L.J.; Phillips, V.T.J. Cloud and aerosol effects on radiation in deep convective clouds: Comparison with warm stratiform clouds. Atmos. Chem. Phys. 2008, 8, 15291–15341. [Google Scholar]
- Leung, G.R.; Saleeby, S.M.; Sokolowsky, G.A.; Freeman, S.W.; Vandenheever, S. Aerosol–cloud impacts on aerosol detrainment and rainout in shallow maritime tropical clouds. Atmos. Chem. Phys. 2023, 23, 5263–5278. [Google Scholar] [CrossRef]
- Kiehl, J.T.; Briegleb, B.P. The relative roles of sulfate aerosols and greenhouse gases in climate forcing. Science 1993, 260, 311–314. [Google Scholar] [CrossRef]
- Toll, V.; Christensen, M.; Quaas, J.; Bellouin, N. Weak average liquid-cloud-water response to anthropogenic aerosols. Nature 2019, 572, 51–55. [Google Scholar] [CrossRef]
- Broccoli, A.J.; Klein, S.A. Comment on “Observational and Model Evidence for Positive Low-Level Cloud Feedback”. Science 2010, 329, 277. [Google Scholar] [CrossRef]
- Cess, R.D.; Potter, G.L.; Blanchet, J.P.; Boer, G.J.; Ghan, S.J.; Kiehl, J.T.; Le Treut, H.; Li, Z.X.; Liang, X.Z.; Mitchell, J.F.B. Interpretation of Cloud-Climate Feedback as Produced by 14 Atmospheric General Circulation Models. Science 1989, 245, 513–516. [Google Scholar] [CrossRef]
- Clement, A.C.; Burgman, R.; Norris, J.R. Observational and Model Evidence for Positive Low-Level Cloud Feedback. Science 2009, 325, 460–464. [Google Scholar] [CrossRef]
- Shikhovtsev, A.Y.; Khaikin, V.B.; Kovadlo, P.G.; Baron, P. Optical Thickness of the Atmosphere above the Terskol Peak. Atmos. Ocean. Opt. 2023, 36, 78–85. [Google Scholar] [CrossRef]
- Khaikin, V.B.; Shikhovtsev, A.Y.; Mironov, A.P. Statistical Characteristics of Precipitated Water Vapor, Optical Depth and Cloudiness in the Northern Part of Russia. Astron. Rep. 2024, 68, 222–232. [Google Scholar] [CrossRef]
- Breon, F.M. How Do Aerosols Affect Cloudiness and Climate? Science 2006, 313, 623–624. [Google Scholar] [CrossRef] [PubMed]
- Li, Z. Influence of Absorbing Aerosols on the Inference of Solar Surface Radiation Budget and Cloud Absorption. J. Clim. 1998, 11, 5–17. [Google Scholar] [CrossRef]
- Sato, Y.; Suzuki, K. How do aerosols affect cloudiness? Science 2019, 363, 580–581. [Google Scholar] [CrossRef] [PubMed]
- Winker, D. The CALIPSO Mission and Initial Observations of Clouds and Aerosols from CALIOP. Proc SPIE 2007, 6509, 1102–1110. [Google Scholar]
- Winker, D.M.; Pelon, J.; Mccormick, M.P. The CALIPSO mission: Spaceborne lidar for observation of aerosols and clouds. Proc SPIE 2003, 4893, 1211–1229. [Google Scholar]
- Kim, S.W.; Berthier, S.; Raut, J.C.; Chazette, P.; Dulac, F.; Yoon, S.C. Validation of aerosol and cloud layer structures from the space-borne lidar CALIOP using a ground-based lidar in Seoul, Korea. Atmos. Chem. Phys. 2008, 8, 3705–3720. [Google Scholar] [CrossRef]
- Pitts, M.C.; Thomason, L.W.; Poole, L.R.; Winker, D.M. Characterization of Polar Stratospheric Clouds with spaceborne lidar: CALIPSO and the 2006 Antarctic season. Atmos. Chem. Phys. 2007, 7, 5207–5228. [Google Scholar] [CrossRef]
- Ntwali, D.; Chen, H. Diurnal spatial distributions of aerosol optical and cloud micro-macrophysics properties in Africa based on MODIS observations. Atmos. Environ. 2018, 182, 252–262. [Google Scholar] [CrossRef]
- Lau, K.M.; Kim, K.M. Cooling of the Atlantic by Saharan dust. Geophys. Res. Lett. 2007, 34, L23811. [Google Scholar] [CrossRef]
- Middleton, N.J. Effect of drought on dust production in the Sahel. Nature 1985, 316, 431–434. [Google Scholar] [CrossRef]
- Getachew, B.; Manjunatha, B.R.; Gangadhara Bhat, H. Spatio-temporal distribution of aerosol optical depth and cloud properties over Lake Tana Basin, Upper Blue Nile River Basin, Ethiopia. Remote Sens. Appl. Soc. Environ. 2020, 20, 100401. [Google Scholar] [CrossRef]
- Nyasulu, M.; Haque, M.M.; Musonda, B.; Fang, C. The long-term spatial and temporal distribution of aerosol optical depth and its associated atmospheric circulation over Southeast Africa. Environ. Sci. Pollut. Res. 2022, 29, 30073–30089. [Google Scholar] [CrossRef] [PubMed]
- Gaetani, M.; Pohl, B.; Alvarez Castro, M.C.; Flamant, C.; Formenti, P. A weather regime characterisation of winter biomass aerosol transport from southern Africa. Atmos. Chem. Phys. 2021, 21, 16575–16591. [Google Scholar] [CrossRef]
- Virts, K.S.; Wallace, J.M.; Fu, Q.; Ackerman, T.P. Tropical Tropopause Transition Layer Cirrus as Represented by CALIPSO Lidar Observations. J. Atmos. Sci. 1912, 67, 3113–3129. [Google Scholar] [CrossRef]
- Lu, X.; Mao, F.; Rosenfeld, D.; Zhu, Y.; Pan, Z.; Gong, W. Satellite retrieval of cloud base height and geometric thickness of low-level cloud based on CALIPSO. Atmos. Chem. Phys. 2021, 21, 11979–12003. [Google Scholar] [CrossRef]
- Yuan, T.; Song, H.; Wood, R.; Oreopoulos, L.; Platnick, S.; Wang, C.; Yu, H.; Meyer, K.; Wilcox, E. Observational evidence of strong forcing from aerosol effect on low cloud coverage. Sci. Adv. 2023, 9, eadh7716. [Google Scholar] [CrossRef]
- García, M.I.; Drooge, B.L.V.; Rodríguez, S.; Alastuey, A. Speciation of organic aerosols in the Saharan Air Layer and in the free troposphere westerlies. Atmos. Chem. Phys. 2017, 14, 8939–8958. [Google Scholar] [CrossRef]
- Despiau, S.; Cougnenc, S.; Resch, F. Marine and atmospheric aerosol measurementson the mediterranean coast. J. Aerosol Sci. 1991, 22, S645–S648. [Google Scholar] [CrossRef]
- Ganor, E.; Levin, Z.; Grieken, R.V. Composition of individual aerosol particles above the Israelian Mediterranean coast during the summer time. Atmos. Environ. 1998, 32, 1631–1642. [Google Scholar] [CrossRef]
- Chakraborty, S.; Jiang, J.H.; Su, H.; Fu, R. On the role of aerosol radiative effect in the wet season onset timing over the Congo rainforest during boreal autumn. Atmos. Chem. Phys. 2021, 21, 12855–12866. [Google Scholar] [CrossRef]
- Herut, B.; Nimmo, M.; Medway, A.; Chester, R.; Krom, M.D. Dry atmospheric inputs of trace metals at the Mediterranean coast of Israel (SE Mediterranean): Sources and fluxes. Atmos. Environ. 2001, 35, 803–813. [Google Scholar] [CrossRef]
- Su, B.; Lin, D.; Liu, Z.; Wu, Q.; Song, W.; Zhang, M. Optical–Physical Characteristics of Low Clouds and Aerosols in South America Based on Cloud-Aerosol Lidar and Infrared Pathfinder Satellite Observation. Atmosphere 2024, 15, 1513. [Google Scholar] [CrossRef]
- Zhang, M.; Mu, P.; Chen, X.; Wu, D.; Lu, F.; Qi, P.; Li, L.B.; Gong, W. Study on the Optical–Physical Properties of Aerosol Layers in Africa Based on a Laser Satellite. Atmosphere 2023, 14, 1524. [Google Scholar] [CrossRef]
- Zhang, J.; Zheng, Y.; Li, Z.; Xia, X.; Chen, H. A 17-year climatology of temperature inversions above clouds over the ARM SGP site: The roles of cloud radiative effects. Atmos. Res. 2020, 237, 104810. [Google Scholar] [CrossRef]
- Jiang, X.; Wang, Y.; Wang, L.; Tao, M.; Wang, J.; Zhou, M.; Bai, X.; Gui, L. Characteristics of Daytime-And-Nighttime AOD Differences Over China: A Perspective from CALIOP Satellite Observations and GEOS-Chem Model Simulations. J. Geophys. Res. Atmos. 2024, 129, e2023JD039158. [Google Scholar] [CrossRef]
- Kim, M.H.; Omar, A.H.; Tackett, J.L.; Vaughan, M.A.; Winker, D.M.; Trepte, C.R.; Hu, Y.; Liu, Z.; Poole, L.R.; Pitts, M.C.; et al. The CALIPSO version 4 automated aerosol classification and lidar ratio selection algorithm. Atmos. Meas. Tech. 2018, 11, 6107–6135. [Google Scholar] [CrossRef] [PubMed]
- Arenas-Díaz, F.; Fuentes, B.; Reyers, M.; Fiedler, S.; Böhm, C.; Campos, E.; Shao, Y.; Bol, R. Dust and aerosols in the Atacama Desert. Earth-Sci. Rev. 2022, 226, 103925. [Google Scholar] [CrossRef]
- Senghor, H.; Machu, É.; Hourdin, F.; Gaye, A.T. Seasonal cycle of desert aerosols in western Africa: Analysis of the coastal transition with passive and active sensors. Atmos. Chem. Phys. 2017, 17, 8395–8410. [Google Scholar] [CrossRef]
- Yang, W.; Marshak, A.; Várnai, T.; Kalashnikova, O.V.; Kostinski, A.B. CALIPSO observations of transatlantic dust: Vertical stratification and effect of clouds. Atmos. Chem. Phys. 2012, 12, 11339–11354. [Google Scholar] [CrossRef]
- Chung, C.E.; Ramanathan, V.; Kim, D.K.; Podgorny, I.A. Global anthropogenic aerosol direct forcing derived from satellite and ground-based observations. J. Geophys. Res. Atmos. 2005, 110, D24207. [Google Scholar] [CrossRef]
- Benkhalifa, J.; Chaabane, M. Towards climatological study on the characteristics of aerosols in Central Africa and Mediterranean sites. J. Atmos. Sol.-Terr. Phys. 2016, 138-139, 206–214. [Google Scholar] [CrossRef]
- Tamoffo, A.T.; Weber, T.; Cabos, W.; Sein, D.V.; Dosio, A.; Rechid, D.; Remedio, A.R.; Jacob, D. Mechanisms of Added Value of a Coupled Global Ocean-Regional Atmosphere Climate Model Over Central Equatorial Africa. J. Geophys. Res. Atmos. 2024, 129, e2023JD039385. [Google Scholar] [CrossRef]
- Hao, W.M.; Liu, M.H. Spatial and temporal distribution of tropical biomass burning. Glob. Biogeochem. Cycles 1994, 8, 495–503. [Google Scholar] [CrossRef]
- Cooke, W.F.; Koffi, B.; Grégoire, J.-M. Seasonality of vegetation fires in Africa from remote sensing data and application to a global chemistry model. J. Geophys. Res. Atmos. 1996, 101, 21051. [Google Scholar] [CrossRef]
- Moore, R.H.; Karydis, V.A.; Capps, S.L.; Lathem, T.L.; Nenes, A. Droplet number uncertainties associated with CCN: An assessment using observations and a global model adjoint. Atmos. Chem. Phys. 2013, 13, 4235–4251. [Google Scholar] [CrossRef]
- Planche, C.; Mann, G.W.; Carslaw, K.S.; Dalvi, M.; Marsham, J.H.; Field, P.R. Spatial and temporal CCN variations in convection-permitting aerosol microphysics simulations in an idealised marine tropical domain. Atmos. Chem. Phys. 2017, 17, 3371–3384. [Google Scholar] [CrossRef]
- Nyasulu, M.; Haque, M.M.; Boiyo, R.; Kumar, K.R.; Zhang, Y.-L. Seasonal climatology and relationship between AOD and cloud properties inferred from the MODIS over Malawi, Southeast Africa. Atmos. Pollut. Res. 2020, 11, 1933–1952. [Google Scholar] [CrossRef]
- Taylor, J.W.; Haslett, S.L.; Bower, K.; Flynn, M.; Crawford, I.; Dorsey, J.; Choularton, T.; Connolly, P.J.; Hahn, V.; Voigt, C.; et al. Aerosol influences on low-level clouds in the West African monsoon. Atmos. Chem. Phys. 2019, 19, 8503–8522. [Google Scholar] [CrossRef]
- Eva, H.; Lambin, E.F. Remote Sensing of Biomass Burning in Tropical Regions. Remote Sens. Environ. 1998, 64, 292–315. [Google Scholar] [CrossRef]
- Pringle, K.J.; Tost, H.; Pozzer, A.; Poschl, U.; Lelieveld, J. Global distribution of the effective aerosol hygroscopicity parameter for CCN activation. Atmos. Chem. Phys. 2010, 10, 5241–5255. [Google Scholar] [CrossRef]
- Giglio, L.; Randerson, J.T.; Van der Werf, G.R.; Kasibhatla, P.S.; Collatz, G.J.; Morton, D.C.; Defries, R.S. Assessing variability and long-term trends in burned area by merging multiple satellite fire products. Biogeosciences 2010, 7, 1171–1186. [Google Scholar] [CrossRef]
- Tamoffo, A.T. Process-based assessment of the impact of reduced turbulent mixing on Congo Basin precipitation in the RCA4 Regional Climate Model. Clim. Dyn. 2021, 56, 1951–1965. [Google Scholar] [CrossRef]


Disclaimer/Publisher’s Note: The statements, opinions and data contained in all publications are solely those of the individual author(s) and contributor(s) and not of MDPI and/or the editor(s). MDPI and/or the editor(s) disclaim responsibility for any injury to people or property resulting from any ideas, methods, instructions or products referred to in the content. |
© 2025 by the authors. Licensee MDPI, Basel, Switzerland. This article is an open access article distributed under the terms and conditions of the Creative Commons Attribution (CC BY) license (https://creativecommons.org/licenses/by/4.0/).
Share and Cite
Su, B.; Lin, D.; Lv, X.; Kong, S.; Song, W.; Zhang, M. Insights into the Optical and Physical Characteristics of Low Clouds and Aerosols in Africa from Satellite Lidar Measurements. Atmosphere 2025, 16, 717. https://doi.org/10.3390/atmos16060717
Su B, Lin D, Lv X, Kong S, Song W, Zhang M. Insights into the Optical and Physical Characteristics of Low Clouds and Aerosols in Africa from Satellite Lidar Measurements. Atmosphere. 2025; 16(6):717. https://doi.org/10.3390/atmos16060717
Chicago/Turabian StyleSu, Bo, Dekai Lin, Xiaozhe Lv, Shuo Kong, Wenkai Song, and Miao Zhang. 2025. "Insights into the Optical and Physical Characteristics of Low Clouds and Aerosols in Africa from Satellite Lidar Measurements" Atmosphere 16, no. 6: 717. https://doi.org/10.3390/atmos16060717
APA StyleSu, B., Lin, D., Lv, X., Kong, S., Song, W., & Zhang, M. (2025). Insights into the Optical and Physical Characteristics of Low Clouds and Aerosols in Africa from Satellite Lidar Measurements. Atmosphere, 16(6), 717. https://doi.org/10.3390/atmos16060717