Article

Vertical Stratification of Dust and Anthropogenic Aerosols and Their Seasonal Impact on Radiative Forcing in Semi-Arid Northwest China

1
College of Mechatronic Engineering, North Minzu University, Yinchuan 750021, China
2
College of Electrical and Information Engineering, North Minzu University, Yinchuan 750021, China
3
Key Laboratory of Atmospheric Environmental Remote Sensing of Ningxia, Yinchuan 750021, China
*
Author to whom correspondence should be addressed.
Atmosphere 2025, 16(6), 718; https://doi.org/10.3390/atmos16060718
Submission received: 9 May 2025 / Revised: 5 June 2025 / Accepted: 10 June 2025 / Published: 13 June 2025
(This article belongs to the Section Aerosols)

Abstract

Aerosol optical properties and radiative forcing critically influence Earth’s climate, particularly in semi-arid regions. This study investigates these properties in Yinchuan, Northwest China, focusing on aerosol optical depth (AOD), single-scattering albedo (SSA), Ångström Index, and direct radiative forcing (DRF) using 2023 CE-318 sun photometer data, HYSPLIT trajectory analysis, and the SBDART model. Spring AOD peaks at 0.58 ± 0.15 (500 nm) due to desert dust, with coarse-mode particles dominating, while summer SSA reaches 0.94, driven by fine-mode aerosols. Internal mixing of dust and anthropogenic aerosols significantly alters DRF through enhanced absorption, with spring surface DRF at −101 ± 22W m−2 indicating strong cooling and internal mixing increasing atmospheric DRF to 52.25W m−2. These findings elucidate dust–anthropogenic interactions’ impact on optical properties and radiative forcing, offering critical observations for semi-arid climate research.

1. Introduction

Aerosols influence the energy balance and atmospheric dynamics by scattering and absorbing solar radiation, playing a critical role in Earth’s climate [1]. In the semi-arid regions of Northwest China, the sources and characteristics of aerosols are particularly complex due to the presence of dust and anthropogenic emissions. The vertical distribution of aerosols, particularly the stratification of dust and anthropogenic aerosols, plays a critical role in modulating radiative forcing due to their distinct altitudes of concentration. Dust aerosols, typically residing at 1.5–7 km altitudes, contrast with anthropogenic aerosols, which are predominantly confined to the boundary layer (0–2 km). This vertical stratification influences scattering and absorption processes, affecting the atmospheric heating profile and regional climate dynamics. Understanding these vertical differences is essential for accurate radiative forcing assessments in semi-arid regions like Northwest China. This region encompasses the Taklimakan Desert, Gobi Desert, Junggar Basin, and Loess Plateau, which are among the major global sources of dust aerosols [2]. Concurrently, rapid industrialization and urbanization have led to a significant increase in emissions of anthropogenic aerosols, including sulfates, nitrates, black carbon (BC), and organic carbon (OC), forming a complex mixed system of dust and anthropogenic aerosols in the atmosphere [3,4]. This discussion primarily refers to the total columnar atmospheric aerosols and their integrated effects on radiative forcing at the surface (BOA) and top of the atmosphere (TOA).
The direct radiative forcing (DRF) of aerosols refers to their ability to alter the net radiative flux at the top of the atmosphere (TOA) or the surface through direct interactions with solar radiation, including scattering and absorption. The magnitude and sign of DRF directly impact regional climate patterns, precipitation distribution, and air quality. In Northwest China, dust aerosols, characterized by a high single-scattering albedo (SSA, typically 0.95–1.0), generally induce significant cooling at the surface, with DRF values in dust source regions ranging from −9 to −24 W m−2. However, at the TOA, dust aerosols may exhibit a slight warming effect due to the absorption of longwave radiation, with DRF values reaching 0 to +6.0 W m−2 in certain areas [5,6]. In contrast, anthropogenic aerosols, with a lower SSA (approximately 0.7–0.9), typically exhibit a stronger cooling effect, with nationwide DRF values of approximately −5.6 W m−2 (BOA) and −3.0 W m−2 (TOA). Notably, when dust and anthropogenic aerosols mix, their synergistic optical properties can significantly alter the net radiative forcing [7,8]. For instance, strongly absorbing anthropogenic aerosols, such as black carbon, may adhere to dust particles, enhancing atmospheric absorption and amplifying the warming effect [9,10].
The semi-arid environment of Northwest China renders it particularly sensitive to climate change. Studies indicate that aerosol radiative forcing in this region has increased in recent years, especially in dust source areas like the Taklimakan Desert, where shortwave DRF under clear-sky conditions has reached −13.5 W m−2 (BOA) and −4.8 W m−2 (TOA), with an atmospheric heating effect of 8.7 W m−2 [11,12]. This trend reflects not only the intensification of dust events but also the rising pollution emissions driven by human activities [13]. Furthermore, the vertical distribution differences between dust (concentrated at 2–5 km altitudes) and anthropogenic aerosols (predominantly in the boundary layer) add complexity to the calculation and prediction of radiative forcing. In urban areas, the optical and radiative properties of aerosols vary significantly under different pollution conditions, such as dust days exhibiting higher absorption and haze days dominated by fine organic aerosols [14,15].
This study focuses on Yinchuan, a non-AERONET site in Northwest China, strategically located between desert and industrial zones (situated in the central Ningxia Plain, surrounded by major deserts including the Badain Jaran and Tengger, serving as a critical pathway for cross-border dust transport and a hub for high-pollution industries such as coal and chemical production) [16,17]. This positioning makes Yinchuan an ideal location for investigating the interactions between dust and anthropogenic aerosols, enabling the retrieval of aerosol optical parameters and microphysical properties [18,19,20]. The unique geographical conditions of Yinchuan provide a natural experimental setting to explore the vertical differentiation effects between coarse-mode dust aerosols and fine-mode anthropogenic aerosols, as well as the synergistic mechanisms of scattering and absorption, thereby filling the observational gap in aerosol radiative forcing research in semi-arid regions [21].

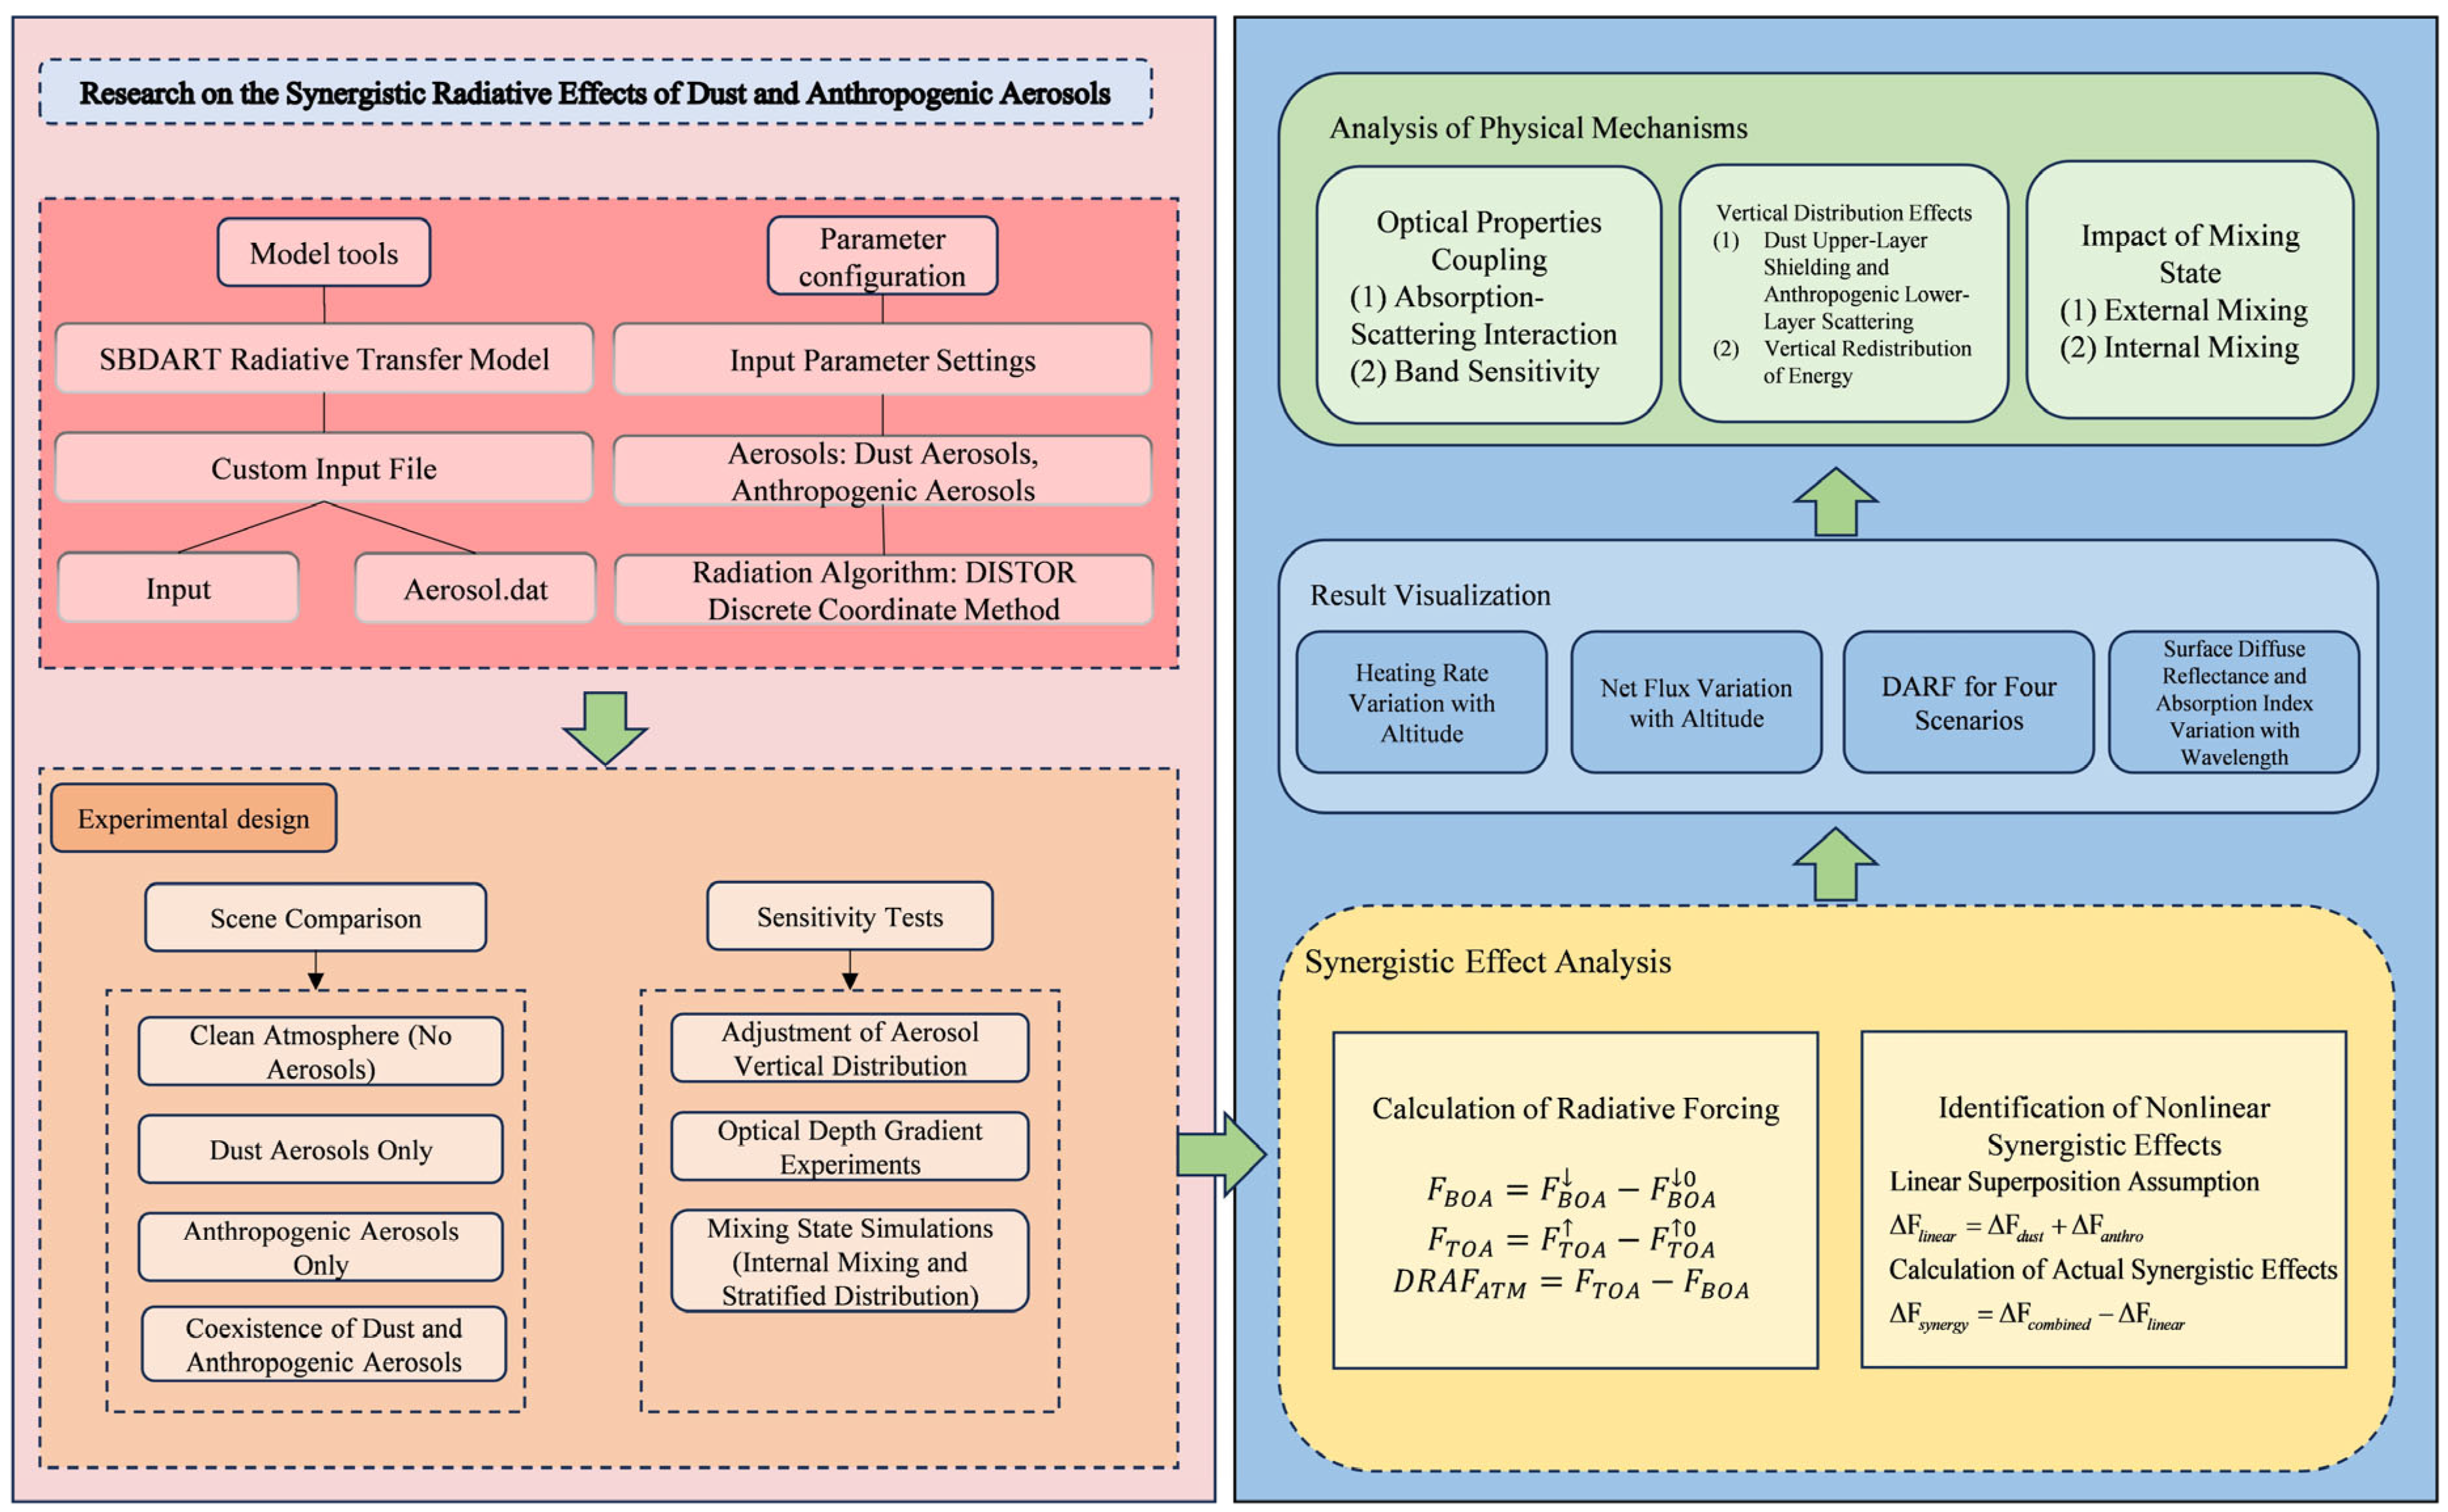
2. Materials and Methods
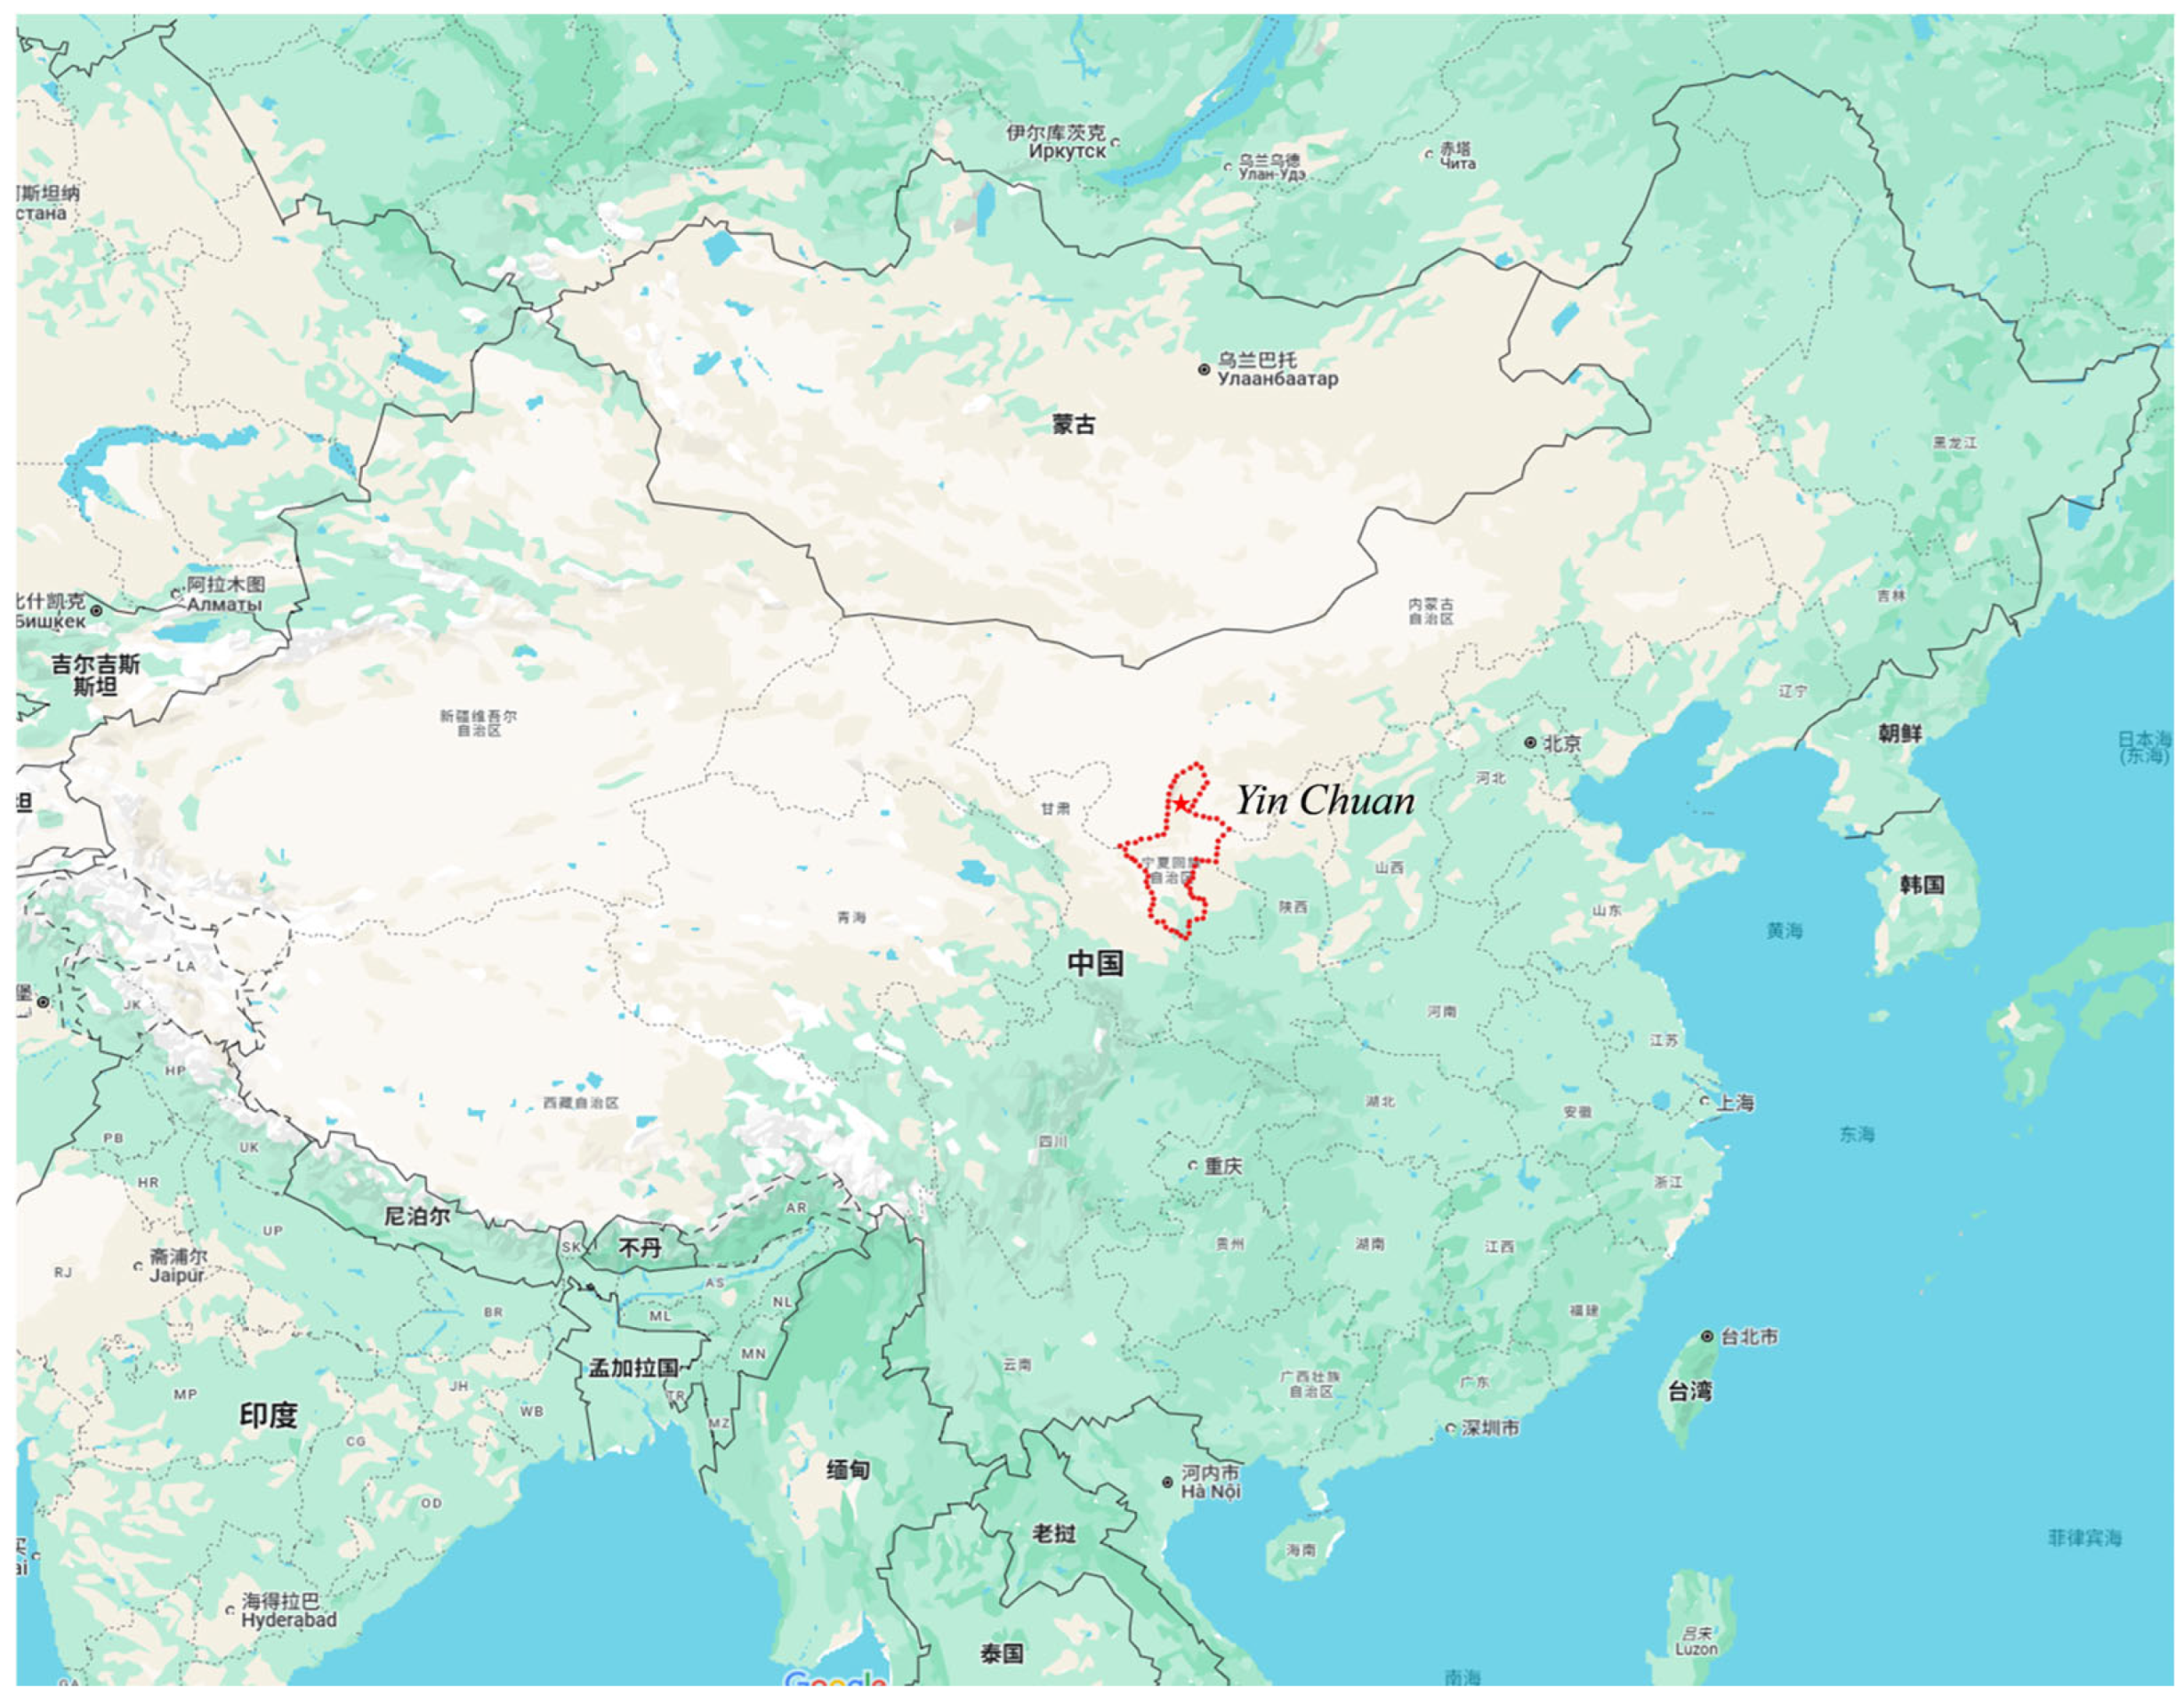
2.1. Study Area

The Yinchuan region is located in the central part of the Ningxia Plain in Northwest China, surrounded by four deserts to the west, northwest, north, and east, as shown in Figure 1. The geographical characteristics of this region result in distinct climatic features, including significant diurnal temperature variations, scarce precipitation, intense evaporation, and arid conditions. Consequently, Yinchuan not only is one of the primary sources of dust storms but also serves as a critical pathway for the wind-driven transport of dust particles. Dust aerosols are a dominant aerosol type in this region, exerting a substantial impact on the local atmospheric environment [22]. Furthermore, Yinchuan is a major hub for coal, chemical, and power industries in Northwest China, with energy-intensive industries accounting for a significant proportion of local industrial activities. The resulting atmospheric particulate matter, including soot, chemical emissions, coal combustion fly ash, and mineral combustion particles, constitutes a major source of pollutants that significantly degrade regional air quality and environmental health.

2.2. Instruments and Data

This study employed a CE-318 sun photometer installed at the Northern University for Nationalities in Yinchuan, operational since September 2012. The instrument is an automatic tracking and scanning solar radiometer manufactured by the French company CIMEL (Paris, France). Using data from the CE-318 sun photometer collected over one year in 2023. The instrument operates across nine channels spanning the visible and near-infrared spectra, with specific wavelengths at 340 nm, 380 nm, 440 nm, 500 nm, 675 nm, 870 nm, 936 nm, 1020 nm, and 1640 nm. It is equipped with multiple automatic sun-tracking and sky-scanning modes, collecting direct solar radiation data through all nine channels and sky-scanning data via six of these channels (440 nm, 500 nm, 675 nm, 870 nm, 1020 nm, and 1640 nm) [23]. The direct solar radiation data are primarily used to retrieve optical depth and total atmospheric water vapor content, while almucantar data (measurements taken in a horizontal circle around the sun at a constant elevation angle) are utilized to derive volume–size distribution and single-scattering albedo. These datasets provide essential support and research tools for investigating atmospheric optical parameters, offering significant application value and research importance in relevant academic fields.
Backward trajectory data were obtained using the HYSPLIT (Hybrid Single-Particle Lagrangian Integrated Trajectory) model, driven by meteorological fields from the Global Data Assimilation System (GDAS) of the National Centers for Environmental Prediction (NCEP). Simulations were initiated from the central point of the Yinchuan region (38.5° N, 106.2° E), and backward trajectory clustering was calculated for each season of 2023 to analyze aerosol transport mechanisms.
Aerosol vertical stratification was analyzed using aerosol subtype classification products derived from the Vertical Feature Mask (VFM) data, which employ a joint inversion of the 532 nm backscatter signal, depolarization ratio, and color ratio to classify aerosol types. These data, combined with the layer top height and the vertical profile of the extinction coefficient at 532 nm, provide a 60 m vertical resolution to resolve the stratified distribution of aerosol types. In Yinchuan, dust aerosols are predominantly stratified at altitudes of 1.5–7 km, driven by long-range transport from nearby deserts, while anthropogenic aerosols, such as smoke and industrial pollutants, are primarily confined to the boundary layer (0–2 km). This vertical stratification significantly influences radiative forcing by altering the scattering and absorption profiles at different atmospheric layers. For instance, dust aerosols at higher altitudes enhance scattering, contributing to surface cooling, while anthropogenic aerosols in the boundary layer increase absorption, amplifying atmospheric heating. These stratified distributions were incorporated into the SBDART model to assess their impact on radiative forcing across different seasons.

2.3. Data Processing and Research Methods

In this research, the ESR.pack (Enhanced Skyrad Algorithm Package) inversion scheme [20], which builds upon the method by Nakajima et al., has been adapted for various sun photometer data types. It features two key modules: Sunrad for direct solar radiation data processing and Skyrad for sky scattered radiation data inversion. The Santa Barbara DISORT Atmospheric Radiative Transfer (SBDART) model, a FORTRAN-based radiative transfer tool, employs the discrete ordinate method (DISORT) coupled with a low-resolution atmospheric parameterization to simulate radiative transfer accurately across the 0.3–3 micron spectrum from the atmosphere’s top to the surface under both clear and cloudy skies. When examining seasonal changes in aerosol direct radiative forcing, SBDART automatically chooses appropriate mid-latitude atmospheric profiles—summer for April to October and winter for November to March. It incorporates aerosol optical properties like AOD (aerosol optical depth), SSA (single-scattering albedo), and g (asymmetry factor), alongside environmental factors such as surface albedo, water vapor profiles, and ozone levels, to model atmospheric absorption, scattering, and surface interactions comprehensively. The SBDART model is essential for simulating radiative transfer and assessing aerosol radiative forcing, particularly in the following areas: studying atmospheric radiation balance, calibrating satellite remote sensing data, and assessing aerosol and cloud radiative forcing. Aerosol radiative forcing is quantified as the radiative balance difference at the surface and top of the atmosphere due to aerosols, computed via Equations (1) and (2), with the overall direct forcing given by Equation (3).
F B O A = F B O A F B O A 0
F T O A = F T O A F T O A 0
D R A F A T M = F T O A F B O A
In Equations (1) and (2), F T O A and F B O A represent the aerosol radiative forcing at the top of the atmosphere (TOA) and at the bottom of the atmosphere (BOA), respectively. Here, F and F 0 denote the net radiative fluxes with and without aerosols, respectively, where the net flux is the difference between downward ( ) and upward ( ) radiative fluxes. In Equation (3), D A R F A T M represents the direct aerosol radiative forcing within the atmosphere, with its value given by the difference between the radiative forcing at TOA and BOA.

2.4. Uncertainty Analysis

The accuracy of aerosol optical properties and radiative forcing estimates depends on both observational data and model simulations, each introducing specific uncertainties. The CE-318 sun photometer has a reported uncertainty of ±0.01–0.02 for aerosol optical depth (AOD) under clear-sky conditions, with higher uncertainties (±0.05) during high-AOD events (e.g., dust storms) due to calibration drift and cloud contamination. The single-scattering albedo (SSA) retrievals from almucantar measurements have uncertainties of ±0.03–0.05, particularly for low-AOD conditions (AOD < 0.4) [23]. The HYSPLIT backward trajectory model relies on GDAS meteorological fields, which may introduce positional errors of 10–20% in trajectory paths due to coarse resolution (1° × 1°) and assumptions in vertical motion. The SBDART model’s radiative forcing calculations are sensitive to input parameters, such as surface albedo (±0.02), water vapor profiles (±10%), and the aerosol asymmetry factor (±0.05), leading to uncertainties in DRF estimates of ±5–10 W m−2 for BOA and TOA [18]. These uncertainties were considered in the analysis by performing sensitivity tests, ensuring that the reported DRF values include error bars reflecting the combined uncertainties from measurements and model inputs.
In analyzing how the optical properties of dust and anthropogenic aerosols synergistically influence radiative forcing, the research employs the SBDART radiative transfer model, as illustrated in Figure 2. The approach quantifies the combined radiative effects of dust and anthropogenic aerosols by customizing aerosol optical parameters. Aerosol optical properties are specified via the aerosol.dat file, focusing on four aerosol scenarios: (1) dust only, (2) anthropogenic aerosols only, (3) external mixing (dust and anthropogenic aerosols as separate particles), and (4) internal mixing (dust and anthropogenic aerosols combined within the same particle) where the optical thickness of dust and anthropogenic aerosols exhibits a stratified decrease with altitude. The output IOUT data are used to visualize and analyze the heating rate variation with altitude, net flux variation with altitude, direct radiative forcing (DRAF) for the four scenarios, and the variation of surface diffuse reflection and absorption indices with wavelength. Additionally, the physical effects of these phenomena are examined. The experimental design includes scenarios with dust only, scenarios with anthropogenic aerosols only, and combined scenarios. The synergistic effects are analyzed through the difference in radiative forcing, and the mechanisms of their interactions are evaluated.

3. Results

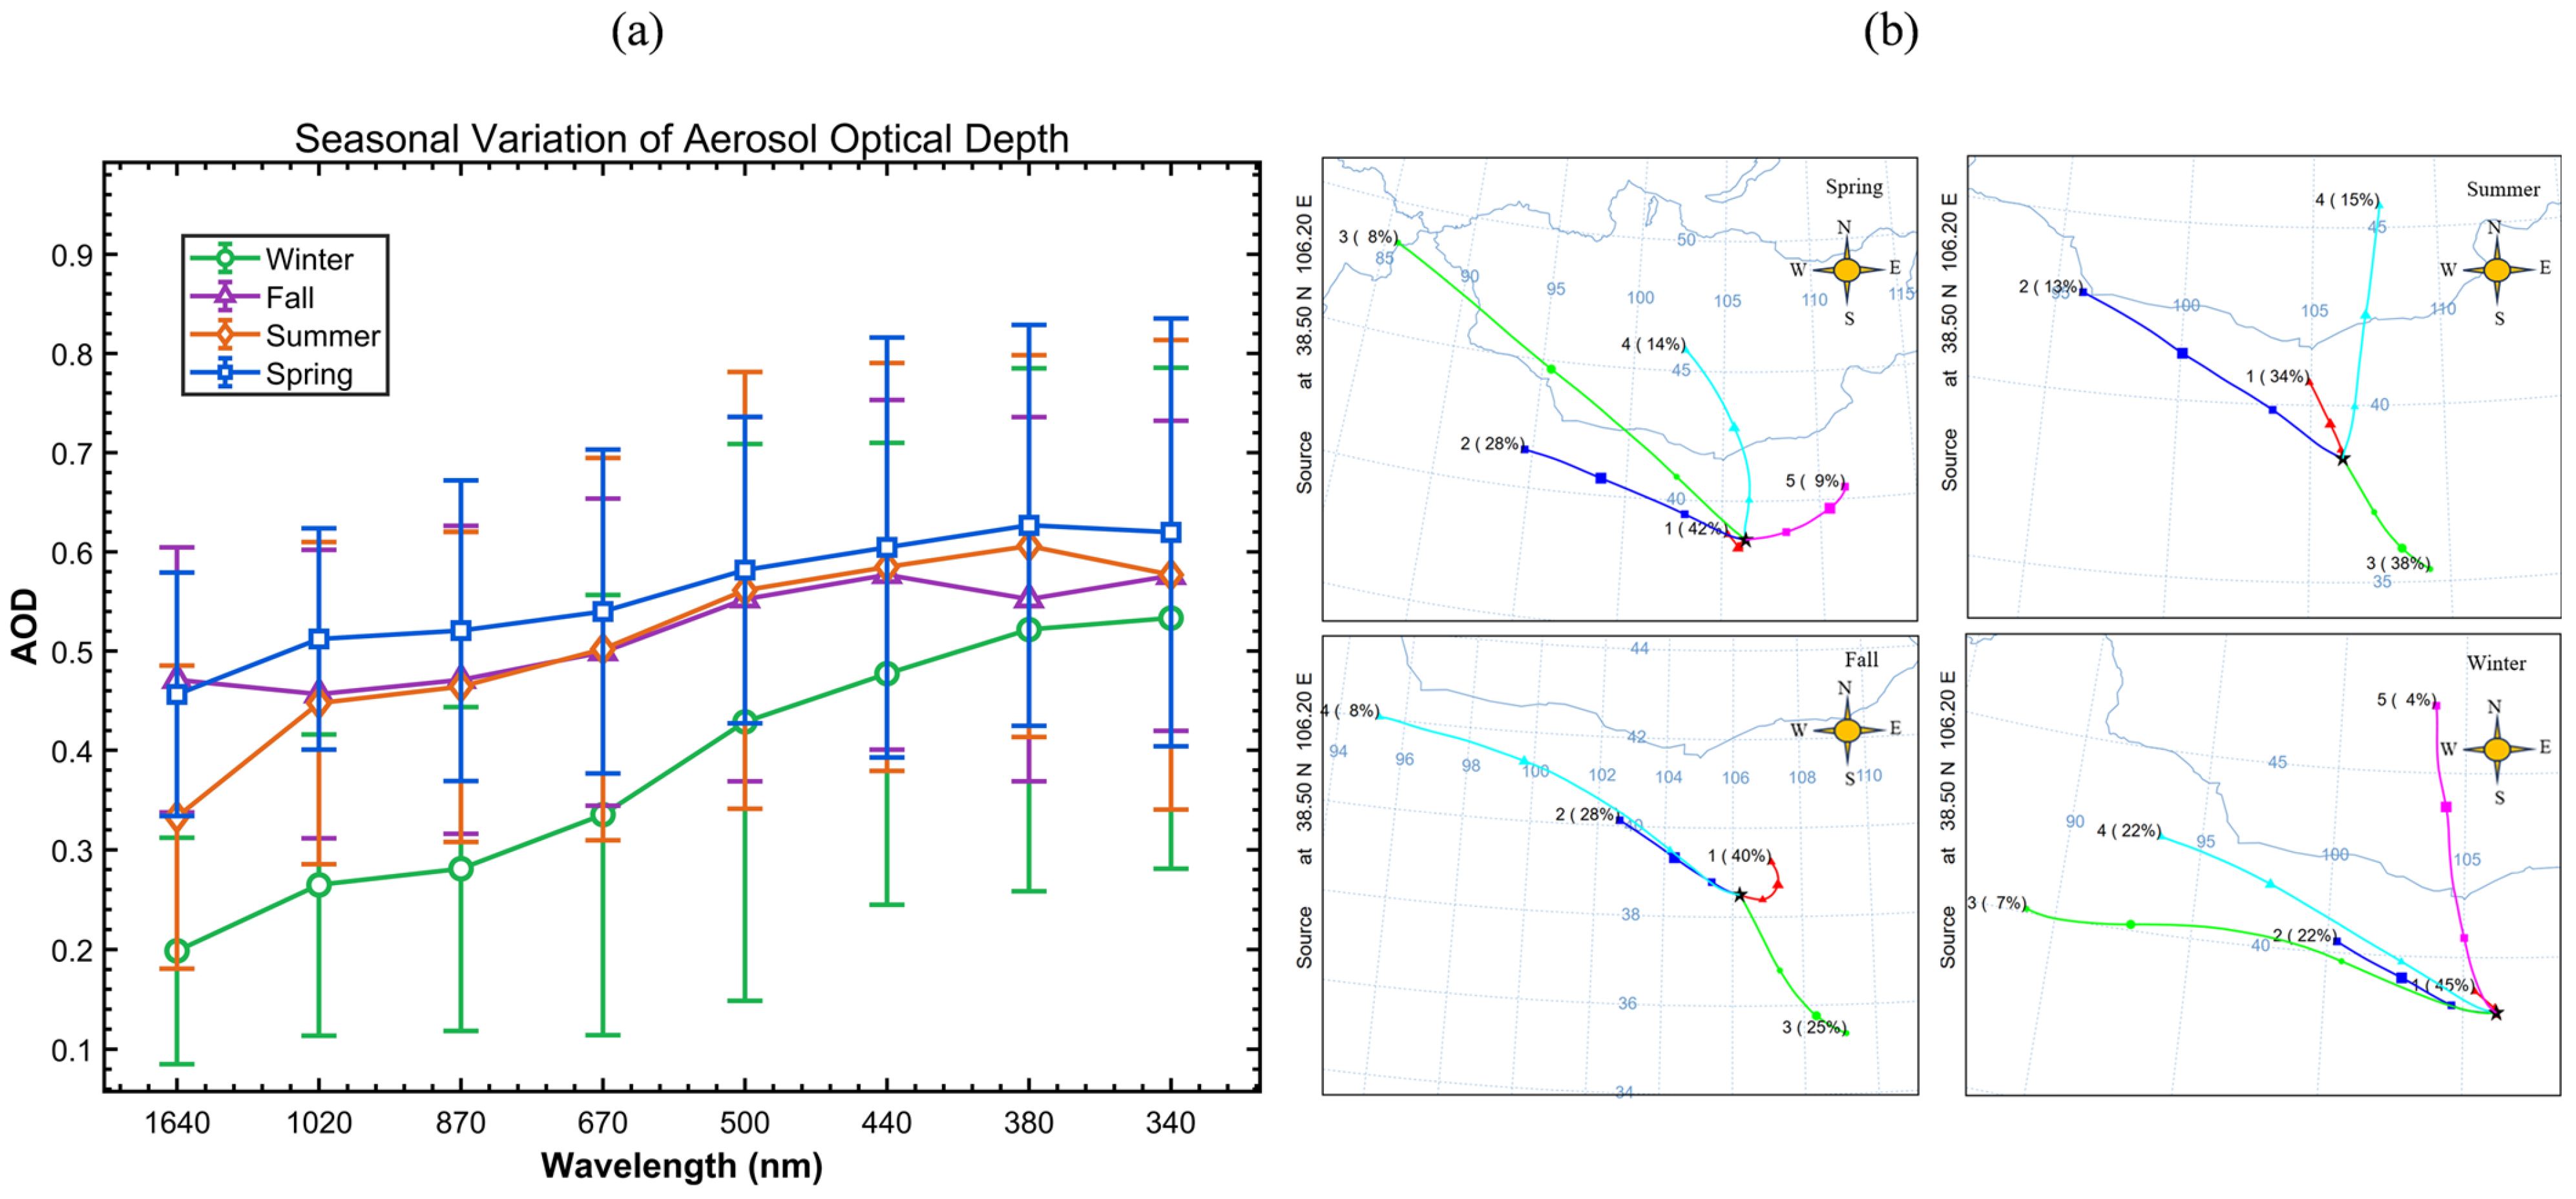
3.1. Seasonal Analysis of Aerosol Optical Depth (AOD) in the Yinchuan Region

Based on the analysis of aerosol optical depth (AOD) data measured by the CE-318 sun photometer at Northern University for Nationalities in 2023, it is evident from Figure 3a that the mean AOD in spring is significantly higher than in other seasons. Long-term observations using the CE-318 photometer reveal that the average AOD at 500 nm wavelength (AOD500) during spring (March to May) is 0.58 ± 0.15, which is notably higher than in summer (0.54 ± 0.22), autumn (0.50 ± 0.18), and winter (0.43 ± 0.28) [24]. This phenomenon is closely linked to regional dust activities: HYSPLIT backward trajectory clustering, as shown in Figure 3b, indicates that northwest airflow prevails in spring (accounting for 90%), transporting dust particles from the Badain Jaran and Tengger Deserts to Yinchuan. The frequent activity of Mongolian cyclones, in conjunction with the Siberian High, leads to increased near-surface wind speeds (averaging 4.5 m/s), providing dynamic conditions for cross-border dust transport [24,25]. Additionally, spring dust storm events constitute 68% of the annual dust days, with an extreme weather event on 22 March 2023, recording an AOD500 of 2.3 and surface PM10 concentrations exceeding 559 μg/m3.

3.2. Analysis of the Aerosol Ångström Exponent

The monthly variation trend of the Ångström Exponent is shown in Figure 4. This index is a critical parameter for characterizing the size distribution of atmospheric aerosol particles. A higher Ångström Exponent indicates a predominance of fine particulate matter from anthropogenic sources, while a decreasing Ångström Exponent suggests an increase in the dominant aerosol particle size. When the Ångström Exponent reaches lower values, coarse-particle aerosols, such as desert dust, are predominant. In spring, the Ångström Exponent exhibits its lowest values (ranging from 0.196 to 0.735, with an average of 0.354), with the minimum occurring in April, reflecting the increased prevalence of severe dust weather. In contrast, the Ångström Exponent reaches its highest values in summer (ranging from 0.175 to 1.685, with an average of 0.669), attributed to the high humidity environment in summer that promotes the deposition of dust aerosols. Based on their sources and optical properties, atmospheric aerosols can be classified into biomass burning aerosols, marine aerosols, dust aerosols, urban aerosols, and background continental aerosols [26]. Analysis of AOD and Ångström Exponent data enables the identification of aerosol types. In the Yinchuan region, aerosol types show little variation, primarily consisting of desert dust aerosols, as well as black carbon (BC) and organic carbon (OC) aerosols generated from urban industrial activities and residential coal combustion for heating [27,28].

3.3. Analysis of Aerosol Particle Size Distribution and Single-Scattering Albedo (SSA)

The single-scattering albedo (SSA), defined as the ratio of scattering to total extinction, is a critical parameter in radiative forcing. It depends on the shape, size, and composition of aerosols. Long-term observations from AERONET indicate that SSA typically ranges from 0.82 to 0.98 globally. As shown in Figure 5a, the SSA in the Yinchuan region is relatively high in summer, reaching 0.94, indicating strong scattering properties. This is associated with the high-humidity environment in summer, where aerosols readily capture atmospheric water vapor, increasing their particle radius and significantly enhancing their scattering coefficient. In spring, SSA is relatively lower due to the high absorption properties of dust and mineral aerosols, which contain substantial iron oxide components. The lower SSA in autumn is linked to increased emissions of strongly absorbing biomass burning aerosols from straw incineration [29,30]. Although the effective radii of coarse- and fine-mode aerosol particles in summer and autumn are similar, their SSA values differ significantly, suggesting that, in addition to the physical properties of aerosols, their chemical composition is likely a key factor influencing SSA variations.
The size distribution of aerosols was retrieved from sky radiation data measured by a sun photometer. The observational results of this study indicate that the aerosol particle volume–size distribution in the Yinchuan region exhibits a pronounced bimodal pattern, with the fine-mode peak diameter ranging between 0.25 and 0.26 μm and the coarse-mode peak diameter measuring approximately 7.73 μm. This distribution pattern is consistent with the aerosol size distribution characteristics derived by Liu et al. based on observational data from 2003 to 2004 in the Yinchuan region, further validating the typical features of regional aerosol size distributions [31]. In spring, frequent dust transport events lead to a coarse-mode-dominated volume concentration spectrum, directly associated with the particle size characteristics of mineral components in dust aerosols. In contrast, summer exhibits a fine-mode-dominated distribution, attributed to mechanisms such as enhanced photochemical reactions under high-temperature conditions, which accelerate secondary aerosol formation, and the transport of water vapor by the southeast monsoon, increasing atmospheric relative humidity and inducing hygroscopic growth of aerosols. This results in the partial migration of fine-mode particles to the coarse mode. Compared to summer, autumn and winter experience reduced local precipitation, weakening wet deposition processes. Additionally, the onset of the heating period in late autumn significantly increases emissions from combustion sources, leading to a concurrent increase in fine-mode (PM2.5) and coarse-mode (PM10) particle concentrations [32,33]. This phenomenon aligns spatially with the characteristics of wintertime compound air pollution in the North China region.

3.4. Analysis of Aerosol Direct Radiative Forcing

Numerical simulations based on the SBDART model reveal that aerosol radiative forcing in the Yinchuan region exhibits significant spatiotemporal heterogeneity, modulated by the synergistic effects of aerosol physicochemical properties (type and size distribution) and local meteorological conditions. The study indicates that direct radiative forcing (DRF) by aerosols at the top of the atmosphere (TOA) and the surface (BOA) is strongly correlated with aerosol size distribution, aerosol optical depth (AOD), and single-scattering albedo (SSA). As shown in Figure 6, TOA radiative forcing exhibits a pronounced cooling effect in March (−27 ± 12 W m−2) and September (−40 ± 19 W m−2), directly associated with seasonal peaks in SSA (March: 0.93 ± 0.05; September: 0.95 ± 0.03). This suggests that aerosols with high SSA values enhance planetary albedo due to their dominant scattering properties. Surface radiative forcing shows significantly high negative values from March to May (−101 ± 22 W m−2), primarily driven by the cross-border transport of dust particles from the Badain Jaran and Tengger Deserts to Yinchuan under prevailing northwest airflow in spring, leading to a surge in coarse-mode aerosol mass concentration (PM10 peak > 300 μg/m3). Seasonal differences in aerosol direct radiative forcing are notable, with values of 70 ± 30 W m−2, 35 ± 21 W m−2, 30 ± 19 W m−2, and 37 ± 18 W m−2 for spring, summer, autumn, and winter, respectively. The significant reduction in radiative forcing during summer is closely linked to enhanced wet deposition processes (average humidity 68%) and aerosol wet removal effects. In autumn and winter, radiative forcing exhibits a bimodal distribution, attributed to residential coal combustion for heating and industrial emissions from the Ningdong Energy and Chemical Industry Base, which collectively increase the proportion of fine-mode carbonaceous aerosols. The strong absorption properties of these aerosols in the near-infrared band (1.2–2.5 μm) induce an atmospheric heating effect, partially offsetting the radiative cooling at the TOA.

3.5. The Synergistic Effects of the Optical Properties of Dust and Anthropogenic Aerosols on Aerosol Radiative Forcing

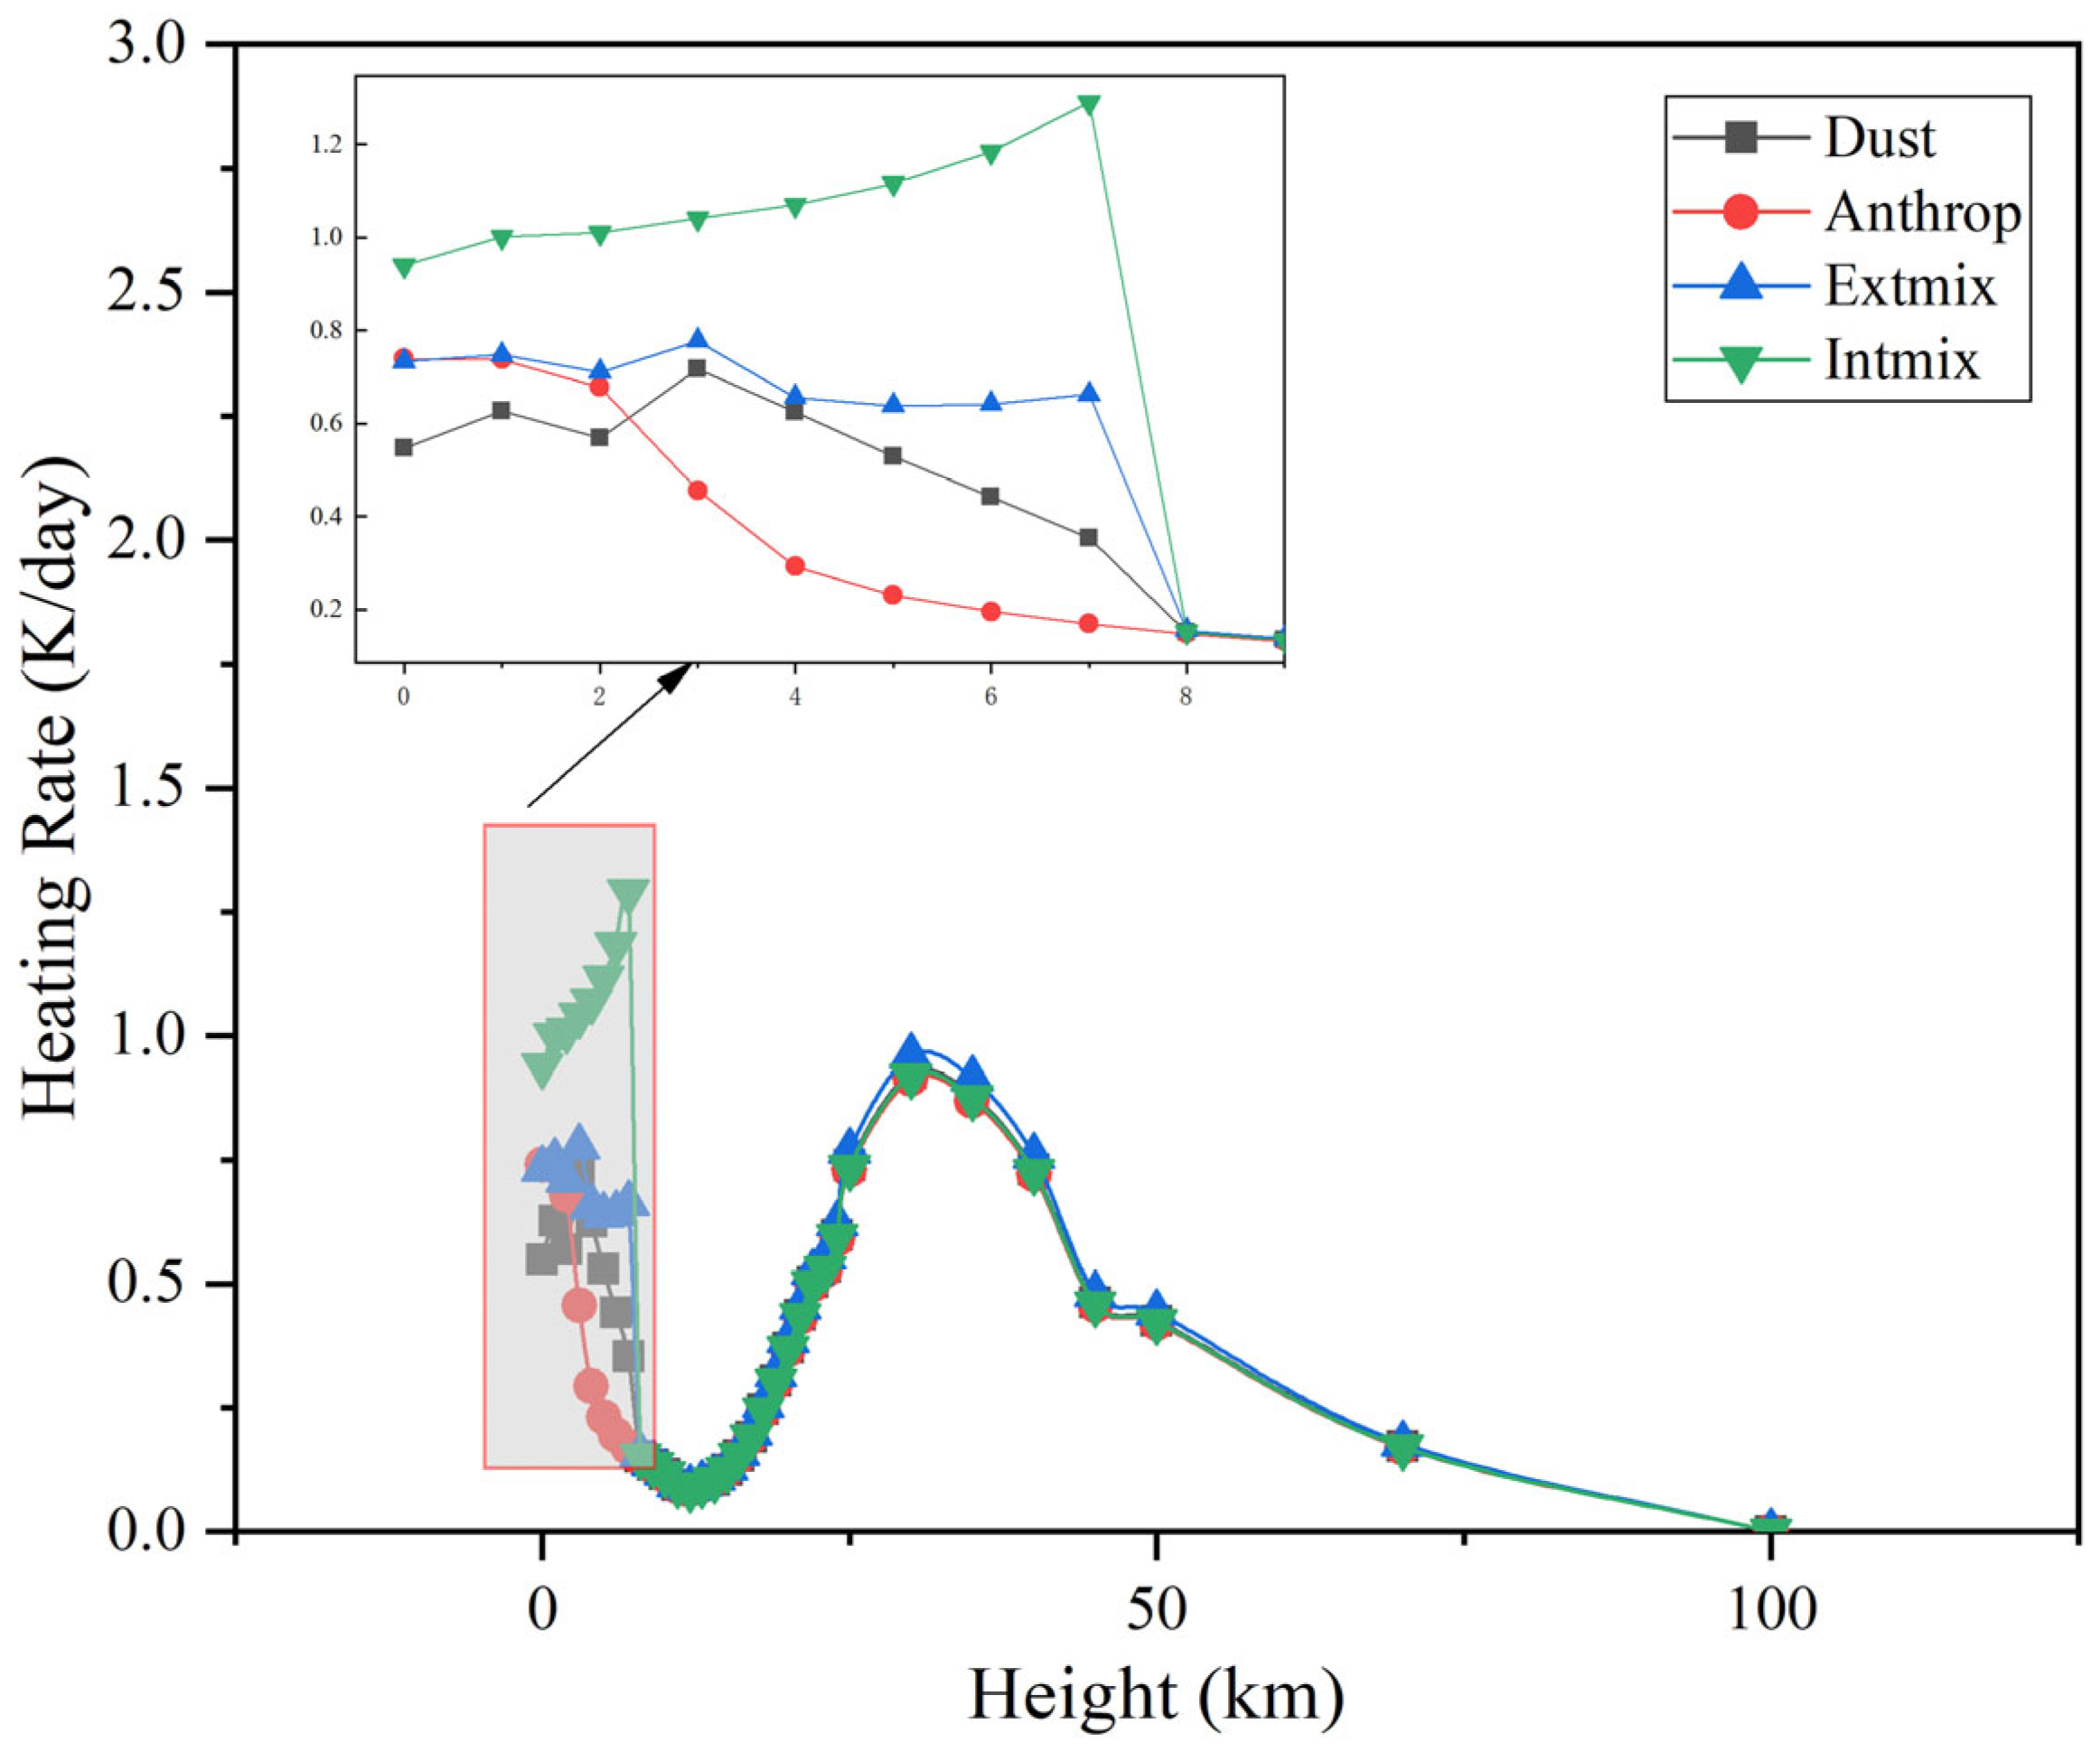
3.5.1. The Heating Rate Analysis

The heating rate analysis, as shown in Figure 7, indicates that the external mixture (Extmix) at 7 km has a heating rate of 0.663 K/day, which is close to the linear superposition of dust (0.354 K/day) and anthropogenic aerosols (0.170 K/day) with an expected value of 0.523 K/day and a deviation of 0.140 K/day [34]. This suggests independent contributions from dust and anthropogenic aerosols, with dust’s weak absorption (primarily due to iron oxides) and anthropogenic aerosols’ strong absorption (e.g., black carbon in the shortwave band) contributing separately, resulting in a weak synergistic effect. The heating rate distribution is relatively uniform, between 0 and 10 km. In contrast, the internal mixture (Intmix) exhibits a heating rate of 1.290 K/day at 7 km, significantly exceeding the linear superposition (deviation of 0.767 K/day) and is notably higher than other scenarios within the 0–10 km range. This phenomenon arises from the “lensing effect” caused by dust encapsulating black carbon, where the high-refractive-index dust shell focuses incident light onto the black carbon core, enhancing absorption efficiency [35]. This leads to increased radiation absorption in the lower atmosphere (0–10 km), significantly elevating the heating rate [36]. Such nonlinear synergistic effects may alter boundary layer stability and convective activity, impacting regional precipitation and cloud formation, highlighting the significant influence of internal mixing on the atmospheric thermal structure. To further illustrate vertical stratification, Figure 7 demonstrates that different aerosol types dominate at distinct altitudes: dust aerosols show peak heating at mid-tropospheric levels (4–7 km), while anthropogenic aerosols concentrate below 2 km. These results confirm a stratified structure, aligning with CALIPSO-based Vertical Feature Mask (VFM) data showing dust between 1.5 and 7 km and smoke within 0–2 km. This vertical decoupling influences radiative flux divergence and atmospheric heating, emphasizing the importance of vertical structure in climate effect assessments.

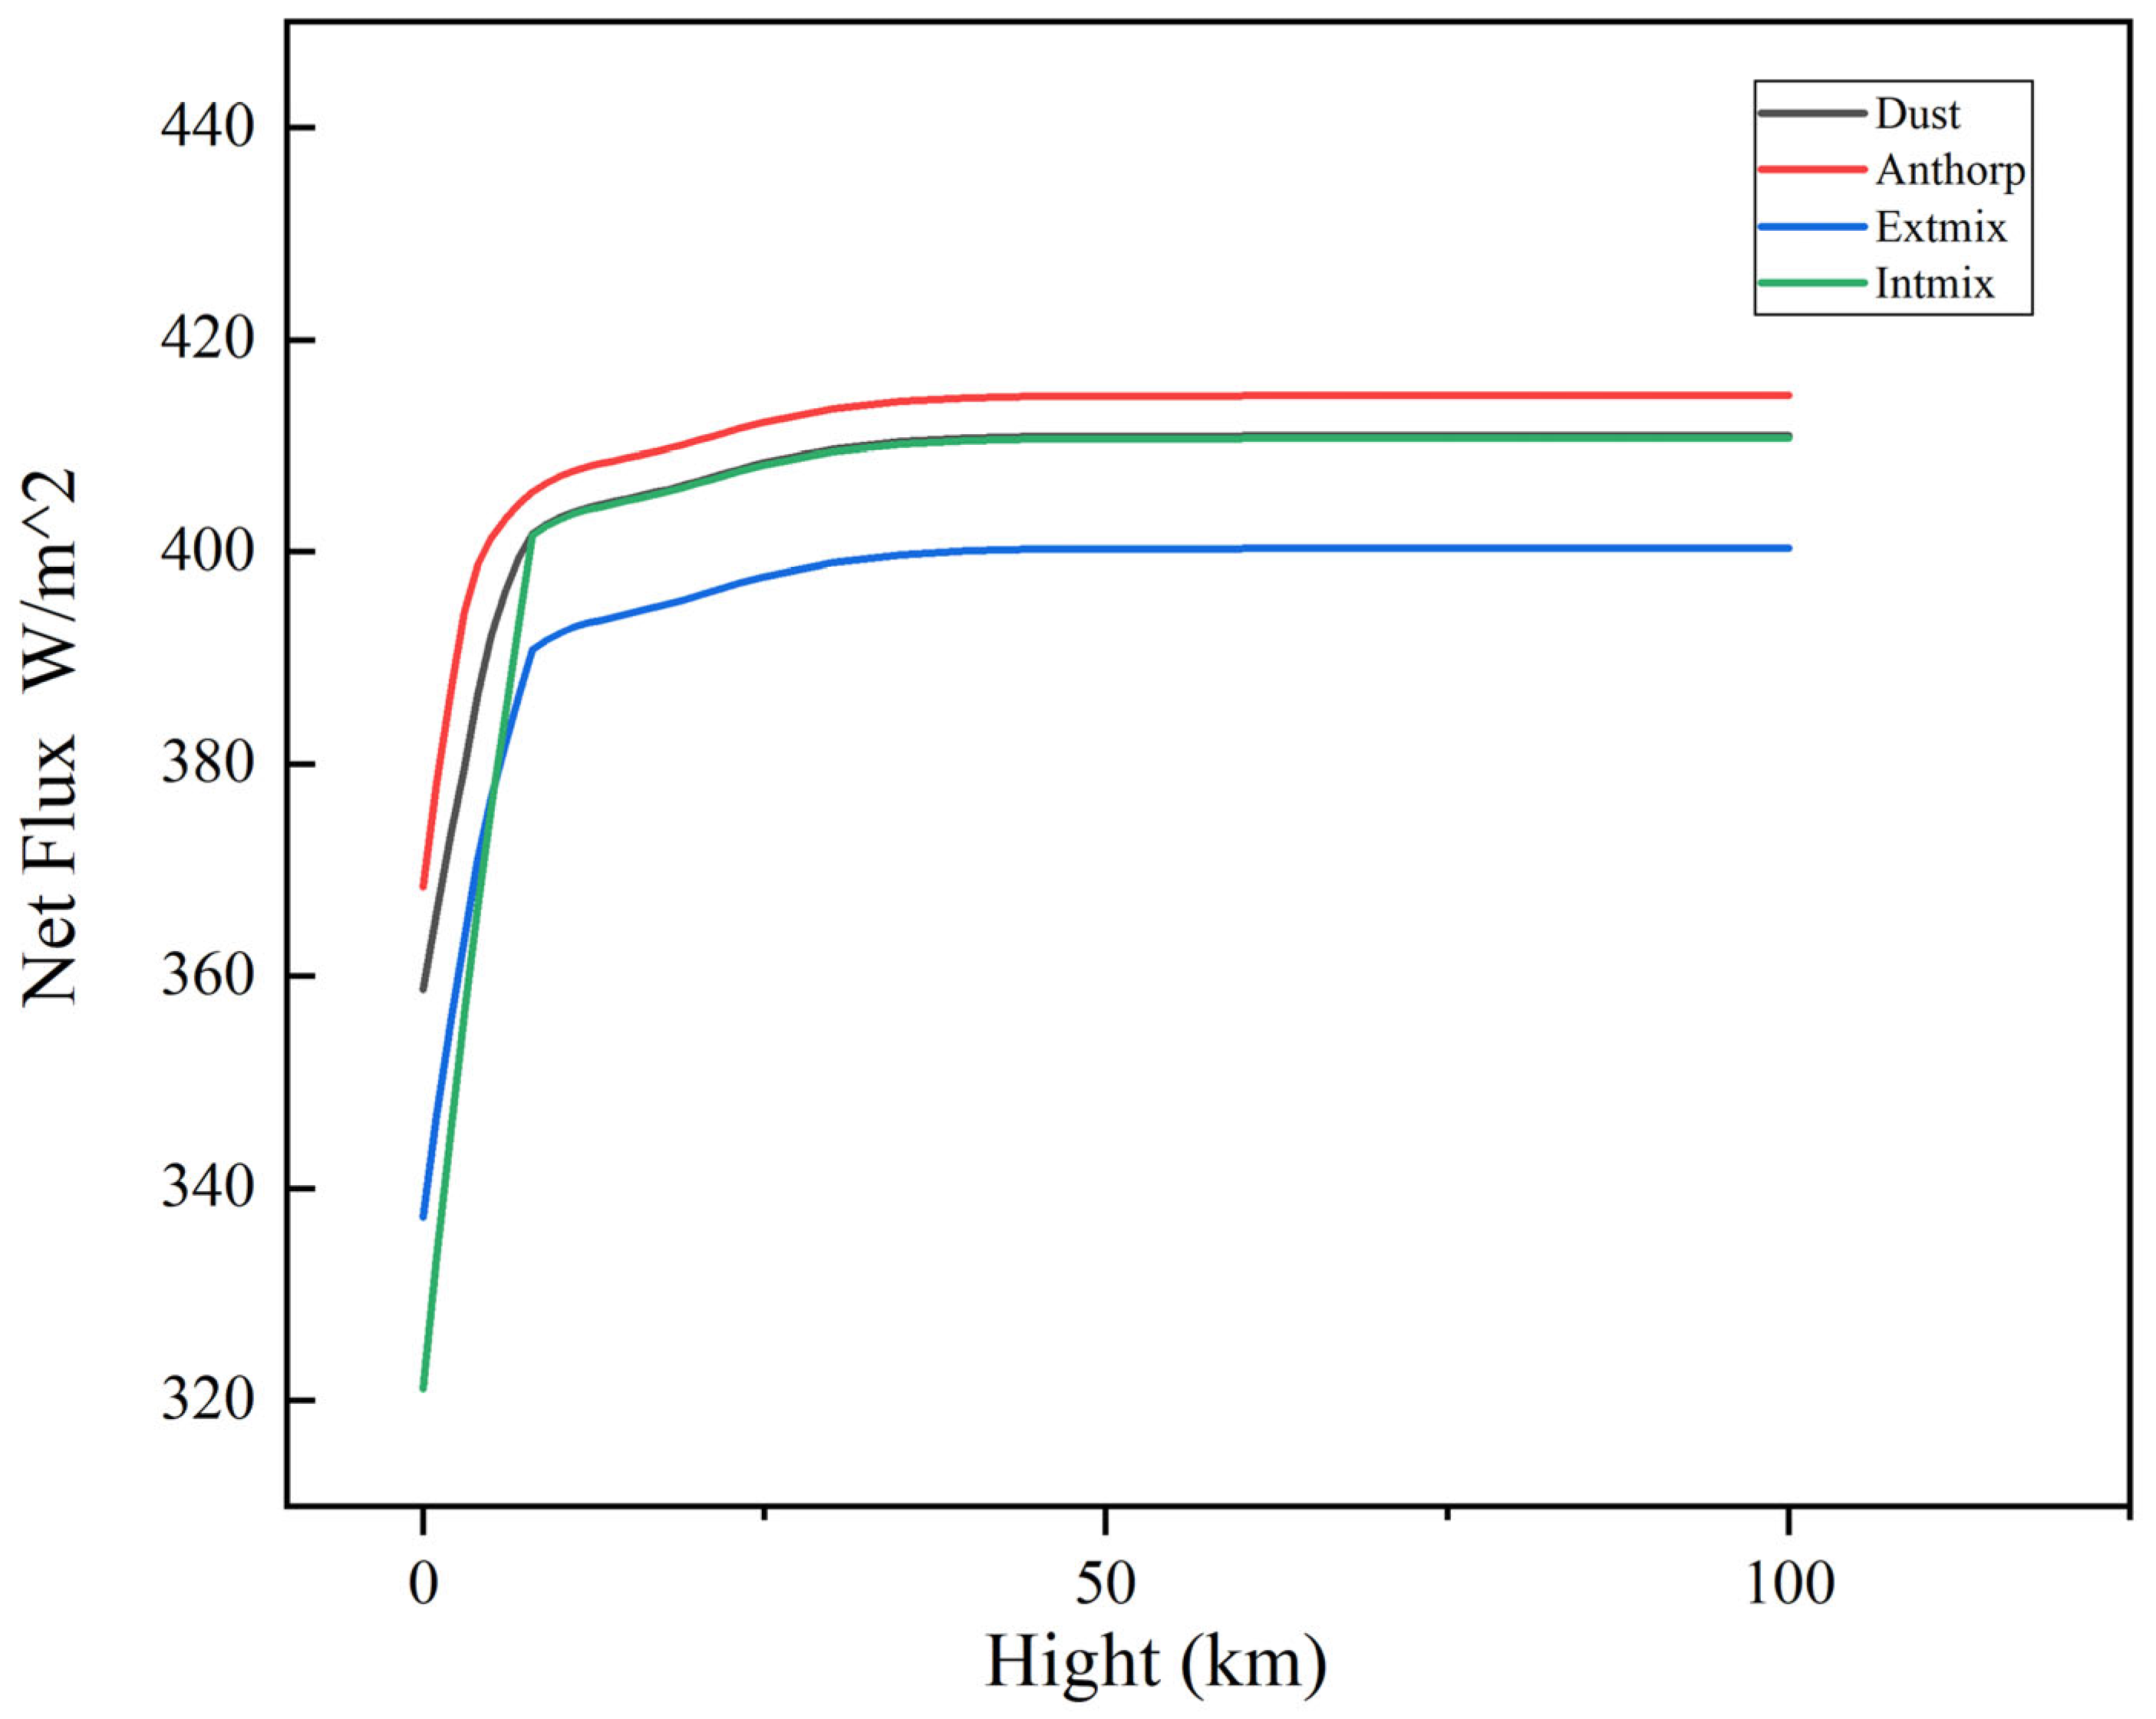
3.5.2. The Net Flux Analysis

The net flux analysis, as shown in Figure 8, indicates that the external mixing (Extmix) scenario yields a net flux of 337.26 W m−2 at the surface (0 km), lower than that of dust (358.77 W m−2) and anthropogenic aerosols (368.43 W m−2). Across the 0–10 km altitude range, the net flux decreases by 63.06 W m−2, closely approximating the linear superposition of dust and anthropogenic aerosols. This suggests independent contributions, with dust increasing reflectance through Mie scattering and anthropogenic aerosols reducing downward flux via absorption (e.g., black carbon’s shortwave absorption). Their combined effect results in a reduced net flux, though the synergistic effect is weak, and the radiation distribution remains relatively uniform. In contrast, the internal mixing (Intmix) scenario exhibits the lowest net flux at the surface (321.13 W m−2), with a decrease of 89.59 W m−2 across 0–10 km, significantly exceeding the linear superposition. This nonlinear effect, previously described, significantly impacts radiative forcing. Consequently, the radiation received at the surface is substantially reduced, while heating in the lower atmosphere is enhanced. This nonlinear synergistic effect alters the vertical distribution of radiation, potentially intensifying surface cooling and influencing low-level atmospheric thermodynamic processes [36].

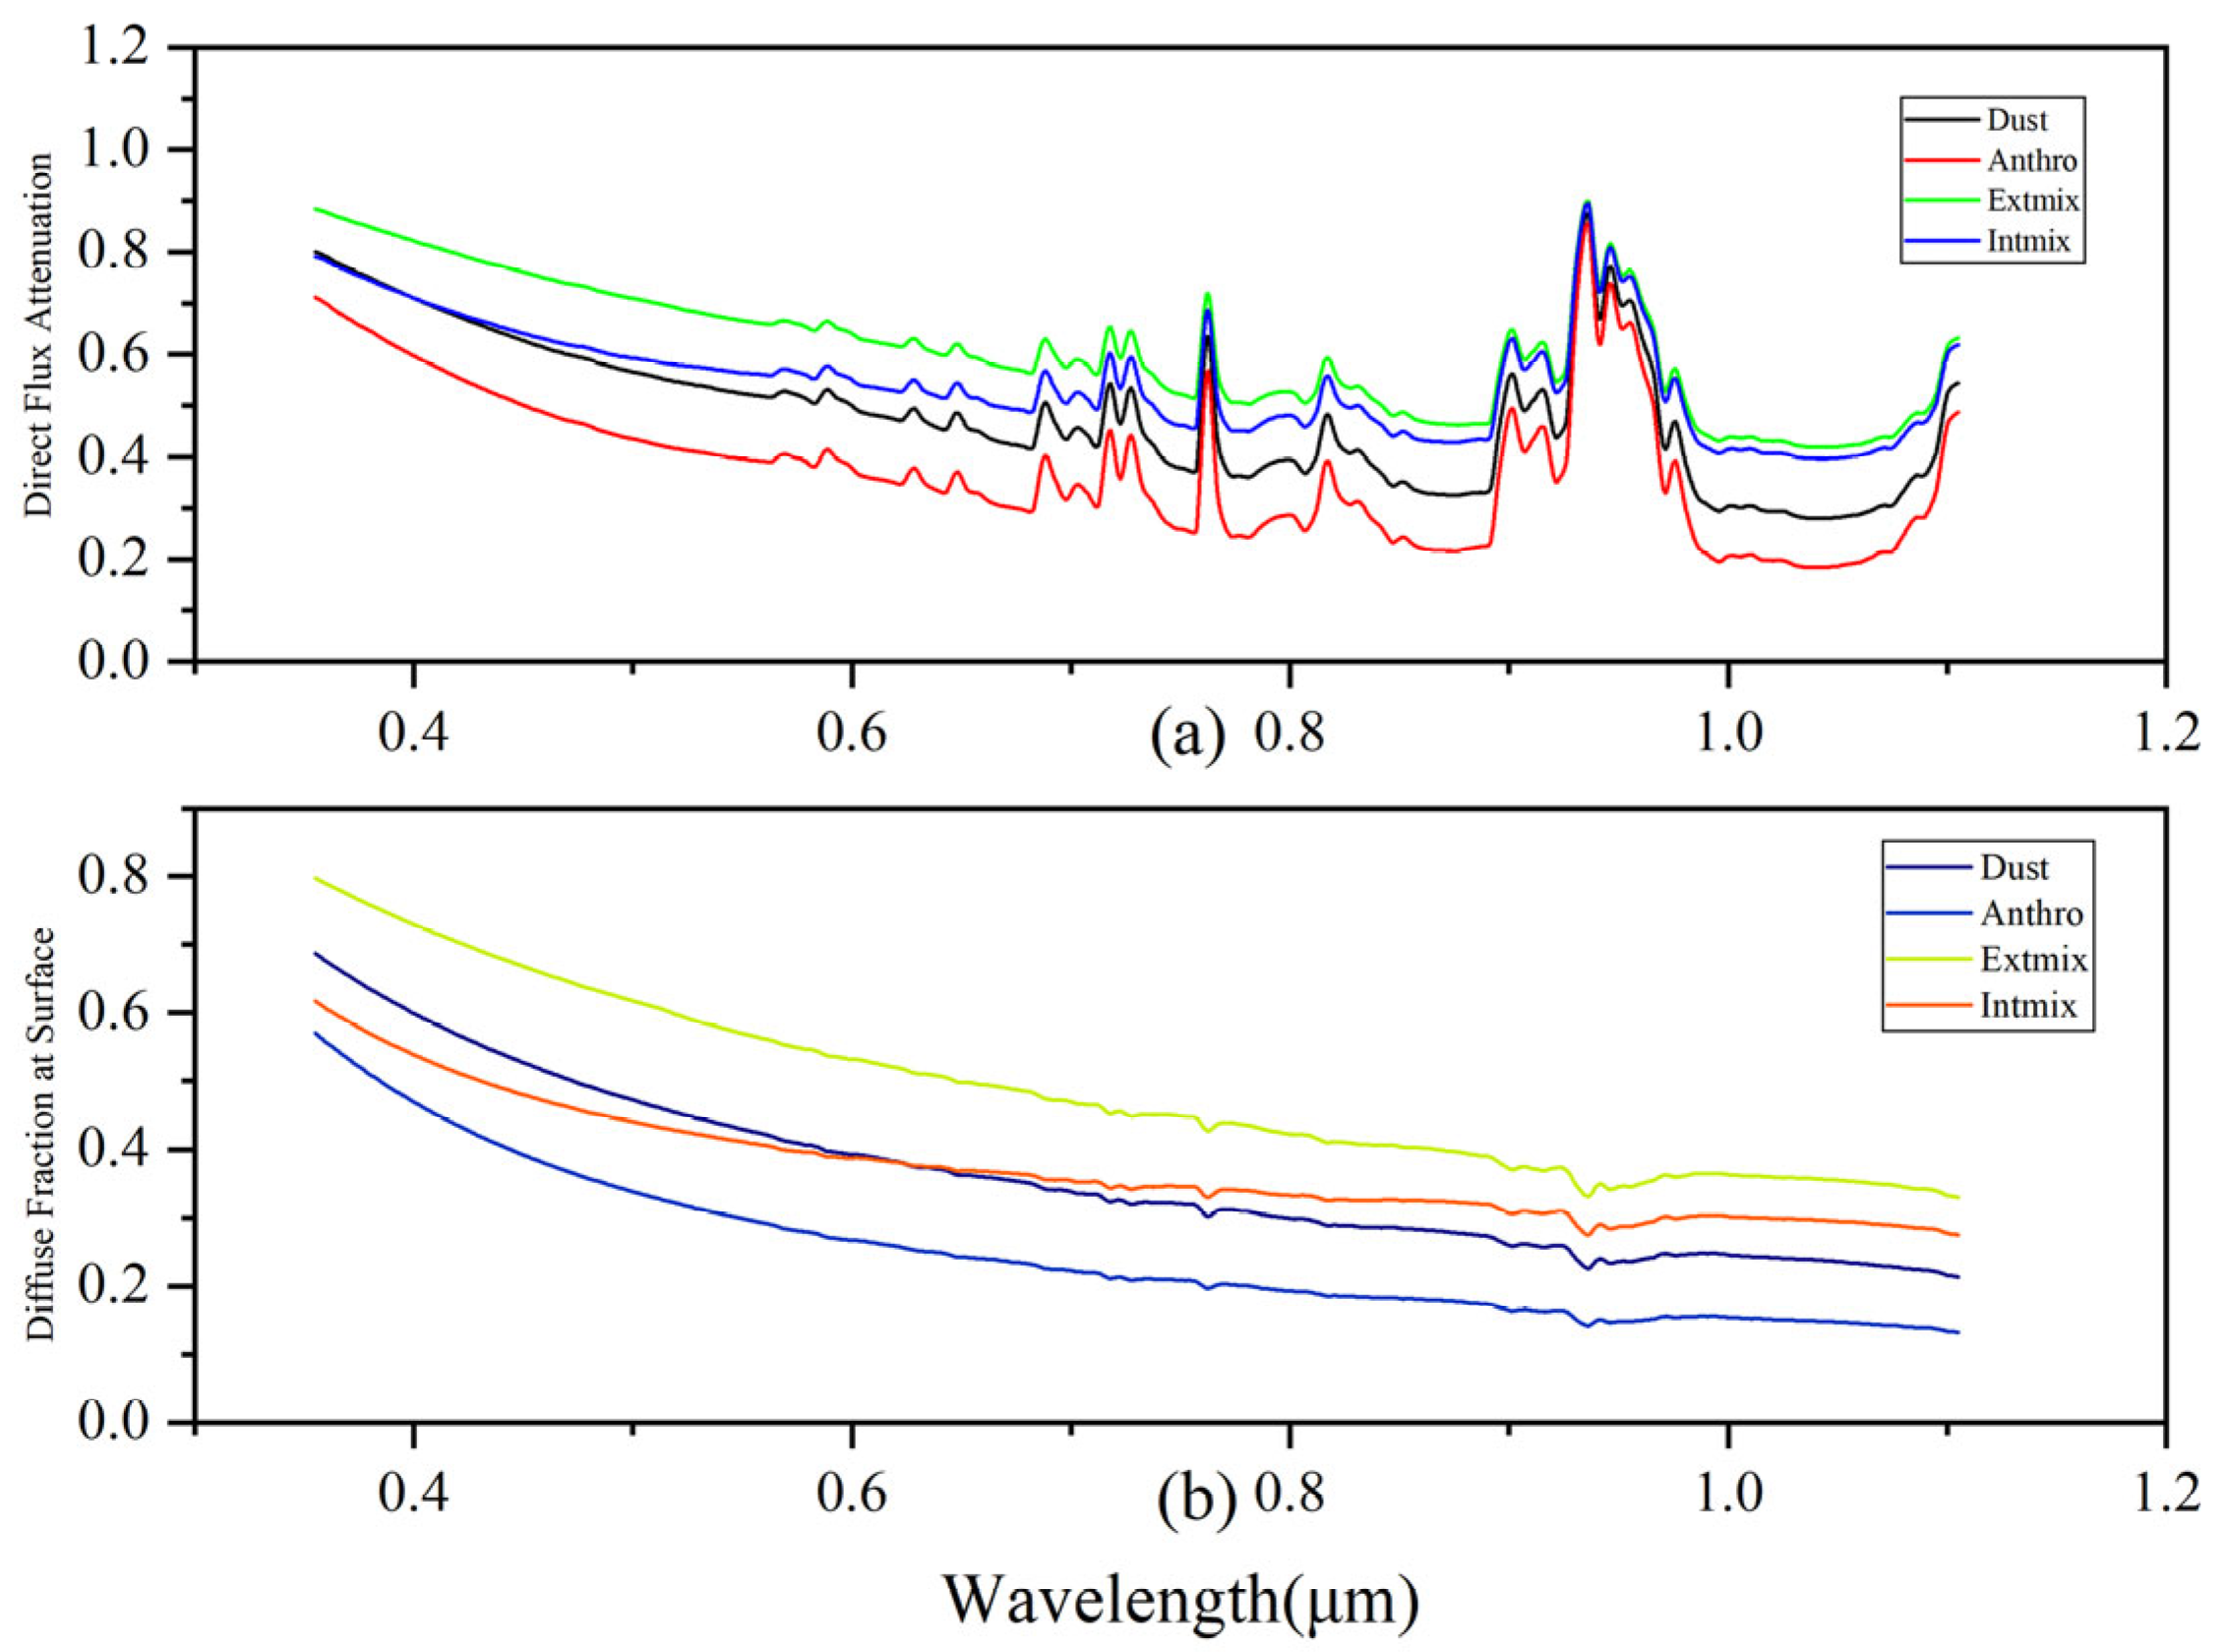
3.5.3. Analysis of Surface Diffuse Reflection and Absorption

As shown in Figure 9, within the wavelength range of 0.355–1.105 μm, the diffuse fraction at the surface for the external mixing (Extmix) scenario (0.797 at 0.355 μm) is higher than that of dust (0.687) and anthropogenic aerosols (0.571). The direct flux attenuation (0.883) closely approximates the linear superposition of the two, indicating that dust and anthropogenic aerosols exist as independent particles in external mixing. The high scattering of dust (e.g., via Mie scattering) and the strong absorption of anthropogenic aerosols (e.g., black carbon’s absorption peak in the ultraviolet–visible band) contribute independently, with a weak synergistic effect. Enhanced scattering results in a higher diffuse fraction, while the linear superposition of absorption leads to slightly greater attenuation compared to individual scenarios [24,37]. In contrast, the internal mixing (Intmix) scenario exhibits a lower diffuse fraction (0.617) than Extmix, with direct flux attenuation (0.792) significantly exceeding the average of dust and anthropogenic aerosols in the shortwave band. Both scattering and attenuation decrease with increasing wavelength (>0.7 μm). This nonlinear effect, previously described, significantly impacts radiative forcing. The strong absorption by black carbon in the shortwave band (ultraviolet–visible) further amplifies the synergistic effect, leading to increased attenuation and reduced scattering [38]. This indicates that the nonlinear enhancement of absorption in internal mixing is primarily concentrated in the shortwave band, potentially exerting significant impacts on surface radiation balance and photochemical processes (e.g., ozone formation).

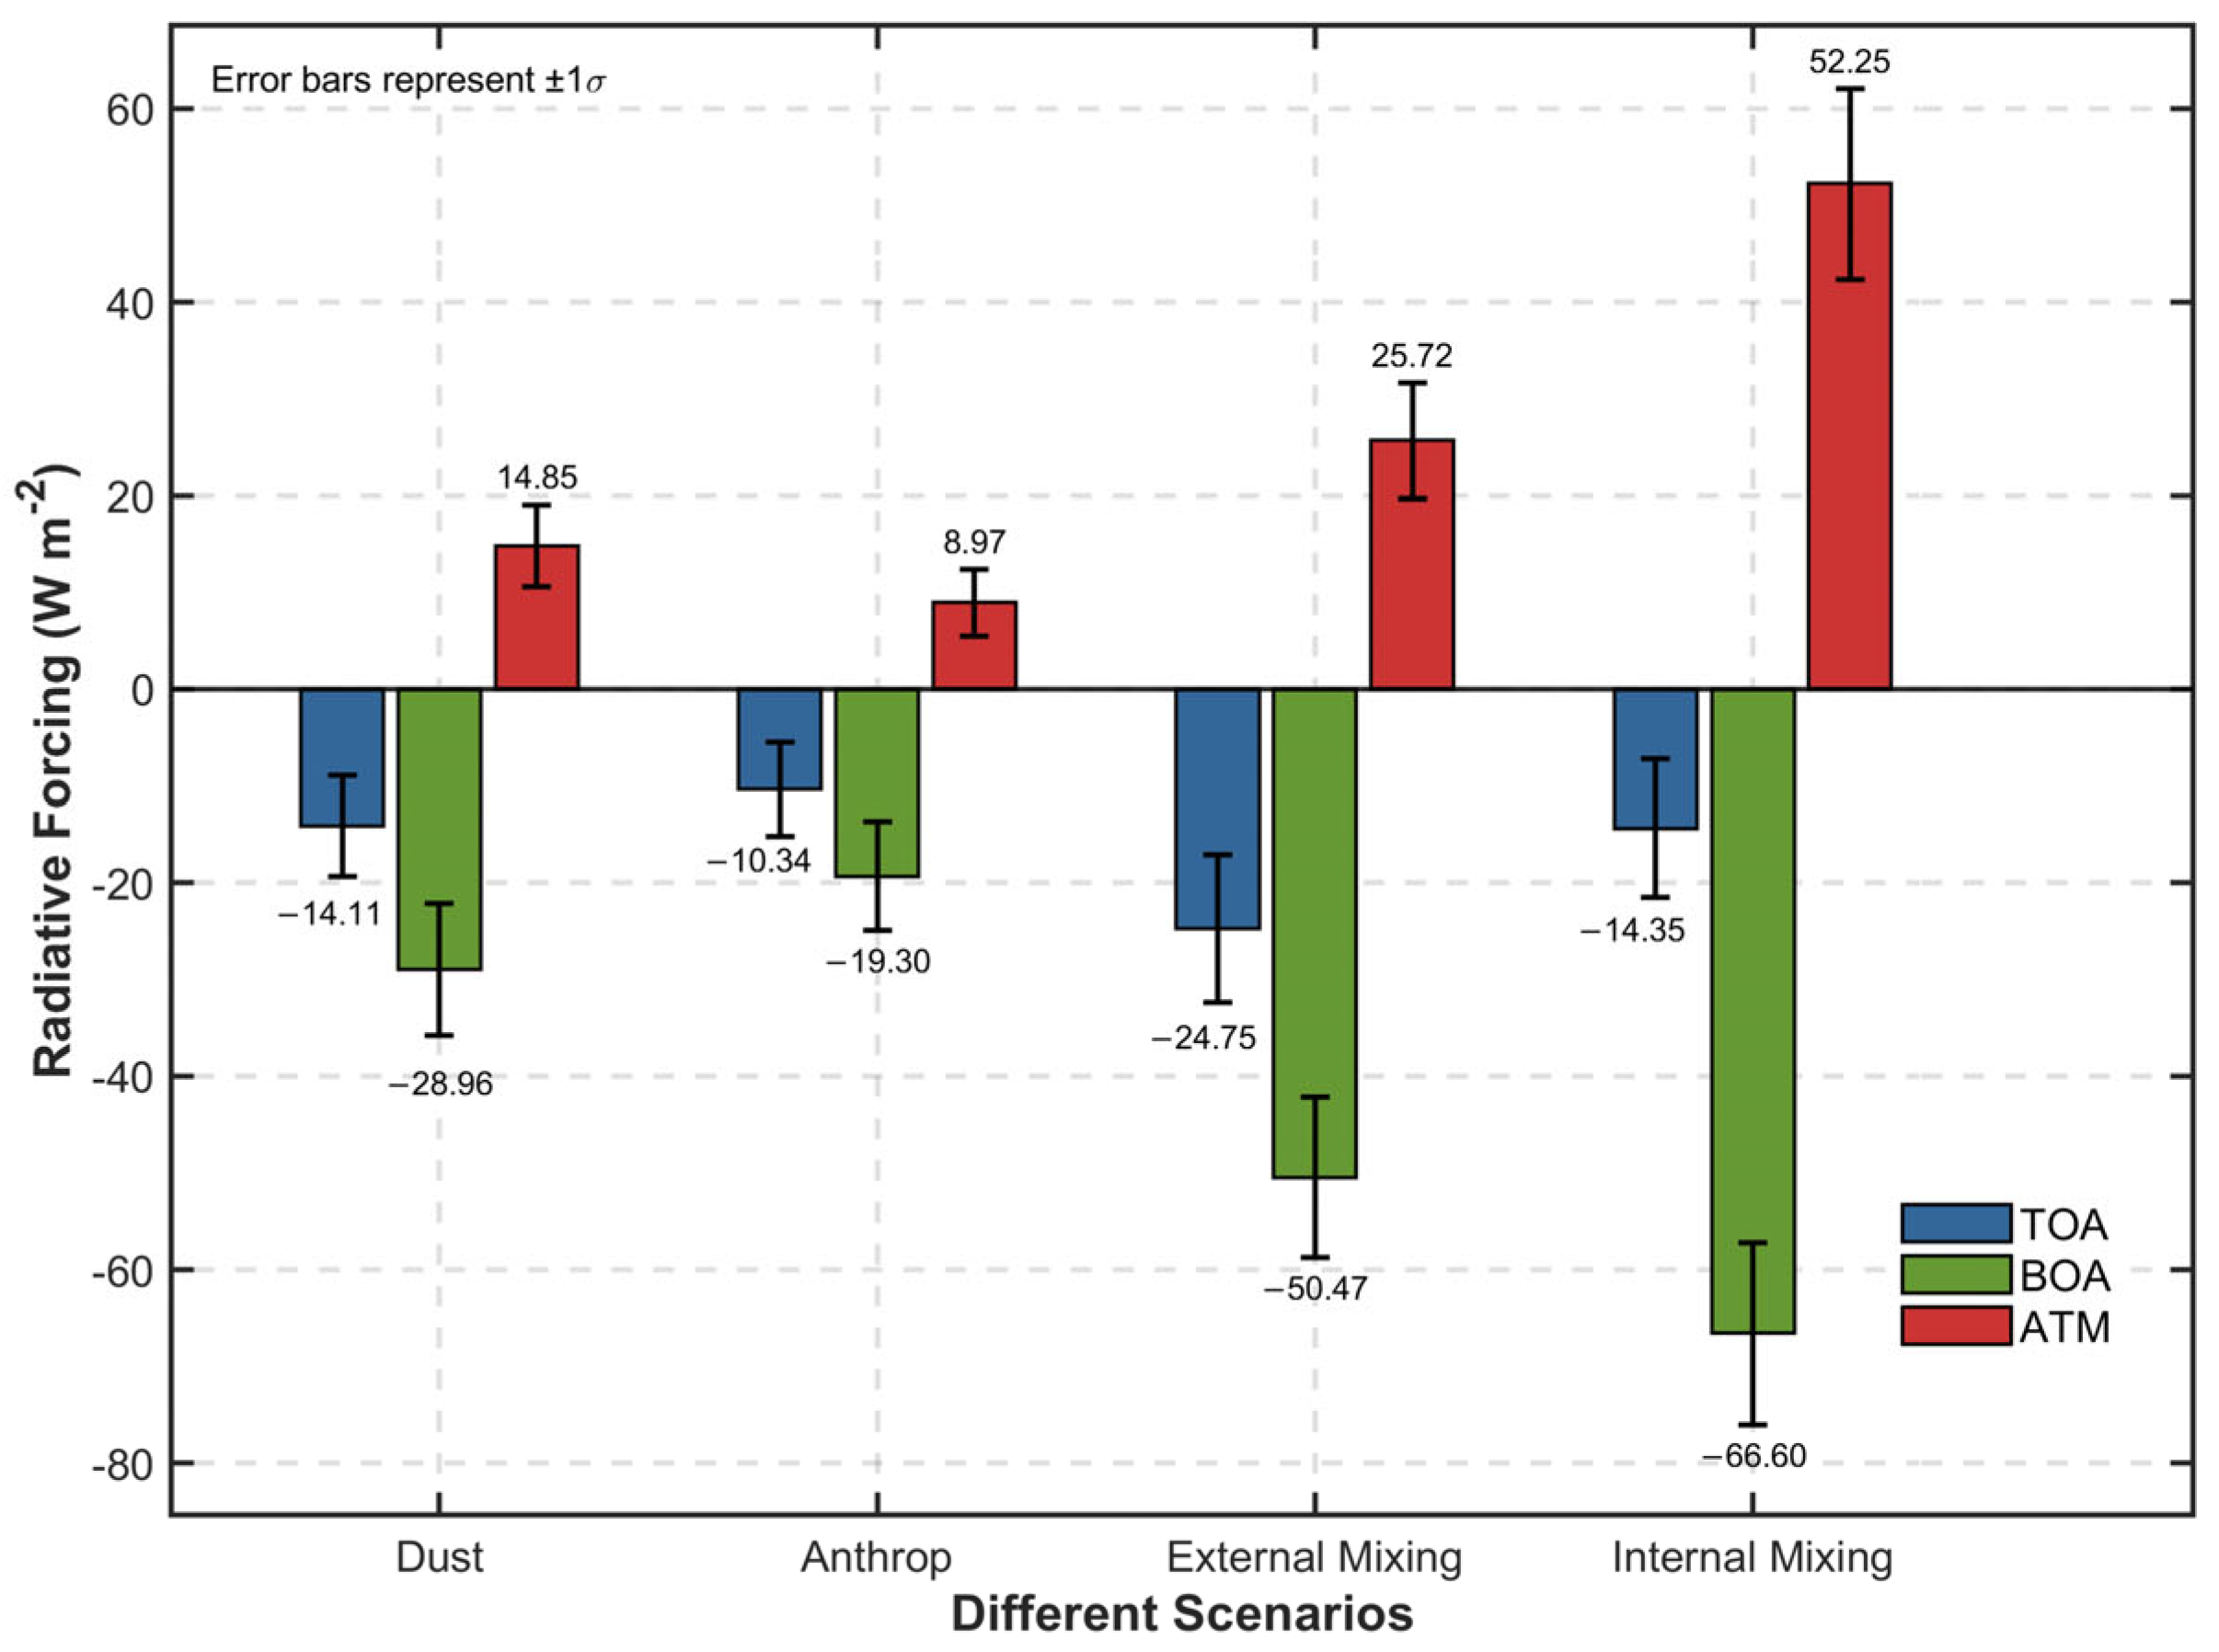
3.5.4. Direct Radiative Forcing of Aerosols Under Four Scenarios Analysis

The error bars in Table 1 were derived from sensitivity analyses in the SBDART model, accounting for uncertainties in AOD (±0.02), SSA (±0.04), and surface albedo (±0.02), combined with measurement uncertainties from the CE-318 sun photometer. The larger uncertainties in the internal mixing scenario reflect the amplified sensitivity to the lensing effect, which enhances absorption but introduces variability due to assumptions about black carbon encapsulation. These error bars ensure that the reported DRF values are robust, with deviations primarily driven by high-AOD events and model input variability.
The analysis of aerosol direct radiative forcing (DARF), as presented in Figure 10 and Table 1, shows that in the external mixing (Extmix) scenario, DARF values at the top of the atmosphere (TOA), bottom of the atmosphere (BOA), and atmospheric absorption (ATM) closely approximate the linear superposition of dust and anthropogenic aerosols (expected values: TOA: −24.44 W m−2, BOA: −48.26 W m−2, and ATM: 23.82 W m−2), with small deviations (TOA: −0.31 W m−2, BOA: −2.21 W m−2, and ATM: 1.90 W m−2) [38,39]. This indicates that dust and anthropogenic aerosols exist as independent particles in external mixing, contributing separately through scattering and absorption, with a weak synergistic effect. The physical mechanism primarily involves the simple superposition of dust’s high scattering (increasing reflectance) and anthropogenic aerosols’ strong absorption (reducing surface radiation). In contrast, the internal mixing (Intmix) scenario exhibits DARF values that significantly deviate from linear superposition (deviations: TOA: 10.09 W m−2, BOA: −18.34 W m−2, and ATM: 28.43 W m−2), with atmospheric absorption increasing by 119.3%. This nonlinear effect stems from the “lensing effect” formed when dust encapsulates strongly absorbing components such as black carbon. In internal mixing, the dust shell focuses light onto the black carbon core, enhancing absorption and increasing radiative absorption in the lower atmosphere. This results in reduced surface forcing (intensifying cooling) and greater TOA forcing (due to decreased upward radiation escape), highlighting the profound impact of internal mixing on the radiative balance [37].

4. Discussion and Conclusions

The aerosol optical properties and radiative forcing in Yinchuan exhibit distinct characteristics compared to other semi-arid regions globally and within China. In the Sahara Desert, a major global dust source, AOD values at 500 nm typically range from 0.4 to 0.8, similar to Yinchuan’s spring AOD (0.58 ± 0.15), but the Sahara’s DRF at BOA is less negative (−50 to −80 W m−2) due to lower anthropogenic aerosol contributions [14]. In contrast, Yinchuan’s BOA DRF in spring (−101 ± 22 W m−2) reflects the synergistic effect of dust and industrial emissions, which is less pronounced in the Sahara. Compared to the Australian Outback, another semi-arid region, Yinchuan’s higher SSA in summer (0.94) versus Australia’s 0.90–0.92 suggests stronger scattering due to hygroscopic aerosol growth under higher humidity [40]. Within China, Yinchuan’s spring AOD is higher than that in the Loess Plateau (0.4–0.5) but lower than in the Taklimakan Desert (0.7–1.0), reflecting its role as a dust transport pathway rather than a primary source [5]. The internal mixing scenario in Yinchuan, with a DRAF of 52 ± 10 W m−2, is notably higher than in urban Beijing (20–30 W m−2), where fine-mode anthropogenic aerosols dominate without significant dust contributions [13,31,41]. These comparisons highlight Yinchuan’s unique position as a confluence of desert dust and industrial emissions, amplifying nonlinear radiative effects that are less evident in other regions.
Methodologically, the study employed a CE-318 sun photometer to measure direct solar and sky radiation, with data processed using the ESR pack inversion scheme. The SBDART model was utilized to simulate radiative transfer and calculate DRF under four aerosol scenarios: dust only, anthropogenic aerosols only, external mixing, and internal mixing. Additionally, HYSPLIT backward trajectory clustering was conducted to investigate aerosol transport mechanisms. Analysis of particle size distribution and SSA further elucidated the physical and chemical properties influencing radiative effects, providing a comprehensive understanding of the region’s aerosol dynamics.
The results have significant implications for climate modeling in semi-arid regions, suggesting that current climate models may underestimate the warming effects caused by the nonlinear enhancement of aerosol mixing, particularly in the internal mixing scenario. The study underscores the need for developing regional climate models that account for local aerosol sources and meteorological conditions, and for incorporating the nonlinear effects of aerosol mixing states into climate predictions. Furthermore, it recommends targeted emission control measures to mitigate the adverse impacts of aerosols on climate, offering valuable insights for research on aerosol–climate interactions.

Author Contributions

X.G. contributed to the conceptualization, formal analysis, investigation, writing—review and editing, supervision, project administration, and funding acquisition, leading the study’s design, overseeing its execution, and securing financial support. R.Z. was responsible for conceptualization, methodology, software, validation, data curation, writing—original draft preparation, and visualization, developing the research methods, processing data, drafting the manuscript, and creating visual representations. X.S. provided resources and contributed to writing—review and editing, supporting the study with materials and revising the manuscript. D.X. also provided resources and contributed to writing—review and editing, assisting with material provision and manuscript revision. J.M., H.Z. and Z.R. are responsible for supervising the project. All authors have read and agreed to the published version of the manuscript.

Funding

This study was supported by the Natural Science Foundation of Ningxia, China (Grant No. 2024AAC03163), National Natural Science Foundation of China (Grant No. 42005103), and Graduate Student Innovative Project of North Minzu University (Grant No. YCX 24331).

Institutional Review Board Statement

Not applicable.

Informed Consent Statement

Not applicable.

Data Availability Statement

Data underlying the results presented in this paper are not publicly available at this time but may be obtained from the authors upon reasonable request.

Acknowledgments

We sincerely thank the Key Laboratory of Atmospheric Environment Remote Sensing at the Northern University for Nationalities in Yinchuan for providing the CE-318 sun photometer and related observational facilities. We also express gratitude to the technical staff of the university’s atmospheric research laboratory for their support in maintaining and calibrating the instrumentation. Additionally, we acknowledge the National Centers for Environmental Prediction (NCEP) for providing the Global Data Assimilation System (GDAS) meteorological fields used in the HYSPLIT model simulations. We are grateful to the developers of the ESR.pack algorithm package, particularly Toshihiko Nakajima and colleagues, and to the developers of the SBDART radiative transfer model, including Paul Ricchiazzi and the research team, for their publicly available software.

Conflicts of Interest

The authors declare no conflicts of interest.

References

  1. Chen, S.Y.; Huang, J.P.; Li, J.; Jia, R.; Jiang, N.; Kang, L.; Ma, S.; Xie, T. Comparison of dust emissions, transport, and deposition between the Taklimakan Desert and Gobi Desert from 2007 to 2011. Sci. China Earth Sci. 2017, 60, 1338–1355. [Google Scholar] [CrossRef]
  2. Zhang, X.Y.; Wang, Y.Q.; Niu, T.; Zhang, X.C.; Gong, S.L.; Zhang, Y.M.; Sun, J.Y. Atmospheric aerosol compositions in China: Spatial/temporal variability, chemical signature, regional haze distribution and comparisons with global aerosols. Atmos. Chem. Phys. 2012, 12, 779–799. [Google Scholar] [CrossRef]
  3. Kok, J.F.; Adebiyi, A.A.; Albani, S.; Balkanski, Y.; Checa-Garcia, R.; Chin, M.; Colarco, P.R.; Hamilton, D.S.; Huang, Y.; Ito, A.; et al. Contribution of the world’s main dust source regions to the global cycle of desert dust. Atmos. Chem. Phys. 2021, 21, 8169–8193. [Google Scholar] [CrossRef]
  4. Xu, S.; Ren, L.; Lang, Y.; Hou, S.; Ren, H.; Wei, L.; Wu, L.; Deng, J.; Hu, W.; Pan, X.; et al. Molecular markers of biomass burning and primary biological aerosols in urban Beijing: Size distribution and seasonal variation. Atmos. Chem. Phys. 2020, 20, 3623–3644. [Google Scholar] [CrossRef]
  5. Huang, J.; Fu, Q.; Su, J.; Tang, Q.; Minnis, P.; Hu, Y.; Yi, Y.; Zhao, Q. Taklimakan dust aerosol radiative heating derived from CALIPSO observations using the Fu-Liou radiation model with CERES constraints. Atmos. Chem. Phys. 2009, 9, 4011–4021. [Google Scholar] [CrossRef]
  6. Bond, T.C.; Doherty, S.J.; Fahey, D.W.; Forster, P.M.; Berntsen, T.; DeAngelo, B.J.; Flanner, M.G.; Ghan, S.; Kärcher, B.; Koch, D.; et al. Bounding the role of black carbon in the climate system: A scientific assessment. J. Geophys. Res. Atmos. 2013, 118, 5380–5552. [Google Scholar] [CrossRef]
  7. Tian, P.; Zhang, L.; Ma, J.; Tang, K.; Xu, L.; Wang, Y.; Cao, X.; Liang, J.; Ji, Y.; Jiang, J.H.; et al. Radiative absorption enhancement of dust mixed with anthropogenic pollution over East Asia. Atmos. Chem. Phys. 2018, 18, 7815–7825. [Google Scholar] [CrossRef]
  8. Li, Z.Q.; Xu, H.; Li, K.T.; Li, D.H.; Xie, Y.S.; Li, L.; Zhang, Y.; Gu, X.F.; Zhao, W.; Tian, Q.J.; et al. Comprehensive study of optical, physical, chemical, and radiative properties of total columnar atmospheric aerosols over China: An overview of Sun–Sky Radiometer Observation Network (SONET) measurements. Bull. Am. Meteorol. Soc. 2018, 99, 739–755. [Google Scholar] [CrossRef]
  9. Sutherland, B.; Meskhidze, N. Type-based assessment of aerosol direct radiative effects: A proof-of-concept using GEOS-Chem and CATCH. Atmos. Res. 2025, 320, 108036. [Google Scholar] [CrossRef]
  10. Elshora, M.; Xia, H.; Su, L.; Wei, T. Observation and study of consecutive dust storms in the Taklimakan desert from March 16 to 27, 2022, using reanalysis models and lidar. Atmos. Res. 2024, 305, 107431. [Google Scholar] [CrossRef]
  11. Wang, X.; Cai, D.; Chen, S.; Lou, J.; Liu, F.; Jiao, L.; Chen, H.; Zhang, C.; Hua, T.; Che, H. Spatio-temporal trends of dust emissions triggered by desertification in China. Catena 2021, 200, 105160. [Google Scholar] [CrossRef]
  12. Chen, G.; Wang, W.C.; Chen, J.P. Circulation responses to regional aerosol climate forcing in summer over East Asia. Clim. Dyn. 2018, 51, 3973–3984. [Google Scholar] [CrossRef]
  13. Che, H.; Qi, B.; Zhao, H.; Xia, X.; Eck, T.F.; Goloub, P.; Dubovik, O.; Estelles, V.; Cuevas-Agulló, C.; Blarel, L.; et al. Aerosol optical properties and direct radiative forcing based on measurements from the China Aerosol Remote Sensing Network (CARSNET) in eastern China. Atmos. Chem. Phys. 2018, 18, 405–425. [Google Scholar] [CrossRef]
  14. Ginoux, P.; Prospero, J.M.; Gill, T.E.; Hsu, N.C.; Zhao, M. Global-scale attribution of anthropogenic and natural dust sources and their emission rates based on MODIS Deep Blue aerosol products. Rev. Geophys. 2012, 50. [Google Scholar] [CrossRef]
  15. Li, J.; He, Q.; Jin, L.; Ge, X. Three-dimensional distribution of dust aerosols over the Tarim Basin and the Tibet Plateau during 2007–2021 derived from CALIPSO lidar observations. J. Clean. Prod. 2023, 400, 136746. [Google Scholar] [CrossRef]
  16. Wang, Z.; Huang, X.; Huang, Q.; Ding, A. Environmental impacts of aerosol radiative effect and urbanization and their interactions over the Beijing-Tianjin-Hebei City cluster. Urban Clim. 2024, 56, 102020. [Google Scholar] [CrossRef]
  17. Aili, A.; Xu, H.; Kasim, T.; Abulikemu, A. Origin and transport pathway of dust storm and its contribution to particulate air pollution in northeast edge of Taklimakan Desert, China. Atmosphere 2021, 12, 113. [Google Scholar] [CrossRef]
  18. Xing, C.; Liu, C.; Wu, H.; Lin, J.; Wang, F.; Wang, S.; Gao, M. Ground-based vertical profile observations of atmospheric composition on the Tibetan Plateau (2017–2019). Earth Syst. Sci. Data 2021, 13, 4897–4912. [Google Scholar] [CrossRef]
  19. Li, Z.; Xia, X.; Cribb, M.; Mi, W.; Holben, B.; Wang, P.; Chen, H.; Tsay, S.; Eck, F.T.; Zhao, F.; et al. Aerosol optical properties and their radiative effects in northern China. J. Geophys. Res. Atmos. 2007, 112. [Google Scholar] [CrossRef]
  20. Estellés, V.; Campanelli, M.; Utrillas, M.P.; Expósito, F.; Martínez-Lozano, J.A. Comparison of AERONET and SKYRAD4. 2 inversion products retrieved from a Cimel CE318 sun-photometer. Atmos. Meas. Tech. 2012, 5, 569–579. [Google Scholar] [CrossRef]
  21. Karakaş, S.Y.; Tuncel, S.G. Chemical characteristics of atmospheric aerosols in a rural site of northwestern Anatolia. Atmos. Environ. 1997, 31, 2933–2943. [Google Scholar] [CrossRef]
  22. Li, K.; Ma, Y.; Li, L.; Huang, B. Chemical Composition and Mixing State of Fine Particles during Haze Periods in Yinchuan. Aerosol Air Qual. Res. 2023, 23, 230116. [Google Scholar] [CrossRef]
  23. Li, J.; Carlson, B.E.; Dubovik, O.; Lacis, A.A. Recent trends in aerosol optical properties derived from AERONET measurements. Atmos. Chem. Phys. 2014, 14, 12271–12289. [Google Scholar] [CrossRef]
  24. Liu, Y.; Sato, Y.; Jia, R.; Xie, Y.; Huang, J.; Nakajima, T. Modeling study on the transport of summer dust and anthropogenic aerosols over the Tibetan Plateau. Atmos. Chem. Phys. 2015, 15, 12581–12594. [Google Scholar] [CrossRef]
  25. Yang, Y.; Russell, L.M.; Lou, S.; Liao, H.; Guo, J.; Liu, Y.; Singh, B.; Ghan, S.J. Dust-wind interactions can intensify aerosol pollution over eastern China. Nat. Commun. 2017, 8, 15333. [Google Scholar] [CrossRef]
  26. Yang, X.; Shen, S.; Yang, F.; He, Q.; Ali, M.; Huo, W.; Liu, X. Spatial and temporal variations of blowing dust events in the Taklimakan Desert. Theor. Appl. Climatol. 2016, 125, 669–677. [Google Scholar] [CrossRef]
  27. Yang, M.; Howell, S.G.; Zhuang, J.; Huebert, B.J. Attribution of aerosol light absorption to black carbon, brown carbon, and dust in China–interpretations of atmospheric measurements during EAST-AIRE. Atmos. Chem. Phys. 2009, 9, 2035–2050. [Google Scholar] [CrossRef]
  28. Zhang, Q.; Jimenez, J.L.; Canagaratna, M.R.; Allan, J.D.; Coe, H.; Ulbrich, I.; Alfarra, M.R.; Takami, A.; Middlebrook, A.M.; Sun, Y.L.; et al. Ubiquity and dominance of oxygenated species in organic aerosols in anthropogenically-influenced Northern Hemisphere midlatitudes. Geophys. Res. Lett. 2007, 34. [Google Scholar] [CrossRef]
  29. Huang, R.J.; Zhang, Y.; Bozzetti, C.; Ho, K.F.; Cao, J.J.; Han, Y.; Daellenbach, K.R.; Slowik, J.G.; Platt, S.M.; Canonaco, M.; et al. High secondary aerosol contribution to particulate pollution during haze events in China. Nature 2014, 514, 218–222. [Google Scholar] [CrossRef] [PubMed]
  30. Wen, W.; Guo, C.; Ma, X.; Zhao, X.; Chen, D.; Xu, J. Impact of emission reduction on aerosol-radiation interaction during heavy pollution periods over Beijing-Tianjin-Hebei region in China. J. Environ. Sci. 2020, 95, 2–13. [Google Scholar] [CrossRef] [PubMed]
  31. Liu, J.; Zheng, Y.; Li, Z.; Wu, R. Ground-based remote sensing of aerosol optical properties in one city in Northwest China. Atmos. Res. 2008, 89, 194–205. [Google Scholar] [CrossRef]
  32. An, Z.; Huang, R.J.; Zhang, R.; Tie, X.; Li, G.; Cao, J.; Zhou, W.; Shi, Z.; Han, Y.; Gu, Z.; et al. Severe haze in northern China: A synergy of anthropogenic emissions and atmospheric processes. Proc. Natl. Acad. Sci. USA 2019, 116, 8657–8666. [Google Scholar] [CrossRef]
  33. Chen, Y.; Ebenstein, A.; Greenstone, M.; Li, H. Evidence on the impact of sustained exposure to air pollution on life expectancy from China’s Huai River policy. Proc. Natl. Acad. Sci. USA 2013, 110, 12936–12941. [Google Scholar] [CrossRef] [PubMed]
  34. Ramachandran, S.; Rupakheti, M.; Lawrence, M.G. Aerosol-induced atmospheric heating rate decreases over South and East Asia as a result of changing content and composition. Sci. Rep. 2020, 10, 20091. [Google Scholar] [CrossRef] [PubMed]
  35. Cappa, C.D.; Onasch, T.B.; Massoli, P.; Worsnop, D.R.; Bates, T.S.; Cross, E.S.; Davidovits, P.; Hakala, J.; Hayden, K.L.; Jobson, B.T.; et al. Radiative absorption enhancements due to the mixing state of atmospheric black carbon. Science 2012, 337, 1078–1081. [Google Scholar] [CrossRef]
  36. Zheng, H.; Kong, S.; Chen, N.; Wu, C. Secondary inorganic aerosol dominated the light absorption enhancement of black carbon aerosol in Wuhan, Central China. Atmos. Environ. 2022, 287, 119288. [Google Scholar] [CrossRef]
  37. Wang, Q.; Sun, Y.; Xu, W.; Du, W.; Zhou, L.; Tang, G.; Chen, C.; Cheng, X.; Zhao, X.; Ji, D.; et al. Vertically resolved characteristics of air pollution during two severe winter haze episodes in urban Beijing, China. Atmos. Chem. Phys. 2018, 18, 2495–2509. [Google Scholar] [CrossRef]
  38. Liu, S.; Aiken, A.C.; Gorkowski, K.; Dubey, M.K.; Cappa, C.D.; Williams, L.R.; Herndon, S.C.; Massoli, P.; Fortner, E.C.; Chhabra, P.S.; et al. Enhanced light absorption by mixed source black and brown carbon particles in UK winter. Nat. Commun. 2015, 6, 8435. [Google Scholar] [CrossRef]
  39. Cheng, Y.; He, K.; Engling, G.; Weber, R.; Liu, J.M.; Du, Z.Y.; Dong, S.P. Brown and black carbon in Beijing aerosol: Implications for the effects of brown coating on light absorption by black carbon. Sci. Total Environ. 2017, 599, 1047–1055. [Google Scholar] [CrossRef]
  40. Bellouin, N.; Quaas, J.; Gryspeerdt, E.; Kinne, S.; Stier, P.; Watson-Parris, D.; Boucher, O.; Carslaw, K.S.; Christensen, M.; Daniau, A.L.; et al. Bounding global aerosol radiative forcing of climate change. Rev. Geophys. 2020, 58, e2019RG000660. [Google Scholar] [CrossRef]
  41. Wang, F.; Li, Z.; Jiang, Q.; Ren, X.; He, H.; Tang, Y.; Dong, X.; Sun, Y.; Dickerson, R.R. Comparative Analysis of Aerosol Vertical Characteristics over the North China Plain Based on Multi-Source Observation Data. Remote Sens. 2024, 16, 609. [Google Scholar] [CrossRef]
Figure 1. Map of the Yinchuan study area, showing the CE-318 sun-photometer location (red star) and surrounding deserts (Badain Jaran, Tengger (Name of the desert), etc.).
Atmosphere 16 00718 g001
Figure 2. Research on the synergistic radiative effects of dust and anthropogenic aerosols.
Atmosphere 16 00718 g002
Figure 3. (a) Seasonal variations in aerosol optical depth (AOD) at various wavelengths in the Yinchuan region during 2023. (b) The HYSPLIT backward trajectory clustering diagram of the four seasons in the Yinchuan area (Note: In the figure, 38.50 N 106.20 E represents 38.50° N, 106.20° E).
Atmosphere 16 00718 g003
Figure 4. The monthly variation trend of the Ångström Index.
Atmosphere 16 00718 g004
Figure 5. (a) Single-scattering albedo (SSA) at different wavelengths across various seasons. (b) Seasonal characteristics of aerosol size distribution in the Yinchuan Region.
Atmosphere 16 00718 g005
Figure 6. Variation trend of aerosol direct radiative forcing in the Yinchuan region during 2023.
Atmosphere 16 00718 g006
Figure 7. Vertical profiles of heating rate (K day−1) for four aerosol scenarios (dust, anthropogenic, external mixing, and internal mixing) in Yinchuan, 2023.
Atmosphere 16 00718 g007
Figure 8. Vertical profiles of net flux for four scenarios.
Atmosphere 16 00718 g008
Figure 9. (a) Variation of Direct Flux Attenuation with wavelength under four scenarios, (b) Variation of Diffuse Fraction at Surface with wavelength under four scenarios.
Atmosphere 16 00718 g009
Figure 10. Direct radiative forcing of aerosols under four scenarios.
Atmosphere 16 00718 g010
Table 1. Direct radiative forcing of aerosols under four scenarios (TOA: top of the atmosphere, BOA: bottom of the atmosphere (surface), and ATM: atmosphere).
Different ScenariosTOABOAATM
Dust (W m−2)−14.11 ± 5.2−28.96 ± 6.814.85 ± 4.2
Anthrop (W m−2)−10.34 ± 4.8−19.30 ± 5.68.97 ± 3.4
External Mixing (W m−2)−24.75 ± 7.6−50.47 ± 8.225.72 ± 6.0
Internal Mixing (W m−2)−14.35 ± 7.1−66.60 ± 9.452.25 ± 9.8
Disclaimer/Publisher’s Note: The statements, opinions and data contained in all publications are solely those of the individual author(s) and contributor(s) and not of MDPI and/or the editor(s). MDPI and/or the editor(s) disclaim responsibility for any injury to people or property resulting from any ideas, methods, instructions or products referred to in the content.

