Author Contributions
Conceptualization, F.M. and J.H.P.; methodology, F.M. and J.H.P.; software, F.M.; validation, F.M. and J.H.P.; formal analysis, F.M., J.H.P. and O.M.; investigation, F.M., J.H.P., Y.G. and P.R.H.; resources, J.H.P.; data curation, F.M., J.H.P., Y.G., P.R.H., M.M., E.A.-Q. and M.A.M.R.; writing—original draft preparation, F.M.; writing—review and editing, J.H.P., Y.G., P.R.H., O.M., M.M., E.A.-Q. and M.A.M.R.; supervision, J.H.P. and Y.G.; project administration, J.H.P.; funding acquisition, J.H.P. All authors have read and agreed to the published version of the manuscript.
Figure 1.
Case study—Zarrineh-Rood River, West Azerbaijan, Iran.
Figure 1.
Case study—Zarrineh-Rood River, West Azerbaijan, Iran.
Figure 2.
Location of hydro-climatic stations and dams along the river.
Figure 2.
Location of hydro-climatic stations and dams along the river.
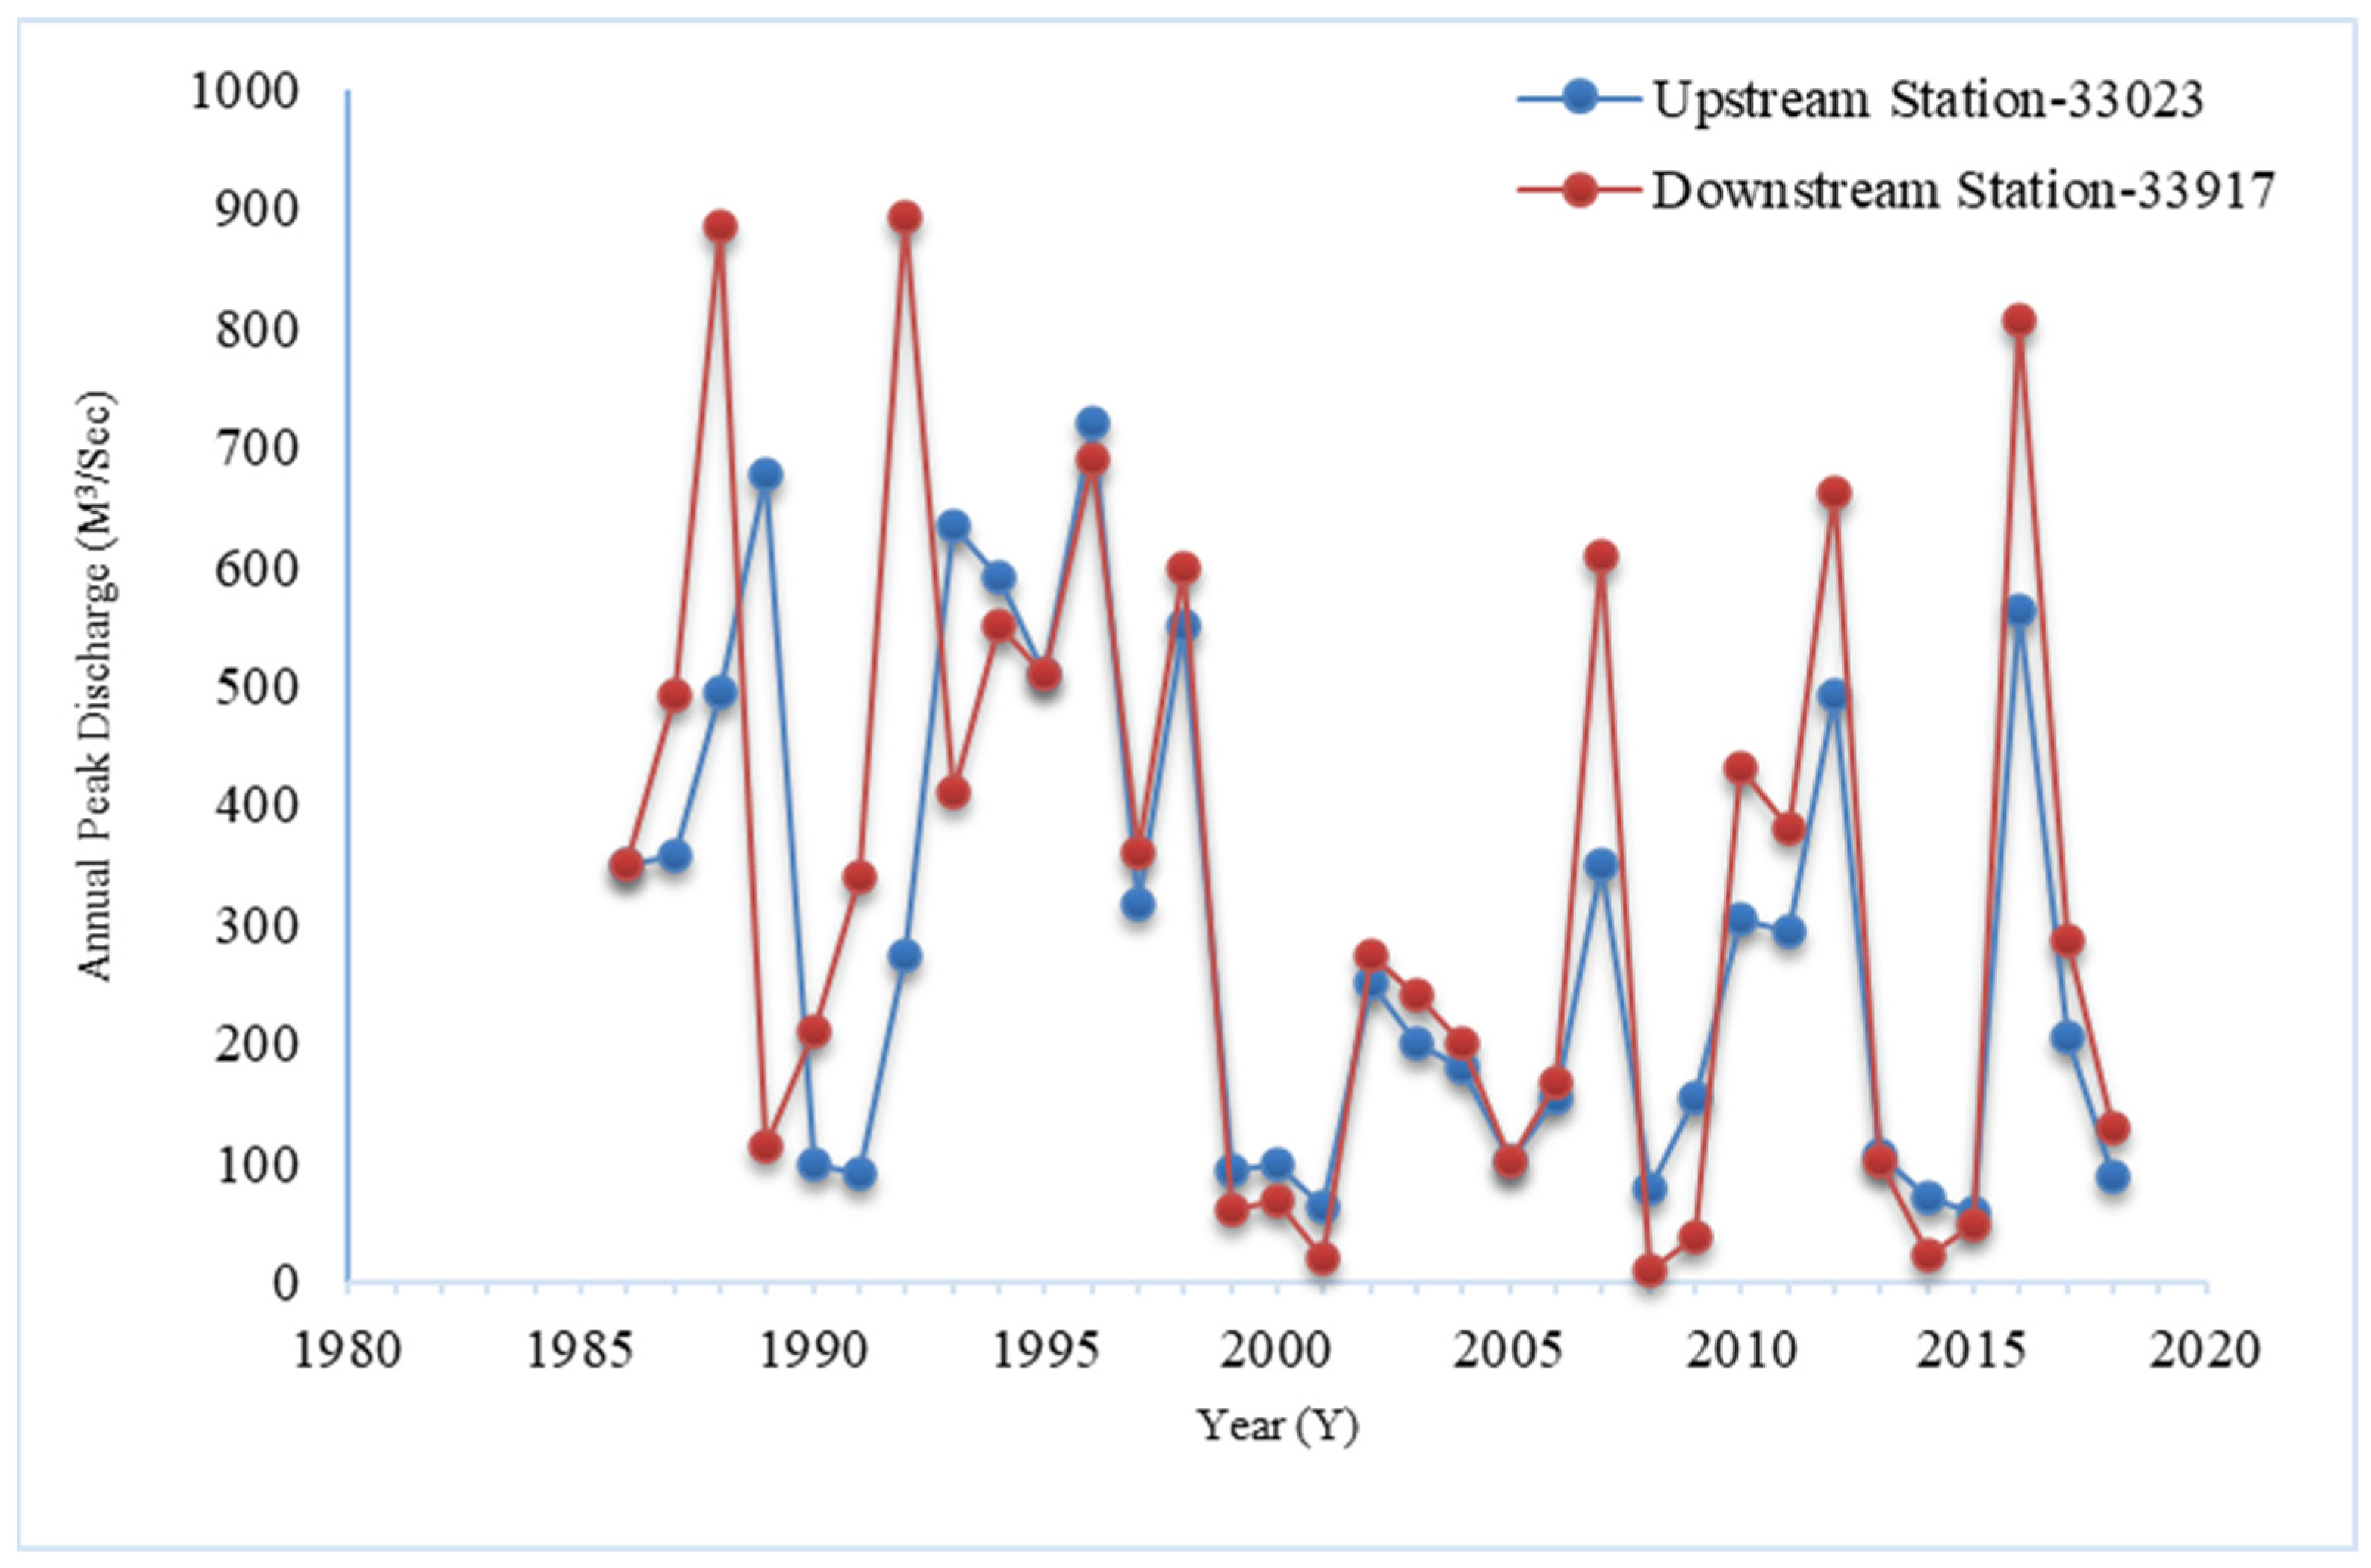
Figure 3.
Hydrographs of upstream-33023 and downstream-33917 stations of Zarrinehrud River.
Figure 3.
Hydrographs of upstream-33023 and downstream-33917 stations of Zarrinehrud River.
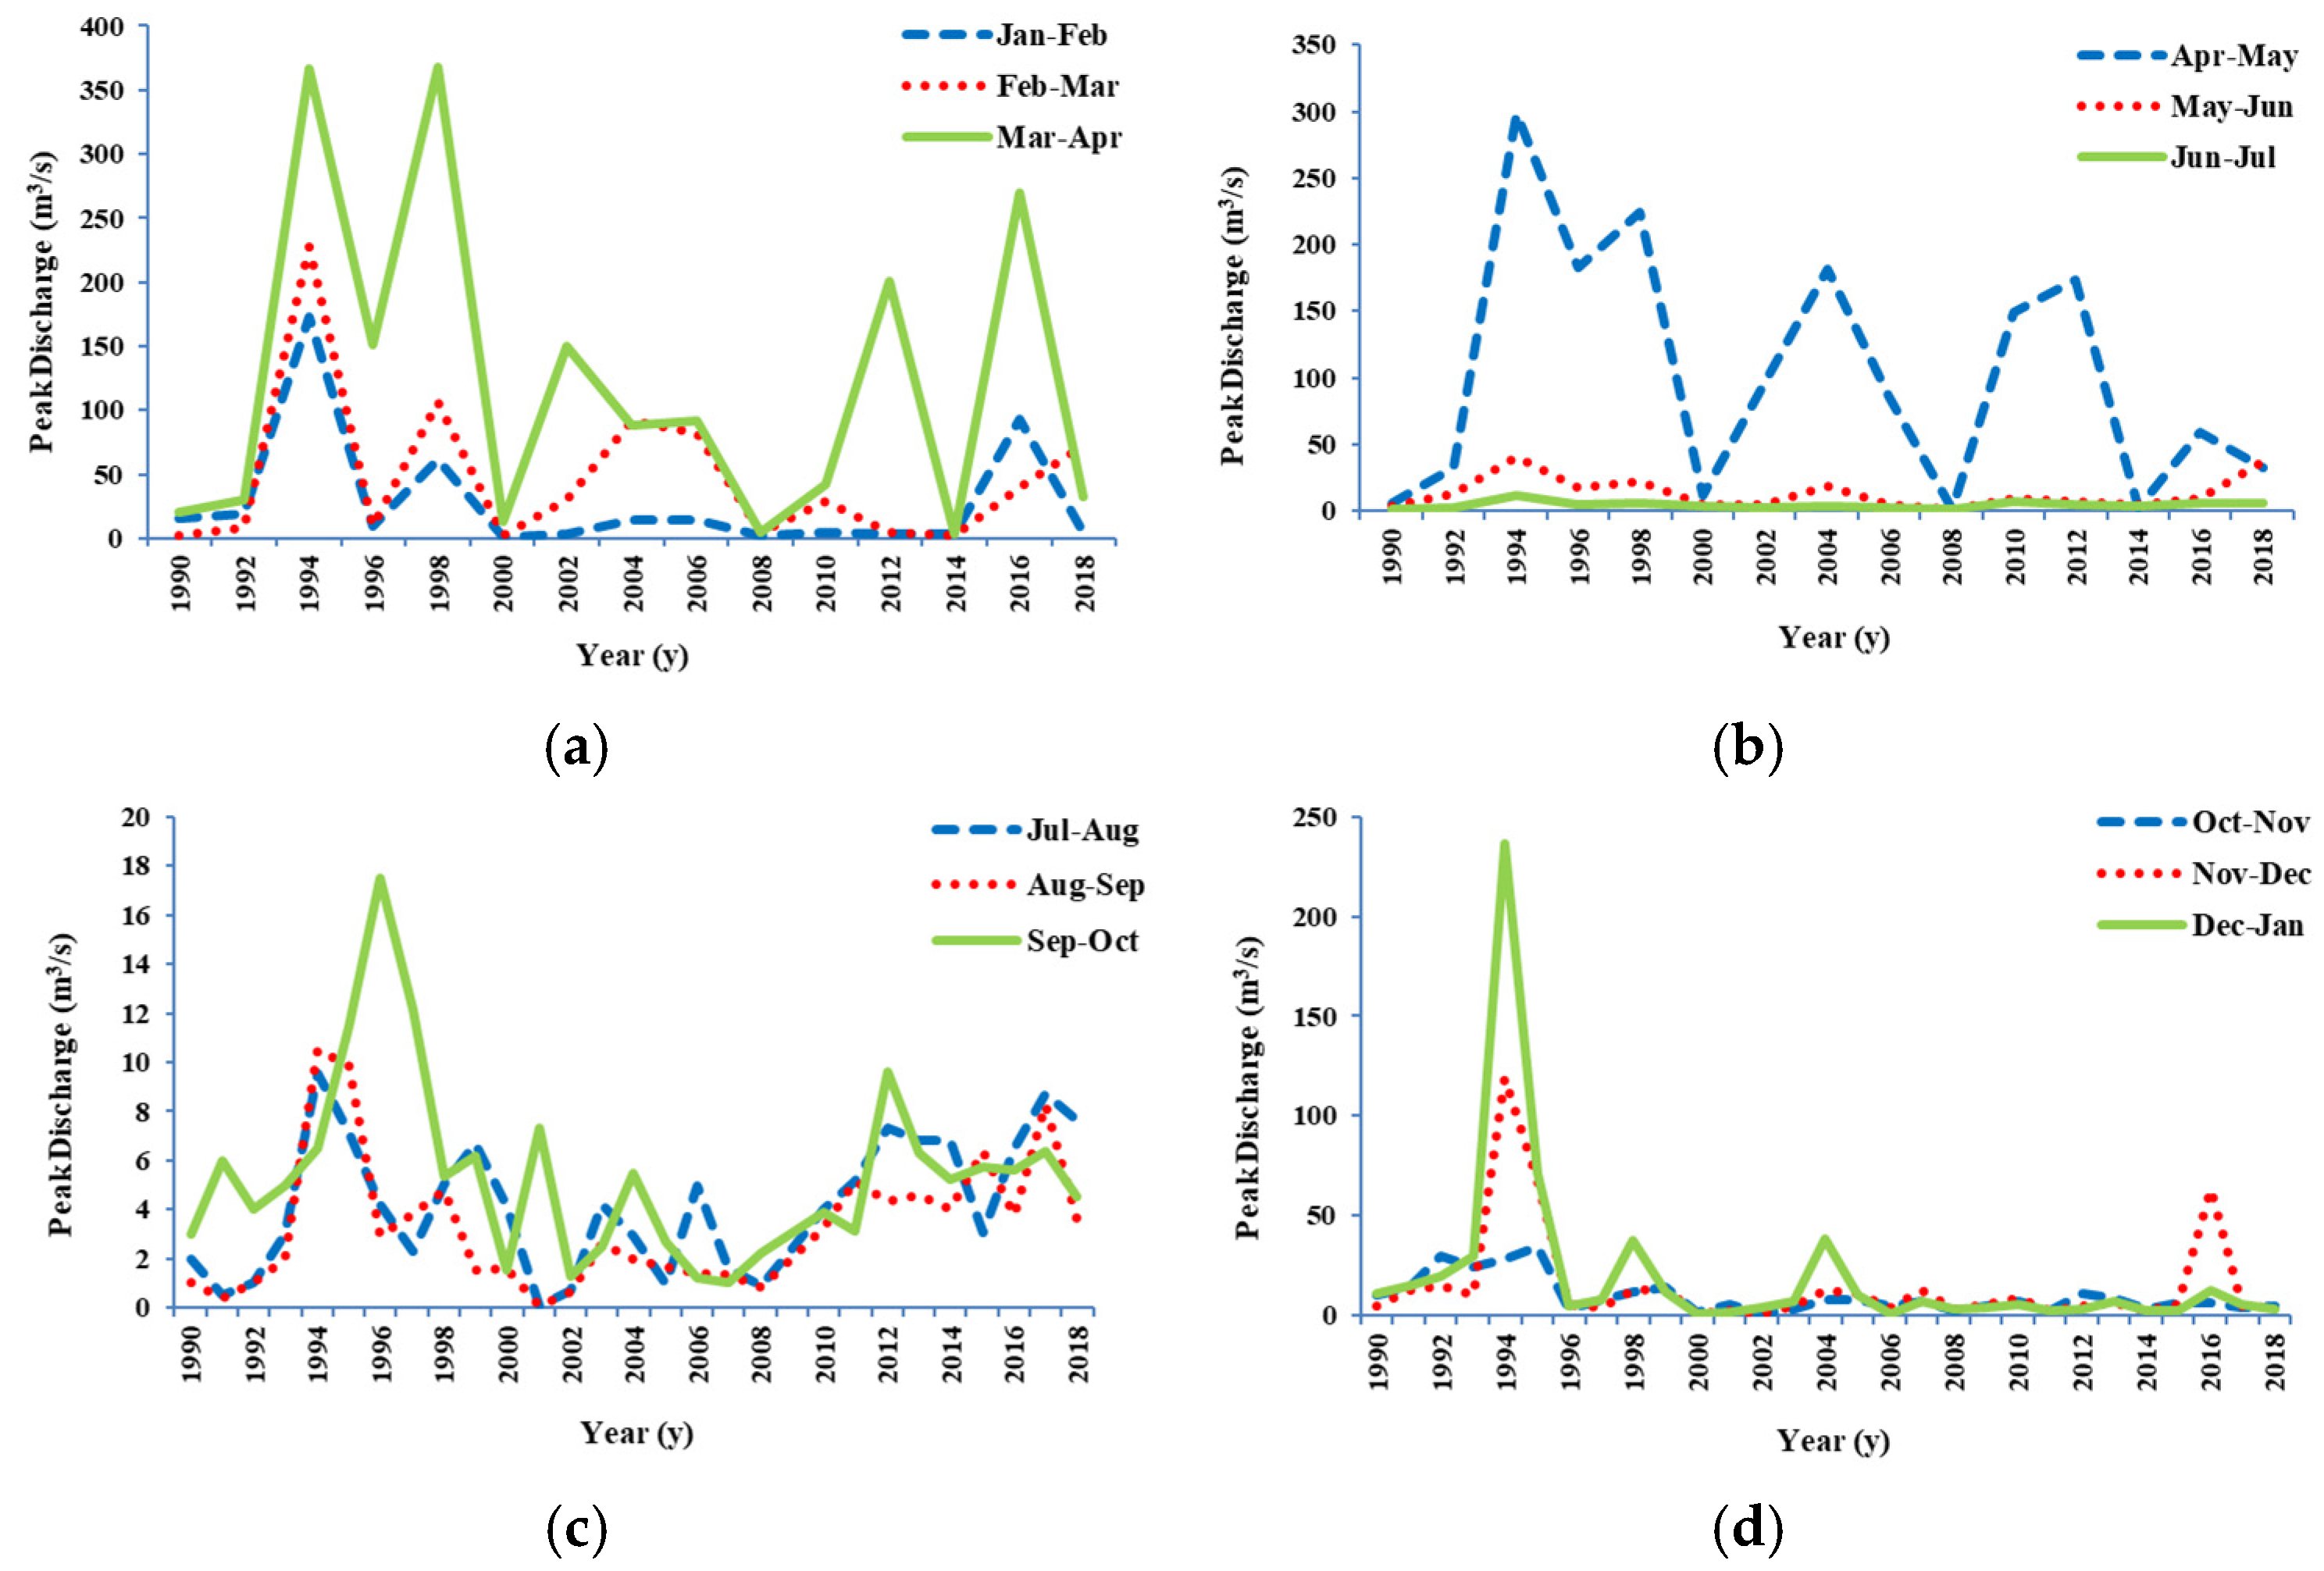
Figure 4.
Seasonal peak discharge at the upstream-33023 station: (a) winter, (b) spring, (c) summer and (d) autumn.
Figure 4.
Seasonal peak discharge at the upstream-33023 station: (a) winter, (b) spring, (c) summer and (d) autumn.
Figure 5.
Seasonal peak discharge at the downstream-33917 station: (a) winter, (b) spring, (c) summer and (d) autumn.
Figure 5.
Seasonal peak discharge at the downstream-33917 station: (a) winter, (b) spring, (c) summer and (d) autumn.
Figure 6.
Precipitation at upstream-33023 station in 1990s: (a) winter, (b) spring, (c) summer (d) autumn.
Figure 6.
Precipitation at upstream-33023 station in 1990s: (a) winter, (b) spring, (c) summer (d) autumn.
Figure 7.
Precipitation at upstream-33023 station in 2000s: (a) winter, (b) spring, (c) summer (d) autumn.
Figure 7.
Precipitation at upstream-33023 station in 2000s: (a) winter, (b) spring, (c) summer (d) autumn.
Figure 8.
Precipitation at upstream-33023 station in 2010s: (a) winter, (b) spring, (c) summer (d) autumn.
Figure 8.
Precipitation at upstream-33023 station in 2010s: (a) winter, (b) spring, (c) summer (d) autumn.
Figure 9.
Precipitation at downstream-33917 station in 1900s: (a) winter, (b) spring, (c) summer and (d) autumn.
Figure 9.
Precipitation at downstream-33917 station in 1900s: (a) winter, (b) spring, (c) summer and (d) autumn.
Figure 10.
Precipitation at downstream-33917 station in 2000s: (a) winter, (b) spring, (c) summer (d) autumn.
Figure 10.
Precipitation at downstream-33917 station in 2000s: (a) winter, (b) spring, (c) summer (d) autumn.
Figure 11.
Precipitation at downstream-33917 station in 2010s: (a) winter, (b) spring, (c) summer (d) autumn.
Figure 11.
Precipitation at downstream-33917 station in 2010s: (a) winter, (b) spring, (c) summer (d) autumn.
Figure 12.
Temperature at the upstream-33023 in 1990s, (a) Winter, (b) Spring, (c) Summer, (d) Autumn.
Figure 12.
Temperature at the upstream-33023 in 1990s, (a) Winter, (b) Spring, (c) Summer, (d) Autumn.
Figure 13.
Monthly temperature at the upstream-33023 in 2000s, (a) Winter, (b) Spring, (c) Summer, (d) Autumn.
Figure 13.
Monthly temperature at the upstream-33023 in 2000s, (a) Winter, (b) Spring, (c) Summer, (d) Autumn.
Figure 14.
Monthly temperature at the upstream-33023 in 2010s, (a) Winter, (b) Spring, (c) Summer, (d) Autumn.
Figure 14.
Monthly temperature at the upstream-33023 in 2010s, (a) Winter, (b) Spring, (c) Summer, (d) Autumn.
Figure 15.
Monthly temperature at the downstream-33917 in 1990s, (a) Winter, (b) Spring, (c) Summer, (d) Autumn.
Figure 15.
Monthly temperature at the downstream-33917 in 1990s, (a) Winter, (b) Spring, (c) Summer, (d) Autumn.
Figure 16.
Monthly temperature at the downstream-33917 in 2000s, (a) Winter, (b) Spring, (c) Summer, (d) Autumn.
Figure 16.
Monthly temperature at the downstream-33917 in 2000s, (a) Winter, (b) Spring, (c) Summer, (d) Autumn.
Figure 17.
Monthly temperature at the downstream-33917 in 2010s, (a) Winter, (b) Spring, (c) Summer, (d) Autumn.
Figure 17.
Monthly temperature at the downstream-33917 in 2010s, (a) Winter, (b) Spring, (c) Summer, (d) Autumn.
Figure 18.
Statistical analysis of river peak discharge for upstream-33023 station.
Figure 18.
Statistical analysis of river peak discharge for upstream-33023 station.
Figure 19.
Statistical analysis of river peak discharge for downstream-33917 station.
Figure 19.
Statistical analysis of river peak discharge for downstream-33917 station.
Table 1.
The statistical tests.
Table 1.
The statistical tests.
| Kolmogorov–Smirnov (K–S) Test | Good for general fitting. Works best with continuous distributions like Normal, Lognormal, Weibull, etc. |
| Anderson–Darling (A–D) Test | Excellent for flood peak data, because extreme values matter a lot. |
| Mann–Kendall | Used for trend detection in time-series data (discharge over time) |
| Sen’s Slope Estimator | Calculates the magnitude of the trend detected by Mann–Kendall |
Table 2.
Regression analysis of monthly river peak discharge.
Table 2.
Regression analysis of monthly river peak discharge.
| Stations | R2 | Statistical Equation | Months with the Highest R2 |
|---|
| Upstream-33023 | 0.786 | y = 0.0574x2 − 2.6859x + 42.976 | September–October |
| Downstream-33917 | 0.845 | y = 60.39x−0.967 | December–January |
Table 3.
Regression analysis of monthly precipitation for upstream-33023 station.
Table 3.
Regression analysis of monthly precipitation for upstream-33023 station.
| Stations | R2 | Statistical Equation | Months with the Highest R2 |
|---|
| Upstream-33023 | 0.661 | y = 36.487x−0.163 | September–October 1990s |
| | 0.719 | y = −2.2008x2 + 23.011x − 6.2833 | April–May 2000s |
| | 0.829 | y = 4.7816x2 − 55.719x + 181.69 | April–May 2010s |
Table 4.
Regression analysis of monthly precipitation for downstream-33917 station.
Table 4.
Regression analysis of monthly precipitation for downstream-33917 station.
| Stations | R2 | Statistical Equation | Months with the Highest R2 |
|---|
| Downstream-33917 | 0.435 | y = −1.9089x2 + 16.424x + 29.313 | March–April 1990s |
| | 1 | y = 3.0625x2 − 35.875x + 109.5 | May–June 2000s |
| | 0.921 | y = 1.4792x2 − 17.017x + 46.438 | May–June 2010s |
Table 5.
The regression analysis of the monthly temperatures for the upstream-33023 station.
Table 5.
The regression analysis of the monthly temperatures for the upstream-33023 station.
| Stations | R2 | Statistical Equation | Months with the Highest R2 |
|---|
| Upstream-33023 | 0.818 | y = 0.4475x2 − 1786.7x + 2E+06 | September–October 1990s |
| | 0.668 | y = −1.0428x2 + 4181.7x − 4E+06 | November–December 2000s |
| | 0.784 | y = −0.2416x2 + 974.75x − 983074 | September–October 2010s |
Table 6.
The regression analysis of the monthly temperature for the downstream-33917 station.
Table 6.
The regression analysis of the monthly temperature for the downstream-33917 station.
| Stations | R2 | Statistical Equation | Months with the Highest R2 |
|---|
| Downstream-33917 | 0.839 | y = −1.8727x2 + 7456.1x − 7E+06 | July–August 1990s |
| | 0.567 | y = −3.8468x2 + 15426x − 2E+07 | April–May 2000s |
| | 0.779 | y = 2.6058x2 − 10491x + 1E+07 | April–May 2010s |
Table 7.
The statistical Kolmogorov–Smirnov test for the monthly river peak discharge for both stations.
Table 7.
The statistical Kolmogorov–Smirnov test for the monthly river peak discharge for both stations.
| Location | Distribution | K–S Statistic | p-Value |
|---|
| Upstream-33023 | Normal | 0.2316 | 0.0000 |
| | Lognormal | 0.0962 | 0.0012 |
| | Gamma | 0.1027 | 0.0004 |
| | Weibull | 0.0901 | 0.0030 |
| Downstream-33917 | Normal | 0.4241 | 0.0000 |
| | Lognormal | 0.1736 | 0.0000 |
| | Gamma | 0.9313 | 0.0000 |
| | Weibull | 0.3725 | 0.0000 |
| | Normal | 0.4241 | 0.0000 |


 ,
, 


