Abstract
Global warming and the increasing frequency and intensity of heat waves are resulting in more frequent unfavourable weather conditions for outdoor activities, especially during the summer. The building environment can alter weather conditions, resulting in higher temperatures (urban heat island). Human towers are cultural activities that typically take place outdoors and were declared a UNESCO Intangible Cultural Heritage in 2010. The objectives of this study are (i) to analyse the weather conditions (i.e., temperature and relative humidity) during the human tower exhibitions, (ii) to determine discomfort during the exhibitions based on the heat index (HI) resulting from the combination of temperature and humidity, and (iii) to compare records from the square with those recorded in the nearest automatic meteorological station (AMS) belonging to the Catalan Meteorological Service network. To determine the weather conditions in the squares during the human tower exhibitions, a pair of sensors recorded temperature and relative humidity data in six exhibitions performed in the summer of 2024. The temperature exceeded 30 °C in five of the six human tower exhibitions analysed. In the cases of the Santa Anna exhibition (El Vendrell) and the Sant Fèlix exhibition (Vilafranca del Penedès), one of the sensors recorded temperatures above 30 °C throughout the entire duration of the exhibition. There was a predominance of HI values falling within the caution threshold in the two sensors of three exhibitions and within the extreme caution threshold in the two sensors of the other three exhibitions. The temperature is higher in urban squares than in the surrounding rural areas. The key factor is the urban heat island phenomenon, which poses health risks to both human tower builders and attendees. Adaptation measures are therefore necessary to guarantee the safety of the participants.
1. Introduction
Global warming and the increasing frequency and intensity of heat waves are resulting in more frequent unfavourable weather conditions for outdoor activities, especially those involving high-intensity efforts during the summer, leading to a decrease in outdoor physical activities [1,2,3,4,5]. Human towers (castells) are a physical activity that typically takes place outdoors in a town (Figure 1). The goal is to adopt different structures, all of which feature a central column called the trunk that is at least one human tower builder (casteller) wide. The tallest human tower ever built has ten tiers. A tight group of castellers known as the core surrounds the base of the trunk to provide stability [6].
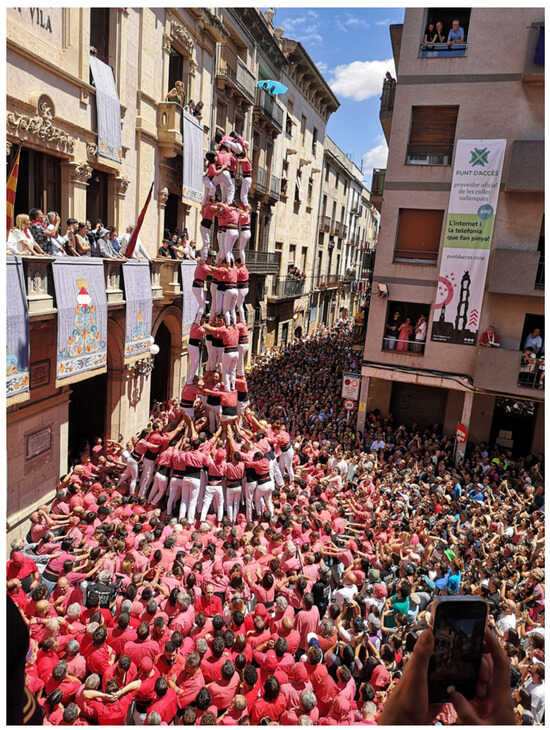
Figure 1.
Human tower exhibition in Valls (24 June 2024). Source: Òscar Saladié.
The weather influences outdoor activities [7,8]; due to the increasing temperatures associated with climate change and other meteorological factors such as solar radiation exposure, wind and relative humidity (RH), the likelihood of unfavourable weather conditions coinciding with a human tower exhibition is greater. Unfavourable outdoor thermal conditions can negatively impact public health, overall wellbeing, and the thermal comfort of individuals [9,10]. According to He et al. [11], thermal comfort is a complex issue influenced by both direct (i.e., physiological, physical, and psychological) and indirect factors (i.e., individual, social, and cultural). Aghamolaei et al. [12] conducted a thorough literature review of outdoor thermal comfort in urban areas and identified two main factors: human and environmental. Human factors include individual psychological and physiological aspects, as well as social factors such as cultural and economic influences, and environmental factors encompass basic meteorological and climatic factors, along with physical elements such as materials, landscape, and urban environment geometry.
Human tower exhibitions take primarily place in squares, which are semi-enclosed locations surrounded by buildings [13]. The building environment can alter weather conditions, resulting in higher temperatures [14,15,16]. This phenomenon, known as the urban heat island (UHI), involves a rise in urban temperatures that amplifies temperature differences with the surrounding rural areas [17]. The increased warming is largely caused by anthropogenic heat released in the towns, their geometry and the materials used in buildings, streets and other constructs [18]. The higher number of sealed surfaces and the decrease in the amount of bare soil and vegetation lead to lower latent heat flux originating from evapotranspiration [19]. Outgoing longwave radiation is typically lower in towns because radiation is trapped in the materials within the town’s geometry, resulting in a change in heat capacities [20]. Albedo values in urban areas are lower than in surrounding non-urban areas [21]. Furthermore, ventilation is limited in certain areas of a town because wind speed is usually reduced in urban canyons, which intensifies urban warming [22]. UHI has been documented in cities worldwide [23,24,25,26,27,28]. UHI has also been observed in small towns [29]. Urbanisation and global warming are dynamic processes that amplify the UHI intensity and heat waves, as well as their synergies [30]. Mandic et al. [31] conducted a comprehensive systematic review of outdoor thermal comfort studies focusing on city squares.
The academic literature has explored the effects of outdoor air temperature on the health of outdoor workers [32]. Amoadu et al. [33] and Ioannou et al. [34] conducted a thorough literature review. The results show that age, gender, physically demanding work, high workload, low job control, use of inappropriate personal protective equipment, piece-rate payment, poor access to sanitation facilities, and pre-shift dehydration are risk factors for dehydration, heat-related illness, kidney diseases, and mental distress. Physical work capacity is projected to be highly affected by the ongoing anthropogenic global warming.
The academic literature has also analysed the relationship between weather and thermal comfort in various sports [35,36,37]. Safety requirements need to be clearly defined and implemented to safeguard the health of participants in leisure and sports activities and the attending public [38]. Adaptation measures are therefore necessary to deal with increasingly frequent and intense heat waves [39,40,41].
The castellers must meet great physical and psychological demands, and the squares become crowded with castellers and spectators during the human tower exhibitions. High temperatures experienced during specific human tower exhibitions, particularly in the summer of 2023, have raised concerns that global warming may negatively impact human tower exhibitions; this was highlighted in two opinion pieces published in the magazine Castells [42,43]. High temperatures can pose a threat to the health and safety of castellers participating in a human tower exhibition and cause heat stroke and dehydration. They can also negatively affect participants’ concentration and physical endurance. Additionally, these risks extend to the attendees in the square. Human tower exhibitions must be held under optimal conditions to achieve the established objectives and prevent the structure from collapsing. It is, therefore, important to take climate change and the potential increase in unfavourable weather conditions into account. In October 2023, a roundtable discussion was held to address this issue as part of the XI Casteller Symposium [44]. This topic was also discussed at the XXVIII Meeting for Injury Prevention in Human Tower Activities in March 2024 [45].
Human towers are also a cultural activity that was declared a UNESCO Intangible Cultural Heritage in 2010 [46]. The impact of climate change on cultural heritage is relatively unexplored compared to other activities and even less so in the case of intangible heritage. The number of publications addressing the impact of climate change on cultural heritage has increased in recent years, as stated in comprehensive literature reviews on the physical impact of climate change on cultural heritage and mitigation and adaptation strategies [47,48,49,50]. Community traditions, rituals and practices can be significantly affected by environmental alterations and changing conditions [51,52,53]. Fatoric and Daly [54] proposed an approach to determine whether climate adaptation can be developed and implemented in the heritage sector to simultaneously reduce the impact of climate change on tangible and intangible cultural heritage. More recently, the Intangible Cultural Heritage Non-Governmental Organization Forum approved the Declaration for the Safeguarding of Intangible Cultural Heritage for Climate Action [55].
Among the literature on urban climate, climate change and thermal comfort, only Olano Pozo et al. [56] have analysed human tower exhibitions. The results show a significant increase in temperature during four of the most important human tower exhibitions between 1951 and 2023, all of which were scheduled in the summer. Additionally, there was a worsening of weather conditions in relation to this activity, as indicated by the heat index (HI). The same study warned about a potential increase in heat cramps and heat stroke among both castellers and attendees of the human tower exhibitions, highlighting the need for strategies to adapt exhibitions to new climate conditions.
Hambrecht and Rockman [57] proposed a framework for addressing climate change and cultural heritage that focuses on four elements: research, adaptation, mitigation, and communication. Olano Pozo et al. [56] addressed the first element. Still, data were not collected from the squares where the human towers are built (i.e., semi-enclosed spaces surrounded by buildings, crowded with castellers and attendees during the exhibitions). It is, therefore, reasonable to assume that the temperature in these urban spaces is higher than in the nearby non-urban area unless the square is shaded. The objectives of this study are (1) to analyse the weather conditions (i.e., temperature and RH) during the human tower exhibitions; (2) to determine discomfort during the exhibitions based on the HI resulting from the combination of temperature and humidity; and (3) to compare records from the square with those recorded in the nearest automatic meteorological station (AMS) belonging to the Catalan Meteorological Service network. The availability of information about thermal conditions in urban crowded squares where human towers are performed is a necessary preliminary step to discuss how to minimise health risks among castellers and attendees, as well as how this outdoor cultural activity needs to be adapted to climate change. Secondly, the results will contribute to understanding urban heat island phenomena in medium and small-sized towns.
Automatic meteorological stations, such as those in the Catalan Meteorological Service network, have data series with a good temporal resolution but limited years of records. These stations are typically situated far from urban centres. On the other hand, some non-automatic weather stations from the Spanish Meteorological Service network are situated in urban centres but only provide data with a daily temporal resolution. These stations are often placed on roofs or rooftops. As a result, there is a need for temperature and RH data to be collected in the squares where human towers are built. Previous studies have relied on reanalysed data or AMS records. This study addresses this gap by exploring the microclimatic conditions experienced during human tower exhibitions.
2. Materials and Methods
This study explores the thermal conditions in urban squares when human towers are performed. To this end, a series of temperature and relative humidity readings were recorded directly in the urban squares where these events take place, using field-deployed sensors that measured data at one-minute intervals.
To determine weather conditions in the squares during the human tower exhibitions, a pair of sensors recorded temperature and RH data at six exhibitions. These recordings were taken between 24 June 2024 (Sant Joan exhibition) in Valls and 1 September 2024 (Santa Rosalia exhibition) in Torredembarra (see Table 1).

Table 1.
Basic information from the analysed human tower exhibitions in the summer of 2024.
Figure 2 shows the locations of the six towns where the analysed human tower exhibitions occurred. The criteria for selecting the exhibitions were as follows: they needed to be summer exhibitions starting in the afternoon, related to a festivity, and held in a square crowded with castellers and attendees. Additionally, at least one of the researchers had to be available to travel to the town on the exhibition date. Table 1 also displays the basic information from each of the six exhibitions, including the date, name of the exhibition, town where the exhibition takes place, name of the square where human towers are built, number of teams participating in the exhibition, and schedule (UTC+2). The duration of the exhibitions is influenced by the number of teams participating, time spent between the end of a human tower and the beginning of the following, number of attempts and potential incidents that may occur; for example, the Sant Felix exhibition in Vilafranca del Penedès lasted for almost six hours because the collapse of a human tower required medical staff and the exhibition was temporarily stopped.

Figure 2.
Localisation of the towns hosting the analysed human tower exhibitions and the nearest automatic meteorological station.
Figure 3 displays a picture of each of the six squares, highlighting where the sensors were installed. The following criteria were considered when installing the sensors:
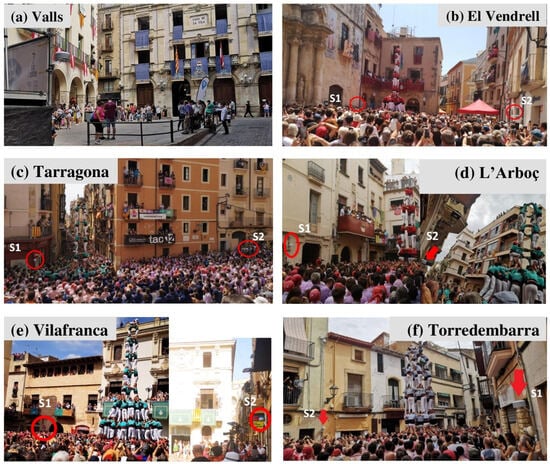
Figure 3.
Urban squares with the pair of meteorological sensors. Source: Òscar Saladié.
- (a)
- One sensor was exposed to solar radiation for the entire duration of the exhibition. The other sensor was located in the shade for the entire duration of the exhibition. This will allow us to determine the temperature differences between areas exposed to the sun and those in the shade. In some cases, the square’s characteristics (e.g., geometry, buildings, adjacent streets) made it challenging to meet the first criterion during the entire duration of the exhibition, and the sensor was exposed to solar radiation or in the shade throughout most of the exhibition. Additionally, sudden cloud cover can impact the readings of sensors exposed to solar radiation. The sensor reading can also be affected by fluctuating wind speeds;
- (b)
- One sensor was as close as possible to one of the human tower teams participating in the exhibition, and the other was close to the area occupied by the attendees. The former involves physical activity, while the latter can also be impacted by high temperatures, especially when exposed to solar radiation;
- (c)
- Sensors were placed at a height that did not interfere with the exhibition (i.e., approximately 190 cm) to reduce the risk of harm to people and damage to the sensor accidentally or otherwise.
Table 2 presents the distance between sensors in the square, the geographical position of the sensors within the square, and whether they were exposed to solar radiation or shaded. As mentioned previously, in some cases, the square’s characteristics made it impossible for the exposition of the sensors to be the same for the entire duration of the exhibition.
Table 2.
Meteorological sensors: distance, geographical position, and exposition.
Table 3 displays details about the geometry, surface, and capacity of the squares according to Brotons Navarro and Soler García de Oteyza [13]. The authors provided comprehensive information about 17 squares in which human tower exhibitions take place around Catalonia; their information also includes the perimeter, slope, number of facades, type of pavement, number of access points, and floor plan of the square, among other details.
Table 3.
Geometry, surface and capacity of the squares (adapted from Brotons Navarro and Soler García de Oteyza [13]).
The sensor used was a HOBO MX2301A model (see Figure 4) by Onset Computer Corporation (Bourne, MA, USA), with a screen to protect it from solar radiation. The temperature range is from −40 to 70 °C, with an accuracy of ±0.2 °C and a resolution of 0.04 °C. The relative humidity range is from 0 to 100%, with an accuracy of ±2.5% and a resolution of 0.01%. The temperature and RH data recorded by the sensors had a temporal resolution of one value per minute. We analysed the temperature evolution during each of the six human tower exhibitions using these data. We applied paired sample t-test to assess the differences between the temperature data recorded in the square and the corresponding measurements from the nearest AMS. The assumption of normality was evaluated using the Shapiro–Wilk test. In cases where the assumption of normality was not met, we employed the Wilcoxon signed-rank test as a non-parametric alternative. For each case of study and sensor, we calculated and reported the normality test statistic (W), its associated p-value, the test statistic (t or Wilcoxon), mean differences, and confidence interval. This statistical protocol enables an objective comparison between sensor and reference data across different locations and variables, addressing the analytical validation beyond descriptive comparisons.
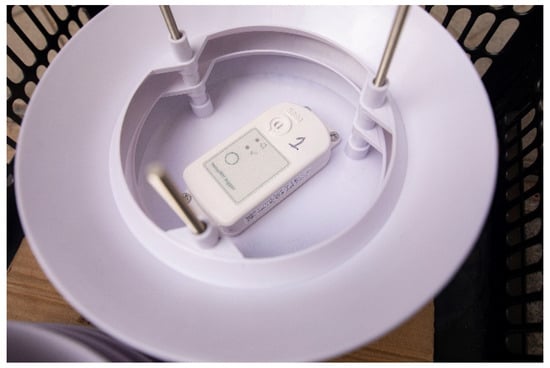
Figure 4.
Meteorological sensor integrated into the screen protector. Source: Òscar Saladié.
We calculated the heat index (HI) by combining the temperature and RH data and determined the percentage of time the square fell within the thresholds set by the index. The HI was developed through multiple regression analysis of Steadman’s equations for radiation and wind exposure as a way of using only two conventional independent variables—ambient temperature and relative humidity [58]. The HI, also known as the apparent temperature, was calculated, where T is the temperature, and RH is the relative humidity [59].
HI = −8.78469476 + (1.61139411 × T) + (2.338548839 × RH) − (0.14611605 × T × RH) − (0.012308094 × T2) − (0.016424828 × RH2) + (0.002211732 × T2 × RH) + (0.00072546 × T × RH2) − (0.000003582 × T2 × RH2)
The HI is what the temperature feels like to the human body when RH is combined with air temperature. The apparent temperature is classified in four intervals [58,60]:
- (a)
- Caution (26.1–32 °C): Fatigue possible with prolonged exposure and/or physical activity;
- (b)
- Extreme caution (32.1–40 °C): Heat stroke, heat cramps, and/or heat exhaustion are possible with prolonged exposure and/or physical activity;
- (c)
- Danger (40.1–52 °C): Heat cramps or heat exhaustion are likely, and heat stroke is possible with prolonged exposure and/or physical activity;
- (d)
- Extreme danger (>52 °C): Heat stroke is highly likely.
In addition, the average temperature recorded by each of the two sensors every 30 min was compared with the corresponding values from the nearest automatic meteorological station (AMS) belonging to the Catalan Meteorological Service network; the data from this network of stations were available in open access at this time interval, and the HI was also calculated at this temporal resolution. Figure 2 shows the nearest AMS to each of the squares. The distances between the towns and the nearest AMS ranged from 1.5 km in Torredembarra to 8.5 km in L’Arboç.
3. Results
3.1. Temperature and Relative Humidity Conditions
Figure 5 depicts the temperature evolution in the six human tower exhibitions for the respective lengths of the exhibitions and in each of the two sensors located in the squares. The charts also include the mean, maximum, and minimum temperatures for the entire duration of the exhibition and the time when these temperatures were reached. The temperature exceeded 30 °C in five of the six human tower exhibitions but did not reach 35 °C in any of them.
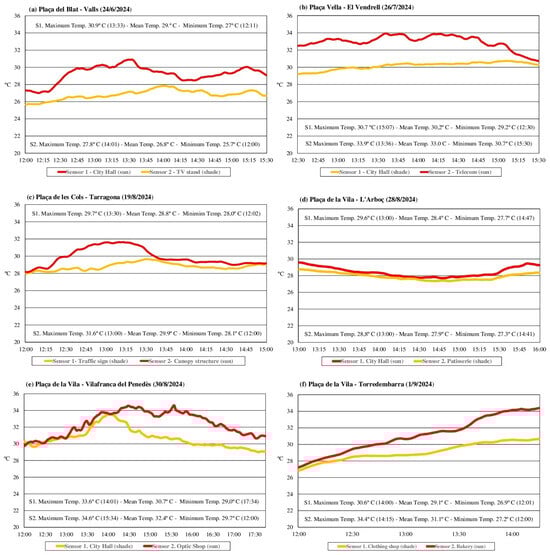
Figure 5.
Temperature evolution during human tower exhibitions.
Regarding the earliest human tower exhibition included in the case studies, the mean temperature on 24 June 2024 in Plaça del Blat (Valls) for the entire duration of the exhibition in Sensor 1 was 29 °C. The sensor was initially in the shade at the beginning of the exhibition and rose in temperature when it began to be exposed to solar radiation (55% of the time). The maximum temperature was reached at 13:30, which was almost 31 °C. Then, the shade of the buildings covered the sensor again. The mean temperature in Sensor 2—which was in the shade for the entire duration of the exhibition—was 26.8 °C. The temperature followed a diurnal pattern, progressively rising until 14:00 (UTC+2) when it reached 27.8 °C. This suggests that if Sensor 1 had been exposed to solar radiation for the entire exhibition, the maximum temperature could have exceeded 32 °C by 14:00.
On 26 July 2024, the mean temperature in Plaça Vella (El Vendrell) during the entire duration of the exhibition on Sensor 2 was 33 °C. The sensor was exposed to solar radiation throughout most of the exhibition (90% of the time). Similar to Valls, the maximum temperature was recorded at 13:30, reached almost 34 °C, and remained stable near that temperature for more than an hour. Sensor 1, which was in the shade throughout the exhibition, recorded a mean temperature of 30.2 °C. The temperature gradually increased during the exhibition, peaking at 30.7 °C at 15:00.
On 19 August 2024, the mean temperature in Plaça de les Cols (Tarragona) during the duration of the exhibition on Sensor 2 was 29.9 °C. The sensor started in the shade but rose in temperature once exposed to solar radiation. This lasted for about 75 min (40% of the time), with the highest temperature recorded at 13:00. Sensor 1, which remained in the shade throughout the exhibition, recorded a mean temperature of 28.8 °C. The temperature gradually increased until 13:30, at which time it reached 29.7 °C. This suggests that if Sensor 1 had been exposed to solar radiation for the entire exhibition, the maximum temperature could have reached 32 °C by 13:30.
On 28 August 2024, the mean temperature in Plaça de la Vila (L’Arboç) during the exhibition was 28.4 °C on Sensor 1 and 27.9 °C on Sensor 2. The human tower exhibition took place under mostly cloudy skies, with temperatures remaining stable at around 28 °C. Towards the end of the exhibition, as the clouds cleared, the temperature began to rise, particularly in Sensor 1, which was exposed to solar radiation (15% of the time). Despite this, the maximum temperature did not exceed 30 °C.
On 30 August 2024, the mean temperature in Plaça de la Vila (Vilafranca del Penedès) during the exhibition was 30.7 °C on Sensor 1 and 32.4 °C on Sensor 2. Both sensors began the exhibition in the shade, and the temperatures remained stable at around 30 °C. The temperature increased once the sensors were exposed to solar radiation. Sensor 1 was shaded again by the surrounding buildings around 14:00 (85% of the time) when it reached its maximum temperature (33.6 °C). Sensor 2 remained exposed to solar radiation (85% of the time), reaching its peak temperature at 15:30 (34.6 °C); the temperature on this sensor hovered around 34 °C from 14:30 to 15:30.
On 1 September 2024, the mean temperature in Plaça de la Vila (Torredembarra) during the exhibition was 29.1 °C on Sensor 1 and 31.1 °C on Sensor 2. Both sensors were initially placed in the shade of the surrounding buildings (Sensor 1) and clouds (Sensor 2). The temperature gradually rose throughout the exhibition and more abruptly for Sensor 2 after it was exposed to solar radiation (95% of the time). In both cases, the highest temperature was recorded at the end of the human tower exhibition, with Sensor 1 reaching 30.6 °C and Sensor 2 registering 34.4 °C.
Figure 6 displays the mean temperature every 30 min from the sensors located in the squares and from the sensor in the nearest AMS, which belongs to the Catalan Meteorological Service network. The figure also displays the temperature differences between S1 and AMS, as well as between S2 and AMS.
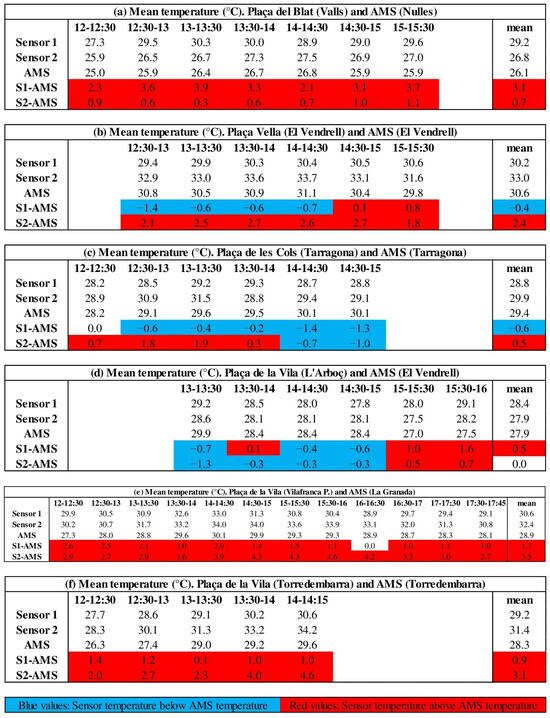
Figure 6.
Mean temperature every 30 min and the differences between the sensors in the squares and the sensor in the nearest AMS.
Table 4 depicts the analysis of the differences between the sensor data and the corresponding measurements from the nearest AMS. The application of the Shapiro–Wilk test reveals that the distribution of temperatures is similar to the normal distribution, with the exception of Vilafranca-S1. In that case, we applied the Wilcoxon test to determine if the differences were statistically significant. The differences between the sensors and AMS data were found to be statistically significant at different levels in eight cases. The differences were not statistically significant in L’Aborç-S1/S2 (cloudy day), El Vendrell-S1 (shade) and Tarragona-S2 (sun).
Table 4.
Differences between the sensor data and the measurements from the AMS.
Figure 7 shows the duration of the human tower exhibitions distributed according to RH figures recorded in the two sensors. The RH was mostly between 40 and 50% in the El Vendrell and Tarragona exhibitions and between 60 and 70% in the L’Arboç exhibition, which was held on a cloudy day. For the other three exhibitions, the sensor exposed to solar radiation mostly recorded an RH between 40 and 50%, and the sensor in the shade mostly recorded an RH between 50 and 60%.

Figure 7.
Distribution of the duration of the human tower exhibitions according to the RH.
3.2. Thermal Discomfort Based on Heat Index Values
The combination of temperature and RH allowed us to calculate the HI. Table 5 shows the duration of the six human tower exhibitions distributed between the only two thresholds achieved: caution and extreme caution. No exhibition had an HI value exceeding 40 °C (danger), and all of them exceeded 26 °C.
Table 5.
Distribution of the duration of the human tower exhibitions according to the heat index (values every minute).
Figure 8 displays the HI values obtained every 30 min using the aforementioned formula to calculate the temperature and relative humidity (RH) recorded by the sensors located in the squares and the AMS sensor. The highest HI values were 37.3 °C in El Vendrell (S2), 37.2° in Vilafranca del Penedès (S2), and 36.1 °C in Torredembarra (S2). The HI from the temperature and RH values recorded in the automatic meteorological stations only exceeded 32 °C and reached the extreme caution threshold in El Vendrell AMS; the HI values were clearly below the ones from the S2, which was exposed to direct radiation, similar to the AMS, and slightly above the ones from the S1, which was in the shade for the entire human tower exhibition. In some cases, the AMS HI values were slightly below the square sensor HI values, even when the latter was in the shade. The only 30 min timeslot in which HI values below 26 °C was in the case of the AMS located in Nulles, near Valls, at the beginning of the human tower exhibition.

Figure 8.
Calculated heat index every 30 min in the squares and in the nearest AMS.
4. Discussion
The installation of RH and temperature sensors in six human tower exhibitions during the summer of 2024 was a crucial first step in addressing the limitations identified in the results obtained by Olano Pozo et al. [56] from reanalysed meteorological data.
Our research provided valuable insights into the microclimate within the squares where human towers were constructed, which are densely populated with castellers and attendees during the exhibitions. This study does not aim to make comparisons between the six human tower exhibitions analysed since they took place on different dates, from 24 June 2024 to 1 September 2024. There were six exhibitions with different temporal lengths. The shortest lasts 2 hours and 15 min, and the longest lasts 5 hours and 45 min.
Based on the results, several key points can be highlighted. Regarding the first objective (i.e., weather conditions in the square), the time of day when the peak temperature occurred varies between 13:00 in Tarragona and L’Arboç exhibitions (mid-August) and 15:34 in Vilafranca del Penedès exhibition (end of August). The time at which the peak temperature is reached is influenced by the square geometry and the sensor’s location. No pattern is found regarding the square geometry described in Table 3. The temperature exceeded 30 °C in five of the six human tower exhibitions analysed. In the cases of the Santa Anna exhibition (El Vendrell) and the Sant Fèlix exhibition (Vilafranca del Penedès), one of the sensors recorded temperatures above 30 °C throughout the entire duration of the exhibition. The temperature did not reach 30 °C during the human tower exhibition in L’Arboç because 25 August 2024 was a cloudy day. It is not uncommon to exceed 30 °C in the summer in the analysed towns, especially during the central hours of the day. The question that arises from the results is whether it is necessary to establish an upper temperature threshold above which human tower exhibitions should not be performed. Sharifi and Boland [61] estimated the ultimate limit of thermal adaptation in unpublic spaces for social activities and necessary activities in Australian cities. Heat policy in some countries allows work to cease when a threshold temperature is reached [62]. The castellers are not workers, and human towers are a cultural activity. Nevertheless, public authorities would have to take into account the possibility of establishing an upper temperature threshold for cultural outdoor activities. A threshold that, in the case of the human towers, should be determined together with the human tower teams and the exhibition organisers. An alternative proposed for outdoor workers is shifting outdoor activities to cooler times of the day [63].
The temperature was higher in the sun than in the shade. The urban geometry around the squares creates areas where the exposure to solar radiation and shade alternate [18,21,22,64], modifying the temperature pattern throughout the exhibitions, as seen in Valls (Sant Joan exhibition) or in Tarragona (Sant Magí exhibition). Additionally, cloud cover reduced temperature differences between sensors. Therefore, increasing the shaded areas in the square would reduce the temperature during the exhibitions. This measure would need to be adjusted to suit the square’s characteristics and the fact that human towers are vertical structures. At the same time, some new elements in the square to increase the shaded area may obstruct the vision of attendees. Still, the temperature remains higher in areas that have been exposed to solar radiation before the sky becomes cloudy (i.e., accumulated heat), as seen during the L’Arboç exhibition.
Regarding the second objective (i.e., discomfort during the exhibitions based on the HI), there is a predominance of HI values falling within the caution threshold in the two sensors of three exhibitions (Valls, Tarragona and L’Arboç) and within the extreme caution threshold in the two sensors of two exhibitions (El Vendrell and Vilafranca del Penedès). It is not possible to establish a pattern between the two groups because the human tower exhibitions took place at different times throughout the summer. It would not be considered extraordinary that during the summer in our study area, the HI values reached are within the extreme caution threshold, especially in the central hours of the day (12–15 h). On the other hand, it is possible that the extreme caution threshold would have been achieved in Valls if Sensor 1 had been exposed to solar radiation for the entire exhibition. Similarly, the time included in the aforementioned threshold would have been extended in Tarragona (Sensor 2). The position of some sensors should be reconsidered when visiting the squares during the human tower exhibitions in summer 2025. Nevertheless, it is not easy to find the right spot in some squares to ensure that the sensor will be exposed to solar radiation for the entire exhibition. Another limitation is related to the heat index. This methodology only considers two meteorological variables: air temperature and relative humidity. Other indices have been developed and are widely used, which incorporate not only basic meteorological parameters but also wind speed, wind direction, and solar radiation [65].
Finally, regarding the third objective (i.e., comparing records from the square with those recorded in the nearest AMS), the temperature is higher in urban squares than in the surrounding rural areas in most study cases. These differences are partly due to the distance between the square where human towers are built and the nearest AMS location and partly due to the fact that the sensor models are not the same. The sensors could not be calibrated because of logistical issues. However, it is reasonable to say that the key factor is the UHI phenomenon, especially when both the sensor in the square and the AMS sensor were exposed to solar radiation for the entire duration of the exhibition or for most of it. In some cases, the temperature was slightly higher in the square than in the nearest AMS, even when the former was in the shade. Therefore, HI values are also higher in the squares. However, a decline in comfort conditions in qualitative terms (i.e., caution situation in the non-urban area and extreme caution situation in the square) only occurred in the exhibitions of Vilafranca del Penedès and Torredembarra. RH in urban areas is lower than in the surrounding rural areas, and RH decreases in warm environments because the capacity to retain water vapour increases.
These results reaffirm the importance of seeking shade when participating in outdoor activities during summer, such as human towers or creating additional shaded areas because higher temperatures due to climate change, exacerbated in the case of towns because of UHI, lead to a decline in comfort conditions. This poses health risks (e.g., heat stroke, heat cramps, and heat exhaustion) to both the castellers and attendees; it also increases the risk of the tower collapsing and causing injuries to the castellers [66,67,68,69]. Public authorities need to design and implement adaptation measures to reduce UHI and mitigate the impact of more frequent and intense heat waves. These measures include high albedo materials for buildings, cool roofs and pavements, green infrastructures, urban green and blue areas, and compact urban design [30,70,71,72]. These measures will have a positive impact on any outdoor activities performed in the towns, including human tower exhibitions.
5. Conclusions
This study builds upon the research conducted by Olano et al. [56]; their findings were based on reanalysed meteorological data. Now, for the first time in academic research, meteorological data—specifically temperature and RH—were recorded in the crowded squares where human towers are built. These data were collected during six summer exhibitions held between 24 June 2024 and 1 September 2024. The results prove that temperatures are higher in urban environments than in surrounding rural areas, making conditions for building human towers more challenging. However, urban squares do have shaded areas created by buildings or trees. The experience of being exposed to solar radiation versus being in the shade during a human tower exhibition, therefore, differs in terms of thermal comfort.
This research has enabled the consolidation of a new research line focusing on the relationship between climate change and human tower exhibitions while also opening up new possibilities for innovation. This study is limited to six events in a single summer. We present exploratory results. It is essential to collect new temperature and RH data during the human tower exhibitions in 2025. This will help create a database that is not limited to a single year, thereby allowing us to observe any decline in thermal comfort over time. By analysing this database, we can approximate the weather conditions in the squares during previous years, such as in the summer of 2023. Furthermore, meteorological sensors need to be installed at other exhibitions starting in the evening and scheduled for both spring and autumn. This will provide a more comprehensive understanding of how weather conditions impact the human tower exhibitions. Additionally, more robust biometeorological indices will need to be used to estimate human thermal sensation and thermal stress more effectively. This involves combining basic meteorological parameters with human physiological parameters such as age, gender, or metabolism. Finally, the influence of square geometry on shading or heat retention needs to be analysed thoroughly.
Measures to adapt human tower exhibitions to climate change are needed, such as limiting the duration of the exhibitions, improving the shirts worn by the castellers, guaranteeing cold water availability for the entire exhibition, and moving the exhibition to the evening, being aware that some measures will be more feasible than others. However, these measures should be proposed by the castellers and the organisers of human tower exhibitions, taking the priority and feasibility of each adaptation measure into consideration. The implementation of a climate service will aid decision-making for the castellers and public authorities when attempting to adapt the exhibitions to expected adverse weather conditions and ensure the safety of both the castellers and the attendees.
In conclusion, castellers and exhibition organisers must recognise that climate change also affects human tower exhibitions. They should determine which adaptation measures could be designed and implemented to address this issue. The dissemination of the results of this study plays a crucial role in promoting greater awareness and commitment among people regarding the impacts of climate change on human tower exhibitions. The main objective should be to prioritise the safety of the participants while preserving the rich cultural heritage and identity embodied by the human towers. This goal can only be achieved through collaboration among the castellers, exhibition organisers, and public authorities.
Author Contributions
Conceptualisation, Ò.S.; methodology, Ò.S., A.B.-C., and J.X.O.P.; formal analysis, Ò.S. and J.S.; data curation, Ò.S., A.B.-C., and J.X.O.P.; writing—original draft preparation, Ò.S.; writing—review and editing, Ò.S., A.B.-C., J.S., and J.X.O.P.; supervision, Ò.S. All authors have read and agreed to the published version of the manuscript.
Funding
This research was funded by the Càtedra URV per a l’Estudi del Fet Casteller; the ADAPTOUR project: The adaptability of complex tourist destinations in the present era of social, economic, and environmental transformations: innovative paths towards destination resilience (contract number PID2020-112525RB-I00), funded by MCIN/AEI/10.13039/501100011033 (Spain); and AGAUR 2021-SGR-00657.
Institutional Review Board Statement
Not applicable.
Informed Consent Statement
Not applicable.
Data Availability Statement
The additional data will be available upon request from the corresponding author.
Conflicts of Interest
The authors declare no conflicts of interest. The funders had no role in the design of the study; in the collection, analyses, or interpretation of data; in the writing of the manuscript; or in the decision to publish the results.
References
- Bernard, P.; Chevance, G.; Kingsbury, C.; Baillot, A.; Romain, A.J.; Molinier, V.; Gadais, T.; Dancause, K.N. Climate change, physical activity and sport: A systematic review. Sports Med. 2021, 51, 1041–1059. [Google Scholar] [CrossRef]
- Fan, Y.; Wang, J.; Obradovich, N.; Zheng, S. Intraday adaptation to extreme temperatures in outdoor activity. Sci. Rep. 2023, 13, 473. [Google Scholar] [CrossRef]
- Ho, J.Y.; Googins, W.B.; Mo, P.K.H.; Chan, E.Y.Y. The effect of temperature on physical activity: An aggregated timeseries analysis of smartphone users in five major Chinese cities. Int. J. Behav. Nutr. Phys. Act. 2022, 19, 68. [Google Scholar] [CrossRef]
- Janice, Y.H.; Lam, H.Y.C.; Huang, Z.; Liu, S.; Goggins, W.B.; Mo, P.K.H.; Chan, E.Y.Y. Factors affecting outdoor physical activity in extreme temperatures in a sub-tropical Chinese urban population: An exploratory telephone survey. BMC Public Health 2023, 23, 101. [Google Scholar] [CrossRef]
- Turrisi, T.B.; Bittel, K.M.; West, A.B.; Hojjatinia, S.; Mama, S.K.; Lago, C.M.; Convoy, D.E. Seasons, weather, and device-measured movement behaviors: A scoping review from 2006 to 2020. Int. J. Behav. Nutr. Phys. Act. 2021, 18, 24. [Google Scholar] [CrossRef]
- Andreu Giner, J. Enciclopèdia Castellera. Tècnica i Ciència; Cossetània Edicions: Valls, Spain, 2018; Volume 3, p. 249. [Google Scholar]
- Bean, R.; Pojani, D.; Corcoran, J. How does weather affect bikeshare use? A comparative analysis of forty cities across climate zones. J. Transp. Geogr. 2021, 95, 103155. [Google Scholar] [CrossRef]
- Wolff, D.; Fitzhugh, E.C. The relationships between weather-related factors and daily outdoor physical activity counts on an urban greenway. Int. J. Environ. Res. Public Health 2011, 8, 579–589. [Google Scholar] [CrossRef]
- Huang, Z.; Cheng, B.; Gou, Z.; Zhang, F. Outdoor thermal comfort and adaptive behaviors in a university campus in China’s hot summer-cold winter climate region. Build. Environ. 2019, 165, 106414. [Google Scholar] [CrossRef]
- Ji, Y.; Song, J.; Shen, P. A review of studies modelling of solar radiation on human thermal comfort in outdoor environment. Build. Environ. 2022, 214, 108891. [Google Scholar] [CrossRef]
- He, X.; Gao, W.; Wang, R.; Yan, D. Study on outdoor thermal comfort of factory areas during winter in hot summer and cold winter zone of China. Build. Environ. 2023, 228, 109883. [Google Scholar] [CrossRef]
- Aghamolaei, R.; Mehdi Azizi, M.; Aminzadeh, B.; O’Donnell, J. A comprehensive review of outdoor thermal comfort in urban areas: Effective parameters and approaches. Energy Environ. 2023, 34, 2204–2227. [Google Scholar] [CrossRef]
- Brotons Navarro, X.; Soler García de Oteyza, G. Enciclopèdia Castellera. Les Places; Cossetània Edicions: Valls, Spain, 2024; Volume 8, p. 265. [Google Scholar]
- Aljawabra, F.; Nikolopoulou, M. Thermal comfort in urban spaces: A cross-cultural study in the hot arid climate. Int. J. Bio-meteorol. 2018, 62, 1901–1909. [Google Scholar] [CrossRef]
- Santos Nouri, A.; Costa, J.P. Addressing thermophysiological thresholds and psychological aspects during hot and dry Mediterranean summers through public space design. The case of Rossio. Build. Environ. 2017, 118, 67–90. [Google Scholar] [CrossRef]
- Su, Y.; Wang, C.; Li, Z.; Meng, Q.; Gong, A.; Wu, Z.; Zhao, Q. Summer outdoor comfort assessment in city squares-A case study of cold dry winter, hot summer climate zone. Sustain. Cities Soc. 2024, 101, 105062. [Google Scholar] [CrossRef]
- Landsberg, H.E. The urban climate. In International Geophysics Series; Academic Press: New York, NY, USA, 1981; Volume 28, p. 277. [Google Scholar]
- Chatzidimitriou, A.; Yannas, S. Microclimate development in open urban spaces: The influence of form and materials. Energy Build. 2015, 108, 156–174. [Google Scholar] [CrossRef]
- Oke, T.R. The energetic basis of the urban heat island. Q. J. R. Meteorol. Soc. 1982, 108, 1–24. [Google Scholar] [CrossRef]
- Mirabi, E.; Nasrollahi, N. Urban facade geometry on outdoor comfort conditions: A Review. Eur. Online J. Nat. Soc. Sci. 2020, 9, 655–677. [Google Scholar] [CrossRef]
- Battisti, A. Bioclimatic architecture and urban morphology. Studies on intermediate urban open spaces. Energies 2020, 13, 5819. [Google Scholar] [CrossRef]
- Vasic, M.; Milosevic, D.; Savic, S.; Bielajac, D.; Arsenovic, D.; Dunjic, J. Micrometeorological measurements and biometeorologial survey in different urban settings of Novi Sad (Serbia). Bull. Serbian Geogr. Soc. 2022, 102, 45–66. [Google Scholar] [CrossRef]
- Athukorala, D.; Murayama, Y. Urban Heat Island Formation in Greater Cairo: Spatio-Temporal Analysis of Daytime and Nighttime Land Surface Temperatures along the Urban-Rural Gradient. Remote Sens. 2021, 13, 1396. [Google Scholar] [CrossRef]
- Cesic, M.; Rogulj, K.; Krtalic, A. Combined Thermal Index Development for Urban Heat Island Detection in Area of Split, Croatia. Land 2025, 14, 175. [Google Scholar] [CrossRef]
- Dewan, A.; Kiselev, G.; Botje, D.; Mahmud, G.I.; Bhuian, M.H.; Hassan, Q.K. Surface urban heat island intensity in five major cities of Bangladesh: Patterns, drivers and trends. Sustain. Cities Soc. 2021, 71, 102926. [Google Scholar] [CrossRef]
- Foissard, X.; Dubreuil, V.; Quénol, H. Defining scales of the land use effect to map the urban heat island in a mid-size European city: Rennes (France). Urban Clim. 2019, 29, 100490. [Google Scholar] [CrossRef]
- Holec, J.; Feranec, J.; Stastny, P.; Szatmári, D.; Kopecká, M.; Garaj, M. Evolution and assessment of urban heat island between the years 1998 and 2016: Case study of the cities Bratislava and Trnava in western Slovakia. Theor. Appl. Climatol. 2020, 141, 979–997. [Google Scholar] [CrossRef]
- Santamouris, M.; Haddad, S.; Fiorito, F.; Osmond, P.; Ding, L.; Prasad, D.; Zhai, X.; Wang, R. Urban Heat Island and Overheating Characteristics in Sydney, Australia. An Analysis of Multiyear Measurements. Sustainability 2017, 9, 712. [Google Scholar] [CrossRef]
- Dienst, M.; Lindén, J.; Saladié, O.; Esper, J. Detection and elimination of UHI effects in long temperature records from villages—A case study from Tivissa, Spain. Urban Clim. 2019, 27, 372–383. [Google Scholar] [CrossRef]
- Cheval, S.; Amihaesei, V.-A.; Chit, Z.; Dumitrescu, A.; Falcescu, V.; Irasoc, A.; Micu, D.M.; Mihulet, E.; Ontel, I.; Paraschiv, M.-G.; et al. A systematic review of urban heat island and heat waves research (1991–2022). Clim. Risk Manag. 2024, 44, 100603. [Google Scholar] [CrossRef]
- Mandic, L.; Djukic, A.; Maric, J.; Mitrovic, B. A systematic review of outdoor thermal comfort studies for the urban (re)desing of city squares. Sustainability 2024, 16, 4920. [Google Scholar] [CrossRef]
- Goodman, J.; Humphrys, E.; Newman, F. Working in heat: Contrasting heat management approaches among outdoor employees and contractors. Saf. Sci. 2023, 165, 106185. [Google Scholar] [CrossRef]
- Amoadu, M.; Ansah, E.W.; Sarfo, J.O.; Hormenu, T. Impact of climate change and heat stress on workers’ health and productivity: A scoping review. J. Clim. Change Health 2023, 12, 100249. [Google Scholar] [CrossRef]
- Ioannou, L.G.; Foster, J.; Morris, N.B.; Piil, J.F.; Havenith, G.; Mekjavic, I.B.; Kenny, G.P.; Nybo, L.; Flouris, A.D. Occupational heat strain in outdoor workers: A comprehensive review and meta-analysis. Temperature 2022, 9, 67–102. [Google Scholar] [CrossRef]
- Fenemor, S.P.; Gill, N.D.; Driller, M.W.; Mills, B.; Casadio, J.R.; Beaven, C.M. The relationship between physiological and performance variables during a hot/humid international rugby sevens tournament. Eur. J. Sport Sci. 2022, 22, 1499–1507. [Google Scholar] [CrossRef]
- Oyama, T.; Fuji, M.; Nakajima, K.; Takakura, J.; Hijioka, Y. Validation of upper thermal thresholds for outdoor sports using thermal physiology modelling. Temperature 2023, 11, 92–106. [Google Scholar] [CrossRef]
- Özgünen, K.T.; Kurdak, S.S.; Maughan, R.J.; Zeren, Ç.; Korkmaz, S.; Yazici, Z.; Ersöz, G.; Shirreffs, M.; Binnet, M.S.; Dvorak, J. Effects of hot environmental conditions on physical activity patterns and temperature response of football players. Scand. J. Med. Sci. Sports 2019, 22, 912–917. [Google Scholar] [CrossRef]
- Hosokawa, Y.; Adams, W.M. Heat risks in athletics. In Human Health and Physical Activity During Heat Exposure; Hosokawa, Y., Ed.; Springer Briefs in Medical Earth Sciences; Springer: Cham, Switzerland, 2018; pp. 73–83. [Google Scholar] [CrossRef]
- Matzarakis, A.; Fröhlich, D. Sport events and climate for visitors—The case of FIFA World Cup in Qatar 2022. Int. J. Biometeorol. 2015, 59, 481–486. [Google Scholar] [CrossRef]
- Orr, M.; Inoue, Y. Sport versus climate: Introducing the climate vulnerability of sport organizations framework. Sport Manag. Rev. 2019, 22, 452–463. [Google Scholar] [CrossRef]
- Schneider, S.; Niederberger, M.; Kurowski, L.; Bade, L. How can outdoor sports protect themselves against climate change-related health risks?—A prevention model based on an expert Delphi study. J. Sci. Med. Sport 2024, 27, 37–44. [Google Scholar] [CrossRef]
- Capdevila, X. Canvi Climàtic i Castells. Revista Castells. 2023. Available online: https://revistacastells.cat/2023/10/opinio-canvi-climatic-i-castells/ (accessed on 18 December 2024).
- Terraza, S. Tres Fotografies Reveladores. Revista Castells. 2023. Available online: https://revistacastells.cat/2023/07/opinio-tres-fotografies-reveladores/ (accessed on 18 December 2024).
- Ajuntament de Valls. In Proceedings of the XI Simposi Casteller de Catalunya, Fira de Santa Úrsula, Museu Casteller de Catalunya, Valls, Spain, 21 October 2023; Available online: https://www.valls.cat/simposi-casteller (accessed on 14 November 2024).
- Coordinadora de Colles Castelleres de Catalunya. In Proceedings of the XXVIII Jornada de Prevenció de Lesions en el Mon Casteller, El Vendrell, Spain, 9 March 2024; Available online: https://castellscat.cat/ca/noticia/325-la-28a-jornada-de-prevencio-de-lesions-en-el-mon-casteller-se-centrara-en-la-sostenibilitat-i-els-riscos-del-canvi-climatic (accessed on 14 November 2024).
- Vaczi, M. From subalternity to intangible heritage and national symbol: Catalonia’s castells. In Indigenous, Traditional, and Folk Sports: Contesting Modernities; Vaczi, M., Bairner, A., Eds.; Routledge: New York, NY, USA, 2023; pp. 70–85. [Google Scholar]
- Fatoric, S.; Seekamp, E. Are cultural heritage and resources threatened by climate change? A systematic literature review. Clim. Change 2017, 142, 227–254. [Google Scholar] [CrossRef]
- Nguyen, K.N.; Baker, S. Climate Change and UNESCO World Heritage-Listed Cultural Properties: A Systematic Review, 2008–2021. Heritage 2023, 6, 2394–2420. [Google Scholar] [CrossRef]
- Orr, S.A.; Richards, J.; Fatoric, S. Climate change and cultural heritage: A systematic literature review (2016–2020). Hist. Environ. Policy Cult. Herit. 2021, 12, 434–477. [Google Scholar] [CrossRef]
- Sesana, E.; Gagno, A.S.; Ciantelli, C.; Cassar, J.; Hughes, J.J. Climate change impacts on cultural heritage: A literature review. WIREs Clim. Change 2021, 12, e710. [Google Scholar] [CrossRef]
- Guerra-Carrera, L.; Jiménez-Castilla, T.; Segrera-Castillak, M. Cultural heritage, the environment and climate change: Cultural /damage from environmental deterioration in San Basilio de Palenque, Colombia. Soc. Identities 2025, 31, 1–15. [Google Scholar] [CrossRef]
- Henderson, M.; Seekamp, E. Battling the tides of climate change: The power of intangible cultural resource values to bind place meanings in vulnerable historic districts. Heritage 2018, 1, 220–238. [Google Scholar] [CrossRef]
- McDermott, P.; Nic Craith, M. Intangible Cultural Heritage and Climate Change: Sustainability and Adaptability in a time of Crisis. Anthropol. J. Eur. Cult. 2024, 33, 1–10. [Google Scholar] [CrossRef]
- Fatoric, S.; Daly, C. Towards a climate-smart cultural heritage management. WIREs Clim. Change 2023, 14, e855. [Google Scholar] [CrossRef]
- ICHNGO Forum. Declaration for Safeguarding of ICH for Climate Change. 31 July 2024. Available online: https://www.ichngoforum.org/news/declaration-for-safeguarding-of-ich-for-climate-change-the-approved-text/ (accessed on 15 February 2025).
- Olano Pozo, J.X.; Saladié, Ò.; Boqué-Ciurana, A. Rising Temperatures, Wavering Human Towers? Temperature Trends and Thermal Comfort during Castells Exhibitions in Catalonia (1951–2023). Case Studies in Valls (24 June), La Bisbal del Penedès (15 August), Tarragona (19 August), and Vilafranca del Penedès (30 August). Climate 2024, 12, 112. [Google Scholar] [CrossRef]
- Hambrecht, G.; Rockman, M. International approaches to climate change and cultural heritage. Am. Antiq. 2017, 82, 627–641. [Google Scholar] [CrossRef]
- Opitz-Stapleton, S.; Sabbag, L.; Hawley, K.; Tran, P.; Hoang, L.; Hoang Nguyen, P. Heat index trends and climate change implications for occupational heat exposure in Da Nang, Vietnam. Clim. Serv. 2016, 2–3, 41–51. [Google Scholar] [CrossRef]
- AEMET. Tabla de Valores de Sensación Térmica Por Calor (Heat Index). Available online: https://www.aemet.es/documentos/es/conocermas/montana/sensacion_termica/SensacionTermicaPorFrio-Calor.pdf (accessed on 15 October 2024).
- National Weather Service. Heat Forecast Tools. National Oceanic and Atmospheric Administration. Available online: https://www.weather.gov/safety/heat-index (accessed on 10 October 2024).
- Sharifi, E.; Boland, J. Passive activity observation (PAO) method to estimate outdoor thermal adaptation in public space: Case studies in Australian cities. Int. J. Biometeorol. 2022, 64, 231–242. [Google Scholar] [CrossRef]
- Lao, J.; Hansen, A.; Nitschke, M.; Hansobn-Easey, S.; Pisaniello, D. Working smart: A exploration of council workers’ experiences and perceptions of heat in Adelaide, South Australia. Saf. Sci. 2016, 82, 228–235. [Google Scholar] [CrossRef]
- Filomena, M.; Picchio, M. Unsafe temperatures, unsafe jobs: The impact of weather conditions on work-related injuries. J. Econ. Behav. Organ. 2024, 224, 851–875. [Google Scholar] [CrossRef]
- Del Serrone, G.; Peluso, P.; Moretti, L. Evaluation of microclimate benefits due to cool pavements and green infraestructures on urban heat island. Atmosphere 2022, 13, 1586. [Google Scholar] [CrossRef]
- Acero, J.A.; Herranz-Pascual, K. A comparison of thermal comfort conditions in four urban spaces by means of measurements and modelling techniques. Build. Environ. 2015, 93, 245–257. [Google Scholar] [CrossRef]
- García-Algar, O.; Felipe, A.; Berrueco, R.; Casano, P.; Vall, O. Human towers and multiple trauma in children. Pediatr. Catalana 2005, 65, 47–48. [Google Scholar]
- Godoy, P.; Rosset-Llobet, J.; Rossell-Urtxuletegui, R. Incidence of injuries among children members of human tower associations. Pediatr. Catalana 2010, 70, 146–150. [Google Scholar]
- Rovira–Ricart, E.; Rosset-Llobet, J. Avaluació de l’efectivitat d’un casc per a infants castellers. Pediatr. Catalana 2008, 68, 217–219. [Google Scholar]
- Witt, A.; Kumru, H.; Oisso, E.; Vidal, J. Traumatic spinal cord injury due to human tower accident in Catalonia. Spinal Cord Ser. Cases 2018, 4, 108. [Google Scholar] [CrossRef]
- Capari, L.; Wilfing, H.; Exner, A.; Höflehner, T.; Haluza, D. Cooling the City? A Scientometric Study on Urban Green and Blue Infrastructure and Climate Change-Induced Public Health Effects. Sustainability 2022, 14, 4929. [Google Scholar] [CrossRef]
- Chaston, T.B.; Broome, R.A.; Cooper, N.; Duck, G.; Geromboux, C.; Guo, Y.; Ji, F.; Perkins-Kirkpatrick, S.; Zhang, Y.; Dissanayake, G.S.; et al. Mortality Burden of Heatwaves in Sydney, Australia Is Exacerbated by the Urban Heat Island and Climate Change: Can Tree Cover Help Mitigate the Health Impacts? Atmosphere 2022, 13, 714. [Google Scholar] [CrossRef]
- Jacobs, S.J.; Gallant, A.J.E.; Tapper, N.J.; Li, D. Use of cool roofs and vegetation to mitigate urban heat and improve human thermal stress in Melbourne, Australia. Am. Meteorol. Soc. 2018, 57, 1747–1764. [Google Scholar] [CrossRef]
Disclaimer/Publisher’s Note: The statements, opinions and data contained in all publications are solely those of the individual author(s) and contributor(s) and not of MDPI and/or the editor(s). MDPI and/or the editor(s) disclaim responsibility for any injury to people or property resulting from any ideas, methods, instructions or products referred to in the content. |
© 2025 by the authors. Licensee MDPI, Basel, Switzerland. This article is an open access article distributed under the terms and conditions of the Creative Commons Attribution (CC BY) license (https://creativecommons.org/licenses/by/4.0/).