Abstract
This study analyzes biometeorological conditions during summer heat events in 11 cities located in different regions of Poland in the summer months from 2020 to 2024. Heat days (defined as days with a maximum temperature exceeding 30 °C) and heatwaves (defined as at least three consecutive days with a maximum temperature above 30 °C) were identified. Biometeorological conditions were assessed based on the Universal Thermal Climate Index (UTCI) and heart rate (HR), assuming a metabolic heat production of 135 W∙m−2 for an adult human. The indices were calculated using the BioKlima 2.6 software. The findings reveal that all cities experienced significant thermal stress during heat events. The maximum UTCI values during heat days indicated strong and very strong heat stress. During the most intense heatwaves, assessed using the Heat Wave Severity (HWS) index, these categories of heat stress occurred 20–30% of the time. Simultaneously, the mean daily heart rates exceeded the warning threshold of 90 beats per minute. Differences in biometeorological conditions were found between urban centers and places located outside the center, where strong heat conditions occurred less frequently. The results indicate that biometeorological conditions imposing thermal stress on the human body were present in all Polish cities during the analyzed five-year period. In Warszawa, Wrocław, and Rzeszów, heatwaves and heat stress occurred annually.
1. Introduction
In recent years, climate change has intensified the frequency and severity of extreme weather events, with heatwaves emerging as a particularly urgent public health and urban planning concern. Central Europe, including Poland, has become increasingly affected by these episodes, which pose significant challenges to urban populations due to the synergistic effects of high temperatures and the urban heat island (UHI) phenomenon [1]. As cities continue to expand and densify, the need for detailed assessments of biometeorological conditions becomes ever more critical. Moreover, information about biometeorological conditions is important for people visiting cities for business or tourism purposes.
A key outcome of biometeorological research is the development of the Universal Thermal Climate Index (UTCI), a comprehensive and scientifically robust indicator designed to assess human thermal stress under various climatic conditions. It was derived from the comprehensively validated multi-node Fiala model of human temperature regulation and thermal comfort [2,3]. Developed through interdisciplinary efforts involving physiology and meteorology, the UTCI reflects the evolution of biometeorology as a field that connects environmental sciences with human health. The UTCI is a physiologically based index that integrates air temperature, wind speed, humidity, and radiation to evaluate thermal stress on the human body [4,5,6]. It has been widely adopted across Europe and endorsed by the International Society of Biometeorology for assessing thermal comfort and heat-related health risks [6], particularly in urban environments [7].
Heatwaves, typically defined as prolonged periods of unusually high temperature, are associated with increased morbidity and mortality rates, especially among vulnerable populations such as the elderly and chronically ill [8]. In Poland, multiple studies have shown an increase in the duration and intensity of heatwaves over the past decades, with summers becoming more thermally stressful [9,10,11,12,13,14]. The June 2019 and August 2015 heat events serve as examples, with peak UTCI values exceeding 40 °C in several Polish cities [15,16].
Urban heat islands further exacerbate thermal stress during heatwaves. This phenomenon—in which urbanized areas experience significantly higher temperatures than surrounding rural regions—is driven by surface modifications and specific energy exchanges in build-up areas, anthropogenic heat emissions, and a reduced share of green spaces. Studies from Warszawa [17], Poznań [18,19], Kraków [20], Łódź [21], and Lublin [22] reveal strong diurnal UHI effects, especially at night, which limit nocturnal cooling and compound the health risks associated with daytime heat. The UHI effect not only amplifies the intensity of heatwaves but also increases thermal discomfort and heat-related health hazards in urban settings, leading to urban overheating, which is especially dangerous to vulnerable populations [23].
Despite a growing amount of studies in the literature on biometeorological conditions in Polish cities, few studies offer a comprehensive comparative analysis of multiple urban areas during recent heat events during the summer months over the past 5 years using standardized thermal indices such as the UTCI. This study aims to fill that gap.
The primary aim of this research is to assess and compare biometeorological conditions in major Polish cities during summer heat events from 2020 to 2024.
2. Materials and Methods
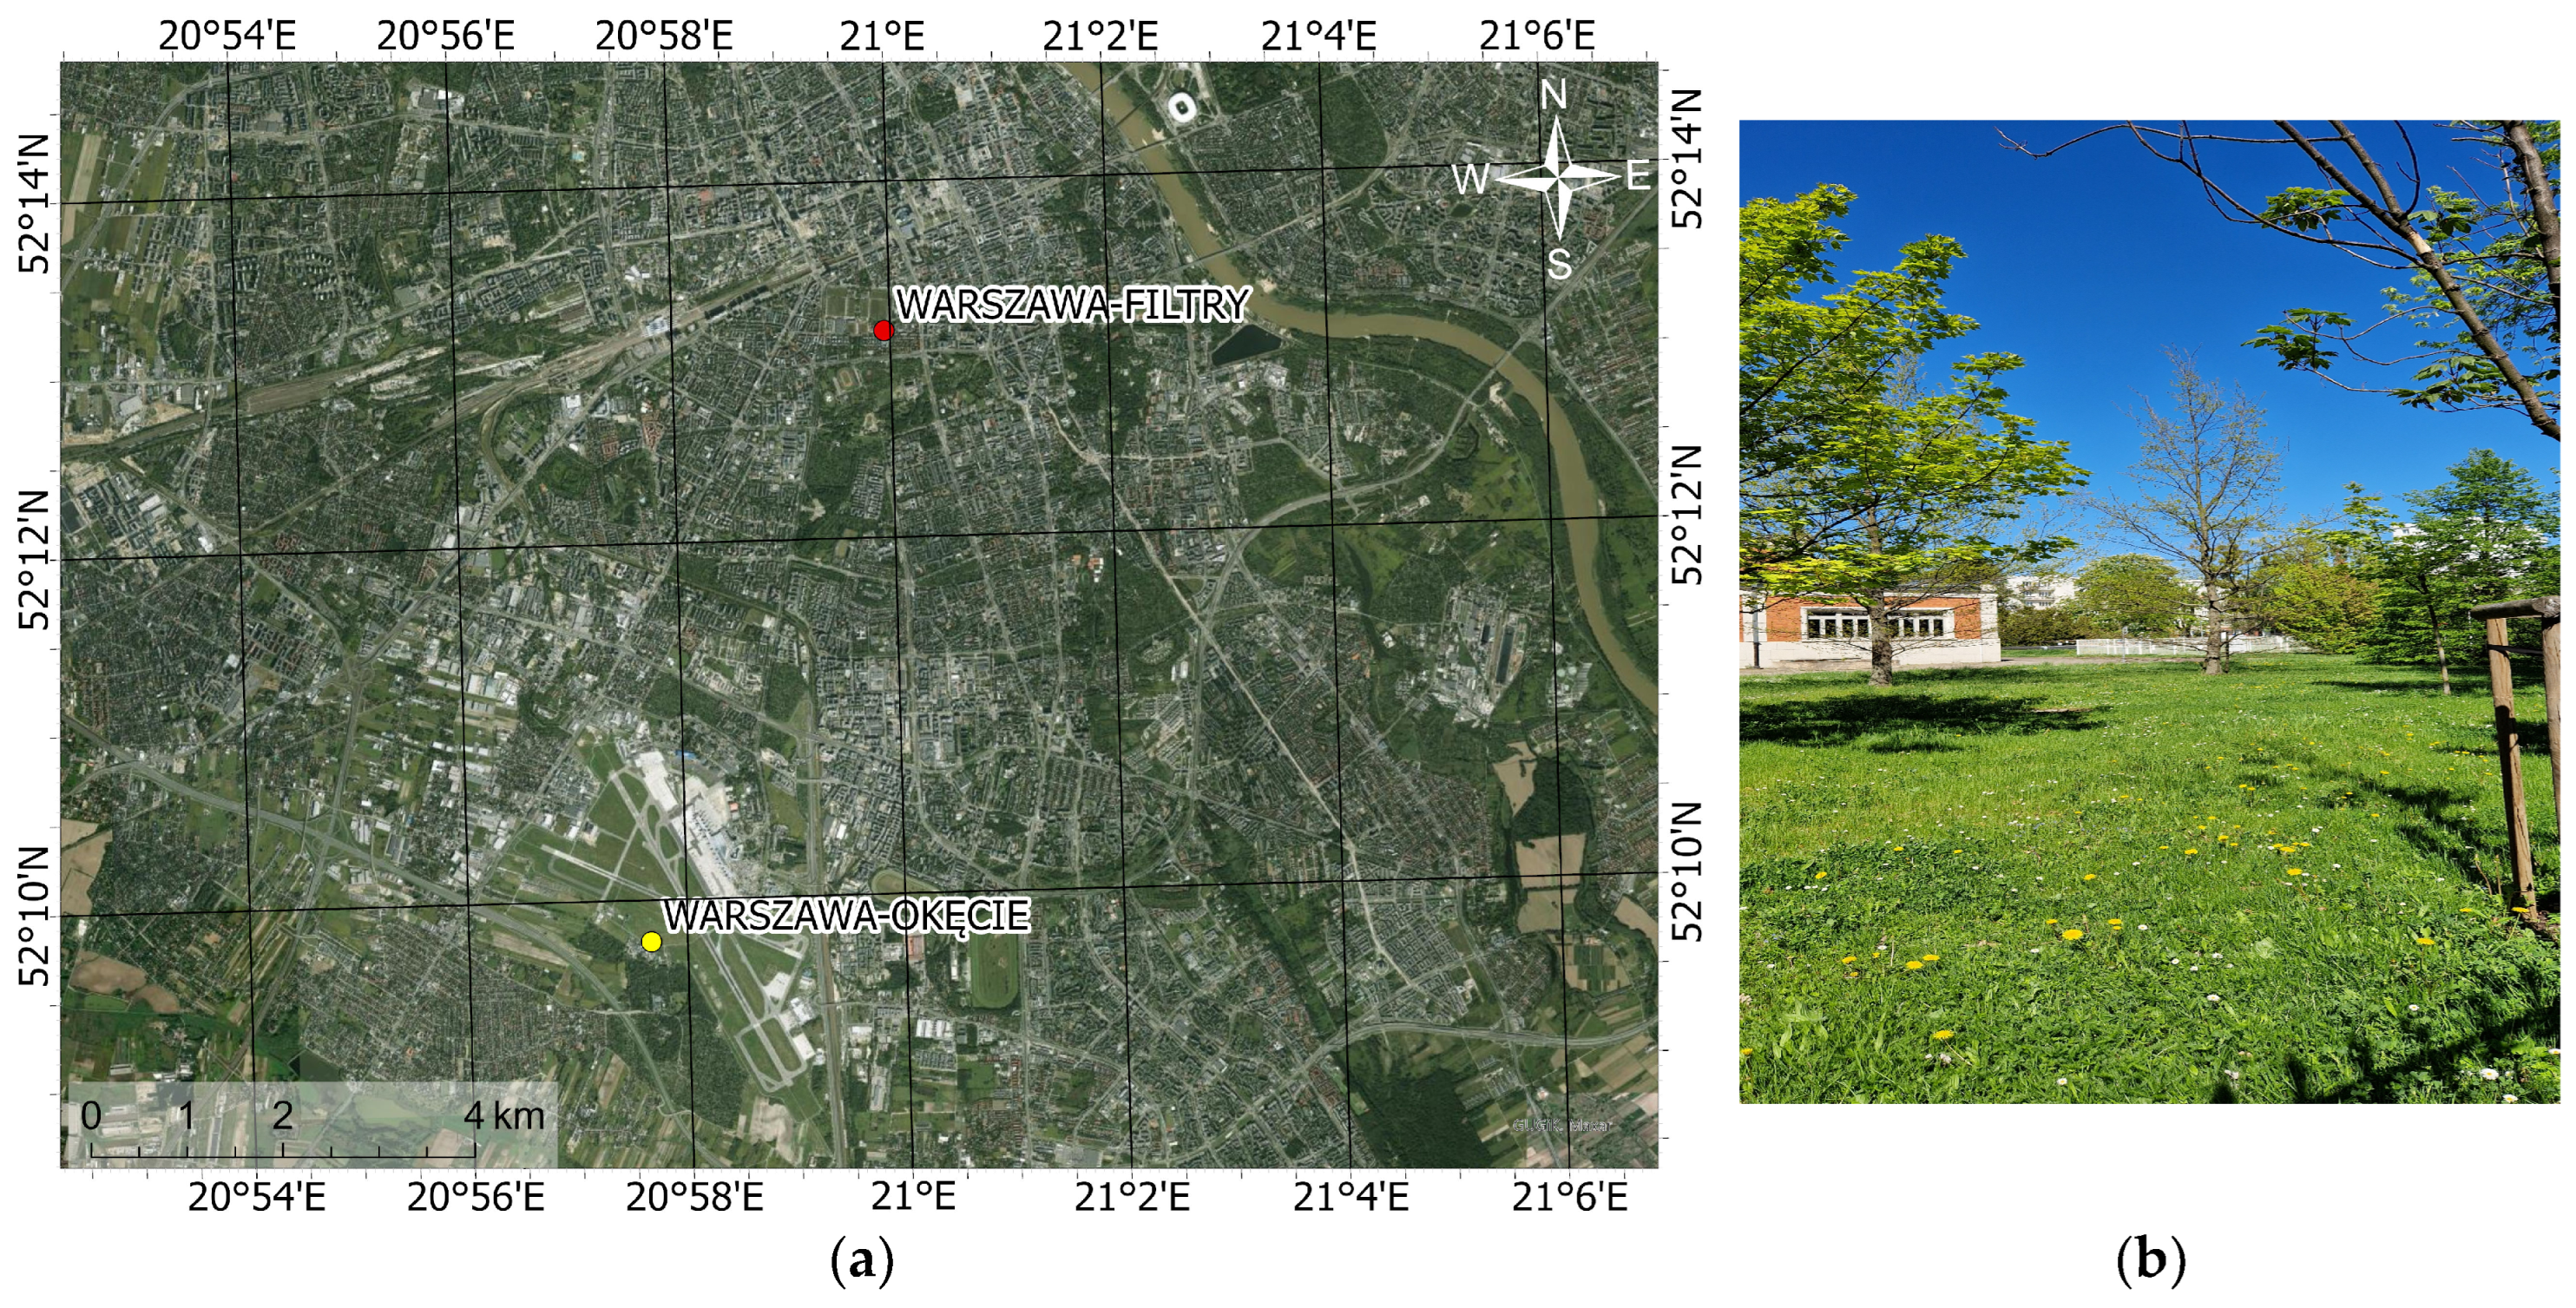
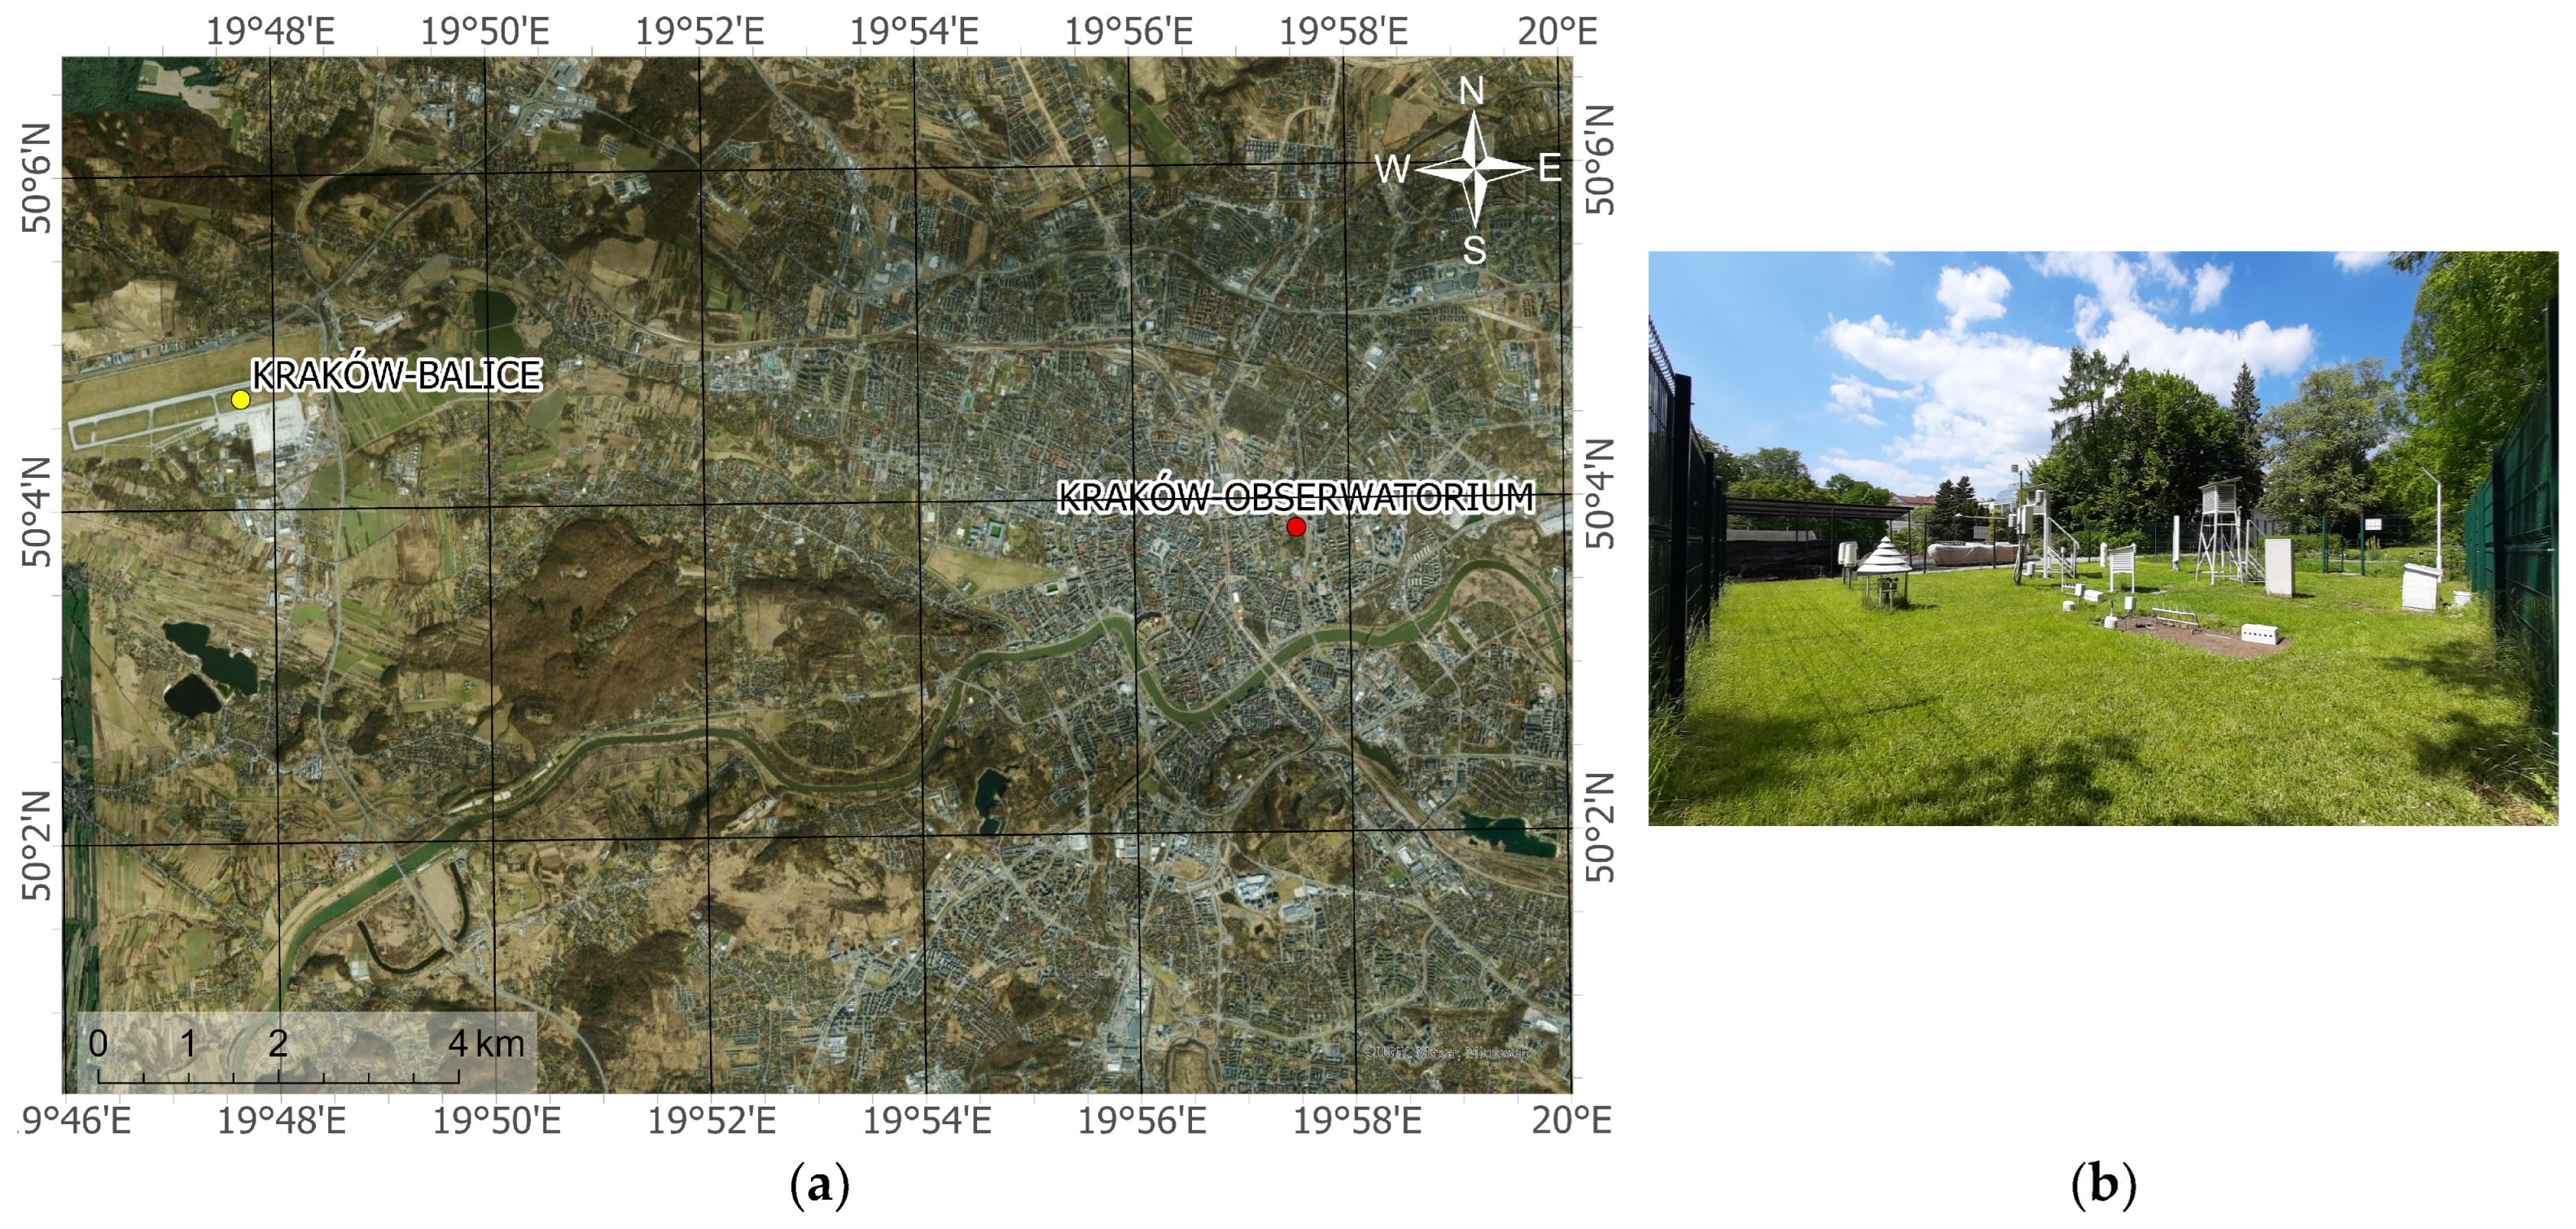
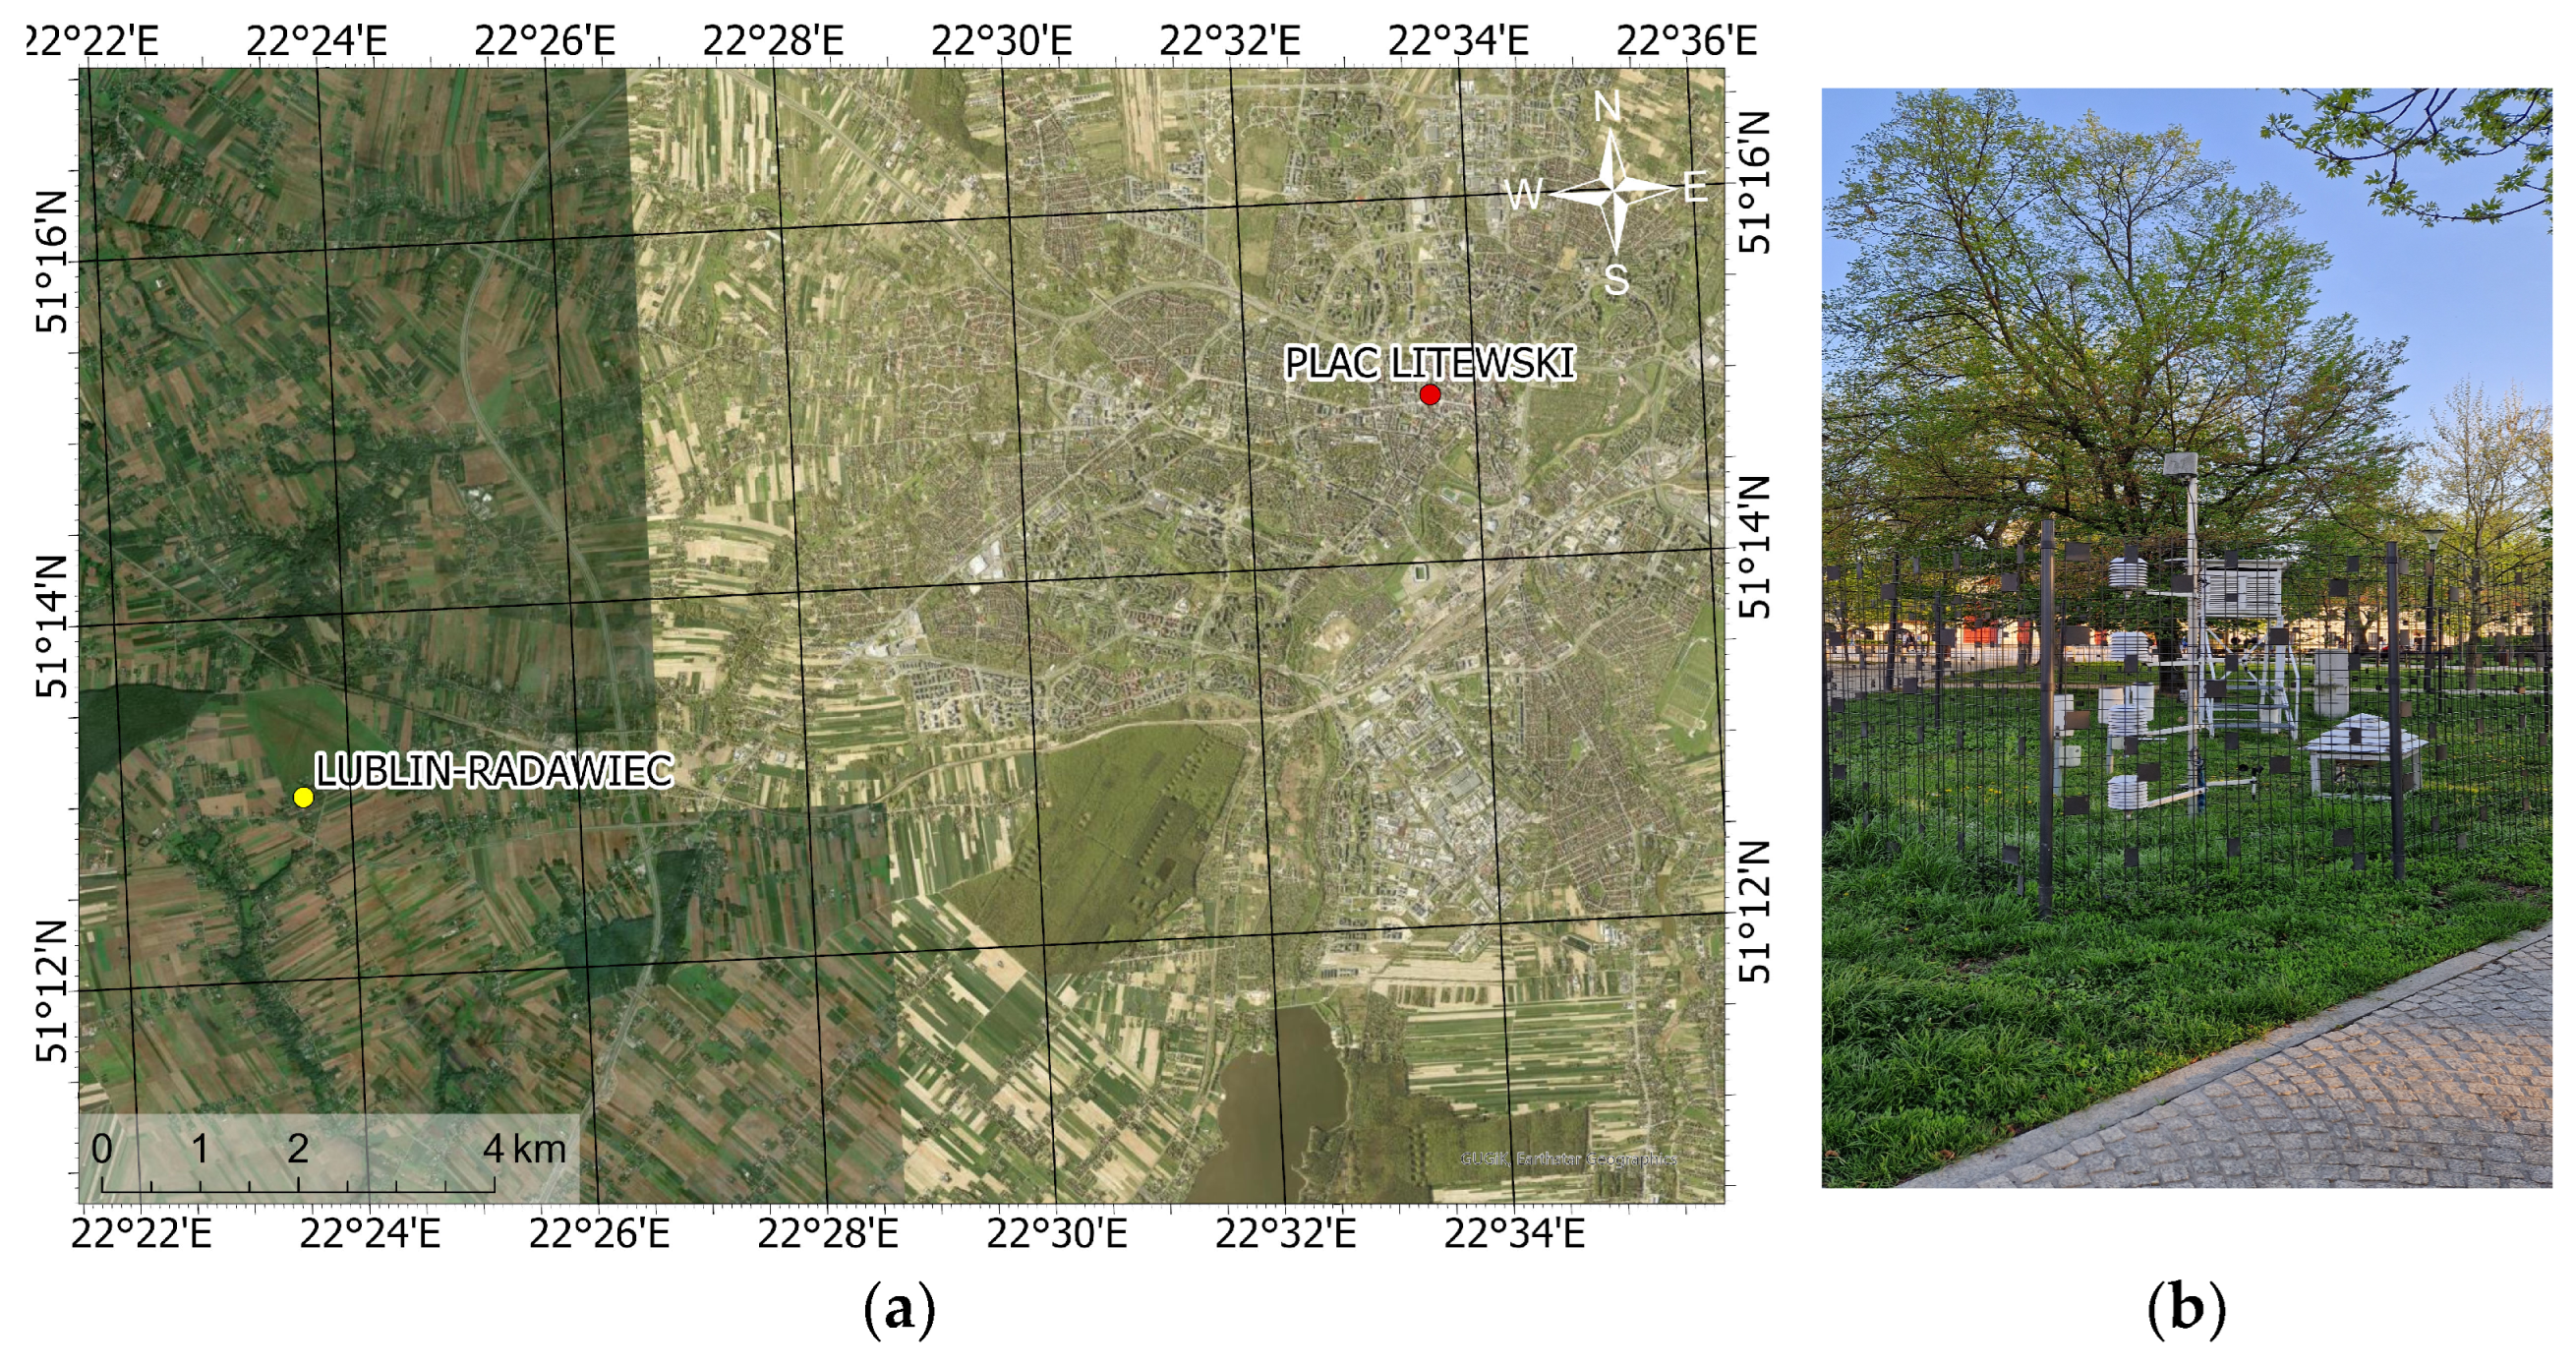
2.1. Study Area
Initially, 13 of the most populous cities in Poland were selected for this study (Figure 1), each with a population exceeding 200,000 inhabitants, based on data from the Polish Central Statistical Office [24]. However, Gdynia was excluded due to its geographical proximity to Gdańsk; together with the smaller city of Sopot, these form the Tricity metropolitan area. To avoid overrepresentation of this region, Gdynia was removed from the analysis. A similar situation occurred in the southern part of the country, where Kraków, Katowice, and Częstochowa are located in close proximity. To minimize spatial clustering, the least populated of these—Częstochowa—was excluded. Additionally, due to the unavailability of relevant meteorological data, Bydgoszcz was also removed from the study. To ensure regional balance, Rzeszów, located in the underrepresented southeastern part of Poland, was included as a replacement. In total, 11 cities located in different regions were selected for the study (Table 1).
Figure 1.
The most populated cities in Poland at 31.XII.2023 based on public data from Statistics Poland [24].
Table 1.
The most populated cities selected for the study.
To examine the differences in biometeorological conditions during heat events between a standard meteorological station and an urban environment, three additional urban stations were selected. They are located within the dense urban fabric of the city centers of Warszawa, Kraków, and Lublin. Warszawa-Filtry station is a climatological station, situated near urban structures to ensure it is representative of the city’s climate (Figure 2). Measurements at the Kraków-Obserwatorium station are conducted in the city center, on the grounds of the Botanical Garden, in an area covered with vegetation (Figure 3). Measurements in the center of Lublin (Lublin-Plac Litewski) are carried out in an urban setting on a flat surface paved with stone, featuring elements of green infrastructure (Figure 4).
Figure 2.
The location of measurement stations (a) in the city center (Warszawa-Filtry) and outside the city (Warszawa-Okęcie) in Warszawa and surroundings of the meteorological station Warszawa-Filtry (b). Source: (a)—ArcGIS online basemap, (b)—photo by Agnieszka Krzyżewska.
Figure 3.
The location of measurement stations (a) in the city center (Kraków-Obserwatorium) and outside the city (Kraków Balice) in Kraków and surroundings of the meteorological station Kraków-Obserwatorium (b). Source: (a)—ArcGIS online basemap, (b)—photo by Sebastain Wypych.
Figure 4.
The location of measurement stations (a) in the city center (Plac Litewski) and outside the city (Lublin-Radawiec) in Lublin and surroundings of the meteorological station Lublin-Plac Litewski (b). Source: (a)—ArcGIS online basemap, (b)—photo by Agnieszka Krzyżewska.
The synoptic stations in Warszawa (Warszawa-Okęcie, Warszawa, Poland), Kraków (Kraków-Balice, Kraków, Poland), and Lublin (Lublin-Radawiec, Lublin, Poland) are located outside the area of dense urban development, in accordance with the requirements set by the World Meteorological Organization (WMO) regarding the location of such stations [25].
2.2. Data and Methods
The required meteorological data for this study were recorded at 11 synoptic stations (Table 1) and 2 climatological stations (Warszawa-Filtry and Kraków-Obserwatorium) in the summer months for the period of 2020–2024, including September 2024. They were obtained from Institute of Meteorology and Water Management–National Research Institute (IMWM) [26] with the use of R package “climate” [27]. Missing data from Warszawa-Filtry station were supplemented with data from another station located in the city (Warszawa-Bielany). Measurements at synoptic stations are conducted hourly, while at climatological stations, they are taken three times a day (06, 12, and 18 UTC).
An additional dataset was obtained from hourly measurements conducted hourly by the University of Maria Curie Skłodowska (UMCS) in Lublin Observatory in the center of the city. The data were obtained from The Department of Hydrology and Climatology of the UMCS in Lublin, Poland.
The occurrence of hot days and heatwaves was considered a heat event. A hot day was defined as a day with a maximum air temperature above 30.0 °C [28]. Although there are many methods of defining heatwaves, this study adopts the approach of considering at least three consecutive days with a maximum temperature above 30 °C, allowing for 1–2-day breaks where the maximum temperature exceeds 25 °C on each of those days. The following main characteristics of the occurrence of heat events during analyzed period were determined: number of hot days and number of heatwaves as well as number of hot days during heatwaves. Additionally, the intensity of individual heatwaves was assessed using the Heat Wave Severity (HWS) index, defined as the sum of the “excesses” of the maximum temperature above 30 °C on subsequent days of a given heatwave in the analyzed period [29].
where:
- tmaxi: the maximum air temperature [°C] on day i
- n: the number of days in a heatwave
Biometeorological conditions during heat events were assessed based on the Universal Thermal Climate Index (UTCI) and heart rate (HR), assuming a metabolic heat production of 135 W∙m−2 for an adult human. The UTCI was derived from the advanced and comprehensively validated multi-node Fiala model of human temperature regulation and thermal comfort [2]. It is defined as the air temperature that would cause the same physiological strain under reference conditions [2,5]. The meteorological reference conditions are as follows: the mean radiant temperature equals the air temperature, the wind speed observed 10 m above ground is 0.5 m∙s−1, and the reference vapor pressure corresponding to 50% relative humidity for ambient temperature equals at most 29 °C and 20 hPa at temperatures above 29 °C. In physiological reference conditions, a person’s metabolic rate while walking at the speed of 1.1 m∙s−1 and wearing clothing appropriate for the current thermal conditions and wind speed is considered. Everyday hourly values of air temperature (°C), relative humidity (%), wind speed at 10 m (m∙s−1), and total cloudiness (okta) were used to determine UTCI values. In present work, the UTCI was calculated with the use of the BioKlima 2.6 software [30], a specialized application developed for biometeorological purposes, and the implemented formula for the mean radiant temperature (°C). Absorbed solar radiation (W∙m−2) was determined using the SolAlt model, as implemented using the BioKlima software [30]. The calculations were based on two key atmospheric parameters: the degree of total cloud cover (in okta) and the solar elevation angle (in degrees). Outgoing longwave radiation from the surface (W∙m−2) was estimated using air temperature and total cloudiness, while the downward longwave radiation emitted by the atmosphere was derived from air temperature and vapor pressure values (hPa). The assessment scale of the UTCI values classified in terms of thermal stress in humans was used to indicate the occurrence of heat stress (Table 2). This assessment scale was constructed on the basis of the occurrence of critical levels of heat strain reactions in the human body and the corresponding threshold values of the UTCI index. The “strong heat stress” threshold UTCI value equals 32 °C and an increase in the evaporation heat loss of more than 40 W∙m−2 within 30 min is observed. Thermal sensation responses are observed already in the case of the moderate heat stress category, when UTCI value is between 26.1 and 32 °C. A sweat rate above 100 g per hour and thermal sensation of warmth are observed. In this case, it is necessary to replenish fluids at a rate of 0.25 L per hour. Generally, as the value of the UTCI increases, intensification in physiological responses such as the sweat rate, skin temperature, and skin wettedness are observed [5]. The maximum UTCI index values were determined during hot days and heatwaves. The UTCI and its assessment scale was validated in wide range of weather and climates [5]. The outputs are categorized into defined thermal stress classes ranging from “extreme cold stress” to “extreme heat stress”, enabling consistent interpretation across different geographic contexts [31].
Table 2.
UTCI categorized in terms of thermal stress [31].
In turn, heart rate (HR) determines the number of heart beats per minute (bpm). The HR value increases with increasing air temperature and water vapor pressure as well as with increasing physical exertion. HR values were estimated using BioKlima 2.6 [30] with the following implemented formula:
where:
- M: metabolic heat production [W∙m−2]
- T: air temperature [°C]
- vp: air vapor pressure [hPa]
According to physiologists, the normal heart rate for men is 70–72 bpm, and for women, it is 78–82 bpm [32]. As HR increases above this value, the load on the circulatory system increases. The warning value for HR is 90 bpm, and a fast heart rate is defined as above 100 bpm [33].
3. Results
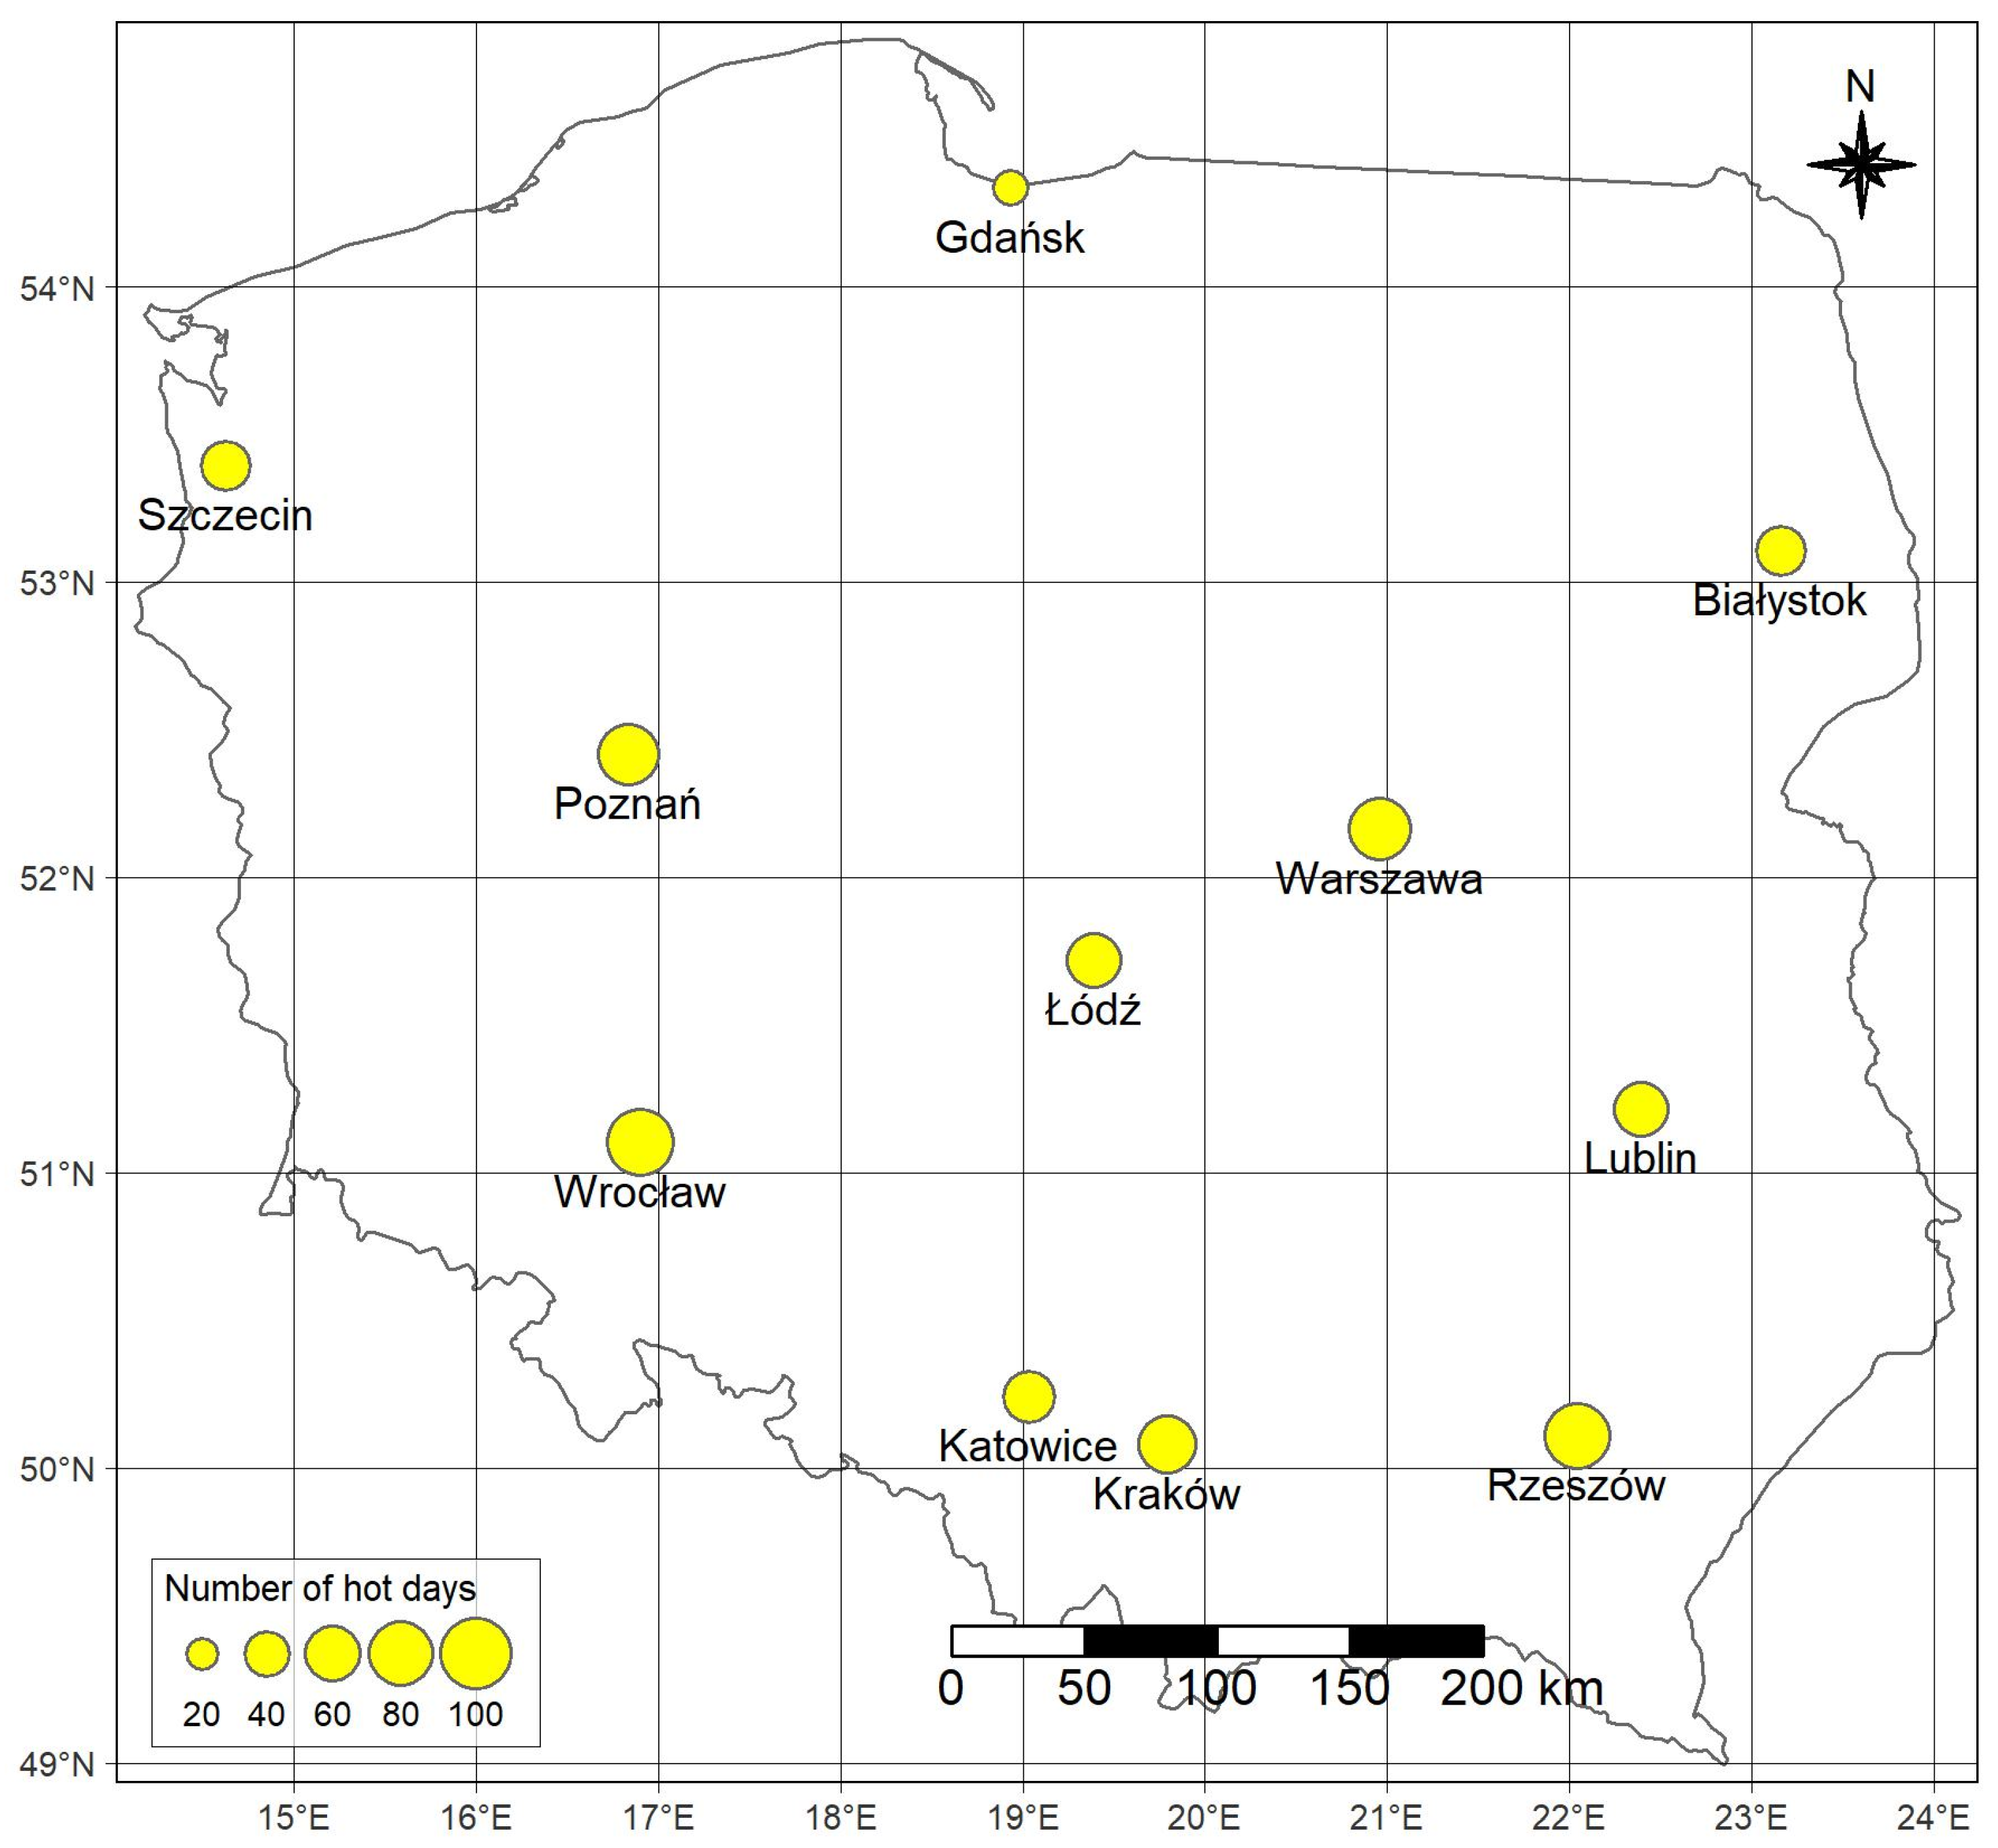
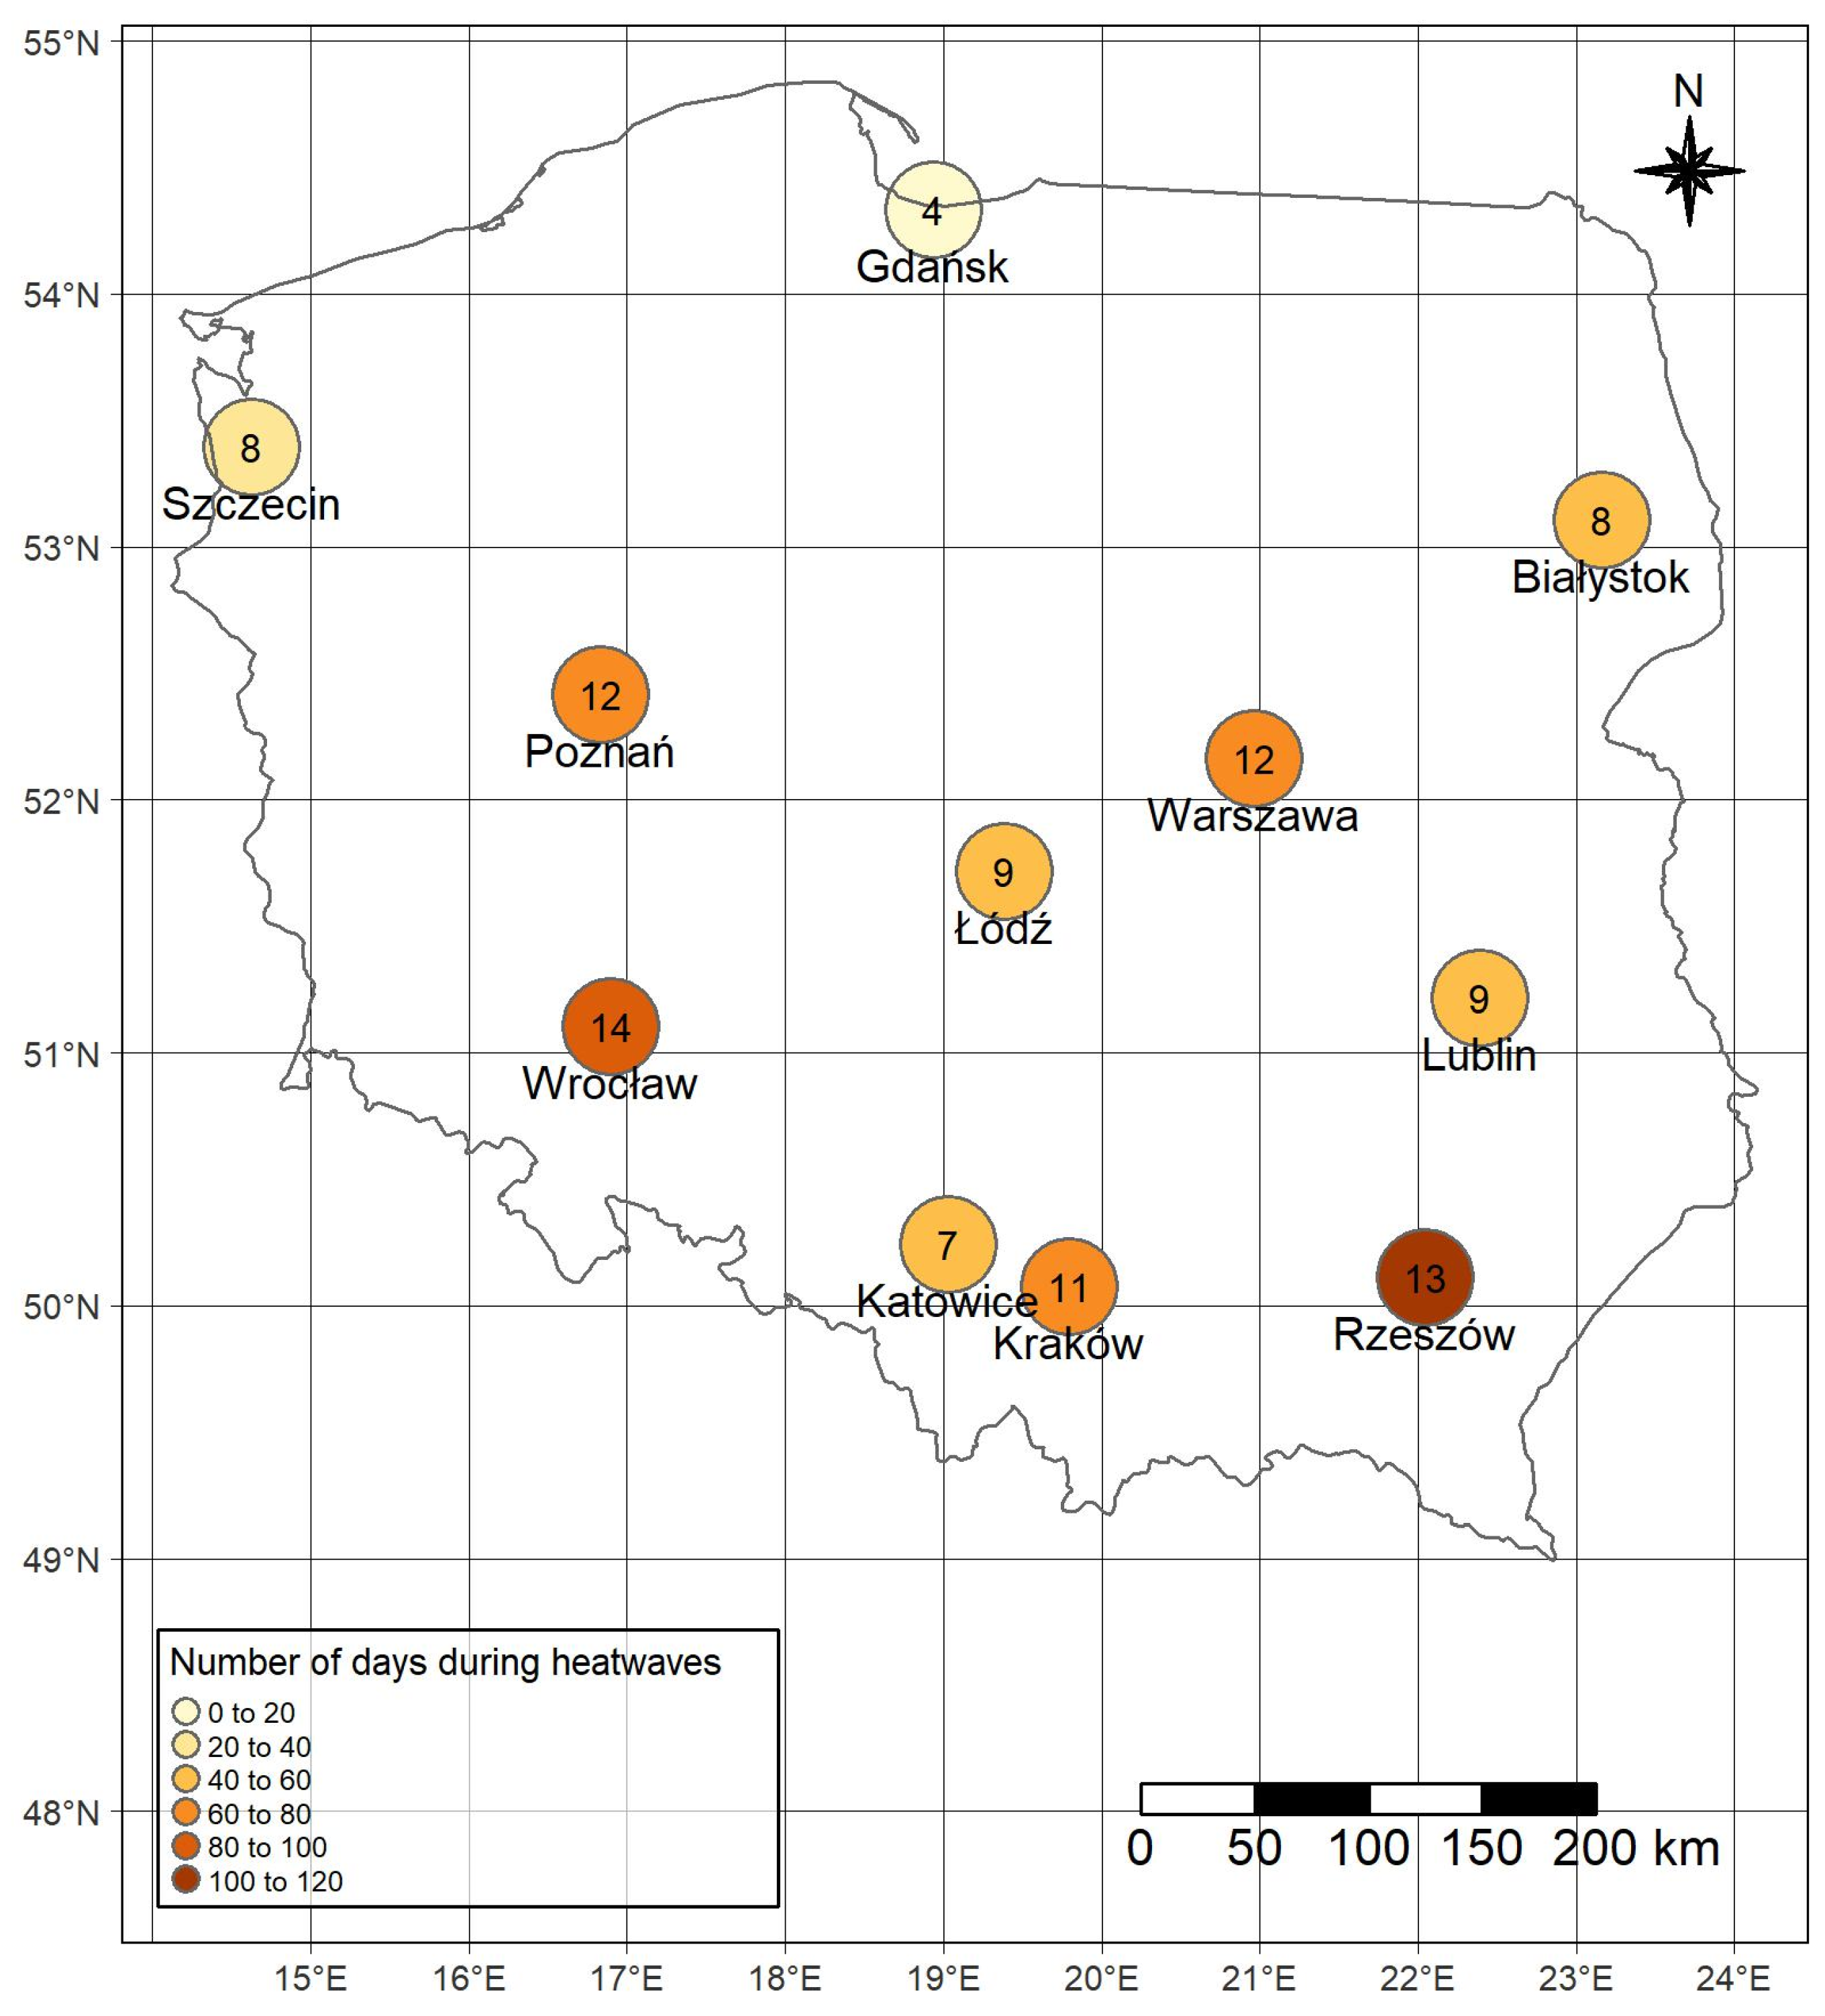
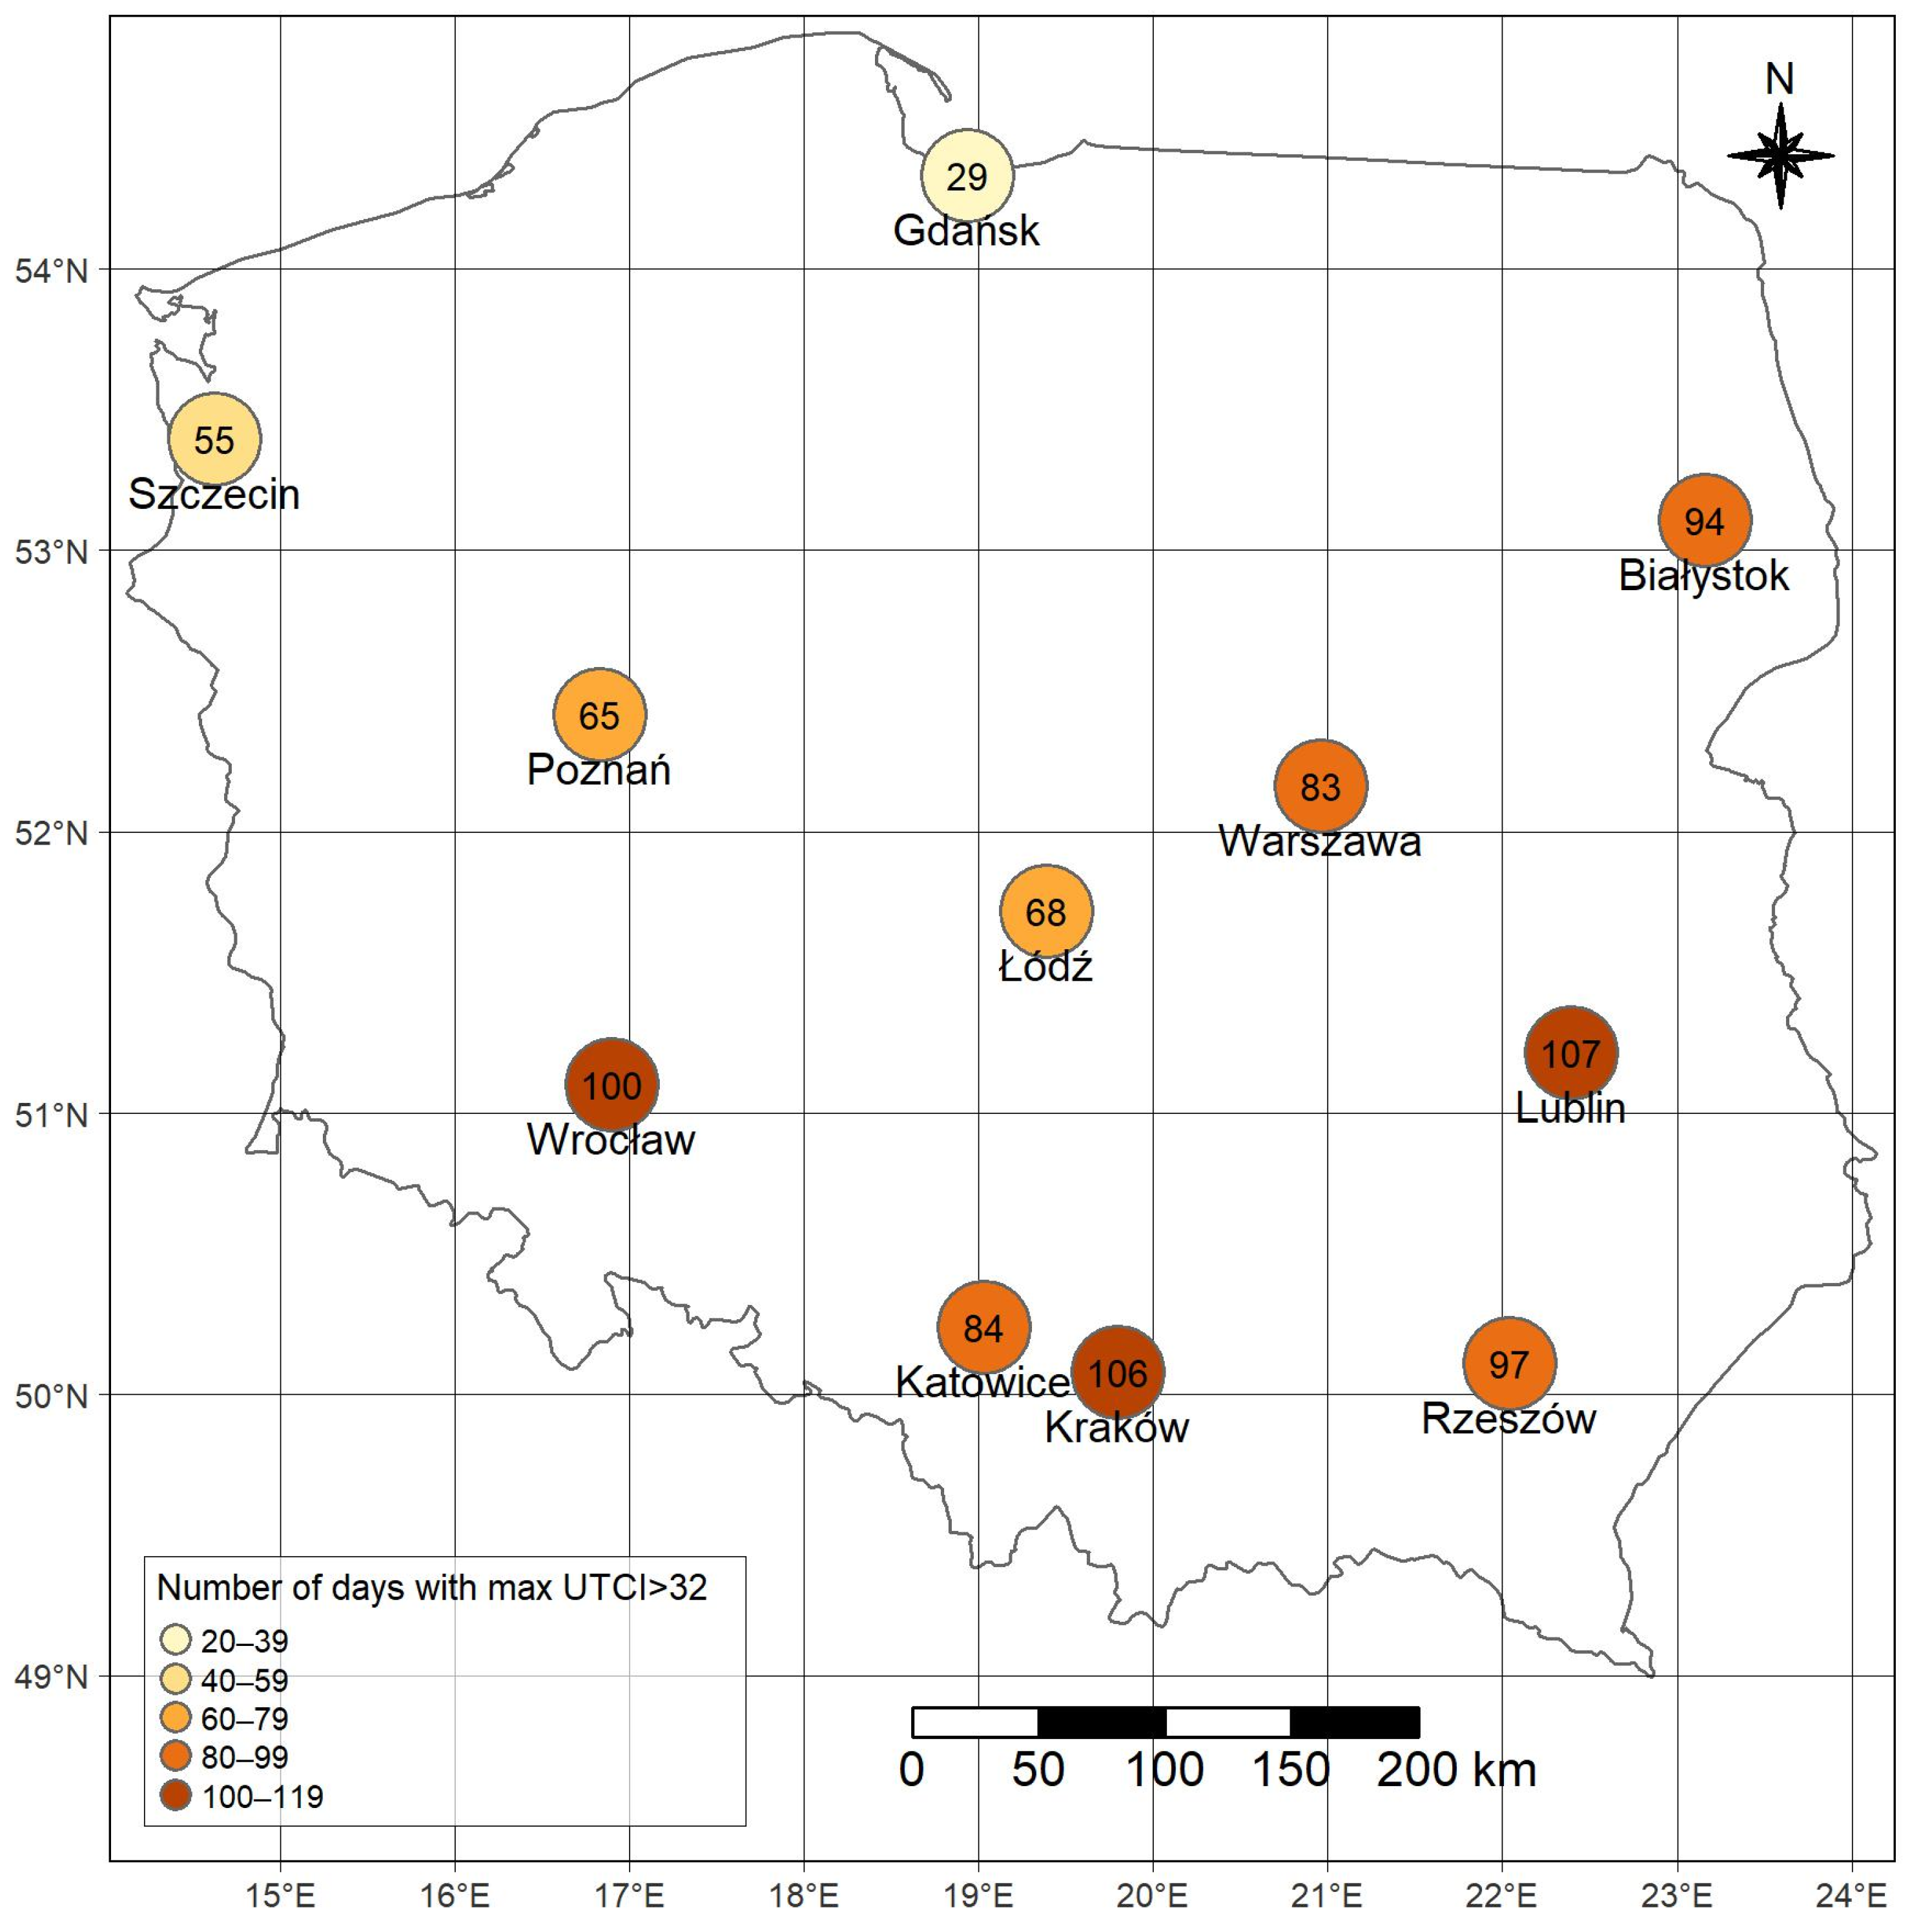
3.1. Occurrence of Hot Days and Heatwaves
During the multi-year period of 2020–2024, hot days occurred from May to September, with only a single hot day in May (11 May 2021 in Wrocław, when the maximum temperature reached 30.2 °C). In contrast, in September, hot days were recorded in 2023 in Warszawa and Wrocław, and in 2024 they were recorded in all cities. The total number of days in the period under study was 469. The distribution of hot days is presented in Figure 5. The lowest number of hot days occurred in Gdańsk (25 days), a city located on the coast. In contrast, the highest number of hot days was observed in Wrocław (87 days) in the southwestern region and in Rzeszów (84 days) in the southeastern region. The maximum number of hot days was recorded in 2024, ranging from 18 days in Katowice to 33 days in Wrocław, whereas the coastal area recorded only 9 days. These results are several times higher than the long-term average, as during the period of 1991–2020, approximately 3 hot days per year were observed along the coast and about 9 to 12 in the other regions (according to the climate norms published by IMWM) [34]. It should also be noted that, in that year, hot days were observed in all cities except Gdańsk, even in early September. Moreover, more than half of the hot days during the analyzed period occurred during heatwave events.
Figure 5.
The number of hot days (dot size) in summer months in selected Polish cities, 2020–2024.
Heatwaves occurred all over Poland, with their frequency varying from 4 in Gdańsk to 13 in Rzeszów and 14 in Wrocław (Figure 6). In the remaining cities, the number of heatwaves ranged from 7 to 11. According to the adopted criterion, heatwaves encompassed between 34 and 110 days, with only 15 days recorded in Gdańsk. On average, heatwaves lasted from 3 to 6 days; however, it is noteworthy that in the cities with the highest number of heatwaves, the mean duration was the longest: exceeding 8 days in Rzeszów and over 6 days in Wrocław. The longest heatwaves lasted 23 days (from 12 to 25 August 2023) in Wrocław and 21 days (from 15 August to 4 September 2024) in Rzeszów.
Figure 6.
Number of heatwaves (as numbers in the circles) and number of days during heatwaves (as colors) in summer months in selected Polish cities, 2020–2024.
Three heatwaves had the greatest spatial extent (Table 3). From 18 to 24 June 2021, a heatwave was recorded in all cities—it persisted for 7 days in Kraków and 3 days in Gdańsk and Rzeszów. In 2022, 2023, and 2024, heatwaves occurred in all cities except Gdańsk; however, isolated hot days were also noted there. The heatwave with the highest intensity was observed in Wroclaw in July 2022, reaching an HWS index of 21.1 °C. In other cities, the most intense heatwaves had a severity ranging from 6 °C in Gdansk to 17.2 °C in Warszawa.
Table 3.
Heatwaves with the largest spatial extent in Poland in 2020–2024.
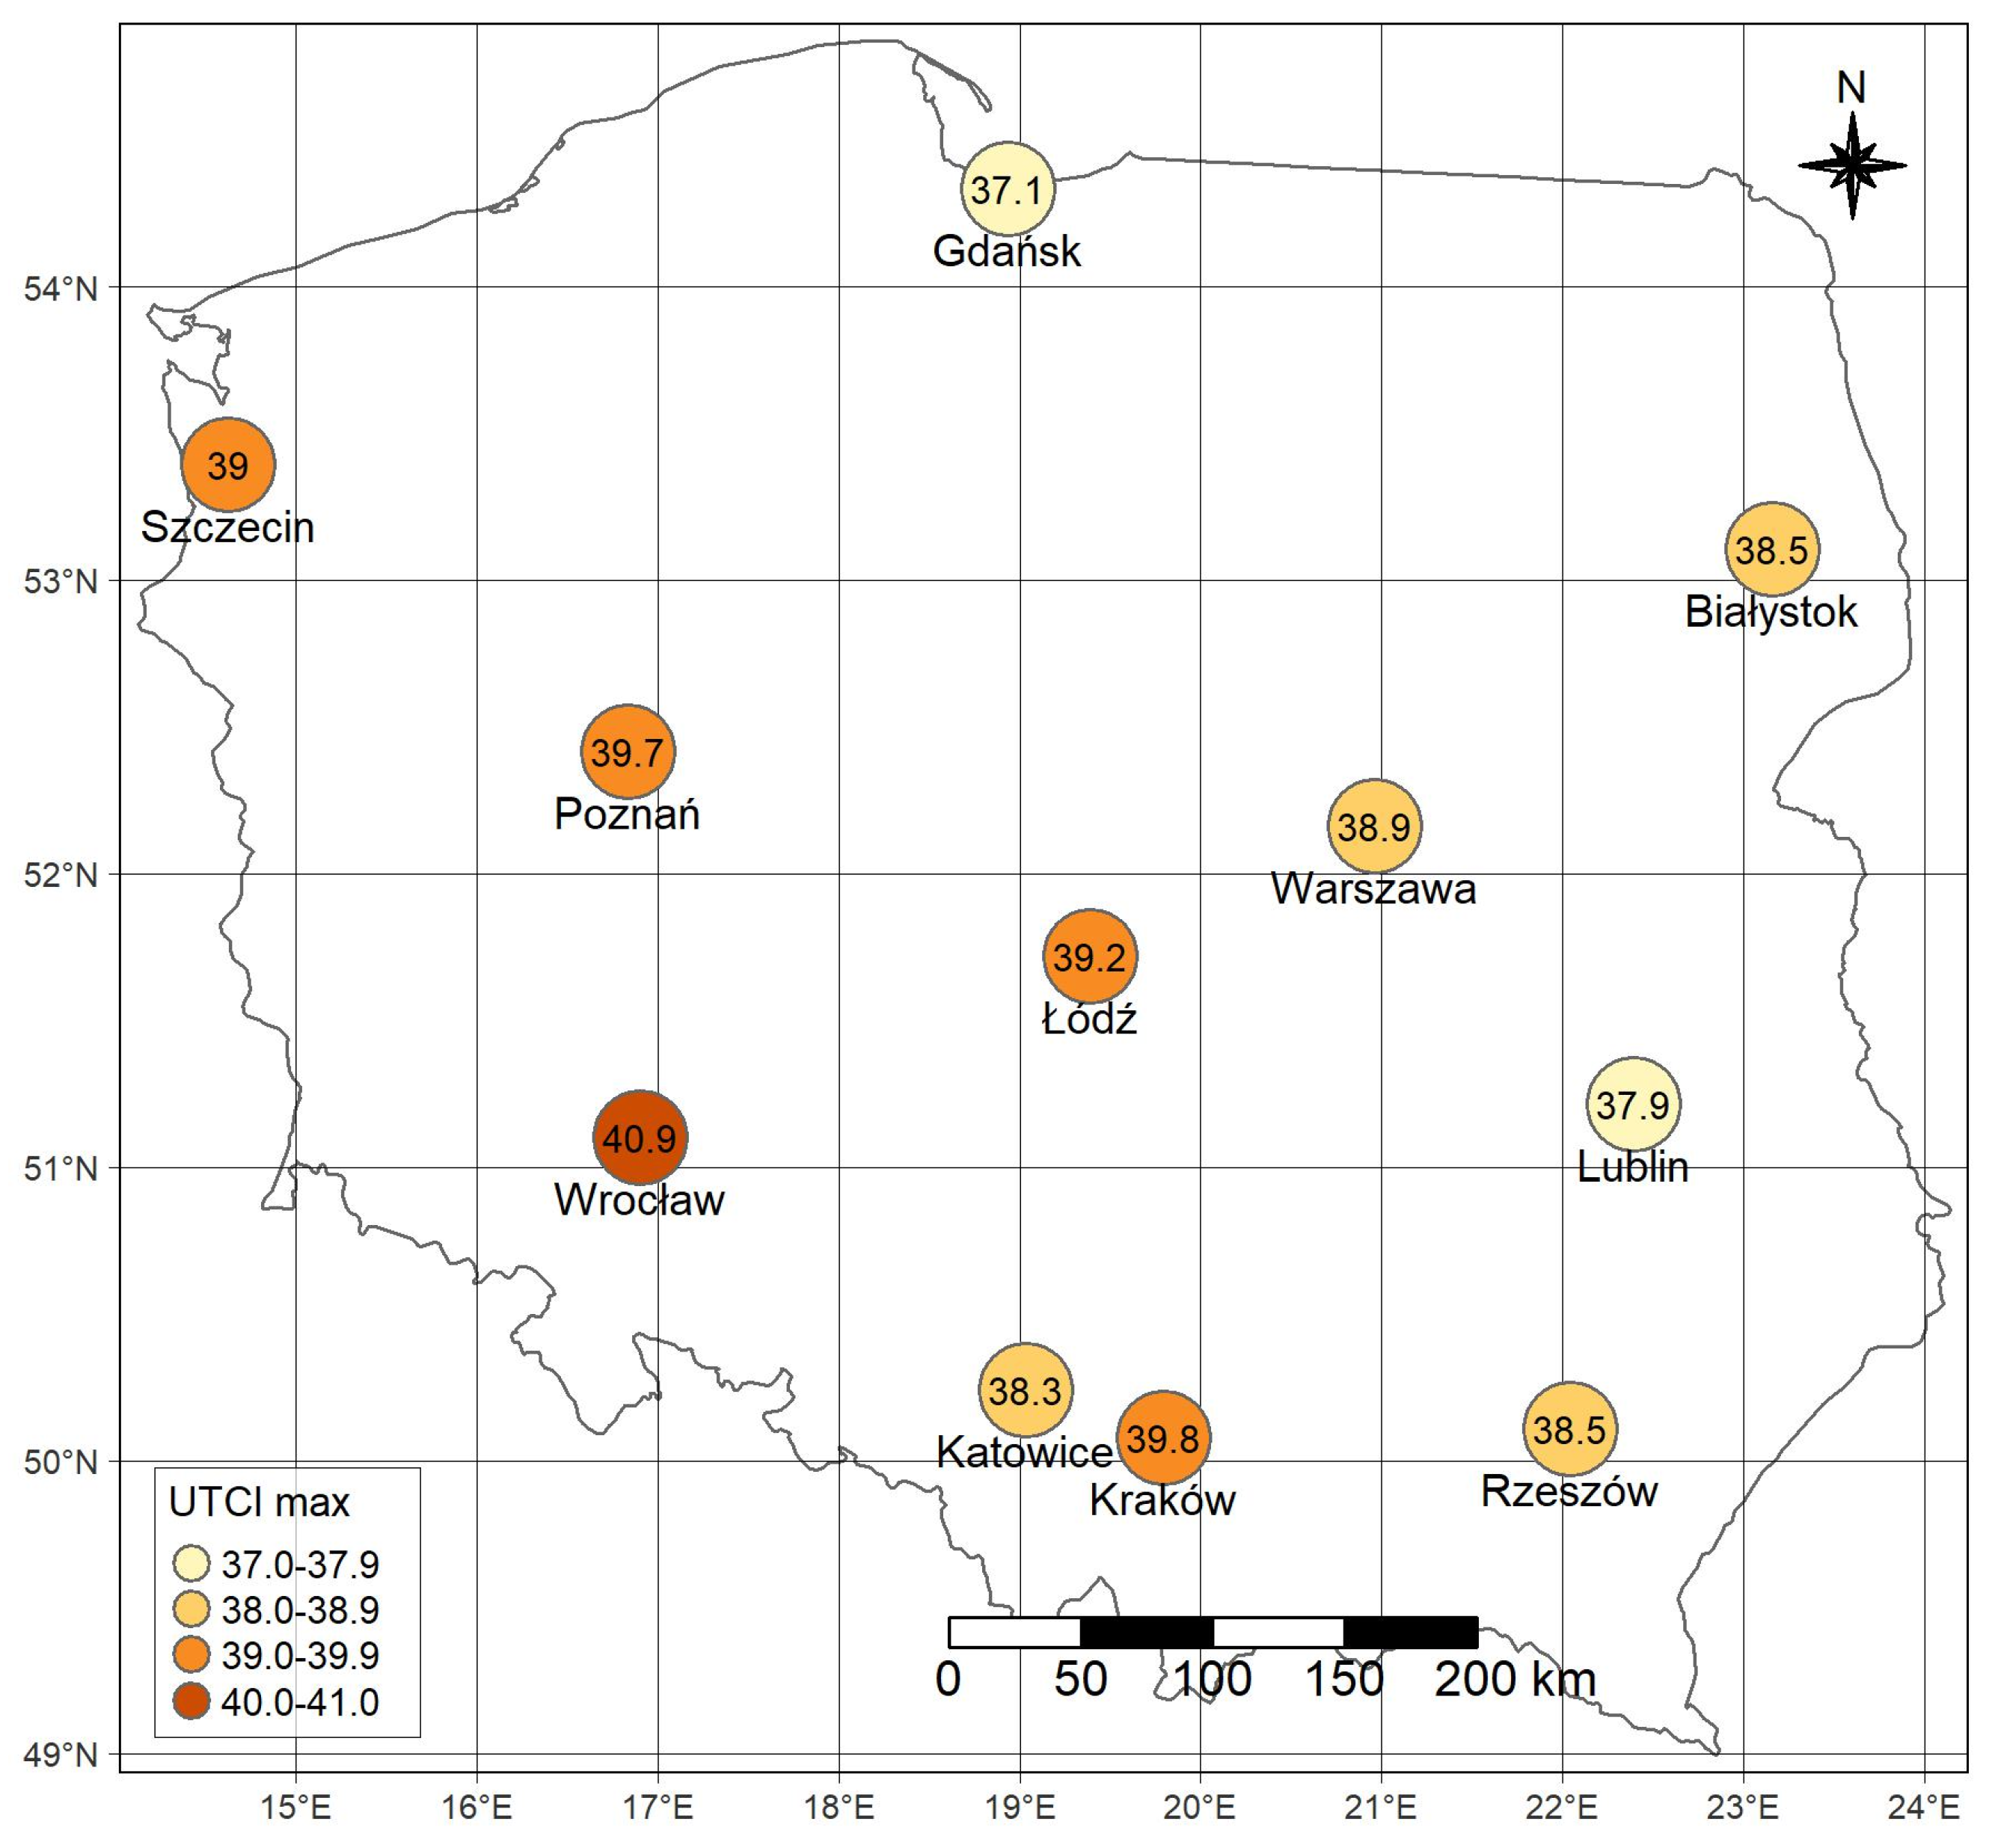
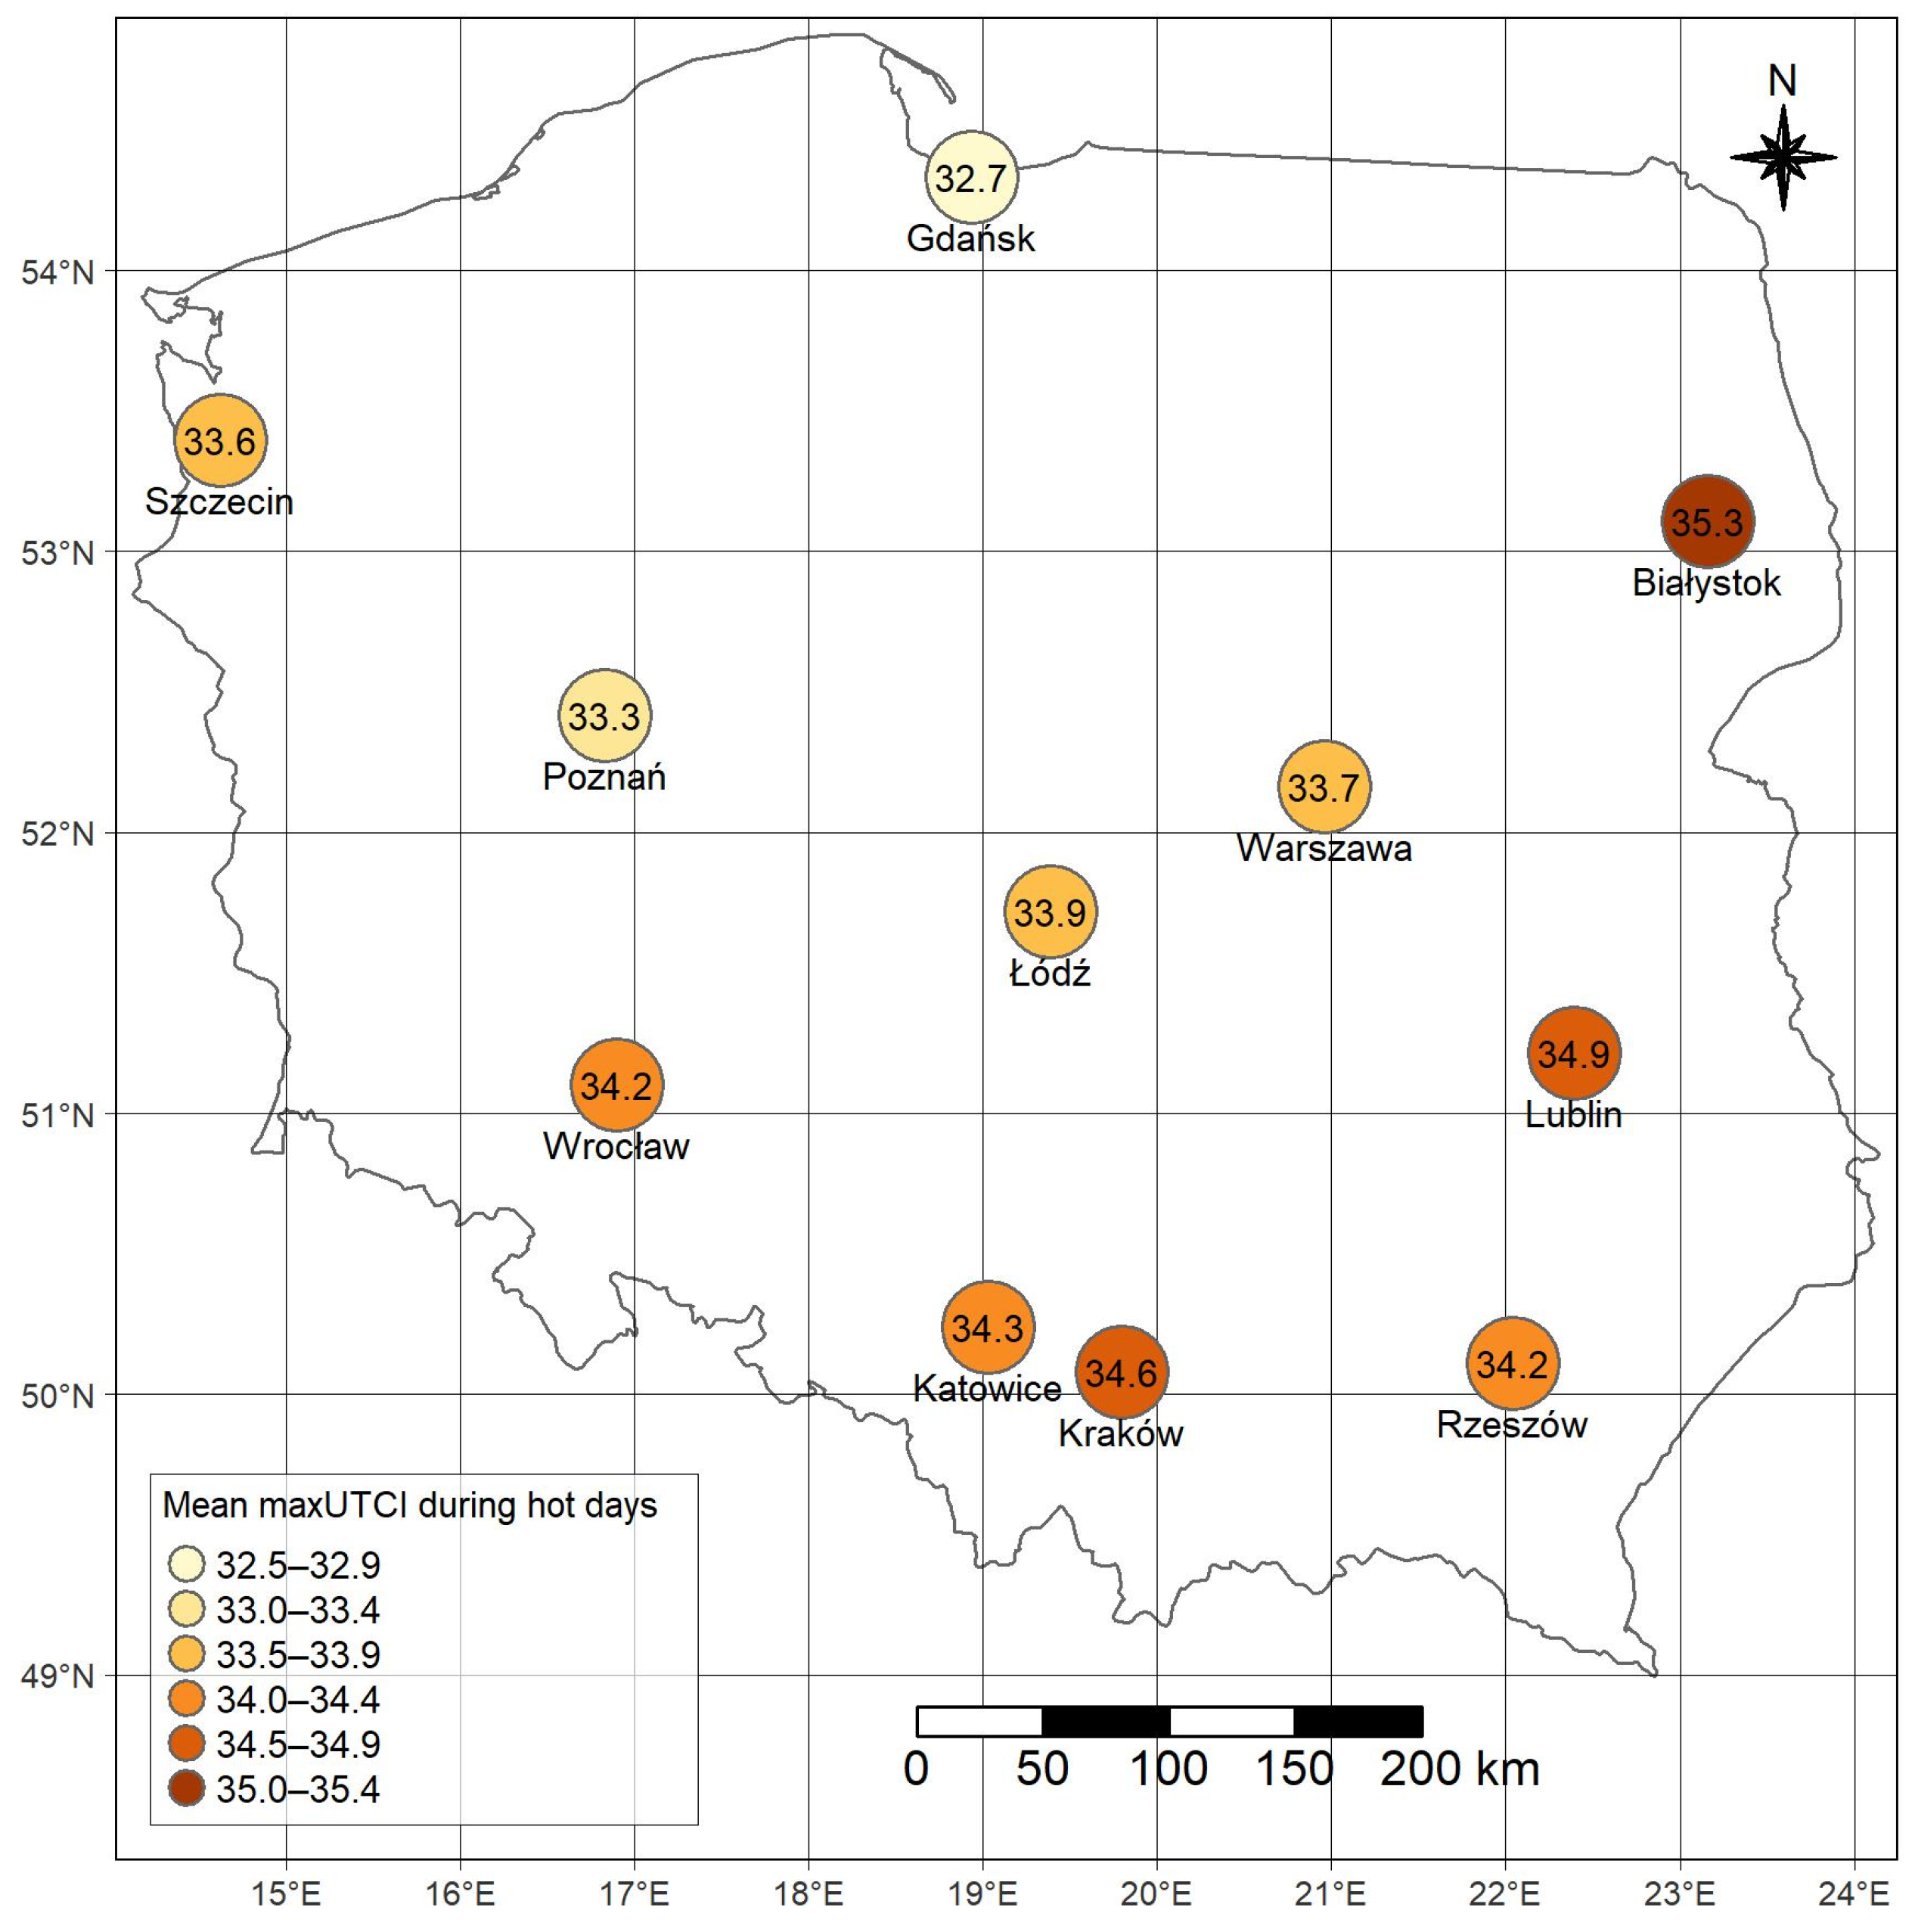
3.2. Biometeorological Conditions During Hot Days and Heatwaves
Biometeorological conditions categorized as “strong or very strong heat stress”, according to the UTCI, were observed in all cities. The highest number of days (over 100) with such conditions was recorded in Lublin and Kraków, where they accounted for 23% of all days (Figure 7).
Figure 7.
Number of days with “strong and very strong heat stress” according to UTCI in summer months in selected Polish cities, 2020–2024.
Based on the maximum UTCI values, it can be concluded that in the majority of hot days, “strong or very strong heat stress” conditions occured, ranging from 72% of days in Gdańsk to 100% in Białystok. The highest maximum UTCI values recorded in the individual cities indicate the occurrence of “very strong heat stress” (Figure 8), with the exeption of Lublin and Gdańsk, where values fell within the “strong heat stress” category. The average maximum UTCI values during hot days ranged from 32.7 °C in Gdańsk to 34.9 °C in Lublin (Figure 9).
Figure 8.
Maximum value of the UTCI (°C) in summer months in selected Polish cities, 2020–2024.
Figure 9.
Mean maximum UTCI (°C) during hot days in summer months in selected Polish cities, 2020–2024.
In all cities, during hot days, there was a great amount of heat strain on the human body due to the high air temperature, which usually did not ease during the warmest period of the day. The highest UTCI values were connected with heatwave occurrences, except for Gdańsk and Lublin, where they were recorded during single hot days.
During the most intense heatwaves, assessed using the Heat Wave Severity (HWS) index, the mean daily UTCI values ranged from 24.7 °C to 27.6 °C (Table 4). The average UTCI values during the hours of the highest solar radiation influx, between 10:00 and 14:00 UTC, varied between 29.6 °C and 36.4 °C. “Strong and very strong heat stress” occurred during 20–30% of these hours, with Białystok experiencing this level of stress over 50% of all hours. At the same time, the mean daily heart rate reached the warning threshold of 90 bpm, with maximum values exceeding 103 bpm (Table 4).
Table 4.
Biometeorological conditions during the most intense heatwaves (according to HWS index) in selected Polish cities, 2020–2024.
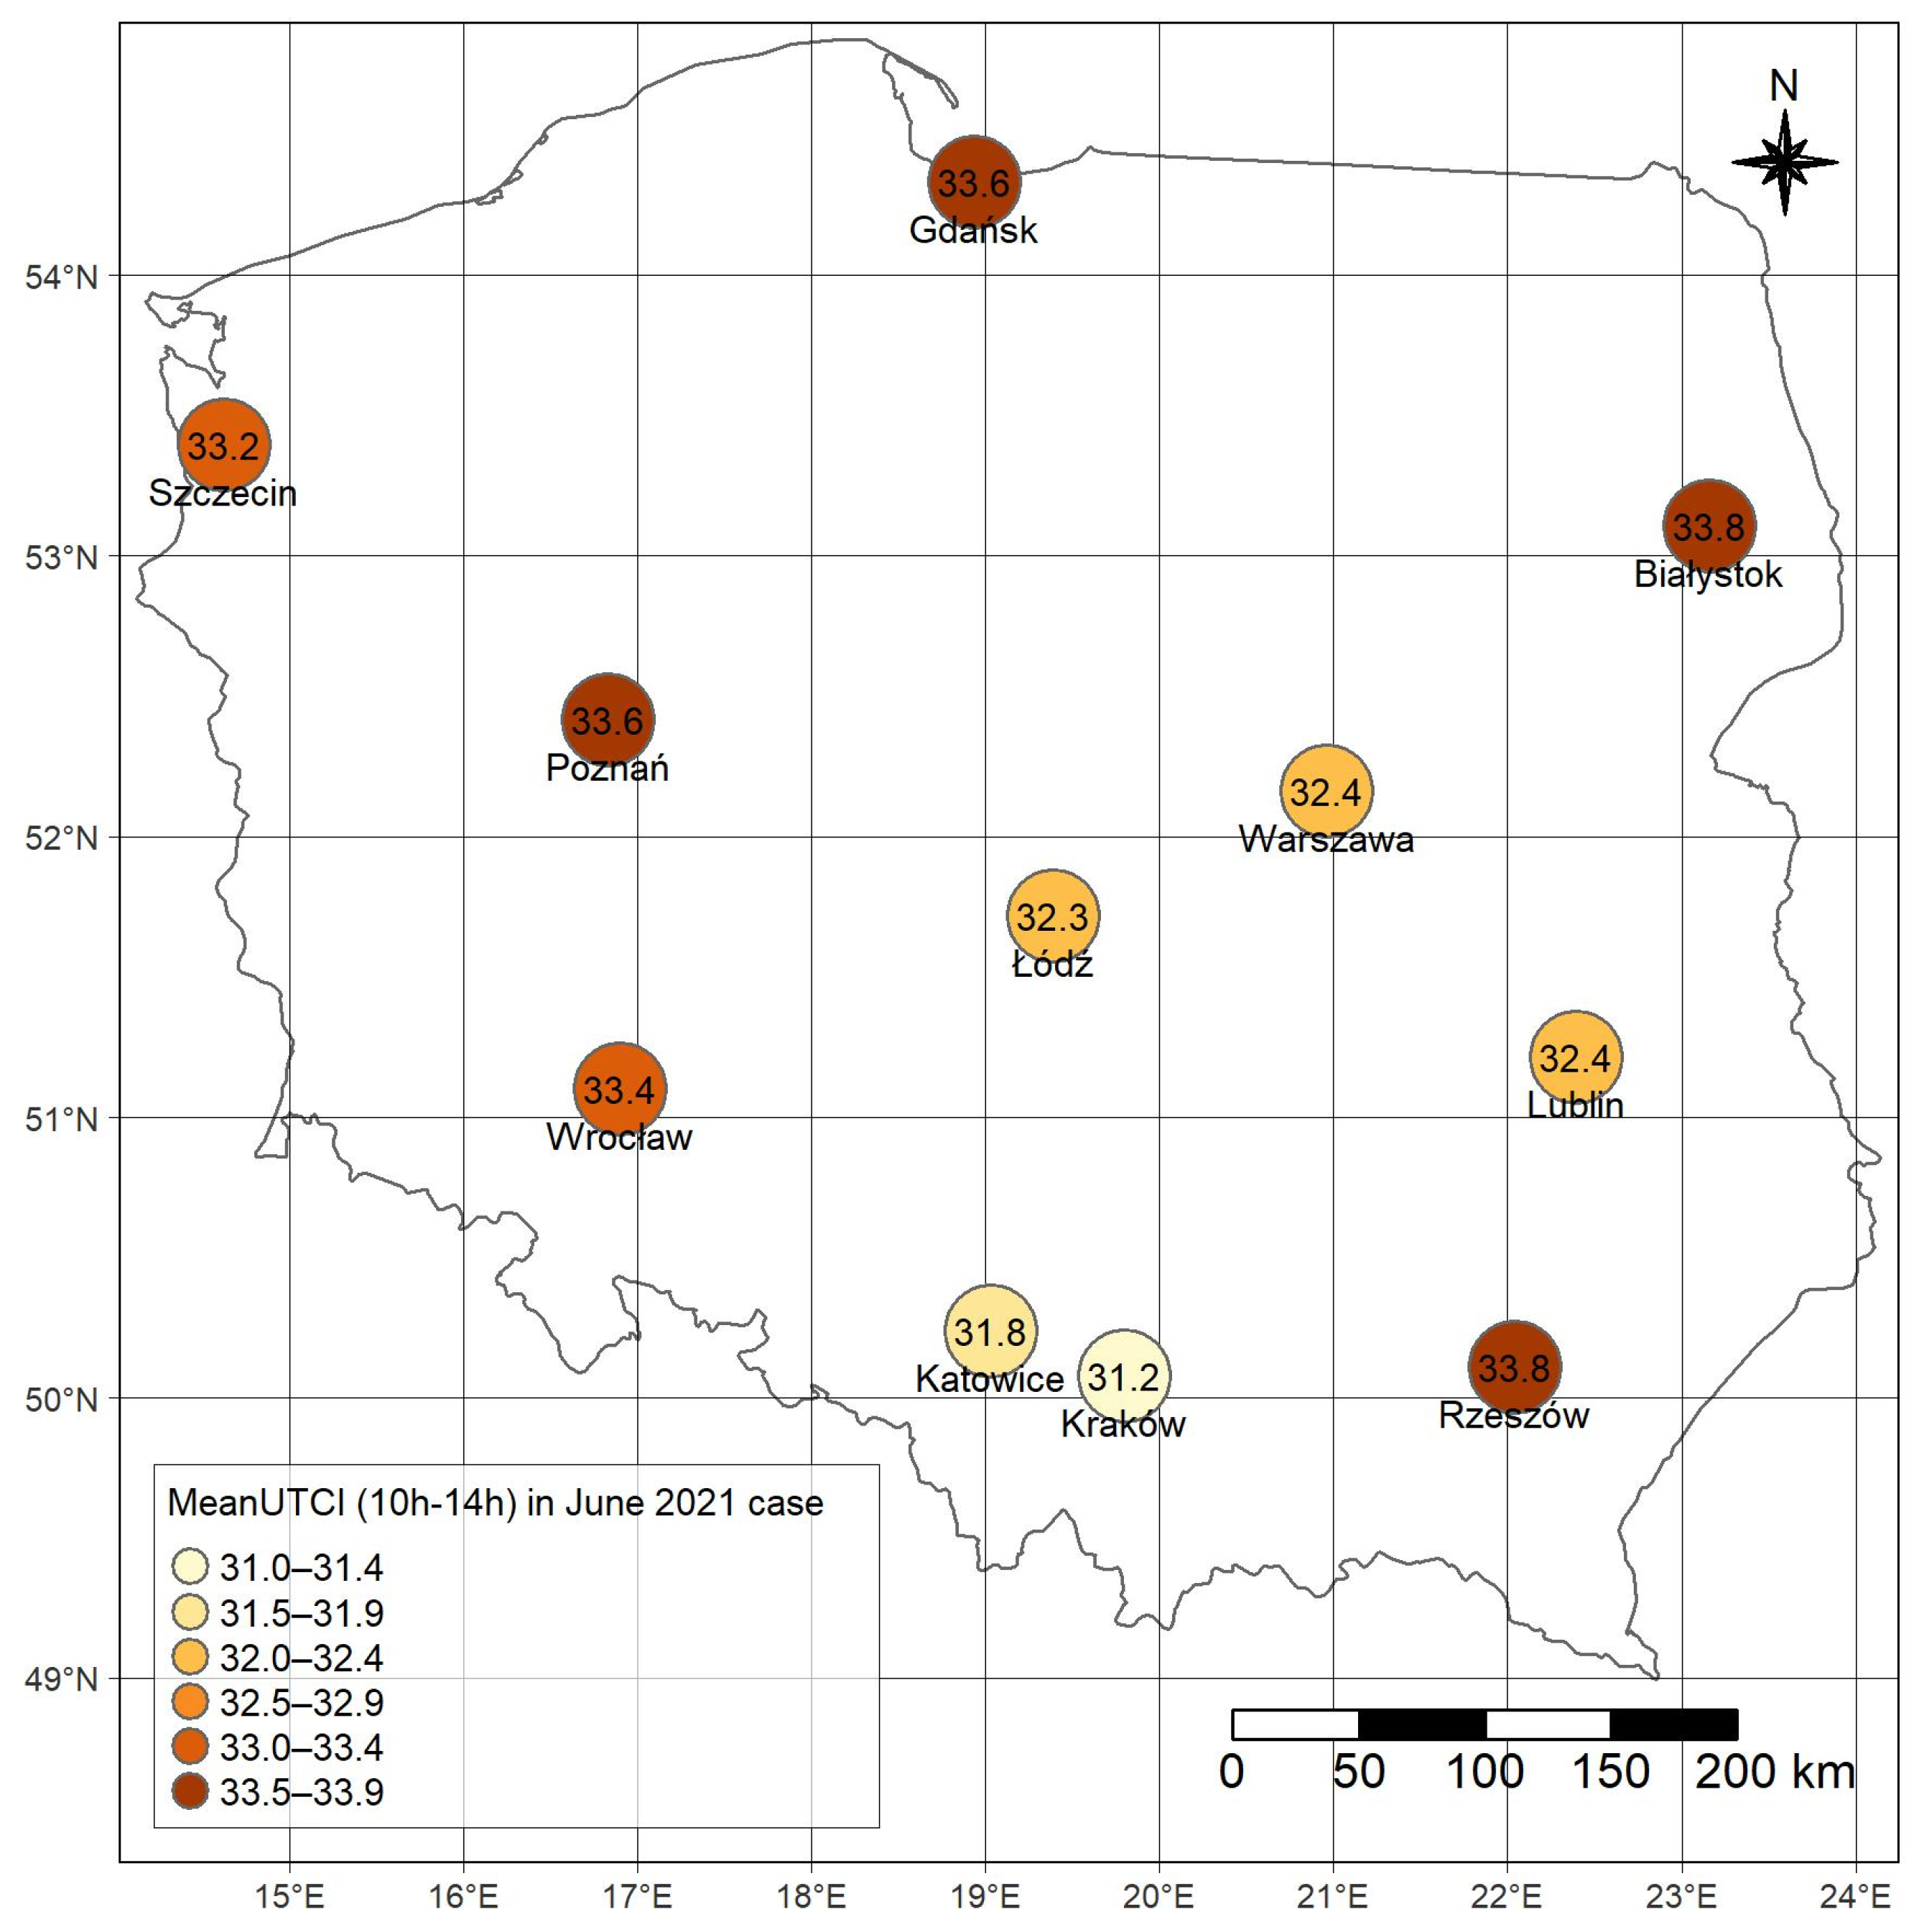
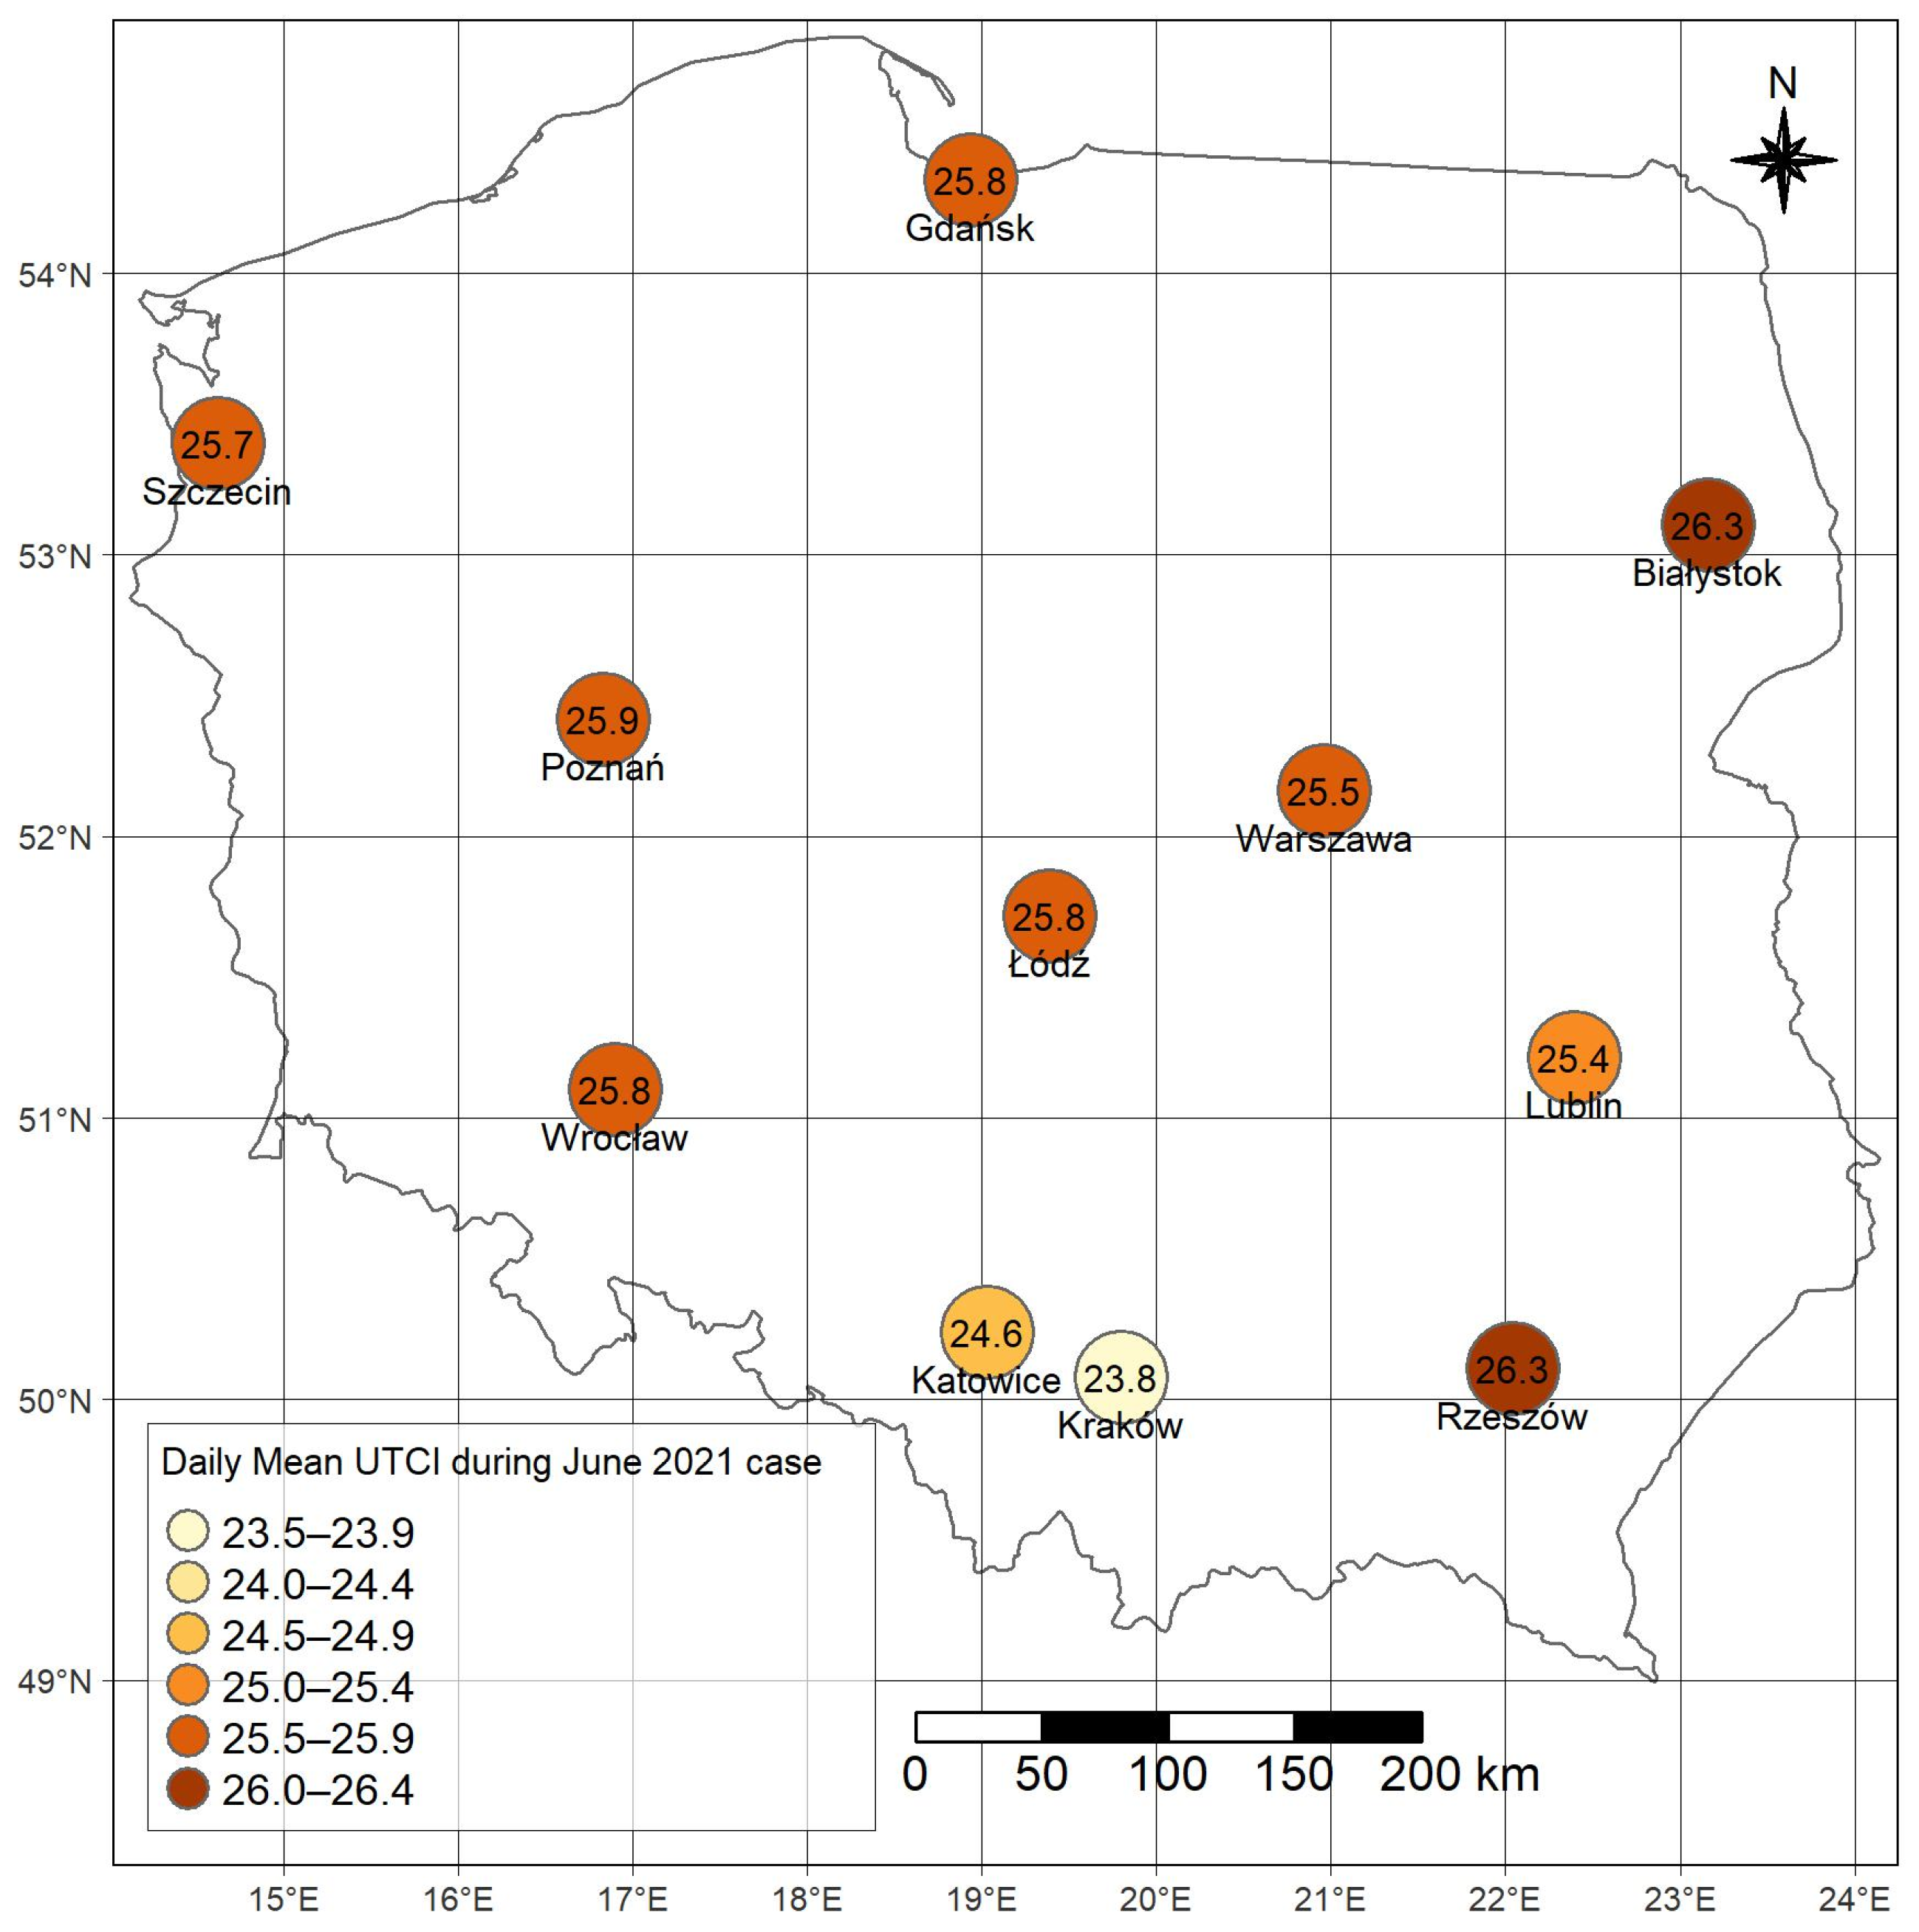
3.3. Heatwave of June 2021–Case Study
The heatwave in June 2021 started at some stations in Western Poland (Wrocław, Poznań, and Szczecin) on 17 June 2021 and lasted until 24 June 2021 (Table 5). In Gdańsk, Szczecin, and Poznań, it was also the most intense heatwave during that period. According to synoptic maps published by IMWM [26], Poland was within the range of an extended high-pressure system centered at 1026 hPa over Eastern Europe, while areas of low pressure were identified from over the North Atlantic to the western part of the continent up to the region of Asia Minor. These circulation conditions favored the advection of hot tropical air from the south-east direction and were also associated with strong solar radiation and weak air movement. These were conditions similar to the type of atmospheric circulation favoring the occurrence of heatwaves [35] and the occurrence of “strong and very strong heat stress” according to the UTCI in Poland [14].
Table 5.
The start and end date and duration of June 2021 heatwave.
The maximum UTCI values during this heatwave indicate the occurrence of “strong heat stress” in all cities, and in Szczecin, they indicate ”very strong heat stress” (Figure 10). Such conditions were recorded in 21–28% of all hours during this wave. They occurred during the daytime hours, primarily between 10:00 and 14:00 UTC. The average UTCI values during this period ranged between 31.7 °C and 33.8 °C (Figure 11). The mean daily UTCI values varied from 23.8 °C in Kraków to 26.3 °C in Rzeszów (Figure 12).
Figure 10.
Maximum value of UTCI (°C) during June 2021 heatwave in selected Polish cities.
Figure 11.
Mean UTCI (°C) between 10:00 and 14:00 UTC during June 2021 heatwave in selected Polish cities.
Figure 12.
Daily mean UTCI (°C) during June 2021 heatwave in selected Polish cities.
The conditions classified as “no thermal stress” were present during approximately half of the hours in all cities, suggesting that there may have been some mitigation of biometeorological conditions. However, this occurred only at night, when there was no direct solar radiation. It is also possible that local-scale air movement contributed to the mitigation of heat stress. Additionally, it is important to note that measurement stations are located outside city centers. The maximum UTCI value during this heatwave reached 38.8 °C in the center of Kraków and 38.7 °C in the center of Lublin, indicating they experienced more intense heat strain compared to areas outside city centers.
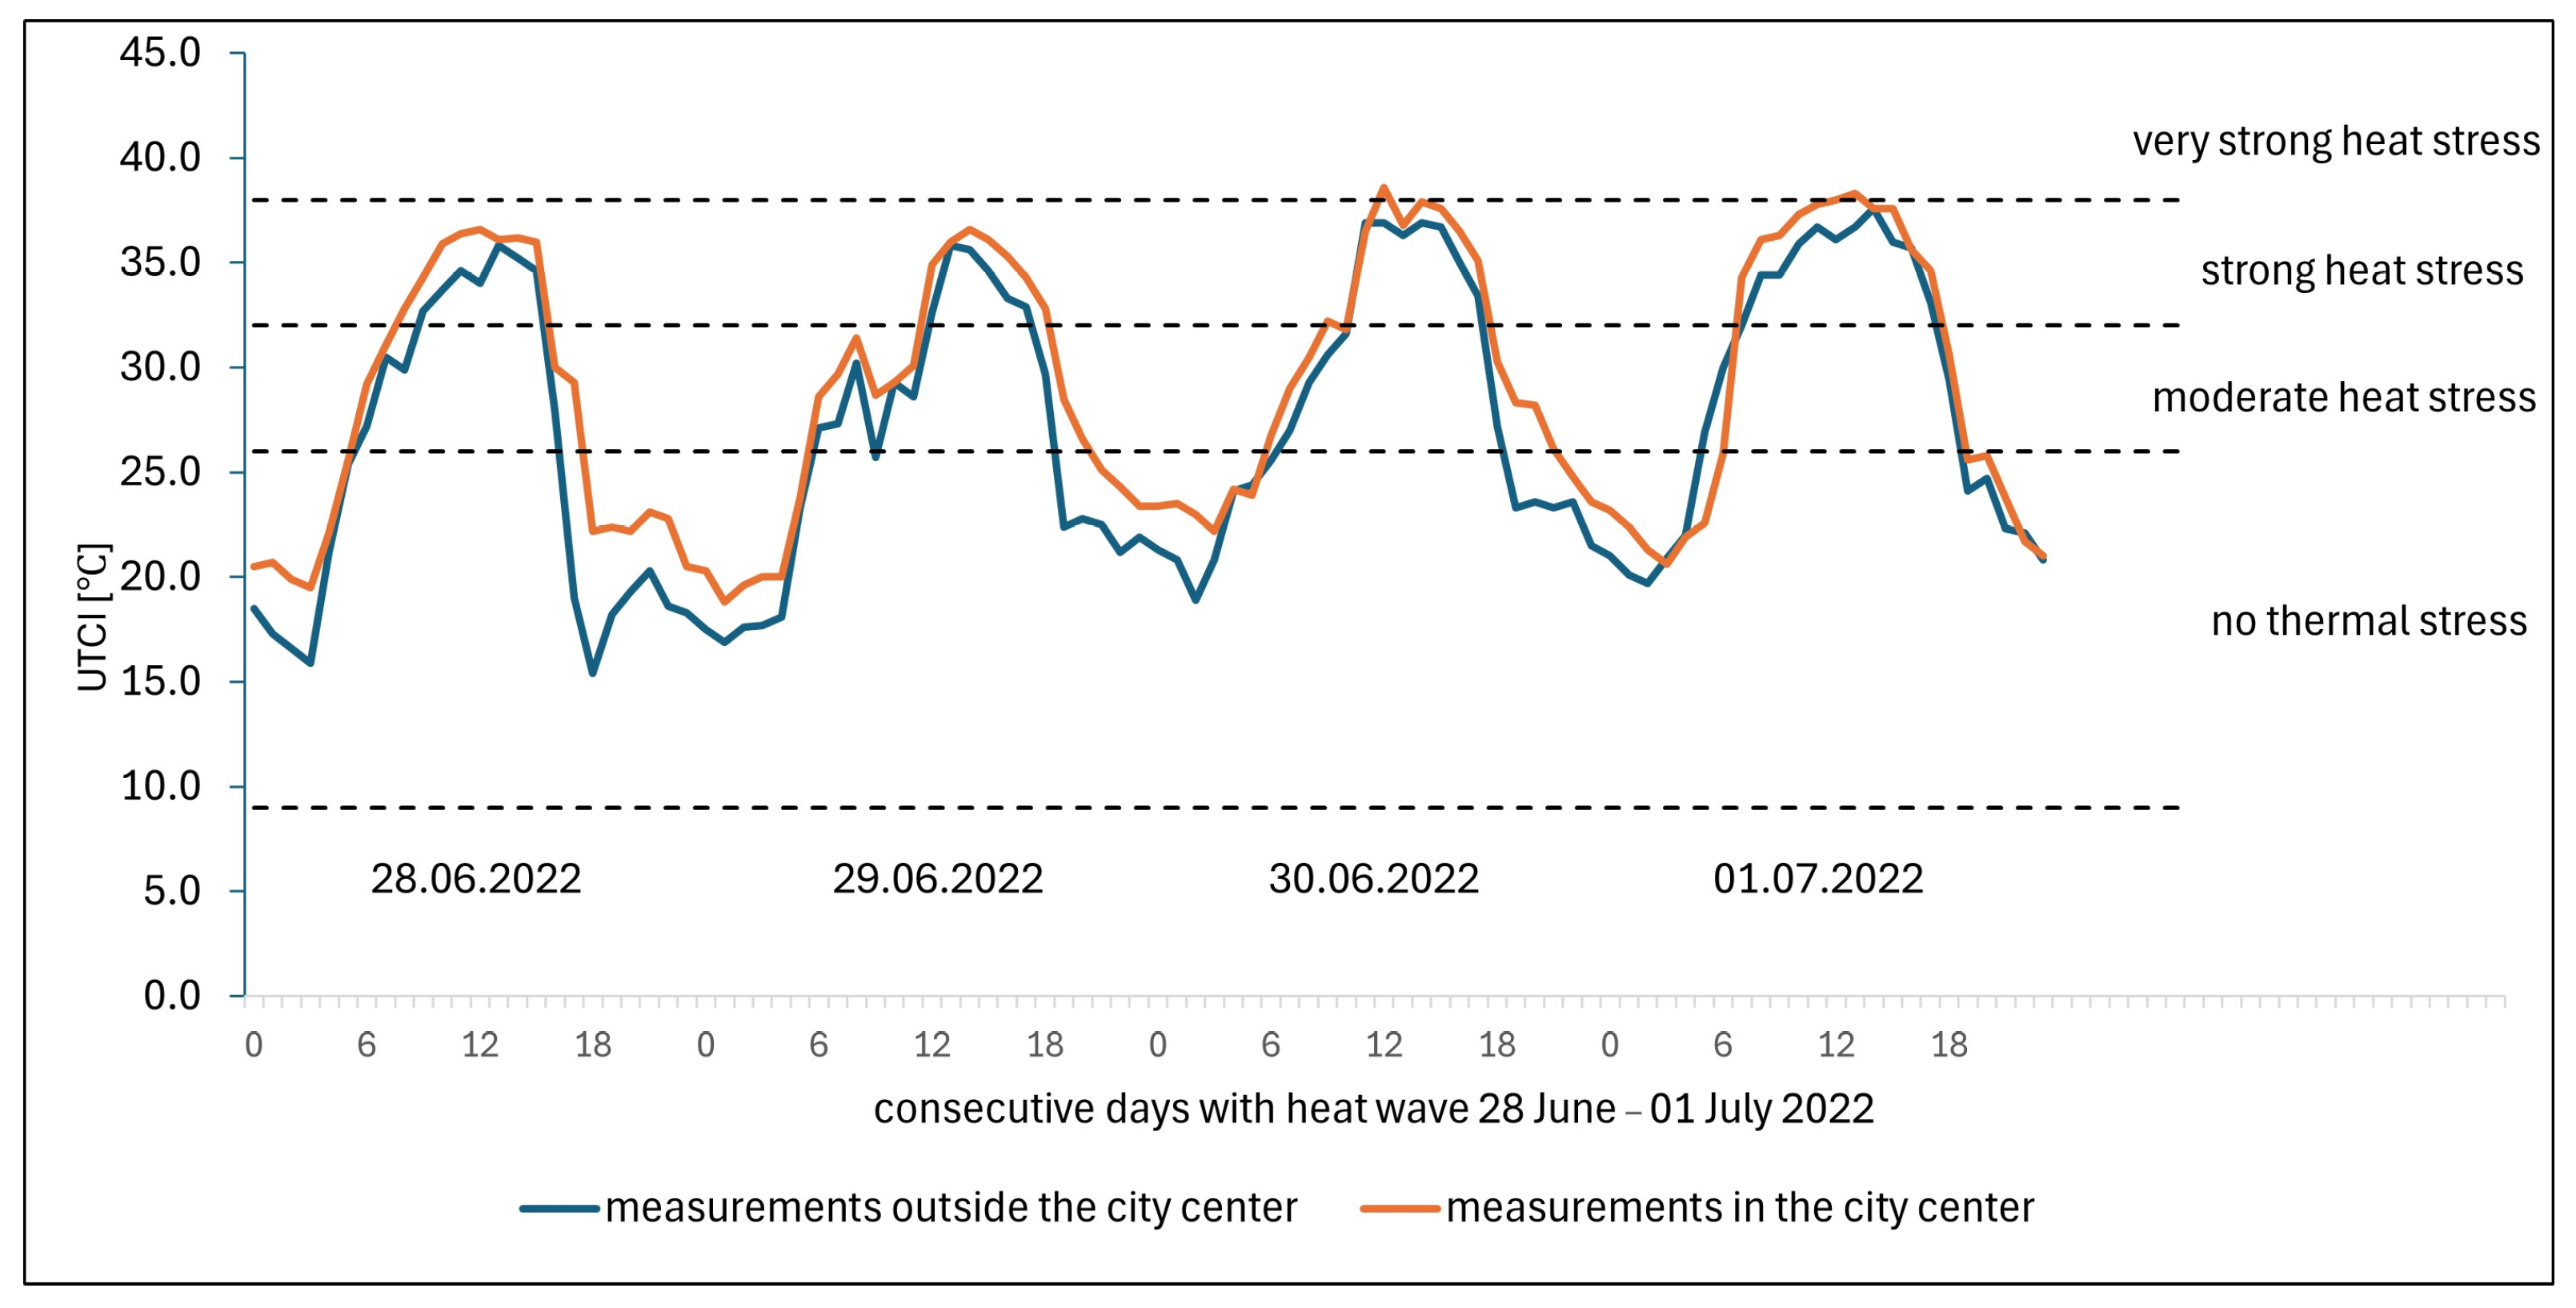
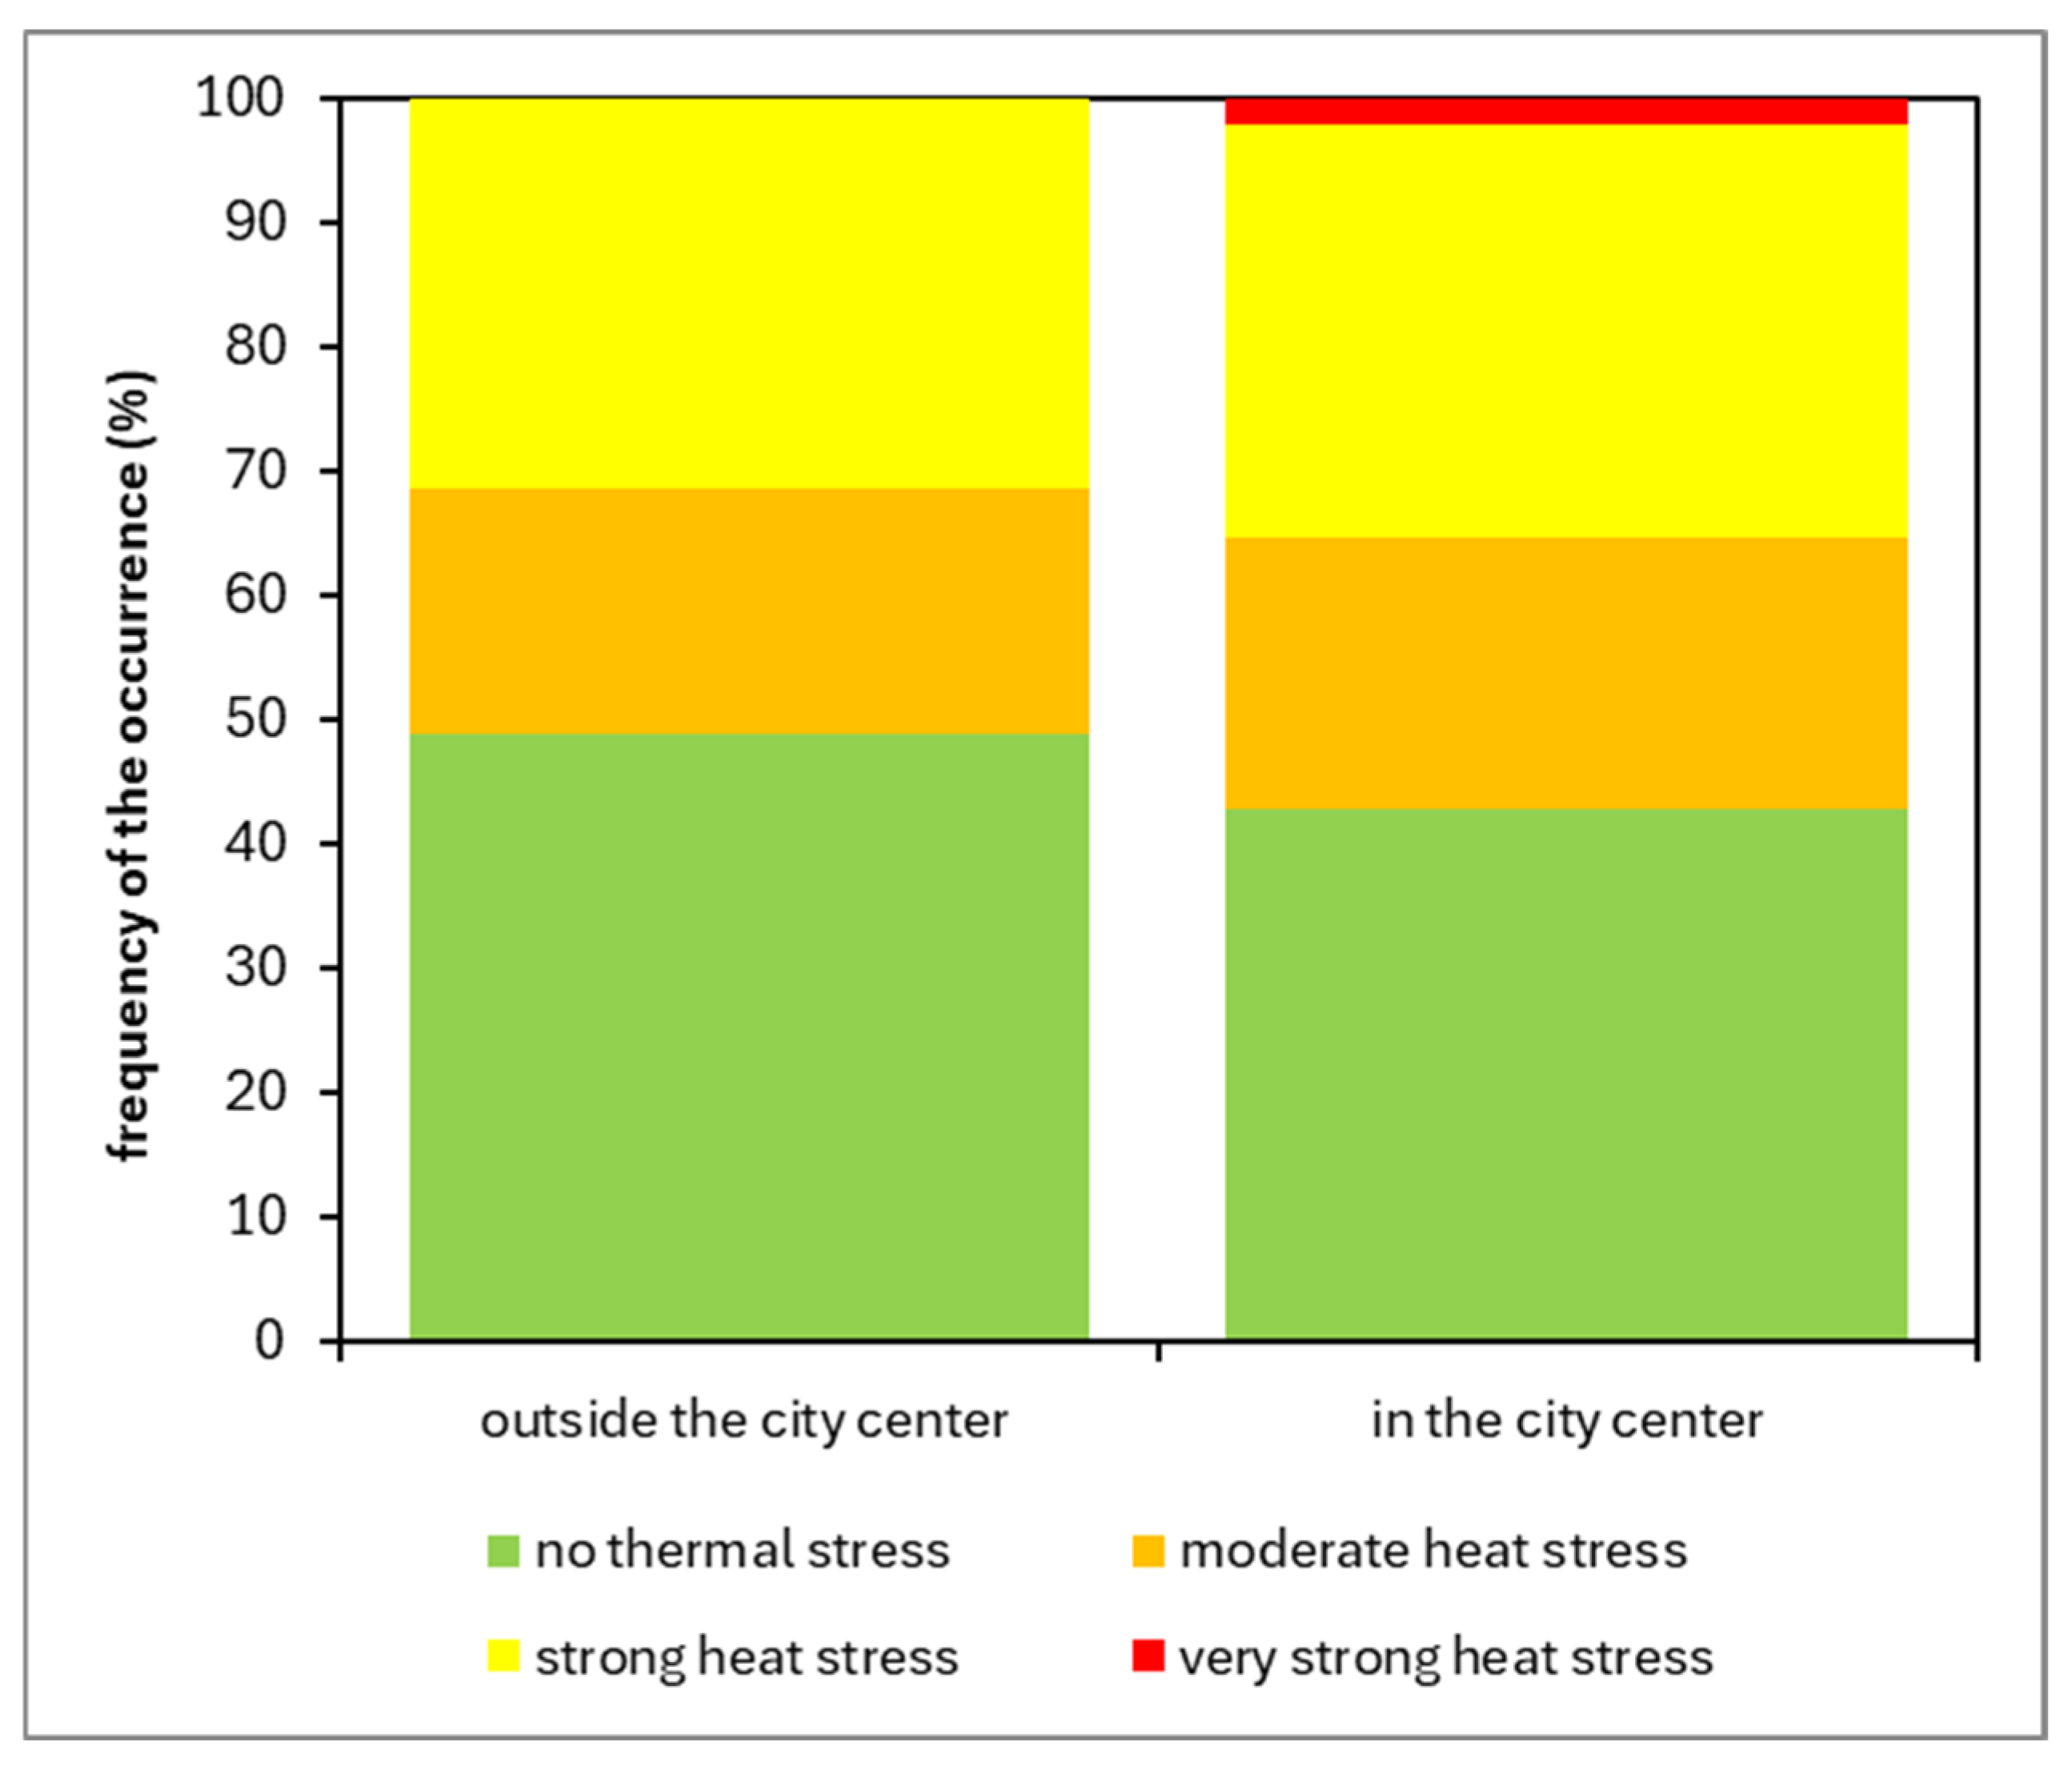
3.4. Biometeorological Conditions During Heatwaves in the City Center and Outside the City
During the heatwaves in Warszawa and Kraków, for most of their duration, the UTCI values were higher in the city center than outside the city. The distributions of UTCI differences are similar in both cities; however, in Kraków, positive differences occurred in over 86% of cases, compared to 73% in Warszawa (Figure 13 and Figure 14). The highest positive differences, exceeding 5 °C, occurred at noon (12:00 UTC). In Warszawa, the maximum difference reached 8 °C, while in Kraków, it was even higher—nearly 11 °C. In general, the index values indicated the same category of heat stress according to the UTCI assessment scale. However, in both cities, there were several instances in which “strong heat stress” conditions were recorded outside the city, while the conditions in the city center imposed an even greater strain on the human body.
Figure 13.
The distribution of differences in UTCI during heatwaves in the city center (Kraków-Obserwatorium) and outside it (Kraków-Balice) in Kraków, 2020–2024.
Figure 14.
The distribution of differences in UTCI during heatwaves in the city center (Warszawa-Filtry) and outside it (Warszawa-Okęcie) in Warszawa, 2020–2024.
Negative differences between the UTCI values in the city center and outside it occurred more frequently in Warszawa than in Kraków, particularly in the early morning. Cases in which UTCI values were higher outside the city at noon occurred rarely, and the differences did not exceed 1 °C. However, due to the lack of measurement data during nighttime hours at stations located in the city centers of Warszawa and Kraków, it was not possible to fully assess UTCI differences at that time of day. In contrast, in the center of Lublin, measurements were taken around the clock, which enabled a comparison of UTCI values in the city center and outside it even during the night. During the most intense heatwave according to the HWS in Lublin, which lasted from 28 June to 1 July 2022, biometeorological conditions followed a regular diurnal pattern (Figure 15). Neither the city nor its surroundings experienced cold stress. During the nighttime and early morning hours, conditions of “no thermal stress” prevailed, whereas during the day, the conditions imposed heat strain on the human body. Outside the city, this manifested as “moderate and strong heat stress”, while in the city center, it was identified as “moderate, strong, and very strong heat stress”. In the diurnal cycle, the largest differences in UTCI values between the city center and outside it were observed in the evening and nighttime hours. Between 16:00 and 21:00 UTC, the average difference was 3.1 °C, whereas in the early hours after sunrise (between 4:00 and 9:00 UTC), the difference was on average 0.9 °C, and between 10:00 and 15:00 UTC, it was 1.1 °C. This pattern of differences relates to the described behavior of the atmospheric urban heat island, indicating the possibility of urban overheating.
Figure 15.
The course of UTCI in the city center (Lublin-Plac Litewski) and outside the city (Lublin-Radawiec) during the heatwave (22 June–1 July 2022) in Lublin.
During the described heatwave, conditions of “no thermal stress” occurred most frequently, accounting for 49% of hours outside the city and 43% in the city (Figure 16). Both “moderate and strong heat stress” were about 2% more frequent in the city center than outside it. Furthermore, as mentioned above, conditions of “very strong heat stress” were recorded exclusively in the city center.
Figure 16.
Frequency of the occurrence (%) of various thermal stress categories according to UTCI during June/July 2022 heatwave in Lublin.
4. Discussion
The study compares the occurrence of heat stress during hot days and heatwaves in major Polish cities during the summer months over a five-year period from 2020 to 2024. Within Poland, these findings are consistent with national studies. A long-term variability analysis of the number of hot days in Poland [36] demonstrated a clear increasing trend. Before 1990, in Warszawa and Rzeszów, the annual number of hot days rarely exceeded 10; however, in the 21st century, this number has typically surpassed 15 and, in many cases, even 20. Since 2021, these two cities have experienced at least a dozen hot days each year, with 24 and 29 hot days recorded in 2024, respectively. A similar pattern was observed in other cities.
In the study by Wibig [29], a definition of heatwaves similar to the one adopted here was used. Over the 65-year period from 1951 to 2015, heatwaves were observed throughout Poland on average once every two years. For instance, 54 heatwaves were recorded in Poznań, compared with only two along the coast. In contrast, during the five-year period analyzed here, Poznań experienced 12 heatwaves, while Gdańsk, situated on the coast, registered four. In the present study, the duration of heatwaves varied, ranging from an average of 4 days in Gdańsk to 9 days in Rzeszów. However, over the longer 65-year period, heatwaves lasting between 6 and 9 days were observed in more than 5% of cases. In the analyzed five-year period, the longest heatwaves occurred in Wrocław and Rzeszów, lasting 23 and 21 days, respectively. This is comparable to the longest durations reported in previous studies (17 to 22 days). It was also reported that during the decade from 2009 to 2019, more than half of all extensive and long-lasting heatwaves in Poland since 1950 occurred [35]. A post-1980 surge in hot days—attributed to atmospheric blocking and synoptic-scale anomalies—was also documented. Moreover, Tomczyk and Bednorz [37] identified central/Western and Southern Poland as thermal stress hotspots, a pattern clearly observed in the case studies presented here. Notably, most of the heatwaves in the current five-year period had a considerable spatial extent, affecting more than half of all cities.
During 1951–2015, the most frequent events were those with an HWS of up to 5 °C [28]. In contrast, during the recent five-year period, the most severe heatwaves exhibited HWS values ranging from 9.4 to 21 °C, except along the coast, where the index only reached 6 °C. These intensities were lower than some of the extreme values previously reported, which ranged from 25 to as high as 55 °C [29].
The highest UTCI values recorded during the analyzed five-year period were generally lower than those observed over the longer period from 1951 to 2018 [38]. However, the spatial variability remained similar, with the greatest maximum UTCI values appearing in cities located in Western Poland and in Kraków. Long-term studies [39] have shown that in cities in eastern and south-eastern cities are more susceptible to an increase in the number of heat stress days. In this study, the variability of each meteorological variable that shapes weather conditions affecting the human body was not analyzed. However, the UTCI values recorded during high-air-temperature events indicate the occurrence of strong or very strong heat stress, as well as elevated heart rates, in all cities. This confirms that air temperature is the primary factor influencing the thermal load on the human body. Regional variations in thermal conditions—driven primarily by atmospheric circulation and differences in the influx of radiant energy—result in distinct biometeorological conditions among cities in different locations. Additionally, regional differences in wind speed distribution and proximity to the sea further modify these conditions, as observed in the coastal city of Gdańsk.
The results obtained here, which indicate UTCI values above 40 °C during the 2022 events, are in line with broader bioclimatological changes. Between 1951 and 2018, rising UTCI values in Poland have resulted in an increase of between one and over two heat-stress days per decade [38]. Similar trends in the frequency of days with strong and very strong heat stress over the period 1966–2015 were documented by [14]. Other projections, for example, those for the Eastern Mediterranean, suggest that heatwaves will become seven times more frequent and three times longer by the end of the century [40]. Similarly, in Italy, thermal stress associated with high air humidity, independent of conventional heatwave definitions, is becoming more prevalent [41], which is expected to result in a significant intensification of heat strain.
Furthermore, comparisons between biometeorological conditions in city centers and their outskirts reveal significant differences. For example, although both the center of Lublin and its outskirts generally fall within the “no thermal stress” category, the city center experienced more frequent and intense heat stress episodes. This is likely due to urban heat island (UHI) effects and local vegetation, as Lublin’s central meteorological station is situated in a green city square that slightly mitigates heat extremes. Instances of mitigated heat stress in the city center may have occurred due to the influence of humidity conditions fostered by the presence of green areas and an enhanced local circulation around the measurement point. These findings support the recommendations to monitor urban greenery and increase the proportion of green spaces within the built environment. These observations reflect patterns reported for the period of 1976–2015 [42] and confirm earlier findings [42,43] that demonstrated that urban morphology and land cover strongly influence heat stress in Warszawa. A similar diurnal pattern of UTCI was observed in comparative studies between the center of Warszawa and suburban areas with low-density development [44], with the city center exhibiting average UTCI values about 4 °C higher and “very strong heat stress” only occurring there. These findings confirm that urban heat islands in summer are clearly a negative phenomenon, as they amplify thermal discomfort. International studies, such as those by Fröhlich and Matzarakis [45], further support this by illustrating how building layout, surface materials, and vegetation determine heat accumulation—highlighted by high-resolution urban modeling using the PALM model to identify thermal hotspots.
The occurrence of very strong heat stress and elevated heart rates during heat events adds essential biological context to the findings. Studies by Bröde et al. [31] and Błażejczyk et al. [5] validate the use of biometeorological indices, such as the UTCI, for predicting human thermal strain. In Poland, Kuchcik [39] demonstrated that UTCI values above 38 °C are associated with a 25–30% increase in relative mortality, while Tomczyk and Bednorz [37] linked prolonged exposure to extreme UTCI conditions with spikes in morbidity and mortality. On an international scale, Wedler et al. [40] estimated that under RCP8.5 scenarios, more than 330 heat-related deaths per summer could occur in Israel by 2100, particularly among elderly populations. These results confirm that heat-related physiological stress is an escalating public health challenge.
5. Conclusions
The following conclusions can be highlighted as the most important outcomes of this study:
- Between 2020 and 2024, all analyzed Polish cities experienced a rising frequency and intensity of heat stress, particularly during prolonged heatwaves. This trend reflects global patterns of increasing thermal stress;
- Spatial heterogeneity in UTCI values and associated heart rate responses across Polish cities highlights regional differences in bioclimatic vulnerability. The most unfavorable biometeorological conditions, characterized by the frequent occurrence of strong and very strong heat stress, were observed in Southern Poland;
- Several specific thermal stress patterns related to city locations have been identified:
- –
- Residents and visitors in Wrocław may be particularly vulnerable to the severe effects of heat stress, as both daytime UTCI values and daily mean UTCI values were the highest among all analyzed cities during strong heatwaves;
- –
- The highest mean maximum UTCI values during hot days were recorded in Eastern Poland (Białystok and Lublin), influenced by the region’s strong thermal continentality;
- –
- The fewest hot days and heatwave events were observed in Gdańsk, with the lowest maximum UTCI values, due to the mitigating effects of its coastal environment;
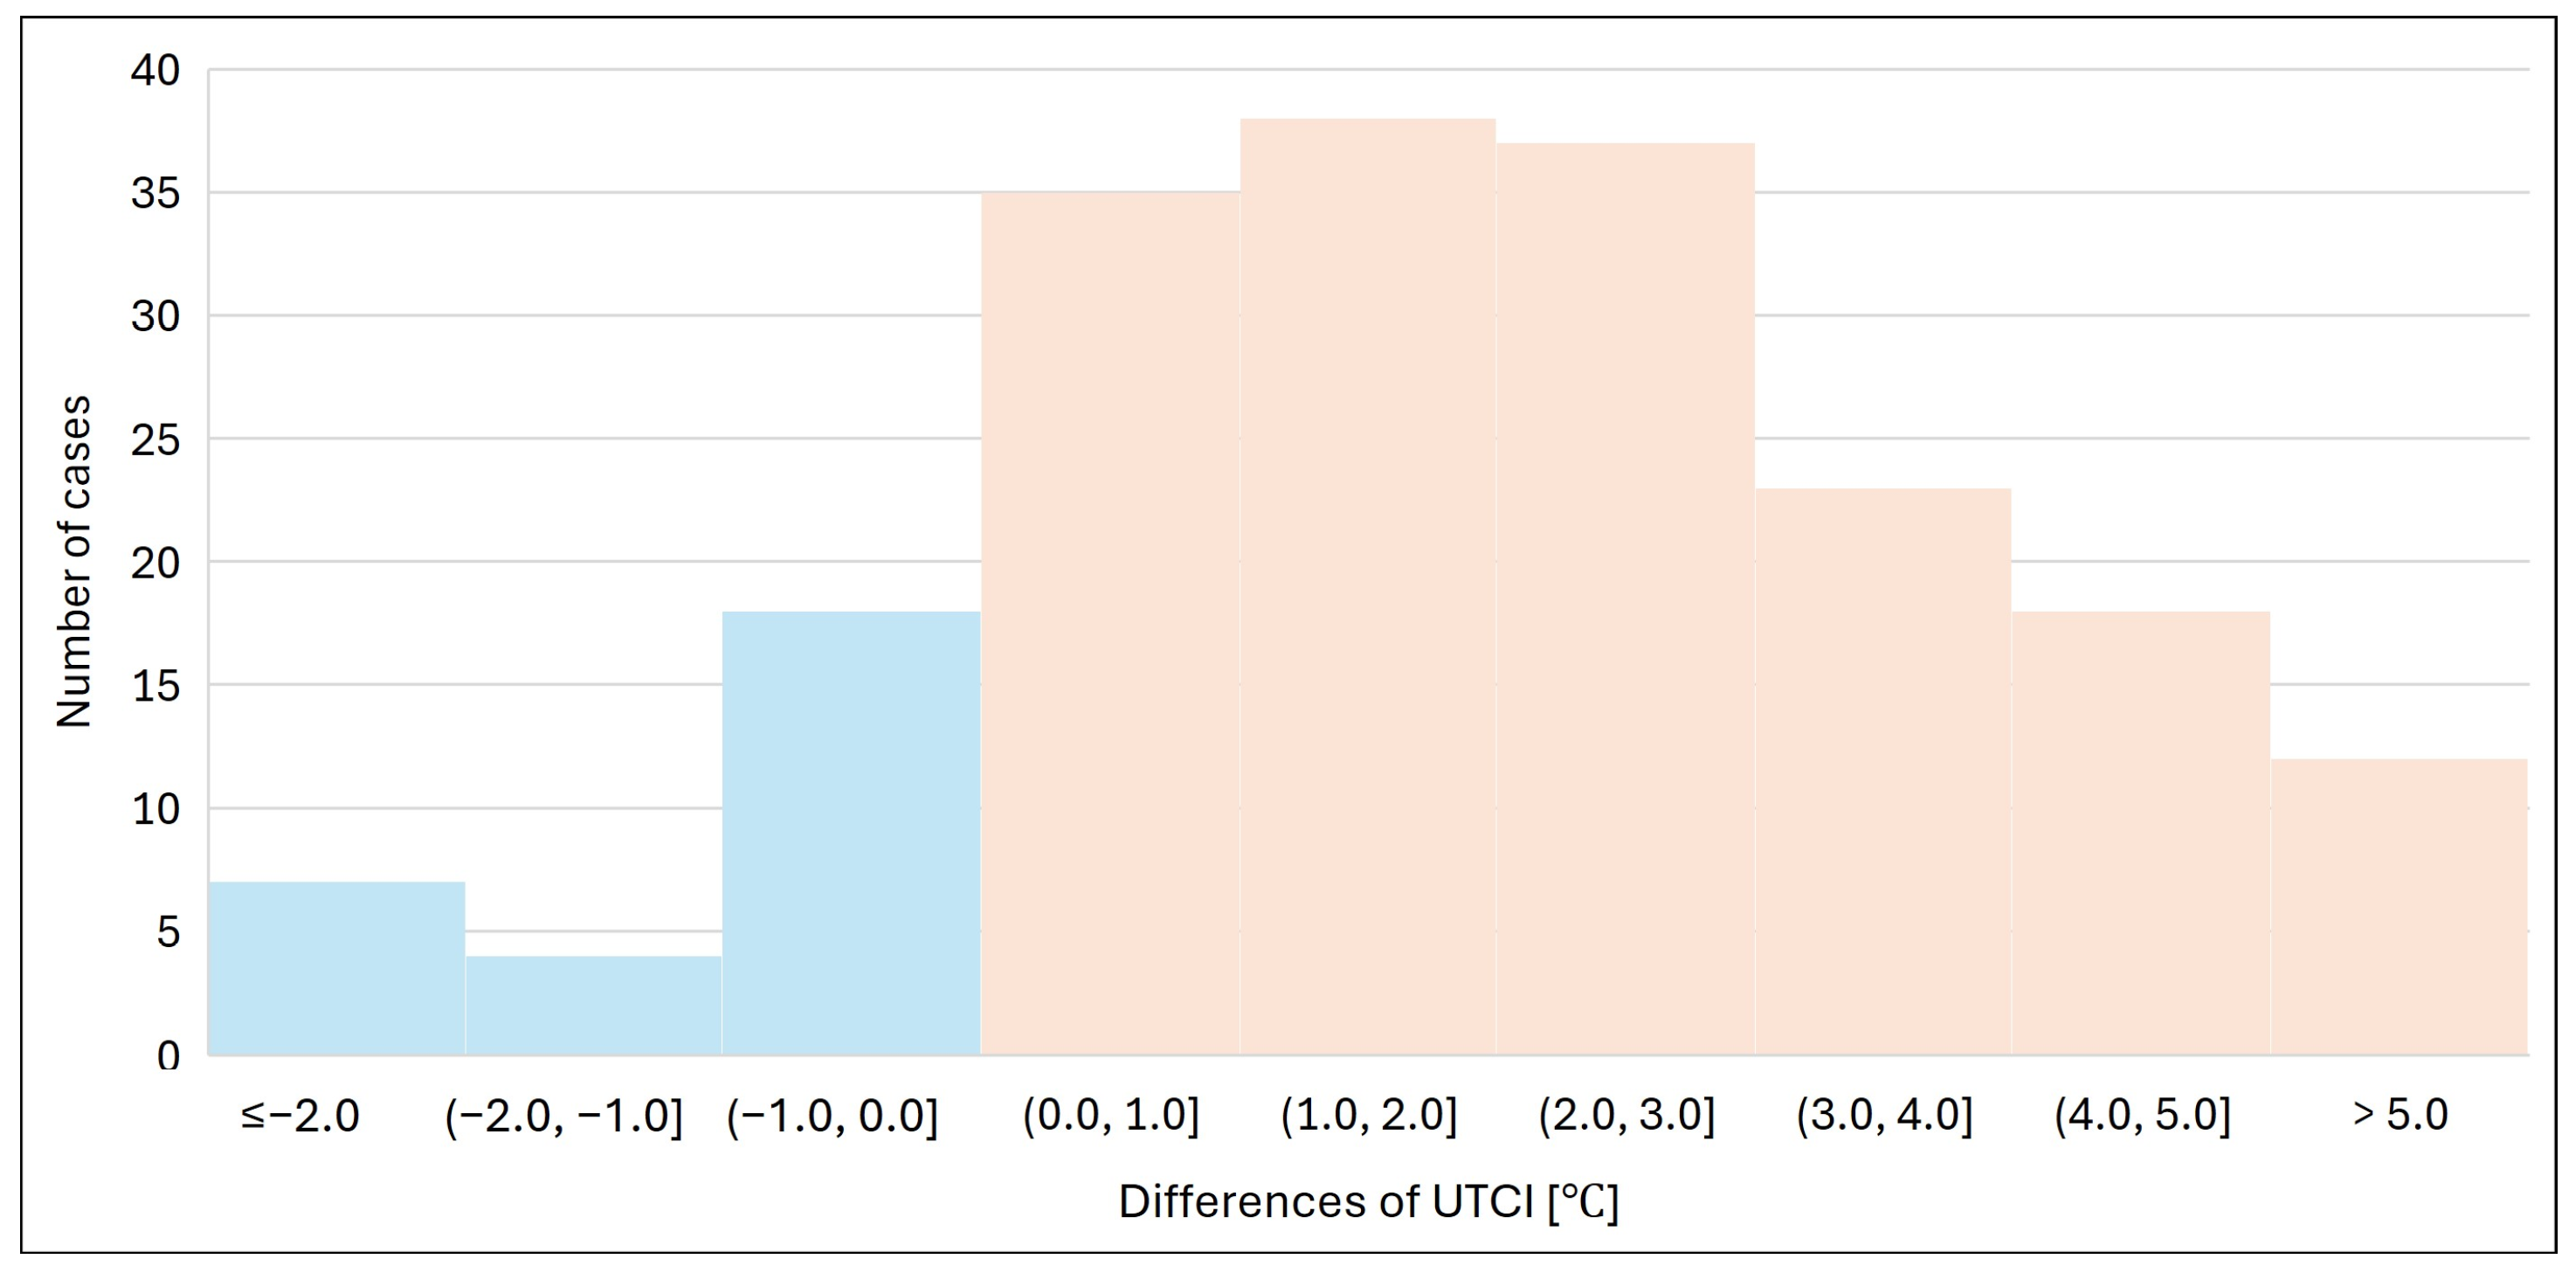
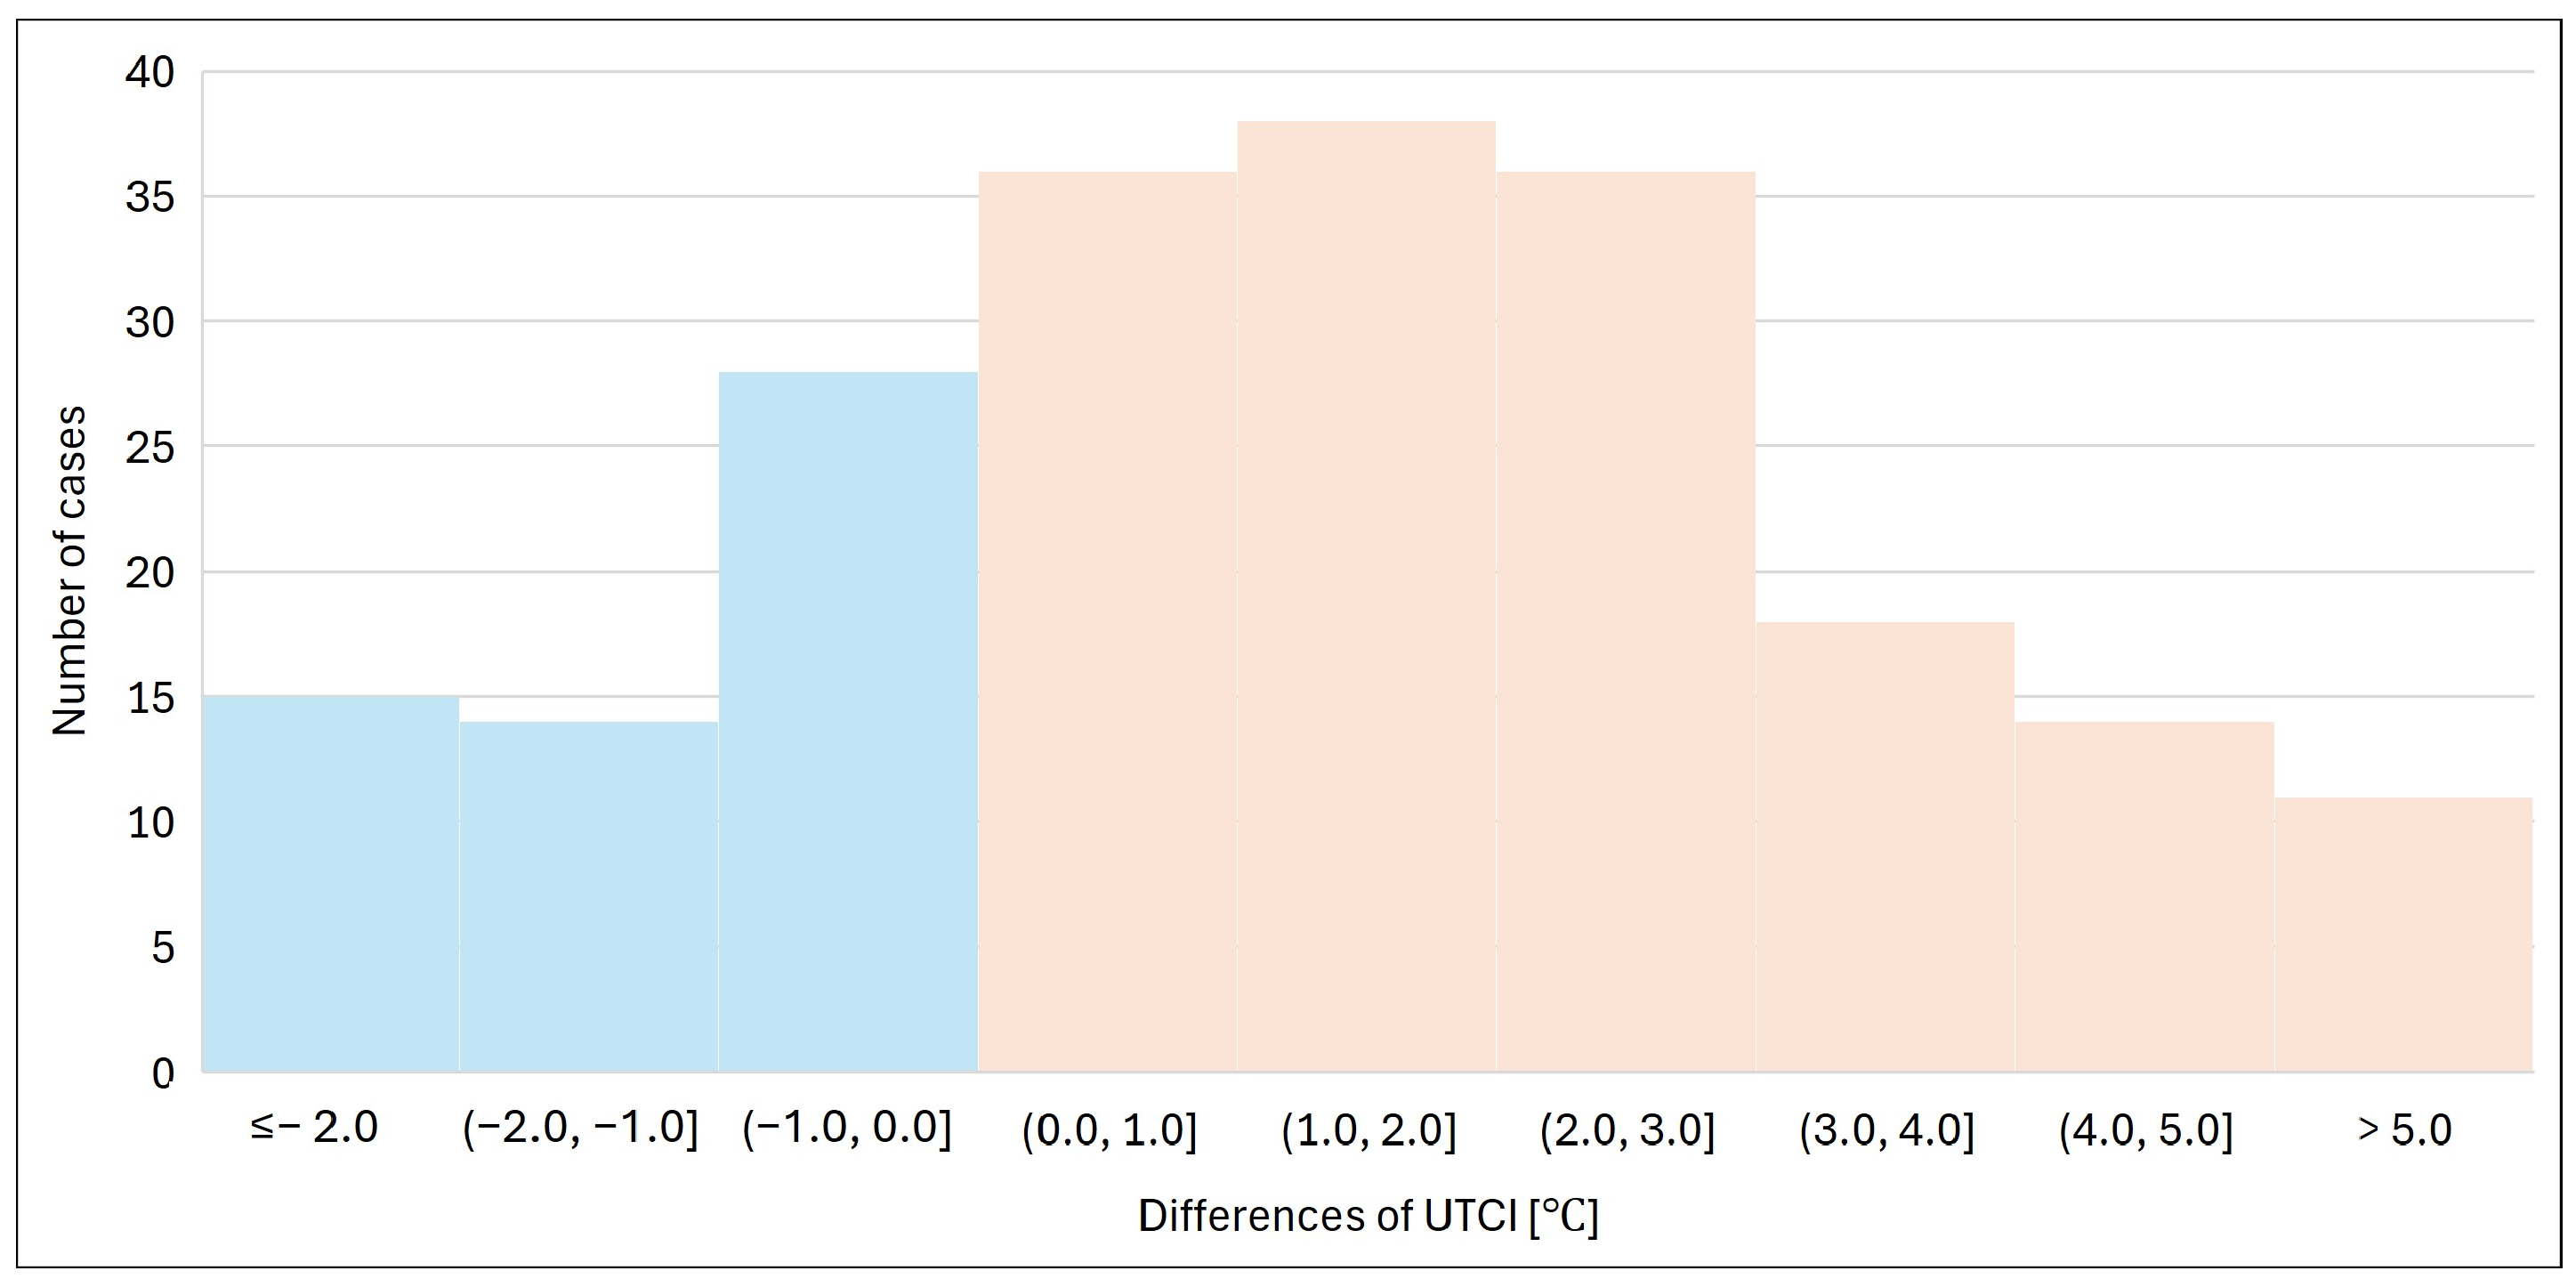
- Comparisons between biometeorological conditions in city centers and their outskirts reveal significant differences, with heat stress levels generally higher in city centers. For instance, in Lublin, very strong heat stress was recorded only in the city center. The distribution of UTCI differences between urban and suburban areas, along with their diurnal patterns, confirms the significant influence of the atmospheric urban heat island effect in Polish cities, which further amplifies heat stress on the human body;
- The persistent occurrence of conditions causing significant heat stress on the human body necessitates the integration of biometeorological assessments into urban planning. Such measures are essential for mitigating urban heat stress and enhancing cities’ resilience against climate change impacts;
- Continuous research on urban climate factors, such as air temperature, surface temperature, and biometeorological conditions, remains critical for understanding and addressing extreme heat effects;
- Future studies should incorporate biometeorological assessments, urban morphology, and socio-economic vulnerabilities to develop targeted adaptation strategies. Special attention should be given to green spaces within the urban built-up environment.
Author Contributions
Conceptualization. M.O. and A.K.; methodology. M.O.; software. M.O. and A.K.; validation. M.O. and A.K.; formal analysis. M.O.; investigation. M.O. and A.K.; resources M.O. and A.K.; data curation M.O. and A.K.; writing—original draft preparation M.O. and A.K.; writing—review and editing M.O. and A.K.; visualization A.K.; supervision. M.O. All authors have read and agreed to the published version of the manuscript.
Funding
This research received no external funding.
Institutional Review Board Statement
Not applicable.
Informed Consent Statement
Not applicable.
Data Availability Statement
The data from station Lublin Plac Litewski used in this paper come from the Meteorological Data Base of the Department of Hydrology and Climatology of the University of Maria Curie Skłodowska in Lublin and are not publicly available.
Acknowledgments
The authors would like to thank Sebastian Wypych for sharing photos of the Kraków-Obserwatorium meteorological station in Kraków.
Conflicts of Interest
The authors declare no conflicts of interest.
References
- Błażejczyk, K.; Twardosz, R.; Wałach, P.; Czarnecka, K.; Błażejczyk, A. Heat Strain and Mortality Effects of Prolonged Central European Heat Wave—An Example of June 2019 in Poland. Int. J. Biometeorol. 2022, 66, 149–161. [Google Scholar] [CrossRef] [PubMed]
- Fiala, D.; Havenith, G.; Bröde, P.; Kampmann, B.; Jendritzky, G. UTCI-Fiala Multi-Node Model of Human Heat Transfer and Temperature Regulation. Int. J. Biometeorol. 2012, 56, 429–441. [Google Scholar] [CrossRef] [PubMed]
- Psikuta, A.; Fiala, D.; Laschewski, G.; Jendritzky, G.; Richards, M.; Błażejczyk, K.; Mekjavič, I.; Rintamäki, H.; de Dear, R.; Havenith, G. Validation of the Fiala Multi-Node Thermophysiological Model for UTCI Application. Int. J. Biometeorol. 2012, 56, 443–460. [Google Scholar] [CrossRef] [PubMed]
- Jendritzky, G.; de Dear, R.; Havenith, G. UTCI-Why Another Thermal Index? Int. J. Biometeorol. 2012, 56, 421–428. [Google Scholar] [CrossRef]
- Błażejczyk, K.; Broede, P.; Fiala, D.; Havenith, G.; Ingvar, H.; Jendritzky, G.; Kampmann, B.; Kunert, A. Principles of the New Universal Thermal Climate Index (Utci) and Its Application. Misc. Geogr. 2010, 14, 91–102. [Google Scholar] [CrossRef]
- Di Napoli, C.; Pappenberger, F.; Cloke, H.L. Assessing Heat-Related Health Risk in Europe via the Universal Thermal Climate Index (UTCI). Int. J. Biometeorol. 2018, 62, 1155–1165. [Google Scholar] [CrossRef]
- Krüger, E.L.; Di Napoli, C. Feasibility of Climate Reanalysis Data as a Proxy for Onsite Weather Measurements in Outdoor Thermal Comfort Surveys. Theor. Appl. Climatol. 2022, 149, 1645–1658. [Google Scholar] [CrossRef]
- Kuchcik, M. Defining Heat Waves—Different Approaches. Geogr. Pol. 2006, 79, 47–63. [Google Scholar]
- Kuchcik, M. Heat Waves in Poland over the Period 1993–2002. Przegląd Geogr. 2006, 78, 397–412. (In Polish) [Google Scholar]
- Krzyżewska, A.; Dyer, J.; Krzyzewska, A.; Dyer, J.; Krzyżewska, A.; Dyer, J. The August 2015 Mega-Heatwave in Poland in the Context of Past Events. Weather 2018, 73, 207–214. [Google Scholar] [CrossRef]
- Krzyżewska, A.; Wereski, S.; Dobek, M. Summer UTCI Variability in Poland in the Twenty-First Century. Int. J. Biometeorol. 2021, 65, 1497–1513. [Google Scholar] [CrossRef] [PubMed]
- Wibig, J.; Podstawczyńska, A.; Rzepa, M.; Piotrowski, P. Heatwaves in Poland—Frequency, Trends and Relationships with Atmospheric Circulation. Geogr. Pol. 2009, 82, 47–59. [Google Scholar] [CrossRef]
- Tomczyk, A.M.; Bednorz, E.; Półrolniczak, M.; Kolendowicz, L. Strong Heat and Cold Waves in Poland in Relation with the Large-Scale Atmospheric Circulation. Theor. Appl. Climatol. 2019, 137, 1909–1923. [Google Scholar] [CrossRef]
- Tomczyk, A.M.; Owczarek, M. Occurrence of Strong and Very Strong Heat Stress in Poland and Its Circulation Conditions. Theor. Appl. Climatol. 2020, 139, 893–905. [Google Scholar] [CrossRef]
- Okoniewska, M. Specificity of Meteorological and Biometeorological Conditions in Central Europe in Centre of Urban Areas in June 2019 (Bydgoszcz, Poland). Atmosphere 2021, 12, 1002. [Google Scholar] [CrossRef]
- Rozbicka, K.; Rozbicki, T. Long-Term Variability of Bioclimatic Conditions and Tourism Potential for Warsaw Agglomeration (Poland). Int. J. Biometeorol. 2021, 65, 1485–1495. [Google Scholar] [CrossRef]
- Kuchcik, M.; Czarnecka, K.; Błażejczyk, K. Urban Heat Island in Warsaw (Poland): Current Development and Projections for 2050. Urban Clim. 2024, 55, 101901. [Google Scholar] [CrossRef]
- Półrolniczak, M.; Kolendowicz, L.; Majkowska, A.; Czernecki, B. The Influence of Atmospheric Circulation on the Intensity of Urban Heat Island and Urban Cold Island in Poznań, Poland. Theor. Appl. Climatol. 2017, 127, 611–625. [Google Scholar] [CrossRef]
- Kosmatka, J. Wpływ Miejskiej Wyspy Ciepła Na Parametry Temperatury. Zesz. Nauk. Politech. Poznańskiej 2023, 13, 79–100. [Google Scholar] [CrossRef]
- Bokwa, A.; Dobrovolný, P.; Gál, T.; Geletič, J.; Gulyás, Á.; Hajto, M.J.; Holec, J.; Hollósi, B.; Kielar, R.; Lehnert, M.; et al. Urban Climate in Central European Cities and Global Climate Change. Acta Climatol. Chorol. 2018, 51–52, 7–35. [Google Scholar] [CrossRef]
- Bobrowska-Korzeniowska, M.; Jerzyńska, J.; Paciorek, M.; Stelmach, W. Analysis of the Urban Heat Island in Łódź, Poland. Int. J. Occup. Med. Environ. Health 2024, 37, 581–590. [Google Scholar] [CrossRef] [PubMed]
- Sachindra, D.A.; Ullah, S.; Zaborski, P.; Nowosad, M.; Dobek, M. Temperature and Urban Heat Island Effect in Lublin City in Poland under Changing Climate. Theor. Appl. Climatol. 2023, 151, 667–690. [Google Scholar] [CrossRef]
- Santamouris, M.; Kolokotsa, D. On the Impact of Urban Overheating and Extreme Climatic Conditions on Housing, Energy, Comfort and Environmental Quality of Vulnerable Population in Europe. Energy Build. 2015, 98, 125–133. [Google Scholar] [CrossRef]
- Statistics Poland. Demographic Yearbook of Poland; Rozkrut, D., Ed.; Zakłady Wydawnictw Statystycznych: Warsaw, Poland, 2024. [Google Scholar]
- WMO. Manual on the WMO Integrated Global Observing System. Annex VIII to the WMO Technical Regulations; WMO: Geneva, Switzerland, 2024; Volume WMO-No. 11, ISBN 978-92-63-11160-9. [Google Scholar]
- IMGW Institute of Meteorology and Water Management. Available online: www.imgw.pl (accessed on 11 April 2025).
- Czernecki, B.; Glogowski, A.; Nowosad, J. Climate: An R Package to Access Free in-Situ Meteorological and Hydrological Datasets for Environmental Assessment. Sustainability 2020, 12, 394. [Google Scholar] [CrossRef]
- Crespi, A.; Terzi, S.; Cocuccioni, S.; Zebisch, M.; Julie, B.; Füssel, H.-M. Climate-Related Hazard Indices for Europe; ETC/CCA: Bologna, Italy, 2020. [Google Scholar]
- Wibig, J. Heat Waves in Poland in the Period 1951–2015: Trends, Patterns and Driving Factors. Meteorol. Hydrol. Water Manag. 2017, 6, 1–10. [Google Scholar] [CrossRef]
- Błażejczyk, K.; Błażejczyk, M. Bioklima. 2010. Available online: https://www.igipz.pan.pl/BioKlima.html (accessed on 1 April 2025).
- Bröde, P.; Fiala, D.; Blazejczyk, K.; Holmér, I.; Jendritzky, G.; Kampmann, B.; Tinz, B.; Havenith, G. Deriving the Operational Procedure for the Universal Thermal Climate Index (UTCI). Int. J. Biometeorol. 2012, 56, 481–494. [Google Scholar] [CrossRef]
- Błażejczyk, K.; Kunert, A. Bioclimatic Conditions of Recreation and Tourism in Poland; IGiPZ PAN: Warszawa, Poland, 2011. [Google Scholar]
- American Heart Association. All About Heart Rate. Available online: https://www.heart.org/en/health-topics/high-blood-pressure/the-facts-about-high-blood-pressure/all-about-heart-rate-pulse (accessed on 30 March 2025).
- IMGW-PIB. Climate of Poland 2020; IMGW-PIB: Warsaw, Poland, 2021. [Google Scholar]
- Wibig, J. Hot Days and Heat Waves in Poland in the Period 1951-2019 and the Circulation Factors Favoring the Most Extreme of Them. Atmosphere 2021, 12, 340. [Google Scholar] [CrossRef]
- Ustrnul, Z.; Wypych, A.; Czekierda, D. Air Temperature Change. In Climate Change in Poland: Past, Present, Future; Falarz, M., Ed.; Springer: Berlin/Heidelberg, Germany, 2021; pp. 275–330. [Google Scholar]
- Tomczyk, A.M.; Bednorz, E. Thermal Stress during Heat Waves and Cold Spells in Poland. Weather Clim. Extrem. 2023, 42, 100612. [Google Scholar] [CrossRef]
- Kuchcik, M.; Błażejczyk, K.; Halaś, A. Changes in Bioclimatic Indices. In Climate Change in Poland; Falarz, M., Ed.; Springer Climate: Cham, Switzerland, 2021; pp. 471–491. [Google Scholar]
- Kuchcik, M. Mortality and Thermal Environment (UTCI) in Poland—Long-Term, Multi-City Study. Int. J. Biometeorol. 2021, 65, 1529–1541. [Google Scholar] [CrossRef]
- Wedler, M.; Pinto, J.G.; Hochman, A. More Frequent, Persistent, and Deadly Heat Waves in the 21st Century over the Eastern Mediterranean. Sci. Total Environ. 2023, 870, 161883. [Google Scholar] [CrossRef]
- Falasca, S.; Di Bernardino, A.; Salata, F. On the Identification and Characterization of Outdoor Thermo-Hygrometric Stress Events. Urban Clim. 2023, 52, 101728. [Google Scholar] [CrossRef]
- Dobek, M.; Wereski, S.; Krzyżewska, A. Bioclimatic Conditions of Lublin Based on the Universal Thermal Climate Index (UTCI). Misc. Geogr. 2020, 24, 118–125. [Google Scholar] [CrossRef]
- Lindner-Cendrowska, K. Assessment of Bioclimatic Conditions in Cities for Tourism and Recreational Purposes (a Warsaw Case Study). Geogr. Pol. 2013, 86, 55–66. [Google Scholar] [CrossRef]
- Błażejczyk, K.; Kuchcik, M.; Milewski, P.; Dudek, W.; Kręcisz, B.; Błażejczyk, A.; Szmyd, J.; Degórska, B.; Pałczyński, C. Urban Heat Island in Warsaw: Climate and Urban Conditions; IGiPZ PAN, Ed.; SEDNO Academic Press: Warsaw, Poland, 2014; e-book; ISBN 978-83-7963-019-6. (In Polish) [Google Scholar]
- Fröhlich, D.; Matzarakis, A. Calculating Human Thermal Comfort and Thermal Stress in the PALM Model System 6.0. Geosci. Model Dev. 2020, 13, 3055–3065. [Google Scholar] [CrossRef]
Disclaimer/Publisher’s Note: The statements, opinions and data contained in all publications are solely those of the individual author(s) and contributor(s) and not of MDPI and/or the editor(s). MDPI and/or the editor(s) disclaim responsibility for any injury to people or property resulting from any ideas, methods, instructions or products referred to in the content. |
© 2025 by the authors. Licensee MDPI, Basel, Switzerland. This article is an open access article distributed under the terms and conditions of the Creative Commons Attribution (CC BY) license (https://creativecommons.org/licenses/by/4.0/).