Article

Increased Frequency of Central Pacific El Niño Events Since 2000 Caused by Frequent Anomalous Warm Zonal Advection

Marine Science and Technology College, Zhejiang Ocean University, Zhoushan 316022, China
*
Author to whom correspondence should be addressed.
Atmosphere 2025, 16(6), 654; https://doi.org/10.3390/atmos16060654
Submission received: 2 April 2025 / Revised: 20 May 2025 / Accepted: 27 May 2025 / Published: 28 May 2025

Abstract

:
Although intensive studies have documented the recent increase in the frequency of the Central Pacific (CP) El Niño events, the underlying mechanism remains unclear. This motivates us to investigate the change in the frequency of CP El Niño events. By analyzing the occurrence of the CP El Niño events between 1960 and 2022, we confirm a statistically significant increase in the frequency of CP El Niño events since 2000. Over the 40 years between 1960 and 1999, eight CP El Niño events appeared. In contrast, over the 23 years between 2000 and 2022, six CP El Niño events are seen. The significant period of the CP El Niño shortens from 4–5 years to 2–3 years. The increased frequency of CP El Niño events is closely related to more frequent warm sea surface temperature (SST) anomalies in the central equatorial Pacific (5° S–5° N, 170° W–122° W) during the CP El Niño developing phase (June to October). A heat budget analysis of the mixed layer reveals that the SST variability in the central equatorial Pacific during the developing phase is determined by zonal temperature advection. The frequent anomalous warm zonal advection drives more frequent warm SST anomalies, and finally, the increased frequency of CP El Niño events, as observed.

1. Introduction

El Niño–Southern Oscillation (ENSO) is the most significant interannual climate variability on the global scale [1]. As first pointed out by Bjerknes in 1969 [2], the ENSO is an air–sea coupled climate mode. Specifically, El Niño describes the oceanic side of the coupled mode [3,4,5,6], while the Southern Oscillation depicts the atmospheric side [7]. Historically, an El Niño event is identified according to the warm sea surface temperature (SST) anomalies in the Niño3 region (5° S–5° N and 150° W–90° W), which is located in the eastern equatorial Pacific [8]. This type of El Niño is now often called the Eastern Pacific (EP) El Niño [9]. The occurrence of traditional EP El Niño events strongly influences the global climate via the atmospheric bridge [10]. For example, the strong 1997/1998 EP El Niño event caused massive floods in the Yangtze River Basin in China during the 1998 summer [11]. Meanwhile, this El Niño event brought severe storms to the southern United States and California, unusually warm and dry conditions to the northern United States, resulting in USD 4 billion in losses [12].
Since 1990, intensive studies have documented another type of El Niño, characterized by the largest warm SST anomalies confined primarily to the central equatorial Pacific instead of the eastern equatorial Pacific [13,14,15,16]. As the warm SST anomalies appear mainly in the central equatorial Pacific near the International Date Line and close to the warm pool, this emerging type is known as Central Pacific (CP) El Niño [16,17], Dateline El Niño [18], warm-pool El Niño [6], or El Niño Modoki [15]. This study refers to it as the CP El Niño, as the counterpart of the EP El Niño. The remarkable warming over the central equatorial Pacific during the CP El Niño makes its influence on weather and climate quite different from the EP El Niño [5]. For example, during the late autumn to winter of EP and CP El Niño events, South China experiences increased precipitation. However, the positive precipitation anomalies during the EP and CP El Niño events differ in intensity and spatial pattern. The positive precipitation anomalies during the CP El Niño event are weaker and located further west, mainly in the inland region of South China, compared with the EP El Niño event [19]. The CP El Niño has a stronger influence on winter temperatures in the northwestern and southeastern United States, while the EP type mainly affects the Great Lakes, Northeast, and Southwest regions [20].
The two different types of El Niño, especially the CP type, have attracted much attention. Although some continue debating whether the CP El Niño constitutes a fundamentally distinct phenomenon or shares dynamical origins with EP El Niño while exhibiting different manifestations, intensive studies contrasted the mechanisms and variabilities of the EP and CP El Niño events. The mechanism for generating the EP El Niño events has been well-established [21,22,23,24]. Four conceptual models of ENSOs have been developed, including the delayed oscillator [21,25], the recharge oscillator [22,26], the western Pacific oscillator [23,27], and the advective–reflective oscillator [24]. However, the mechanisms for the CP El Niño events remain unclear. Four main hypotheses have been put forward. The first hypothesis attributes CP El Niño occurrence to the weakening of equatorial easterly winds. Ashok et al. (2007) [15] demonstrated that, after 1979, reductions in equatorial easterlies decreased zonal SST gradients, subsequently flattening the thermocline and creating favorable conditions for CP El Niño emergence. The second hypothesis associates CP El Niño occurrence with global warming. Yeh et al. [28] demonstrated that human-induced warming weakens the Walker circulation and trade winds, leading to a shoaling and flattening of the equatorial Pacific thermocline, enhancing positive feedbacks in the central Pacific and promoting localized warming anomalies. The third hypothesis links CP El Niño occurrence to the mean-state SST patterns. Xiang et al. [29] identified a La Niña-like SST pattern emerging in the tropical Pacific around 2000, which suppressed local convective activity and shifted westerly anomalies westward, effectively inhibiting the eastward propagation of SST anomalies. The fourth hypothesis emphasizes subtropical precursors in CP El Niño occurrence. Yu et al. [30] observed that, before the occurrence of a CP El Niño event, warm SST anomalies initially form in the extratropical northeastern Pacific through the seasonal footprinting mechanism [31,32,33]. These warm SST anomalies then extend equatorward to the central equatorial Pacific to drive the CP El Niño event.
Changes in the frequency of the CP and EP El Niño events are also a focus [34,35]. Recent research suggests that both CP and EP El Niño events will occur much more frequently under the projected global warming scenarios in the future [28,36,37]. Specifically, weakened trade winds under global warming would flatten the equatorial Pacific thermocline while shoaling the central Pacific thermocline at the beginning of CP El Niño [28]. However, this hypothesis struggles to account for observed trends over the past 30 years [1]. In addition, since the late 20th century, the CP El Niño events have become more frequent and intense, while EP El Niño events have declined and become stronger [14,38]. It is worth mentioning that, though the global mean surface temperature plateaued since the 1990s for about a decade [39], the CP El Niño events became more frequent and intense [14,28,29,40,41]. In particular, Lee and McPhaden [40] observed a doubling in the intensity of CP El Niño events from 1982 to 2010 based on observational data, arguing that Central Pacific thermocline shoaling could not explain the amplified strength of the CP El Niño events.
As mentioned above, many studies have noted the recent increase in the frequency of CP El Niño events [14,28,36,38]; however, the underlying mechanism is still unclear. It motivates us to focus on the increased frequency of the CP El Niño events in recent decades and figure out the mechanism. Based on the Pettitt test, we confirm a significant increase in the frequency of CP El Niño events since 2000. Between 1960 and 1999, eight CP El Niño events were recorded over a 40-year period, whereas six events were observed during the shorter 23-year span from 2000 to 2022. To explore the drivers of this increased frequency, we conduct a heat budget analysis of the upper 70 m layer in the central equatorial Pacific using ECCO2 model outputs. Our results highlight that more frequent anomalous warm zonal advection over the central equatorial Pacific contributes to more frequent warm SST (mixed layer temperature) anomalies, leading to the observed increased frequency of the CP El Niño events since 2000. This paper is organized as follows: Section 2 offers the data and methods; Section 3 confirms the significantly increased frequency of CP El Niño events since 2000; Section 4 investigates the mechanisms driving the increases in the frequency of CP El Niño events. This study culminates in Section 5 and Section 6, synthesizing key conclusions and providing an interpretive analysis of the results.

2. Data and Methods

2.1. Data

El Niño events are identified according to the Ocean Niño Index (ONI) [42]. The ONI is downloaded from https://origin.cpc.ncep.noaa.gov/products/analysis_monitoring/ensostuff/ONI_v5.php (accessed on 15 June 2024).
Merged EP and CP indices are used to identify the EP and CP El Niño events. The Merged EP and CP indices are created using four widely used ENSO indices. The four ENSO indices are as follows: (1) the CP and EP indices by Yu and Kao [16], which were downloaded from https://www.ess.uci.edu/~yu/2OSC/ (accessed on 11 May 2024); (2) the C and E indices by Takahashi et al. [43]; (3) the Niño4 and Niño3 indices proposed by Yeh et al. [28]; and (4) the warm pool and cold tongue Niño indices (NWP and NCT) by Ren and Jin [44]. Here, we calculated the C and E indices, the Niño4 and Niño3 indices, and the NWP and NCT indices using ERSST V5 data [45] according to the corresponding methods. The ERSST V5 data were exclusively used to compute these indices and downloaded from https://www.psl.noaa.gov/data/gridded/data.noaa.ersst.v5.html (accessed on 4 June 2024).
The Hadley Centre Sea Ice and Sea Surface Temperature (HadISST) dataset is used to analyze the tropical Pacific SST. The HadISST is a global monthly SST and sea ice analysis developed by the Met Office Hadley Centre [46]. It has a spatial resolution of 1° × 1° and spans from 1870 to the present. The data were downloaded from https://www.metoffice.gov.uk/hadobs/hadisst/index.html (accessed on 10 November 2024).
The Estimating the Circulation and Climate of the Ocean, Phase II (ECCO2) Cube92 model output is employed to perform a heat budget analysis in the central Equatorial Pacific. The ECCO2 is a model simulation performed based on an eddy-permitting configuration of the Massachusetts Institute of Technology general circulation model [47]. The ECCO2 estimates fit the observations using a Green’s Function approach. The simulation is dynamically and kinematically consistent, with a mean horizontal resolution of 18 km and 50 depth levels to 5906 m. The ECCO2 output provides the required variables that are necessary for the heat budget analysis, including the vertical current velocity. The interpolated ECCO2 output, averaged every 3 days on a 0.25° × 0.25° horizontal grid between 1993 and 2022, was downloaded from https://apdrc.soest.hawaii.edu/datadoc/ecco2_cube92.php (accessed on 11 May 2024).
Surface 10 m wind from the NCEP/NCAR Reanalysis I [48] is also used. The reanalysis product provides global monthly surface wind on a 2.5° × 2.5° horizontal grid since 1960. The wind data were downloaded from https://psl.noaa.gov/data/gridded/data.ncep.reanalysis.html (accessed on 17 January 2024).

2.2. Methods

2.2.1. Identification of CP and EP El Niño Events

El Niño events are identified according to the ONI criterion proposed by the National Oceanic and Atmospheric Administration (NOAA). An event is classified as the El Niño event when the ONI reaches or surpasses +0.5 °C for at least five consecutive overlapping three-month periods.
We applied the Merged EP/CP-index method, proposed by Jia and Guo (2025) [19], to determine all the EP and CP El Niño events from the identified El Niño events. This approach first standardizes the CP index, the C index, the Niño4 index, and the NWP index, respectively. Then, the Merged CP index is derived as the arithmetic mean of these four standardized indices. The same procedure was used to obtain the Merged index (the time series of Merged CP and EP indices are shown in Figure S1a,b). The spatial patterns of SST anomalies regressed on the Merged EP and CP indices (Figure S1c,d) are consistent with previous studies [15,49].
Based on the Merged EP/CP-index, an El Niño event is classified as CP (EP) if the average Merged CP index value for December, January, and February exceeds (below) that of the Merged EP index.

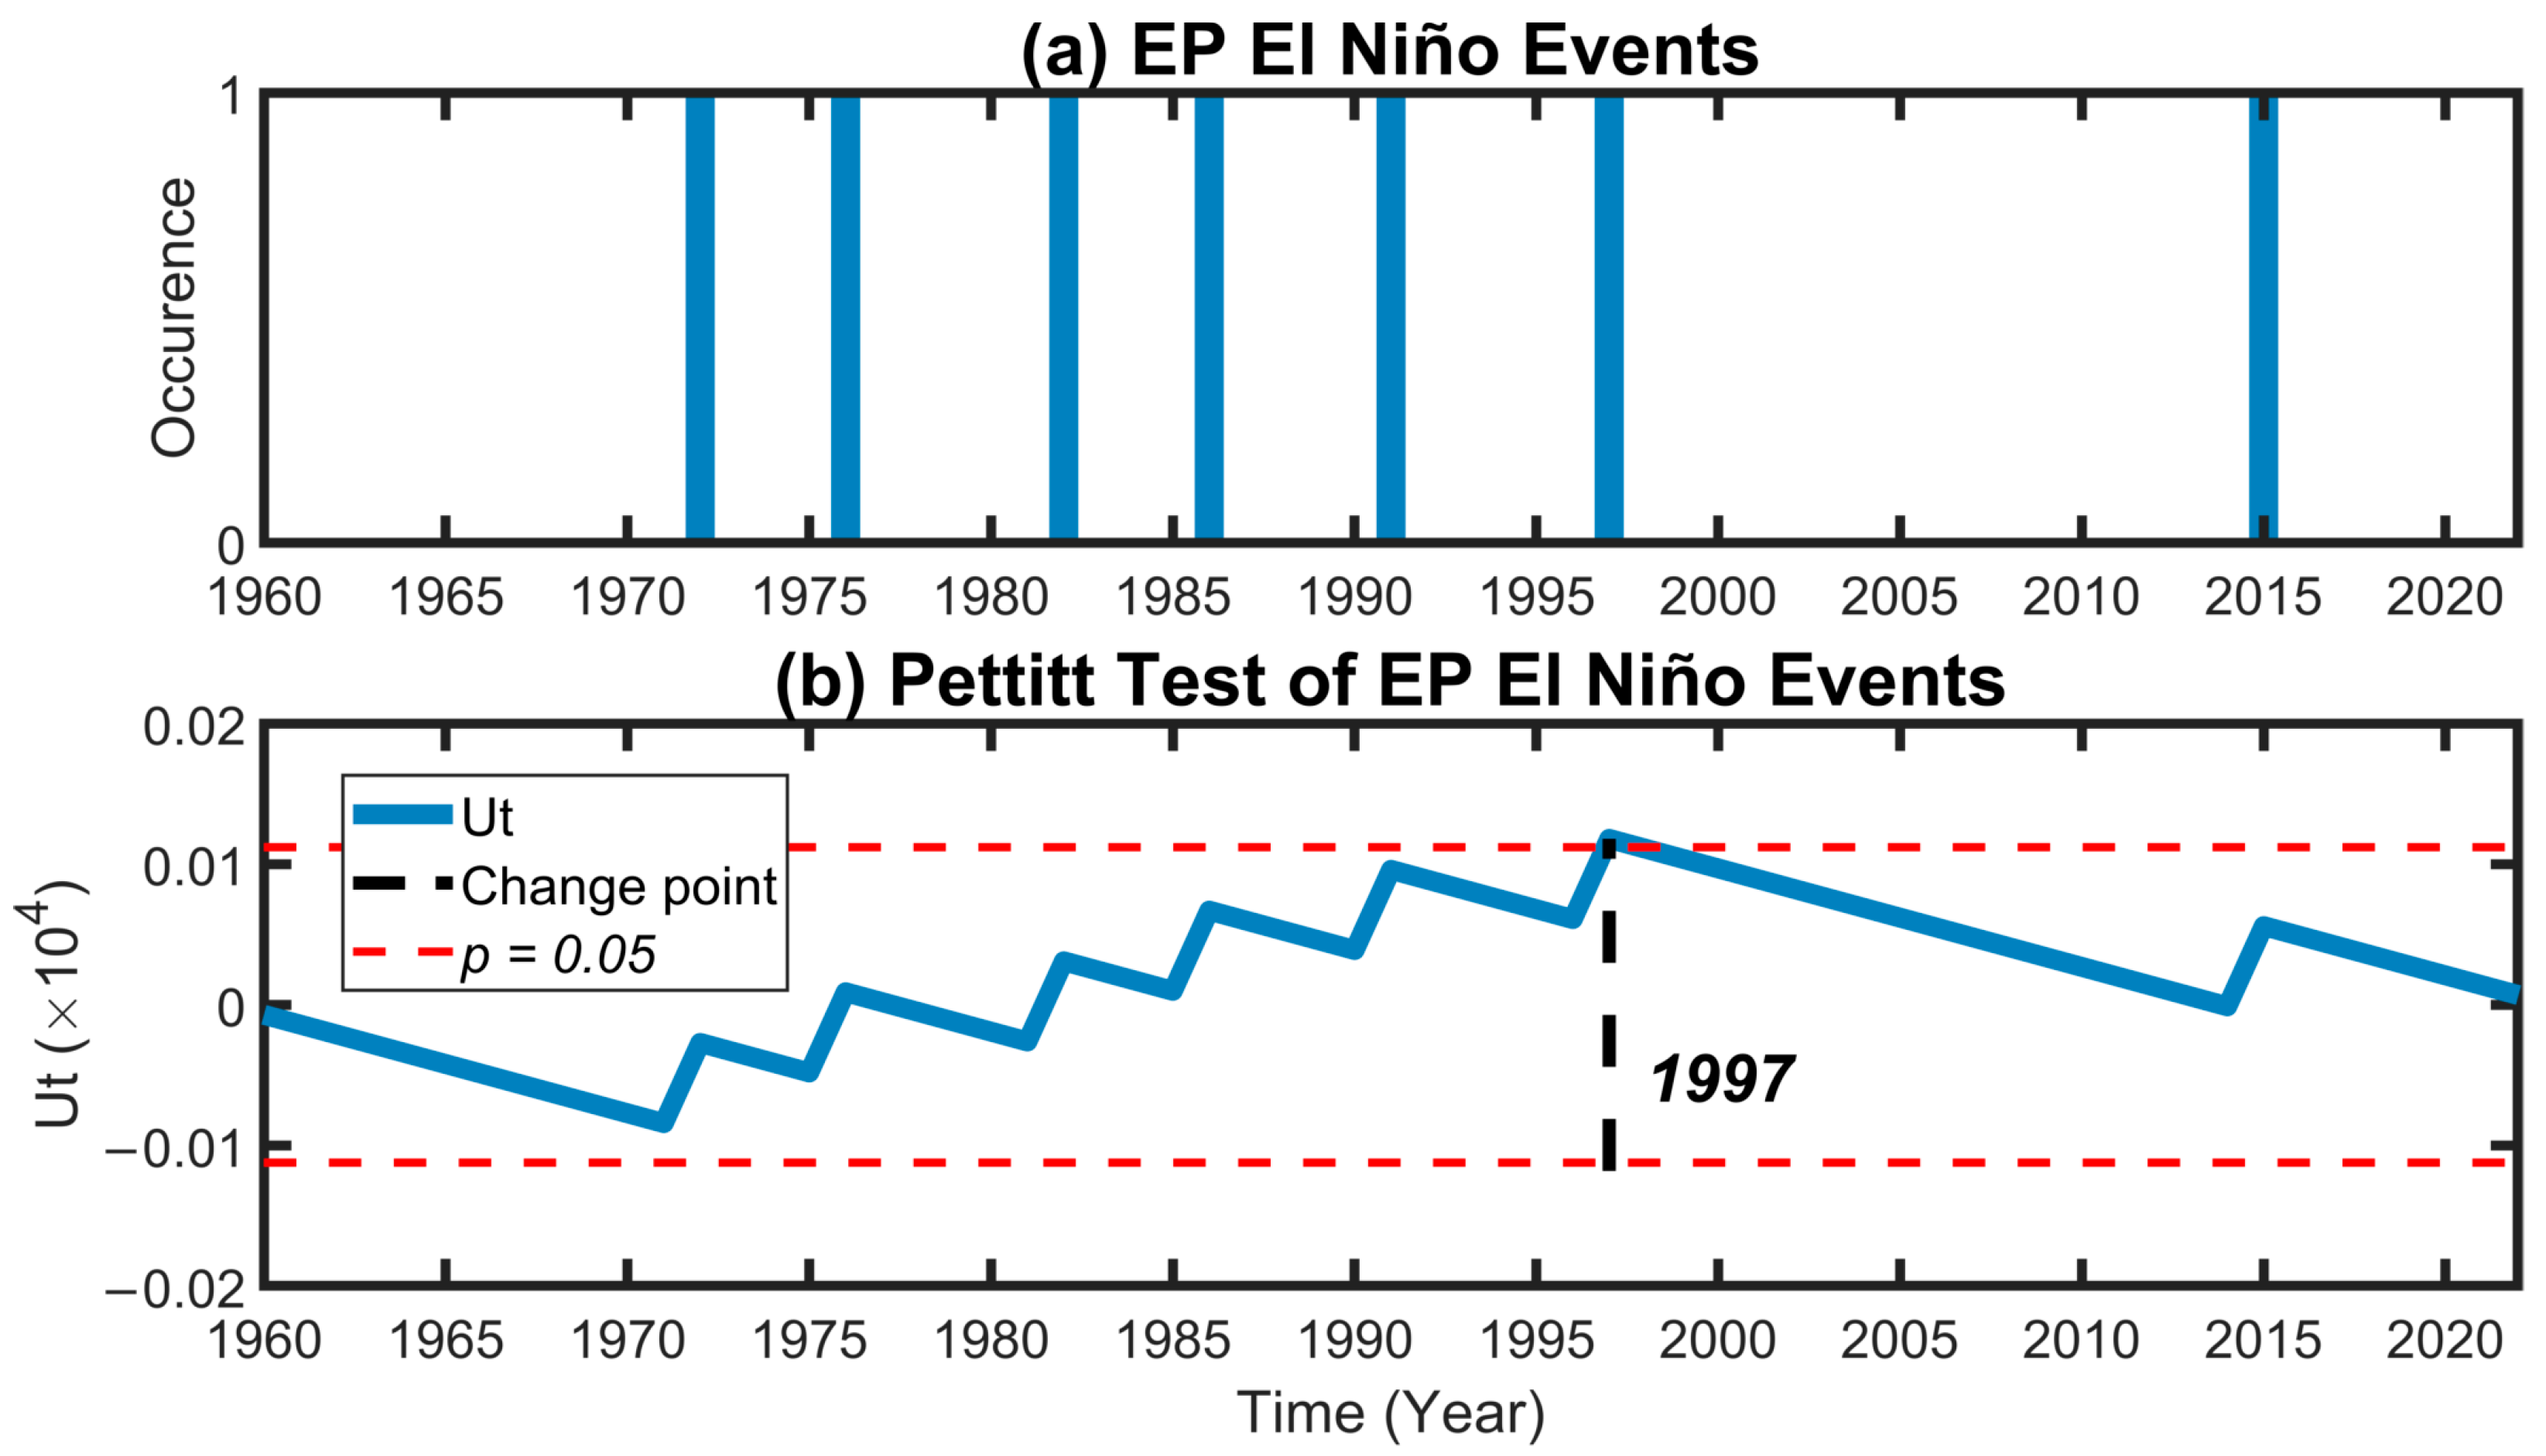
2.2.2. Significance Tests

Multiple significance tests are used in this study. For correlation analyses, a two-tailed Student’s t-test was applied. For spectral analyses, a red noise test is adopted. The Pettitt test is employed to identify the change point in the occurrence of CP El Niño events. The Pettitt test is a well-established method for detecting abrupt changes in time series, providing a solid theoretical foundation for variability analysis [50]. Previous studies have demonstrated that this method can effectively identify significant shifts in the mean of a time series, even when the exact timing of the change is unknown [51]. The test is based on the Mann–Whitney statistic Ut. In addition, effective degrees of freedom are used for long time series following the approach proposed by Pyper and Peterman [52].

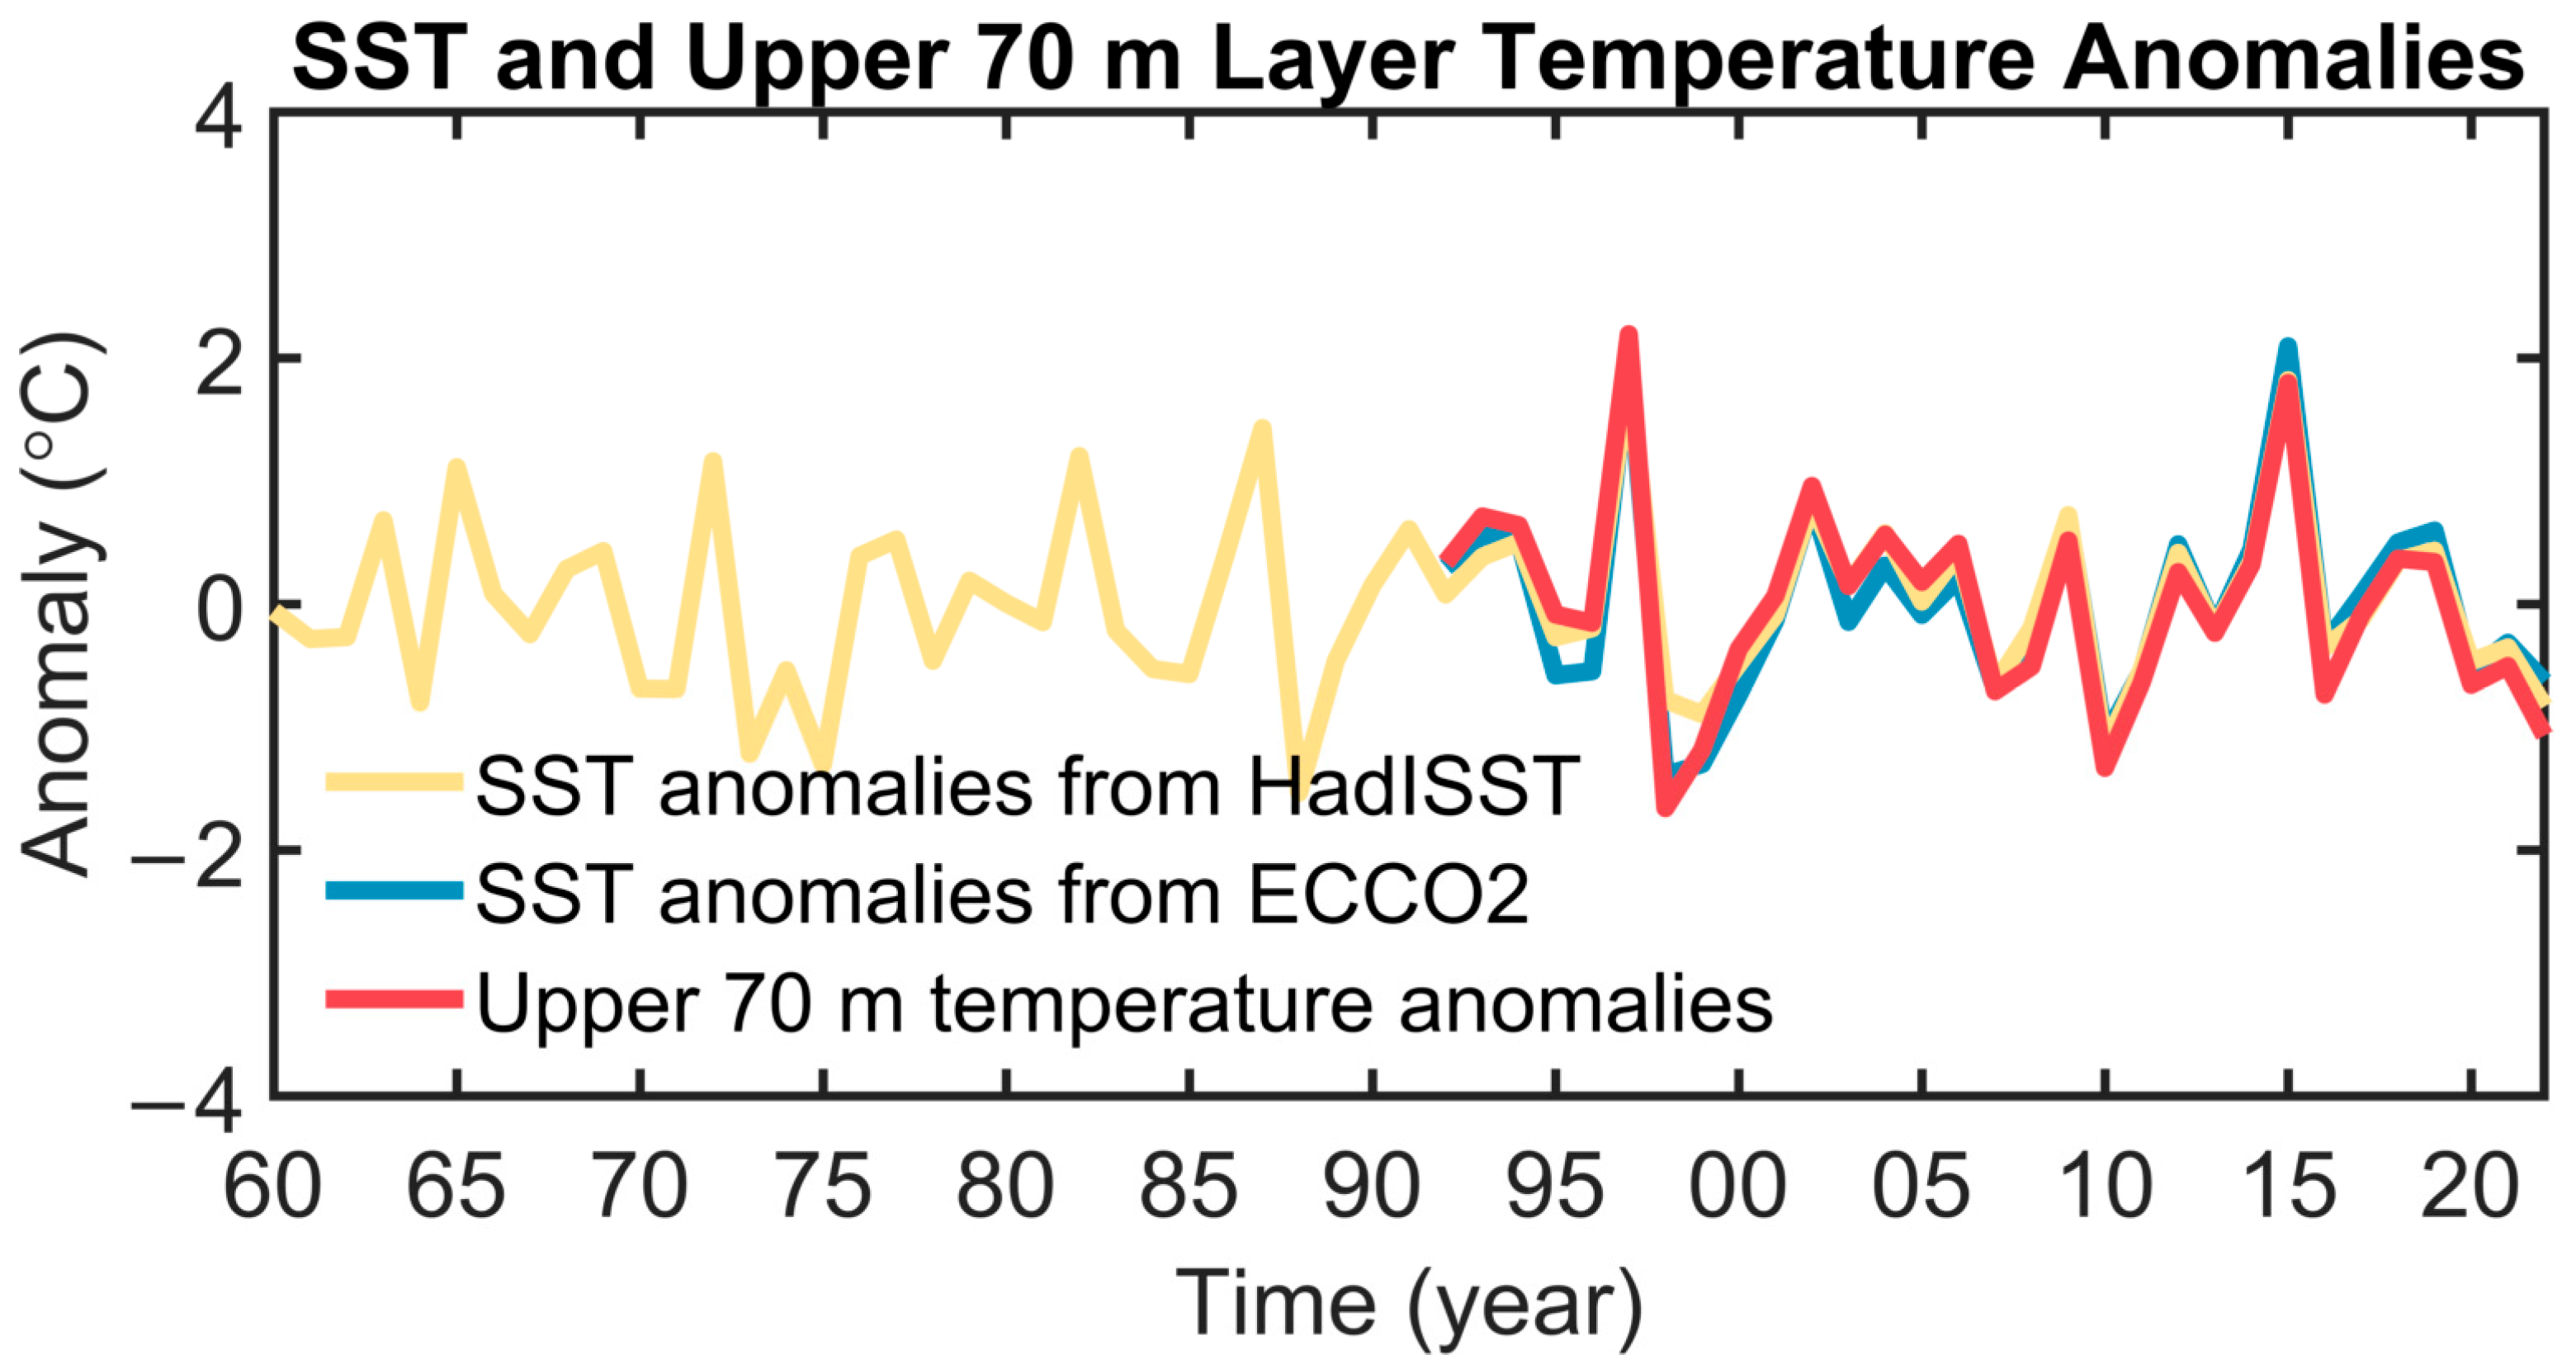
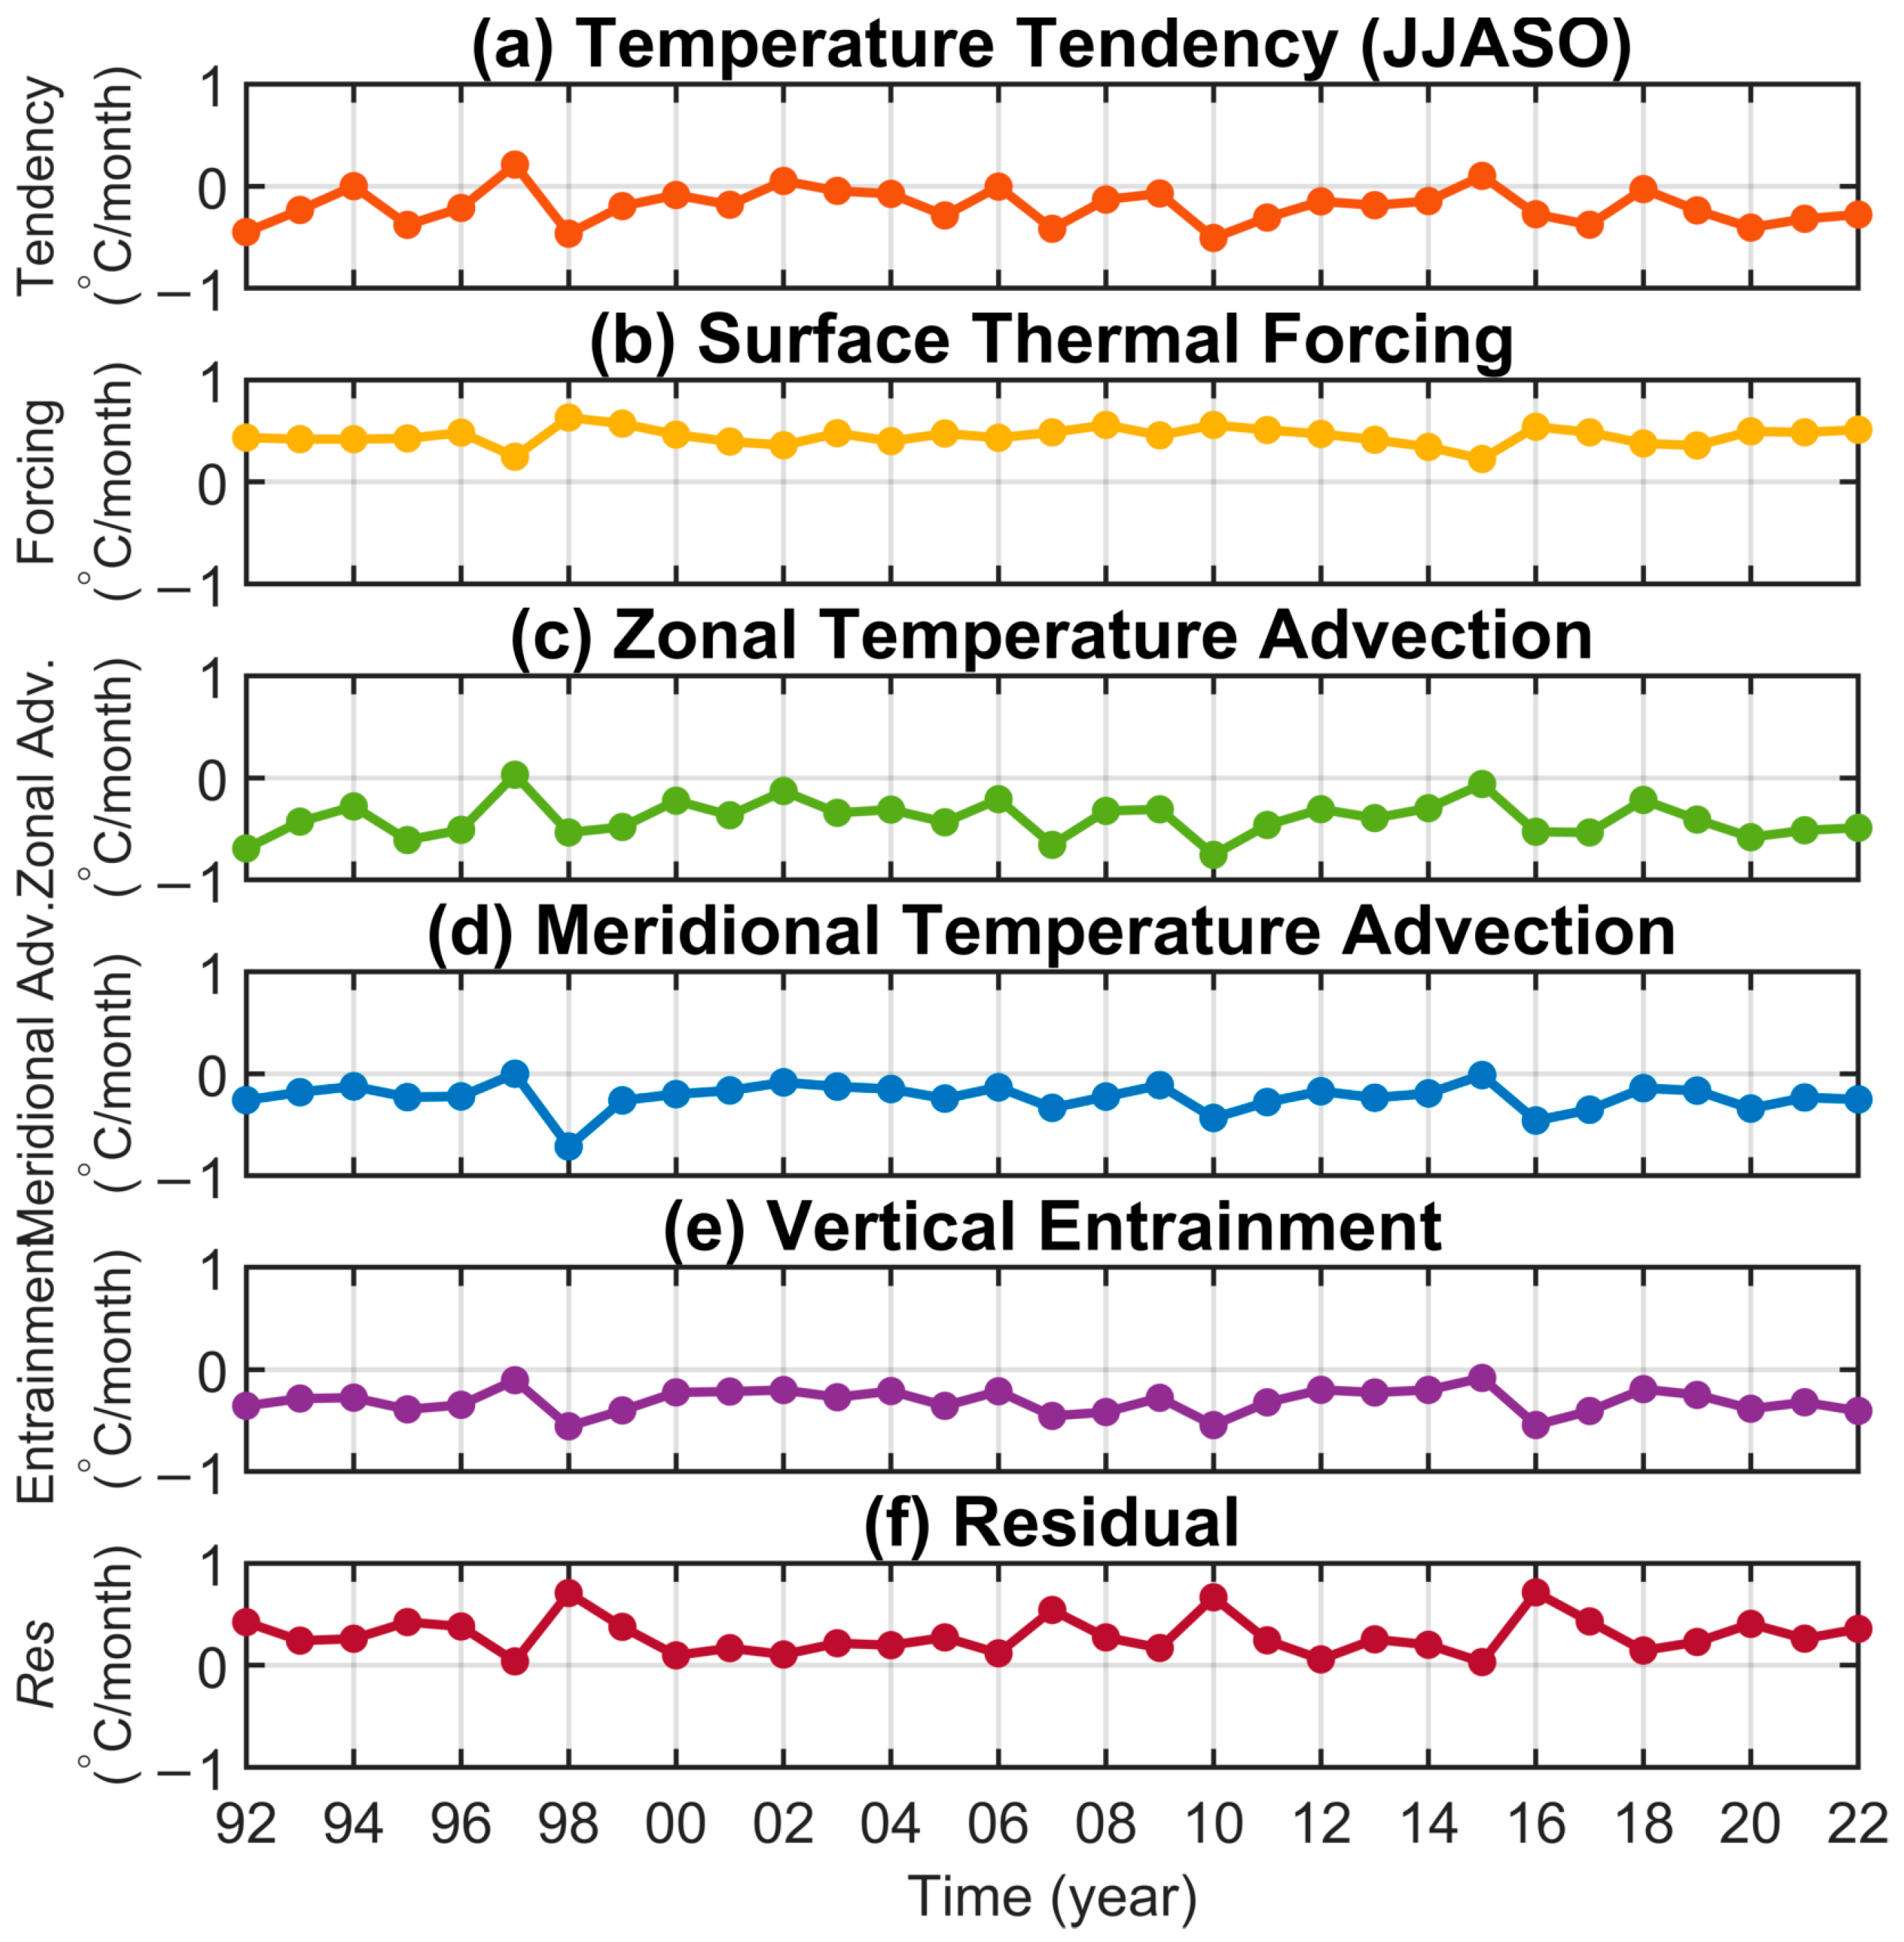
2.2.3. The Mixed Layer Heat Budget Equation

For the mixed layer in a specific region, such as in the central equatorial Pacific, the mean mixed layer temperature T m is controlled by
T m t = Q 0 q d ρ · C p · h u T m x v T m y w e n t T m T d h + R e s
where t is the time, Q 0   is the net surface heat flux, q d is the downward radiative heat flux across the base of the upper layer, ρ is the seawater density, C p is the specific heat of seawater, h is the mixed layer depth, u and v are the zonal and meridional current velocity, respectively, w e n t is the entrainment rate of cold seawater from below the mixed layer, T d is the seawater temperature below the mixed layer, and R e s is the residual containing the contribution from mixing [53,54]. T m t on the left hand of Equation (1) is the temperature tendency term, while Q 0 q d ρ · C p · h , u T m x , v T m y , w e n t T m T d h , and R e s on the right hand are the surface thermal forcing term, the zonal temperature advection term, the meridional temperature advection term, the vertical entrainment term, and the residual term, respectively.
In this study, we use a fixed mixed layer base instead of a varying one. The study region (5° S–5° N, 170° W–122° W) is located in the central equatorial Pacific, where the seasonality of mixed layer depth is much weaker than in the midlatitudes. The mixed layer in the study region is around 50–100 m [55,56]. Here, we chose the upper 70 m layer as the mixed layer. The mean temperature of the upper 70 m layer in the study region is consistent with the regional mean SST, as shown in Figure S2. Considering the 70 m layer is much thicker, we take q d as 0. In other words, we think that the upper 70 m layer absorbs the whole surface net heat flux. Using a fixed mixed layer, the w e n t follows
w e n t = w d ,   w d > 0 w e n t = 0 ,   w d 0
where w d is the vertical current velocity at the base of the fixed mixed layer, and upward positive. The heat budget analysis is performed based on the ECCO2 model output.

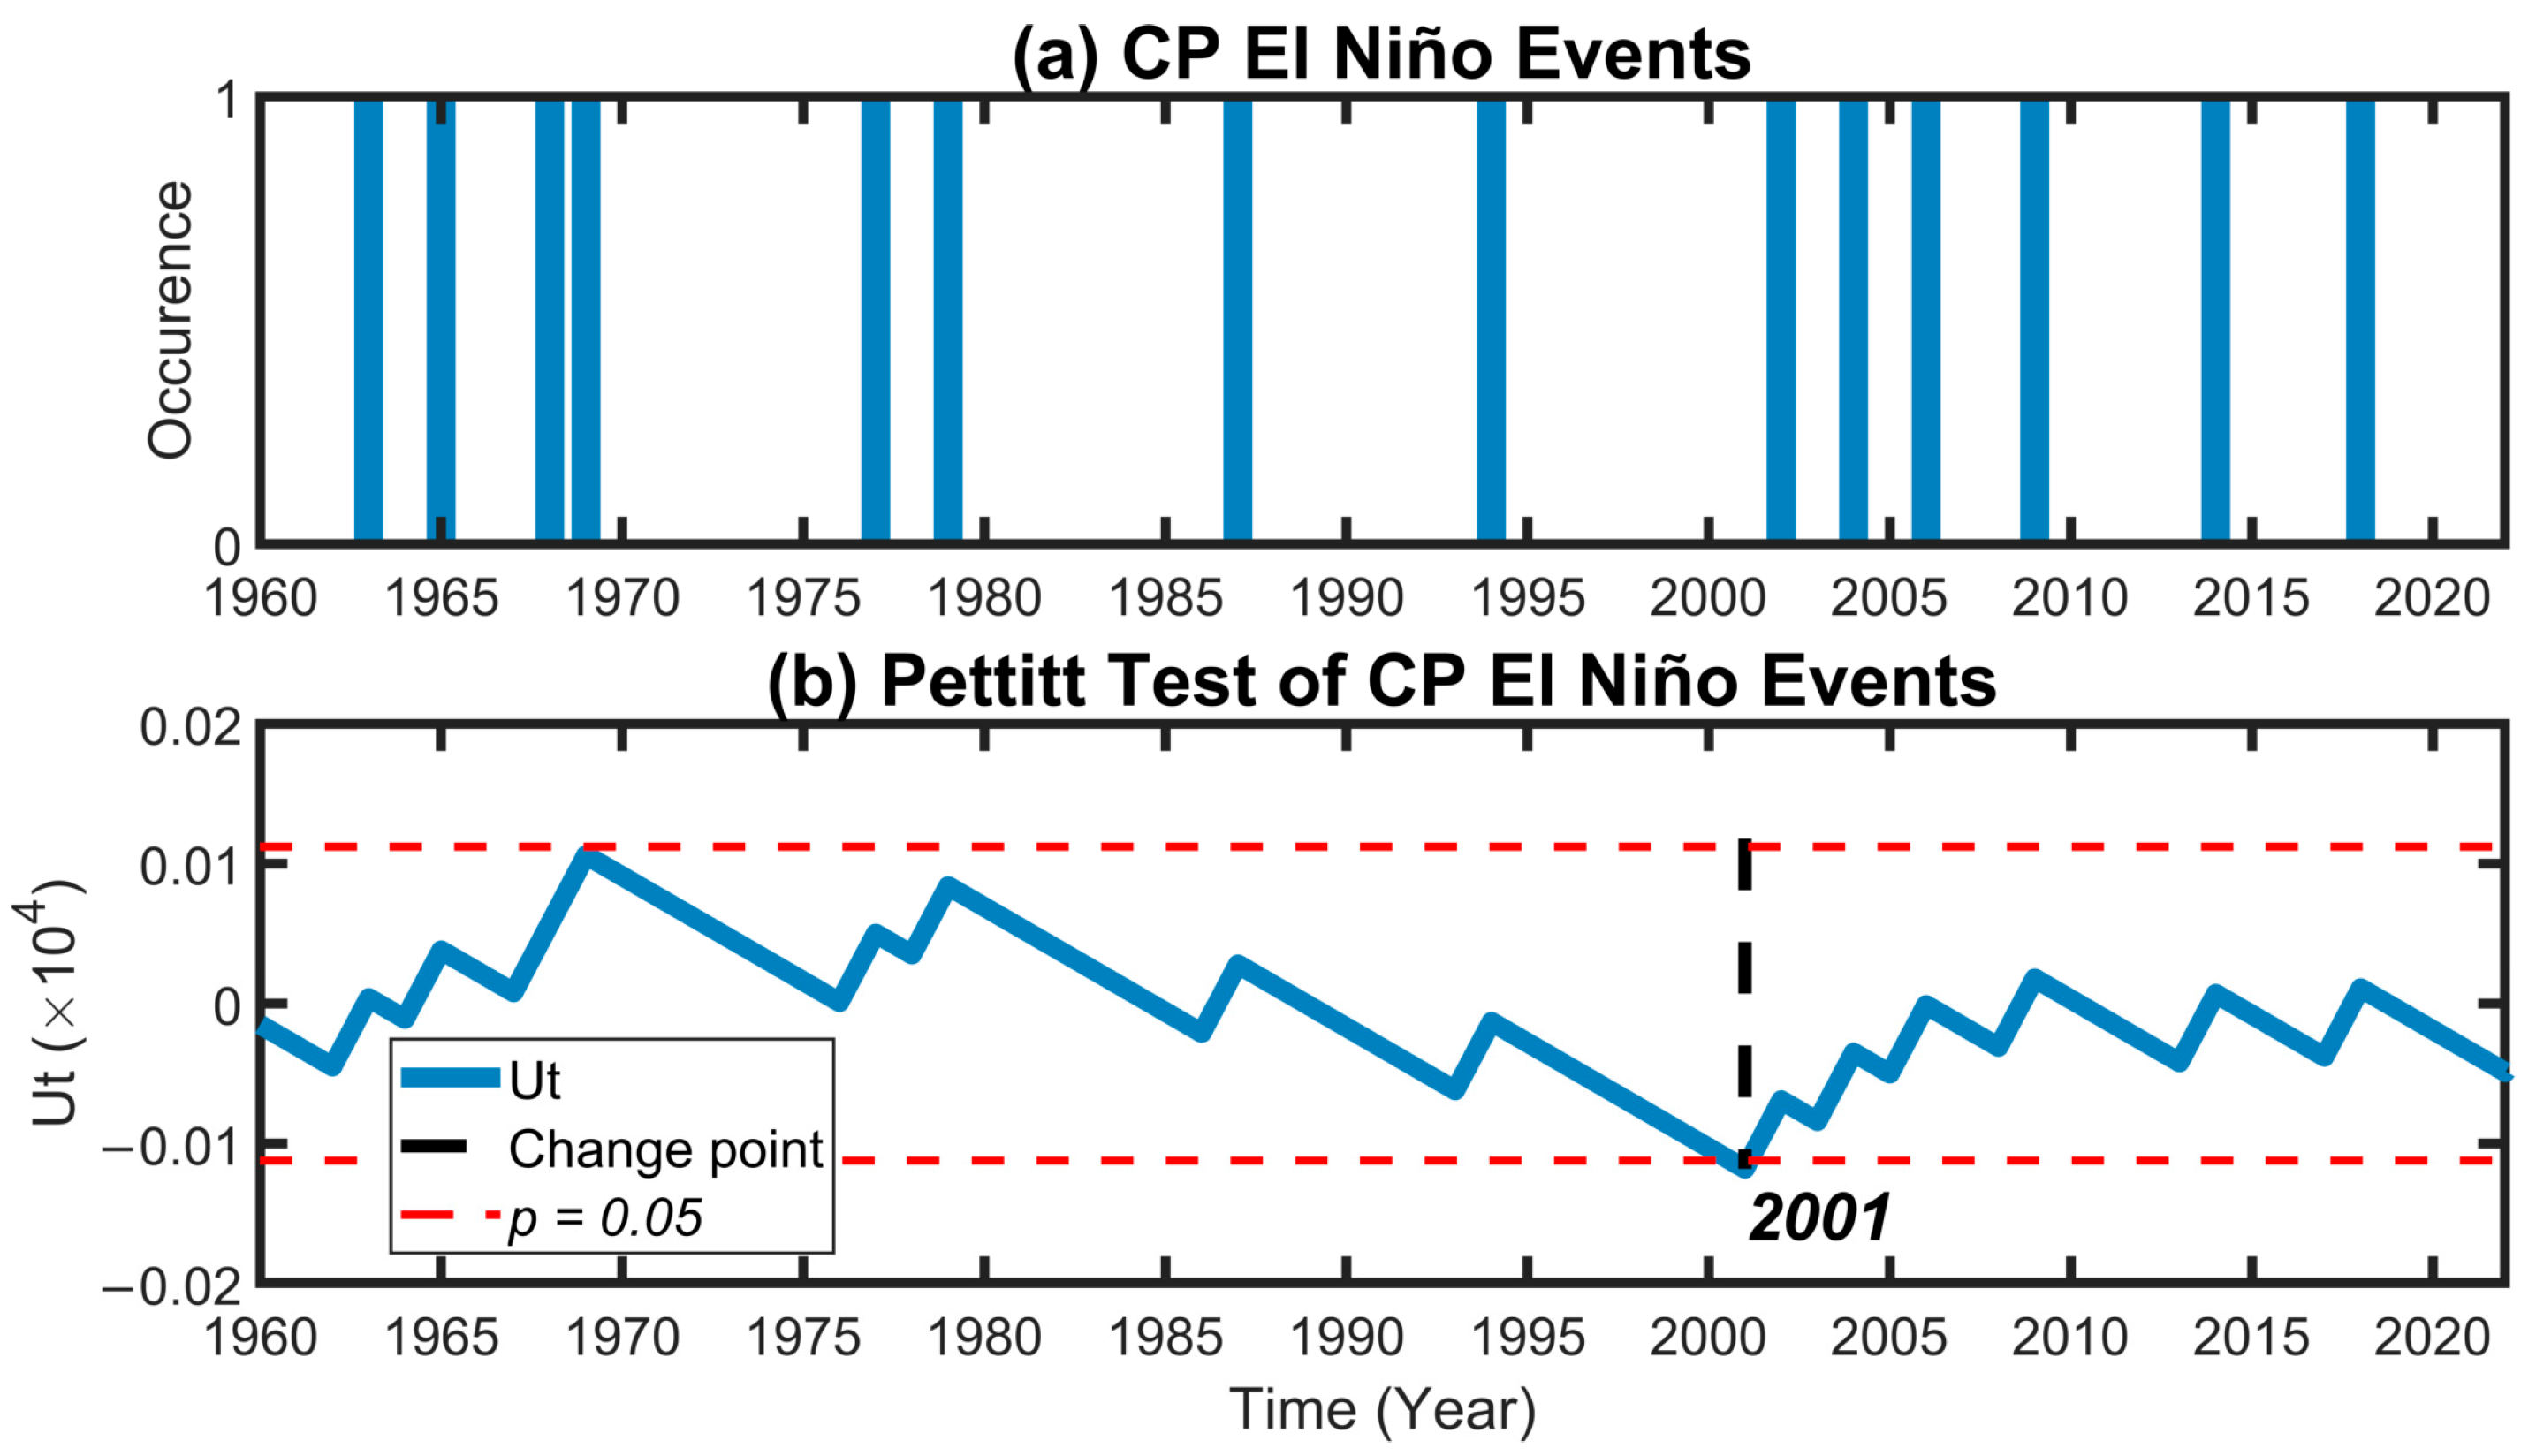
3. Increase in CP El Niño Frequency Since 2000

During the study period between 1960 and 2022, 21 El Niño events are identified according to the ONI criterion (see Section 2.2 Methods). Furthermore, based on the Merged EP/CP-index method, among the identified El Niño events, 14 were classified as CP El Niño, while the remaining 7 were categorized as EP El Niño. The results are listed in Table 1. More CP El Niño events are observed compared with EP El Niño events.
The frequency of CP El Niño events increased since 2000. Figure 1a displays the frequency of CP El Niño events from 1960 to 2022. If a CP El Niño event occurs, the occurrence is denoted as 1; otherwise, the occurrence is 0. A notable increase in CP El Niño frequency seems to emerge since 2000. During 1960–1999, eight CP El Niño events are recorded over the 40 years. Meanwhile, during the shorter 23-year span of 2000–2022, six CP El Niño events are observed. To investigate the change in the frequency, we applied the Pettitt test to detect abrupt changes in the CP El Niño events, as shown in Figure 1b. The CP El Niño events exhibited significant abrupt changes around 2000. Specifically, the CP El Niño events underwent a significant abrupt change in 2001, shifting from a declining trend pre-2001 to a rising trend thereafter.
CP El Niño events experienced significant changes since 2000. To further investigate the frequency of CP El Niño events, Figures S3–S6 present the number of events within 7-year, 9-year, 11-year, and 13-year moving windows, respectively. The results are consistent with the significant abrupt changes observed after 2000. Specifically, CP El Niño events exhibited significant abrupt changes across various moving window lengths. Within a 7-year moving window, a notable shift occurred in 2000 (p < 0.05), changing from a declining trend prior to 2000 to an increasing trend thereafter. In the 9-year moving window, a significant change was detected between 1999 and 2001 (p < 0.05). For the 11-year window, the change occurred in 1998 (p < 0.05), while in the 13-year window, a significant abrupt shift was observed in 1999 (p < 0.05). Hence, using 2000 as the change point, we will analyze the changes in CP El Niño events during 1960–1999 and 2000–2022. A statistical analysis of the number of CP El Niño events for each decade from the 1960s to the 2010s further confirms the abrupt changes in the CP El Niño frequency after 2000 (see Figure S7). The result is consistent with previous studies [14,38].
Since 2000, the period of CP El Niño’s interannual variability shortened. We first examine the differences in the interannual variability of the CP El Niño before and since 2000. Figure 2a presents the time series of the Merged CP index. The power spectrum results of the Merged CP index during 1960–1999 and 2000–2022 are shown in Figure 2b,c, respectively. The Merged CP index during 1960–1999 exhibited the most significant period at 2.5, 3.6, and 4.4 years (passing the 99% confidence level, Figure 2b). Since 2000, the amplitude of the interannual variability in CP El Niño did not show obvious changes. However, the most significant period of the interannual variability of the Merged CP index shortened and shifted to 2–3 years since 2000, as shown in Figure 2c. The period of the CP El Niño events shortens from 4–5 years to 2–3 years. In summary, the interannual variability in the CP El Niño exhibited a shortened period. Consistent results were also obtained from the wavelet power spectrum of the Merged CP index, as illustrated in Figure S8.

4. Mechanisms

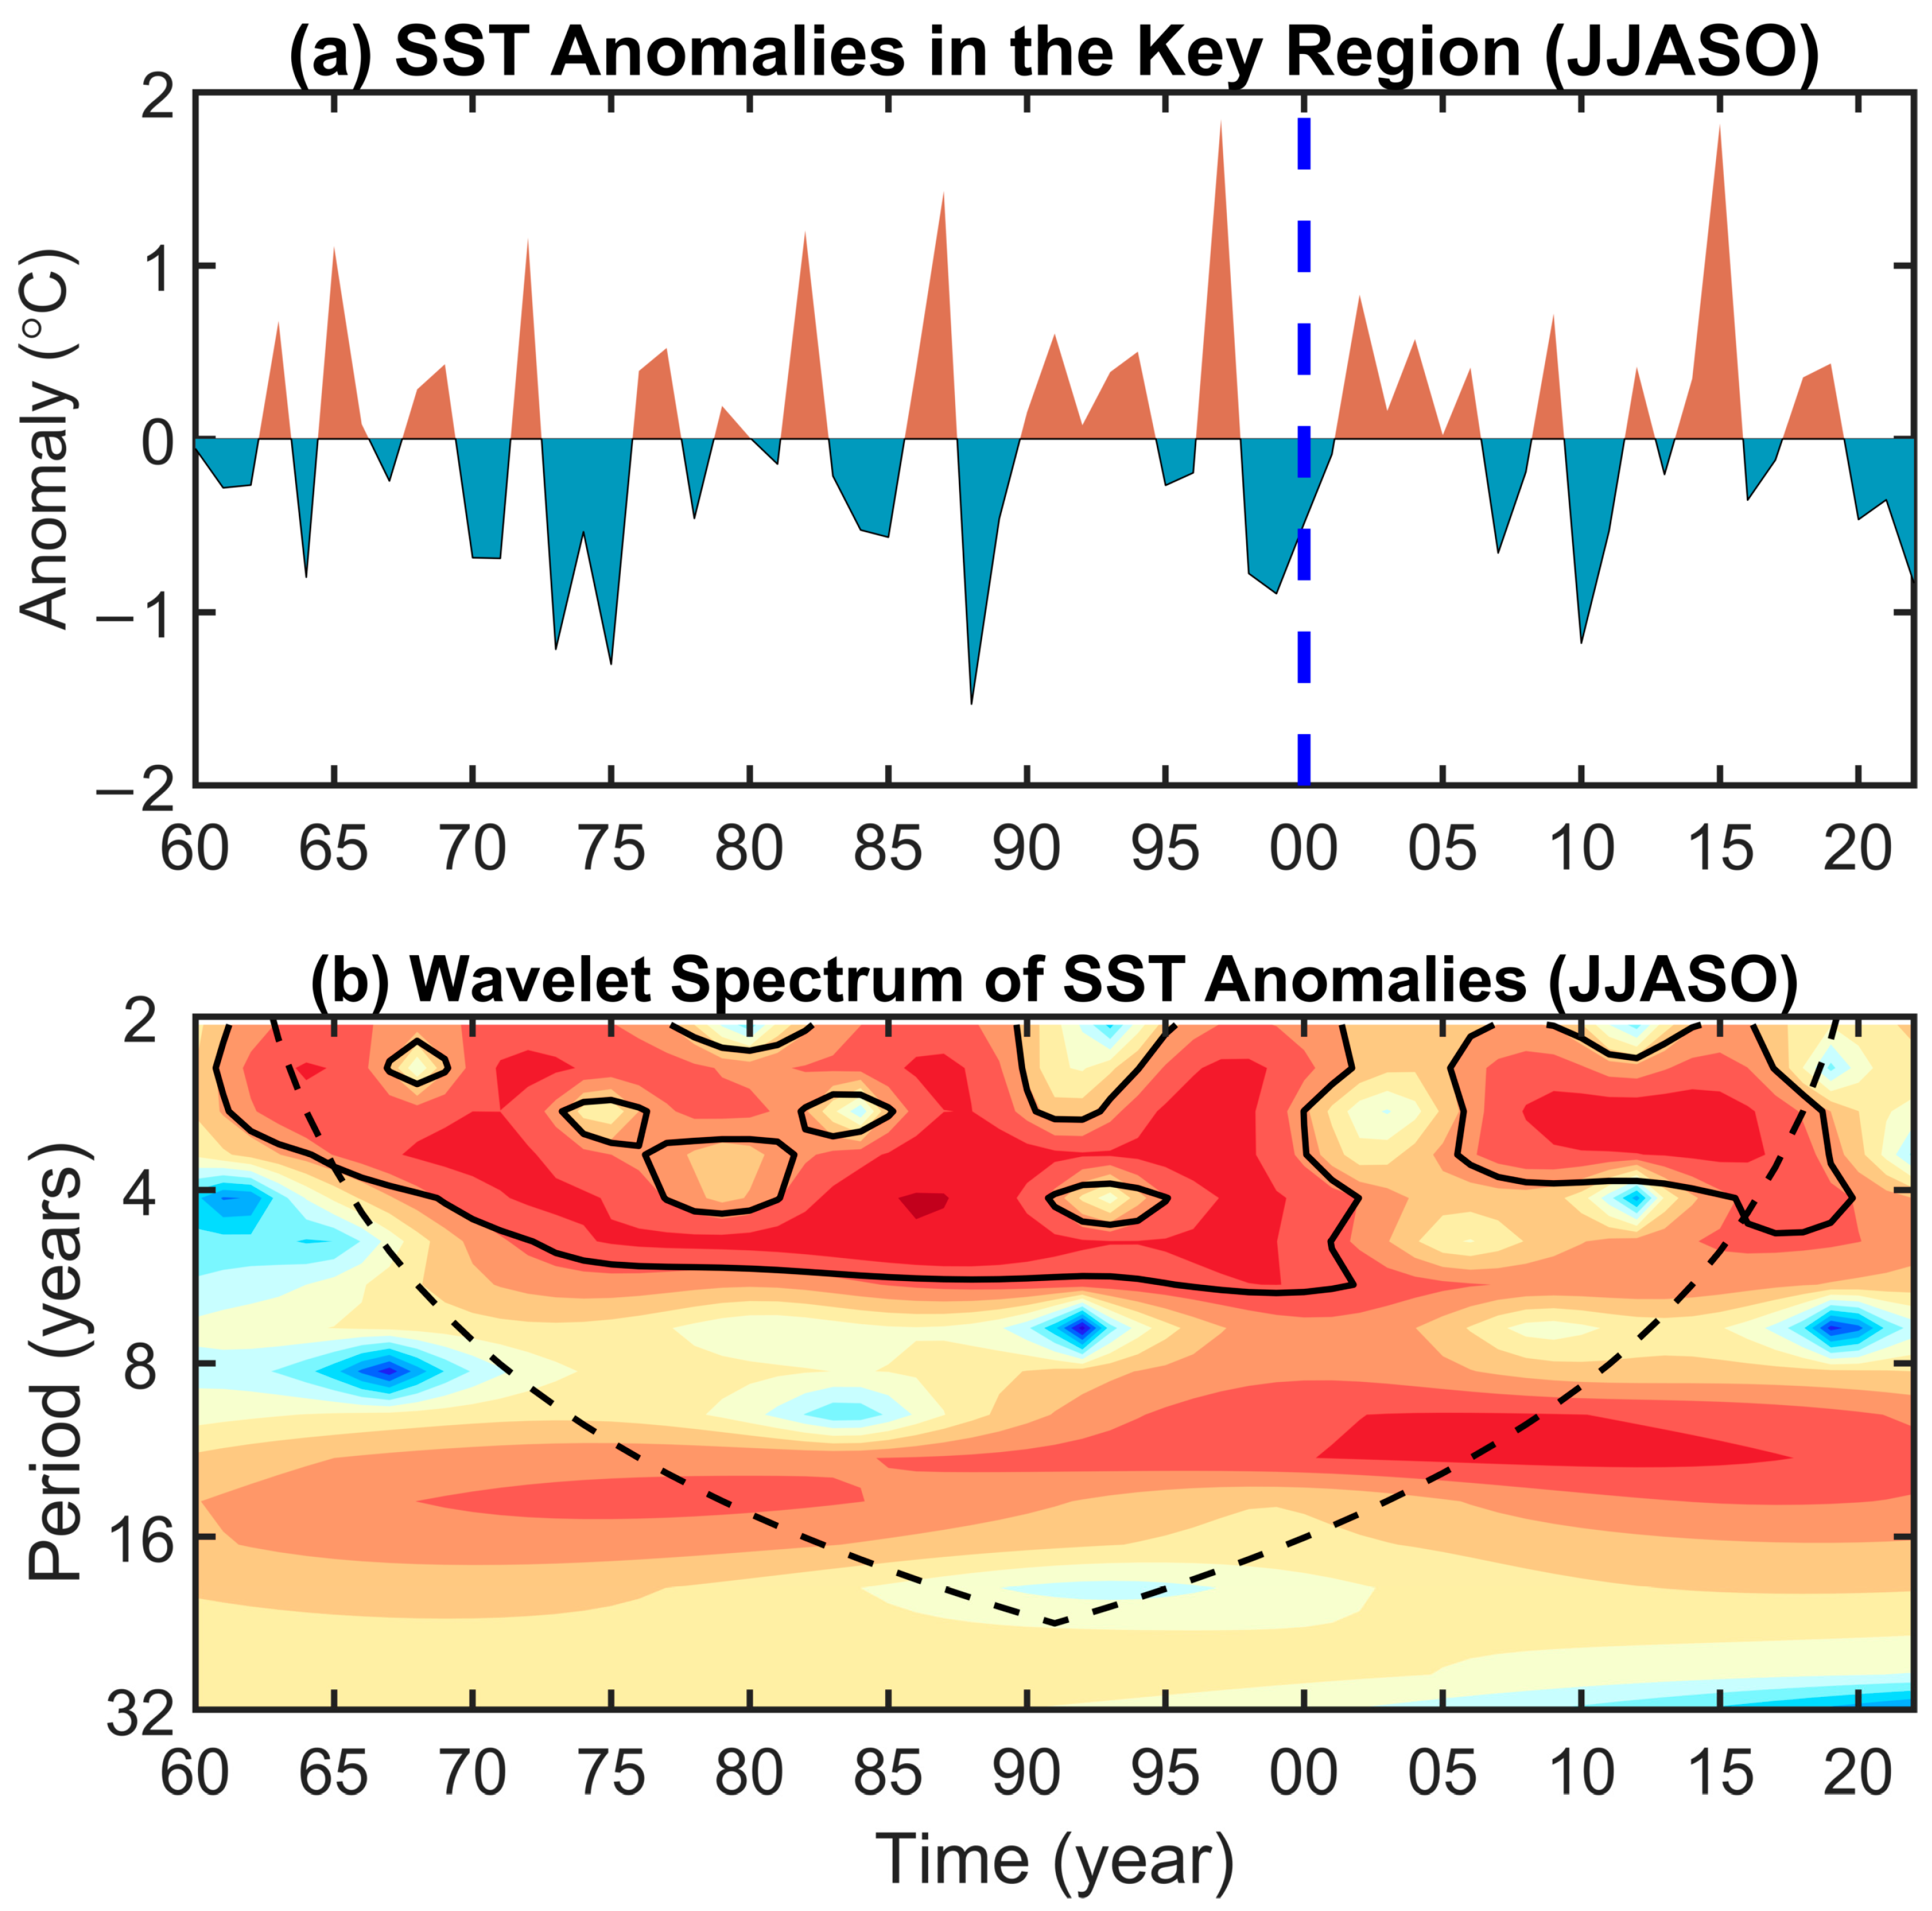
4.1. More Frequent Warm SST Anomalies in the Key Region

To investigate the increased frequency of CP El Niño events since 2000, we first performed a composite analysis of SST anomalies across three evolutionary phases: the onset, developing, and mature phases. Following previous studies [57,58,59,60], February–April (FMA) and April–June (AMJ) are chosen to indicate the onset phase, June-August (JJA) and August-October (ASO) are taken to represent the developing phase, and October-December (OND) and December-February (D(0)JF(+1)) are picked to reflect the mature phase. The composite SST anomalies from FMA(0) to D(0)JF(+1) during the CP El Niño events between 1960 and 2022 are illustrated in Figure 3a–f, respectively. Significant warm SST anomalies first appear in the central equatorial Pacific in JJA(0) of the developing phase (Figure 3c). The specific region with significant SST anomalies is 5° S–5° N, 170° W–122° W (the black box in Figure 3c). Then, the significant warm SST anomalies amplify and extend eastward, as from Figure 3d–f. The specific region of 5° S–5° N, 170° W–122° W is essential for the developing phase of the CP El Niño. We take it as the key region for the CP El Niño.
The SST anomalies in the key region are highly linked to CP El Niño events during the developing phase. Figure 4a,b present the time series of regional mean SST anomalies in the key region and the Merged CP index during the developing phase, respectively. The two time series seem to have the same phase change. A lead–lag correlation analysis further confirms the close relationship. As shown in Figure 4c, the largest positive correlation coefficient reaches 0.75 at zero leads or lags, passing the 99% confidence level. It suggests that the SST anomalies in the key region and the Merged CP index during the developing phase of the CP El Niño events exhibit a significant simultaneous correlation.
Notably, warm SST anomalies in the key region are more frequently observed during 2000–2022 compared to 1960–1999. Figure 5a shows the time series of regional mean SST anomalies in the key region from 1960 to 2022 during the developing phase. Between 1960 and 1999, there were 14 years that presented large and persistent warm SST anomalies in the key region over 40 years. In contrast, between 2000 and 2022, there were 9 years in which large and persistent warm SST anomalies emerged in just 23 years. The increased frequency of the warm SST anomalies in the key region since 2000 is further confirmed by a wavelet analysis. Figure 5b shows the wavelet power spectrum of the regional mean SST anomalies. The regional mean SST anomalies in the key region exhibit two dominant periods before and after 2000. During 1960–1999, the SST anomalies showed a significant period of 2–5 years. However, during 2000–2022, the significant period shifts to 2–3 years. The more frequent warm SST anomalies in the key region during the developing phase of the CP El Niño are consistent with the shortened period of the interannual variability of the Merged CP index in Figure 2c since 2000. The more frequent warm SST anomalies in the key region drive the observed increased frequency of the CP El Niño events since 2000.

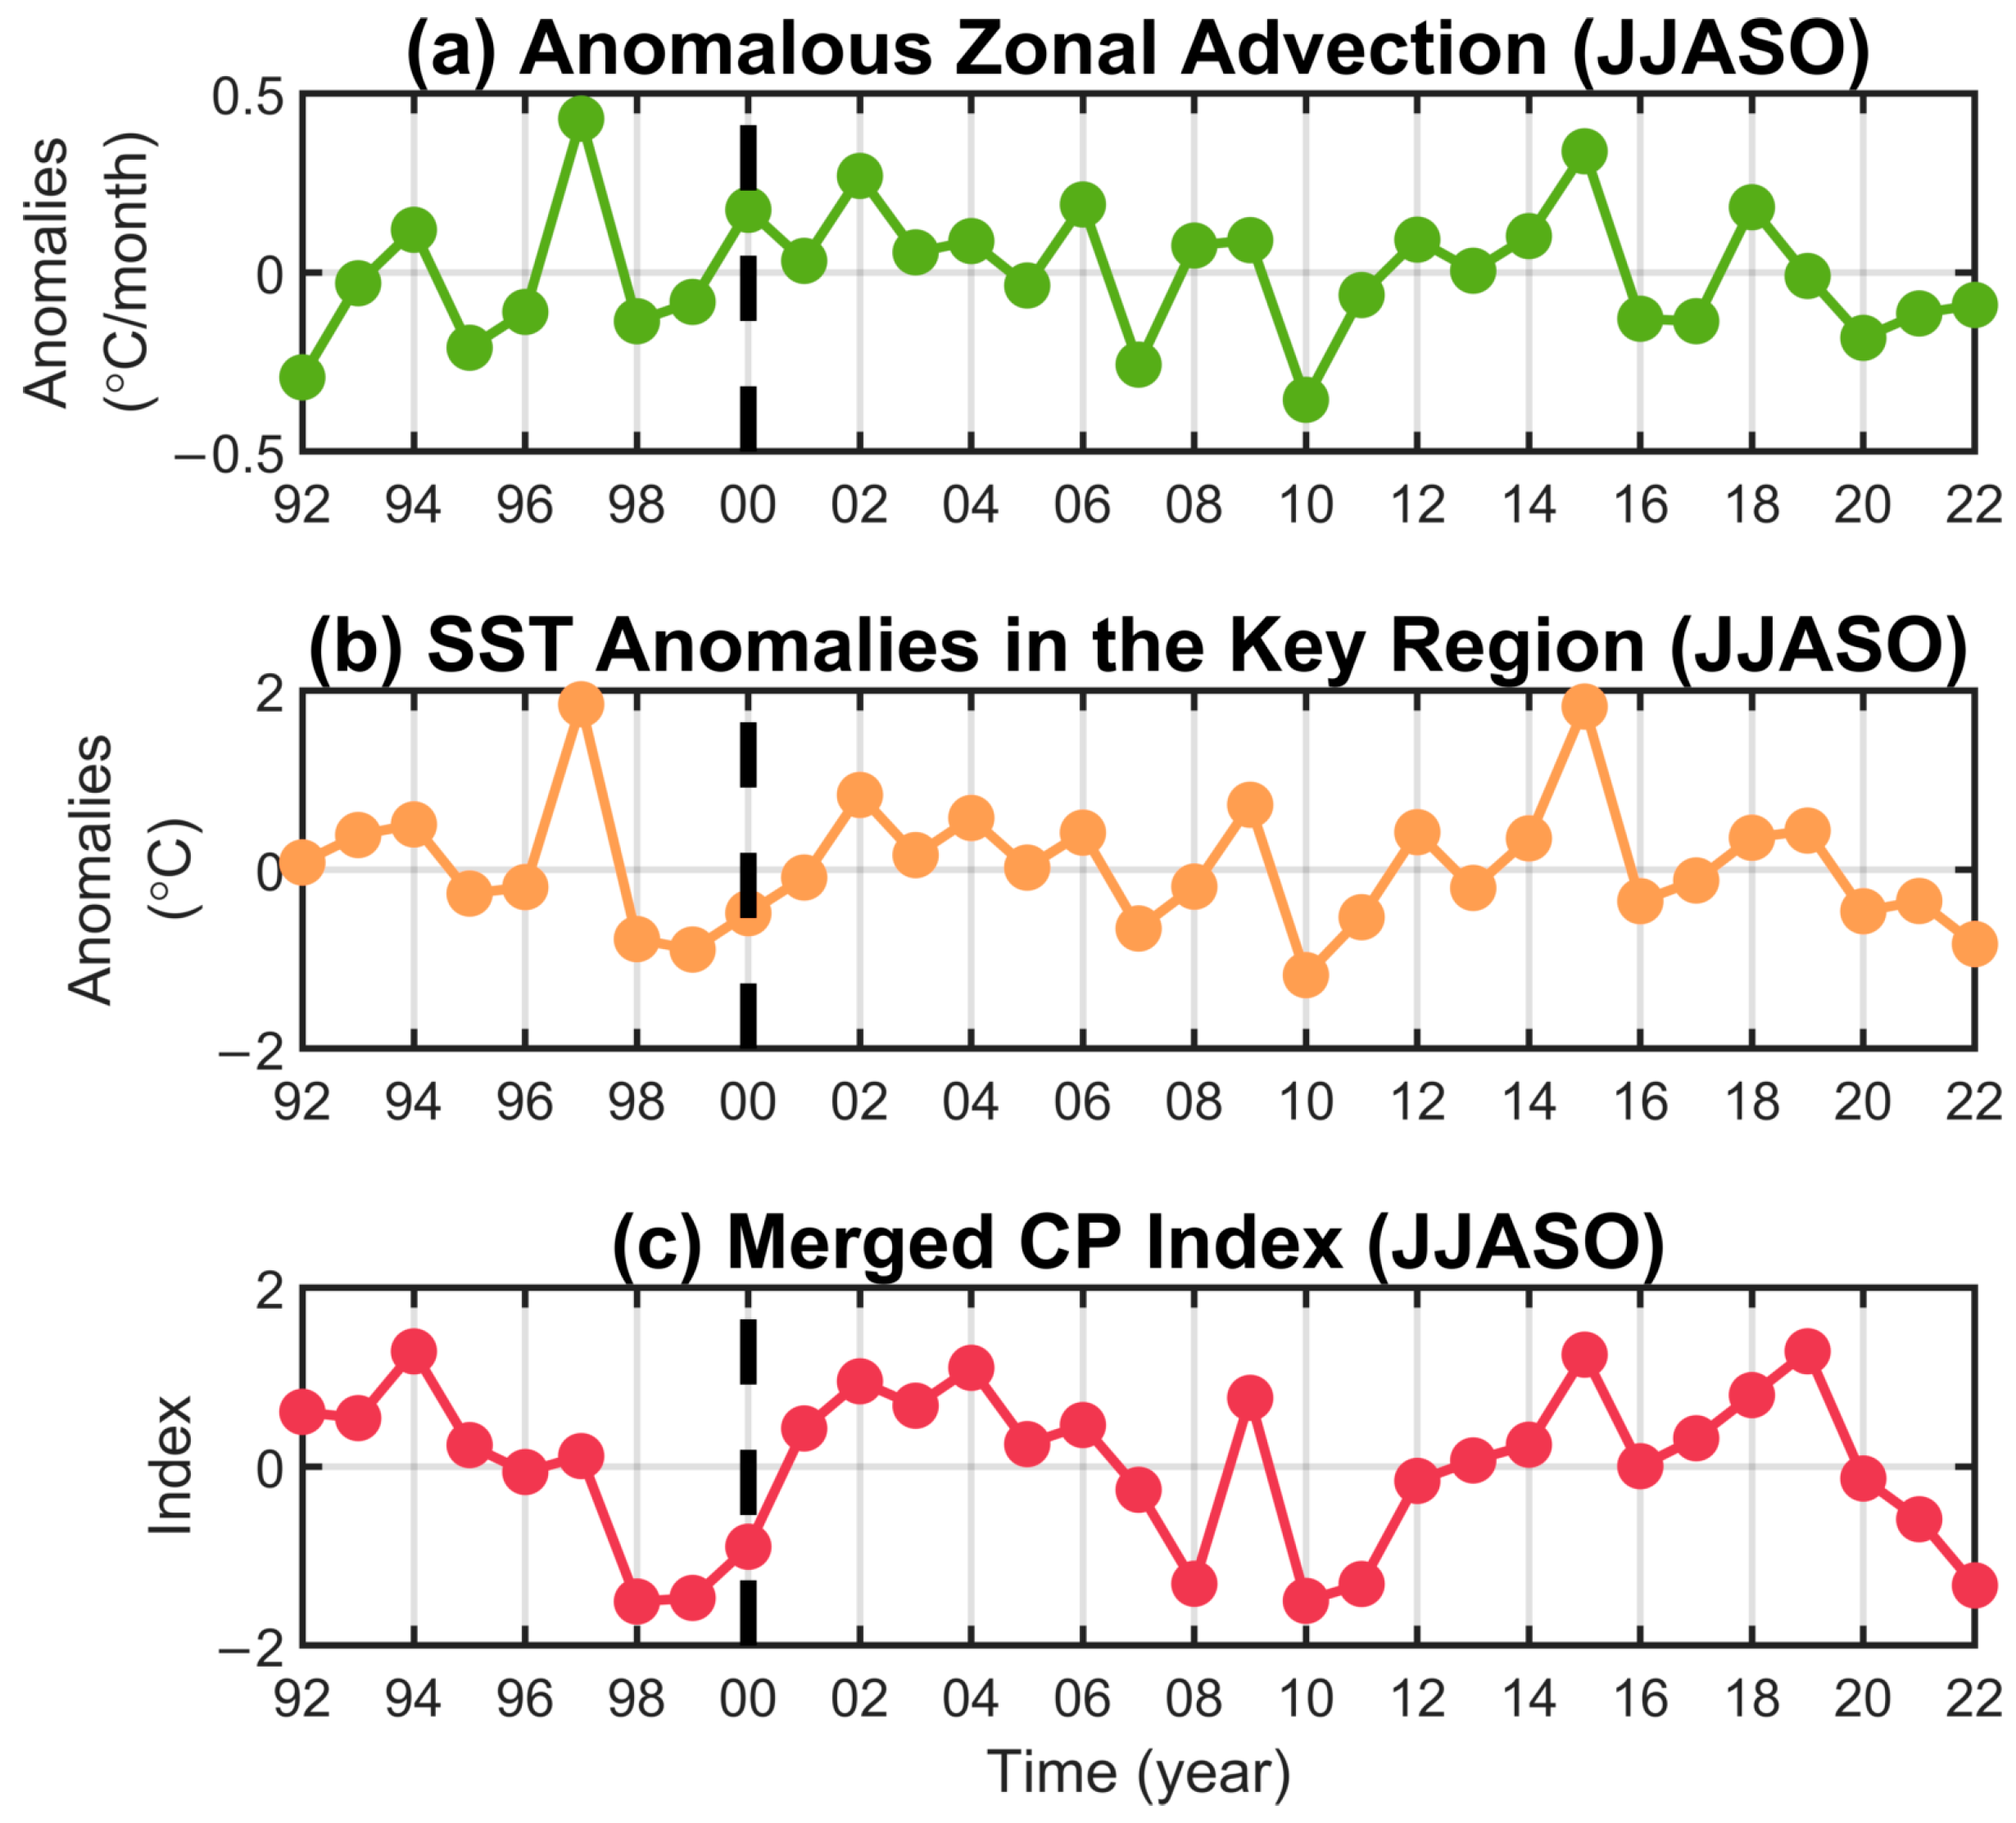
4.2. Role of Anomalous Warm Zonal Advection

So, why are warm SST anomalies in the key region more frequently observed during the developing phase since 2000? To find out the answer, we conducted a heat budget analysis of the mixed layer in the key region based on the ECCO2 model output. The ECCO2 output spans from 1992 to 2022. Here, we used a fixed mixed layer, and the mixed layer depth is chosen to be 70 m according to previous studies [61]. The two datasets, HadISST and ECCO2, also exhibit nearly identical time series of monthly regional mean SST anomalies in the key region, as shown in the yellow line and the blue line in Figure 6, respectively. The time series of the regional mean SST in the key region from HadISST and the 70 m depth-averaged regional mean temperature in the key region from ECCO2 are offered in the yellow line and the red line in Figure 6, respectively. Clearly, the two time series show nearly the same phase change. This suggests that the SST and the subsurface temperature in the Central Pacific of the ECCO2 output are consistent with the SST of the HadISST. This guarantees that performing the heat budget analysis of the upper 70 m layer in the Central Pacific based on the ECCO2 output is valid.
The results of the heat budget analysis of the upper 70 m layer in the key region during the developing phase (JJASO) are illustrated in Figure 7. The temperature tendency (Figure 7a) mainly follows the zonal temperature advection (Figure 7c). Their correlation coefficient is 0.96, passing the 95% confidence level. The correlation coefficient between the temperature tendency and surface thermal forcing is −0.67. In comparison, the correlation with meridional temperature advection is 0.81, the vertical entrainment is 0.81, and the residual term is −0.80. Other terms also show significant correlation coefficients, but they are less important than zonal temperature advection. Surface thermal forcing exhibits no significant changes over time. Zonal temperature advection is the dominant process during the developing phase of CP El Niño events. In contrast, meridional temperature advection plays a minor role in the warming during this phase and shows a further decline after 2000. Vertical entrainment remains relatively steady throughout the period. The residual term associated with heat flux represents a combination of mixing. In all, on the interannual time scale, the SST, as well as mixed layer temperature variability in the key region is determined by zonal temperature advection.
The more frequent warm SST anomalies in the key region during the developing phase are induced by the more frequent anomalous warm zonal advection. Figure 8a shows the time series of regional mean zonal advection anomalies in the key region from 1992 to 2022 during the developing phase. Figure 8b,c present the time series of regional mean SST anomalies in the key region and the Merged CP index during the developing phase, respectively. The warm zonal advection and SST anomalies appear to exhibit in-phase changes. In the key region, correlation analysis reveals that the correlation coefficient was 0.80 during 2000–2022, passing the 99% confidence level. Between 2000 and 2022, there were 9 years in large and persistent warm zonal advection anomalies which emerged in just 23 years. Specifically, anomalous warm zonal advection is observed in the years 2002, 2004, 2006, 2008, 2009, 2012, 2014, 2015, and 2018, consistent with the results shown in Figure 5a.

5. Conclusions

This study investigates the recent increase in the frequency of CP El Niño events. Based on the Merged EP/CP-Index method, we identify all the CP El Niño events between 1960 and 2022. There are 14 CP El Niño events over the 63 years. A Pettitt test is used to analyze the change in the frequency of CP El Niño events during 1960–2022. The results confirm a significant increase in the frequency of CP El Niño events since 2000. Over the 40 years between 1960 and 1999, eight CP El Niño events appeared. In contrast, over the 23 years between 2000 and 2022, six CP El Niño events are seen. In addition, the period of the CP El Niño events shortens from 4–5 years to 2–3 years.
A composite analysis of the SST anomalies during the CP El Niño event reveals that the key region (5° S–5° N, 170° W–122° W) in the central equatorial Pacific is essential for the development of CP El Niño events. The increased frequency of CP El Niño events is closely related to more frequent warm SST anomalies in this key region during the developing phase of CP El Niño events (i.e., June to October). The two datasets, HadISST and ECCO2, also exhibit nearly identical time series of monthly regional mean SST anomalies in the key region. Furthermore, a heat budget analysis of the upper 70 m layer in the key region based on the ECCO2 output suggests that the SST variability in the central equatorial Pacific during the developing phase is dominated by zonal temperature advection. The more frequent warm SST anomalies are caused by frequent anomalous warm zonal advection. In all, we propose that the frequent anomalous warm zonal advection since 2000 causes the more frequent warm SST anomalies, and finally drives the observed increase in the CP El Niño event frequency since 2000.

6. Discussion

The frequency of the EP El Niño events has declined since the 2000s. Figure 9a,b display the number of EP El Niño events. A notable decline in EP El Niño frequency is evident since 2000, with only one EP El Niño event occurring over the subsequent two decades (Figure 9a). To determine the timing of the frequency changes, we applied the Pettitt test to detect abrupt changes in the number of EP El Niño events, as shown in Figure 9b. EP El Niño events also exhibited significant abrupt changes since 2000, yet their frequency trends diverged markedly from CP El Niño events. Specifically, the EP El Niño events showed a statistically significant abrupt change in 1997 (p < 0.05), transitioning from a significant increasing trend pre-1997 to a declining trend since 1997. These results reveal opposing frequency characteristics between EP and CP El Niño events.
Consistent with Shin et al. (2022) [14], our results also indicate a marked increase in CP El Niño frequency since 2000. Previous studies also reported that there has been an increase in extreme El Niño events in recent years [34]. Although our study examines the trends and changes in EP and CP El Niño events, we do not specifically analyze their intensities. We classify the two types of El Niño into four intensity levels: super, strong, moderate, and weak, based on the ONI, following L’Heureux et al. [62]. Table S1 shows the number of EP and CP El Niño events at each intensity. There are three, one, two, and one EP El Niño events classified as super, strong, moderate, and weak, respectively. Meanwhile, the number of CP El Niño events in these categories is zero, two, five, and seven, respectively. Figure S9 shows the proportion of events at each intensity. From the distribution of different intensities of EP and CP El Niño events, we find that EP El Niño events are predominantly super El Niño events, accounting for 43% (Figure S9a). In contrast, 50% of CP El Niño events are weak, followed by 36% classified as moderate, with no super CP El Niño events observed (Figure S9b). As the current number of EP and CP El Niño events of different intensities and types is too limited to analyze trends and variability, further research is essential to incorporate longer-term data or model experiments, which would help investigate the characteristics of El Niño frequency under different intensities. Moreover, a complementary relationship between the decadal frequencies of CP El Niño events is evident in Figures S7 and S10: when the frequency of EP El Niño events is at its lowest, CP El Niño events reach a peak, while the total number of events appears to remain relatively constant. Therefore, further investigation is warranted to determine whether these two types of El Niño events represent different manifestations of the same underlying decadal variability. The zonal temperature advection during the developing phase of CP El Niño events might be linked to anomalous zonal winds over the key region.

Supplementary Materials

The following supporting information can be downloaded at: https://www.mdpi.com/article/10.3390/atmos16060654/s1, Figure S1: The Merged EP/CP index and the corresponding spatial patterns of winter Sea Surface Temperature (SST) anomalies for EP and CP El Niño events are presented. (a) and (b) show the time series of the monthly merged EP and CP indices from 1960 to 2022, respectively. (c) and (d) display the composite spatial patterns of SST anomalies (color shading, in °C) for EP and CP El Niño events in December, January, and February (0/1). Among the 21 El Niño events, 7 EP and 14 CP El Niño events are used in the composites (see Table 1). This analysis follows the methodology of Jia and Guo (2025); Figure S2: Time series of regional mean SST anomalies (blue) in the key region during the developing phase and the upper 70 m layer regional mean temperature (red); Figure S3: Statistical analysis and Pettitt test of the frequency of CP El Niño events. (a) The number of CP El Niño events within a 7-year moving window; (b) Pettitt test for the number of CP El Niño events within a 7-year moving window, where the solid line denotes the test statistic, the black dashed line indicates the detected change point, and the magenta, blue, and yellow dashed lines represent the 99%, 95%, and 90% confidence levels, respectively; Figure S4: Statistical analysis and Pettitt test of the frequency of CP El Niño events. (a) The number of CP El Niño events within a 9-year moving window; (b) Pettitt test for the number of CP El Niño events within a 9-year moving window, where the solid line denotes the test statistic, the black dashed line indicates the detected change point, and the red dashed line represents the 95% confidence level; Figure S5: Statistical analysis and Pettitt test of the frequency of CP El Niño events. (a) The number of CP El Niño events within a 11-year moving window; (b) Pettitt test for the number of CP El Niño events within a 11-year moving window, where the solid line denotes the test statistic, the black dashed line indicates the detected change point, and the magenta, blue, and yellow dashed lines represent the 99%, 95%, and 90% confidence levels, respectively; Figure S6: Statistical analysis and Pettitt test of the frequency of CP El Niño events. (a) The number of CP El Niño events within a 13-year moving window; (b) Pettitt test for the number of CP El Niño events within a 13-year moving window, where the solid line denotes the test statistic, the black dashed line indicates the detected change point, and the magenta, blue, and yellow dashed lines represent the 99%, 95%, and 90% confidence levels, respectively; Figure S7: The number of occurrences of the CP El Niño events in each decade from the 1960s to the 2010s; Figure S8: The real part of wavelet coefficients for the Merged CP index, with black soild lines indicating the 95% significance level; Table S1: All the El Niño events with four different intensities between 1960 and 2022 according to the ONI-based criterion and their types decided by the Merged EP/CP-index methods; Figure S9: Proportion of two types of El Niño events with different intensities. (a) Proportions of super El Niño, strong El Niño, moderate El Niño, and weak El Niño events within EP El Niño events; (b) Same as (a), but for CP El Niño events; Figure S10: The number of occurrences of the EP El Niño events in each decade from the 1960s to the 2010s.

Author Contributions

Conceptualization, L.J. and Y.G.; methodology, L.J.; software, L.J.; validation, L.J. and Y.G.; formal analysis, L.J.; investigation, L.J.; resources, L.J.; data curation, L.J.; writing—original draft preparation, L.J.; writing—review and editing, L.J. and Y.G.; visualization, L.J. and Y.G.; supervision, Y.G.; project administration, Y.G.; funding acquisition, Y.G. All authors have read and agreed to the published version of the manuscript.

Funding

This research was funded by the National Natural Science Foundation of China, grant number: 42106019. Bureau of Science and Technology of Zhoushan, the Zhoushan Science and Technology Project—Zhejiang Ocean University Special Project, grant number: 2022C41020. The Scientific Research Initiation Fund of the Zhejiang Ocean University, grant number: GK 11034150220003.

Institutional Review Board Statement

Not applicable.

Informed Consent Statement

Not applicable.

Data Availability Statement

The ONI is downloaded from https://origin.cpc.ncep.noaa.gov/products/analysis_monitoring/ensostuff/ONI_v5.php (accessed on 15 June 2024). The EP and CP indices were downloaded from https://www.ess.uci.edu/~yu/2OSC/ (accessed on 11 May 2024). The ERSST V5 data from https://www.psl.noaa.gov/data/gridded/data.noaa.ersst.v5.html (accessed on 4 June 2024). The HadISST data were downloaded from https://www.metoffice.gov.uk/hadobs/hadisst/index.html (accessed on 10 November 2024). The NCEP/NCAR Reanalysis I dataset is available for download at: https://psl.noaa.gov/data/gridded/data.ncep.reanalysis.html (accessed on 17 January 2024). The interpolated ECCO2 output was downloaded from https://apdrc.soest.hawaii.edu/datadoc/ecco2_cube92.php (accessed on 11 May 2024).

Acknowledgments

Jia and Guo would like to thank Ji Qi for his valuable help and suggestions in this study. Qi helped perform the heat budget analysis with the ECCO2 output. Special thanks are extended to Editors for their valuable guidance and support throughout the revision and review process. We are also grateful to the three anonymous reviewers for their insightful comments, thoughtful questions, and constructive suggestions, which significantly improved our work. We deeply appreciate their time and effort in reviewing our manuscript.

Conflicts of Interest

The authors declare no conflicts of interest.

Abbreviations

The following abbreviations are used in this manuscript:
ENSOEl Niño–Southern Oscillation
SSTSea surface temperature
EPEastern Pacific
CPCentral Pacific
ONIOcean Niño Index
NWPWarm pool Niño index
NCTCold tongue Niño index
HadISSTThe Hadley Centre Sea Ice and Sea Surface Temperature
FMAFebruary, March, and April
AMJApril, May, and June
JJAJune, July, and August
ASOAugust, September, and October
ONDOctober, November, and December
DJFDecember, January, and February

References

  1. Newman, M.; Shin, S.I.; Alexander, M.A. Natural variation in ENSO flavors. Geophys. Res. Lett. 2011, 38, L14705. [Google Scholar] [CrossRef]
  2. Bjerknes, J. Atmospheric Teleconnections from the Equatorial Pacific1. Mon. Weather Rev. 1969, 97, 163–172. [Google Scholar] [CrossRef]
  3. Torrence, C.; Webster, P.J. Interdecadal Changes in the ENSO–Monsoon System. J. Clim. 1999, 12, 2679–2690. [Google Scholar] [CrossRef]
  4. Nicholls, N. Predictability of Interannual Variations of Australian Seasonal Tropical Cyclone Activity. Mon. Weather Rev. 1985, 113, 1144–1149. [Google Scholar] [CrossRef]
  5. Rasmusson, E.M.; Carpenter, T.H. Variations in Tropical Sea Surface Temperature and Surface Wind Fields Associated with the Southern Oscillation/El Niño. Mon. Weather Rev. 1982, 110, 354–384. [Google Scholar] [CrossRef]
  6. Jin, F.F.; Kug, J.S.; An, S.-I. Two Types of El Niño Events: Cold Tongue El Niño and Warm Pool El Niño. J. Clim. 2009, 22, 1499–1515. [Google Scholar] [CrossRef]
  7. Troup, A. The ‘southern oscillation’. Q. J. R. Meteorol. Soc. 1965, 91, 490–506. [Google Scholar] [CrossRef]
  8. Kim, H.M.; Webster, P.J.; Curry, J.A. Impact of shifting patterns of Pacific Ocean warming on North Atlantic tropical cyclones. Science 2009, 325, 77–80. [Google Scholar] [CrossRef]
  9. Wang, C.; Deser, C.; Yu, J.-Y.; DiNezio, P.; Clement, A. El Niño and Southern Oscillation (ENSO): A Review. In Coral Reefs of the Eastern Tropical Pacific; Coral Reefs of the World; Springer: Berlin/Heidelberg, Germany, 2017; pp. 85–106. [Google Scholar]
  10. Alexander, M.A.; Bladé, I.; Newman, M.; Lanzante, J.R.; Lau, N.-C.; Scott, J.D. The atmospheric bridge: The influence of ENSO teleconnections on air–sea interaction over the global oceans. J. Clim. 2002, 15, 2205–2231. [Google Scholar] [CrossRef]
  11. Jiang, T.; Kundzewicz, Z.W.; Su, B. Changes in monthly precipitation and flood hazard in the Yangtze River Basin, China. Int. J. Climatol. A J. R. Meteorol. Soc. 2008, 28, 1471–1481. [Google Scholar] [CrossRef]
  12. Changnon, S.A. Impacts of 1997–98 EI Niño–generated weather in the United States. Bull. Am. Meteorol. Soc. 1999, 80, 1819–1828. [Google Scholar] [CrossRef]
  13. Alizadeh-Choobari, O. Contrasting global teleconnection features of the eastern Pacific and central Pacific El Niño events. Dyn. Atmos. Ocean. 2017, 80, 139–154. [Google Scholar] [CrossRef]
  14. Shin, N.Y.; Kug, J.-S.; Stuecker, M.F.; Jin, F.F.; Timmermann, A.; Kim, G.-I. More frequent central Pacific El Niño and stronger eastern pacific El Niño in a warmer climate. NPJ Clim. Atmos. Sci. 2022, 5, 101. [Google Scholar] [CrossRef]
  15. Ashok, K.; Behera, S.K.; Rao, S.A.; Weng, H.; Yamagata, T. El Niño Modoki and its possible teleconnection. J. Geophys. Res. 2007, 112, C11007. [Google Scholar] [CrossRef]
  16. Yu, J.Y.; Kao, H.Y. Contrasting Eastern-Pacific and Central-Pacific Types of ENSO. J. Clim. 2009, 22, 615–632. [Google Scholar] [CrossRef]
  17. Kim, S.T.; Yu, J.-Y. Reversed Spatial Asymmetries between El Niño and La Niña and Their Linkage to Decadal ENSO Modulation in CMIP3 Models. J. Clim. 2011, 24, 5423–5434. [Google Scholar] [CrossRef]
  18. Larkin, N.K.; Harrison, D. Global seasonal temperature and precipitation anomalies during El Niño autumn and winter. Geophys. Res. Lett. 2005, 32. [Google Scholar] [CrossRef]
  19. Jia, L.; Guo, Y. Revisiting the differential impacts of Eastern-Pacific and Central-Pacific El Niño on late autumn to winter precipitation over South China. Dyn. Atmos. Ocean. 2025, 110, 101557. [Google Scholar] [CrossRef]
  20. Yu, J.Y.; Zou, Y.h.; Kim, S.T.; Lee, T. The changing impact of El Niño on US winter temperatures. Geophys. Res. Lett. 2012, 39, L15702. [Google Scholar] [CrossRef]
  21. Schopf, P.S.; Suarez, M.J. Vacillations in a Coupled Ocean–Atmosphere Model. J. Atmos. Sci. 1988, 45, 549–566. [Google Scholar] [CrossRef]
  22. Jin, F.-F. An equatorial ocean recharge paradigm for ENSO. Part II: A stripped-down coupled model. J. Atmos. Sci. 1997, 54, 830–847. [Google Scholar] [CrossRef]
  23. Weisberg, R.H.; Wang, C. A western Pacific oscillator paradigm for the El Niño-Southern Oscillation. Geophys. Res. Lett. 1997, 24, 779–782. [Google Scholar] [CrossRef]
  24. Picaut, J.; Masia, F.; du Penhoat, Y. An advective-reflective conceptual model for the oscillatory nature of the ENSO. Science 1997, 277, 663–666. [Google Scholar] [CrossRef]
  25. Battisti, D.S.; Hirst, A.C. Interannual Variability in a Tropical Atmosphere–Ocean Model: Influence of the Basic State, Ocean Geometry and Nonlinearity. J. Atmos. Sci. 1989, 46, 1687–1712. [Google Scholar] [CrossRef]
  26. Jin, F.F. An equatorial ocean recharge paradigm for ENSO. Part I: Conceptual model. J. Atmos. Sci. 1997, 54, 811–829. [Google Scholar] [CrossRef]
  27. Wang, C.Z.; Weisberg, R.H.; Virmani, J.I. Western Pacific interannual variability associated with the El Niño-Southern Oscillation. J. Geophys. Res. Ocean. 1999, 104, 5131–5149. [Google Scholar] [CrossRef]
  28. Yeh, S.W.; Kug, J.S.; Dewitte, B.; Kwon, M.H.; Kirtman, B.P.; Jin, F.-F. El Niño in a changing climate. Nature 2009, 461, 511–514. [Google Scholar] [CrossRef]
  29. Xiang, B.Q.; Wang, B.; Li, T. A new paradigm for the predominance of standing central Pacific warming after the late 1990s. Clim. Dyn. 2013, 41, 327–340. [Google Scholar] [CrossRef]
  30. Yu, J.-Y.; Kao, H.-Y.; Lee, T. Subtropics-related interannual sea surface temperature variability in the central equatorial Pacific. J. Clim. 2010, 23, 2869–2884. [Google Scholar] [CrossRef]
  31. Vimont, D.J.; Alexander, M.; Fontaine, A. Midlatitude excitation of tropical variability in the Pacific: The role of thermodynamic coupling and seasonality. J. Clim. 2009, 22, 518–534. [Google Scholar] [CrossRef]
  32. Vimont, D.J.; Wallace, J.M.; Battisti, D.S. The seasonal footprinting mechanism in the Pacific: Implications for ENSO. J. Clim. 2003, 16, 2668–2675. [Google Scholar] [CrossRef]
  33. Vimont, D.J.; Battisti, D.S.; Hirst, A.C. Footprinting: A seasonal connection between the tropics and mid-latitudes. Geophys. Res. Lett. 2001, 28, 3923–3926. [Google Scholar] [CrossRef]
  34. Cai, W.; Borlace, S.; Lengaigne, M.; Van Rensch, P.; Collins, M.; Vecchi, G.; Timmermann, A.; Santoso, A.; McPhaden, M.J.; Wu, L. Increasing frequency of extreme El Niño events due to greenhouse warming. Nat. Clim. Change 2014, 4, 111–116. [Google Scholar] [CrossRef]
  35. Gan, R.Y.; Liu, Q.; Huang, G.; Hu, K.M.; Li, X.C. Greenhouse warming and internal variability increase extreme and central Pacific El Niño frequency since 1980. Nat. Commun. 2023, 14, 394. [Google Scholar] [CrossRef] [PubMed]
  36. Chen, M.Y.; Yu, J.Y.; Wang, X.; Chen, S. Distinct onset mechanisms of two subtypes of CP El Niño and their changes in future warming. Geophys. Res. Lett. 2021, 48, e2021GL093707. [Google Scholar] [CrossRef]
  37. Ng, B.; Cai, W.; Cowan, T.; Bi, D. Impacts of low-frequency internal climate variability and greenhouse warming on El Niño–Southern Oscillation. J. Clim. 2021, 34, 2205–2218. [Google Scholar] [CrossRef]
  38. Freund, M.B.; Henley, B.J.; Karoly, D.J.; McGregor, H.V.; Abram, N.J.; Dommenget, D. Higher frequency of Central Pacific El Niño events in recent decades relative to past centuries. Nat. Geosci. 2019, 12, 450–455. [Google Scholar] [CrossRef]
  39. Solomon, S.; Rosenlof, K.H.; Portmann, R.W.; Daniel, J.S.; Davis, S.M.; Sanford, T.J.; Plattner, G.-K. Contributions of stratospheric water vapor to decadal changes in the rate of global warming. Science 2010, 327, 1219–1223. [Google Scholar] [CrossRef]
  40. Lee, T.; McPhaden, M.J. Increasing intensity of El Niño in the central-equatorial Pacific. Geophys. Res. Lett. 2010, 37, L14603. [Google Scholar] [CrossRef]
  41. Chung, P.H.; Li, T. Interdecadal relationship between the mean state and El Niño types. J. Clim. 2013, 26, 361–379. [Google Scholar] [CrossRef]
  42. Barnston, A.G.; Chelliah, M.; Goldenberg, S.B. Documentation of a highly ENSO-related SST region in the equatorial Pacific. Atmos.-Ocean (Can. Meteorol. Oceanogr. Soc.) 1997, 35, 367. [Google Scholar] [CrossRef]
  43. Takahashi, K.; Montecinos, A.; Goubanova, K.; Dewitte, B. ENSO regimes: Reinterpreting the canonical and Modoki El Niño. Geophys. Res. Lett. 2011, 38, L10704. [Google Scholar] [CrossRef]
  44. Ren, H.L.; Jin, F.F. Niño indices for two types of ENSO. Geophys. Res. Lett. 2011, 38, L04704. [Google Scholar] [CrossRef]
  45. Huang, B.Y.; Thorne, P.W.; Banzon, V.F.; Boyer, T.; Chepurin, G.; Lawrimore, J.H.; Menne, M.J.; Smith, T.M.; Vose, R.S.; Zhang, H.-M. Extended reconstructed sea surface temperature, version 5 (ERSSTv5): Upgrades, validations, and intercomparisons. J. Clim. 2017, 30, 8179–8205. [Google Scholar] [CrossRef]
  46. Rayner, N.A.; Parker, D.E.; Horton, E.; Folland, C.K.; Alexander, L.V.; Rowell, D.; Kent, E.C.; Kaplan, A. Global analyses of sea surface temperature, sea ice, and night marine air temperature since the late nineteenth century. J. Geophys. Res. Atmos. 2003, 108, 4407. [Google Scholar] [CrossRef]
  47. Marshall, J.; Adcroft, A.; Hill, C.; Perelman, L.; Heisey, C. A finite-volume, incompressible Navier Stokes model for studies of the ocean on parallel computers. J. Geophys. Res. Ocean. 1997, 102, 5753–5766. [Google Scholar] [CrossRef]
  48. Kalnay, E. The NCEP/NCAR 40-yr reanalysis project. Bull. Am. Meteorol. Soc. 1996, 77, 431–477. [Google Scholar] [CrossRef]
  49. Larkin, N.K. On the definition of El Niño and associated seasonal average U.S. weather anomalies. Geophys. Res. Lett. 2005, 32, L13705. [Google Scholar] [CrossRef]
  50. Mallakpour, I.; Villarini, G. A simulation study to examine the sensitivity of the Pettitt test to detect abrupt changes in mean. Hydrol. Sci. J. 2016, 61, 245–254. [Google Scholar] [CrossRef]
  51. Das, P.K.; Chandra, S.; Das, D.K.; Midya, S.K.; Paul, A.; Bandyopadhyay, S.; Dadhwal, V.K. Understanding the interactions between meteorological and soil moisture drought over Indian region. J. Earth Syst. Sci. 2020, 129, 197. [Google Scholar] [CrossRef]
  52. Pyper, B.J.; Peterman, R.M. Comparison of methods to account for autocorrelation in correlation analyses of fish data. Can. J. Fish. Aquat. Sci. 1998, 55, 2127–2140. [Google Scholar] [CrossRef]
  53. Qu, T. Mixed layer heat balance in the western North Pacific. J. Geophys. Res. Ocean. 2003, 108. [Google Scholar] [CrossRef]
  54. Bond, N.A.; Cronin, M.F.; Freeland, H.; Mantua, N. Causes and impacts of the 2014 warm anomaly in the NE Pacific. Geophys. Res. Lett. 2015, 42, 3414–3420. [Google Scholar] [CrossRef]
  55. Kara, A.B.; Rochford, P.A.; Hurlburt, H.E. Mixed layer depth variability over the global ocean. J. Geophys. Res. Ocean. 2003, 108. [Google Scholar] [CrossRef]
  56. de Boyer Montégut, C.; Madec, G.; Fischer, A.S.; Lazar, A.; Iudicone, D. Mixed layer depth over the global ocean: An examination of profile data and a profile-based climatology. J. Geophys. Res. Ocean. 2004, 109. [Google Scholar] [CrossRef]
  57. Su, J.Z.; Li, T.; Zhang, R.H. The initiation and developing mechanisms of central Pacific El Niños. J. Clim. 2014, 27, 4473–4485. [Google Scholar] [CrossRef]
  58. Feng, J.; Chen, W.; Tam, C.; Zhou, W. Different impacts of El Niño and El Niño Modoki on China rainfall in the decaying phases. Int. J. Climatol. 2011, 31, 2091–2101. [Google Scholar] [CrossRef]
  59. Kousky, V.E. The global climate of December 1991–February 1992: Mature-phase warm (ENSO) episode conditions develop. J. Clim. 1993, 6, 1639–1655. [Google Scholar] [CrossRef]
  60. Iwakiri, T.; Watanabe, M. Multiyear La Niña impact on summer temperature over Japan. J. Meteorol. Soc. Jpn. Ser. II 2020, 98, 1245–1260. [Google Scholar] [CrossRef]
  61. Woolway, R.I.; Sharma, S.; Weyhenmeyer, G.A.; Debolskiy, A.; Golub, M.; Mercado-Bettín, D.; Perroud, M.; Stepanenko, V.; Tan, Z.; Grant, L. Phenological shifts in lake stratification under climate change. Nat. Commun. 2021, 12, 2318. [Google Scholar] [CrossRef]
  62. L’Heureux, M.L.; Takahashi, K.; Watkins, A.B.; Barnston, A.G.; Becker, E.J.; Di Liberto, T.E.; Gamble, F.; Gottschalck, J.; Halpert, M.S.; Huang, B. Observing and predicting the 2015/16 El Niño. Bull. Am. Meteorol. Soc. 2017, 98, 1363–1382. [Google Scholar] [CrossRef]
Figure 1. Statistical analysis and Pettitt test of the frequency of CP El Niño events. (a) The number of CP El Niño events; (b) Pettitt test for the number of CP El Niño events, where the solid line denotes the test statistic, the black dashed line indicates the detected change point, and the red dashed line represents the 95% confidence level.
Atmosphere 16 00654 g001
Figure 2. The time series and power spectrum analysis of the Merged CP index. (a) The time series of the Merged CP index from 1960 to 2022. The blue dashed line represents the year 2000; (b) Power spectrum analysis of the Merged CP index in 1960–1999. The blue solid line represents the power spectrum, and the red dashed line offers a 99% significance level; (c) Same as (b), but during 2000–2022.
Atmosphere 16 00654 g002
Figure 3. Composite of SST anomalies during the onset, developing, and mature phases of the CP El Niño event (1960–2022). (a,b) Composite of SST anomalies during the onset phase (February to June) of the CP El Niño event. The black box represents the key region, which extends from 5° S to 5° N, 170° W to 122° W; (c,d) Same as (a,b), but for the developing phase (June to October); (e,f) Same as (a,b), but for the mature phase (October to February of the following year). Color shading highlights significant SST anomalies that exceed the 95% confidence level.
Atmosphere 16 00654 g003
Figure 4. Regional mean SST anomalies in the key region for CP El Niño and the Merged CP index during the developing phase. (a) The time series of regional mean SST anomalies in the key region for CP El Niño during the developing phase. (b) The time series of the Merged CP index during the developing phase. The black dashed line indicates the zero line (y = 0). (c) Lead–lag correlation analysis between the time series of regional mean SST anomalies in the key region for CP El Niño and the Merged CP index during the developing phase. The grey dashed lines represent the 99% confidence levels.
Atmosphere 16 00654 g004
Figure 5. Regional mean SST anomalies and wavelet power spectrum in the key region for CP El Niño during the developing phase. (a) The time series of regional mean SST anomalies in the key region for CP El Niño during the developing phase. Red shading denotes warm SST anomalies, blue shading denotes cold SST anomalies, and the blue dashed line marks the year 2000; (b) Wavelet power spectrum of regional mean SST anomalies in the key region for CP El Niño during the developing phase (color shading). The solid contour lines denote the 95% significance level, The dashed contour line indicates the cone of influence.
Atmosphere 16 00654 g005
Figure 6. Time series of regional mean SST anomalies in the key region during the developing phase, based on HadISST (yellow) and ECCO2 (blue) datasets, along with the upper 70 m layer regional mean temperature from ECCO2 (red).
Atmosphere 16 00654 g006
Figure 7. The heat budget analysis of the upper 70 m layer in the key region based on the ECCO2 model output between 1992 and 2022. (a) The monthly depth-averaged regional mean temperature tendency term. (b) The surface thermal forcing term, (c) the zonal temperature advection term, (d) the meridional temperature advection term, (e) the vertical entrainment term, and (f) the residual term.
Atmosphere 16 00654 g007
Figure 8. Time series of regional mean zonal advection and SST anomalies in the key region and Merged CP index during the developing phase. (a) The zonal temperature advection term from the heat budget analysis of the upper 70 m layer in the key region, based on ECCO2 model output from 1992 to 2022; (b) The time series of regional mean SST anomalies in the key region for CP El Niño during the developing phase; (c) The time series of the Merged CP index during the developing phase. The black dashed line marks the year 2000.
Atmosphere 16 00654 g008
Figure 9. Statistical analysis and Pettitt test of the frequency of EP El Niño events. (a) The number of EP El Niño events; (b) Pettitt test for the number of EP El Niño events, where the solid line denotes the test statistic, the black dashed line indicates the detected change point, and the red dashed line represents the 95% confidence level.
Atmosphere 16 00654 g009
Table 1. All the CP and EP El Niño events between 1960 and 2022, as identified by the Merged EP/CP-index method (see Section 2.2 Methods).
CP El Niño EventsEP El Niño Events
Years1963–1964; 1965–1966; 1968–1969; 1969–1970;
1977–1978; 1979–1980; 1987–1988; 1994–1995;
2002–2003; 2004–2005; 2006–2007; 2009–2010;
2014–2015; 2018–2019
1972–1973; 1976–1977;
1982–1983; 1986–1987;
1991–1992; 1997–1998;
2015–2016
Disclaimer/Publisher’s Note: The statements, opinions and data contained in all publications are solely those of the individual author(s) and contributor(s) and not of MDPI and/or the editor(s). MDPI and/or the editor(s) disclaim responsibility for any injury to people or property resulting from any ideas, methods, instructions or products referred to in the content.

