Article

The Interannual Cyclicity of Precipitation in Xinjiang During the Past 70 Years and Its Contributing Factors

1
School of Geographic and Environmental Sciences, Tianjin Normal University, Tianjin 300387, China
2
Tianjin Key Laboratory of Water Resources and Environment, Tianjin Normal University, Tianjin 300387, China
3
Institute of Global Environmental Change, Xi’an Jiaotong University, Xi’an 710049, China
4
State Key Laboratory of Loess Science, Institute of Earth Environment, Chinese Academy of Sciences, Xi’an 710061, China
*
Author to whom correspondence should be addressed.
Atmosphere 2025, 16(5), 629; https://doi.org/10.3390/atmos16050629
Submission received: 23 March 2025 / Revised: 9 May 2025 / Accepted: 16 May 2025 / Published: 21 May 2025
(This article belongs to the Special Issue Desert Climate and Environmental Change: From Past to Present)

Abstract

:
Precipitation cyclicity plays a crucial role in regional water supply and climate predictions. In this study, we used observational data from 34 representative meteorological stations in the Xinjiang region, a major part of inland arid China, to characterize the interannual cyclicity of regional precipitation from 1951 to 2021 and analyze its contributing factors. The results indicated that the mean annual precipitation in Xinjiang (MAP_XJ) was dominated by a remarkably increasing trend over the past 70 years, which was superimposed by two bands of interannual cycles of approximately 3 years with explanatory variance of 56.57% (Band I) and 6–7 years with explanatory variance of 23.38% (Band II). This is generally consistent with previous studies on the cyclicity of precipitation in Xinjiang for both seasonal and annual precipitation. We analyzed the North Tropical Atlantic sea-surface temperature (NTASST), El Niño-Southern Oscillation (ENSO), North Atlantic Oscillation (NAO), Arctic Oscillation (AO), and Indian Summer Monsoon (ISM) as potential forcing factors that show similar interannual cycles and may contribute to the identified precipitation variability. Two approaches, multivariate linear regression and the Random Forest model, were employed to ascertain the relative significance of each factor influencing Bands I and II, respectively. The multivariate linear regression analysis revealed that the AO index contributed the most to Band I, with a significance score of −0.656, whereas the ENSO index with a one-year lead (ENSO−1yr) played a dominant role in Band II (significance score = 0.457). The Random Forest model also suggested that the AO index exhibited the highest significance score (0.859) for Band I, whereas the AO index with a one-year lead (AO−1yr) had the highest significance score (0.876) for Band II. Overall, our findings highlight the necessity of employing different methods that consider both the linear and non-linear response of climate variability to driving factors crucial for future climate prediction.

1. Introduction

Cyclic changes in meteorological precipitation play an important role in regulating regional climate, hydrological cycles, and water resources. Moreover, regional hydroclimate cycles may have significantly influenced human living environments and the rise and fall of prehistoric cultures and ancient civilizations [1,2]. Therefore, a fuller understanding of the dominant cycles of regional precipitation and their influencing factors is not only conducive to revealing the natural climate dynamics but also offers a crucial reference for hydroclimatic forecasting. During the past several decades, the cyclic evolution of regional precipitation/hydroclimate over various timescales, from seasonal to orbital, has been at the forefront of research in the field of climate and environmental changes. For example, the dominant cycle of the Asian monsoon at orbital scales has sparked widespread interest and discussion, with 20,000-year precessional cycles and 100,000-year ice-volume cycles reflected in various geological proxy records [3,4,5,6]. Understanding of the relevant control mechanisms has also gradually deepened. During the Holocene, the dominant centennial-scale cycles of regional hydroclimates and their internal and external forcings have received widespread attention [7,8,9,10,11,12]. Possible connections between periodic changes in precipitation with human culture and/or civilization evolution are also of interest [1,13]. In addition, analyses conducted using observed data from meteorological stations indicate that interannual to multi-decadal precipitation trends and periodic cycles provide a foundation for understanding the characteristics of regional climate change during the instrumental period [14,15,16,17,18,19]. In summary, a large amount of work has been undertaken on the dominant cycles of precipitation evolution in different regions across various timescales, as well as their internal and external forcings. Despite this progress, the driving factors and relative significance of precipitation cycles in arid and semi-arid Asian regions remain unclear and require more in-depth investigation.
The arid Xinjiang region, located in northwestern China, is primarily influenced by mid-latitude westerly circulation [20,21,22]. Overall, the climate in the Xinjiang region is arid and the ecological environment is fragile. Meteorological precipitation not only influences the climate of this region but also provides water resources for oasis agriculture. Studies have shown that, in the past few decades, against the background of global warming, precipitation in the Xinjiang region has shown a multi-timescale periodicity [14,19,23,24,25,26,27,28,29]. For example, at an interannual scale, there is a general 2–3 year and 5–6 year cycle [19]. Regionally, the North Xinjiang region is mainly characterized by 3-, 6-, 8-, 11-, and 18-year cycles; the Tianshan Mountain area by 6- and 10-year cycles; and the South Xinjiang region by 5-, 8-, and 18-year cycles [24]. It is noteworthy that different studies show deviations in these cycles owing to differences in data sources and methods.
Previous studies have identified factors such as the El Niño-Southern Oscillation (ENSO), Arctic Oscillation (AO), and Indian Summer Monsoon (ISM) as potential influences on the multi-year cyclicity of precipitation in the Xinjiang region [30,31,32,33,34]. For example, the 2–7 year ENSO cycle may lead to high-frequency oscillations of the 3- and 6-year quasi-periods [31,32]; the Arctic Oscillation (AO) affects snowfall by modulating extreme temperatures, thereby influencing interdecadal precipitation changes [33,34]; and the ISM and ENSO regulate the differences in precipitation on the southern and northern slopes of the Tianshan Mountains on the interdecadal scale [30], further highlighting the complexity of multi-factor forcing. However, the relative influence of different forcings, such as sea-surface temperature (SST), on the periodicity of factors remain unclear.
In this study, we analyze the dominant cycles and potential factors influencing mean annual precipitation in the Xinjiang region over the past 70 years based on observation data from 34 representative meteorological stations. We compared the cycles in a time series of the mean annual precipitation in Xinjiang (MAP_XJ) along with indices of the North Tropical Atlantic SST (NTASST), ENSO, NAO, AO, and ISM. Given their similar cycles, two bands of variation were selected for band-pass filtering and cross-correlation analysis, which served as the basis for determining the relative significance of different factors based on multiple linear regression and Random Forest models. Our results provide a reference for interannual precipitation changes in Xinjiang and the relative significance of different oceanic and atmospheric processes in climate projections.

2. Data and Methods

Based on the spatial distribution of meteorological stations in Xinjiang, we selected 34 representative stations that ensured a relatively uniform geographical distribution across the region and accounted for the availability of long-term continuous observation records. The selected stations encompass diverse topographies and climatic zones, effectively representing the natural geographical, climatic, and environmental characteristics of Xinjiang. These stations provide spatially and temporally consistent observational data suitable for analyzing precipitation variability over the past seven decades (1951–2021). Figure 1 illustrates the geographical distribution of the 34 meteorological stations. Detailed station metadata, including geographical coordinates (longitude/latitude), elevation, and specific observation periods, are also provided in Supplementary Material Table S1.
The long-term trend in precipitation was removed using high-pass filtering, and residual values were calculated and normalized (z-score) using OriginPro. The REDFIT power spectrum periodic calculation of the precipitation series was completed in PAST4.0 software, and the cyclicity of the precipitation series was verified through continuous wavelet transform (completed in OriginPro). The precipitation time series was also decomposed using the Ensemble Empirical Mode Decomposition (EEMD) method using the Matlab R2022b platform to verify cyclicity and investigate the contributions of various periodic components from interannual to multi-decadal timescales. The EEMD method can effectively extract signals and trends of different scales in time series and has been widely applied in climate change research [39,40,41,42]. Then, we conducted a power spectrum analysis on the five factors: NTASST, ENSO, NAO, AO, and ISM (completed in PAST4.0). Based on the results of the power spectrum analysis, we performed band-pass filtering on Xinjiang’s precipitation and the five factors (NTASST, ENSO, NAO, AO, and ISM) with period ranges of 2.5–3.5 and 5–8 years (in OriginPro) and then conducted cross-correlation analysis using PAST4.0 software.
To determine the significance scores of the impacts of NTASST, NAO, AO, ENSO−1yr, and ISM−1yr on the interannual precipitation variability in Xinjiang, a comparative analysis was undertaken using two methodologies. First, a multiple linear regression analysis was conducted using SPSS Statistics 27 and, second, Random Forest regression modeling was implemented in MATLAB R2022b. The regression model was constructed with an ensemble of 100 decision trees (numTrees = 100), where the complexity was regulated by setting the minimum leaf size to 5 (minleaf = 5). Model validation incorporated both out-of-bag (OOB) error estimation and independent test set evaluation. Additionally, feature importance was assessed using OOB predictor importance. Finally, we validated the use of NTASST, NAO, AO, ENSO, and ISM for cyclical predictions using both methods.

3. Results

Interannual cycles of precipitation in Xinjiang over the past 70 years were demonstrated and cross-verified using three methods. To accurately depict the cyclicity, we performed high-pass filtering at a 1/50−1 year frequency to remove long-term trends. The normalized (z-score) time series was then used to calculate the REDFIT power spectrum (Figure 2a) and continuous wavelet transform (Figure 2b). As shown in Figure 2, the confidence levels of the 3- and 6-year cycles in the precipitation sequence exceeded 99%, whereas the confidence level of the 7-year cycle exceeded 90%. This indicates that the precipitation time series is characterized by distinct interannual cycles over the past 70 years.
To further verify the cyclicity of precipitation in Xinjiang and investigate the contributions of different periodic components across various timescales, the original time series was decomposed using the EEMD method (Figure 2c). The results of the EEMD component extraction (Figure 2c) show that Intrinsic Mode Function (IMF) 1 (56.57%) and IMF 2 (23.38%) contributed the most to the total variance (79.95%). This indicates that the 3-year (IMF 1) and 7-year (IMF 2) cycles dominate the interannual oscillations of the Xinjiang precipitation time series, which supports the results of the REDFIT power spectrum and continuous wavelet transformation.
The dominant 3–7 year cycles are a common signal in the variability of precipitation in the Xinjiang region and arid Central Asia [14,19,23,24,26]. For example, Xie et al. [26], based on the calculation of daily precipitation data in the Xinjiang region from 1961 to 2015, also found that the changes in the Standardized Precipitation Index (SPI) of drought had a main cycle of 8 years and sub-main cycles of 4 and 16 years. Wang et al. [14] recently analyzed daily precipitation data from 1961 to 2018 and found that in the northwestern region of China, a relatively stable quasi-3-year cycle exists. Zhang et al. [23] analyzed daily precipitation and temperature data from 1961 to 2008 in Xinjiang and indicated that the annual average precipitation is characterized by quasi-2-year and quasi-6-year cycles; summer precipitation shows quasi-3-year and quasi-5-year cycles; and winter precipitation shows a quasi-3-year cycle. Thus, the 3–7-year cycles of precipitation in Xinjiang over the past 70 years are generally supported by previous studies, implying a common signal for the entire arid Central Asian region that is worthy of further investigation.

4. Discussion

4.1. Potential Factors Influencing Precipitation Changes in Xinjiang

Although previous studies have shown that climate change in arid Central Asia is mainly influenced by mid-latitude westerly circulation, precipitation changes in the Xinjiang region are closely linked to SSTs and atmospheric processes in both high- and low-latitude regions [20,22,35,43,44,45,46,47,48,49,50,51]. Generally, the North Atlantic Ocean acts as an important source of water vapor for mid-latitude arid Central Asia, and its thermal changes can affect the weather and climate of Xinjiang through mid-latitude westerly circulation at various timescales [20,21,35,52,53,54]. The increase in the North Atlantic SST (NASST) leads to an increase in evaporation, which, in turn, increases the moisture supply during warm seasons along the westerlies, thus increasing precipitation in the Xinjiang region. Conversely, when the NASST decreases, the precipitation in Xinjiang decreases [35,55,56]. The NTASST index shows 3–3.5- and 8-year cycles (Figure 3b), which are similar to the 3-year and 6–7-year cycles we identified in the Xinjiang precipitation sequence.
Previous studies have also indicated that changes in the NAO and AO are closely related to precipitation variability in Xinjiang [27,57,58,59,60,61]. The NAO redistributes atmospheric mass between the Arctic and subtropical Atlantic, leading to substantial shifts in surface air temperature, wind patterns, storm activity, and precipitation across the Atlantic and surrounding continents [62]. Huang et al. [61] noted that a negative NAO phase can generate negative height anomalies in northern Central Asia while inducing positive anomalies to the south, resulting in an increased pressure gradient and enhanced westerly winds that deliver more water vapor to arid Central Asia during winter. Dai et al. [27] concluded that during extreme negative NAO years, moisture transport from southern Europe and transient vorticity enhances atmospheric precipitable water in Central Asia, promoting a more westerly flow of cold air. This synergy between the southwest moisture transport and transient weather systems boosts moisture convergence, thereby increasing precipitation in Xinjiang. Conversely, weaker westerly moisture transport can lead to reduced weather activity and lower precipitation, potentially causing droughts. In summer, the strength of the NAO influences the East Asian-Pacific (EAP) teleconnection pattern over the Scandinavian Peninsula, altering quasi-stationary wave patterns and, subsequently, affecting summer precipitation in Xinjiang [58]. The NAO index has a 2-year cycle (Figure 3d), which is similar to the 3-year cycle of the Xinjiang precipitation series.
The AO, a key mode of winter sea-level pressure in the Northern Hemisphere, characterizes the mid-latitude westerly intensity and position, reflecting the atmospheric circulation state in these regions [63]. The AO index correlates well with winter and summer precipitation on a quasi-3-year scale. In northern Xinjiang, winter precipitation was significantly correlated with AO changes at various timescales, with a lag of 0.5–1 year [60]. During weak AO years, colder middle to upper tropospheric conditions create anomalous cyclonic circulation at 200 hPa over Western and Central Asia, enhancing mid-latitude westerly winds and shifting the Western Asian subtropical jet southward. This anomalous southwesterly flow facilitates the influx of warm moist air from low latitudes into Central Asia and northern Xinjiang, resulting in increased rainfall [57]. Conversely, strong AO conditions are correlated with reduced precipitation in Xinjiang, whereas weaker AO phases are associated with increased precipitation [59]. In Figure 3e, the AO index shows 3- and 3.6-year cycles, with the 3-year cycle being identical to that of Xinjiang precipitation.
Many studies have also shown significant connections between hydroclimate change in Xinjiang, arid Central Asia, and low-latitude ocean–atmospheric systems [43,45,46,47,48,49,50,51]. Equatorial East Pacific SST anomalies and their coupling process with the atmospheric Hadley circulation, ENSO, are the most significant interannual scale climate change signals on the Earth’s surface [64,65,66,67,68] and are one of the key factors driving Asian monsoon climate change [69,70,71]. For example, a study by Jin and Tao [71] on the SST data for the Niño 3 region in the eastern Pacific showed that during the development years of ENSO, eastern China experiences less rainfall in summer, while during the recovery years, the Yangtze River and southern China regions experience more rainfall, with less rainfall on both sides. Similarly, the climates of northwestern China and arid Central Asia are also regulated and influenced by ENSO [43,45,48,49]. For instance, Wei and Chen [43] revealed that the rainy season in northern Xinjiang (April to July) responds significantly to ENSO indices, including the SST of the Eastern Pacific and the Southern Oscillation Index (SOI). Chen et al. [49] also pointed out the significant impact of the ENSO cycle on autumn, winter, and spring precipitation in Central Asia (including Xinjiang) and compared the contribution of moisture from the Indian Ocean and the North Atlantic to Central Asian precipitation during El Niño occurrence. Li and Zhao [72] also found that El Niño has an impact on precipitation in northwestern China during both the current and following years. All of this research demonstrates a close relationship between ENSO and precipitation changes in the Xinjiang region. As the instrumental data suggest that ENSO has a dominant cycle ranging from 3 to 8 years [73], we conducted a power spectrum calculation on the ENSO index series (Figure 3c), revealing 3.5-, 5-, and 11.8-year cycles; the 3.5- and 5-year cycles are analogous to the 3- and 6-year cycles of the Xinjiang precipitation sequence.
As a crucial component of the Asian monsoon system, the ISM significantly influences precipitation in Xinjiang through energy exchange and water vapor transport between the ocean and atmosphere over various timescales [46,47,50,51,74]. One of the pathways for water vapor transport by the ISM, which originates in the Arabian Sea, is responsible for moisture delivery to northwest China [75,76]. When this moisture traverses the southern slopes of the Kunlun Mountains, it generates considerable clouds and precipitation. Once it enters northern Xinjiang, this air current transforms into a descending current, reducing the likelihood of cloud formation and precipitation [77]. Moreover, recent studies have suggested that an anomalous weakness in the ISM triggers the northward transport of moisture from the Indian Ocean, thereby increasing precipitation in the Tarim Basin and northwest China [47,50,51]. This relationship between the ISM and Xinjiang precipitation is further supported by the similarity in their dominant cycles. For instance, the ISM index, as represented by all-India summer monsoon rainfall, exhibits 3- and 7.5-year cycles (Figure 3f) similar to the 3- and 6–7-year cycles of precipitation in Xinjiang.

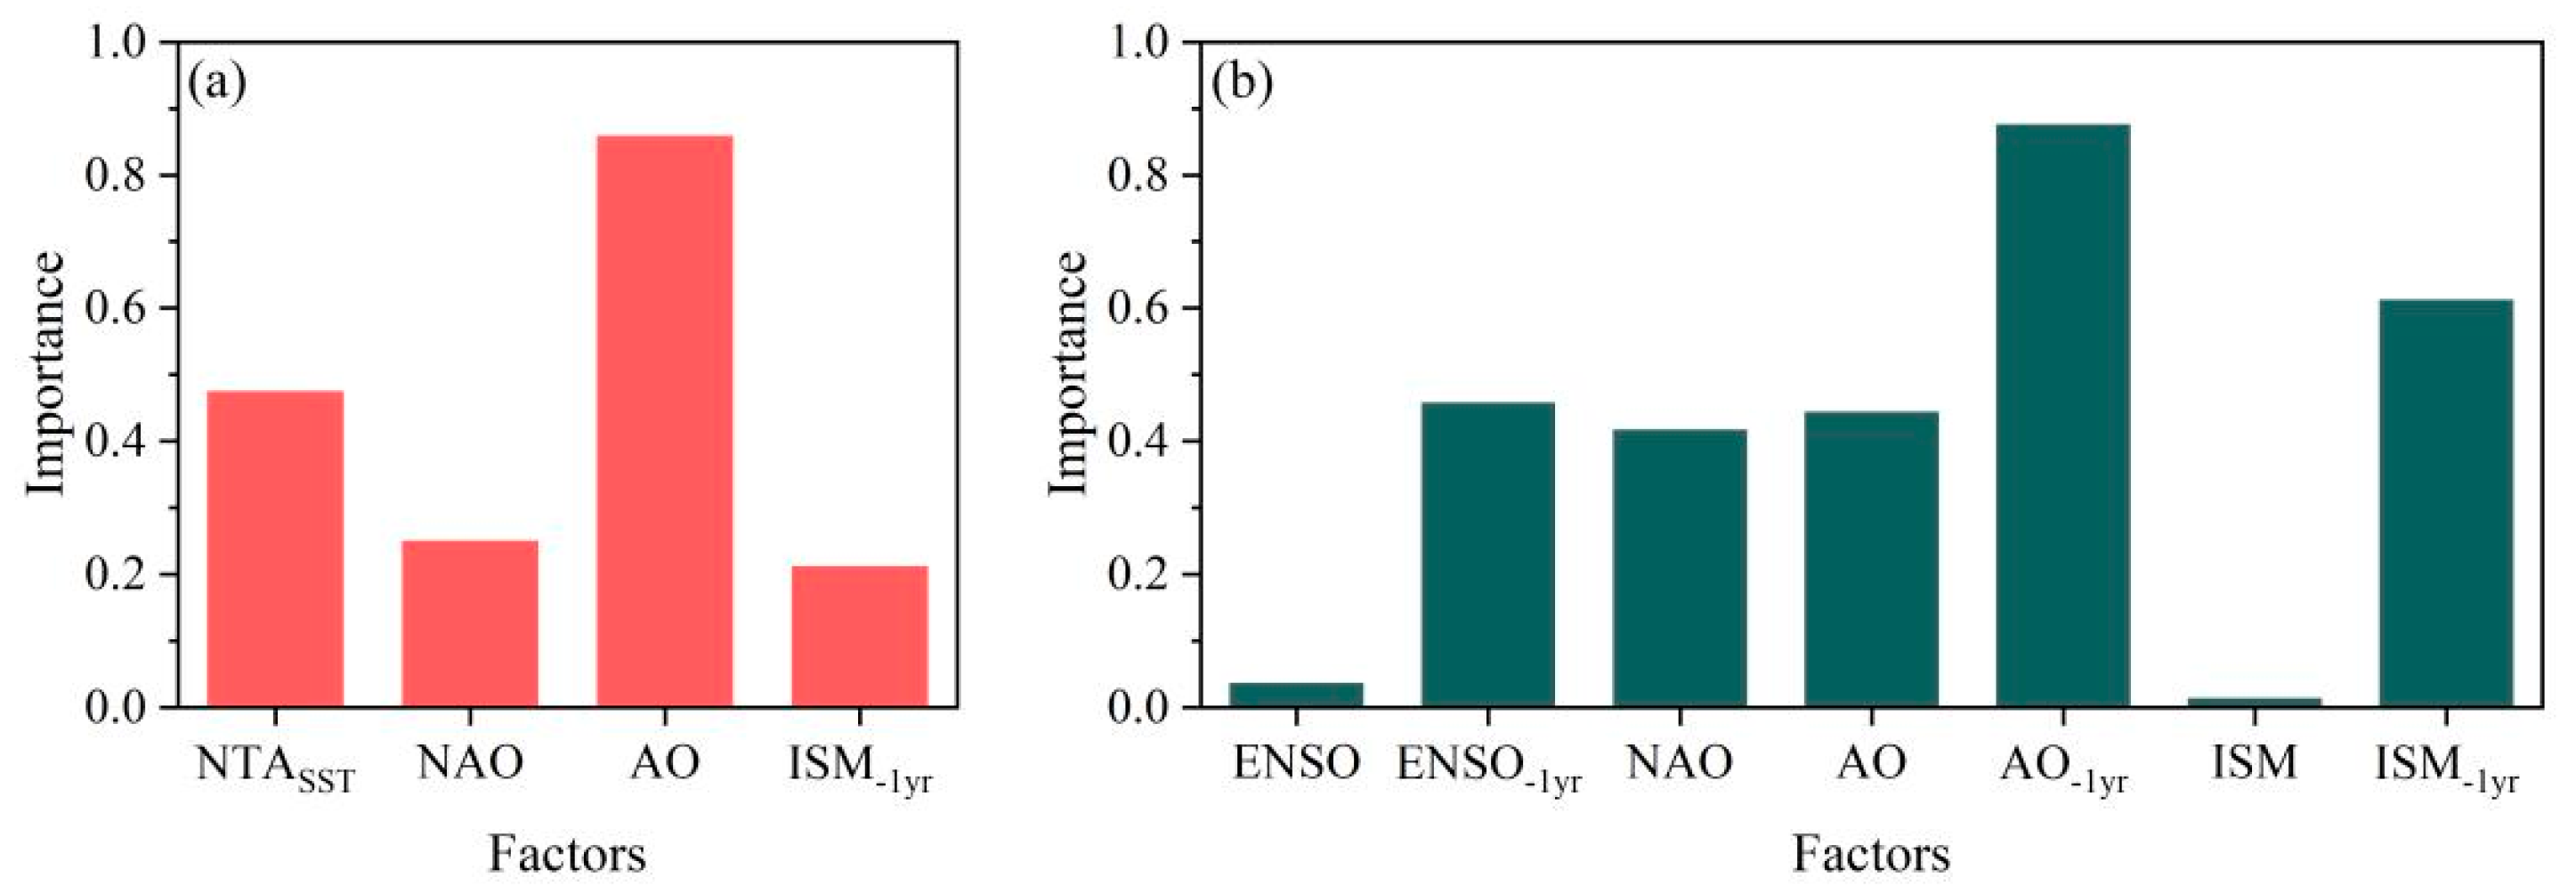
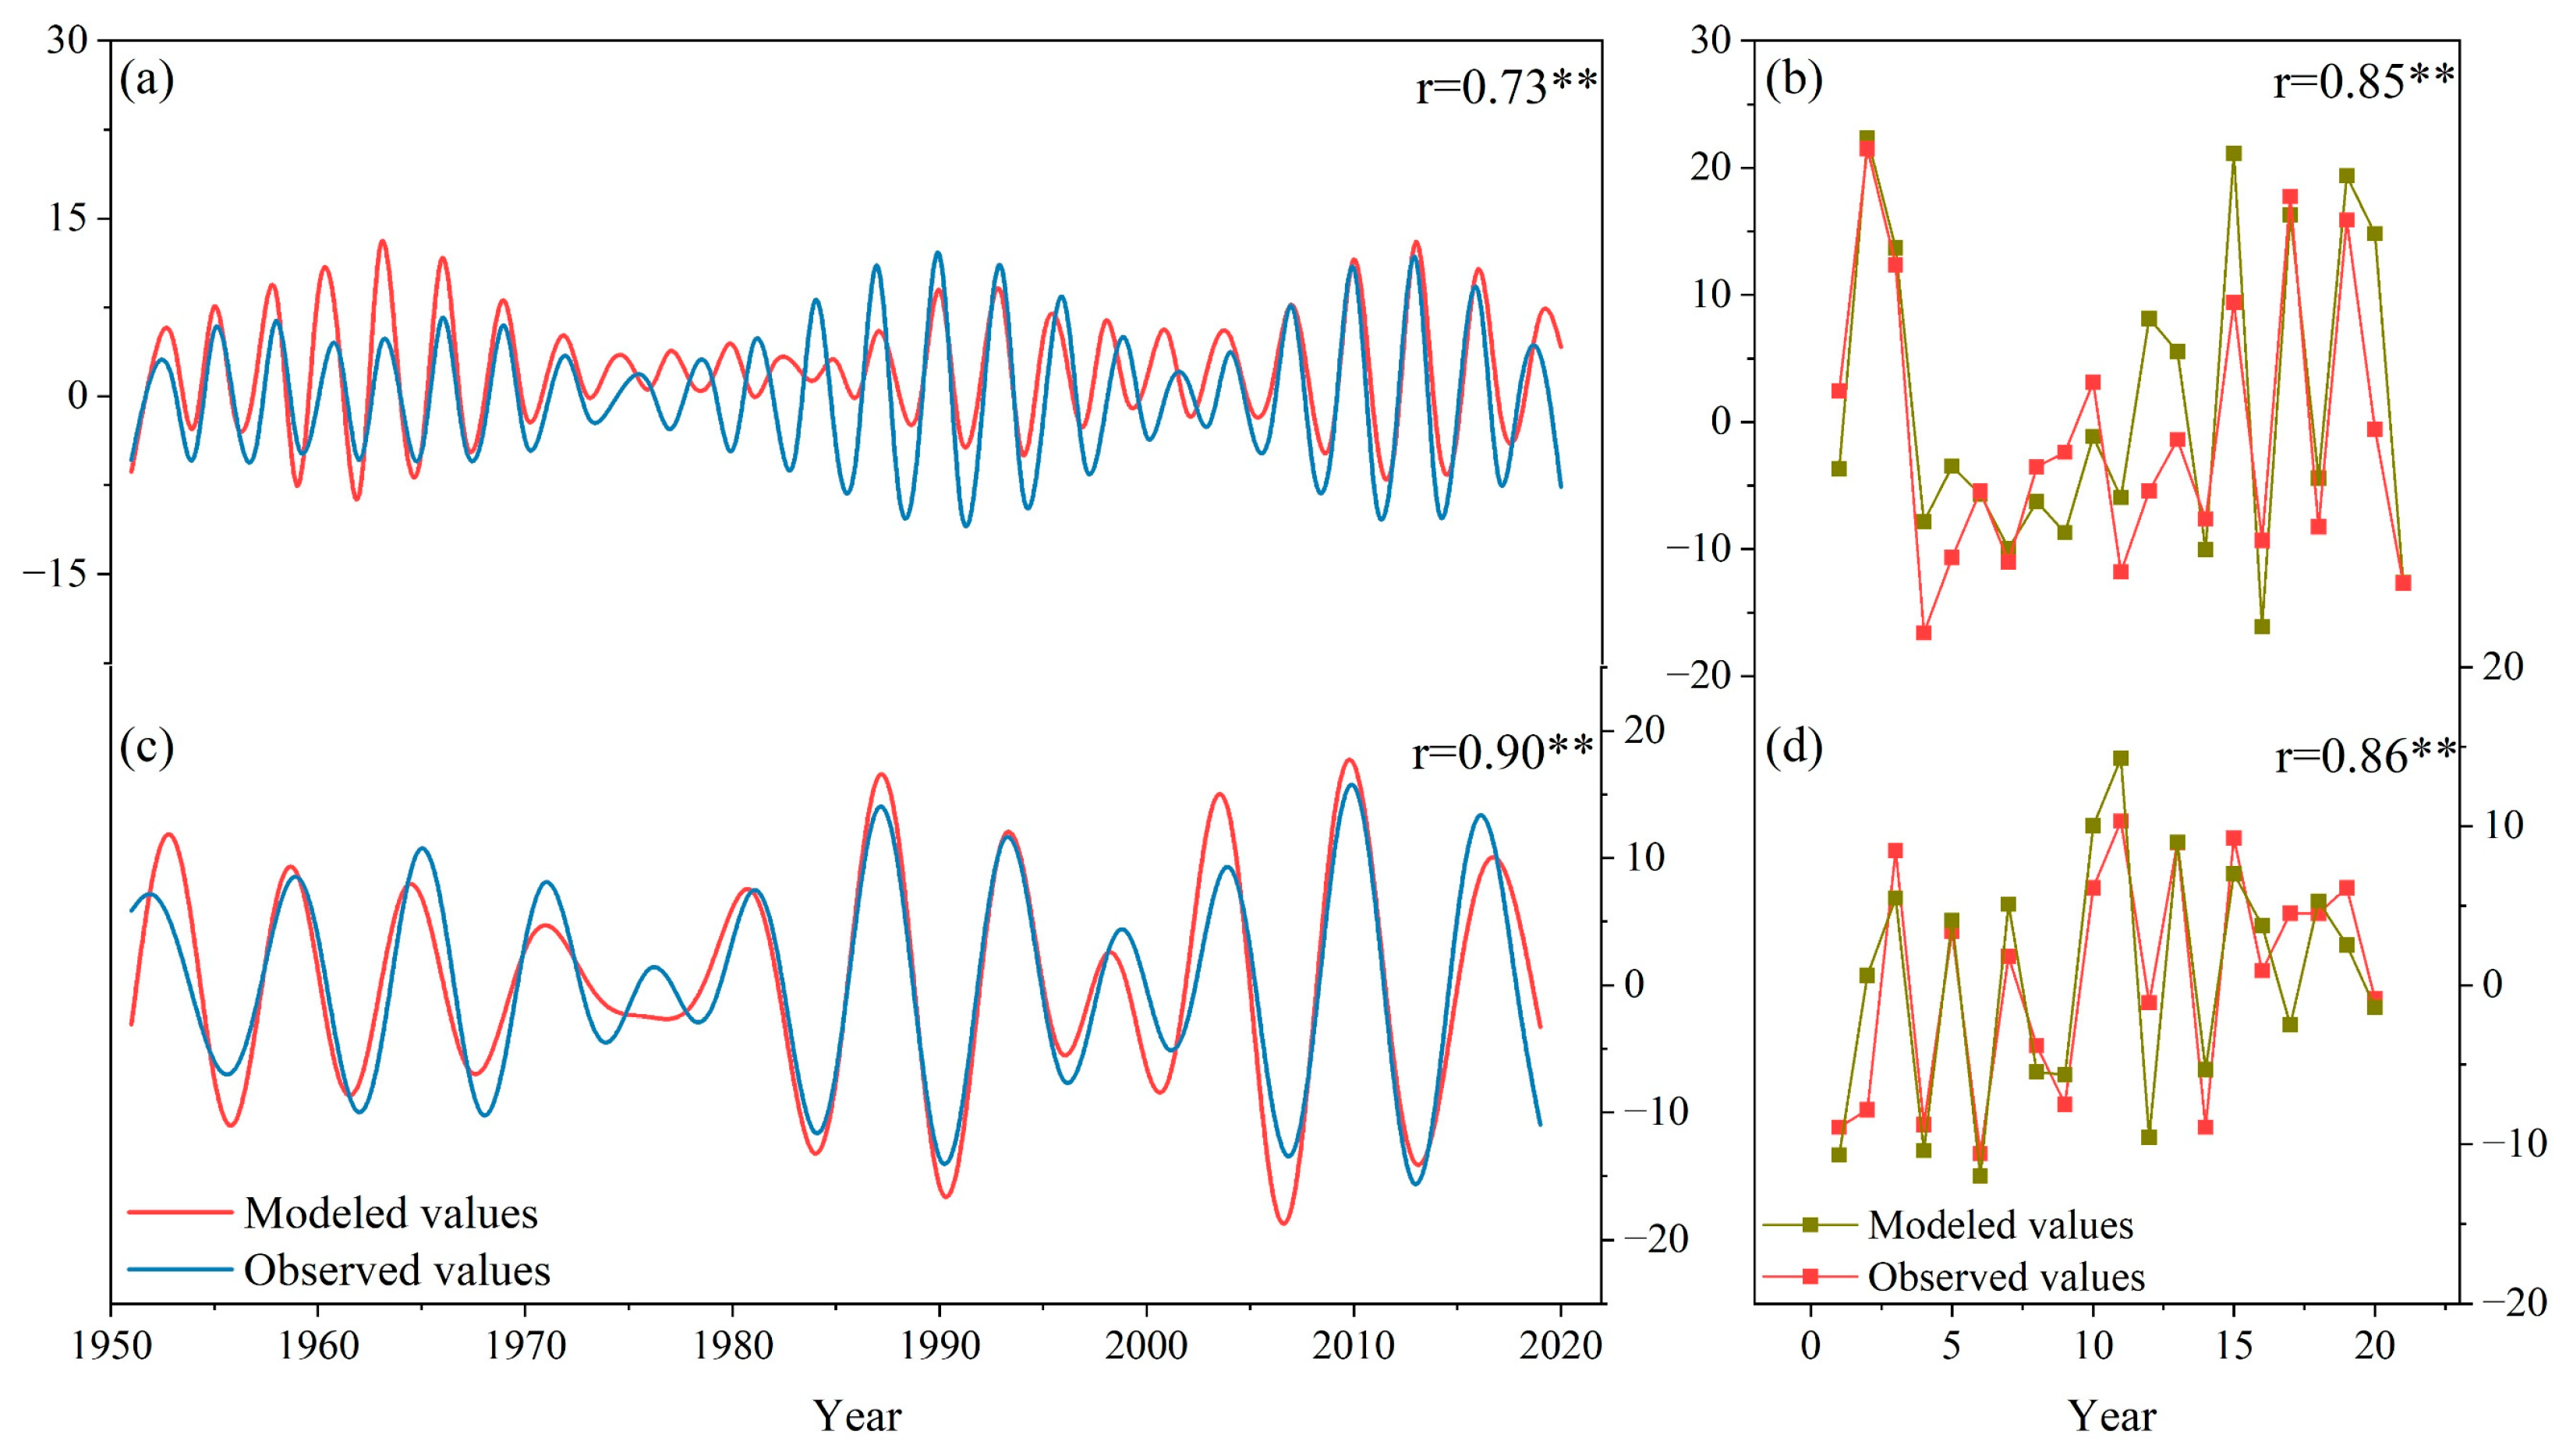
4.2. Significance of Different Factors on Interannual Precipitation Cyclicity in Xinjiang

Currently, only a few studies have evaluated the significance of multiple factors affecting Xinjiang’s interannual precipitation [32,78]. For example, Hu et al. [32] conducted a correlation analysis between annual precipitation in the Central Asian region and the NAO, Pacific Decadal Oscillation (PDO), AO, ENSO, and Zonal Index (ZI) at interannual timescales, showing that only ENSO has strong influences on the annual precipitation, with a significantly positive correlation (r = 0.41, p = 0.01) during 1951–2013 followed by AO (r = −0.21), NAO (r = −0.15), and ZI (r = 0.07). Yang and Xing [78] used cross-correlation and stepwise regression methods to analyze the teleconnection effects of the ENSO, PDO, Atlantic Multi-decadal Oscillation (AMO), and AO on the variability of Xinjiang droughts, showing that the AMO primarily influences drought variations’ 2-year timescales (significance score = −1.271) followed by the AO (significance score = −0.318) and the PDO (significance score = 0.249). However, the significance ranking of the factors affecting the 3- and 6–7-year periodic changes in MAP_XJ is not clear, and the influence of various climate indices on the following year’s precipitation in Xinjiang was not considered.
Given the similarities in the interannual cyclicity of Xinjiang precipitation and the indices of potential factors (Figure 3), band-pass filtering was conducted on all time series to isolate the two dominant bands of variance. Based on the cycles indicated by the power spectrum, we, respectively, set the ranges of two bands at 2.5–3.5 years (Band I) (Figure 4) and 5–8 years (Band II) (Figure 4). The results indicated that for Band I (2.5–3.5 years), significant correlations (zero lag) were detected among three indices; Xinjiang precipitation displayed a positive correlation (r = 0.56, p < 0.01) with NTASST, whereas both the AO (r = −0.55, p < 0.01) and NAO (r = −0.39, p < 0.01) showed significant negative correlations with Xinjiang precipitation. In addition, a negative correlation (r = −0.40, p < 0.01) was observed between precipitation in Xinjiang and the ISM index, with a one-year lead period (ISM−1yr). For Band II (5–8 years), the correlation coefficients between Xinjiang precipitation and NTASST (r = 0.26, p < 0.05) as well as NAO (r = −0.31, p < 0.01) are lower than those for Band I. More importantly, the ENSO index one-year ahead (ENSO−1yr) exhibited the strongest positive correlation (r = 0.60, p < 0.01) with the precipitation in Xinjiang. Meanwhile, the AO index with a one-year lead (AO−1yr) (r = −0.72, p < 0.01) and the ISM index with a one-year lead (ISM−1yr) (r = −0.67, p < 0.01) demonstrated substantial negative correlations with precipitation in Xinjiang.
Although significant correlations exist between precipitation in Xinjiang and various potential forcing factors based on the two main bands of variance, we further explored the significance scores of these factors using multiple linear regression to estimate the statistical relationships [79,80,81]. Thus, for Band I, we conducted a multivariate linear regression analysis on NTASST, NAO, AO, and ISM−1yr, for which the correlations of with Xinjiang precipitation exceeded the 99% confidence level. The combined contribution and standardized coefficients of the four factors to the 2.5–3.5-year precipitation cycle are shown in Table 1.
For Band I, the NTASST, NAO, AO, and ISM−1yr indices jointly explained 53.6% of the precipitation variability in Xinjiang. Based on the regression analysis, the AO index explains most of the variability in the 2.5–3.5-year cycle as it exhibits the highest standardized coefficient (−0.656) among all the climatic factors (Table 1).
For Band II (Table 2), the ENSO, ENSO−1yr, NAO, AO, AO−1yr, ISM, and ISM−1yr indices collectively accounted for 81.8% of the precipitation variability in Xinjiang. Among these climatic factors, ENSO−1yr predominated the 5–8-year cycle, with a standardized coefficient of 0.457.
Furthermore, we employed the Random Forest model to determine the significance score of each factor for cross-verification of the multivariate linear regression analysis. In the case of Band I, precipitation in Xinjiang was designated as the output variable, while NTASST, NAO, AO, and ISM_−1yr were used as the input variables. Among these climatic factors, the AO had the highest significance score at 0.859 (Figure 5a). For Band II, precipitation in Xinjiang was selected as the output variable, while ENSO, ENSO−1yr, NAO, AO, AO−1yr, ISM, and ISM−1yr were used as input variables. The results showed that AO−1yr had the highest significance score at 0.876 (Figure 5b).
Because multiple linear regression mainly considers linear responses and the Random Forest model mainly focuses on non-linear responses, certain disparities exist between the results of the two methods. Because the Random Forest model can be regarded as supplementary to the non-linear relationships among the variables [79,82,83], both results provide a comprehensive breakdown of the factors dominating periodic changes in precipitation in Xinjiang.

4.3. Insights from Interannual Cycles for Future Precipitation Changes

Predicting the future climate has long been a central focus of climate science research [84]. For the Xinjiang region, Zhang et al. [85] projected that, during the period from 2021 to 2050, the average annual precipitation in Xinjiang will undergo changes at rates of 3.95 mm/10 a, 1.90 mm/10 a, 2.50 mm/10 a, and 8.67 mm/10 a under the SSP1-2.6, SSP2-4.5, SSP3-7.0, and SSP5-8.5 scenarios, respectively. However, Du et al. [86] predicted that the increase in precipitation in the same region would be much smaller under Representative Concentration Pathway (RCP) 8.5 than under RCP4.5 during the mid-21st century. Such discrepancies could be attributed to the different contributions of the potential forcing factors considered in the models. Thus, we used our results to offer some insights into future interannual changes in precipitation in the study region.
First, we used the unstandardized coefficients obtained from the multiple linear regression analysis (Table 1 and Table 2) to calculate the predicted precipitation values by considering the relative contributions of the potential factors according to the following regression equations:
M A P _ X J B a n d   I = 35.121 × N T A _ S S T + 13.511 × N A O 40.349 × A O 0.309 × I S M 0.068
M A P _ X J B a n d   I I = 7.384 × E N S O + 14.829 × E N S O _ 1 y r 20.290 × N A O 16.882 × A O 12.701 × A O _ 1 y r + 0.752 × I S M 0.813 × I S M _ 1 y r 0.105
In addition, we conducted a correlation analysis between the observed and modeled values derived from these equations. The results reveal that for Band I, the correlation coefficient between the modeled and observed values reaches 0.73 (p < 0.01; Figure 6a). For Band II, the correlation coefficient was as high as 0.9 (p < 0.01; Figure 6c). This suggests that multiple linear regression analysis can reflect the relative significance of the potential forcing factors.
Second, we applied the Random Forest model for the predicted values of precipitation in Xinjiang. For Band I, Xinjiang precipitation was designated as the output variable, with NTASST, NAO, AO, and ISM−1yr serving as input variables. The resulting correlation coefficient was 0.85 (p < 0.01; Figure 6b). For Band II, ENSO, ENSO−1yr, NAO, AO, AO−1yr, ISM, and ISM−1yr were used as input variables, yielding a correlation coefficient of 0.86 (p < 0.01; Figure 6d). This suggests that the Random Forest model is also capable of reflecting the relative significance of potential forcing factors.
In summary, our analysis substantiates the use of NTASST, NAO, AO, and ISM−1yr to predict precipitation in Xinjiang in Band I, and uses ENSO, ENSO−1yr, NAO, AO, AO−1yr, ISM, and ISM−1yr to predict precipitation in Xinjiang in Band II. However, considering that the results obtained based on the methods of this study still have uncertainties, such as the systematic errors of the methods and the credibility assessment of the significance scores for each factor, validations of the methodology in these aspects are necessary in future research. We especially recommend the abovementioned results be verified through artificial intelligence and big data models.

4.4. Innovations and Limitations of the Study

Given that this study aims to clarify the contributions of various atmospheric and oceanic factors related to the interannual cyclicity of precipitation over the past 70 years in Xinjiang, we, for the first time, assessed the relative importance of key factors including ENSO, AO, NAO, NTASST, and ISM, which are generally considered as the main factors influencing hydroclimate changes in Xinjiang both during the modern observational period and in the past (e.g., the Holocene). Most importantly, we found the significant connections of ENSO with one-year lead (ENSO−1yr), AO with one-year lead (AO−1yr), and ISM with one-year lead (ISM−1yr) with cyclic changes in precipitation in Xinjiang, which have not been emphasized in previous studies. Consequently, the results of this manuscript are meaningful in terms of understanding the forcing mechanisms of hydroclimate variability on multiple timescales. Furthermore, the methods and results of our study are relevant to other arid regions where cyclic changes in precipitation have not been fully understood. For example, Evans et al. [87] investigated precipitation changes in Middle Eastern regions and primarily relied on regional climate models (RegCM2) and statistical correlation analyses. Moron et al. [88] predominantly employed EOF and SSA methods to analyze changes in precipitation in North Africa. Our study provides an approach to innovatively integrates multiple linear regression and Random Forest models to quantify the combined effects of oceanic and atmospheric factors on precipitation cycles.
On the other hand, there remain some limitations in our results, which should be clarified and are valuable for future research. First, although the 34 stations used in this study could represent the general variation pattern of precipitation in Xinjiang, a number of stations with a relatively short duration of observational period were excluded. This has led to a limitation of our data in terms of spatial resolution for the complex terrain in the Xinjiang region, as minor periodic variations at some sites might not be adequately presented in our results. However, we examined the data reproductivity by calculating the dominating multi-year cycles of precipitation anomaly in Xinjiang using the ECMWF ERA5 product for 1981–2010 (Figure S1). The result supports the dominating cycles as indicated by REDFIT, wavelet transform, and EEMD components.
Second, since this study focuses on identifying dominant multi-year cycles, we separated the variations in mean annual precipitation in Xinjiang (MAP_XJ) into two bands: 2.5–3.5 years and 5–8 years. This approach may overlook other cycles beyond these two ranges. For example, the ENSO index exhibits an 11.8-year cycle, which is similar to the 12-year cycle observed in Xinjiang precipitation (Figure 3c). This is another limitation of our research, and we will address such periodic changes and contributing factors of precipitation in Xinjiang in future studies.
Third, during the data processing, we did not examine the validity of random seed in the original manuscript, which could slightly affect the reproducibility of the results. To address this issue, numbers such as 42, 123, 1234, and 2025 were randomly set as the seeds to verify the data reproducibility. As shown in Table S2, the random seed of 1234 yielded the smallest root mean square error (RMSE) for Band I, with the AO index exhibiting the highest significance score (0.854). In contrast, the random seed of 123 produced the smallest RMSE for Band II, and the AO−1yr index showed the highest significance score (0.740). Although these results are consistent with the conclusions of our study, this reminds us of the possible limitation of methodology.

5. Conclusions

Based on observational data from 34 meteorological stations, we analyzed the dominant cycles of mean annual precipitation in Xinjiang (MAP_XJ) from 1951 to 2021. MAP_XJ showed an overall increasing trend, with the superposition of a dominant cycle of ~3 years (Band I, 56.57% variance) and ~6–7 years (Band II, 23.38% variance). Two methods (multiple linear regression and the Random Forest model) were employed to detect the significance scores of potential forcing factors, including NTASST, NAO, AO, ENSO, and ISM, which all show similar interannual cycles with MAP_XJ. Based on both analyses, the AO index exhibited the highest significance scores for the MAP_XJ changes in Band I. In contrast, the one-year-ahead ENSO index (ENSO−1yr) showed the highest significance in Band II based on multiple linear regression analysis, and the one-year-ahead AO index (AO−1yr) scored highest using the Random Forest model.
Our results indicate that the application of different methods considering the linear and non-linear responses of different forcing factors leads to discrepancies in understanding the dominant factors of climate change. Therefore, more attention should be paid to the methodologies adopted in future climate predictions.

Supplementary Materials

The following supporting information can be downloaded at: https://www.mdpi.com/article/10.3390/atmos16050629/s1. Figure S1. The dominating multi-year cycles in precipitation anomaly for the Xinjiang region using MCMWF ERA5 product during 1980–2010. Table S1. Information of 34 meteorological stations in Xinjiang region used in this study. Table S2. Random Forest model: Feature importance and predictive performance across different random seeds.

Author Contributions

Conceptualization, W.M. and X.L.; methodology, W.M.; software, W.M. and S.S.; validation, W.M., X.L. and Z.W.; formal analysis, W.M.; investigation, X.L.; resources, X.L.; data curation, Y.S., J.H. and M.M. (Mengfei Ma); writing—original draft preparation, W.M.; writing—review and editing, X.L and M.M. (Meihong Ma); visualization, W.M.; supervision, L.T.; project administration, X.L.; funding acquisition, X.L. All authors have read and agreed to the published version of the manuscript.

Funding

This study is supported by the National Natural Science Foundation of China (Nos. 42471177, 41901099) and the Open Foundation of State Key Laboratory of Loess and Quaternary Geology, Institute of Earth Environment, CAS (SKLLQG2316).

Institutional Review Board Statement

Not applicable.

Informed Consent Statement

Not applicable.

Data Availability Statement

Data is contained within the article.

Acknowledgments

We sincerely appreciate the constructive feedback provided by the two anonymous reviewers.

Conflicts of Interest

The authors declare no conflict of interest.

References

  1. Xu, D.; Lu, H.; Chu, G.; Liu, L.; Shen, C.; Li, F.; Wang, C.; Wu, N. Synchronous 500-year oscillations of monsoon climate and human activity in Northeast Asia. Nat. Commun. 2019, 10, 4105. [Google Scholar] [CrossRef] [PubMed]
  2. Li, Y.; Fleitmann, D.; Wang, X.; Pérez-Mejías, C.; Sha, L.; Dong, X.; Wang, D.; Zhang, R.; Qu, X.; Cheng, H. 550-Year climate periodicity in the Yunnan-Guizhou Plateau during the Late Mid-Holocene: Insights and implications. Geophys. Res. Lett. 2023, 50, e2023GL103523. [Google Scholar] [CrossRef]
  3. Zhao, D.; Lu, Z.; Wan, S.; Cheng, H.; Shi, X.; Li, A. Quaternary rainfall variability is governed by insolation in northern China and ice-sheet forcing in the South. Commun. Earth Environ. 2023, 4, 7. [Google Scholar] [CrossRef]
  4. Huang, E.; Zhao, M.; Wang, Y.; Tian, J. Quaternary precession cycles of sea-surface oxygen isotope records from the tropical western pacific. Quat. Sci. 2020, 40, 1464–1473. (In Chinese) [Google Scholar]
  5. Cheng, H.; Edwards, R.L.; Sinha, A.; Spötl, C.; Yi, L.; Chen, S.; Kelly, M.; Kathayat, G.; Wang, X.; Li, X. The Asian monsoon over the past 640,000 years and ice age terminations. Nature 2016, 534, 640–646. [Google Scholar] [CrossRef]
  6. Beck, J.W.; Zhou, W.; Li, C.; Wu, Z.; White, L.; Xian, F.; Kong, X.; An, Z. A 550,000-year record of East Asian monsoon rainfall from 10Be in loess. Science 2018, 360, 877–881. [Google Scholar] [CrossRef]
  7. Zhang, Z.; Huang, W.; Chen, J.; Liu, J.; Wei, H.; Chen, F. Multi-time scale analysis of East Asian summer monsoon and its possible mechanism during Holocene. Quat. Sci. 2017, 37, 498–509. (In Chinese) [Google Scholar]
  8. Raspopov, O.M.; Dergachev, V.A.; Esper, J.; Kozyreva, O.V.; Frank, D.; Ogurtsov, M.; Kolström, T.; Shao, X. The influence of the de Vries (∼200-year) solar cycle on climate variations: Results from the Central Asian Mountains and their global link. Palaeogeogr. Palaeoclimatol. Palaeoecol. 2008, 259, 6–16. [Google Scholar] [CrossRef]
  9. Liu, X.; Rao, Z.; Shen, C.C.; Liu, J.; Chen, J.; Chen, S.; Wang, X.; Chen, F. Holocene solar activity imprint on centennial-to multidecadal-scale hydroclimatic oscillations in arid central Asia. J. Geophys. Res. Atmos. 2019, 124, 2562–2573. [Google Scholar] [CrossRef]
  10. Huang, C.; Tian, X. Discussion on the driving mechanism of solar activity to interannual-suborbital-scale climate change. Quat. Sci. 2018, 38, 1255–1267. (In Chinese) [Google Scholar]
  11. Hu, F.S.; Kaufman, D.; Yoneji, S.; Nelson, D.; Shemesh, A.; Huang, Y.; Tian, J.; Bond, G.; Clegg, B.; Brown, T. Cyclic variation and solar forcing of Holocene climate in the Alaskan subarctic. Science 2003, 301, 1890–1893. [Google Scholar] [CrossRef] [PubMed]
  12. Fleitmann, D.; Burns, S.J.; Mudelsee, M.; Neff, U.; Kramers, J.; Mangini, A.; Matter, A. Holocene forcing of the Indian monsoon recorded in a stalagmite from southern Oman. Science 2003, 300, 1737–1739. [Google Scholar] [CrossRef] [PubMed]
  13. Lu, H. Periodic climate change and human adaptation. Acta Anthropol. Sin. 2022, 41, 731–748. (In Chinese) [Google Scholar]
  14. Wang, C.; Zhang, S.; Li, K.; Zhang, F.; Yang, K. Change characteristics of precipitation in Northwest China from 1961 to 2018. Chin. J. Atmos. Sci. 2021, 45, 713–724. (In Chinese) [Google Scholar]
  15. Shang, S.; Lian, L.; Ma, T.; Zhang, K.; Han, T. Spatiotemporal variation of temperature and precipitation in northwest China in recent 54 years. Arid Zone Res. 2018, 35, 68–76. (In Chinese) [Google Scholar]
  16. Liu, Y.; Wei, Z. Comparison of the Precipitation Cycle and Trend in Different Areas of Northern China in Recent 50 years. Adv. Earth Sci. 2012, 27, 337–346. (In Chinese) [Google Scholar]
  17. Hao, Z.; Zheng, J.; Ge, Q. Precipitation cycles in the middle and lower reaches of the Yellow River (1736–2000). J. Geogr. Sci. 2008, 18, 17–25. [Google Scholar] [CrossRef]
  18. Xu, G.; Dong, A. The quasi-three year period of precipitation in the west of China. Plateau Meteorol. 1982, 1, 11–17. (In Chinese) [Google Scholar]
  19. Chen, Y.-Y.; Chen, N.; Qian, Z.-A.; Wang, S.-G. Temporal and Spatial Change Features of Precipitation over CMASA(II): Synthetical Climate Subregions of the CMASA and Further Analyses of Periodic Change of Precipitation in Its Various Ones. Plateau Meteorol. 2011, 30, 13–21. (In Chinese) [Google Scholar]
  20. Aizen, E.M.; Aizen, V.B.; Melack, J.M.; Nakamura, T.; Ohta, T. Precipitation and atmospheric circulation patterns at mid-latitudes of Asia. Int. J. Climatol. J. R. Meteorol. Soc. 2001, 21, 535–556. [Google Scholar] [CrossRef]
  21. Aizen, V.B.; Aizen, E.M.; Joswiak, D.R.; Fujita, K.; Takeuchi, N.; Nikitin, S.A. Climatic and atmospheric circulation pattern variability from ice-core isotope/geochemistry records (Altai, Tien Shan and Tibet). Ann. Glaciol. 2006, 43, 49–60. [Google Scholar] [CrossRef]
  22. Chen, F.; Chen, J.; Huang, W.; Chen, S.; Huang, X.; Jin, L.; Jia, J.; Zhang, X.; An, C.; Zhang, J.; et al. Westerlies Asia and monsoonal Asia: Spatiotemporal differences in climate change and possible mechanisms on decadal to sub-orbital timescales. Earth-Sci. Rev. 2019, 192, 337–354. [Google Scholar] [CrossRef]
  23. Zhang, Y.; Wei, W.; Jiang, F.; Liu, M.; Wang, W.; Bai, L.; Han, X.; Hong, W.; Lu, H.; Li, X. Relationship between the North Atlantic Oscillation and climate change in Xinjiang in recent 50 years. Plateau Meteorol. 2012, 31, 974–982. (In Chinese) [Google Scholar]
  24. Jiang, Y.; Liu, J.; Shao, W.; Yu, X.; Wang, S. Climatic characteristics and historical evolution of precipitation in different time scales in Xinjiang from 1961 to 2013. J. Glaciol. Geocryol. 2014, 36, 1363–1375. (In Chinese) [Google Scholar]
  25. Yao, J.; Chen, Y.; Guan, X.; Zhao, Y.; Chen, J.; Mao, W. Recent climate and hydrological changes in a mountain–basin system in Xinjiang, China. Earth-Sci. Rev. 2022, 226, 103957. [Google Scholar] [CrossRef]
  26. Xie, P.; Gu, Y.; Zhang, Y.; Xiang, L. Precipitation and drought characteristics in Xinjiang during 1961–2015. Arid Land Geogr. 2017, 40, 332–339. (In Chinese) [Google Scholar]
  27. Dai, X.; Wang, P.; Zhang, K. A study on precipitation trend and fluctuation mechanism in northwestern China over the past 60 years. Acta Phys. Sin. 2013, 62, 129201. (In Chinese) [Google Scholar]
  28. Dai, X.; Ren, Y.; Chen, H. Multi-scale feature of climate and climate shift in Xinjiang over the past 50 years. Acta Meteorol. Sin. 2007, 65, 1003–1010. (In Chinese) [Google Scholar]
  29. Chen, F.; Huang, W.; Jin, L.; Chen, J.; Wang, J. Spatiotemporal precipitation variations in the arid Central Asia in the context of global warming. Sci. China Earth Sci. 2011, 54, 1812–1821. [Google Scholar] [CrossRef]
  30. An, L.; Hao, Y.; Yeh, T.-C.J.; Zhang, B. Annual to multidecadal climate modes linking precipitation of the northern and southern slopes of the Tianshan Mts. Theor. Appl. Climatol. 2020, 140, 453–465. [Google Scholar] [CrossRef]
  31. Hanley, D.E.; Bourassa, M.A.; O’Brien, J.J.; Smith, S.R.; Spade, E.R. A Quantitative Evaluation of ENSO Indices. J. Clim. 2003, 16, 1249–1258. [Google Scholar] [CrossRef]
  32. Hu, Z.; Zhou, Q.; Chen, X.; Qian, C.; Wang, S.; Li, J. Variations and changes of annual precipitation in Central Asia over the last century. Int. J. Climatol. 2017, 37, 157–170. [Google Scholar] [CrossRef]
  33. Ke, C.Q.; Li, X.C.; Xie, H.; Ma, D.H.; Liu, X.; Kou, C. Variability in snow cover phenology in China from 1952 to 2010. Hydrol. Earth Syst. Sci. 2016, 20, 755–770. [Google Scholar] [CrossRef]
  34. Zhang, K.; Dai, S.; Dong, X. Dynamic Variability in Daily Temperature Extremes and Their Relationships with Large-scale Atmospheric Circulation During 1960–2015 in Xinjiang, China. Chin. Geogr. Sci. 2020, 30, 233–248. [Google Scholar] [CrossRef]
  35. Chen, F.; Yu, Z.; Yang, M.; Ito, E.; Wang, S.; Madsen, D.B.; Huang, X.; Zhao, Y.; Sato, T.; John, B.; et al. Holocene moisture evolution in arid central Asia and its out-of-phase relationship with Asian monsoon history. Quat. Sci. Rev. 2008, 27, 351–364. [Google Scholar] [CrossRef]
  36. Chen, J.; Huang, W.; Jin, L.; Chen, J.; Chen, S.; Chen, F. A climatological northern boundary index for the East Asian summer monsoon and its interannual variability. Sci. China Earth Sci. 2018, 61, 13–22. [Google Scholar] [CrossRef]
  37. Huang, L.; Chen, J.; Yang, K.; Yang, Y.; Huang, W.; Zhang, X.; Chen, F. The northern boundary of the Asian summer monsoon and division of westerlies and monsoon regimes over the Tibetan Plateau in present-day. Sci. China Earth Sci. 2023, 66, 882–893. [Google Scholar] [CrossRef]
  38. Feng, S.; Hu, Q.; Huang, W.; Ho, C.-H.; Li, R.; Tang, Z. Projected climate regime shift under future global warming from multi-model, multi-scenario CMIP5 simulations. Glob. Planet. Change 2014, 112, 41–52. [Google Scholar] [CrossRef]
  39. Yang, S.; Chen, S.; Wang, Y.; Zhang, Z.; Zeng, Y. Comparison of oxygencarbon isotopes from a Holocene stalagmite by EEMD method. Geogr. Res. 2017, 36, 1455–1466. (In Chinese) [Google Scholar]
  40. Wu, Y. Multi-scale fluctuation of precipitation in Dushanbe revealed by EEMD analysis. J. Arid. Land Resour. Environ. 2015, 29, 152–157. (In Chinese) [Google Scholar]
  41. Cai, N.; Huang, W.; Xie, W.; Ye, Q.; Yang, Z. Ensemble Empirical Mode Decomposition Base on Complementary Adaptive Noises. J. Electron. Inf. Technol. 2015, 37, 2383–2389. (In Chinese) [Google Scholar]
  42. Li, Y.; Chen, L.; Jiang, T.; Luo, W.; Lin, Z. Multi-scale modulation analysis of solar activity and Indian summer monsoon based on EEMD Method. Geogr. Sci. 2018, 38, 628–635. (In Chinese) [Google Scholar]
  43. Wei, X.; Chen, Y. The response relationship of the rainy season precipitation in northern Xinjiang to ENSO. Prog. Geophys. 2002, 17, 753–759. (In Chinese) [Google Scholar]
  44. Sun, Q.; Daryin, A.; Zhao, J.; Xie, M.; Darin, F.; Rakshun, Y.; Su, Y.; Dong, H.; Chu, G.; Wang, S. High-Resolution Elemental Record From the Holocene Sediments of an Alpine Lake in the Central Altai Mountains: Implications for Arctic Sea-Ice Variations. Earth Space Sci. 2021, 8, e2021EA001810. [Google Scholar] [CrossRef]
  45. Li, Y.; Li, D. Effects of ENSO cycle on the summer climate anomaly over northwest China. Plateau Meteorol. 2004, 23, 930–935. (In Chinese) [Google Scholar]
  46. Zhang, J.; LI, H.; Tang, H. Preliminary analysis of the synergistic influence of westerly wind and indian monsoon on rainstorm over Tarim Basin. Trans. Atmos. Sci. 2023, 46, 242–258. (In Chinese) [Google Scholar]
  47. Huang, W.; Feng, S.; Chen, J.; Chen, F. Physical Mechanisms of Summer Precipitation Variations in the Tarim Basin in Northwestern China. J. Clim. 2015, 28, 3579–3591. [Google Scholar] [CrossRef]
  48. Wang, G.; Luo, Z.; Zhao, D. Association of precipitation over Northwest China during march to september with ENSO. Trans. Atmos. Sci. 2007, 30, 849–856. (In Chinese) [Google Scholar]
  49. Chen, X.; Wang, S.; Hu, Z.; Zhou, Q.; Hu, Q. Spatiotemporal characteristics of seasonal precipitation and their relationships with ENSO in Central Asia during 1901–2013. J. Geogr. Sci. 2018, 28, 1341–1368. [Google Scholar] [CrossRef]
  50. Chen, F.; Chen, J.; Huang, W. Weakened East Asian summer monsoon triggers increased precipitation in Northwest China. Sci. China Earth Sci. 2021, 64, 835–837. [Google Scholar] [CrossRef]
  51. Chen, C.; Zhang, X.; Lu, H.; Jin, L.; Du, Y.; Chen, F. Increasing summer precipitation in arid Central Asia linked to the weakening of the East Asian summer monsoon in the recent decades. Int. J. Climatol. 2021, 41, 1024–1038. [Google Scholar] [CrossRef]
  52. Zhang, X.; Miao, J.; Wang, X.; Zhou, B. Interannual variation of summer compound hot and drought events in Xinjiang and its relationship with the North Atlantic sea surface temperature. J. Clim. 2024, 37, 4949–4960. [Google Scholar] [CrossRef]
  53. Zhang, X. A primary study on the influence of north Atlantic ocean surface temperature on the plenty or deficiency of discharge in spring in north Xinjiang region. Geogr. Sci. 1989, 9, 329–335,387. (In Chinese) [Google Scholar]
  54. Lauterbach, S.; Witt, R.; Plessen, B.; Dulski, P.; Prasad, S.; Mingram, J.; Gleixner, G.; Hettler-Riedel, S.; Stebich, M.; Schnetger, B. Climatic imprint of the mid-latitude Westerlies in the Central Tian Shan of Kyrgyzstan and teleconnections to North Atlantic climate variability during the last 6000 years. Holocene 2014, 24, 970–984. [Google Scholar] [CrossRef]
  55. Monteith, J. Evaporation and surface temperature. Q. J. R. Meteorol. Soc. 1981, 107, 1–27. [Google Scholar] [CrossRef]
  56. Bothe, O.; Fraedrich, K.; Zhu, X. Precipitation climate of Central Asia and the large-scale atmospheric circulation. Theor. Appl. Climatol. 2012, 108, 345–354. [Google Scholar] [CrossRef]
  57. Zhao, Y.; Wang, M.; Huang, A.; Li, H.; Huo, W.; Yang, Q. Relationships between the West Asian subtropical westerly jet and summer precipitation in northern Xinjiang. Theor. Appl. Climatol. 2014, 116, 403–411. [Google Scholar] [CrossRef]
  58. Yang, L.; Zhang, Q. Effects of the North Atlantic Oscillation on the summer rainfall anomalies in Xinjiang. Chin. J. Atmos. Sci. 2008, 32, 1187–1196. (In Chinese) [Google Scholar]
  59. Yang, H.; Li, C. Influence of Arctic Oscillation on temperature and precipitation in winter. Clim. Environ. Res. 2008, 13, 395–404. (In Chinese) [Google Scholar]
  60. Guan, X.; Sun, W.; Li, M. Climate change in north Xinjiang and its response to Arctic oscillation during the period of 1965–2012. Arid Zone Res. 2016, 33, 681–689. (In Chinese) [Google Scholar]
  61. Huang, W.; Chen, F.; Feng, S.; Chen, J.; Zhang, X. Interannual precipitation variations in the mid-latitude Asia and their association with large-scale atmospheric circulation. Chin. Sci. Bull. 2013, 58, 3962–3968. [Google Scholar] [CrossRef]
  62. Hurrell, J.W.; Deser, C. North Atlantic climate variability: The role of the North Atlantic Oscillation. J. Mar. Syst. 2010, 79, 231–244. [Google Scholar] [CrossRef]
  63. Thompson, D.W.; Wallace, J.M. The Arctic Oscillation signature in the wintertime geopotential height and temperature fields. Geophys. Res. Lett. 1998, 25, 1297–1300. [Google Scholar] [CrossRef]
  64. Timmermann, A.; An, S.-I.; Kug, J.-S.; Jin, F.-F.; Cai, W.; Capotondi, A.; Cobb, K.M.; Lengaigne, M.; McPhaden, M.J.; Stuecker, M.F.; et al. El Niño–Southern Oscillation complexity. Nature 2018, 559, 535–545. [Google Scholar] [CrossRef]
  65. Philander, S.G.H. Meteorology: Anomalous El Niño of 1982–1983. Nature 1983, 305, 16. [Google Scholar] [CrossRef]
  66. McPhaden, M.J.; Zebiak, S.E.; Glantz, M.H. ENSO as an Integrating Concept in Earth Science. Science 2006, 314, 1740–1745. [Google Scholar] [CrossRef]
  67. Fu, C.; Teng, X. Climate anomalies in China associated with El Niño/Southern oscillation. Chin. J. Atmos. Sci. 1988, 12, 133–141. (In Chinese) [Google Scholar]
  68. Alexander, M.A.; Bladé, I.; Newman, M.; Lanzante, J.R.; Lau, N.-C.; Scott, J.D. The Atmospheric Bridge: The Influence of ENSO Teleconnections on Air–Sea Interaction over the Global Oceans. J. Clim. 2002, 15, 2205–2231. [Google Scholar] [CrossRef]
  69. Feng, S.; Hu, Q. Variations in the Teleconnection of ENSO and Summer Rainfall in Northern China: A Role of the Indian Summer Monsoon. J. Clim. 2004, 17, 4871–4881. [Google Scholar] [CrossRef]
  70. Hu, P.; Chen, W.; Wang, L.; Chen, S.; Liu, Y.; Chen, L. Revisiting the ENSO–monsoonal rainfall relationship: New insights based on an objective determination of the Asian summer monsoon duration. Environ. Res. Lett. 2022, 17, 104050. [Google Scholar] [CrossRef]
  71. Jin, Z.; Tao, S. A study on the relationships between ENSO cycle and rainfalls during summer and winter in eastern China. Chin. J. Atmos. 1999, 23, 663–672. (In Chinese) [Google Scholar]
  72. Li, L.; Zhao, J. Effects of ENS0 events on climates of different climate zones in northwest China since 1951. Areal Res. Dev. 2016, 35, 166–171. (In Chinese) [Google Scholar]
  73. Chen, Y.; Zhao, C.; Zhi, H. Analysis of ENSO Event Intensity Changes and Time–Frequency Characteristic Since 1875. Atmosphere 2024, 15, 1428. [Google Scholar] [CrossRef]
  74. An, Z.; Wu, G.; Li, J.; Sun, Y.; Liu, Y.; Zhou, W.; Cai, Y.; Duan, A.; Li, L.; Mao, J.; et al. Global Monsoon Dynamics and Climate Change. Annu. Rev. Earth Planet. 2015, 43, 29–77. [Google Scholar] [CrossRef]
  75. Zhang, X.; Jin, L. Association of the Northern Hemisphere circumglobal teleconnection with the Asian summer monsoon during the Holocene in a transient simulation. Holocene 2016, 26, 290–301. [Google Scholar] [CrossRef]
  76. Cui, Y. The transport of vapour and its sources in Northwest China. J. Hydraul. Eng. 1994, 9, 93. (In Chinese) [Google Scholar]
  77. Wang, X.; Xu, X.; Wang, W. Characteristic of spatial transportation of water vapor for Northwest China’s rainfall in spring and summer. Plateau Meteorol. 2007, 26, 749–758. (In Chinese) [Google Scholar]
  78. Yang, R.; Xing, B. Teleconnections of Large-Scale Climate Patterns to Regional Drought in Mid-Latitudes: A Case Study in Xinjiang, China. Atmosphere 2022, 13, 230. [Google Scholar] [CrossRef]
  79. Uyanık, G.K.; Güler, N. A Study on Multiple Linear Regression Analysis. Procedia—Soc. Behav. Sci. 2013, 106, 234–240. [Google Scholar] [CrossRef]
  80. Bring, J. How to standardize regression coefficients. Am. Stat. 1994, 48, 209–213. [Google Scholar] [CrossRef]
  81. Alexopoulos, E.C. Introduction to multivariate regression analysis. Hippokratia 2010, 14, 23–28. [Google Scholar] [PubMed]
  82. Breiman, L. Random Forests. Mach. Learn. 2001, 45, 5–32. [Google Scholar] [CrossRef]
  83. Auret, L.; Aldrich, C. Interpretation of nonlinear relationships between process variables by use of random forests. Miner. Eng. 2012, 35, 27–42. [Google Scholar] [CrossRef]
  84. IPCC. Climate Change 2021: The Physical Science Basis. Contribution of Working Group I to the Sixth Assessment Report of the Intergovernmental Panel on Climate Change; Cambridge University Press: Cambridge, UK; New York, NY, USA, 2021; Volume 2, p. 2391. [Google Scholar]
  85. Zhang, Y.; Zhang, P.; Gu, X.; Long, A. Projections of temperature and precipitation changes in Xinjiang from 2021 to 2050 based on the CMIP6 model. PLoS ONE 2024, 19, e0307911. [Google Scholar] [CrossRef]
  86. Du, H.; Zhou, C.; Tang, H.; Jin, X.; Chen, D.; Jiang, P.; Li, M. Simulation and estimation of future precipitation changes in arid regions: A case study of Xinjiang, Northwest China. Clim. Change 2021, 167, 43. [Google Scholar] [CrossRef]
  87. Evans, J.P.; Smith, R.B.; Oglesby, R.J. Middle East climate simulation and dominant precipitation processes. Int. J. Climatol. J. R. Meteorol. Soc. 2004, 24, 1671–1694. [Google Scholar] [CrossRef]
  88. Moron, V. Trend, decadal and interannual variability in annual rainfall of subequatorial and tropical North Africa (1900–1994). Int. J. Climatol. J. R. Meteorol. Soc. 1997, 17, 785–805. [Google Scholar] [CrossRef]
Figure 1. Map showing the study area and related ocean–atmosphere systems. (a) Dots represent the 34 meteorological stations in Xinjiang used in this paper and (b) blue arrows represent the main directions of the mid-latitude westerly circulation, the East Asian summer monsoon, and the Indian summer monsoon, respectively. The blue dashed line indicates the northern boundary of the modern summer monsoon [35,36,37], and the red dashed lines indicate the arid Asian region [38].
Atmosphere 16 00629 g001
Figure 2. Cyclicity of precipitation in the Xinjiang region based on (a) REDFIT spectral analysis, (b) continuous wavelet transforming, and (c) EEMD components.
Atmosphere 16 00629 g002
Figure 3. Comparison of REDFIT power spectrum interannual cycles of (a) normalized MAPXJ, (b) NTASST, (c) ENSO, (d) NAO, (e) AO, and (f) ISM.
Atmosphere 16 00629 g003
Figure 4. Comparison of band-pass filter phases of 2.5–3.5 years (af) and 5–8 years (gl) in normalized series of MAP_XJ, NTASST, ENSO, AO, NAO, and ISM. Note: * Significant at the 95% level. ** Significant at the 99% level.
Atmosphere 16 00629 g004
Figure 5. Significance of potential factors on the (a) 2.5–3.5-year and (b) 5–8-year precipitation cycles in Xinjiang based on the Random Forest algorithm.
Atmosphere 16 00629 g005
Figure 6. Comparison of modeled and observed values in Xinjiang precipitation for (a,b) Band I and (c,d) Band II using multivariate linear regression (a,c) and the Random Forest algorithm (b,d), respectively. Note: ** Significant at the 99% level.
Atmosphere 16 00629 g006
Table 1. Multivariate linear regression analysis of the 2.5–3.5-yr band-pass filtered results of the Xinjiang precipitation sequence and NTASST, NAO, AO, and ISM−1yr.
ModelUnstandardized CoefficientsStandardized Coefficients Collinearity StatisticsR2
BStandard ErrorBetatSignificanceToleranceVIF
(Constant)−0.0680.941 −0.0720.943 0.536
NTASST35.1218.9470.3863.92500.7381.355
NAO13.5117.4240.2731.820.0730.3173.155
AO−40.3499.234−0.656−4.3700.3173.159
ISM−1yr−0.3090.191−0.156−1.6150.1110.7691.301
Note: The dependent variable was set as the time series of precipitation in Xinjiang.
Table 2. Multivariate linear regression analysis of the 5–8-yr band-pass filtered results of the Xinjiang precipitation sequence and ENSO, ENSO−1yr, NAO, AO, AO−1yr, ISM, and ISM−1yr.
ModelUnstandardized CoefficientsStandardized Coefficients Collinearity StatisticsR2
BStandard ErrorBetatSignificanceToleranceVIF
(Constant)−0.1050.574 −0.1820.856 0.818
ENSO7.3842.4540.2253.0080.0040.5331.877
ENSO−1yr14.8292.3840.4576.22200.5521.811
NAO−20.293.931−0.382−5.16200.5451.834
AO−16.8826.57−0.219−2.570.0130.4122.428
AO−1yr−12.7016.436−0.167−1.9730.0530.4152.411
ISM0.7520.2470.2993.0460.0030.313.227
ISM−1yr−0.8130.243−0.323−3.3430.0010.3193.133
Note: The dependent variable was set as the time series of precipitation in Xinjiang.
Disclaimer/Publisher’s Note: The statements, opinions and data contained in all publications are solely those of the individual author(s) and contributor(s) and not of MDPI and/or the editor(s). MDPI and/or the editor(s) disclaim responsibility for any injury to people or property resulting from any ideas, methods, instructions or products referred to in the content.

