Article

Long-Term Caragana korshinskii Restoration Enhances SOC Stability but Reduces Sequestration Efficiency over 40 Years in Degraded Loess Soils

by
Zhijing Xue
1,
Shuangying Wang
1,
Anqi Wang
1,*,
Shengwei Huang
1,
Tingting Qu
1,
Qin Chen
2,
Xiaoyun Li
1,
Rui Wang
1,
Zhengyao Liu
3 and
Zhibao Dong
1
1
School of Geography and Tourism, Shaanxi Normal University, Xi’an 710119, China
2
Northwest Land and Resources Research Center, Shaanxi Normal University, Xi’an 710119, China
3
Shaanxi Institute of Geological Survey, Xi’an 710004, China
*
Author to whom correspondence should be addressed.
Atmosphere 2025, 16(6), 662; https://doi.org/10.3390/atmos16060662
Submission received: 18 April 2025 / Revised: 24 May 2025 / Accepted: 28 May 2025 / Published: 31 May 2025
(This article belongs to the Special Issue Desert Climate and Environmental Change: From Past to Present)

Abstract

Caragana korshinskii, a key species in China’s Grain for Green Project on the Loess Plateau, is effective in enhancing soil C sequestration. However, whether its contribution to SOC (soil organic carbon) stability persists over multi-decadal restoration chronosequences remains unclear. Using the time–space substitution method, we investigated the SOC fractions (POC, particulate organic C, and MAOC, mineral-associated organic C) dynamics across soil depths (0–10, 10–30, and 30–60 cm) in a 40-year chronosequence of C. korshinskii restoration, which is located in a comprehensive managed watershed on the Loess Plateau, China. The results showed that the C. korshinskii restoration chronosequence improved soil C sequestration at different scales compared to abandoned sites. In the middle phase (10–30 years), the concentration of SOC peaked at 35.88 g/kg, exceeding natural grassland (32.33 g/kg). Above- and belowground biomass accumulation drove SOC enhancement. POC as transient C inputs, and MAOC through mineral interactions, reach a peak at 7.98 g/kg which shows the greatest increase (276.81%). In the subsequent phase (after 30 years), MAOC dominated SOC stabilization, yet SOC fractions declined overall. MAOC contribution to SOC stability plateaued at 20–30%, constrained by soil desiccation from prolonged root water uptake. C. korshinskii provides the optimal SOC benefits within 10–30 years of restoration, highlighting a trade-off between vegetation-driven C inputs and hydrological limits in arid ecosystems. Beyond 30 years, C. korshinskii’s high water demand reduced SOC sequestration efficiency, risking the reversal of carbon gains despite initial MAOC advantages.

1. Introduction

The soil C pool, the largest C reservoir in terrestrial ecosystems, holds approximately 1500 Pg of C. This amount is 2–3 times larger than the C stored in the atmosphere and vegetation pools, respectively [1]. Even minor changes in soil C pools can have a profound effect on atmospheric CO2 levels, thereby acting in dual roles as both a source and a sink [2,3,4]. Improving soil C sequestration and reducing greenhouse gas emissions are key strategies for addressing climate change and managing the global C cycle [5]. Understanding the dynamics of SOC is particularly important in ecologically fragile regions [6,7], as human interventions—such as large-scale revegetation—can significantly affect carbon sequestration patterns. A prominent example is the Loess Plateau in China; it is one of the most erosion-prone areas in the world due to its fragmented terrain and uneven distribution of annual precipitation [8]. However, the Chinese government’s revegetation initiative, which began in 1999, has converted over 50,000 km2 of degraded land. Restoring dryland vegetation can mitigate land degradation, increase vegetation cover and enhance terrestrial C sinks [9]. Significant C sequestration in soil organic C (SOC) has been achieved through vegetation restoration activities, which have mainly focused on converting cropland into forest or grassland [10]. Thus, the interplay between the vegetation restoration chronosequence and SOC stabilization is especially pronounced in regions with legacy degradation.
As a drought-tolerant legume, C. korshinskii has an extensive root system, formidable resilience, and strong regeneration capacity. It contributes significantly to ecological restoration, soil and water conservation, and wind and sand control [11,12]. As a result, it has become the preferred species for reforestation and revegetation initiatives on the Loess Plateau, and plays a crucial role in improving the ecological environment of the arid and semi-arid zones in northwest China [13]. While it is widely accepted that vegetation restoration is effective in promoting SOC sequestration, uncertainties remain regarding the long-term impacts of C. korshinskii cultivation in enhancing SOC sequestration benefits and improving the stability of the C reservoirs. In particular, the substantial water consumption during C. korshinskii growth may have an impact on the soil’s dry depths [14]. At the same time, the aging process of C. korshinskii leads to the degradation of soil structure [15]. Despite the widespread implementation of C. korshinskii plantations for erosion control, their capacity to stabilize soil C pools remains poorly quantified. Critical uncertainties persist regarding: (i) how SOC fraction dynamics (e.g., POC vs. MAOC, particulate organic C vs. mineral-associated organic C) mediate C sequestration efficiency across restoration stages, and (ii) whether long-term revegetation (20 or 30 years) enhances or diminishes SOC stability under shrublands.
In recent years, there has been a growing research focus on soil C pools in the context of vegetation restoration [16,17,18], particularly regarding their C storage capacity and spatial distribution characteristics. Spatially, the effect of vegetation restoration on SOC varies significantly with soil depth [19]. Approximately 60% of SOC is concentrated in the upper 0–20 cm of the soil profile, highlighting the importance of topsoil in SOC sequestration [20,21,22,23]. It is widely acknowledged that vegetation restoration promotes the accumulation of SOC. However, the stability of SOC under different restoration patterns remains insufficiently studied [24]. Distinct vegetation restoration approaches—such as the afforestation of former croplands with artificial shrublands, or natural regeneration into grasslands—can lead to divergent SOC stabilization outcomes [25,26]. Recent studies have increasingly focused on the response of SOC to natural grassland restoration. For example, Liao et al. [27] reported that both POC and MAOC increased during natural grassland recovery, contributing jointly to SOC accumulation. Notably, even after 30 years, SOC levels had not reached a steady state, with the dominant SOC source shifting from microbially derived MAOC to plant-derived POC, reflecting the higher sensitivity of POC to grassland restoration. In contrast, artificial restoration using species such as Caragana korshinskii (a common shrub in arid regions) may influence SOC dynamics differently due to its unique physiological traits, particularly its impact on soil moisture regimes. Nonetheless, studies on SOC stability under artificial restoration remain limited and warrant further investigation. While chronosequence studies on natural vegetation restoration have significantly advanced our understanding of SOC stabilization mechanisms on the Loess Plateau over the past decade [28], critical knowledge gaps remain regarding the dynamics of SOC fractions under artificial restoration dominated by artificial plantations, such as C. korshinskii shrubland. The effects of the duration of artificial vegetation restoration on the accumulation, turnover, and sequestration mechanisms of SOC remain unclear [17,29]. In addition, the factors influencing the stability of SOC under the soil environment in the context of vegetation restoration chronosequences are not fully understood.
The stability of SOC pools is determined by different C fractions, each with different protection mechanisms and turnover rates. SOC was categorized into two fractions using particle-size thresholds: particulate organic carbon (POC, >53 μm) and mineral-associated organic carbon (MAOC, <53 μm). These physical separations not only reflect the properties and functions of the original state SOC, but also provide significantly more mechanistic information than bulk SOC alone [30,31,32]. They serve as a basis for understanding the formation and stability of SOC in response to environmental changes [33]. POC as transient plant-derived C, is mainly composed of semi-decomposed plant residues [30] and serves as a transitional active C pool in the conversion of plant residues to humus. It has characteristics such as a high C/N ratio, a short turnover time (5–20 years), and susceptibility to microbial decomposition [34]. In the short term, it is highly sensitive to environmental changes and has a short residence time in the soil, representing the active fraction formed by the turnover of plant-derived C sources [35,36]. In contrast, MAOC as mineral-stabilized pools, is composed of organic matter adsorbed by soil clay particles and charged minerals, which can exist stably in the soil for a long time through strong chemical bonds with the mineral surfaces [30]. Compared to POC, MAOC has a lower C/N ratio, a longer turnover time, and is less susceptible to microbial utilization. Its proportion in SOC may indicate the stability of the C pool [37,38].
Therefore, the primary objective of our study was to characterize the temporal dynamics of POC and MAOC distribution and their controlling factors in soils under C. korshinskii plantations across a 40-year restoration chronosequence (10, 20, 30, and 40 years), with particular emphasis on their vertical depth in the 0–60 cm soil profile. Specifically, we aimed to quantify how the long-term restoration chronosequence affects both the accumulation patterns and stabilization mechanisms of SOC fractions in this artificial restoration model, with particular attention to stage-dependent transitions in C sequestration efficiency. Three key hypotheses guided our study of C. korshinskii artificial restoration: (1) The contribution of plant-derived carbon to SOC exhibits stage-dependent variation, with sequestration efficiency declining in the later stages due to shrub aging; (2) MAOC increases proportionally with restoration duration and soil depth, reflecting enhanced stabilization; and (3) SOC stability is primarily controlled by MAOC, mediated by changes in soil properties induced by C. korshinskii across restoration stages. By testing the above hypotheses, we aim to understand the effect of C. korshinskii shrubland on SOC sequestration during different restoration chronosequence periods, with a focus on C pool stability. This will support the scientific management of C. korshinskii plantations by providing a theoretical basis for understanding the stability of the soil C storage under artificial modes in long-term restoration chronosequence scales.

2. Material and Method
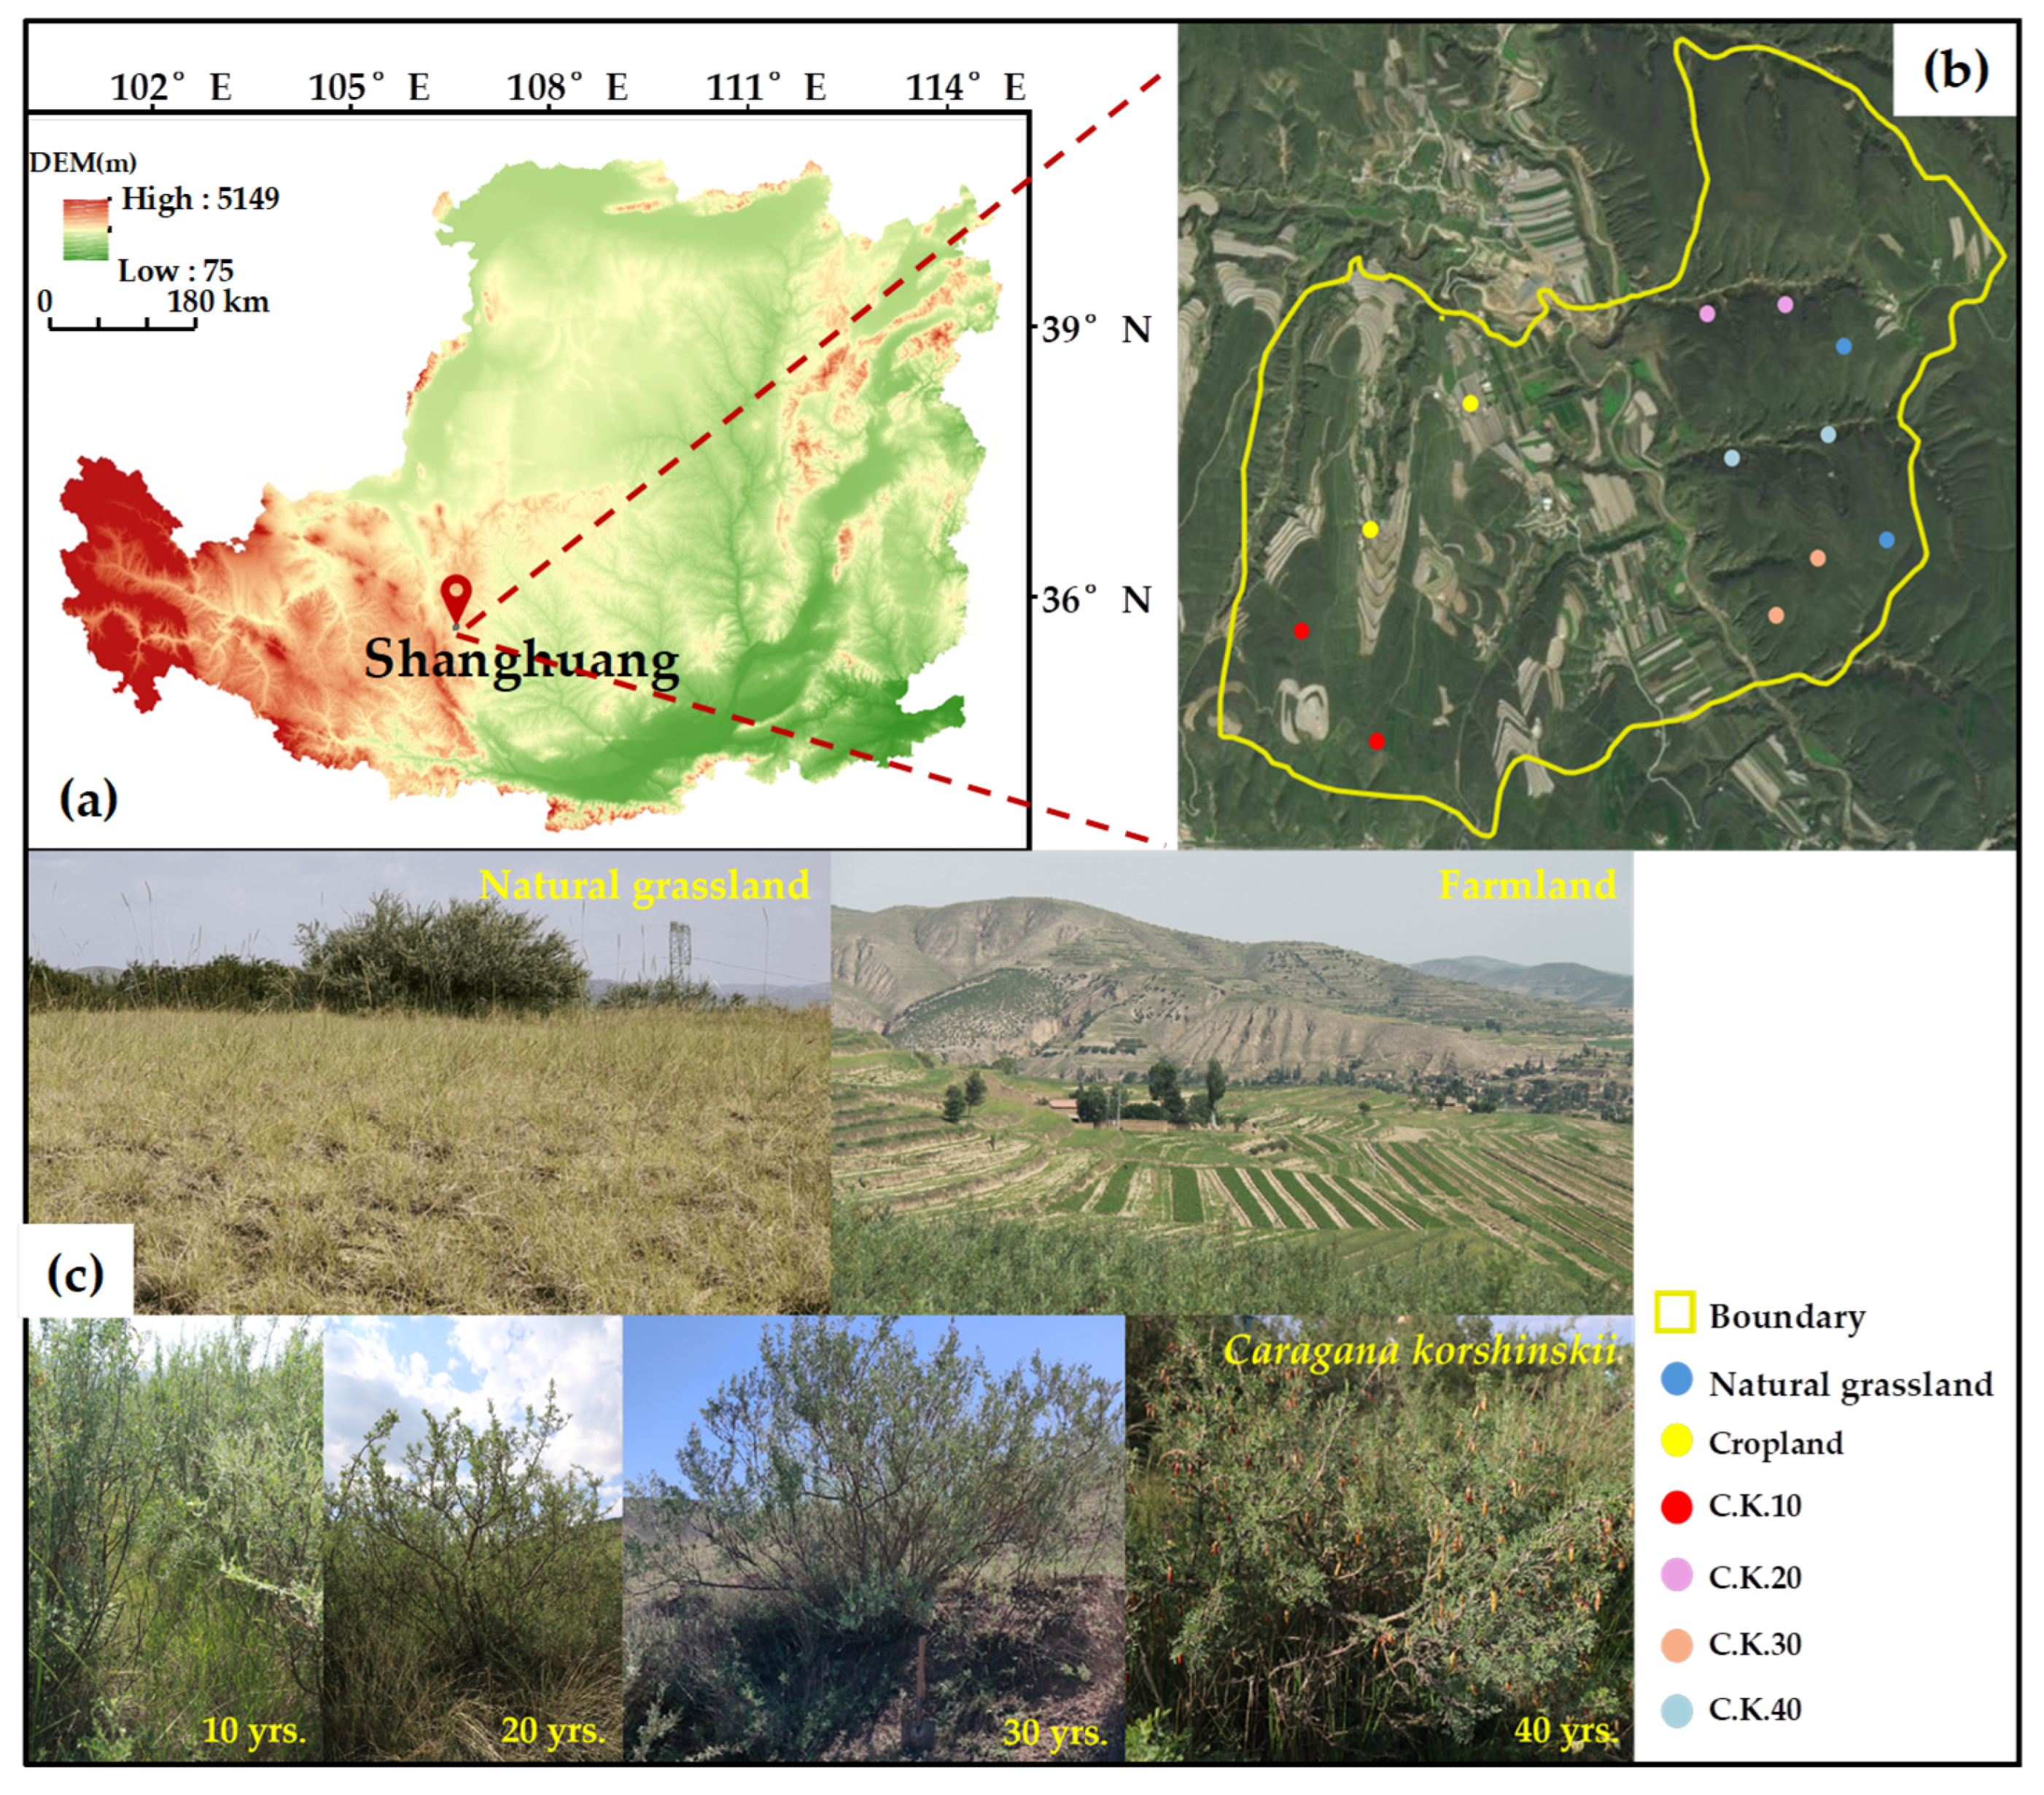
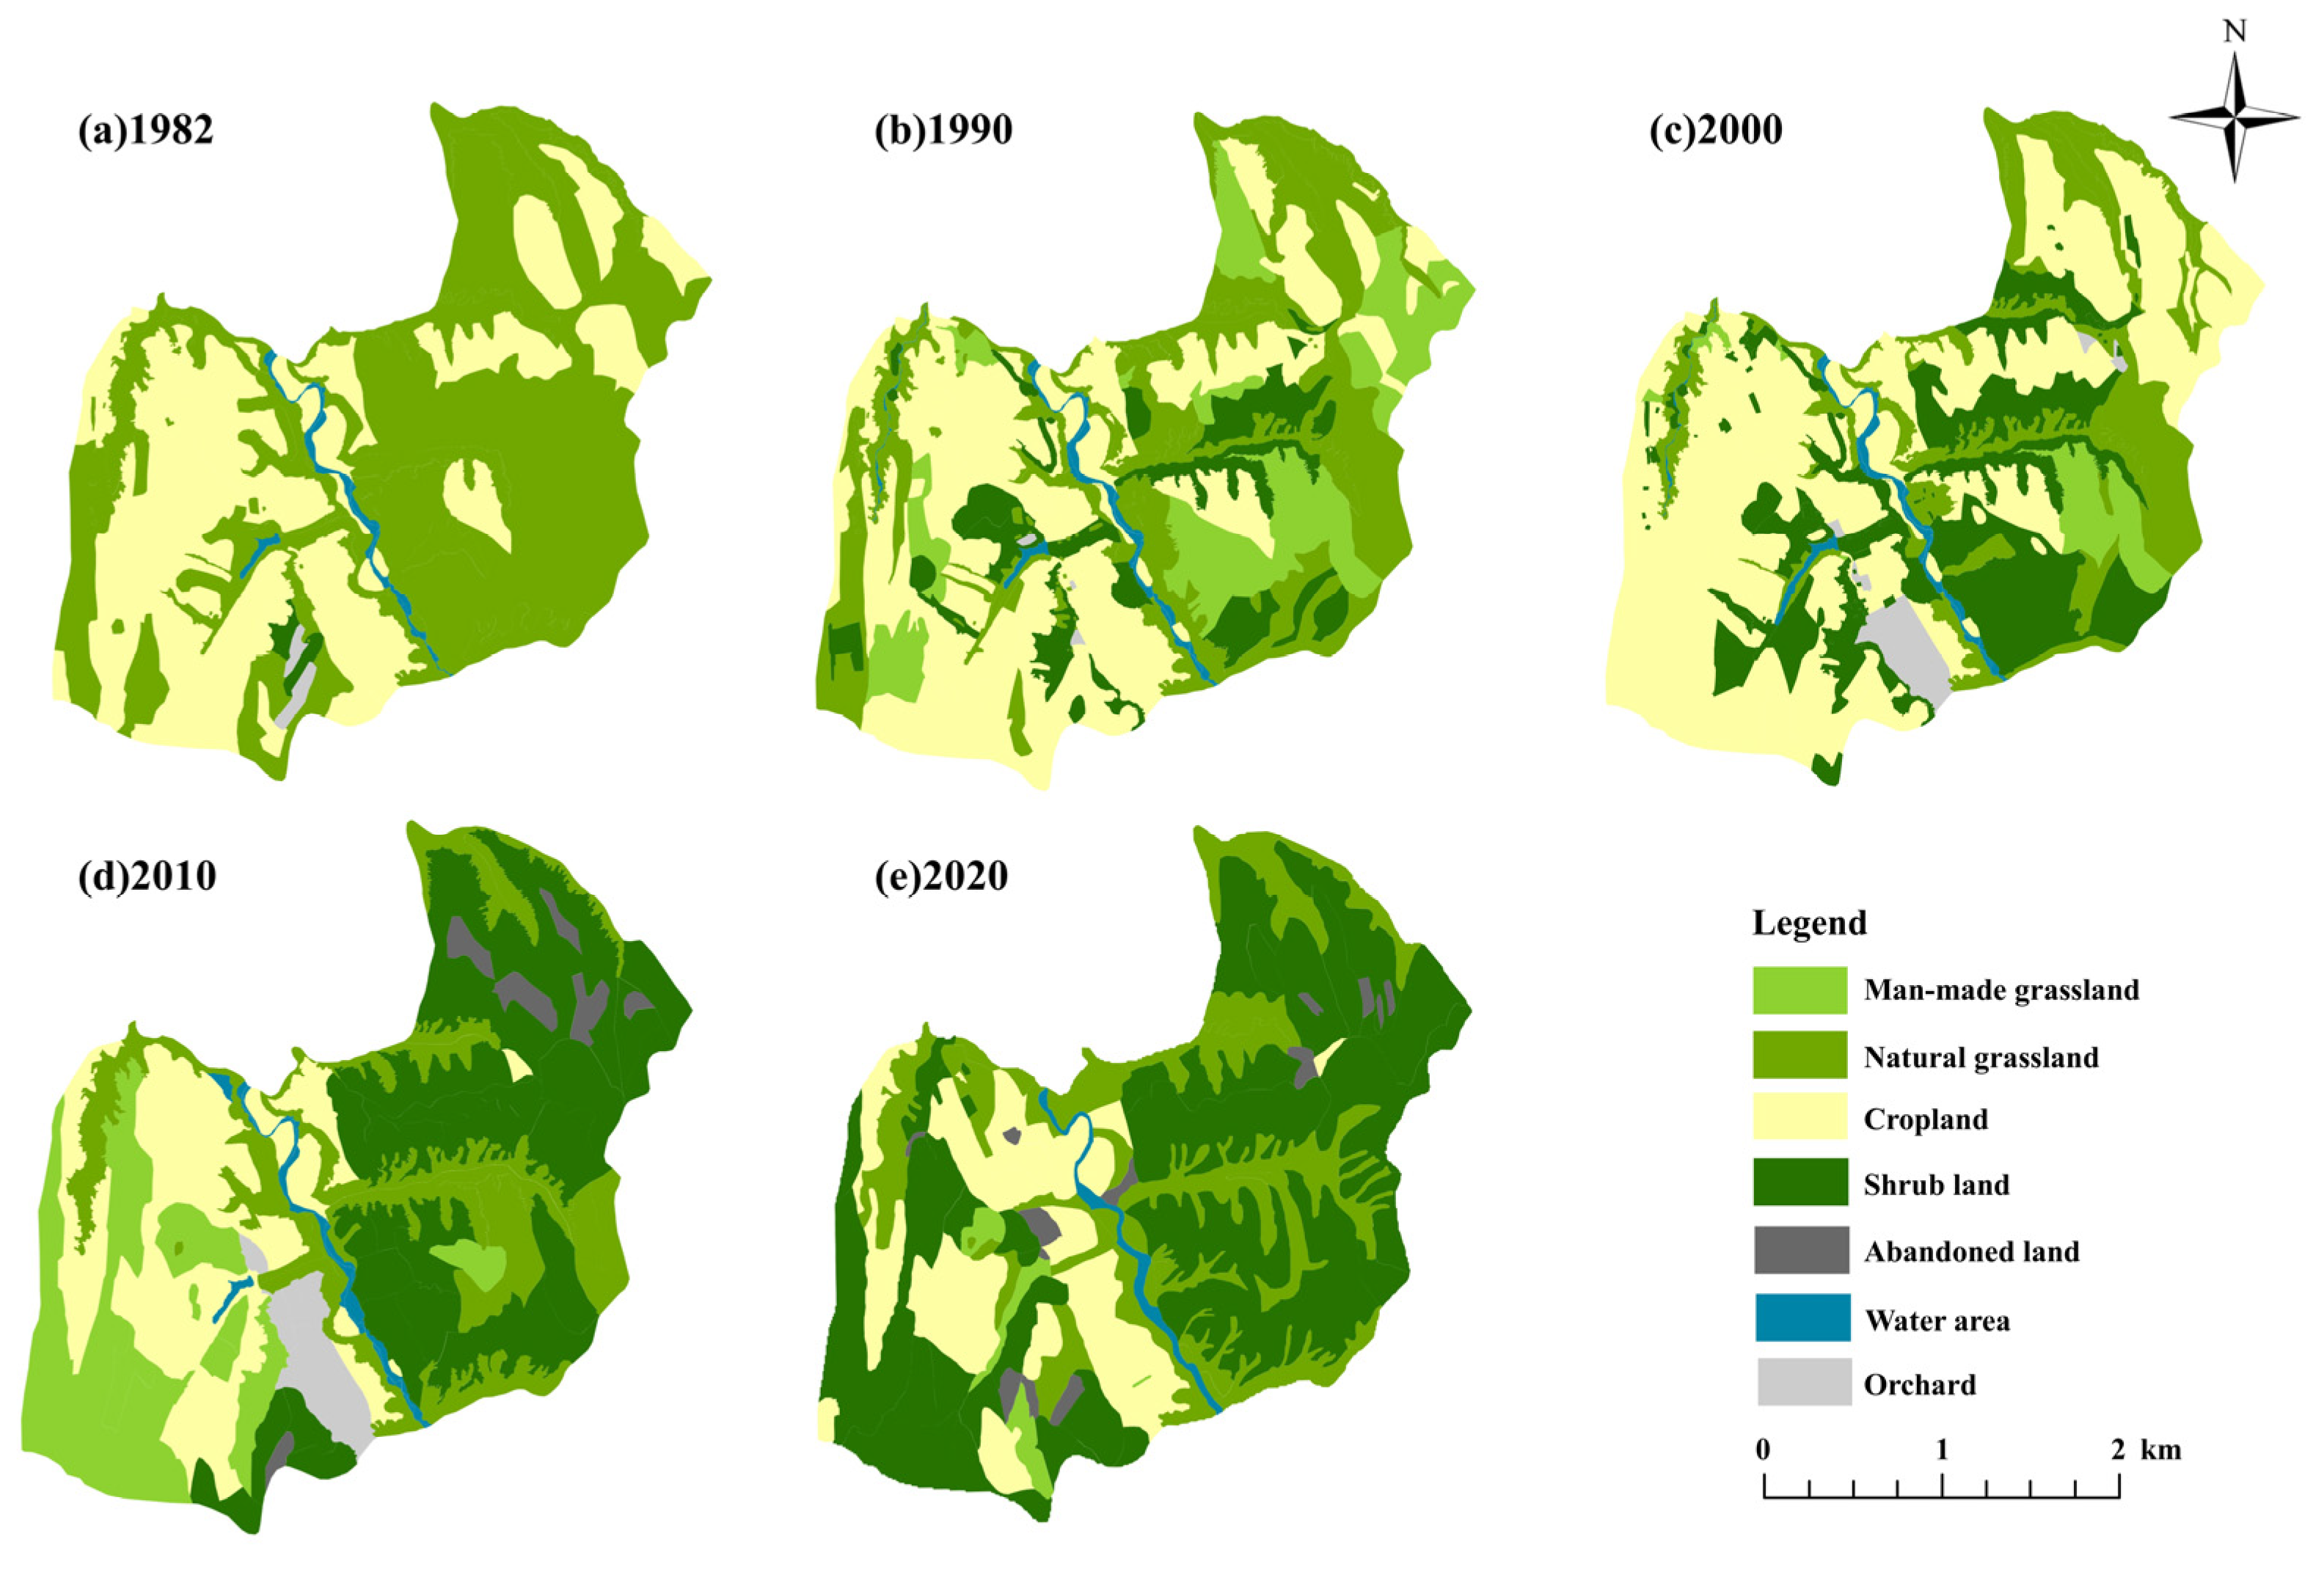
2.1. Study Area

The small watershed Shanghuang (106°26′–106°30′ E, 35°59′–36°02′ N) is located in the hilly gully region of the Loess Plateau, Guyuan, Ningxia Province (Figure 1a). The region belongs to the temperate and semi-arid climate zone, with an annual average temperature ranging from 5–8 °C, an effective accumulated temperature of 2000~3000 °C (≥10 °C), and an average annual precipitation of about 420 mm [39]. According to the WRB (World Reference Base for Soil Resources), the soil type in the study area is predominantly Cambisol, with high erodibility, which developed from primitive or secondary loess parent material [28]. The small watershed has experienced nearly 50 years of comprehensive management since the 1970s [21], which covers an area of 8.19 km2 (Figure 1b). The 1982 survey noted that 90% of the area is hilly and 51% of the land is between 1530 m and 1822 m, resulting in a distinctive landscape of gullies and steep slopes [40]. It is also characterized by severe soil erosion, ecological degradation and low agricultural productivity (Figure 2). The aim of comprehensive management is to control soil erosion and improve soil quality in order to make effective use of land resources. The revegetation program employs spatially differentiated strategies: (1) artificial restoration through horizontal benches on steep slopes (>25°) for planting deep-rooted shrubs, predominantly C. korshinskii to control soil erosion, and (2) passive natural restoration on moderate slopes (<25°), where grassland ecosystems are allowed to regenerate spontaneously via seedbank recruitment. Over the past 50 years of ‘Grain for Green’ implementation, this dual approach has successfully transformed degraded landscapes. It has become a model for comprehensive land management [39]. Though field surveys in 2020 and the interpretation of satellite and remote sensing imagery, the main land uses and vegetation types of the study area were identified: shrubland (C. korshinskii), artificial grassland (Medicago sativa), natural grassland (Artemisia vestita, Stipa bungeana, etc.), farmland (maize and wheat), and abandoned farmland (Figure 2). Detailed information on the land use types is given in Table S1, where the main land uses are shrub land (3996 ha) > natural grassland (1773 ha) > farmland (1289 ha) > other (1102 ha).

2.2. C. korshinskii Plantations and Management

Caragana korshinskii, a leguminous shrub, is widespread on the Loess Plateau. It is a popular plant for restoring vegetation in areas with low rainfall and eroded land [26]. C. korshinskii was extensively planted on steep slopes in belts (row spacing 3 m and adjacent seedling spacing 1.5 m) with extensive management. The belts were oriented parallel to the dominant soil erosion contour. Prior to restoration, the vegetation cover (Artemisia vestita, Stipa bungeana, Thymus mongolicus, etc.) was generally less than 10% and water erosion was common. After 5 years of planting, C. korshinskii has grown into a belt of shrubs about 1 m high. With a gradual stabilization of the eroded land, short grasses, legumes and herbs invaded, and a stabilized shrub–grass system was established. So far, time intervals since the initiation of artificial revegetation throughout the small watershed are represented by a series of 10-, 20-, 30- and 40-year-old C. korshinskii, which were planted around 2012, 2002, 1992, and 1982, respectively (Figure 2c). The restoration chronosequence stages in this study are defined by the time since the government-led revegetation practices, representing a human-assisted recovery chronosequence rather than natural succession. After C. korshinskii has been growing for more than 10 years, older branches are pruned to encourage regeneration.

2.3. Soil Sampling

The availability of closely spaced C. korshinski plantations established 10, 20, 30, and 40 year ago on eroded soils with similar characteristics was the reason for the retrospective approach in this study. Thus, the plantations on similar sites provide a temporal gradient of shrub cover. Changes in soil properties can be measured by comparing sites of different shrubland ages. For each plantation age (10, 20, 30, and 40 years), two sample plots of 10 m × 10 m were selected with essentially the same elevation, slope direction, and slope (Figure 2b). Each sample plot was laid out in an ‘S’ pattern and sampled using a non-equidistant irregular grid method with 6–7 replicates taken for each site using a 20 × 5 cm soil auger. A sampling depth of 0–60 cm was implemented, with the total depth divided into three depths, namely 0–10, 10–30, and 30–60 cm. In addition, two unvegetated sites (abandoned farmland) and naturally restored vegetation communities (natural grassland) were selected as chronosequence controls in the vicinity of the planted sites. The soils at each site were assumed to be similar before planting. A total of 60 soil samples were collected, 6 (4 shrublands + abandoned cropland + natural grassland) × 2 (sample plots) × 5 (sampling sites) × 3 (soil depths). Each fresh soil sample (1.5–2.0 kg) sample was submitted for laboratory analysis. After air-drying at room temperature, all soil samples were passed through a 2 mm sieve. The soil sampling method we used is consistent with that described in references [28,41].

2.4. Measurement of Soil Properties and Soil Organic C Fractions

Basic soil characteristics: The following parameters were measured for each sample: soil organic C (SOC, g·kg−1), soil total nitrogen (TN, g·kg−1), soil total phosphorus (TP, g·kg−1), and soil microbial biomass C, N, and P (MBC, MBN, and MBP, mg·kg−1). SOC and TN were measured using the potassium dichromate method [42] and the micro-Kjeldahl method [43]. TP was quantified after acid digestion using Shimadzu F-4600 fluorescence spectrophotometer at 660 nm (Japan) [44]. MBC, MBN, and MBP were measured by the chloroform fumigation-extraction method [45].
Soil organic C fractions analysis: To address the study’s objective of characterizing soil C pool stability mechanisms, SOC was divided into two operationally defined fractions based on particle-size separation (modified from [30]). POC and MAOC were separated using a modified particle size fractionation method [46]. This method effectively divides SOC into these two pools. Soil samples (10 g) were vortexed with 30 mL of sodium hexametaphosphate solution (NaHMP, 50 g/L) at 200 rpm. To disperse the soil aggregates, the mixture was agitated on a rocking bed for 18 h. The resulting suspension was poured through a 53 μm and 250 μm sieve and washed with water until the effluent was clear. This ensured the removal of fine particles. The material retained on the 53–250 μm sieve was dried in a 60 °C oven and weighed. The organic C content of each particle fraction was then determined and multiplied by the proportion of soil retained by each fraction to calculate the POC content. For particles that passed through the sieve (<53 μm), the material was also dried at 60 °C and weighed, allowing for the MAOC content to be calculated.

2.5. Statistical Analyses

In this study, two-way ANOVA and least significant difference (LSD) tests were performed using SPSS 26.0 to analyze the effects of different years and soil depths on soil organic C fractions. Before the ANOVA was performed, the Shapiro–Wilk test was used to check for normality and the Levene test was used to assess the homogeneity of variance. The results showed that there were no outliers and that the residuals were approximately normally distributed (p > 0.05), demonstrating the homogeneity of variance.
Linear regression analysis was performed in Origin 2024 to explore the relationship between the levels of different soil organic C (SOC, POC, and MAOC) fractions and restoration chronosequence years (10, 20, 30, and 40 years).
To comprehensively evaluate the influence of soil properties on soil carbon fractions during ecological restoration, we conducted a series of statistical analyses. First, soil properties were categorized into three functional groups: soil physical characteristics (SPC), soil chemical characteristics (SNC), and soil microbial (biological) characteristics (SMC). Specifically, SPC included bulk density (BD), soil porosity (SP), soil moisture content (SMC), and average soil particle size (GS). SNC comprised soil carbon dioxide emissions (CO2-C), ammonium nitrogen (NH4+-N), nitrate nitrogen (NO3-N), total nitrogen (TN), and available potassium (AK). SMC encompassed microbial biomass carbon (MBC), microbial biomass nitrogen (MBN), and microbial biomass phosphorus (MBP).
We then conducted pairwise Pearson correlation analyses between these three soil property categories and three major SOC fractions: POC, MAOC, and total SOC. These analyses were performed separately for four ecosystem restoration stages—10, 20, 30, and 40 years after restoration began—to assess how these relationships evolved over time.
To further disentangle the complex interactions and contributions of different soil property categories to SOC dynamics, we applied Mantel tests and variance partitioning analysis (VPA) using the vegan package in R (http://www.r-project.org). The Mantel test quantified the strength and significance of the overall correlation between dissimilarity matrices derived from SPC, SNC, and SMC and those of SOC fractions. This allowed us to evaluate how closely changes in each soil property category were associated with variations in soil carbon pools.
Additionally, VPA was used to partition the variance in POC, MAOC, and SOC into components uniquely or jointly explained by SPC, SNC, and SMC. This analysis provided insights into the direct and indirect contributions of physical, chemical, and biological soil processes to the stabilization and transformation of organic carbon during restoration. By quantifying the relative explanatory power of each group, we were able to identify the dominant soil factors driving organic carbon dynamics across different restoration stages.
All statistical analyses were carried out using R software (v4.3.2), SPSS 26.0 (SPSS Inc., Chicago, IL, USA), and Origin 2024 (OriginLab Corp., Northampton, MA, USA).

3. Results

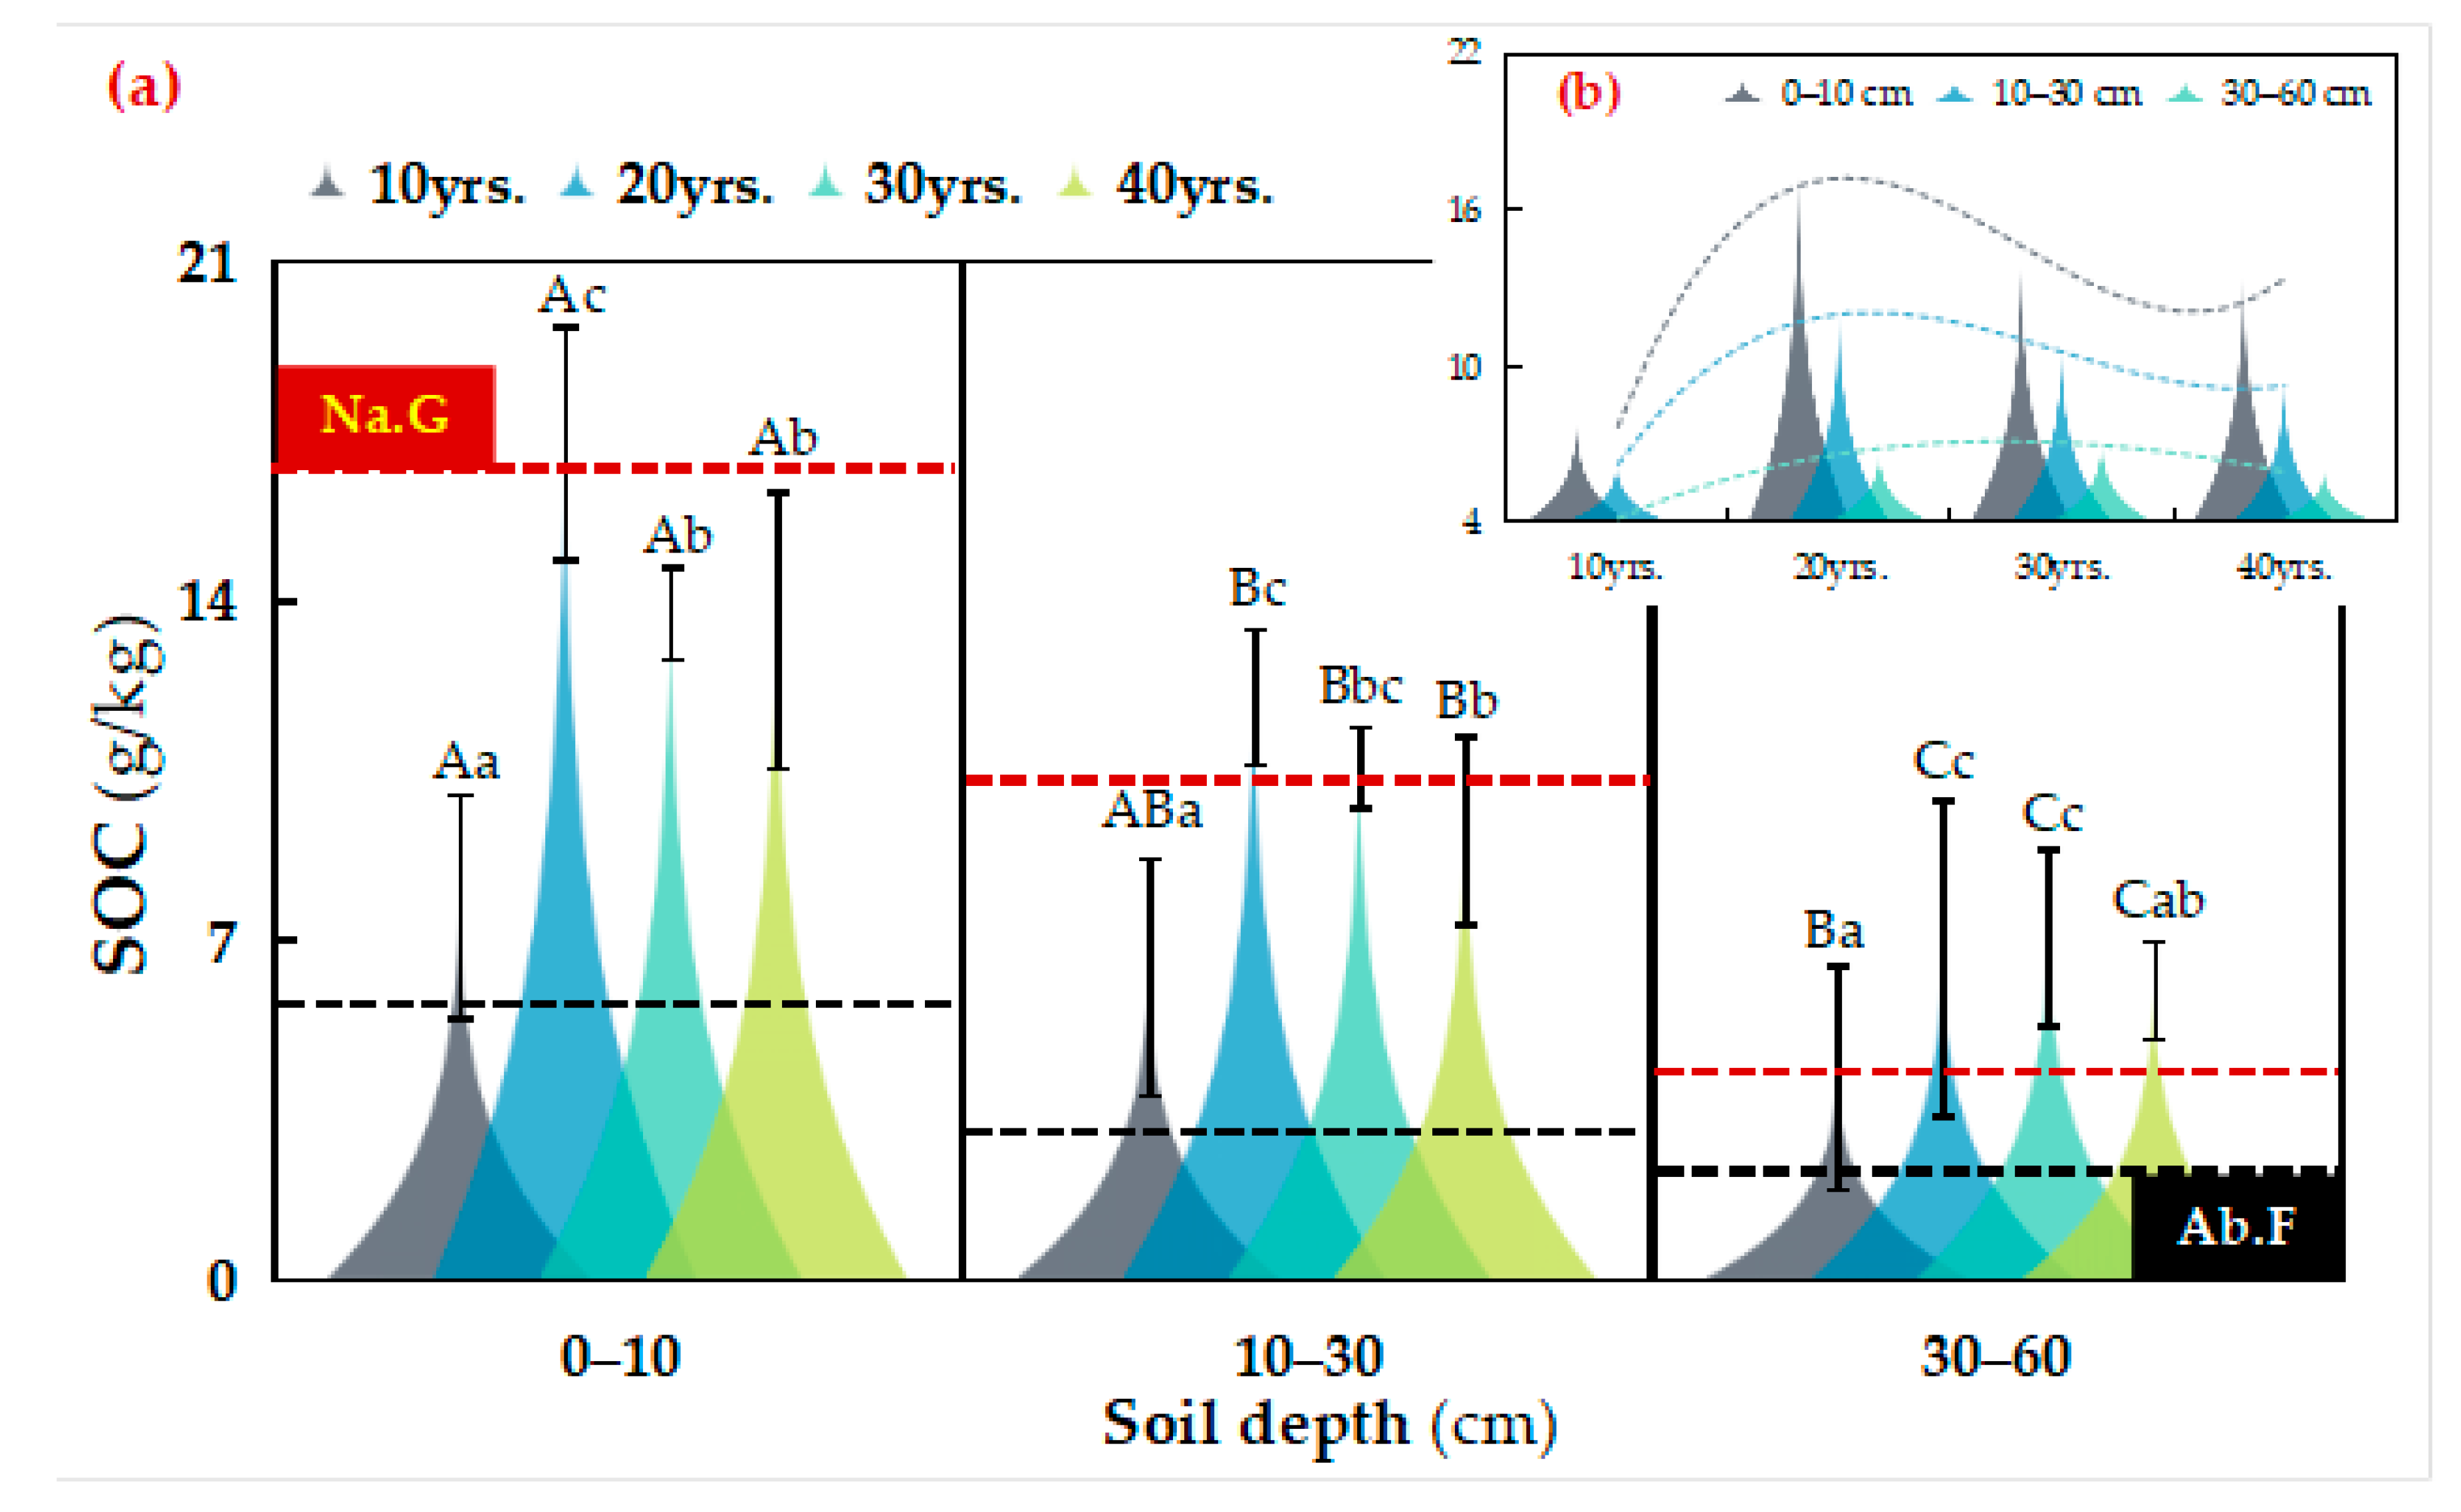
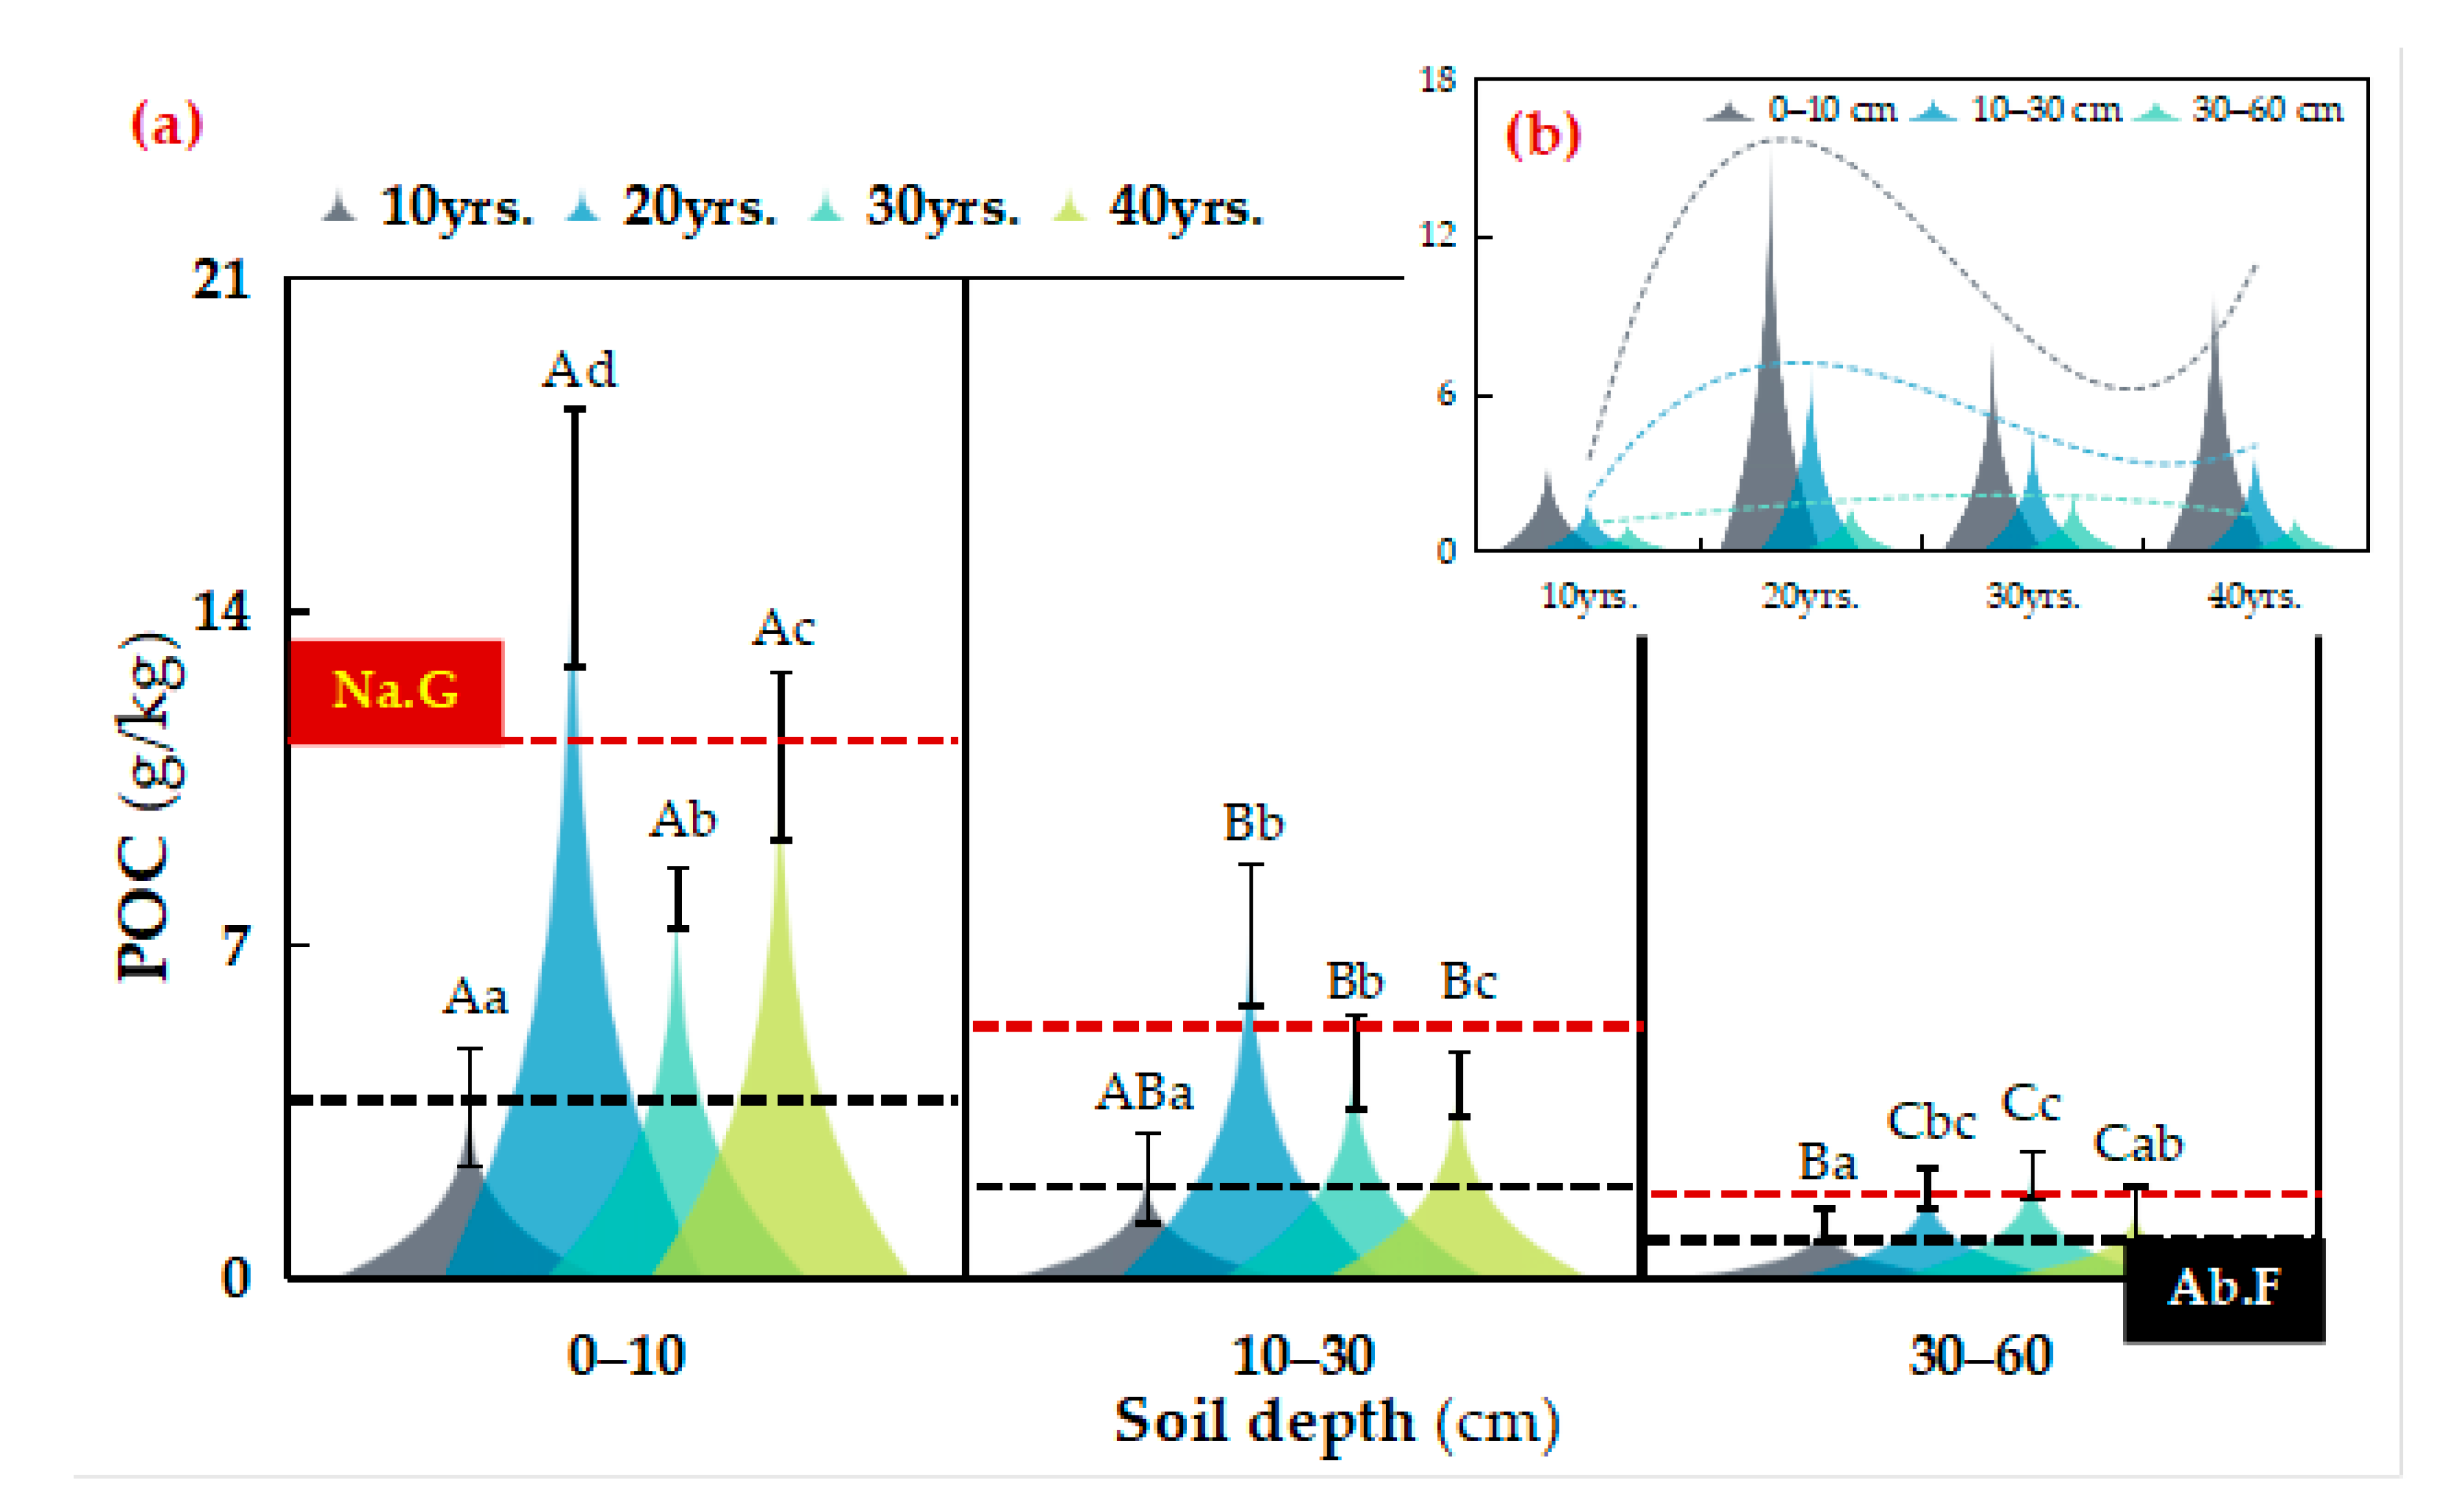
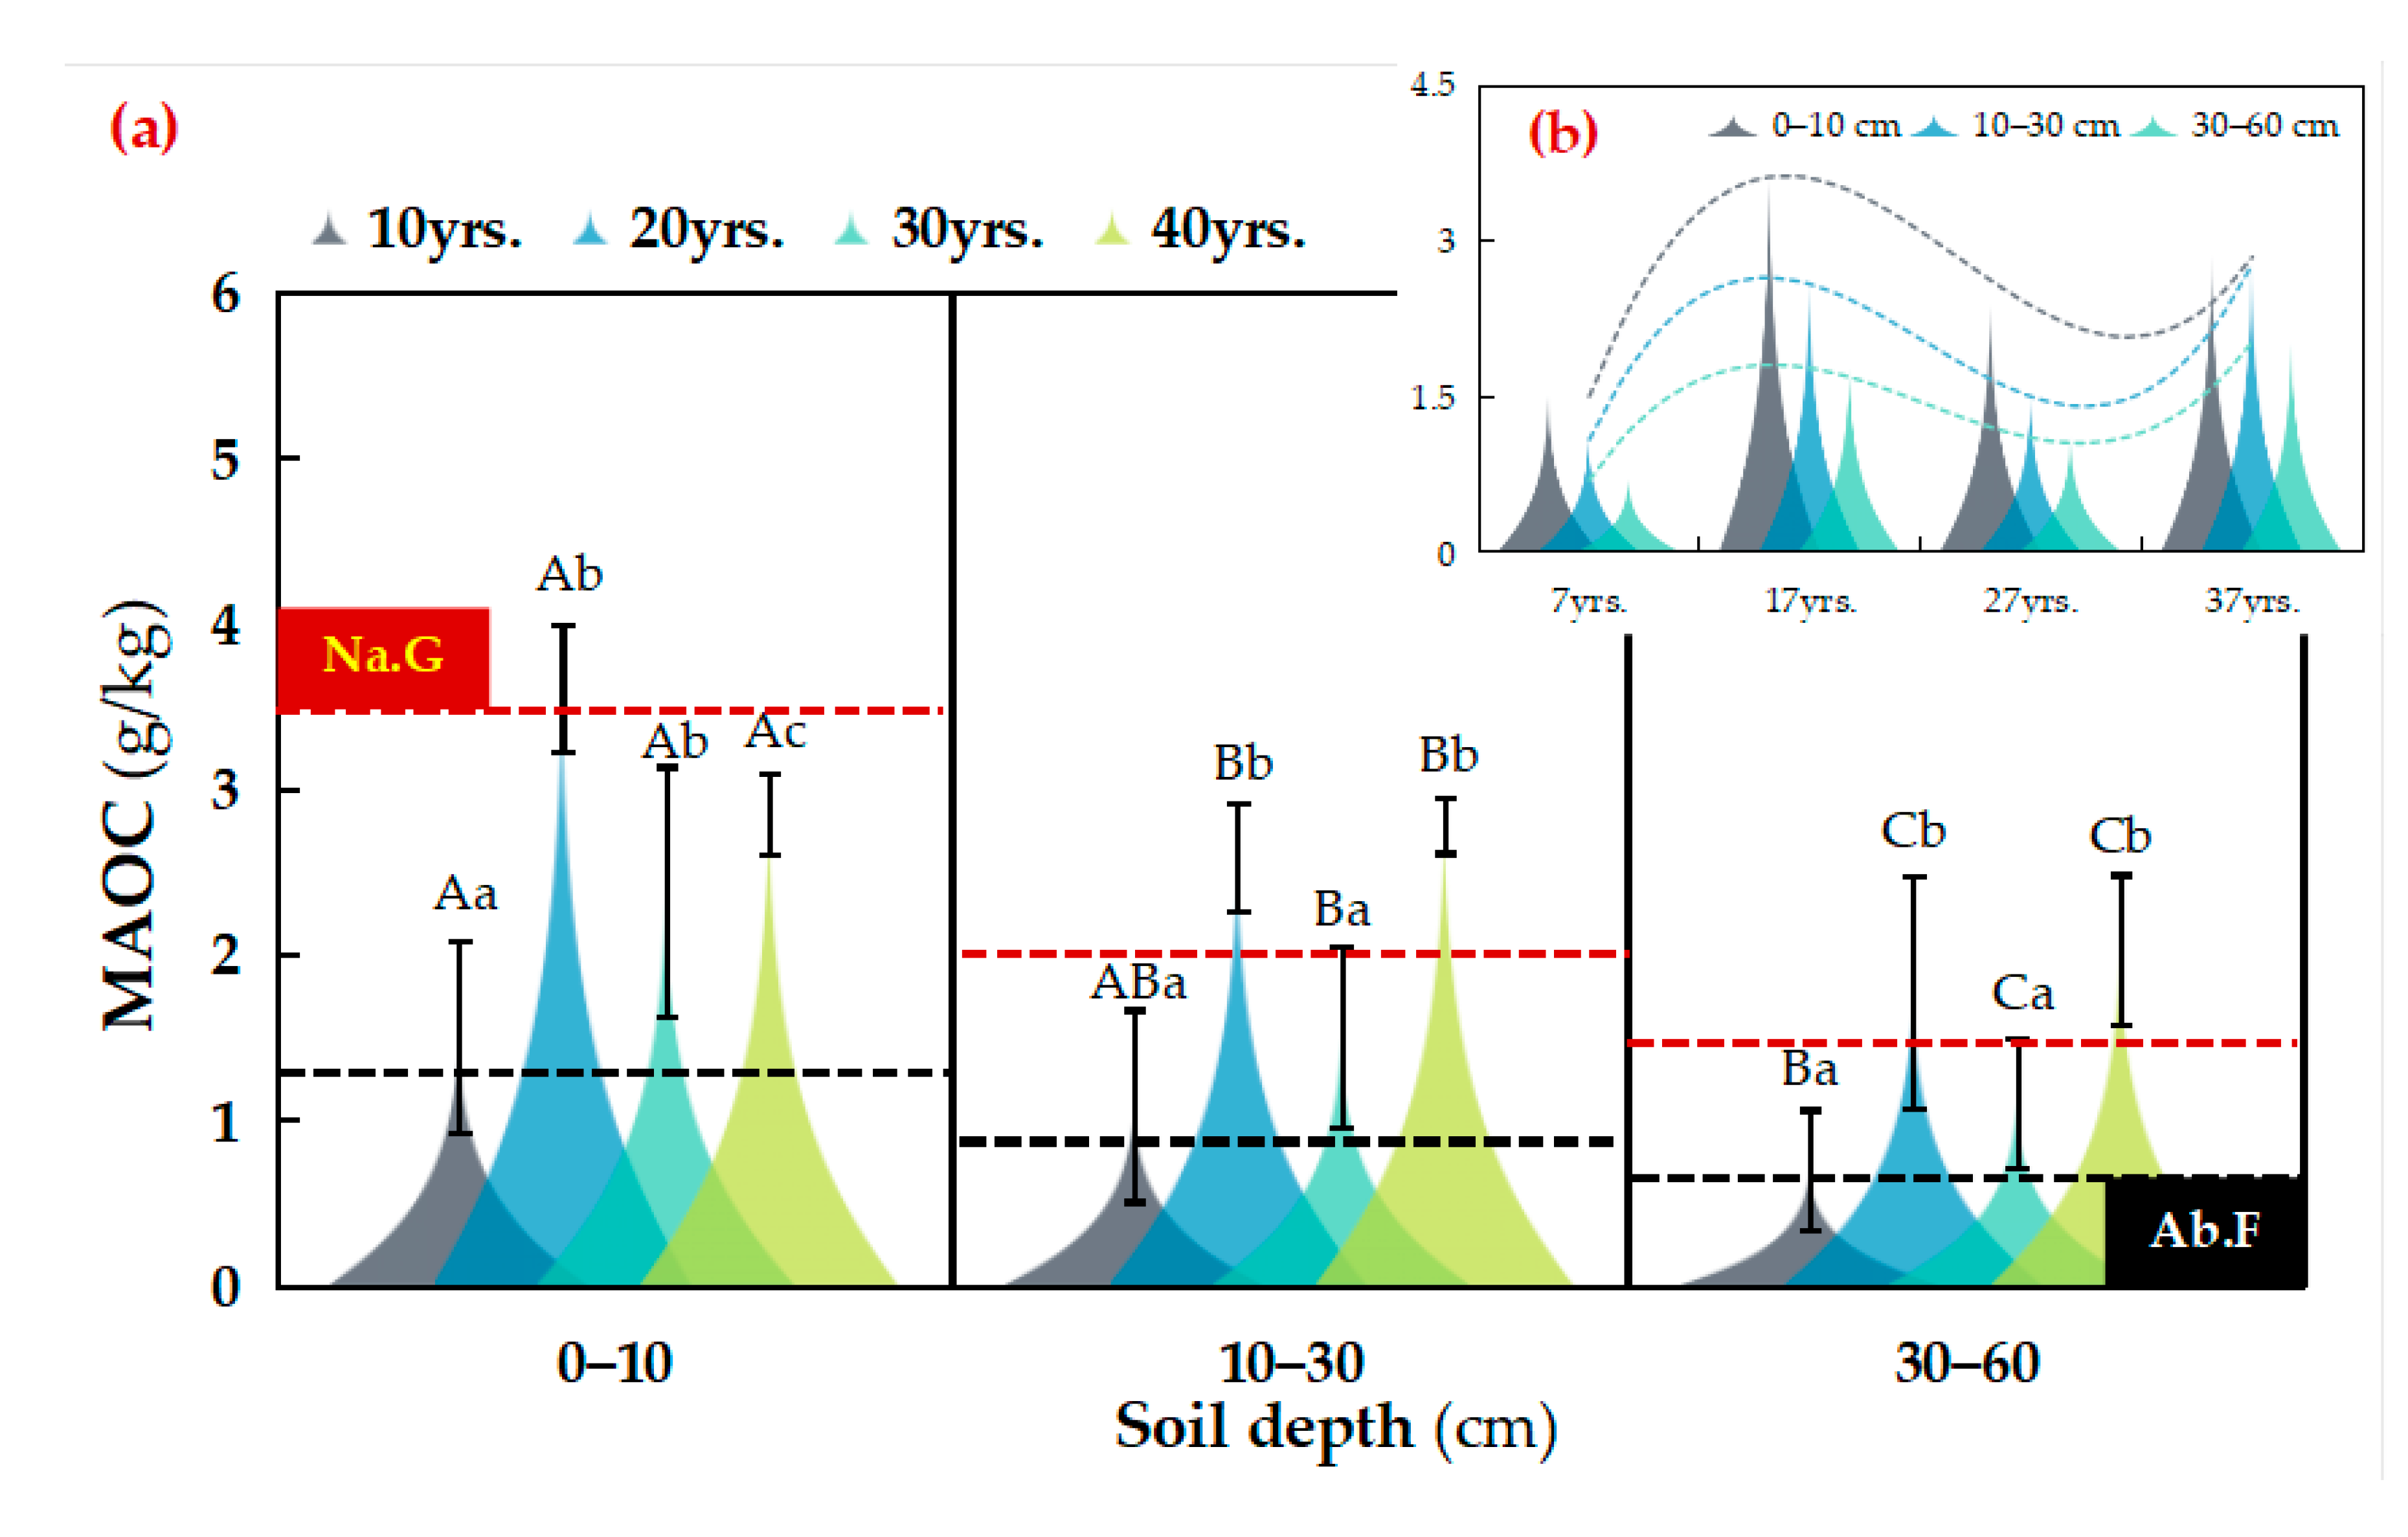
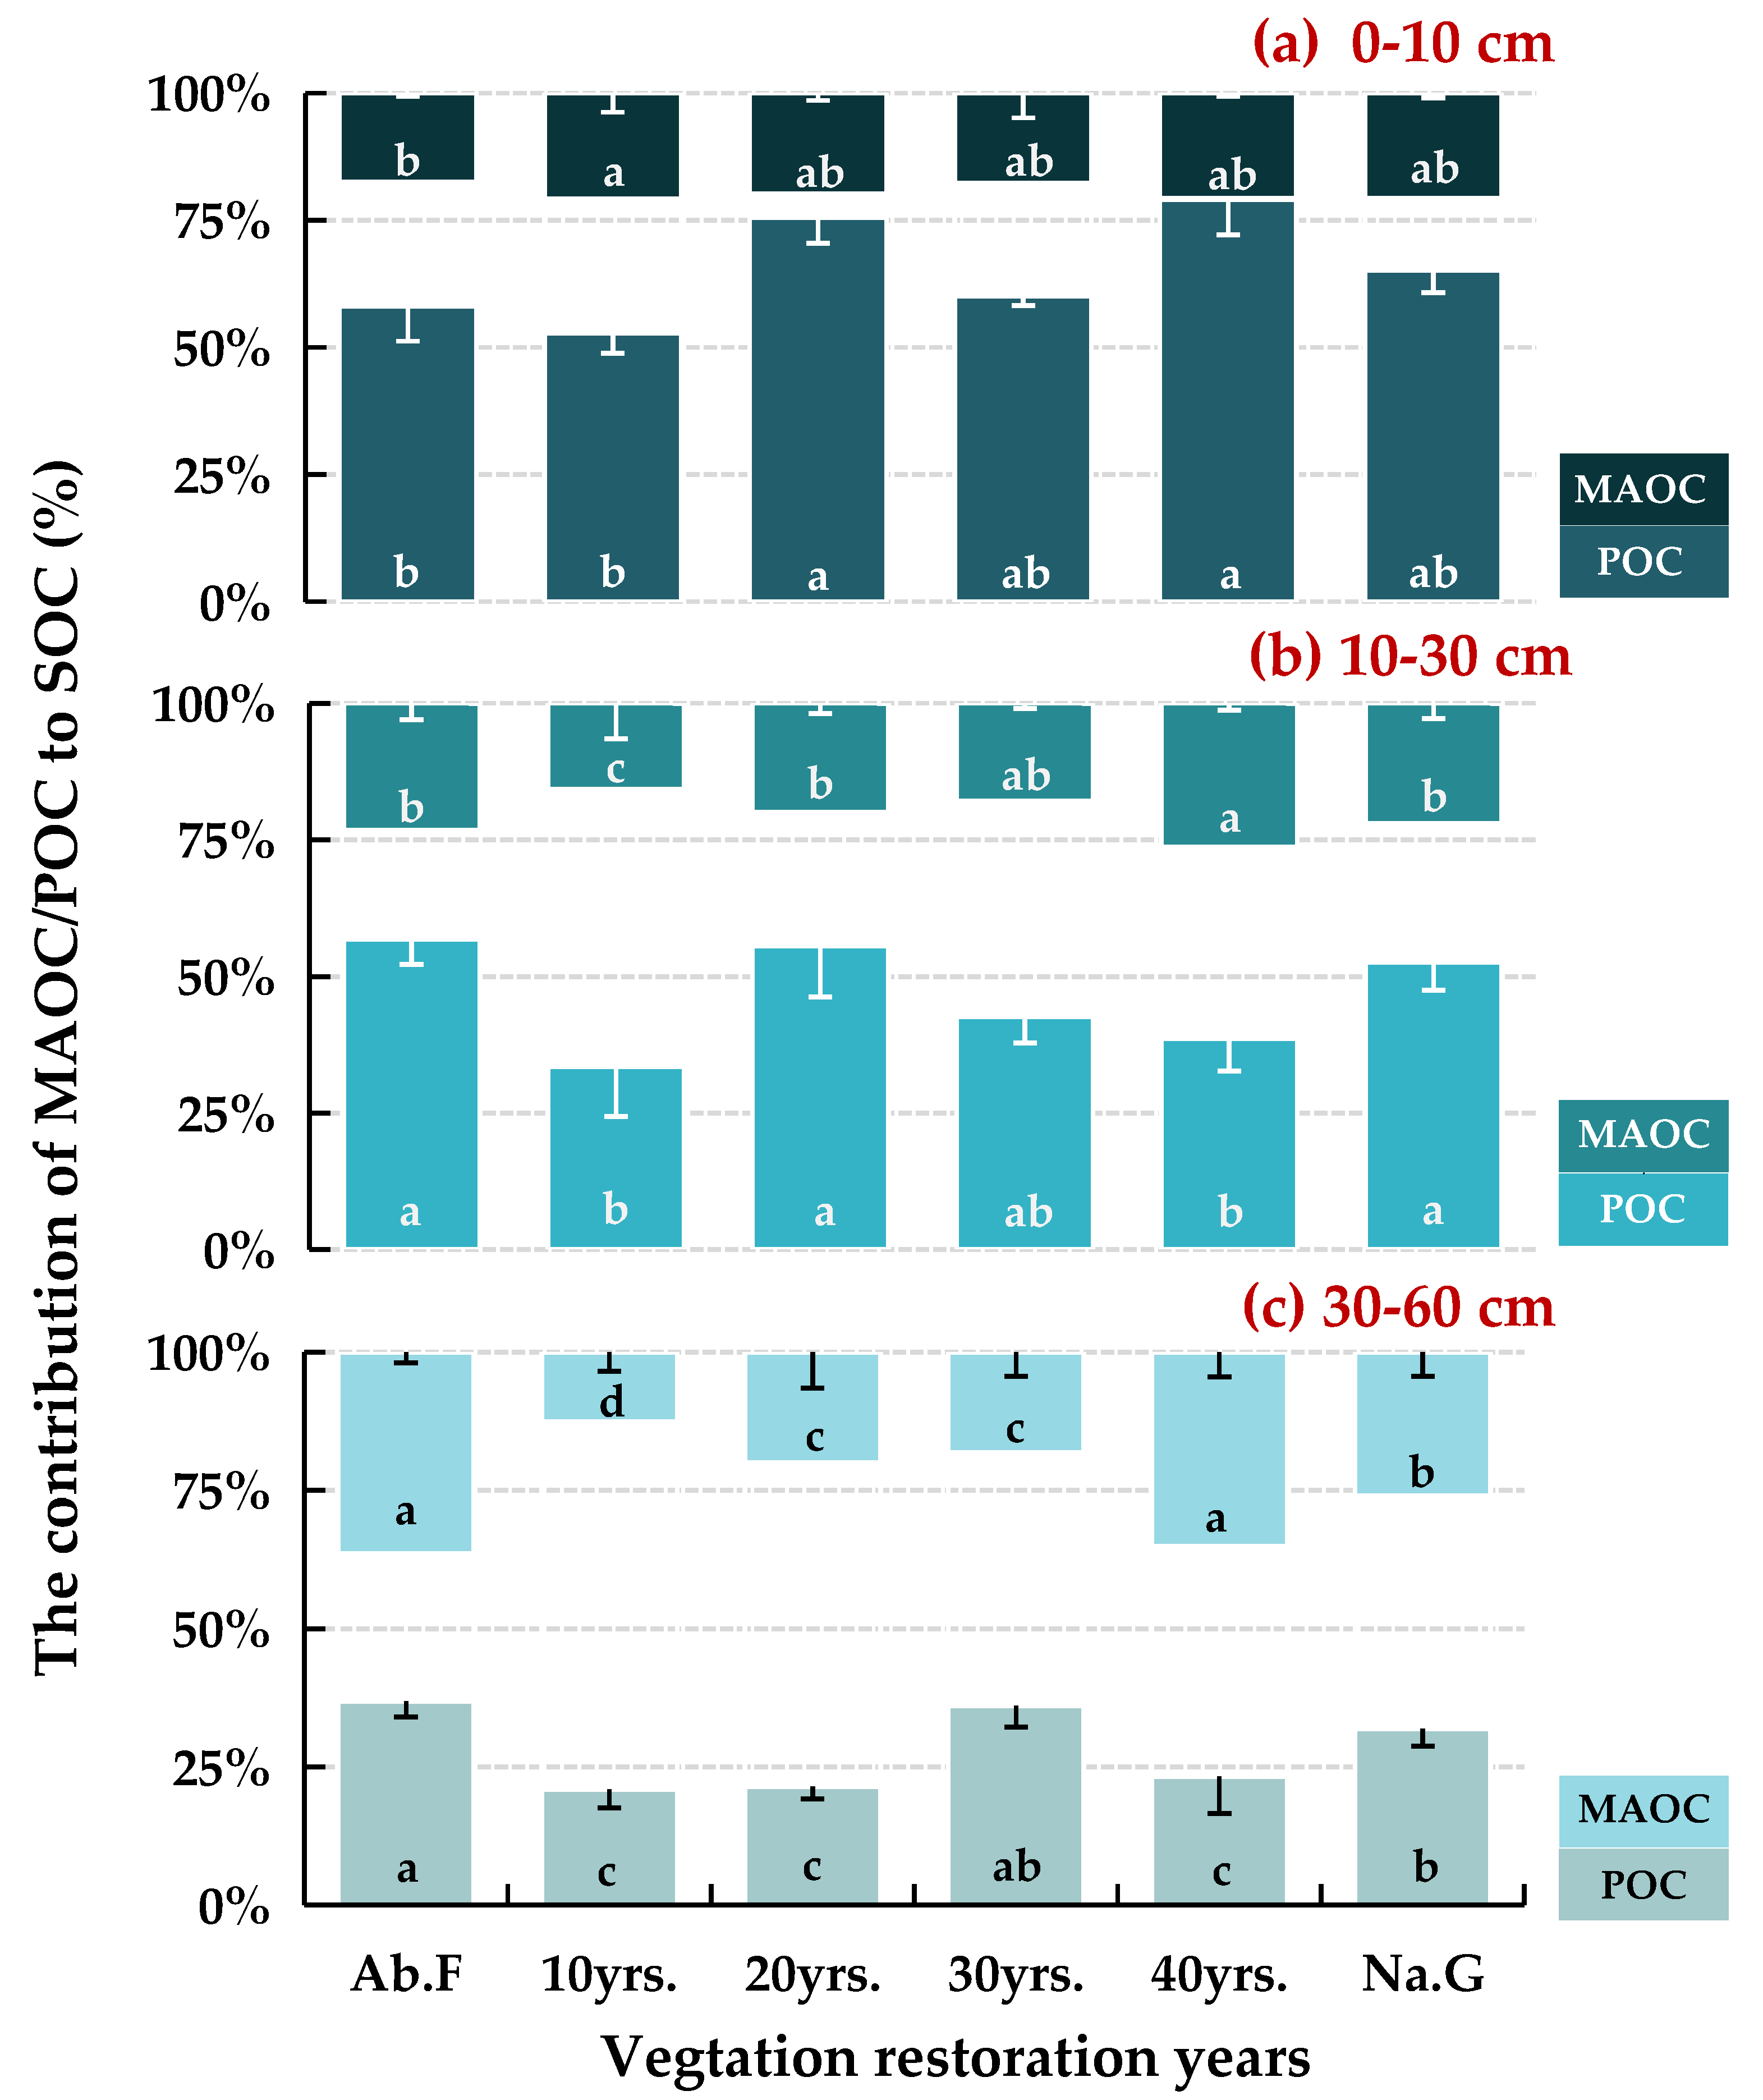
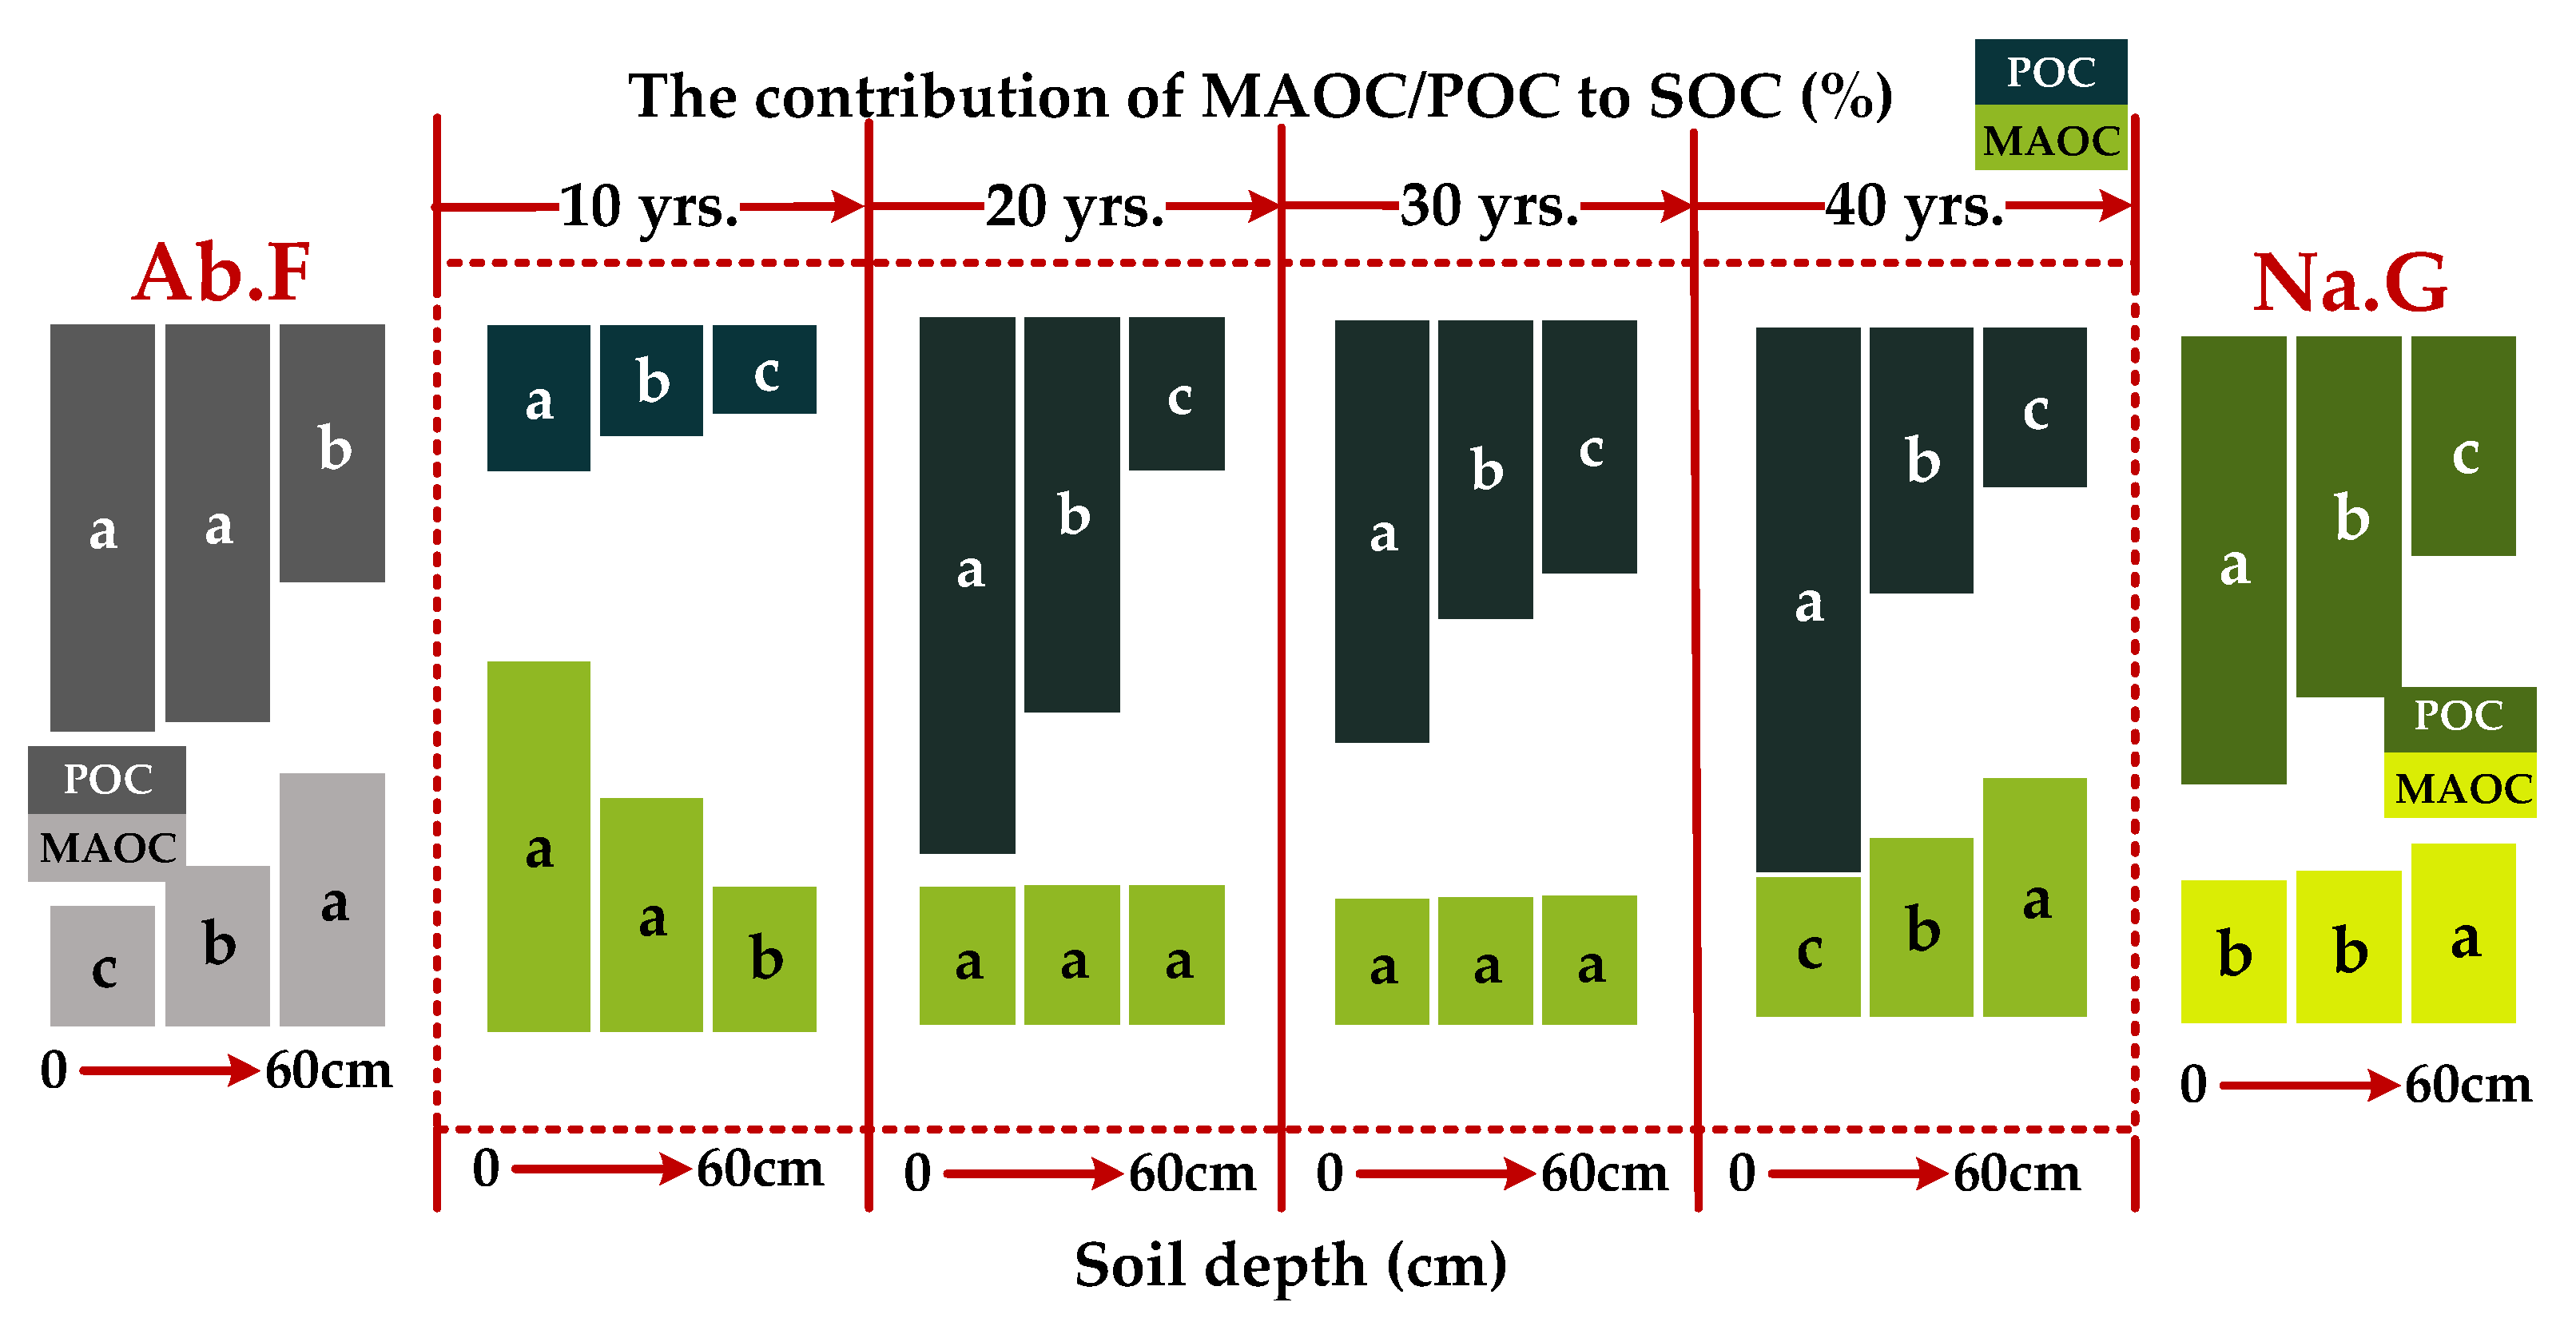
3.1. Distribution of SOC Fractions in Different Vegetation Restoration Chronosequence Years

As shown in Figure 3, SOC in the different restoration chronosequence years showed a significant decreasing trend with increasing soil depth, except for in 10 yrs. C. korshinskii shrubland restoration chronosequence stages, where the differences were not statistically significant (p < 0.05). Compared to the abandoned farmland, the concentration of SOC increased to varying degrees in the different restoration chronosequence periods, with the highest increase (206.14%) in 20 yrs. (35.88 g/kg). The SOC contents in the 0–10 and 10–30 cm depths are 2.59–3.44 and 1.81–2.12 times higher than that in the 30–60 cm depths, respectively. As the restoration chronosequence years progressed, the SOC level showed a trend of initially increasing and then declining. The values in three soil depths peaked at 20 yrs. (0–10 and 10–30 cm) and 30 yrs. (30–60 cm). For the other years, it followed the order of 20 yrs./30 yrs. > 40 yrs. > 10 yrs. It should be noted that the significance analysis indicated variations in the years of SOC reduction across different soil depths of C. korshinskii shrubland. Specifically, the concentration in the 0–10 cm and 10–30 cm depths decreased significantly between 20 yrs. and 30 yrs., while the decrease in the 30–60 cm soil depths occurred between 30 yrs. and 40 yrs.
As shown in Figure 4, the concentration of soil particulate organic C (POC) decreases significantly with increasing soil depth (p < 0.05), with the differences being most pronounced in 20 yrs. C. korshinskii shrubland. During this restoration chronosequence period, the POC contents in the 0–10 and 10–30 cm depths are 8.27 and 3.84 times higher than that in the 30–60 cm depths, respectively. Similar to the distribution of SOC, the orders of POC in the 0–10 and 10–30 cm depths are as follows: 20 yrs. > 40 yrs. > 30 yrs. > 10 yrs. In the 40 yrs. shrubland, the concentration in the 0–10 cm depths is significantly greater than that in the 30 yrs shrubland. In the 30–60 cm depths, POC exhibits a different order, 30 yrs. > 20 yrs. > 40 yrs. > 10 yrs., with less significant differences between restoration chronosequence periods and soil depths. Using cropland as a control, there is no significant difference compared to the 10 yrs. shrubland. However, POC increases to varying degrees with other restoration chronosequence years, peaking at 20 yrs. (24.64 g/kg) with the greatest increase (282.09%). Compared to natural grassland, it is lower in all restoration chronosequence years except for the 0–30 cm depths in 20 yrs. shrubland and the 30–60 cm depths in 30 yrs shrubland.
As shown in Figure 5, the soil mineral-associated organic carbon (MAOC) also gradually decreases as soil depth increases. This is especially evident in the 0–10 and 10–30 cm depths of the 20 yrs., where the values are 2.03 and 1.45 times higher than those in the 30–60 cm depths, respectively. The concentration of MAOC in each depth over the different restoration chronosequence years followed the order of 20 yrs. > 40 yrs. > 30 yrs. > 10 yrs. This trend is consistent with that observed for the 0–10 cm POC. However, the differences between restoration chronosequence years are less pronounced compared to POC. In addition, the changes in MAOC in different depths during the vegetation restoration chronosequence process are more consistent compared to the POC, indicating greater stability. Overall, the MAOC increases during the 20 yrs. and reaches a peak (7.98 g/kg). It shows the greatest increase (276.81%), higher than the abandoned farmland. Except for the 10 yrs., there is no significant difference, whereas the values increased to varying degrees in the other years. Compared to the natural grassland, the MAOC in the 20 and 40 yrs. are similar, while those in the 10 and 30 yrs. are significantly lower.

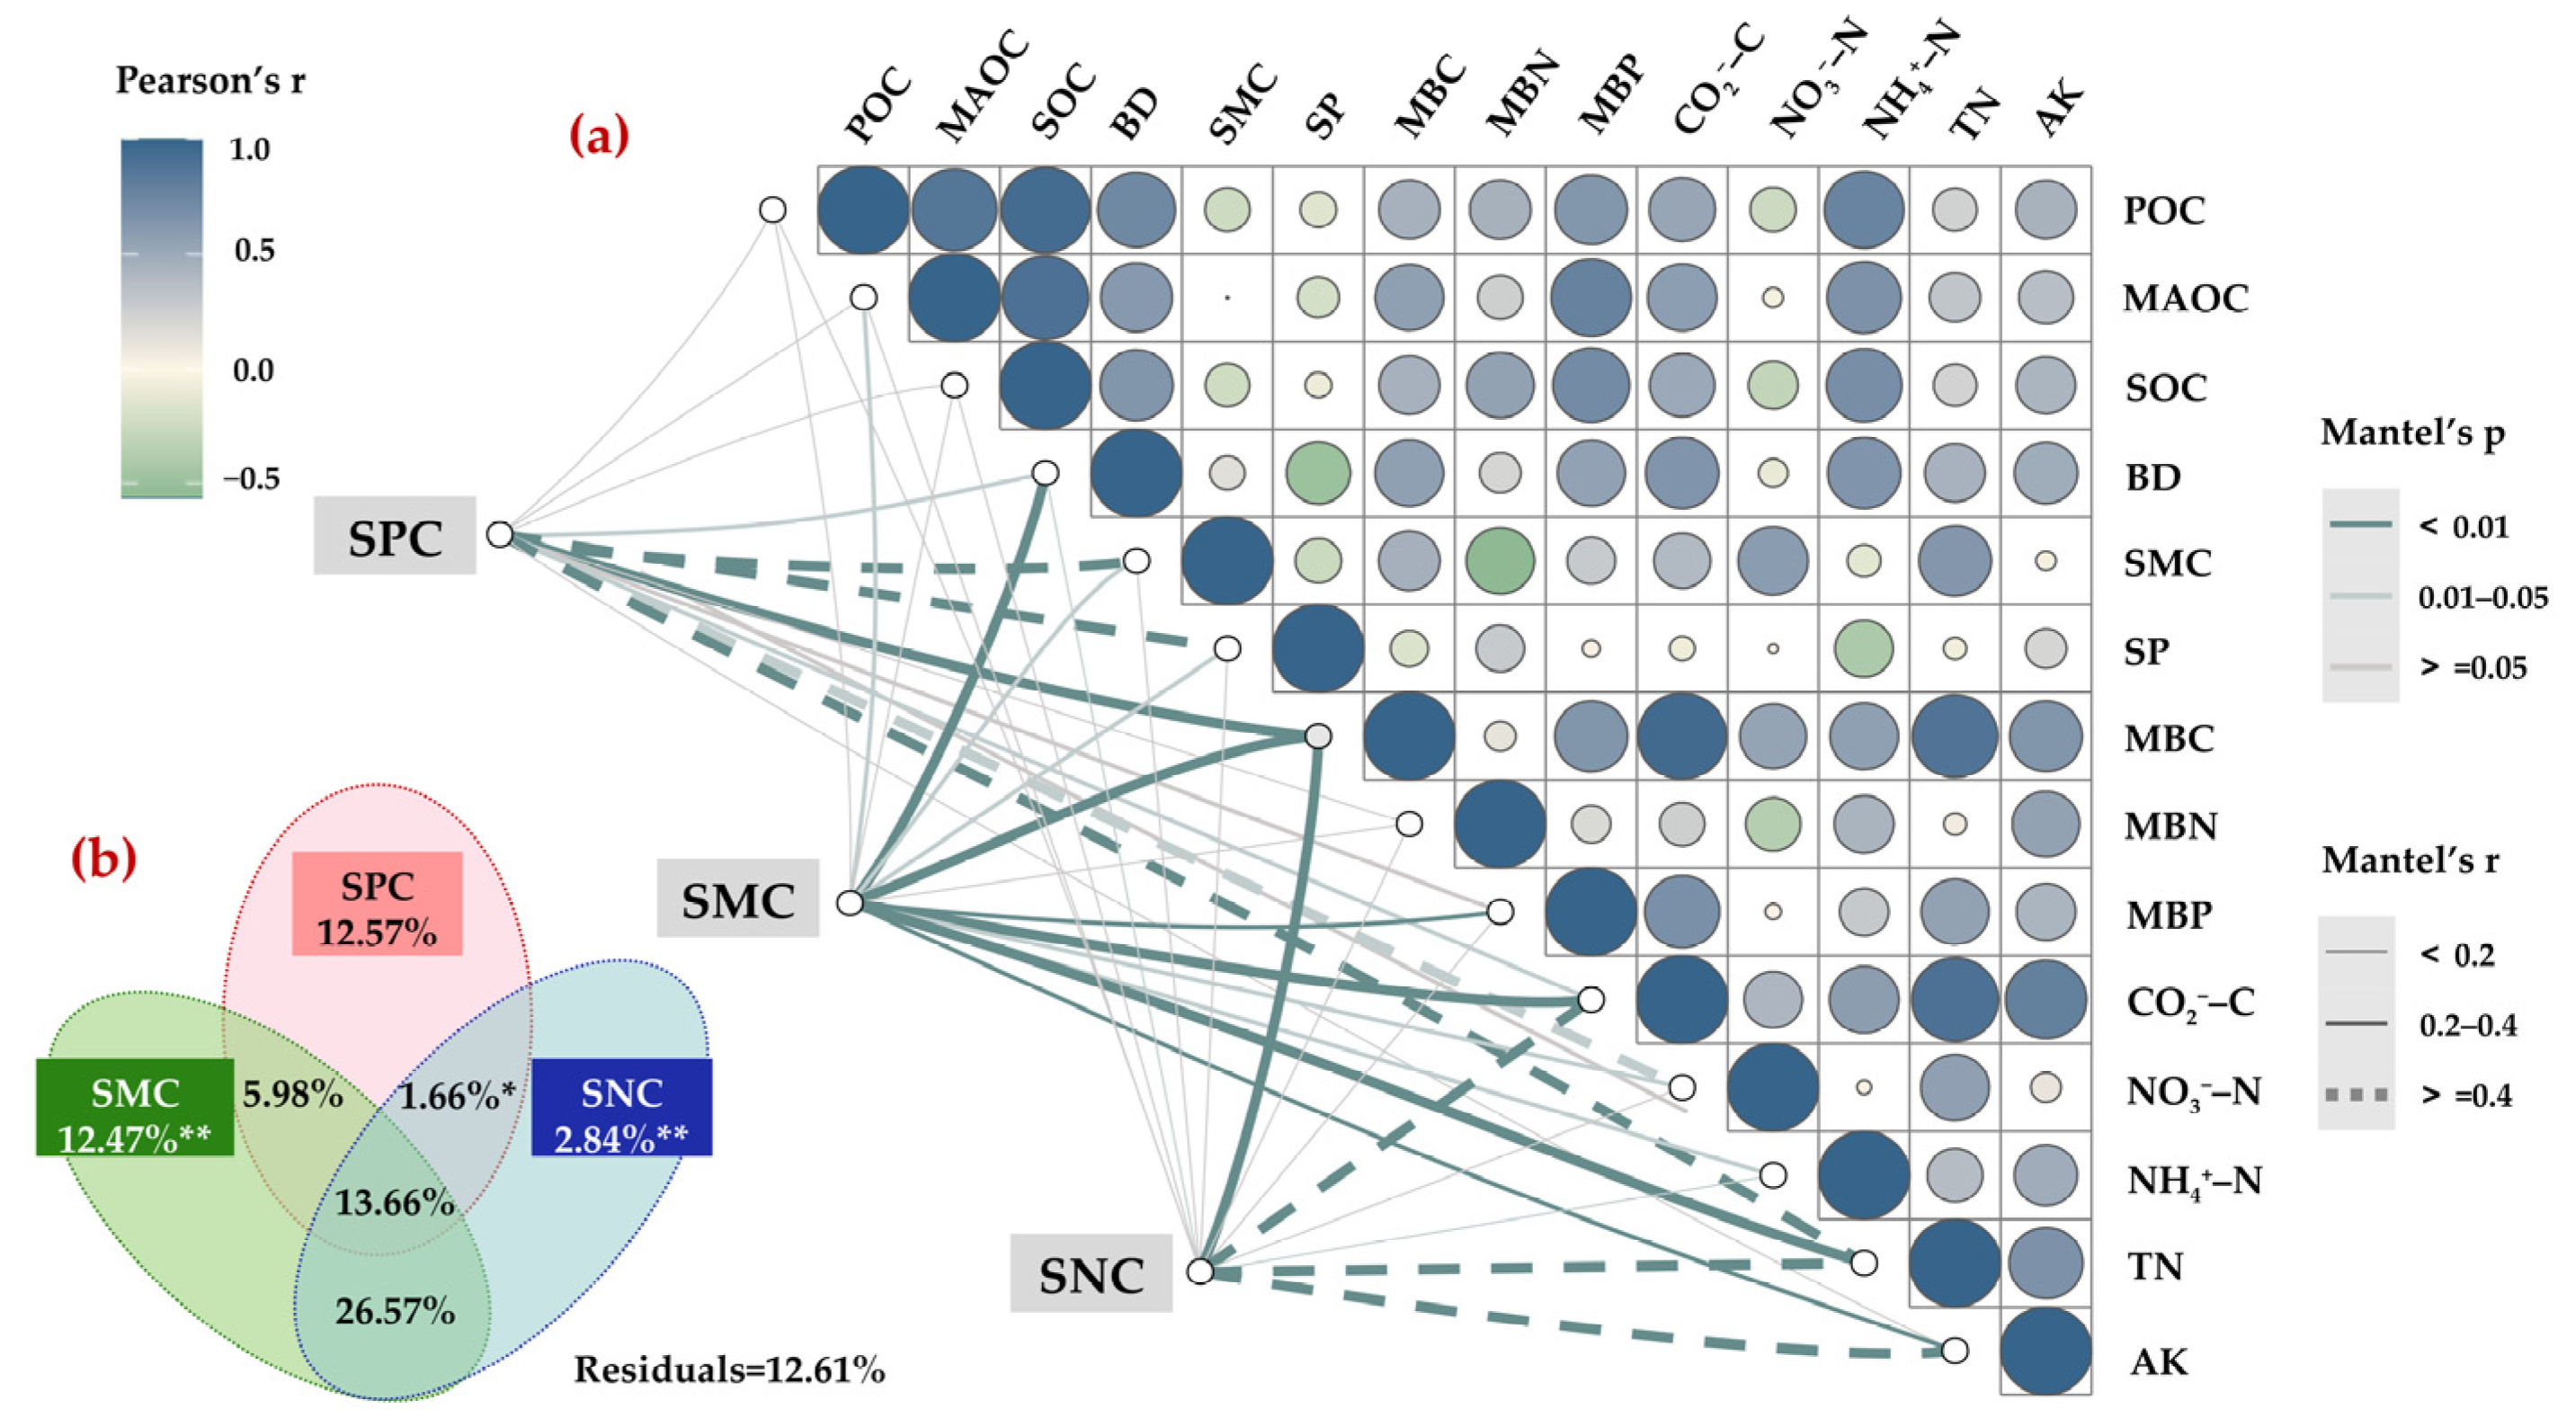
3.2. The Correlation Between POC, MAOC, and SOC in Different Restoration Chronosequence Periods

Based on Figure 6, it can be observed that the contribution rate of POC to SOC declines with increasing soil depth. In contrast, the contribution rate of MAOC to SOC increases as soil depth increases. This indicates that MAOC primarily contributes mainly to SOC in the deeper soil depths, while POC dominates at the surface. The contributions of POC and MAOC to SOC vary between different soil depths and recovery years.
Taking POC as an example, in the 0–10 cm depths, POC shows an initial increase, followed by a decrease, and then another increase with restoration chronosequence years progress, mirroring the trend of SOC. In the 10–30 cm depths, POC first increases and then decreases, while in the 30–60 cm depths it decreases initially, then increases, and finally decreases again. This is opposite to the trend of SOC. On the other hand, the contribution of MAOC to SOC is opposite to that of POC. Particularly, the contribution rate of MAOC in the 0–10 cm depths reaches its maximum (30%) at 10 yrs., while it remains around 20% for the other restoration chronosequence years (Figure 7).
During the 10–30 yrs. restoration chronosequence period, the contribution of MAOC to SOC decreases in the 0–30 cm depths, whereas it increases significantly in the 10–60 cm depths during the 30–40 yrs. period. In addition, at the 20 and 40 yrs. restoration chronosequence marks, the contribution rate of MAOC shows significant differences between soil depths, while these differences are relatively small for the other restoration chronosequence years. Except for the 40-year restoration chronosequence period, where the contribution of MAOC to SOC in the 30–60 cm depths (60%) exceeds that of POC, the contribution of POC to SOC in all other restoration chronosequence years is greater than that of MAOC in both soil depths.
Using SOC as the y-axis and C fractions as the x-axis for linear regression analysis, it was found that there is a highly significant positive correlation (p < 0.001) between SOC and either POC or MAOC throughout the restoration chronosequence process. The relationship between MAOC and SOC is closer than that between POC and SOC, although this relationship varies between restoration chronosequence years (Figure 8). In the 10-year period, there was no significant correlation between POC, MAOC, and SOC. However, in the 20-year restoration chronosequence period, both POC and MAOC show highly significant positive correlations with SOC (p < 0.001). In the 30-year period, only POC shows a highly significant positive correlation with SOC (p < 0.001). Interestingly, the correlation between SOC and both POC and MAOC reappears in the 40-year period, but is no longer highly significant (p < 0.05).

3.3. Influencing Factors of SOC Fractions

SOC and its fractions are strongly influenced by SPC, SNC, and SMC (Figure 9a). As shown by the VPA results (Figure 9b), the total explanatory rate of the different environmental factors and their interactions on the SOC fractions reaches 88%. The explanatory rates of SMC and SPC are similar, both around 12% (Figure 9b). The explanation of SNC alone is the lowest with 2.84%. However, the interaction of biochemical properties has the highest explanatory rate (26.57%), which indicates that these properties are interrelated rather than independent. Specifically, MBC (soil microbial biomass carbon) is the main driver of SMC, while other non-biological properties such as BD, CO2-C, and TN also have an influence on SMC. Soil moisture (SM) and soil porosity (SP) are the major drivers of soil physical properties. Other non-physical factors, such as MBC, have a positive effect on SPC. CO2-C, TN, and TN are the major drivers of SNC, with other non-chemical factors such as MBC having a positive effect on SNC. Overall, SMC is the most important driver of variation in SOC and its fractions. MBC is not only the dominant driver of SMC (Mantel’s p >= 0.05), but also significantly influences SPC and SNC.

4. Discussion

4.1. Influence of C. korshinskii Chronosequence Stage on SOC Sequestration

The accumulation of SOC fundamentally depends on increasing new carbon inputs, reducing losses of older carbon, and minimizing soil disturbance [47,48]. From a physical fractionation perspective, SOC stabilization is directly influenced by particulate organic carbon (POC) turnover and mineral-associated organic carbon (MAOC) formation [17]. Both POC and MAOC are closely regulated by plant residue inputs, soil physicochemical properties, and microbial community activity [30,49].
Under C. korshinskii restoration, SOC accumulation follows a three-phase chronosequence, in which distinct mechanisms dominate the early, middle, and late stages. As a transitional carbon pool, the dynamics of POC are particularly sensitive to fluctuations in plant carbon inputs and microbial decomposition [50]. In the early chronosequence stage, SOC sequestration was limited due to insufficient plant-derived carbon inputs (Figure 4). Both POC and MAOC exhibited weak correlations with total SOC (Figure 8), reflecting a transient “carbon deficit” typical of early restoration phases [51]. Similar initial SOC declines have been reported in temperate ecosystems prior to net accumulation [48]. The low regenerative capacity of young C. korshinskii shrubs restricted both above- and belowground biomass production, delaying measurable carbon gains [52].
In contrast, during the fast-growing stage (10–20 years), a pivotal shift occurred: SOC content peaked at 35.88 g/kg, surpassing that of natural grassland (32.33 g/kg; Figure 3). Rapid POC turnover was accelerated by increased plant biomass and showed a strong correlation with SOC. Concurrently, MAOC formation intensified, facilitated by the microbial processing of root exudates and necromass (e.g., roots, exudates, and microbial residues) [53,54]. This dual mechanism—POC functioning as a transient carbon source, and MAOC as the long-term stabilization pathway—has been widely observed [50]. Notably, the synergy between aboveground litter inputs and subsurface root expansion created microbial hotspots [55], which enhanced clay–mineral interactions critical for MAOC persistence [56].
Beyond 20 years, SOC stabilization shifted toward MAOC dominance despite declining POC inputs (Figure 4). The microbial resistance of MAOC [27] ensured subsoil carbon retention (30–60 cm; Figure 5), even as shrub aging led to reduced aboveground biomass [57]. However, prolonged water uptake by mature shrubs induced soil desiccation, which constrained MAOC accumulation in the 0–30 cm soil layer, consistent with drought-driven carbon trade-offs reported in arid ecosystems [58]. Over the past 40 years, microbial biomass carbon (MBC) nearly tripled (Table S2), yet MAOC increases lagged behind POC depletion (Figure 5), highlighting a critical threshold where hydrological constraints outweigh mineral protection mechanisms.

4.2. Dominance of MAOC Contribution to SOC Stability

MAOC emerges as the cornerstone of SOC stability across vegetation restoration chronosequences, particularly in the late stages. While POC drives short-term SOC turnover (on the scale of years to decades), the century-scale persistence of MAOC [59,60] ensures sustained carbon sequestration. Our findings reveal a progressive decline in POC/MAOC ratios with increasing restoration duration (Figure 6 and Figure 7), indicating a shift toward MAOC-dominated stabilization—a pattern consistent with global dryland studies [28].
The dominance of MAOC is most pronounced below 30 cm soil depth, where the POC/MAOC ratio reached its lowest point at 40 years (Figure 7). Deep-rooted C. korshinskii played a key role in facilitating this shift. Root biomass in the 30–60 cm layer tripled by year 40, supplying microbial substrates essential for the formation of organo-mineral complexes [31,54]. Microbial necromass derived from nitrogen-fixing symbioses [58] further contributed to MAOC formation in subsoils (Table S2), consistent with findings on microbial residue transformation by Sokol et al. [61]. Despite the observed declines in surface SOC after 30 years (Figure 3), MAOC maintained strong correlations with total SOC (Figure 8), thereby supporting our second hypothesis. This contrasts with the transient role of POC, whose influence diminished sharply after 20 years (Figure 4).
Although MAOC governed SOC stability, POC remained the primary source of total SOC across most restoration stages (Figure 6 and Figure 7). In surface soils (0–30 cm), high POC contributions were sustained by rapid litter inputs, whereas MAOC contributions in the subsoil surpassed those of POC only after 40 years (Figure 7). This reflects a time-lagged pattern in MAOC formation and mineral stabilization. Unlike the immediate input of biomass-derived POC, subsoil MAOC accrual requires decades of microbial transformation [61,62]. Clay particles preferentially stabilized microbial-derived MAOC over plant-derived POC [17], further reinforcing MAOC’s role as the long-term carbon sink in this restoration system.

4.3. MAOC Accumulation Depends on Depth Stabilization Mechanisms

The accumulation of MAOC is governed by depth-dependent stabilization mechanisms, primarily mediated through interactions among soil physical properties, root dynamics, and hydrological constraints. These mechanisms exert divergent controls across soil depths, ultimately shaping the vertical distribution and long-term stability of SOC. Our results demonstrate that soil physical properties—particularly soil moisture (SM) and soil porosity (SP)—emerged as dominant factors influencing MAOC dynamics, collectively explaining 12.57% of the variability in organic carbon fractions (Figure 9b). Notably, these properties exhibited distinct trends with soil depth.
Soil porosity directly influences root growth and belowground biomass accumulation [63]. In our study, porosity decreased overall at depths above 30 cm, but increased below this threshold (Table S2). During the 20–30 year period of the C. korshinskii restoration chronosequence, declining porosity in upper layers constrained vertical water movement and root development [53,64]. In contrast, increased porosity in deeper layers facilitated root biomass accumulation and enhanced organo-mineral interactions, thereby promoting MAOC accrual [31].
Concurrently, rapid C. korshinskii growth and root expansion led to progressive soil moisture depletion [52]. Soil moisture declined continuously over the 30-year period (Table S2), resulting in the formation of persistent dry soil layers in the later stages [14]. These dry subsoil conditions (>30 years) impaired MAOC preservation, despite its inherent mineral protection. Consistent with findings by Wang et al. [14], drought conditions caused C. korshinskii to shift water uptake to deeper layers, depleting moisture critical for microbial activity and soil aggregate formation [58]. This shift explains the observed decoupling of MAOC and total SOC in the late restoration stages (Figure 8).
Therefore, the sustainability of SOC sequestration is highly dependent on the availability of soil moisture, particularly in arid and semi-arid regions [65]. Hydrological stress not only limits MAOC–mineral interactions but may even reverse SOC sequestration processes [47]. Even with intrinsic mineral protection, prolonged moisture deficits weaken organo-mineral complexes, underscoring that depth-dependent stabilization mechanisms are ultimately constrained by water availability.
Therefore, despite the fact that the plant-C resource of C. korshinskii contributes significantly to the stability of the soil C pool with more than 30 years age, its importance in terms of soil C benefits is not as prominent. Its high water consumption may weaken soil nutrient cycling and availability, leading to prominent soil dry depths, which further affects photosynthetic efficiency and C sequestration capacity [66]. Therefore, the benefits of an artificial restoration chronosequence to the soil C pool may not be sustained indefinitely. Moreover, soil quality will face degradation if the water consumption of C. korshinskii continues to exceed supply [52].

4.4. Microbial Drivers Mediate Soil C Pool Stabilization in Managed Restoration

Our findings highlight soil microbial biomass carbon (MBC) as the pivotal biological mediator of SOC stabilization in managed C. korshinskii restoration systems. While soil nutrients alone accounted for only 3% of the variability in organic carbon fractions, biological factors—particularly MBC—explained 26% of the variance (Figure 9b). MBC not only directly regulated SOC dynamics but also mediated interactions between soil physical properties (e.g., porosity and bulk density) and chemical properties (e.g., inorganic nitrogen and total N), forming a synergistic network that enhanced MAOC stabilization [67]. This is consistent with Kallenbach et al. [68], who identified microbial activity as a linchpin for soil carbon persistence.
As a leguminous shrub, C. korshinskii amplified microbial-driven carbon stabilization through nitrogen-fixing symbiosis. This symbiotic relationship releases substantial amounts of nitrogen into the soil [64], elevating inorganic nitrogen levels (NO3-N and NH4+-N; Table S2) in the rhizosphere, which in turn fuels microbial growth and necromass production. The observed threefold increase in MBC and microbial biomass nitrogen (MBN) across all soil depths—peaking at 40 years (Table S2)—supplied low-molecular-weight metabolites such as polysaccharides and organic acids that bind to clay minerals [69], thereby directly facilitating MAOC accrual (Figure 1).
Over the restoration chronosequence, microbial activity shifted the balance between labile and stable carbon pools. In the early stages (0–20 years), significant correlations were observed between NH4+-N and MAOC (Figure S1), reflecting rapid microbial processing of plant-derived carbon. After 30 years, MBC and MBN surged (Table S2), although MAOC increases lagged behind POC consumption (Figure 5). From 30 to 40 years, the contribution of POC to SOC decreased across all soil depths, while the opposite trend was observed for MAOC (Figure 6 and Figure 7). Consequently, MAOC’s contribution to SOC increased in deeper soils (Figure 7), whereas POC dominance declined, underscoring the critical role of microbial regulation in carbon pool stability. These findings may provide valuable implications for the use of other deep-rooted leguminous shrubs in dryland restoration. Future work should explore optimal rotation cycles (e.g., 20–30 years), supplementary planting strategies after canopy closure, and integrated soil moisture retention measures (such as mulching or micro-catchments) to sustain soil carbon benefits and avoid long-term desiccation.

5. Conclusions

The extensive artificial restoration chronosequence of C. korshinskii has the potential to increase SOC levels. The increase in initial and intermediate stages (10–30 years) was driven by the synergistic contribution of POC and MAOC. However, MAOC become the primary stabilizer of SOC during the later restoration years (>30 years), particularly in 30–60 soil depth. However, total SOC declined due to surface desiccation (0–30 cm), highlighting a decoupling between MAOC stability and SOC quantity. On long-term scales, SOC sequestration may lead to a reduction or even reversal, which is limited by the presence of dry soil depths. Prolonged C. korshinskii growth depleted soil moisture, creating persistent dry layers that disrupted microbial activity and MAOC-clay bonding. Despite tripling microbial biomass (MBC), MAOC accrual lagged behind POC depletion, indicating water scarcity overrides mineral protection beyond 30 years. SOC benefits are maximized within 10–30 years when POC-MAOC synergy peaks. Therefore, although C. korshinskii restoration chronosequence can effectively sequester SOC, extending the growing season indefinitely may not be a prudent strategy. This is because the maximum benefit of SOC only occurs during the 10–30 year restoration chronosequence, when the POC-MAOC synergism is at its peak. It is imperative that planting duration be incorporated into the ecological assessment system, and that scientifically optimized planting methods be used to optimize the sustainable C sequestration benefits of the vegetation restoration chronosequence.

Supplementary Materials

The following supporting information can be downloaded at https://www.mdpi.com/article/10.3390/atmos16060662/s1, Figure S1. Pairwise comparisons of soil properties with a color gradient denoting Pearson’s correlation coefficients in different restoration years; Table S1. The distribution and proportion of land uses; Table S2. Variations of soil basic characteristics during the restoration years of C. korshinski.

Author Contributions

Conceptualization, Z.X. and R.W.; Software, S.H.; Validation, A.W.; Formal analysis, T.Q.; Investigation, S.W.; Resources, Q.C.; Data curation, X.L. and Z.L.; Writing—original draft, Z.X. and A.W.; Writing—review & editing, Z.X. and A.W.; Visualization, Z.X.; Supervision, Z.X. and Z.D.; Funding acquisition, Z.X. and A.W. All authors have read and agreed to the published version of the manuscript.

Funding

This study was funded by the key Research and Development Program of Shaanxi Province (2025NC-YBXM-265), the Fundamental Research Funds for the Central Universities (GK202301003, GK202309006), the Shaanxi Province postdoctoral research funding project (grant nos. 2023BSHEDZZ192), the National Natural Science Foundation of China (41807060), and the Natural Science Basic Research Program of Shaanxi Province (2021JCW-17, 2023-JC-QN-0301, 2024JC-YBQN-0364).

Institutional Review Board Statement

Not applicable.

Informed Consent Statement

Not applicable.

Data Availability Statement

The data presented in this study are openly available at https://doi.org/10.5281/zenodo.14015772.

Conflicts of Interest

The authors declare no conflicts of interest relevant to this study.

References

  1. Adhikari, K.; Owens, P.R.; Libohova, Z.; Miller, D.M.; Wills, S.A.; Nemecek, J. Assessing soil organic carbon stock of Wisconsin, USA and its fate under future land use and climate change. Sci. Total Environ. 2019, 667, 833–845. [Google Scholar] [CrossRef] [PubMed]
  2. Batjes, N.H. Total carbon and nitrogen in the soils of the world. Eur. J. Soil Sci. 1996, 47, 151–163. [Google Scholar] [CrossRef]
  3. Stockmann, U.; Adams, M.; Crawford, J.W.; Field, D.J.; Henakaarchchi, N.; Jenkins, M.; Minasny, B.; McBratney, A.B.; Courcelles, V.; Singh, K.; et al. The knowns, known unknowns and unknowns of sequestration of soil organic carbon. Agric. Ecosyst. Environ. 2013, 164, 80–99. [Google Scholar] [CrossRef]
  4. Xu, L.; Yu, G.; He, N.; Wang, Q.; Gao, Y.; Ding, W.; Li, S.; Niu, S.; Ge, J. Carbon storage in China’s terrestrial ecosystems: A synthesis. Sci. Rep. 2018, 8, 2806. [Google Scholar] [CrossRef]
  5. Amelung, W.; Bossio, D.; de Vries, W.; Kögel-Knabner, I.; Amundson, R.; Bol, R.; Collins, C.; Lal, R.; Leifeld, J.; Minasny, B. Towards a global-scale soil climate mitigation strategy. Nat. Commun. 2020, 2020, 5427. [Google Scholar] [CrossRef]
  6. Zhang, X.P.; Lin, P.F.; Chen, H.; Yan, R.; Zhang, J.; Yu, Y.; Liu, E.; Yang, Y.; Zhao, W.; Lv, D.; et al. Understanding land use/cover change impacts on runoff and sediment load at flood events on the Loess Plateau, China. Hydrol. Process. 2018, 32, 576–589. [Google Scholar] [CrossRef]
  7. Shi, P.; Li, P.; Li, Z.; Sun, J.; Wang, D.; Min, Z. Effects of grass vegetation coverage and position on runoff and sediment yields on the slope of Loess Plateau, China. Agric. Water Manag. 2022, 259, 107231. [Google Scholar] [CrossRef]
  8. Gu, C.; Mu, X.; Gao, P.; Zhao, G.; Sun, W.; Tatarko, J.; Tan, X. Influence of vegetation restoration on soil physical properties in the Loess Plateau, China. J. Soils Sediments 2019, 2019, 716–728. [Google Scholar] [CrossRef]
  9. Wang, A.; Zha, T.; Zhang, Z. Variations in soil organic carbon storage and stability with vegetation restoration stages on the Loess Plateau of China. Catena 2023, 228, 107142. [Google Scholar] [CrossRef]
  10. Li, Q.; Jia, W.; Wu, J.; Wang, L.; Huang, F.; Cheng, X. Changes in soil organic carbon stability in association with microbial carbon use efficiency following 40 years of afforestation. Catena 2023, 228, 107179. [Google Scholar] [CrossRef]
  11. Wang, S.; Yang, M.; Gao, X.; Hu, Q.; Song, J.; Ma, N.; Song, X.; Siddique, K.; Wu, P.; Zhao, X. Divergent responses of deep SOC sequestration to large-scale revegetation on China’s Loess Plateau. Agric. Ecosyst. Environ. 2023, 349, 108433. [Google Scholar] [CrossRef]
  12. Zhao, R.; He, M.; Yue, P.; Huang, L.; Liu, F. Linking soil organic carbon stock to microbial stoichiometry, carbon sequestration and microenvironment under long-term forest conversion. J. Environ. Manag. 2022, 301, 113940. [Google Scholar] [CrossRef] [PubMed]
  13. Gong, C.; Bai, J.; Wang, J.; Zhou, Y.; Kang, T.; Wang, J.; Hu, C.; Guo, H.; Chen, P.; Xie, P.; et al. Carbon storage patterns of Caragana korshinskii in areas of reduced environmental moisture on the Loess Plateau, China. Sci. Rep. 2016, 6, 28883. [Google Scholar] [CrossRef] [PubMed]
  14. Wang, J.; Zhao, W.; Wang, G.; Yang, S.; Pereira, P. Effects of long-term afforestation and natural grassland recovery on soil properties and quality in Loess Plateau. Sci. Total Environ. 2021, 770, 144833. [Google Scholar] [CrossRef]
  15. Bao, J.T.; Wang, J.; Li, X.R.; Zhang, Z.; Su, J. Age-related changes in photosynthesis and water relations of revegetated Caragana korshinskii in the Tengger desert, Northern China. Trees 2015, 29, 1749–1760. [Google Scholar] [CrossRef]
  16. Xu, H.; Qu, Q.; Lu, B.; Zhang, Y.; Liu, G.; Xue, S. Variation in soil organic carbon stability and driving factors after vegetation restoration in different vegetation zones on the Loess Plateau, China. Soil Tillage Res. 2020, 204, 104727. [Google Scholar] [CrossRef]
  17. Li, Y.; Zhang, X.; Wang, B.; Wu, X.; Wang, Z.; Liu, L.; Yang, H. Revegetation promotes soil mineral-associated organic carbon sequestration and soil carbon stability in the Tengger Desert, northern China. Soil Biol. Biochem. 2023, 185, 109155. [Google Scholar] [CrossRef]
  18. Cunningham, S.C.; Metzeling, K.J.; Nally, R.M.; Thomson, J.R.; Cavagnaro, T.R. Changes in soil carbon of pastures after afforestation with mixed species: Sampling, heterogeneity and surrogates. Agric. Ecosyst. Environ. 2012, 158, 58–65. [Google Scholar] [CrossRef]
  19. Wu, L.; Li, L.; Yao, Y.; Qin, F.; Guo, Y.; Gao, Y.; Zhang, M. Spatial distribution of soil organic carbon and its influencing factors at different soil depths in a semiarid region of China. Environ. Earth Sci. 2017, 76, 654. [Google Scholar] [CrossRef]
  20. Albaladejo, J.; Ortiz, R.; Garcia-Franco, N.; Navarro, A.; Almagro, M.; Pintado, J.; Martínez-Mena, M. Land use and climate change impacts on soil organic carbon stocks in semi-arid Spain. J. Soils Sediments 2013, 13, 265–277. [Google Scholar] [CrossRef]
  21. Zhou, L.; Li, S.; Liu, B.; Wu, P.; Heal, K.; Ma, X. Tissue-specific carbon concentration, carbon stock, and distribution in Cunninghamia lanceolata (Lamb.) Hook plantations at various developmental stages in subtropical China. Ann. For. Sci. 2019, 76, 70. [Google Scholar] [CrossRef]
  22. Villarino, S.H.; Pinto, P.; Jackson, R.B.; Piñeiro, G. Plant rhizodeposition: A key factor for soil organic matter formation in stable fractions. Sci. Adv. 2021, 7, eabd3176. [Google Scholar] [CrossRef] [PubMed]
  23. Zhao, Y.; Wang, L.; Knighton, J.; Evaristo, J.; Wassen, M. Contrasting adaptive strategies by Caragana korshinskii and Salix psammophila in a semiarid revegetated ecosystem. Agric. For. Meteorol. 2021, 300, 168–1923. [Google Scholar] [CrossRef]
  24. Su, Z.; Zhong, Y.; Zhu, X.; Wu, Y.; Shen, Z.; Shangguan, Z. Vegetation restoration altered the soil organic carbon composition and favoured its stability in a Robinia pseudoacacia plantation. Sci. Total Environ. 2023, 899, 165665. [Google Scholar] [CrossRef]
  25. Fu, B.J.; Zhao, W.; Chen, L.; Zhang, J.; Lv, H.; Gulinck, J. Assessment of soil erosion at large watershed scale using RUSLE and GIS: A case study in the Loess Plateau of China. Land Degrad. Dev. 2005, 16, 73–85. [Google Scholar] [CrossRef]
  26. Jian, S.; Zhao, C.; Fang, S.; Yu, K. Effects of different vegetation restoration on soil water storage and water balance in the Chinese Loess Plateau. Agric. For. Meteorol. 2015, 206, 85–96. [Google Scholar] [CrossRef]
  27. Liao, J.; Yang, X.; Dou, Y.; Wang, B.; Xue, Z.; Sun, H.; Yang, Y.; An, S. Divergent contribution of particulate and mineral-associated organic matter to soil carbon in grassland. J. Environ. Manag. 2023, 344, 0301–4797. [Google Scholar] [CrossRef]
  28. Shi, J.; Song, M.; Yang, L.; Zhao, F.; Wu, J.; Li, J.; Yu, Z.; Li, A.; Shangguan, Z.; Deng, L. Recalcitrant organic carbon plays a key role in soil carbon sequestration along a long-term vegetation succession on the Loess Plateau. Catena 2023, 233, 107528. [Google Scholar] [CrossRef]
  29. Wang, K.; Zheng, J.; Li, G.; Ma, Z.; Zhang, X.; Zhang, Q.; Yang, Z.; Huang, G. Caragana korshinskii of different planting years altered the soil water, carbon, and nitrogen storage in the different layers within level ditch on slope in a semi-arid area. Catena 2024, 242, 108126. [Google Scholar] [CrossRef]
  30. Cotrufo, M.; Ranalli, M.; Haddix, J.; Six, J.; Lugato, E. Soil carbon storage informed by particulate and mineral-associated organic matter. Nat. Geosci. 2019, 12, 989–994. [Google Scholar] [CrossRef]
  31. Lavallee, J.; Soong, J.; Cotrufo, M.F. Conceptualizing soil organic matter into particulate and mineral-associated forms to address global change in the 21st century. Glob. Chang. Biol. 2020, 26, 261–273. [Google Scholar] [CrossRef] [PubMed]
  32. Gu, J.; Yang, F.; Song, X.; Yang, S.; Zhang, G. Edaphic regulation of soil organic carbon fractions in the mattic layer across the Qinghai-Tibetan Plateau. Sci. Total Environ. 2024, 943, 173814. [Google Scholar] [CrossRef] [PubMed]
  33. Villarino, S.H.; Studdert, G.A.; Baldassini, P.; Cendoya, M.; Giuffoli, L.; Mastrángelo, M.; Piñeiro, G. Deforestation impacts on soil organic carbon stocks in the Semiarid Chaco Region, Argentina. Sci. Total Environ. 2017, 575, 1056–1065. [Google Scholar] [CrossRef] [PubMed]
  34. Guo, X.; Raphael, A.; Rossel, V.; Wang, G.; Xiao, L.; Wang, M.; Zhang, S.; Luo, Z. Particulate and mineral-associated organic carbon turnover revealed by modelling their long-term dynamics. Soil Biol. Biochem. 2022, 173, 108780. [Google Scholar] [CrossRef]
  35. Amorim, H.; Luis, C.; Ivan, H.; Zinn, Y. C:N ratios of bulk soils and particle-size fractions: Global trends and major drivers. Geoderma 2022, 425, 116026. [Google Scholar] [CrossRef]
  36. Rocci, K.; Lavallee, J.; Stewart, C.; Cotrufo, M. Soil organic carbon response to global environmental change depends on its distribution between mineral-associated and particulate organic matter: A meta-analysis. Sci. Total Environ. 2021, 793, 148569. [Google Scholar] [CrossRef]
  37. Feng, W.; Plante, A.; Aufdenkampe, A.; Six, J. Soil organic matter stability in organo-mineral complexes as a function of increasing C loading. Soil Biol. Biochem. 2014, 69, 398–405. [Google Scholar] [CrossRef]
  38. Ramesh, T.; Nanthi, S.; Kirkham, M.; Wijesekara, H.; Manjaiah, K.M.; Ch, S.; Sasidharan, S.; Rinklebe, J.; Yong, S.; Choudbury, B.; et al. Freeman II, Soil organic carbon dynamics, Impact of land use changes and management practices, A review. Adv. Agron. 2019, 156, 1–107. [Google Scholar]
  39. Liu, J.; Zhao, Z.; Yan, Y.; Ali, A.; Ahmed, Z.; He, D.; Yu, M.; Hang, J.; Perven, M.; Nazir, T.; et al. Effect of alfalfa habitat change on dispersal behavior of Harmonia axyridis Pallas and Hippodamia variegata Goeze (Coleoptera, Coccinellidae). J. Asia-Pac. Entomol. 2021, 24, 997–1003. [Google Scholar] [CrossRef]
  40. An, S.S.; Huang, Y.M.; Liu, M.Y. Soil organic carbon density and land restorations example of southern mountain area of Ningxia province, northwest China. Commun. Soil Sci. Plant Anal. 2020, 4, 181–189. [Google Scholar] [CrossRef]
  41. Nelson, D.W.; Sommers, L.E. Total carbon, organic carbon, and organic matter. In Methods of Soil Analysis: Part 3 Chemical Methods; American Society of Agronomy: Madison, WI, USA, 1996; Volume 5, pp. 961–1010. [Google Scholar]
  42. Peng, X.; Huang, Y.; Duan, X.; Yamg, H.; Liu, J. Particulate and mineral-associated organic carbon fractions reveal the roles of soil aggregates under different land-use types in a karst faulted basin of China. Catena 2023, 220, 106721. [Google Scholar] [CrossRef]
  43. Bremner, J.M. Nitrogen-total. In Methods of Soil Analysis: Part 3 Chemical Methods; American Society of Agronomy: Madison, WI, USA, 1996; Volume 5, pp. 1085–1121. [Google Scholar]
  44. Olsen, S.R.; Sommers, L.E. Phosphorous. In Methods of Soil Analysis: Part 2, Chemical and Microbial Properties; Agronomy Monograph; Page, A.L., Miller, R.H., Keeney, D.R., Eds.; Agronomy Society of America: Madison, WI, USA, 1982; Volume 9, pp. 403–430. [Google Scholar]
  45. Vance, E.D.; Brookes, P.C.; Jenkinson, D.S. An extraction method for measuring soil microbial biomass C. Soil Biol. Biochem. 1987, 19, 703–707. [Google Scholar] [CrossRef]
  46. Cambardella, C.A.; Elliott, E. Particulate soil organic-matter changes across a grassland cultivation sequence. Soil Sci. Soc. Am. J. 1992, 56, 777–783. [Google Scholar] [CrossRef]
  47. Nicoloso, R.; Rice, C.; Amado, T.; Costa, C.; Akley, E. Carbon saturation and translocation in a no-till soil under organic amendments. Agric. Ecosyst. Environ. 2018, 264, 73–84. [Google Scholar] [CrossRef]
  48. Zhao, Q.; Shi, P.; Li, P.; Li, Z.; Min, Z.; Sun, J.; Cui, L.; Niu, H.; Zu, P.; Cao, M. Effects of vegetation restoration on soil organic carbon in the Loess Plateau: A meta-analysis. Land Degrad. Dev. 2023, 34, 2088–2097. [Google Scholar] [CrossRef]
  49. Angst, G.; Mueller, K.; Nierop, K.; Simpson, M. Plant- or microbial-derived? A review on the molecular composition of stabilized soil organic matter. Soil Biol. Biochem. 2021, 156, 108189. [Google Scholar] [CrossRef]
  50. Wu, J.; Zhang, H.; Pan, Y. Particulate organic carbon is more sensitive to nitrogen addition than mineral-associated organic carbon, A meta-analysis. Soil Tillage Res. 2022, 216, 106405. [Google Scholar] [CrossRef]
  51. Don, A.; Rebmann, C.; Kolle, O.; Scherer-lorenzen, M.; Schulze, E. Impact of afforestation-associated management changes on the carbon balance of grassland. Glob. Chang. Biol. 2009, 15, 1990–2002. [Google Scholar] [CrossRef]
  52. Chai, Q.; Ma, Z.; An, Q.; Wu, G.; Chang, X.; Zheng, J.; Wang, G. Does artificial Caragana korshinskii plantation increase soil carbon continuously in a water-limited landscape on the Loess Plateau? Land Degrad. Dev. 2019, 30, 1691–1698. [Google Scholar] [CrossRef]
  53. Zhang, F.; Chen, X.; Yao, S.; Ye, Y.; Zhang, B. Responses of soil mineral-associated and particulate organic carbon to carbon input: A meta-analysis. Sci. Total Environ. 2022, 829, 0048–9697. [Google Scholar] [CrossRef]
  54. Li, Z.; Duan, X.; Guo, X.; Gao, W.; Li, Y.; Zhou, P.; Zhu, Q.; O’Donnell, A.G.; Dai, K.; Wu, J. Microbial metabolic capacity regulates the accrual of mineral-associated organic carbon in subtropical paddy soils. Soil Biol. Biochem. 2024, 195, 109457. [Google Scholar] [CrossRef]
  55. Lu, F.; Hu, H.; Sun, W.; Zhu, J.; Liu, G.; Zhou, W.; Zhang, Q.; Shi, P.; Liu, X.; Wu, X.; et al. Effects of national ecological restoration projects on carbon sequestration in China from 2001 to 2010. Proc. Natl. Acad. Sci. USA 2018, 115, 4039–4044. [Google Scholar] [CrossRef] [PubMed]
  56. Shi, S.; Han, P.; Zhang, P.; Ding, F.; Ma, C. The impact of afforestation on soil organic carbon sequestration on the Qinghai Plateau, China. PLoS ONE 2015, 10, e0116591. [Google Scholar] [CrossRef] [PubMed]
  57. Wang, X.; Zhang, K.; Li, J.; Li, Q.; Na, W.; Gao, Y.; Gao, Z. Response of soil water in deep dry soil layers to monthly precipitation, plant species, and surface mulch in a semi-arid hilly loess region of China. Agric. Water Manag. 2024, 291, 108612. [Google Scholar] [CrossRef]
  58. Jia, X.; Zhao, C.; Wang, Y.; Zhu, Y.; Wei, X.; Shao, M. Traditional dry soil layer index method overestimates soil desiccation severity following conversion of cropland into forest and grassland on China’s Loess Plateau. Agric. Ecosyst. Environ. 2020, 291, 106794. [Google Scholar] [CrossRef]
  59. Kleber, M.; Eusterhues, K.; Keiluweit, M.; Mikutta, C.; Mikutta, R.; Nico, P. Chapter One: Mineral-Organic Associations: Formation, Properties, and Relevance in Soil Environments. In Advances in Agronomy; Sparks, D.L., Ed.; Academic Press: Cambridge, MA, USA, 2015; Volume 130, pp. 1–140. [Google Scholar]
  60. Poeplau, C.; Don, A.; Six, J.; Kaiser, M.; Benbi, D.; Chenu, C.; Cotrufo, M.; Derrien, D.; Gioacchini, P.; Grand, S.; et al. Rolf Nieder, Isolating organic carbon fractions with varying turnover rates in temperate agricultural soils—A comprehensive method comparison. Soil Biol. Biochem. 2018, 125, 10–26. [Google Scholar] [CrossRef]
  61. Sokol, N.W.; Sanderman, J.; Bradford, M.A. Pathways of mineral-associated soil organic matter formation: Integrating the role of plant carbon source, chemistry, and point of entry. Glob. Chang. Biol. 2019, 25, 12–24. [Google Scholar] [CrossRef]
  62. Isabelle, B.D. Reviews and syntheses: The mechanisms underlying carbon storage in soil. Biogeosciences 2020, 17, 5223–5242. [Google Scholar]
  63. Feng, Y.; Sui, X.; Tang, J.; Liu, R.; Ling, X.; Liang, W.; Wei, X. Responses of belowground fine root biomass and morphology in Robinia pseudoacacia L. plantations to aboveground environmental factors. Glob. Ecol. Conserv. 2024, 50, e02863. [Google Scholar] [CrossRef]
  64. Jia, Y.; Li, T.; Shao, M.; Hao, J.; Wang, Y.; Jia, X.; Zeng, C.; Fu, X.; Liu, B.; Gan, M. Disentangling the formation and evolvement mechanism of plants-induced dried soil layers on China’s Loess Plateau. Agric. For. Meteorol. 2019, 269–270, 57–70. [Google Scholar] [CrossRef]
  65. Han, L.; Nan, G.; He, X.; Wang, J.; Zhao, J.; Zhang, X. Soil moisture and soil organic carbon coupled effects in apple orchards on the Loess Plateau, China. Sci. Rep. 2024, 14, 12281. [Google Scholar] [CrossRef]
  66. Reich, P.B.; Sendall, K.M.; Stefanski, A.; Rich, R.L.; Hobbie, S.E.; Montgomery, R.A. Effects of climate warming on photosynthesis in boreal tree species depend on soil moisture. Nature 2018, 562, 263–267. [Google Scholar] [CrossRef] [PubMed]
  67. Philippot, L.; Chenu, C.; Kappler, A.; Rillig, M.C.; Fierer, N. The interplay between microbial communities and soil properties. Nat. Rev. Microbiol. 2024, 22, 226–239. [Google Scholar] [CrossRef] [PubMed]
  68. Kallenbach, C.; Frey, S.; Grandy, A. Direct evidence for microbial-derived soil organic matter formation and its ecophysiological controls. Nat. Commun. 2016, 7, 13630. [Google Scholar] [CrossRef] [PubMed]
  69. Jilling, A.; Keiluweit, M.; Gutknecht, J.; Grandy, A.S. Priming mechanisms providing plants and microbes access to mineral-associated organic matter. Soil Biol. Biochem. 2021, 158, 108265. [Google Scholar] [CrossRef]
Figure 1. Artificial restoration of C. korshinskii shrubs of different chronosequence ages. (a) Location of the study area; (b) Distribution of sampling sites; (c) C. korshinskii shrubs with different restoration years (10, 20, 30, and 40 years old) and two controls of natural grassland and cropland.
Atmosphere 16 00662 g001
Figure 2. Land use change from 1982 to 2020, nearly 40 years of comprehensive catchment area.
Atmosphere 16 00662 g002
Figure 3. Variation in SOC across C. korshinski restoration chronosequence years. Note: (a) Changes in different restoration chronosequence years. (b) Changes in different soil depths. Values are presented as the means of six replicates ± std. (standard deviation). Red dashed lines indicate values for natural grassland and black dashed lines indicate values for abandoned farmland. Lowercase letters indicate significant differences between restoration chronosequence years (p < 0.05). Capital letters indicate significant differences between 0–10, 10–30, and 30–60 cm soil depths (p < 0.05).
Atmosphere 16 00662 g003
Figure 4. Variation in POC across C. korshinski restoration chronosequence years. Note: (a) Changes in different restoration chronosequence years. (b) Changes in different soil depths. Values are presented as the means of six replicates ± std. (standard deviation). Red dashed lines indicate values for natural grassland and black dashed lines indicate values for abandoned farmland. Lowercase letters indicate significant differences between restoration chronosequence years (p < 0.05). Capital letters indicate significant differences between 0–10, 10–30, and 30–60 cm soil depths (p < 0.05).
Atmosphere 16 00662 g004
Figure 5. Variation in MAOC across C. korshinski restoration chronosequence years. Note: (a) Changes in different restoration chronosequence years. (b) Changes in different soil depths. Values are presented as the means of six replicates ± std. (standard deviation). Red dashed lines indicate values for natural grassland and black dashed lines indicate values for abandoned farmland. Lowercase letters indicate significant differences between restoration chronosequence years (p < 0.05). Capital letters indicate significant differences between 0–10, 10–30, and 30–60 cm soil depths (p < 0.05).
Atmosphere 16 00662 g005
Figure 6. The contribution of MAOC/POC to SOC over C. korshinski restoration chronosequence years. Note: (a) 0–10 cm soil depth; (b) 10–30 cm soil depth; (c) 30–60 cm soil depth; MAOC, soil mineral-associated organic carbon; POC, particulate organic carbon. Lowercase letters indicate significant differences between restoration chronosequence years and two controls (p < 0.05).
Atmosphere 16 00662 g006
Figure 7. The contribution of MAOC/POC to SOC in different soil depths. Note: MAOC, soil mineral-associated organic carbon; POC, particulate organic carbon; Ab.F, abandoned farmland; Na.G, natural grassland; and 0–60 cm divided into three soil depths, 0–10 cm, 10–30 cm, and 30–60 cm, respectively. Lowercase letters indicate significant differences between soil depths.
Atmosphere 16 00662 g007
Figure 8. The relationships between POC, MAOC, and SOC. Note: POC, soil particulate organic carbon; MAOC, soil mineral-associated organic carbon; SOC, soil organic carbon; and r denotes the correlations between POC/MAOC and SOC across C. korshinski restoration chronosequence years. * p <= 0.05; ** p <= 0.01.
Atmosphere 16 00662 g008
Figure 9. (a) Pairwise comparisons of soil properties with a color gradient indicating Pearson’s correlation coefficients. (b) The contribution of three types of factors in explaining the influence of soil properties. Note: The three types of factors include soil physical characteristics (SPC), soil chemical characteristics (SNC), and soil microbial (biological) characteristics (SMC). (a) POC, MAOC, and SOC were related to each environmental factor by Mantel tests. Edge width corresponds to Mantel’s r statistics for the corresponding distance correlations, and edge color indicates the statistical significance. The green and blue colors show, respectively, a negative and positive relationship between two variables. The deeper the color, the stronger the relationship. For each panel, the color is proportional to Pearson’s correlation coefficient (Pearson ρ) (dark green, r = −1, dark blue, r = 1). (b) According to the variation partitioning analysis (VPA) and backward stepwise regression models, we obtained the contribution of the multiple interaction factor and the single factor in explaining the soil properties. * p ≤ 0.05; ** p ≤ 0.01.
Atmosphere 16 00662 g009
Disclaimer/Publisher’s Note: The statements, opinions and data contained in all publications are solely those of the individual author(s) and contributor(s) and not of MDPI and/or the editor(s). MDPI and/or the editor(s) disclaim responsibility for any injury to people or property resulting from any ideas, methods, instructions or products referred to in the content.

