Article

Seasonal and Diurnal Variations of Indoor PM2.5 in Six Households in Akure, Nigeria

by
Sawanya Saetae
1,*,
Francis Olawale Abulude
2,
Kazushi Arasaki
1,
Mohammed Mohammed Ndamitso
3,
Akinyinka Akinnusotu
4,
Samuel Dare Oluwagbayide
5,
Yutaka Matsumi
6,
Kazuaki Kawamoto
1,7 and
Tomoki Nakayama
1,7,*
1
Graduate School of Fisheries and Environmental Sciences, Nagasaki University, Nagasaki 852-8521, Nagasaki, Japan
2
Environmental and Sustainable Research Group, Science and Education Development Institute, Akure 340106, Ondo, Nigeria
3
Department of Chemistry, Federal University of Technology, Minna 920101, Niger, Nigeria
4
Department of Science Laboratory Technology, University of Medical Sciences, Ondo 341106, Ondo, Nigeria
5
Department of Agricultural and Bio-Environmental Engineering, Federal Polytechnic, Ilaro 112106, Ogun, Nigeria
6
Institute for Space-Earth Environmental Research, Nagoya University, Nagoya 464-8602, Aichi, Japan
7
Graduate School of Integrated Science and Technology, Nagasaki University, Nagasaki 852-8521, Nagasaki, Japan
*
Authors to whom correspondence should be addressed.
Atmosphere 2025, 16(5), 603; https://doi.org/10.3390/atmos16050603
Submission received: 5 April 2025 / Revised: 10 May 2025 / Accepted: 13 May 2025 / Published: 16 May 2025
(This article belongs to the Section Air Quality)

Abstract

:
Seasonal, diurnal, and site-to-site variations in indoor PM2.5 concentrations in Akure, a city in southwestern Nigeria, are investigated by continuous observations using low-cost sensors in six households. Significant seasonal variations were observed, with the highest monthly PM2.5 concentrations occurring in the dry season, both indoors and outdoors. Significant seasonal variations with higher PM2.5 levels during the dry season were observed, with mean PM2.5 concentrations of 55 μg/m3 in the kitchen and 48 μg/m3 in the living rooms, compared to those during the wet season (23 μg/m3 in the kitchen and 14 μg/m3 in the living rooms). The kitchen-to-outdoor and indoor-to-outdoor PM2.5 ratios increased particularly during the morning and evening hours at several sites, suggesting significant contributions from cooking activities in the kitchen, as well as the transfer of PM2.5 into the living room. An assessment of PM2.5 exposure risks among 32 residents in the studied households revealed higher risks among individuals who cook routinely. This study underscores the importance of addressing indoor air pollution alongside outdoor pollution, particularly by improving ventilation and reducing cooking emissions, to effectively minimize exposure risks.

1. Introduction

Indoor air pollution is a global issue affecting millions, with the World Health Organization (WHO) estimating that it contributes to approximately 4.3 million fatalities [1]. Particulate matter with aerodynamic diameters smaller than 2.5 µm (PM2.5) is a major contributor, as it can infiltrate the respiratory system and cause significant health problems. Several studies have found a link between high PM2.5 levels and increased mortality and morbidity [2,3,4].
Western Sub-Saharan Africa is considered one of the most polluted regions in the world, with Nigeria having some of the highest PM2.5 exposures [5]. In fact, 100% of the population in Nigeria lives in areas where PM2.5 levels exceed the WHO air quality guidelines. Indoor PM2.5 from combustion is significantly associated with lower life expectancy in Sub-Saharan Africa, particularly for females, and should be reduced to improve overall life expectancy [6].
In Nigeria, cooking is the most common household energy requirement. According to the 2018 Nigeria Demographic and Health Survey (NDHS) for 40,427 households [7], a large fraction of households in Nigeria use unclean fuels such as firewood, kerosene, and charcoal for cooking. In urban areas, 37%, 24%, and 9% of households use firewood, kerosene, and charcoal, respectively, while 26% and 1% use gases (liquid petroleum gas (LPG), natural gas, or biogas) and electricity, respectively. In rural areas, a higher fraction (83%) of households use firewood, and only 4% and <1% use LPG, natural gas, or biogas, and electricity, respectively. In urban (rural) areas, 48% (34%) of households have a cooking place inside the house, 23% (31%) have a separate building for cooking, and 28% (33%) cook outdoors [7]. In urban (rural) areas, 22% (71%), 7 (11%), and 7% (4%) of households use three-stone stoves, self-build biomass stoves, and manufactured biomass stoves, respectively, according to the 2018/2019 Nigeria Living Standard Survey (NLSS) [8]. In Nigeria, the majority of households do not have a chimney or hood for cooking stoves [9]. The high costs of clean cooking energy sources, such as LPG and electricity, as well as cooking stoves, impose significant limits on household fuel preferences [10]. Moreover, poor ventilation and lack of air purification systems cause PM2.5 to accumulate indoors, affecting air quality and increasing exposure risks, especially for sensitive groups such as children, the elderly, and individuals with respiratory problems.
Although continuous measurements of indoor PM2.5 in residential houses throughout the year have not been reported in Nigeria, several studies have documented PM2.5 concentrations in kitchens, as listed in Table 1. Kumar et al. [11] reported PM2.5 levels in the kitchens of five households using LPG and electricity as cooking fuels (except one household using LPG and kerosene) for 7 days during the wet season. They reported ranges of average and maximum PM2.5 concentrations of 9–27 µg/m3 and 1103–1283 µg/m3 across five studied sites. In other areas of Nigeria, Aigbokhaode and Isara [12] measured PM2.5 levels for 30–60 min during the daytime in 62 household kitchens in a suburban area of Edo State, southern Nigeria. They reported higher PM2.5 levels, with a mean of 29 µg/m3 (ranging from 14 to 650 µg/m3) for households using unclean cooking fuels (firewood and kerosene), compared to 26 µg/m3 (ranging from 14 to 358 µg/m3) for households using cleaner fuels (LPG and electricity). Giwa et al. [13] measured PM2.5 concentrations in the kitchens of 38 households using kerosene in Sango, southwestern Nigeria, for 49–158 min mostly during the morning and evening hours in the dry season. They reported that PM2.5 concentrations significantly increased during cooking, from an average of 89 µg/m3 (ranging from 64 to 102 µg/m3) before cooking to 138 µg/m3 (ranging from 97 to 187 µg/m3) during cooking. Furthermore, Adianimovie and Ebinimi [14] reported mean PM2.5 levels during cooking hours in 18 and 12 households using kerosene and wood, respectively, as their main cooking fuels to be 51 and 37 µg/m3 in Yenagoa, southern Nigeria. Oluwole et al. [15] found that PM2.5 concentrations in the kitchens of 59 households during cooking using firewood significantly decreased from an interquartile range (IQR) of 831–3437 µg/m3 pre-intervention to 50–277 µg/m3 post-intervention. Giwa et al. [16] also reported increases in PM2.5 levels up to 1335 µg/m3 during cooking in a test kitchen in Nigeria.
A few studies have also examined indoor PM2.5 levels in areas other than kitchens (Table 1). Abulude et al. [17] reported the average PM2.5 level (83 µg/m3) in the living room of a residential building in Abuja. Abulude et al. [18] also measured PM2.5 in five rooms of a two-parlor bungalow apartment in Akure, Nigeria, for about one month from January 2022. They reported high average concentrations of PM2.5 exceeding 300 µg/m3 at all locations. Additionally, Abulude et al. [19] measured PM2.5 concentrations in the living room of a residential building in Akure during four different months (January, April, November, and December) and reported higher average PM2.5 levels in January and December (dry season) than those in April (wet season). Further, Eghomwanre et al. [20] measured PM1, PM2.5, and PM10 concentrations once per month using a mobile monitor in the living rooms and basements of 45 locations in Benin City, southeastern Nigeria, and reported higher average PM2.5 levels in the living room during the dry season (51–93 µg/m3) compared to the wet season (33–60 µg/m3).
Exposure risks associated with PM exposures are typically estimated using outdoor PM concentrations due to the limited availability of indoor air quality data, especially in Western Sub-Saharan Africa (e.g., [21,22]). In addition, several recent studies have examined potential health impacts in this region, based on personal exposure monitoring of PM. Xu et al. [23] investigated personal PM2.5 exposures in Abidjan, Côte d’Ivoire, and Cotonou, Benin, using personal exposure filter sampling (five days in each of the dry and wet seasons in 2006) with gravimetric and chemical analyses. Arku et al. [24] measured personal PM2.5 exposures for 56 students using personal exposure filter sampling equipment and mobile sensors between January and August in Accra, Ghana. On average, 2.5 lots of 24 h measurements were conducted for each student. Piedrahita et al. [25] conducted 48 h personal filter sampling of PM2.5 in Navrongo town in northern Ghana from November 2013 to August 2015 and obtained 191 samples from 88 individuals. While personal exposure monitoring is a powerful tool for estimating potential health risks, long-term continuous monitoring of personal exposure is challenging due to the burden of carrying personal exposure monitoring or sampling devices for extended periods.
Addressing indoor air pollution in residential houses, in addition to outdoor air pollution, is important to understand factors influencing the health of residents. Additionally, long-term simultaneous monitoring of indoor and outdoor PM at multiple sites may provide useful data for estimating exposure risks. However, only a few studies have estimated the exposure risk of PM2.5 at specific places, such as healthcare centers [26], schools [27], household living rooms/basements [20], and kitchens [13] in Nigeria, typically based on short-term monitoring of indoor air quality using portable devices.
In this study, long-term continuous observations of PM2.5 in indoor environments such as the kitchen and living room of six residential households in Akure, a city in southwestern Nigeria, have been conducted to investigate the seasonal and diurnal variations in PM2.5 and their controlling factors. Additionally, the exposure risks for PM2.5 are discussed by combining the obtained indoor PM2.5 data with the simultaneously obtained outdoor PM2.5 data previously reported [28]. The findings of this study will contribute to a better understanding of PM2.5 air pollution and its exposure levels and assist policymakers in assessing exposure risks and implementing strategies to mitigate air pollution.

2. Materials and Methods

2.1. Observation Sites

PM2.5 measurements were conducted at six sites (A, B, C, I, J, and K) in Akure, with the longitude and latitude information of each site listed in Table 2, and the map illustrating the location of each site was provided in our previous study [28]. Akure is the capital city of Ondo State in the southwest of Nigeria, covering an area of 991 km2. It is bordered to the south by State Road 6, to the north by the Owo–Ikare Road, and to the east by the Owena River. In 2023, the city’s population was 744,000 [29]. Akure has a tropical wet and dry climate, with distinct rainy and dry seasons. The rainy season lasts from April to October, while the dry season, known as the Harmattan season, extends from November to March [30,31]. The mean annual temperature ranges from 21 °C to 27 °C, with slightly higher temperatures during the dry season and lower temperatures during the rainy season. The city receives an average annual rainfall of 1200–1600 mm, with most rainfall occurring during the wet season [32]. As a fast-growing city with an increasing population and industrial activity, Akure faces significant air pollution challenges, highlighting the need for mitigation measures to improve air quality.
Sites A and B are located in the urban residential area in the Akure South (Akure S), while Sites C, I, J, and K are situated in the less urbanized Oba-lle town in the Akure North (Akure N). At each site, PM2.5 concentrations were monitored in three locations: outdoor, kitchen, and living room. Our previous study [28] reported the seasonal and diurnal variations in outdoor PM2.5 concentrations. In this study, we analyzed the temporal and site-to-site variations in PM2.5 concentrations in the kitchen and indoor areas. In our previous study [28], we suggested that local emissions, likely from solid fuel combustion, waste burning, and/or unpaved road dust, contributed more to outdoor air pollution at Sites C, I, J, and K, especially during the morning and evening hours.

2.2. Characteristics of the Households

We conducted a questionnaire survey to understand the potential sources of PM2.5 and estimate the exposures of household occupants. The questionnaire collected information on the number of occupants, their gender and age range, and their typical daily activities during the dry and wet seasons to assess how much time they spent in each environment. It also gathered data on potential sources of PM2.5, including cooking time and duration, fuel types used, and smoking habits.
Figure 1 shows the building arrangement and sampling points for each site, and Table 2 lists household characteristics and cooking fuel usage at each site. At Sites A and I, kitchens are located within the main building, while Site J has an outdoor kitchen. Sites B, C, and K each have two kitchens, one inside and the other outside. At Site A, the indoor kitchen was used approximately 80% of the time during the wet season and 70% during the dry season. At Site I, the indoor kitchen was used approximately 70% and 60% during the wet and dry seasons, respectively. Outdoor cooking with mobile stoves accounted for 10–20% at Site A and 20–30% at Site I, despite no formal outdoor kitchen. At Site J, the outdoor kitchen was used almost exclusively (about 90%). At Sites B and C, the indoor kitchen was used approximately 90% and 60% of the time, while the outdoor kitchen accounted for about 5% and 30%, respectively. At Site K, the indoor kitchen was used approximately 60% during the wet season and 30% during the dry season, with outdoor cooking accounting for 30% and 60%, respectively. The remaining time at each site was attributed to non-cooking days. The indoor kitchens at Sites C, I, and K have windows for ventilation, but none have ventilation fans, hoods, or chimneys.
In this study, PM2.5 concentrations were monitored in indoor kitchens at all sites except Site J, where outdoor kitchen concentrations were measured. Table 2 shows that, except at Site J, households primarily use gases (LPG, natural gas, or biogas) and electricity for cooking in indoor kitchens, with usage fractions of 50–80% and 0–40%, respectively, during the dry and wet seasons. Kerosene is used in small amounts (up to 20%) at all sites, while charcoal makes up 20–30% of the fuel used at Site C. At Site J, only firewood is used with 3-stone stoves in the outdoor kitchen during both seasons. At Sites A, B, and C, the indoor kitchen is adjacent to the living room, where PM2.5 monitoring was also conducted. None of the residents at the studied sites were smokers, except for one resident at Site J.

2.3. PM2.5 Measurements

At all sites, one sensor was installed outside the main building, in the living room, and in the kitchen, as shown in Figure 1. This study used small optical PM2.5 sensors developed by Panasonic Corporation and Nagoya University [33]. These sensors detect particles with diameters above approximately 300 nm and are known for their good linearity and accuracy (typically <25%) based on laboratory experiments and field observations in Japan and other countries [33,34,35]. The sensors were calibrated based on ambient measurements at Nagasaki University in Japan, by comparing the sensor output with data from a beta attenuation monitor (BAM). However, the potential influence of differences in optical properties of ambient particles with those emitted during the cooking activities to the sensor output cannot be ruled out. Additionally, hygroscopic growth of particles under high-relative-humidity (RH) conditions may lead to an overestimation of the sensor readings during the wet season, as discussed in our previous study [28]. Notably, in our previous studies conducted in India, Vietnam, and Japan, the outputs of the PM2.5 sensors showed good agreement with those of the BAMs across different seasons, including the periods that were strongly influenced by biomass burning [33,34,35].
The equipment, consisting of the sensor and a data logging system (IDEC Co., Ltd., Tokyo, Japan), was used for the observations. PM2.5 mass concentrations were monitored every 5 min over a 24 h period in the kitchen, living room, and outdoor locations at each site. The periods of data collected in the kitchen and living room at each site in this study are summarized in Table 2. Unfortunately, frequent power shortages caused data gaps during the observation periods.

2.4. Exposure Risk Estimation

Organizations such as the WHO and the United States Environmental Protection Agency (USEPA) use exposure risk to manage and assess the risks associated with various environmental hazards. The USEPA identifies three primary pathways of exposure: inhalation, ingestion, and skin contact. Inhalation is the most rapid exposure pathway and is assumed to be the only route in this study. In this study, the risk associated with exposure to PM2.5 through the inhalation route was evaluated as specified by the USEPA guidelines [36].
The potential exposure risk for each resident was roughly estimated by calculating the hazard quotient (HQ) (unitless), and detailed procedures to calculate the HQ are given in Text S1 and Table S1 in the Supplementary Material. In this study, the HQ values for each of the 32 residents living in the six studied households (Sites A, B, C, I, J, and K) during the wet season (from Aril to October), dry season (from November to March), and all seasons were calculated. These 32 residents were categorized into four groups: adults who are not cooking (3 residents), adults who are cooking (21 residents), children who are not cooking (2 residents), and children who are cooking (6 residents). In this study, residents under 10 years of age were treated as children.
First, average diurnal variations in PM2.5 concentrations in the outdoor, living room, and kitchen of each household were calculated for the wet season, dry season, and all seasons using the observation data. Second, the average PM2.5 exposure concentration for each resident was estimated based on the average diurnal variations in PM2.5 concentrations in the outdoor, kitchen, and other indoor room of each household, along with the time each resident spent in the outdoor, kitchen, and other indoor rooms (assuming that PM2.5 concentrations in the living room represent those of indoor rooms other than the kitchen). The periods of time spent outdoors, indoors, and in the kitchen for each resident were estimated from the questionnaire survey and are listed in Table S2. Third, using the estimated average PM2.5 exposure concentration for each resident, the average daily dose (ADD) for each season and for all seasons was calculated. The corresponding HQ values were then obtained by dividing the ADD by the reference dose (RfD). For the inhalation reference concentration (RfC) used to calculate the RfD, the WHO air quality guideline level for yearly average (5 µg/m3) was used [37]. HQ values greater than 1 indicate a potential risk of adverse impact on public health.

3. Results and Discussion

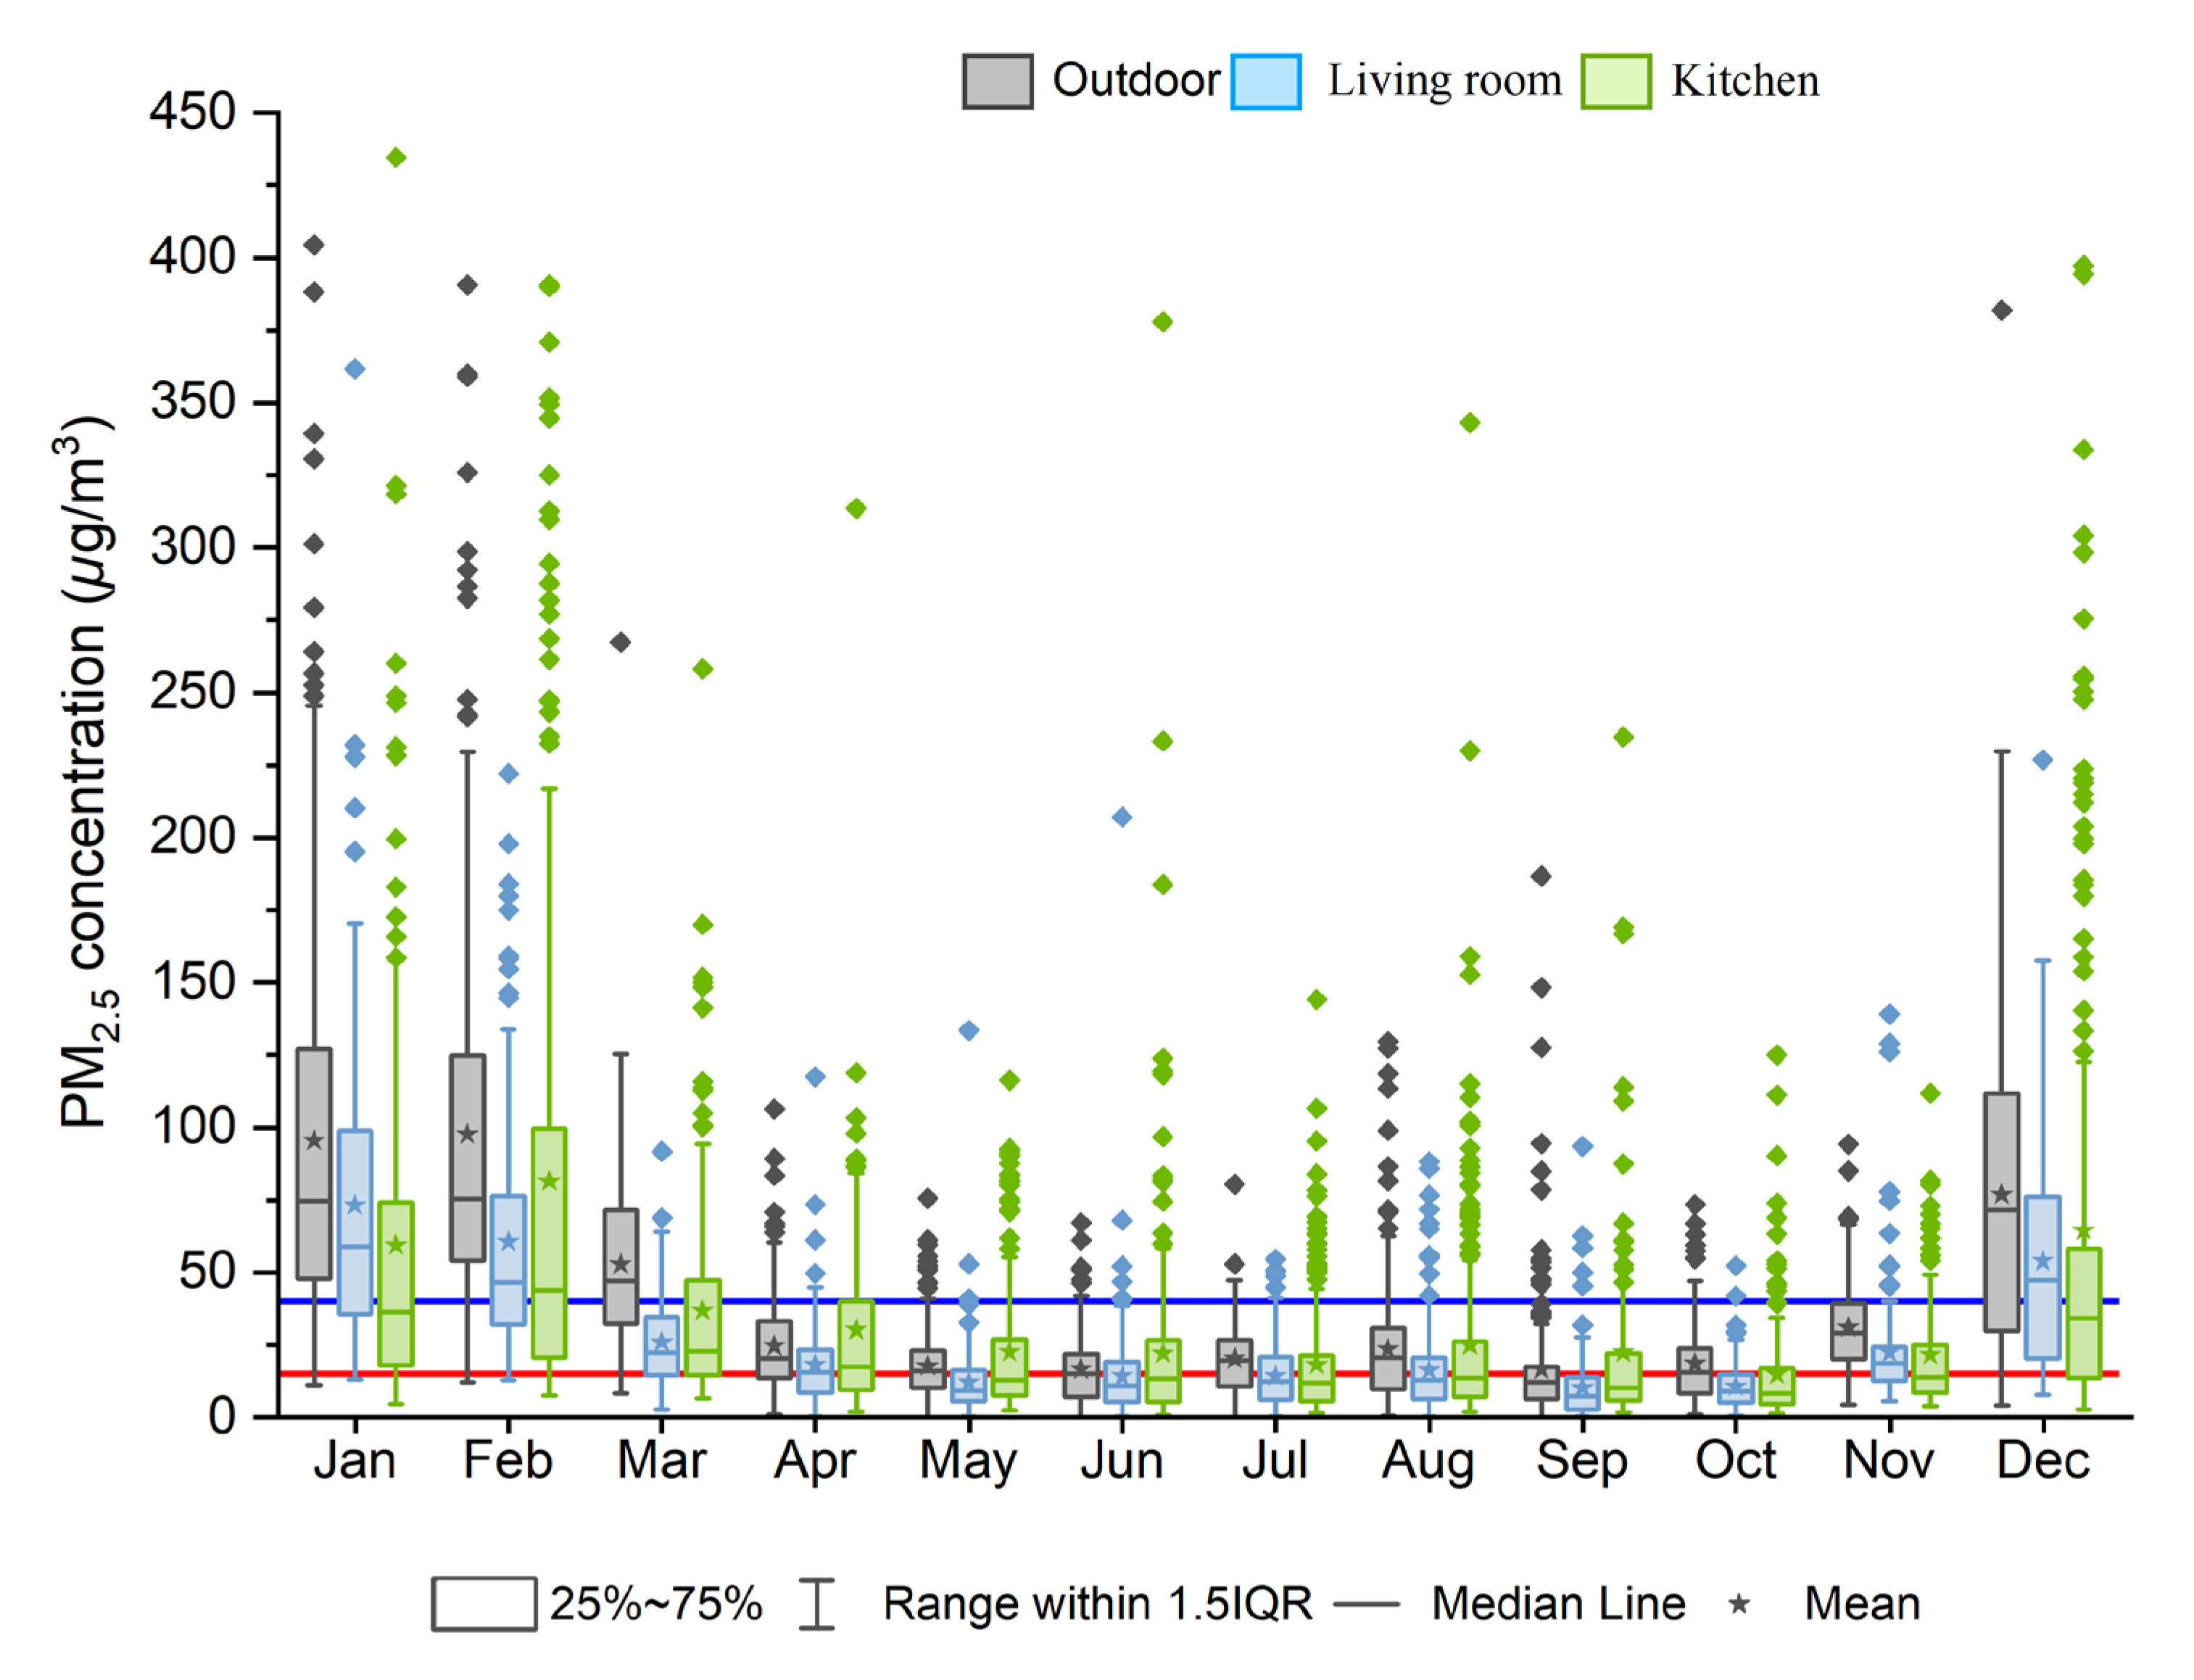
3.1. Seasonal Variation in PM2.5 in the Kitchen and Living Room

Figure 2 shows the whisker-box plots for daily PM2.5 concentrations at all sites across all periods measured in living rooms and kitchens, with outdoor data obtained from our previous study [28]. Table S3 lists the numerical values for outdoor, kitchen, and living room concentrations. Significant seasonal variations with higher PM2.5 levels during the dry season (from November to March) were observed in both the living rooms and kitchens compared to the wet season (from April to October), and similar variations were observed for outdoor locations in our previous study [28]. During the wet season, the mean (±standard deviation (SD)) of PM2.5 concentration was highest in the kitchens (23 ± 36 μg/m3), followed by outdoors (20 ± 16 μg/m3) and living rooms (14 ± 13 μg/m3). However, in the dry season, the highest concentration was observed outdoors (77 ± 61 μg/m3), followed by kitchens (55 ± 73 μg/m3) and living rooms (48 ± 41 μg/m3) (Table S3). These results are reasonable, assuming that outdoor sources contribute significantly to indoor PM2.5 during the dry season, whereas the relative contributions of indoor sources, such as cooking emissions, increase during the wet season. Note that high-RH conditions during the wet season may lead to overestimation of sensor readings and could reduce the magnitude of seasonal variations. However, this factor is unlikely to significantly affect the preceding discussions, assuming that indoor RH levels were not substantially higher than those outdoors during the wet season.
The proportion of outliers exceeding 1.5 times the IQR above the third quartile, along with the maximum daily concentrations in each month, was higher in the kitchen compared to the living room and outdoors, especially during the wet season, which can be attributed to the emissions from cooking activities. Note that high outdoor PM2.5 levels exceeding 100 μg/m3 were observed, particularly at the less urbanized sites (I, J, and K), likely due to the use of solid fuels for outdoor cooking, waste combustion activities, and local dust emissions from unpaved roads, as discussed in our previous study [28].
During the dry season, the daily PM2.5 concentrations in the living room and kitchen frequently exceeded the daily guideline values set by the National Environmental Standards and Regulations Enforcement Agency (NESREA; 40 μg/m3) [38] and the WHO (15 μg/m3) [37]. The exceedance rates in the kitchen and living room were 39% and 44%, respectively, for the NESREA guideline, and 75% and 85%, respectively, for the WHO guideline during the dry season. Although the exceedance rates were smaller in the wet season—14% (kitchen) and 3% (living room) for NESREA guideline levels, and 42% (kitchen) and 35% (living room) for WHO guideline levels—these values remained non-negligible. The annual mean PM2.5 levels were 35 μg/m3 in the kitchen and 28 μg/m3 in the living room, which were lower than the outdoor value (41 μg/m3) reported in our previous study [28]; however, they remained higher than the Nigerian national ambient air quality standard for the annual value (20 μg/m3) set by the NESREA [38] and the WHO air quality guideline level (5 μg/m3) [37]. To our knowledge, this is the first report on the annual average PM2.5 levels for indoor environments in Nigeria.

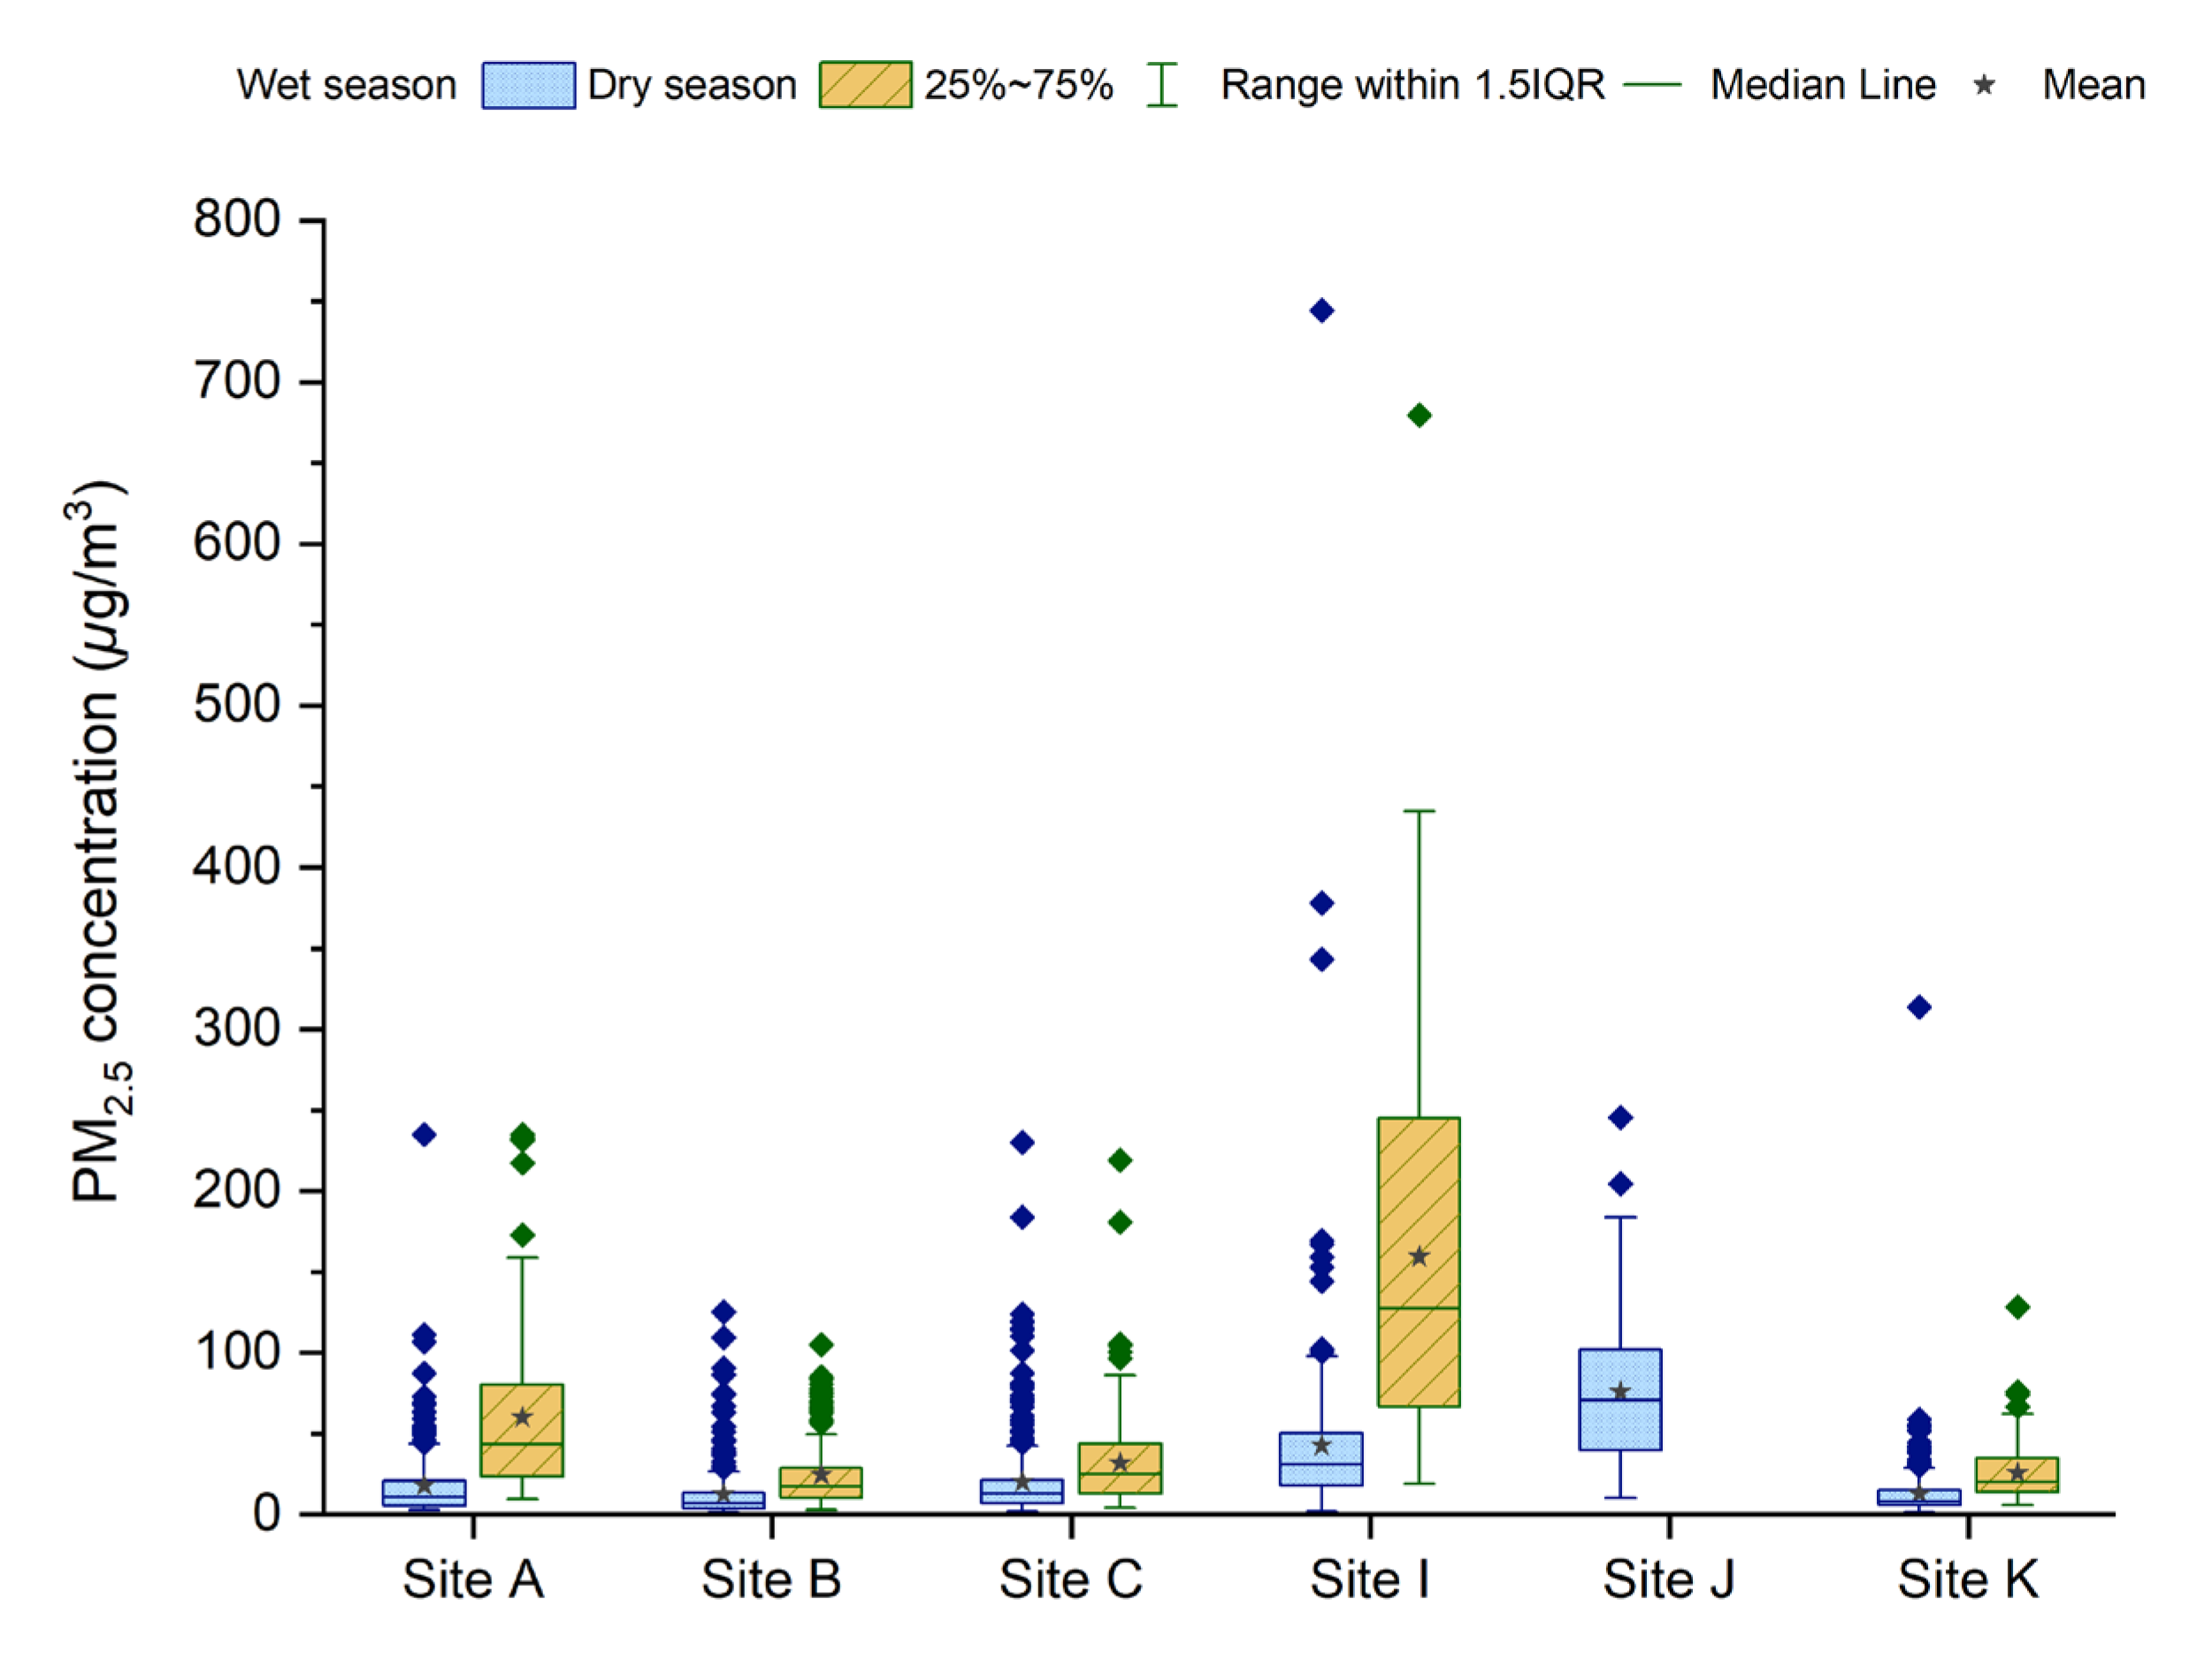
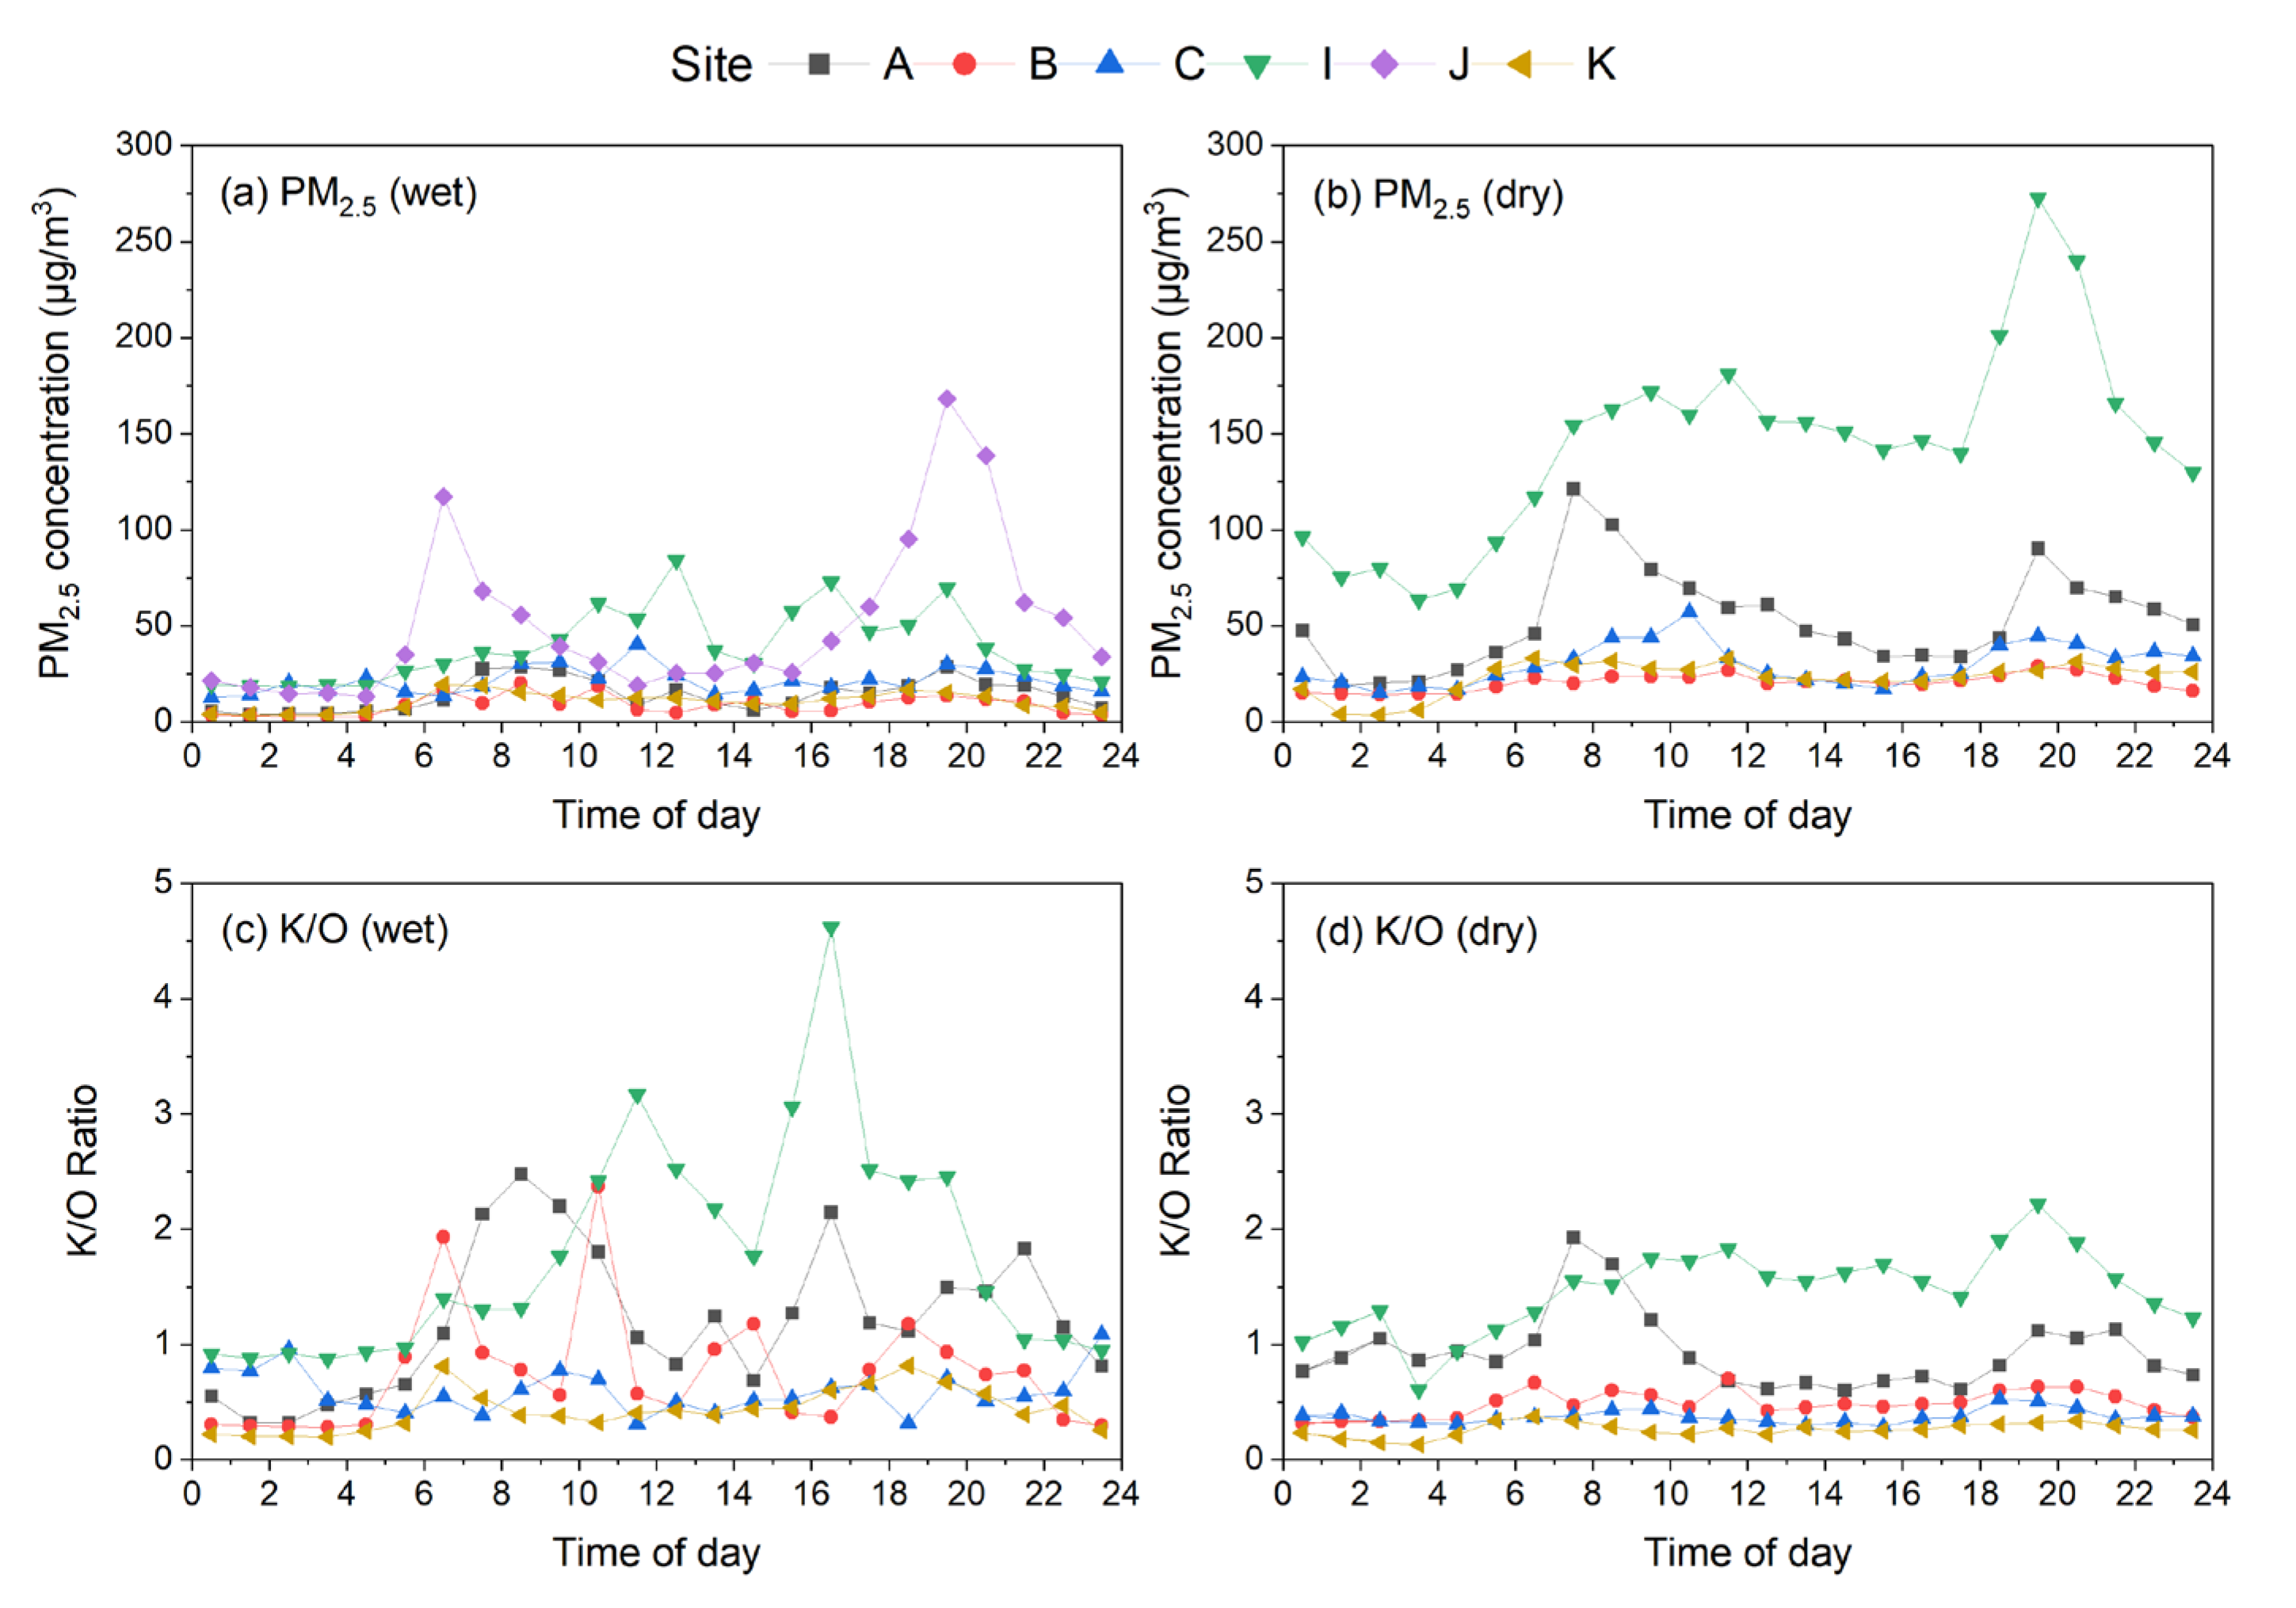
3.2. Site-to-Site and Diurnal Variations in PM2.5 in the Kitchen

Whisker-box plots for daily averaged kitchen PM2.5 concentrations for both the dry and wet seasons at each site are shown in Figure 3, and corresponding numerical values, including outdoor data, are listed in Table S4. The results of statistical analyses for the hourly PM2.5 concentrations at each site in each month are shown in Figure S1. Due to the limited data available at Site J during the dry season, these were excluded from Figure 3. Significant site-to-site variations were observed; Site J had the highest mean concentration (75 µg/m3), followed by Site I (43 µg/m3) during the wet season, and Site I had the highest mean concentration (159 µg/m3), followed by Site A (60 µg/m3) during the dry season. The hourly maximum PM2.5 concentrations reached approximately 1300, 2800, and 800 µg/m3 at Sites A, I, and J (Figure S1). Figure 4 shows the log–log scatter plots of 5 min average PM2.5 concentrations between outdoor and kitchen environments at each site, and slopes, intercepts, and Pearson’s correlation coefficients (r) for these plots are listed in Table S5. Significant positive relationships were observed between the logarithms of outdoor and kitchen PM2.5 concentrations during the dry season at all sites (r = 0.63–0.81). In the wet season, weak but positive correlations were seen at Sites I, J, and K (r = 0.43–0.54), whereas the correlations at Sites A, B, and C were less (r = 0.02–0.29) (Table S5). While outdoor concentrations generally exceeded those in the kitchen, instances where kitchen PM2.5 concentrations surpassed outdoor levels (likely due to cooking activities in the kitchen) were frequently identified across all study sites. This phenomenon was especially prominent at Site I (Figure 4d).
Figure 5a,b show the averaged diurnal variations in kitchen PM2.5 concentrations during the wet and dry seasons, respectively. In both seasons, the highest kitchen PM2.5 concentrations were typically observed during the morning (6:00–9:00) and evening (18:00–20:00) hours, except at Site I. At Site I, the morning peak shifted to noon (10:00–13:00), and PM2.5 levels remained high throughout the day. The magnitude of the morning and evening peaks was relatively larger at Site J during the wet season and at Site A during the dry season compared to other sites, except Site I. The ratios of kitchen PM2.5 to outdoor PM2.5 (referred to as the K/O ratio) were calculated using 5 min average data when both kitchen and outdoor PM2.5 were available. As shown in Figure 5c,d, large enhancements of the K/O ratio were observed during the morning and evening hours at Site A and from morning to evening at Site I in both seasons. At Site I, cooking activities were conducted at 14:00–16:00, in addition to the morning and evening hours (6:00–8:00 and 18:00–20:00) in both seasons. The combination of longer cooking periods and lower ventilation efficiency in the kitchen at Site I are attributed as the cause of the observed enhancement of the K/O ratio. At Site A, where there is no window in the kitchen, the relatively low ventilation efficiency during cooking may have caused the large enhancement of the K/O ratio during the morning and evening hours. Unfortunately, the diurnal variation in the K/O ratio at Site J could not be shown due to the limitation of the available simultaneous data. However, the large enhancements of PM2.5 in the outdoor kitchen during the wet season (approximately 100 and 150 µg/m3, respectively), compared to the outdoor PM2.5 values (approximately 20 and 30 µg/m3) reported in our previous study [28], suggest significant contributions of cooking activities. The high emission flux of PM2.5 from open wood combustion during cooking is responsible for the large enhancements in kitchen PM2.5 at Site J, even though dilution rates in the outdoor kitchen may be faster than in indoor kitchens at other sites. Notably, the K/O ratio after midnight (0:00–4:00), when no cooking activities were typically carried out, was near unity at Site A during the dry season and Site I in both seasons, but was significantly smaller (0.2–0.5) at Sites B and K in both seasons and at Site A during the wet season. These results suggest the substantial variability in the penetration efficiencies of outdoor PM2.5 among the studied households.
The large site-to-site variations in observed kitchen PM2.5 concentrations, their diurnal patterns, and their relationships with outdoor concentrations are attributable to differences in cooking activities (e.g., frequency, duration, cooking methods, and fuels), kitchen ventilation conditions (e.g., whether windows and doors are opened during cooking and other times), and outdoor PM2.5 levels among the households.

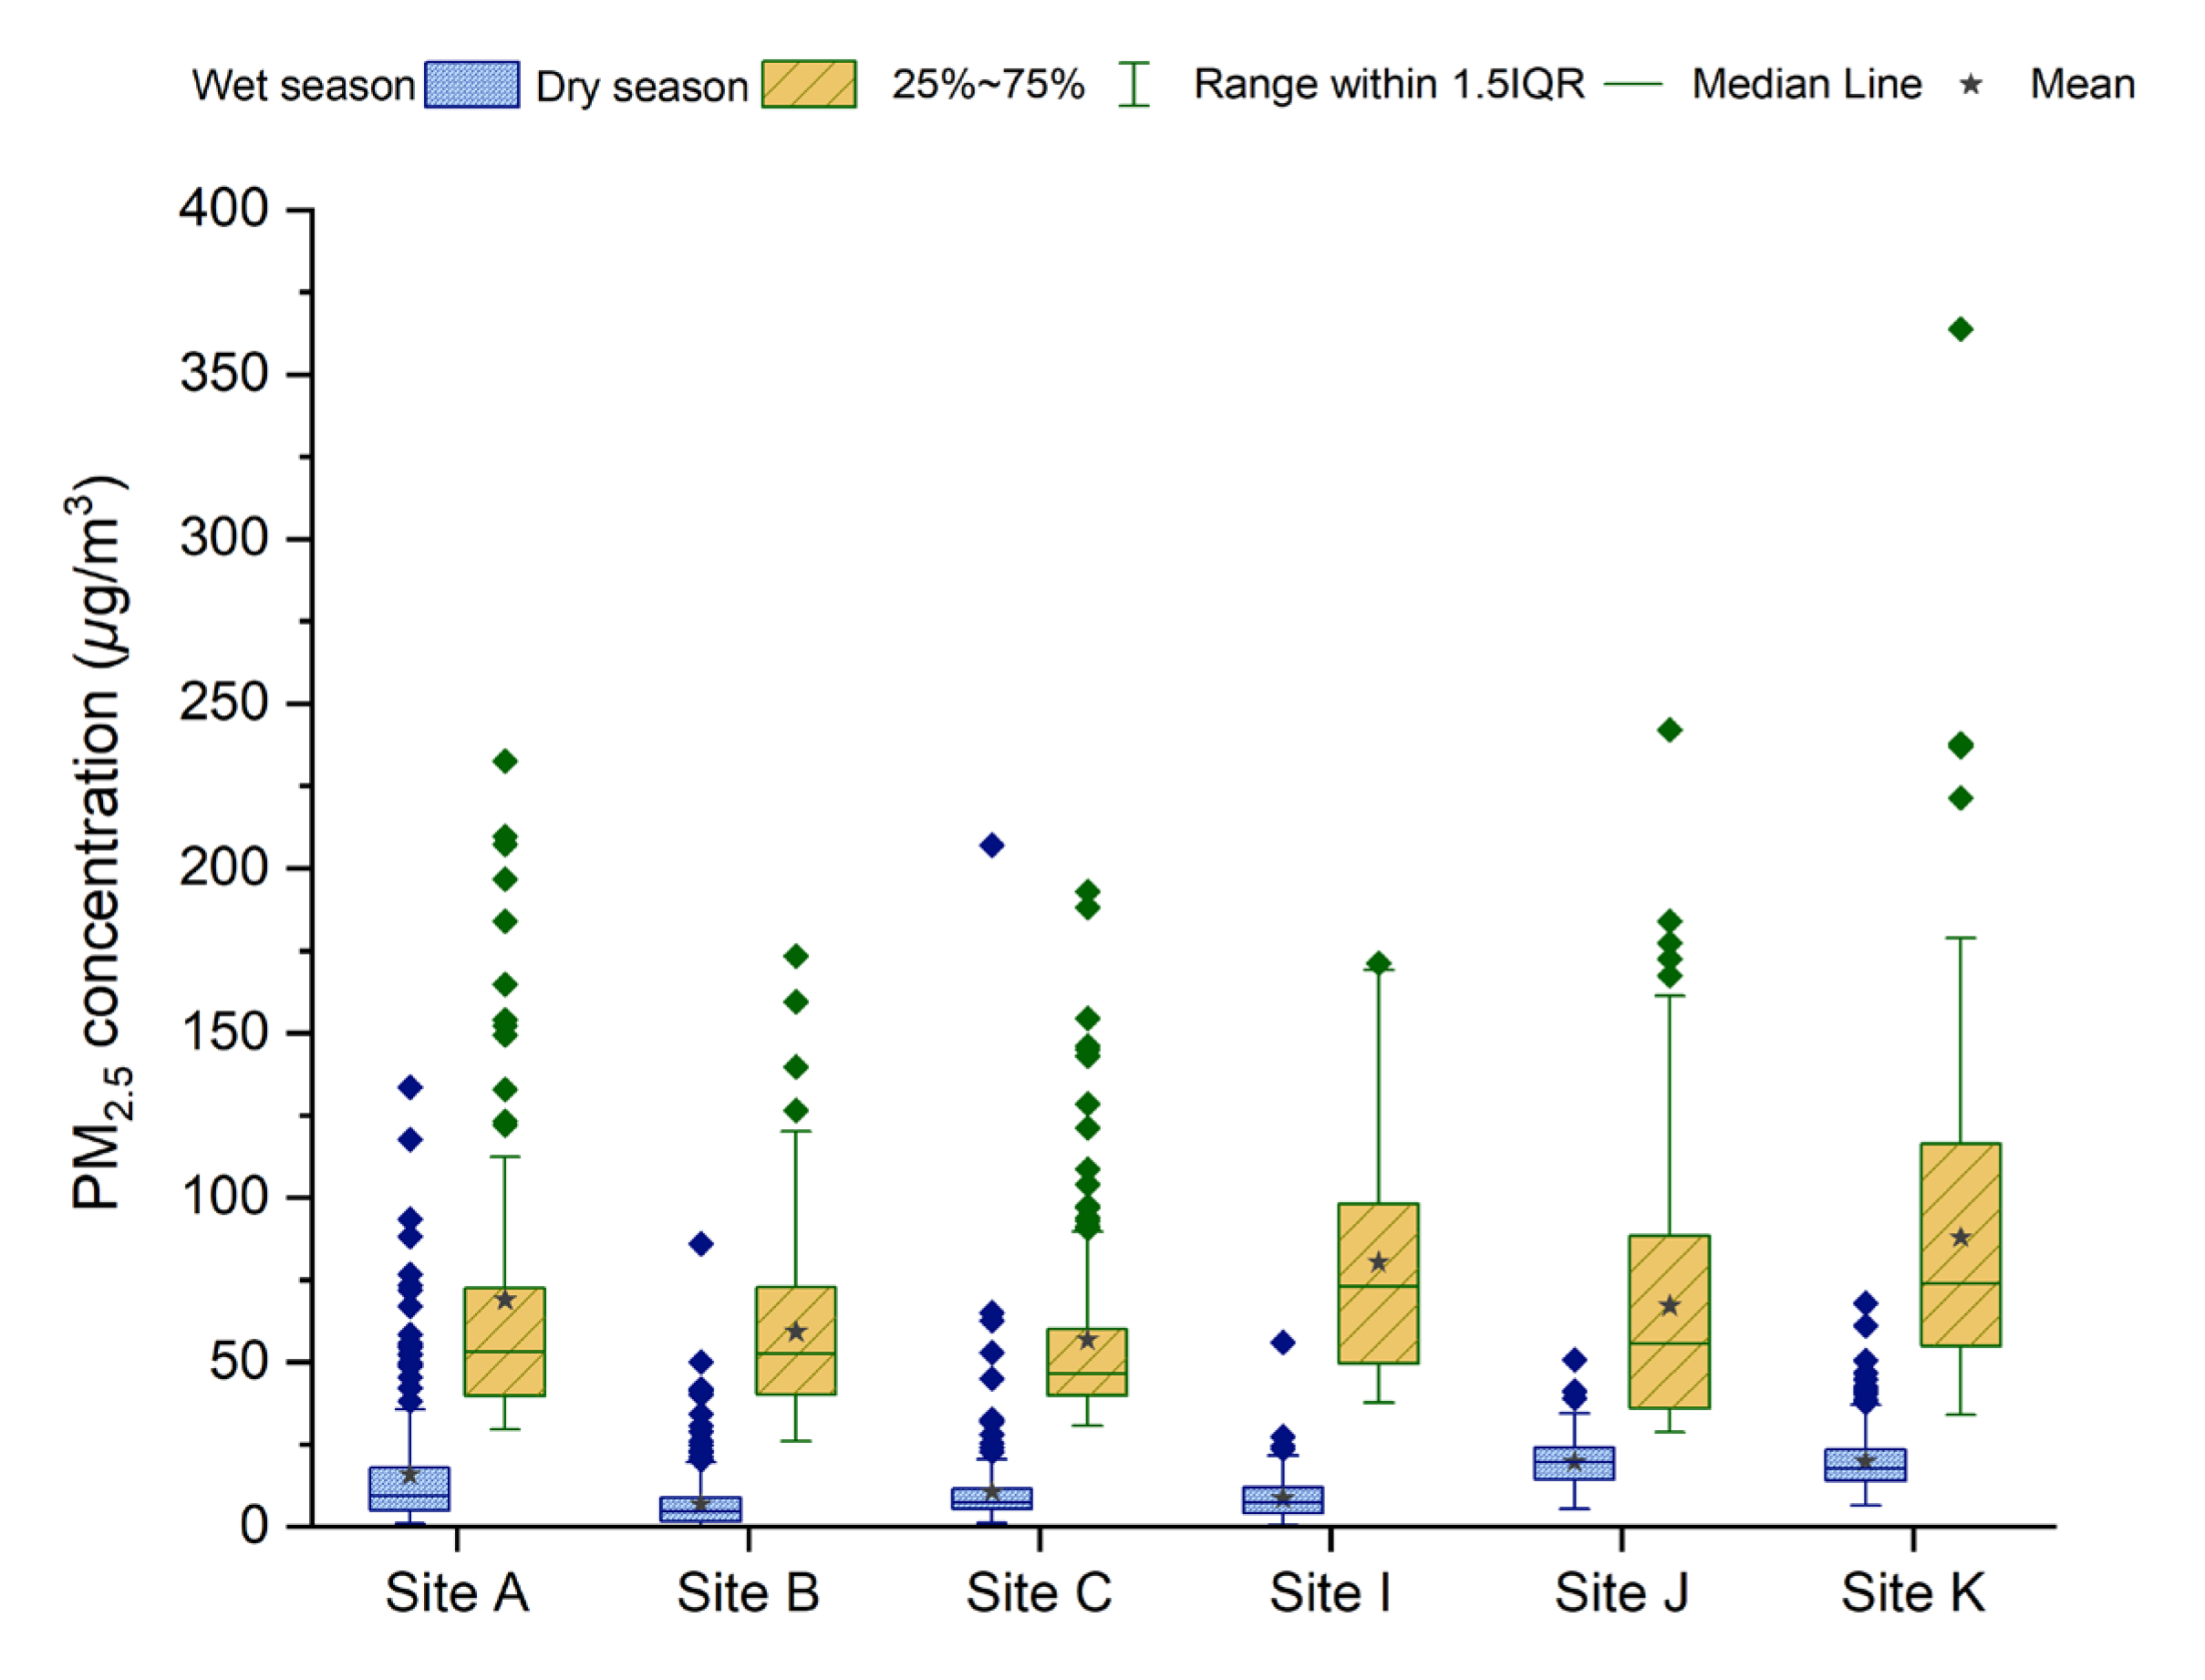
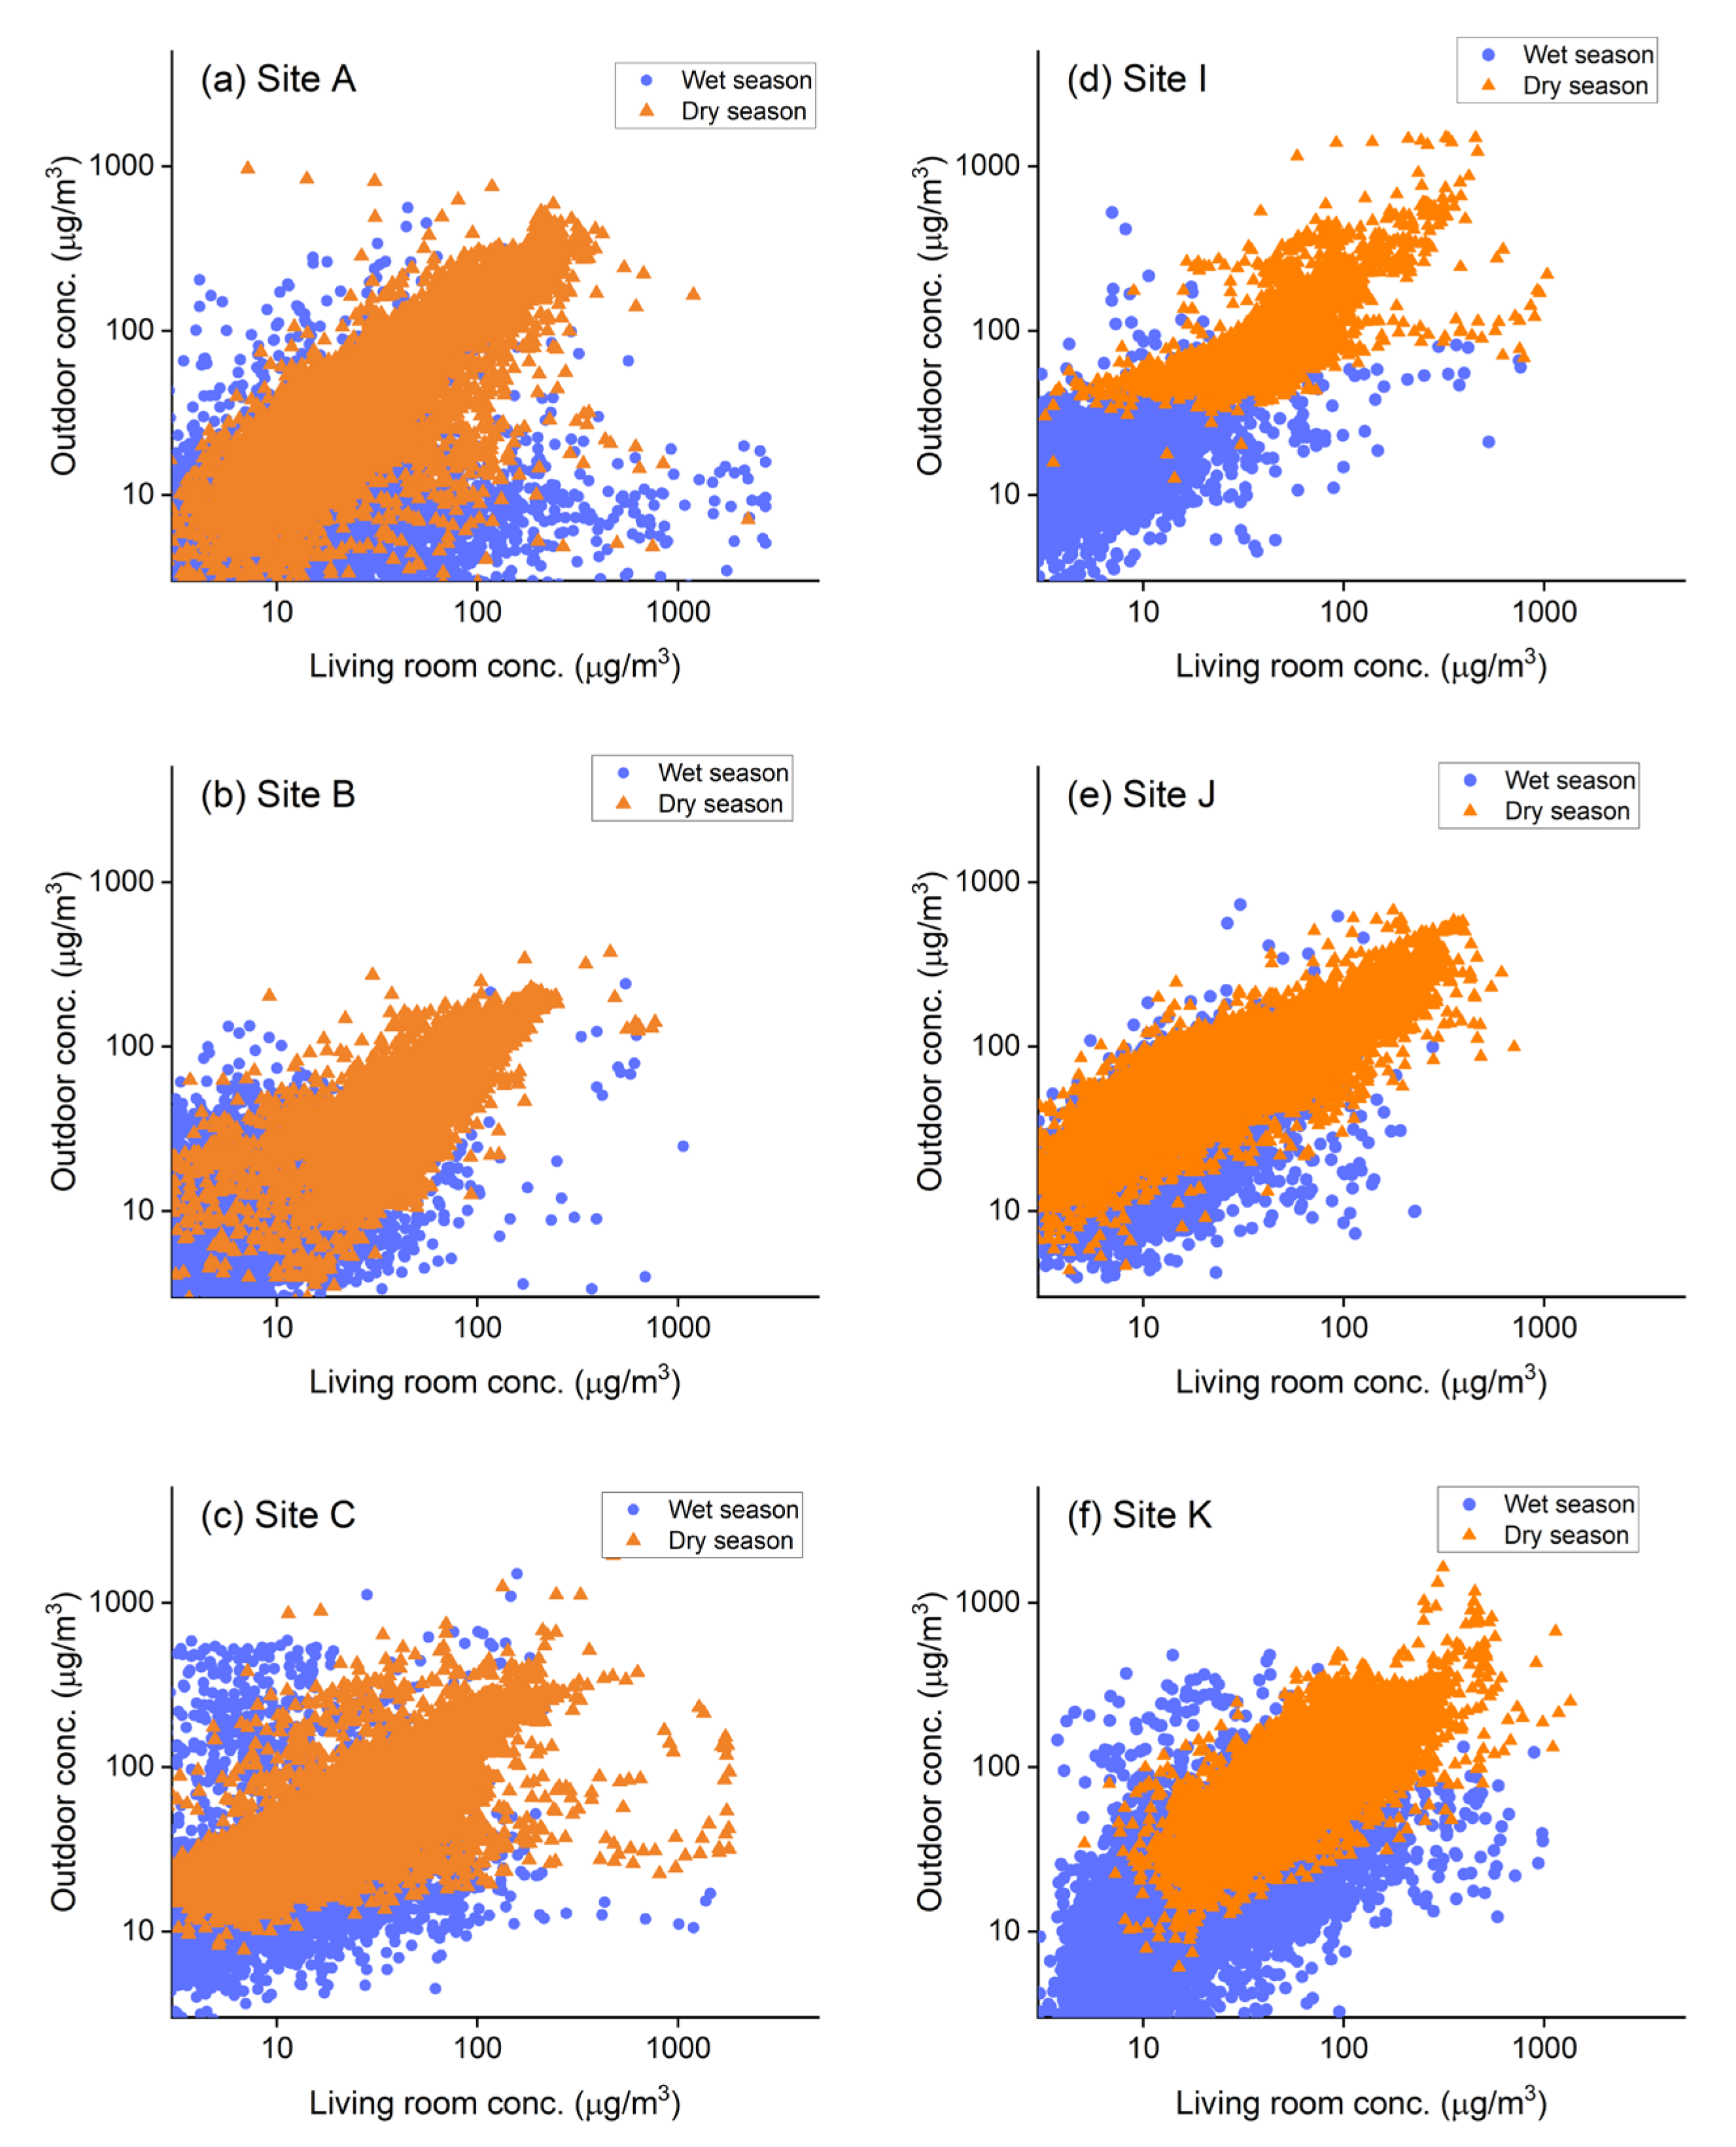
3.3. Site-to-Site and Diurnal Variations in PM2.5 in the Living Room

Whisker-box plots for daily averaged living room PM2.5 concentrations during the dry and wet seasons at each site are shown in Figure 6, and corresponding numerical values are listed in Table S4. The results of statistical analyses for the hourly PM2.5 concentrations in each month at each site are shown in Figure S2. The site-to-site variations in the average PM2.5 values in the living room were smaller than those in the kitchen. The higher average concentrations were observed at Sites J and K (both 20 µg/m3) during the wet season and at Sites I and K (60 and 68 µg/m3) during the dry season (Table S4). Relatively high outdoor PM2.5 concentrations, with averages of 21–32 (90–111) µg/m3 during the wet (dry) season, were reported at Sites I, J, and K, which are less in the urbanized area compared to Sites A and B, which had lower PM2.5 levels, 10–15 (41–49) µg/m3, during the wet (dry) season [28] (Table S4). This suggests that the higher outdoor PM2.5 concentrations at Sites I, J, and K likely contribute to the higher average PM2.5 levels in the living rooms at these sites.
Log–log scatter plots of outdoor vs. living room PM2.5 concentrations during the wet and dry seasons for each site are shown in Figure 7. Significant positive correlations were observed in both seasons, with average r values of 0.75 and 0.53 for the dry and wet seasons, respectively, except for a low value of 0.11 at Site B during the wet season. These values were higher than the average r values for the outdoor vs. kitchen scatter plots, which were 0.68 and 0.39 for the dry and wet seasons, respectively, except for a very low value of 0.06 in the kitchen during the wet season (Table S5). These findings indicate that indoor emission sources (such as cooking activities) have a relatively minor impact on PM2.5 levels in the living room compared to those in the kitchen, and that outdoor PM2.5 contributes more to living room concentrations than to kitchen concentrations.
Figure 8a,b display the diurnal variations in PM2.5 concentrations in the living rooms during the wet and dry seasons, respectively. PM2.5 concentrations in the living room had longer peak time than those of kitchen: from morning to noon (typically 6:00–12:00) and from evening to night (typically 18:00–22:00) in both seasons. The peak concentrations were relatively high at Sites A, J, and K during the wet season and at Sites A, C, J, and K during the dry season, compared to other sites. Figure 8c,d show the diurnal variation in the ratios of living room PM2.5 to outdoor PM2.5 (L/O ratio). At Site A, high L/O ratios exceeding 1.0 were observed throughout the day during the wet season, in contrast to the other sites. This may be partly attributed to the transfer of PM2.5 from the kitchen to the living room, given the large numbers of outliers with high living room concentrations observed in the scatter plots, especially during the wet season (Figure 7a). A slight enhancement of the L/O ratio was observed during morning and evening to night hours at Sites B and K in both seasons, suggesting non-negligible contributions of transfer of kitchen PM2.5 at these sites. At sites other than Site A, average L/O ratios after midnight (0:00–4:00) ranged from 0.29 to 0.72 and from 0.30 to 0.85 during the wet and dry seasons, respectively. The large site-to-site variations after midnight are likely due to differences in outdoor PM2.5 penetration efficiency at each household, although a quantitative analysis of the relationship with ventilation conditions is beyond the scope of this study.

3.4. Comparison with Literature Studies on Indoor PM2.5

As listed in Table 1, several previous studies reported PM2.5 concentrations in the rooms, including kitchens and living rooms, of households in Nigeria. The ranges of mean concentrations (12–75 and 24–159 µg/m3 during wet and dry seasons, respectively) in the kitchen obtained in this study are similar to the values reported by Kumar et al. [11] in Akure (9–27 µg/m3) and Adianimovie and Ebinimi [15] during the cooking hours in Yenagoa (35 and 51 µg/m3 for households using kerosene and firewood, respectively). Aigbokhaode and Isara [12] reported a wider range of PM2.5 concentrations in the kitchen (14–358 and 14–650 µg/m3 for households using electricity/LPG and kerosene/firewood, respectively) during short-term measurements in the daytime. However, the mean values (26 and 29 µg/m3 for these households) are consistent with the mean values observed in this study. Additionally, other studies [13,14,16] reported high PM2.5 concentrations (ranging from hundreds to thousands of µg/m3) in the kitchen during cooking. The maximum hourly PM2.5 concentrations in the kitchen at six sites (464–2781 µg/m3) obtained in this study are similar to those reported in the literature (Table 1). However, accurate comparisons are difficult due to the limited measurement durations and seasonal coverage in previous studies.
The average PM2.5 concentrations in the living room during the wet and dry seasons (7–20 and 35–68 µg/m3, respectively) observed in this study are in similar ranges to the values reported by Abulude et al. [19] at Akure, but lower than the values reported by Eghomwanre et al. [20] for the living rooms and basements of residential houses in Benin, Nigeria (33–60 and 51–93 µg/m3 during the wet and dry seasons, respectively) (Table 1). Interestingly, Eghomwanre et al. [20] reported that indoor PM2.5 concentrations were typically higher than outdoor levels. The greater contributions of indoor sources, such as cooking, may explain the higher PM2.5 levels observed in their study. Additionally, the PM2.5 levels in the living room obtained in this study are 1/5 to 1/10 of the corresponding values reported by Abulude et al. [17] in the living room of a residential house in Abuja during the daytime in the wet season and by Abulude et al. [18] in the living rooms of a bungalow apartment at Akure during the dry season (Table 1), although the cause of the difference is unclear.

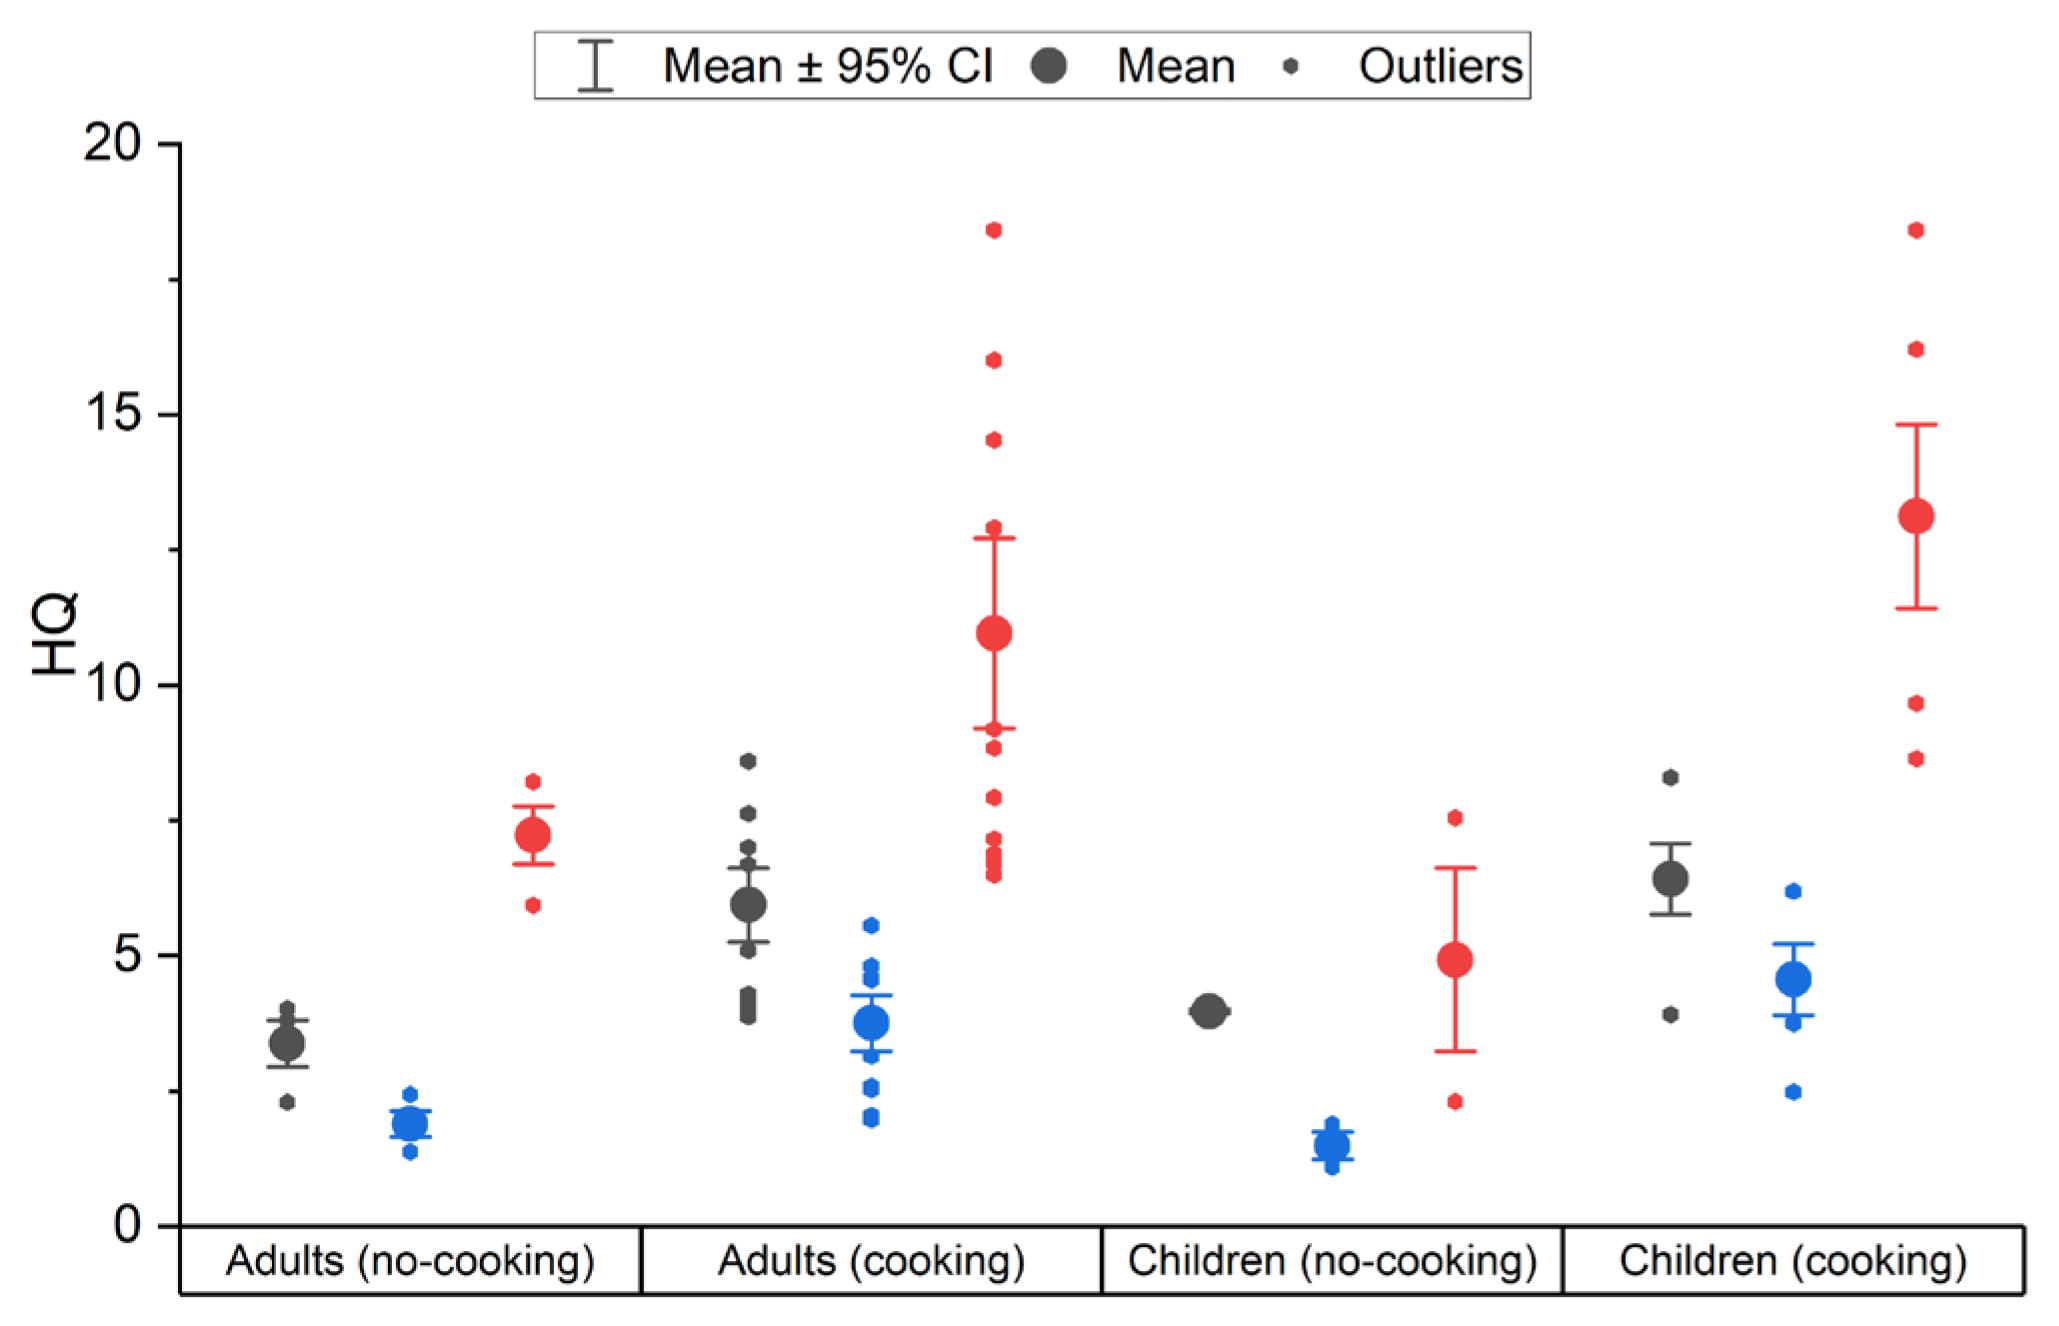
3.5. Exposure Risk Estimate

PM2.5 exposure for residents depends on their lifestyle, as different microenvironments have varying PM2.5 concentrations, which also fluctuate with time of day and season, even within the same household. In this study, the HQ values for 32 residents across six households were estimated by combining the time each resident spends outdoors, indoors, and in the kitchen with real observation data for outdoor, living room (indoor), and kitchen PM2.5 concentrations for each household.
Figure 9 presents the estimated HQ values for each group, (1) adults who do not cook (“adults (no-cooking)”), (2) adults who cook (“adults (cooking)”), (3) children who do not cook (“children (no-cooking)”), and (4) children who cook (“children (cooking)”), for the dry, wet, and all seasons. Their numerical values are provided in Table S6. The HQ values showed significant seasonal differences, with higher mean (±SD) values in the dry season (10.5 ± 4.2) compared to the wet season (3.6 ± 1.4). This is due to large seasonal variations in PM2.5 concentrations in the outdoors, living room, and kitchen (Figure 2). The significantly high average HQ values exceeding 1.0 suggest that PM2.5 air pollution is a potential health risk for residents, especially in the dry season.
For both seasons, groups involved in cooking exhibited relatively higher HQ values than those who did not cook. For all seasons, the average (±SD) HQ values for adults (cooking) and children (cooking) were 5.9 ± 1.5 and 6.4 ± 1.4, respectively, significantly higher than those for adults (no-cooking) and children (no-cooking) (3.4 ± 0.9 and 4.0 ± 0.1). These findings highlight the importance of minimizing exposure to high PM2.5 concentrations during cooking hours. The children (cooking) exhibited slightly higher average HQ values than those of adults, whereas we could not evaluate statistical significance due to small sampling size. Although children are generally more sensitive to PM2.5 than adults, this sensitivity was not accounted for in the current estimates. Further research on the exposure risks to PM2.5 for children, considering their increased sensitivity, and the development of strategies to mitigate these risks, will be crucial.
On average (±SD), the ADD during indoor stay contributed 59% (±18%) to the total ADD. If outdoor concentrations are assumed to represent indoor concentrations, including those in the kitchen, the estimated ADD values would be 35% (±39%) higher than those estimated using measured outdoor, living room, and kitchen concentrations, because outdoor concentrations were, on average, higher than indoor concentrations. These results suggest that measurements of both indoor and outdoor PM2.5 are necessary to accurately estimate residents’ exposure levels, which can vary depending on household location, building structure, and residents’ activities.
Several studies have evaluated PM2.5 exposure risks in Western Sub-Saharan Africa through personal exposure monitoring using personal PM2.5 samplers, mobile sensors, or indoor air quality measurements. In Nigeria, Eghomwanre et al. [20] estimated the hazard ratio (HR) for PM2.5, defined as the ratio of the observed mean PM2.5 concentration to the RfC (25 µg/m3), which is 1.04 times the HQ estimated in this study. Their estimates were based on monthly mobile measurements at 45 locations in Benin City, Nigeria. The HR values ranged from 1.3 to 2.4 in the wet season and 2.2 to 3.7 in the dry season, corresponding to HR values of 6.7–11.9 and 10.8–18.6, respectively, using an RfC value of 5. The mean (±SD) HR values estimated from the HQ values in this study are 3.7 ± 1.5 for the wet season and 11.0 ± 4.4 for the dry season, respectively. The slightly lower HR values compared with those reported by Eghomwanre et al. [20] are mainly attributed to the lower indoor (living room) concentrations (Table 1), as the reported outdoor concentrations were similar to each other.
In other Western Sub-Sahara African countries, Xu et al. [23] investigated personal PM2.5 exposure at three sites: a domestic fire site for women, a waste burning site for students in Abidjan, Côte d’Ivoire, and a motorcycle traffic site for drivers in Cotonou, Benin. They reported average personal PM2.5 exposures of 359, 494, and 335 µg/m3 in the dry season (January), and 305, 220, and 151 µg/m3 in the wet season (July), respectively. These PM2.5 levels correspond to HQ values of approximately 30–80, assuming an RfC value of 5 µg/m3. Arku et al. [24] measured personal PM2.5 exposures for 56 students in Accra, Ghana, based on personal filter sampling and mobile sensor monitoring from January to August. They reported individual exposure levels ranging from less than 10 µg/m3 to more than 150 µg/m3, with a mean value of 56 µg/m3, corresponding to an HQ value of approximately 11, assuming an RfC value of 5 µg/m3. They also noted that the use of biomass fuels in living areas was associated with higher PM2.5 exposures. Piedrahita et al. [25] reported the chemical compositions of PM2.5, which were collected by personal filter sampling by 88 individuals in Navrongo, Northern Ghana. They reported the mean concentration of the sum of organic carbon and elemental carbon to be 42 µg/m3, which is much higher than the corresponding concentration in ambient samples (4 µg/m3). This corresponds to a lower limit of HQ = 8.5 for PM2.5 exposure using the RfC value of 5 µg/m3. Their positive matrix factorization analysis identified cooking with solid fuels as a significant contributor to PM2.5 exposure. Although HQ values above unity were common, the mean HQ (±SD) of 5.5 ± 1.8 for all seasons estimated in this study is slightly lower than those reported by Arku et al. [24] and Piedrahita et al. [25] and an order of magnitude lower than the values reported by Xu et al. [23].

4. Conclusions

This study used low-cost sensors for continuous, multiyear monitoring of indoor PM2.5 concentrations in living rooms and kitchens at six sites in Akure, Nigeria. Seasonal variations showed significantly higher PM2.5 concentrations during the dry season compared to the wet season, mirroring outdoor PM2.5 trends. However, seasonal variations were less pronounced indoors, likely due to the filtering of high outdoor PM2.5 concentrations during the dry season. Monthly median values in the kitchens were similar to those in the living rooms during the dry season but higher during the wet season. The greater penetration of outdoor PM2.5 into indoor spaces during the dry season and the lower efficiency of outdoor PM2.5 penetration into the kitchen are suggested to contribute to higher PM2.5 levels in the living room during the dry season. In contrast, cooking activities contributed more to PM2.5 in the kitchen during the wet season. PM2.5 concentrations varied significantly across sites, especially in kitchens, due to differences in cooking activities, fuel types, and household ventilation. At several sites, significant increases in the kitchen-to-outdoor and living-to-outdoor ratios were observed during the day, particularly in the morning and evening, reflecting the impact of cooking activities and particle penetration. These findings suggest that PM2.5 emissions from cooking and their penetration into the living room are key factors in the temporal and site-to-site variation in indoor PM2.5 levels.
Using the WHO air quality guideline for yearly average inhalation reference concentration, the mean (±SD) HQ values for 32 residents were estimated to be 3.6 ± 1.4 in the wet season and 10.5 ± 4.2 in the dry season. Residents involved in cooking activities had higher HQ values than others. The high HQ values exceeding unity highlight the urgent need to address both indoor and outdoor air pollution to mitigate exposure risks in Nigeria, particularly for vulnerable groups such as children and the elderly. This underscores the importance of developing targeted strategies to improve ventilation and reduce cooking emissions.
Further research is needed to understand the factors driving differences in indoor PM2.5 levels across locations, including expanding the number of monitoring sites and simultaneous measurements of parameters related to cooking activity and ventilation pattern. Additionally, integrating indoor and outdoor air quality monitoring data with particle toxicity and health-related data will offer more detailed insights into the health risk of PM2.5. The use of low-cost sensors represents a promising approach to advance research and identify targeted solutions for improving air quality and health outcomes.

Supplementary Materials

The following supporting information can be downloaded at https://www.mdpi.com/article/10.3390/atmos16050603/s1: Text S1: Estimation of the hazard quotient; Table S1: Summary of risk assessment recommendations for children and adults by the USEPA; Table S2: Duration of time each resident spent outdoors, indoors, and in the kitchen; Table S3: Monthly and seasonal means, medians, and maxima of PM2.5 concentrations across all sites; Table S4: Seasonal and annual mean PM2.5 concentrations in the outdoor, kitchen, and living room at each site; Table S5: Slopes, intercepts, and Pearson’s correlation coefficients (r) for log–log plots of 5-minutes average PM2.5 concentrations between outdoor and kitchen, and between outdoor and living room during the wet and dry seasons at each site; Table S6: Statistics of HQ values for each group; Figure S1: Whisker-box plots for hourly kitchen PM2.5 concentrations for each month in 2020, 2021, and 2022 at all studied sites; Figure S2: Whisker-box plots for hourly living room PM2.5 concentrations for each month in 2020, 2021, and 2022 at all studied sites.

Author Contributions

Conceptualization, T.N. and F.O.A.; sensor preparation and calibration, T.N. and Y.M.; observation and data collection, F.O.A., M.M.N., A.A., S.D.O. and T.N.; data curation and analysis, S.S. and T.N.; visualization, S.S. and K.A.; discussion, S.S., K.K. and T.N.; writing, S.S. and T.N.; funding acquisition, T.N. All authors have read and agreed to the published version of the manuscript.

Funding

This research was supported by the Leading Initiative for Excellent Young Researchers and the Grant-in-Aid for Scientific Research (KAKENHI 21KK0187), MEXT, Japan, the Grant for Environmental Research Projects from the Sumitomo Foundation, and the Nagasaki University WISE Programme.

Institutional Review Board Statement

Not applicable.

Informed Consent Statement

Not applicable.

Data Availability Statement

Data available upon request.

Acknowledgments

The authors express their appreciation for P. Nakayama, and H. Nakayama (Nagasaki University) for their advice.

Conflicts of Interest

The authors declare no conflicts of interest.

References

  1. World Health Organization. WHO, Household Air Pollution. 2024. Available online: https://www.who.int/news-room/fact-sheets/detail/household-air-pollution-and-health (accessed on 1 December 2024).
  2. Pai, S.J.; Carter, T.S.; Heald, C.L.; Kroll, J.H. Updated world health organization air quality guidelines highlight the importance of non-anthropogenic PM2.5. Environ. Sci. Technol. Lett. 2022, 9, 501–506. [Google Scholar] [CrossRef] [PubMed]
  3. Yu, W.; Xu, R.; Ye, T.; Abramson, M.J.; Morawska, L.; Jalaludin, B.; Johnston, F.H.; Henderson, S.B.; Knibbs, L.D.; Morgan, G.G.; et al. Estimates of global mortality burden associated with short-term exposure to fine particulate matter (PM2.5). Lancet Planet. Health 2024, 8, e146–e155. [Google Scholar] [CrossRef] [PubMed]
  4. Chen, J.; Hoek, G.; de Hoogh, K.; Rodopoulou, S.; Andersen, Z.J.; Bellander, T.; Brandt, J.; Fecht, D.; Forastiere, F.; Gulliver, J.; et al. Long-term exposure to source-specific fine particles and mortality─A pooled analysis of 14 European cohorts within the ELAPSE project. Environ. Sci. Technol. 2022, 56, 9277–9290. [Google Scholar] [CrossRef] [PubMed]
  5. McDuffie, E.E.; Martin, R.V.; Spadaro, J.V.; Burnett, R.; Smith, S.J.; O’Rourke, P.; Hammer, M.S.; van Donkelaar, A.; Bindle, L.; Shah, V.; et al. Source sector and fuel contributions to ambient PM2.5 and attributable mortality across multiple spatial scales. Nat. Commun. 2021, 12, 3594. [Google Scholar] [CrossRef]
  6. Aboubacar, B.; Deyi, X.; Razak, M.Y.A.; Leyla, B.H. The effect of PM2.5 from household combustion on life expectancy in Sub-Saharan Africa. Int. J. Environ. Res. Public Health 2018, 15, 748. [Google Scholar] [CrossRef]
  7. National Population Commission (NPC) [Nigeria]; ICF. Nigeria Demographic and Health Survey 2018; NPC: Abuja, Nigeria; ICF: Rockville, ML, USA, 2019. [Google Scholar]
  8. National Bureau of Statistics (NBS) [Nigeria]. Nigeria Living Standard Survey 2018/2019; National Bureau of Statistics: Abuja, Nigeria, 2020. [Google Scholar]
  9. National Population Commission (NPC) [Nigeria]; ICF Macro. Nigeria Demographic and Health Survey 2008; NPC: Abuja, Nigeria; ICF Macro: Rockville, ML, USA, 2009. [Google Scholar]
  10. Fawehinmi, A.S.; Oyerinde, O.V. Household energy in Nigeria: The Challenge of pricing and poverty in fuel switching. J. Energy Dev. 2002, 27, 277–284. Available online: https://www.jstor.org/stable/24808712 (accessed on 1 September 2024).
  11. Kumar, P.; Hama, S.; Abbass, R.A.; Nogueira, T.; Brand, V.S.; Wu, H.W.; Abulude, F.O.; Adelodun, A.A.; Anand, P.; Andrade, M.F.; et al. In-kitchen aerosol exposure in twelve cities across the globe. Environ. Int. 2022, 162, 107155. [Google Scholar] [CrossRef]
  12. Aigbokhaode, A.Q.; Isara, A.R. Household air pollution and respiratory symptoms of women and children in a suburban community in Nigeria. Turk. Thorac. J. 2021, 22, 466–472. [Google Scholar] [CrossRef]
  13. Giwa, S.O.; Nwaokocha, C.N.; Sharifpur, M. An appraisal of air quality, thermal comfort, acoustic, and health risk of household kitchens in a developing country. Environ. Sci. Pollut. Res. 2022, 29, 26202–26213. [Google Scholar] [CrossRef]
  14. Adianimovie, S.; Ebinimi, G. Investigation of particulate matter (PM10 & PM2.5) and gaseous pollutants (CO2 & CO) in houses using kerosene cooking stoves & wood fire in Attisa 3, Bayelsa State, Nigeria. NIPES J. Sci. Technol. Res. 2023, 5, 206–219. [Google Scholar] [CrossRef]
  15. Oluwole, O.; Ana, G.R.; Arinola, G.O.; Wiskel, T.; Falusi, A.G.; Huo, D.; Olopade, O.I.; Olopade, C.O. Effect of stove intervention on household air pollution and the respiratory health of women and children in rural Nigeria. Air Qual. Atmos. Health 2013, 6, 553–561. [Google Scholar] [CrossRef]
  16. Giwa, S.O.; Oladosu, J.O.; Sulaiman, M.A.; Taziwa, R.T.; Sharifpur, M. Influence of stove locations and ventilation conditions on kitchen air quality and thermal comfort during oil-cooking activities. Atmos. Pollut. Res. 2023, 14, 101882. [Google Scholar] [CrossRef]
  17. Abulude, F.O.; Feyisetan, A.O.; Arifalo, K.M.; Akinnusotu, A.; Bello, L.J. Indoor particulate matter assessment in a Northern Nigerian abattoir and a residential building. J. Atmos. Sci. Res. 2022, 5, 20–28. [Google Scholar] [CrossRef]
  18. Abulude, F.O.; Ratford, V.; Ratford, J.; Seelam, R.; Akinnusotu, A.; Olayinka, Y.V.; Arifalo, K.M.; Adamu, A.; Bello, L.J. Indoor air quality monitoring in Akure, Ondo State, Nigeria. Qual. Life 2024, 15, 13–28. [Google Scholar] [CrossRef]
  19. Abulude, F.O.; Suriano, D.; Oluwagbayide, S.D.; Akinnusotu, A.; Abulude, I.A.; Awogbindin, E. Study on indoor pollutants emission in Akure, Ondo State, Nigeria. Arab. Gulf J. Sci. Res. 2024, 42, 1643–1663. [Google Scholar] [CrossRef]
  20. Eghomwanre, A.F.; Oguntoke, O.; Taiwo, A.M. Levels of indoor particulate matter and association with asthma in children in Benin City, Nigeria. Environ. Monit. Assess. 2022, 194, 467. [Google Scholar] [CrossRef]
  21. Bachwenkizi, J.; Liu, C.; Meng, X.; Zhang, L.; Wang, W.; Donkelaar, A.V.; Martin, R.V.; Hammer, M.S.; Chen, R.; Kan, H. Maternal exposure to fine particulate matter and preterm birth and low birth weight in Africa. Environ. Int. 2022, 160, 107053. [Google Scholar] [CrossRef]
  22. Tajudeen, Y.; Mohammed, U.F.; Mohammed, Z.A.; Abdulazeez, A.; Abdulgafar, I.B.; Musa, B.; Adedayo, J. Concentrations and health risks of particulate matter (PM2.5) and associated elements in the ambient air of Lagos, Southwestern Nigeria. J. Biol. Res. Biotechnol. 2023, 21, 2141–2149. [Google Scholar] [CrossRef]
  23. Xu, H.; Léon, J.-F.; Liousse, C.; Guinot, B.; Yoboué, V.; Akpo, A.B.; Adon, J.; Ho, K.F.; Ho, S.S.H.; Li, L.; et al. Personal exposure to PM2.5 emitted from typical anthropogenic sources in southern West Africa: Chemical characteristics and associated health risks. Atmos. Chem. Phys. 2019, 19, 6637–6657. [Google Scholar] [CrossRef]
  24. Arku, R.E.; Dionisio, K.L.; Hughes, A.F.; Vallarino, J.; Spengler, J.D.; Castro, M.C.; Agyei-Mensah, S.; Ezzati, M. Personal particulate matter exposures and locations of students in four neighborhoods in Accra, Ghana. J. Expo. Sci. Environ. Epidemiol. 2015, 25, 557–566. [Google Scholar] [CrossRef]
  25. Piedrahita, R.; Kanyomse, E.; Coffey, E.; Xie, M.; Hagar, Y.; Alirigia, R.; Agyei, F.; Wiedinmyer, C.; Dickinson, K.L.; Oduro, A.; et al. Exposures to and origins of carbonaceous PM2.5 in a cookstove intervention in Northern Ghana. Sci. Total Environ. 2017, 576, 178–192. [Google Scholar] [CrossRef] [PubMed]
  26. Abulude, F.O.; Oluwagbayide, S.D.; Akinnusotu, A.; Elemide, O.A.; Gbotoso, A.O.; Ademilua, S.O.; Abulude, I.A. Indoor air quality in a tertiary institution: The case of Federal College of Agriculture, Akure, Nigeria. Aerosol Sci. Eng. 2024, 8, 1–12. [Google Scholar] [CrossRef]
  27. Ite, A.E.; Harry, T.A.; Obadimu, C.O.; Ekwere, I.O. Comparison of indoor air quality in schools: Urban vs. industrial ‘oil & gas’ zones in Akwa Ibom State—Nigeria. JEPHH. 2019, 7, 15–26. [Google Scholar] [CrossRef]
  28. Saetae, S.; Abulude, F.O.; Ndamitso, M.M.; Akinnusotu, A.; Oluwagbayide, S.D.; Matsumi, Y.; Kanegae, K.; Kawamoto, K.; Nakayama, T. Multi-year continuous observations of ambient PM2.5 at six sites in Akure, Southwestern Nigeria. Atmosphere. 2024, 15, 867. [Google Scholar] [CrossRef]
  29. UN. World Population Prospects 2024. United Nations. 2024. Available online: https://population.un.org/wpp/ (accessed on 1 December 2024).
  30. Dimari, G.A.; Hati, S.S.; Waziri, M.; Maitera, O.N. Pollution synergy from particulate matter sources: The Harmattan fugitive dust and combustion emission in Maiduguri Metropolis Nigeria. Eur. J. Sci. Res. 2008, 23, 465–471. [Google Scholar]
  31. Orogade, S.A.; Kayode, O.O.; Philip, K.H.; Donatus, B.A.; Abubakar, U.I.; Charles, A.O. Source apportionment of fine and coarse particulate matter in industrial areas of Kaduna, Northern Nigeria. Aerosol Air Qual. Res. 2016, 16, 1179–1190. [Google Scholar] [CrossRef]
  32. World Bank. Climate Change Knowledge Portal for Development Practitioners and Policy Makers, Climate Change Knowledge Portal. 2024. Available online: https://climateknowledgeportal.worldbank.org/country/nigeria (accessed on 1 December 2024).
  33. Nakayama, T.; Matsumi, Y.; Kawahito, K.; Watabe, Y. Development and evaluation of a palm-sized optical PM2.5 sensor. Aerosol Sci. Technol. 2018, 52, 2–12. [Google Scholar] [CrossRef]
  34. Ly, B.T.; Matsumi, Y.; Nakayama, T.; Sakamoto, Y.; Kajii, Y.; Nghiem, T.D. Characterizing PM2.5 in Hanoi with new high temporal resolution sensor. Aerosol Air Qual. Res. 2018, 18, 2487–2497. [Google Scholar] [CrossRef]
  35. Singh, T.; Matsumi, Y.; Nakayama, T.; Hayashida, S.; Patra, P.K.; Yasutomi, N.; Kajino, M.; Yamaji, K.; Khatri, P.; Takigawa, M.; et al. Very high particulate pollution over northwest India captured by a high-density in situ sensor network. Sci. Rep. 2023, 13, 13201. [Google Scholar] [CrossRef]
  36. USEPA. Conducting a Human Health Risk Assessment. The United States Environmental Protection Agency. 2024. Available online: https://www.epa.gov/risk/conducting-human-health-risk-assessment (accessed on 30 December 2024).
  37. WHO. WHO Global Air Quality Guidelines: Particulate Matter (PM2.5 and PM10), Ozone, Nitrogen Dioxide, Sulfur Dioxide and Carbon Monoxide. World Health Organization. 2021. Available online: https://apps.who.int/iris/handle/10665/345329 (accessed on 30 August 2024).
  38. National Environmental Standards and Regulations Enforcement Agency (NESREA). Ambient Air Quality Standards for Criteria Pollutants and Air Toxic. Schedule XIII. Regulation 29. 30 and 33. Fed. Repub. Niger. Off. Gaz. 2021, 108, 3373. [Google Scholar]
Figure 1. Layouts of houses and locations of sensors at the six observation sites.
Atmosphere 16 00603 g001
Figure 2. Whisker-box plots for daily PM2.5 concentrations in each month at all sites. The black, blue, and green boxes represent the data for the outdoor, living room, and kitchen, respectively. The stars and diamonds represent the mean values in each month and the outliers, respectively. The blue and red lines are the daily air quality standards of Nigeria (40 µg/m3) and the WHO target for the daily concentration (15 µg/m3), respectively. Note that two outliers (680 and 744 µg/m3 for the kitchen data in February and September, respectively) are located outside the range of the figure.
Atmosphere 16 00603 g002
Figure 3. Whisker-box plots for daily averaged kitchen PM2.5 concentrations during the wet and dry seasons at each site.
Atmosphere 16 00603 g003
Figure 4. Scatter plot showing the relationship between outdoor and kitchen PM2.5 concentrations (5 min average) at each observation site.
Atmosphere 16 00603 g004
Figure 5. Diurnal variation in (a,b) PM2.5 concentrations in the kitchen and (c,d) K/O ratios at each site during the (a,c) wet and (b,d) dry seasons.
Atmosphere 16 00603 g005
Figure 6. Whisker-box plots for daily living room PM2.5 concentrations during the wet and dry seasons at each site.
Atmosphere 16 00603 g006
Figure 7. Scatter plot showing the relationship between outdoor and living room PM2.5 concentrations (5 min average) at each observation site.
Atmosphere 16 00603 g007
Figure 8. Diurnal variation in (a,b) PM2.5 concentrations in the living room and (c,d) L/O ratios at each site during the (a,c) wet and (b,d) dry seasons.
Atmosphere 16 00603 g008
Figure 9. Estimated HQ values for each group for all seasons (black symbols), wet season (blue symbols), and dry (red symbols) season.
Atmosphere 16 00603 g009
Table 1. Summary of indoor PM2.5 levels in Nigeria.
PlaceMeasurement
Location
PeriodAverage
PM2.5 Conc.
(µg/m3)
Reference
Akure, Ondo StateKitchen
(5 households)
7 days9–27 (LPG, LPG/electricity, LPG/kerosene)Kumar et al. [11]
Benin, Edo StateKitchen
(62 households)
30–60 min
(8:00–18:00)
14–358 (electricity or LPG)
14–650 (kerosene or firewood)
Aigbokhaode and Isara [12]
Sango, Ogun StateKitchen
(38 households)
49–158 min
(5.45–10.00 or 17:30–20.30)
64–102 (before cooking)
97–187 (during cooking with kerosene)
Giwa et al. [13]
Yenagoa, Bayelsa StateKitchen
(30 households)
4 days
(6:00–9:00 and 17:00–20:00)
51 (kerosene)
37 (firewood)
Adianimovie and Ebinimi [14]
Three communities near Ibadan, Oyo StateKitchen
(59 households)
1 h
(before and during cooking)
831–3437 (IQR during cooking with firewood, pre-intervention)
50–277 (IQR during cooking with firewood, post-intervention)
Oluwole et al. [15]
Olabisi Onabanjo UniversityTest kitchen~140 min
(laboratory experiments)
1129–1335 (during flying)
130–232 (after flying)
Giwa et al. [16]
Abuja, FCTLiving room
(one residential building)
August–September 2022
(during daytime for two weeks)
83Abulude et al. [17]
Akure,
Ondo State
Two living/one kitchen/two others (a bungalow apartment)January–February 2022
(one month)
461, 695 (living rooms)
483 (kitchen)
350, 391 (other rooms)
Abulude et al. [18]
Akure,
Ondo State
Living room
(one household)
January/April/November/December42 (January)/25 (April)/36 (November)/55 (December)Abulude et al. [19]
Benin,
Edo State
Living room/basement
(45 households)
April 2019–March 2020
(once per month)
33–60 (wet season)
51–93 (dry season)
Eghomwanre et al. [20]
Akure,
Ondo State
Kitchen and living rooms
(6 households)
May 2020–September 2022
(depends on sites)
12–75 (kitchen, wet season)
24–159 (kitchen, dry season)
7–20 (living room, wet season)
35–68 (living room, dry season)
This work
Table 2. Household characteristics and typical fraction of cooking fuels at each site.
Site NameABCIJK
LocationAkure SAkure SAkure NAkure NAkure NAkure N
Latitude (°N)7.2117.2257.2687.2687.2677.263
Longitude (°E)5.1755.1725.2525.2545.2545.258
Observation period in kitchenJune 2020
–July 2022
June 2020
–April 2022
June 2020
–September 2022
February 2021
–September 2022
March 2022
–June 2022
May 2021
–September 2022
Observation period in living roomMay 2020
–December 2021
May 2020
–June 2022
May 2020
–May 2021
May 2021
–March 2022
May 2021
–August 2022
May 2021
–September 2022
Type of kitchen where PM2.5 was monitoredIndoor
kitchen
Indoor
kitchen
Indoor
kitchen
Indoor
kitchen
Open
outdoor
kitchen
Indoor
kitchen
Number of residents455666
Number of smokers000010
Fraction cooking fuel used in wet/dry season
-electricity (%)30/3020/20-10/10-40/40
-gases (%)50/5070/7055/6080/80-50/50
-kerosene (%)20/2010/1015/20-/10-10/10
-charcoal (%)--30/20---
-firewood (%)---10/0100/100-
Disclaimer/Publisher’s Note: The statements, opinions and data contained in all publications are solely those of the individual author(s) and contributor(s) and not of MDPI and/or the editor(s). MDPI and/or the editor(s) disclaim responsibility for any injury to people or property resulting from any ideas, methods, instructions or products referred to in the content.

