Article

Evaluation of Time Delay and Cumulative Effects of Meteorological Drought on Net Primary Productivity of Vegetation in the Upper Reaches of the Yellow River, China

1
School of Surveying and Engineering Information, Henan Polytechnic University (HPU), Jiaozuo 454003, China
2
Heihe Water Resources and Ecological Protection Research Center, Lanzhou 730030, China
*
Author to whom correspondence should be addressed.
Atmosphere 2025, 16(5), 602; https://doi.org/10.3390/atmos16050602
Submission received: 14 April 2025 / Revised: 13 May 2025 / Accepted: 14 May 2025 / Published: 16 May 2025
(This article belongs to the Special Issue Drought Monitoring, Prediction and Impacts (2nd Edition))

Abstract

As a critical region for ecological construction in China, the upper Yellow River is still relatively short of research on the time-lag and cumulative effects of regional-scale drought on vegetation growth. Therefore, based on net primary productivity (NPP) estimated by the improved CASA (Carnegie–Ames–Stanford approach) model and multi-time scale SPEI, trend analysis, significance test and partial correlation analysis were employed to explore the spatial and temporal patterns of NPP and quantitatively evaluate its response to drought. The results showed that (1) From 2001 to 2022, NPP was higher in the south and lower in the north, decreasing from southwest to northeast, and annual NPP was increasing in 87.9% of the regions. NPP in spring, summer and autumn has been significantly improved. (2) In terms of interannual and spatial distribution, except for spring and winter, annual, summer and autumn all showed an insignificant trend of humidification. (3) The lag and cumulative effects of drought on vegetation in most areas are positively correlated. About 82.58% of NPP in the growing season has a time-lag effect with drought, which mainly focuses on 1–2 months. The average lag time was 3.6 months, indicating that NPP had the strongest correlation with the meteorological drought index of the previous 3.6 months. For cumulative effect, about 66.14% of NPP had a cumulative effect on drought, and the cumulative time scales were mainly March, April, November and December. With the worsening of drought conditions, the effect of drought on NPP is enhanced. These findings enhance the understanding of the long-term consequences of drought on terrestrial ecosystems and provide a basis for the development of mitigation and adaptation strategies aimed at alleviating the adverse effects of drought on agriculture and ecosystems.

1. Introduction

Drought is considered among the most impactful natural disasters, causing significant ecological, economic and social consequences [1,2]. Research indicates that ongoing climate change, driven by rising temperatures, higher potential evapotranspiration and shifts in precipitation patterns, may lead to increased occurrences and severity of droughts, with the IPCC AR6 emphasizing that as warming continues, more regions will be affected by droughts going forward [3,4]. As meteorological drought initiates drought processes, understanding its related effects is crucial for precisely evaluating the influence of drought conditions on ecosystems, especially on vegetation, soil and water resources. In the context of continuous global warming, the degree of drought has a decisive impact on vegetation type, structure, land degradation and forest fires [5,6]. Prolonged severe drought can critically damage vegetation ecosystems, potentially triggering terrestrial ecosystem collapse [7,8]. Net primary productivity (NPP) is the net value of the plant community after respiration consumption is subtracted from photosynthetic activity over a given time period and area [9,10,11], which can accurately reveal the dynamic change of vegetation [12]. As a key element in exploring ecosystem carbon budget and evaluating ecological sustainability [13], it determines the carbon sink of terrestrial ecosystems [14], and its changes can directly reflect the reaction of vegetation systems to environmental and climatic conditions [15]. Therefore, exploring the traits of vegetation ecosystems under drought stress is crucial for maintaining the stability and development of terrestrial ecosystems and ensuring regional ecological security.
Drought index is an effective tool for monitoring and characterizing drought events. In meteorological drought monitoring, the commonly used evaluation indexes include the relative humidity index, the standardized precipitation index (SPI) [16], the Palmer drought severity index (PDSI) [17] and the standardized precipitation evapotranspiration index (SPEI) [18]. Among these, SPEI is particularly favored because it comprehensively considers the changes of precipitation (pre) and potential evapotranspiration (pet) [19,20,21]. Studies have indicated that drought can impair the normal growth of vegetation to varying degrees [22,23,24]. Huang et al. [25] identified significant variations in the vulnerability of different grassland ecosystems to drought, as assessed using the SPEI (SPEI-12) on a 12-month timescale. Wu et al. [26] used SPEI-1 analysis to demonstrate that drought conditions in the majority of China (70.7%) were positively correlated with vegetation growth. Using SPEI-3 and satellite-based solar-induced chlorophyll fluorescence (SIF) data from the Yellow River Basin (2000–2018), Geng et al. [27] demonstrated a significant positive correlation between drought conditions and vegetation growth (37.06%). However, many of the preceding studies emphasize a single timescale or specific drought types, which results in a skewed understanding of vegetation’s sensitivity and tolerance to drought over varying timescales. Although vegetation shows a significant response to drought, it warrants emphasis that this relationship is not entirely symmetrical. Vegetation activity in any specific month might also be affected by climatic conditions from previous months [28]. In view of the impact of multi-time scale drought delay and the cumulative effect on vegetation, a number of researchers have carried out comprehensive studies. Based on the study of SPEI base v2.7 and NIRv-GPP at a global scale, Lu et al. [29] found that over 76.84% of grasslands in Central Asia were more affected by the delayed impact of drought than by the cumulative influence. Liu et al. [30] showed that the average lag of drought on grassland in Central Asia was 5.36 months, and the lag effect of vegetation in the arid region was stronger than that in the humid region. Wei et al. [31] analyzed the relationship between GPP products obtained from OCO-2 and SPEI, and found that 88.37% of grassland in the world had a lag effect on drought, which was mainly concentrated on a monthly timespan.
Amid the current climate warming, the changing trend of regional drought and vegetation growth becomes more complex. Therefore, accurate monitoring of regional aridity and quantitative analysis of its impact on vegetation growth becomes particularly critical.
However, regional studies, particularly in fragile ecosystems like the Upper Yellow River, remain scarce. The upper reaches are the primary water-producing zone of the Yellow River basin, situated in dry and semi-dry zones [32]. Frequent regional disasters and the disparity between natural resource supply and demand lead to an exceptionally fragile ecological environment [33], and environmental problems caused by changes in vegetation habitat conditions have a profound effect on the ecology of the central and downstream areas of the Yellow River [34], which is one of the regions experiencing the most intense soil erosion in China [35,36], and has become a key area of vegetation restoration projects in China. NPP is a crucial quantitative parameter to measure the productive potential of regional vegetation in the natural environment [37,38,39], which has attracted much attention in the study of achieving carbon peak and carbon neutrality in China [40,41]. There is relatively little research on the time-delay and cumulative impacts of regional-scale drought on plant ecosystem growth. Therefore, this paper aims to explore the relationship between NPP of different vegetation types and multi-time scale SPEI, so as to further understand the response mechanism of vegetation in the upstream region to drought, and provide a theoretical foundation for forecasting the association between terrestrial ecosystems and climatic shifts moving forward.

2. Data and Methodology

2.1. Study Area Overview

The Yellow River Basin spans a large region, complex surface structure and significant climate differences [42]. According to environmental elements like basin landforms, geomorphology and hydrology, the area from the source of the Yellow River to Hekou Township, Inner Mongolia, is defined as the upstream region [43] (95°54′33″~112°53′33″ E, 32°05′00″~41°51′50″ N) (Figure 1b). The temperature steadily rises from west to east, with the average annual temperature ranging from 1 °C to 8 °C. “Precipitation concentration and uneven distribution, dry winter and spring, rainy summer and autumn” are the primary features of precipitation in the upstream region. Annual precipitation varies from 200 to 500 mm, with approximately 70% of the total precipitation occurring between June and September [44]. The study area primarily consists of alpine meadow, scrub and alpine steppe [45], and these vegetation systems show diversity at different altitudes and geographical locations, especially in desert and alpine areas, where vegetation types and coverage are significantly different. The land cover categories are predominantly grasslands, forests and agricultural land, with grass as the main type the land covering the widest area (Figure 1c). The development of the upstream region is faced with potential ecological security risks, and the ecological environment problem has become an important topic of ecological environment research in China and even Asia.

2.2. Data Sources and Preparation Steps

2.2.1. Station Meteorological Data

The daily observations from 37 weather monitoring sites in the upstream region is retrieved from the website (https://data.cma.cn/; accessed on 5 June 2024), and encompass the peak temperature, mean temperature (°C), lowest temperature, air moisture (%), precipitation volume (mm), wind force and direction (m/s) and sunlight duration (h). The data cover a time series from 1959 to 2020. At Linhe station, 20 months of precipitation data were missing between 1960 and 1982. Missing test data and outliers were imputed using the mean replacement method, with the average of the data for the same month in each year at the site calculated to replace the missing data. In this research, the Penman–Monteith equation was applied to estimate the pet (mm) [46], and Vicente-Serrano et al. [47] were referred to. The log-logistic three-parameter probability distribution model was applied to fit the monthly difference series of pre and pet, and then SPEI was generated through normal transformation. The data of 2021–2022 were retrieved from the SPEI basev2.9 database, through the Google Earth Engine (GEE, https://earthengine.google.com; accessed on 5 June 2024). In order to facilitate the subsequent analysis, the inverse distance weighting (IDW) [48] method was adopted to process the SPEI interpolation of each meteorological station and convert it into grid-based data, spatially resolved at 1 km, matching the NPP time series. The dry and wet grades of the drought index are presented in Table 1.

2.2.2. NDVI Data

MODIS NDVI data come from MOD13A2 (https://lpdaac.usgs.gov/products/mod13a2v061/, accessed on 5 June 2024) remote sensing products and are processed using the GEE remote sensing cloud computing platform (including cloud removal and cloud shadow removal), covering a time range from 2000 to the present, which is publicly accessible through the GEE platform.

2.2.3. Vegetation Type Data

The MCD12Q1 product is MODIS satellite remote sensing land cover types, spatial resolution of 500 m by 500 m, provided by NASA (https://ladsweb.modaps.eosdis.nasa.gov/, accessed on 13 June 2024), on a global scale, has a higher recognition accuracy and is widely used in the study on ecological environment monitoring and evolution [49,50]. There are 8 different land cover classification schemes. This study adopts the land classification scheme of the International Geosphere–Biosphere Programme (IGBP) and takes the vegetation system as the research object.

2.2.4. Solar Radiation, Temperature and Precipitation Data

TerraClimate is a worldwide monthly terrestrial climate and hydrological balance grid dataset developed by the University of Idaho [51], covering the period 1958–2022. In this paper, the solar radiation, temperature and rainfall data from TerraClimate are applied in the GEE platform, where the TerraClimate data are publicly accessible.

2.2.5. Annual NPP Data

The annual NPP was selected from the 2001–2022 MOD17A3 HGF dataset and from NASA. Numerous studies have shown that this dataset can effectively reflect regional NPP, and the verification results have reliable accuracy [52,53,54].In order to verify the monthly and annual NPP estimated by the CASA model, this paper carried out batch band extraction, format and projection conversion and resampling to a resolution of 1 km.

2.3. Research Approach

2.3.1. NPP Calculation

Utilizing the GEE cloud computing platform, this study applied the CASA approach [55] to assess the monthly NPP in the upstream region during 2001–2022. Based on the normalized vegetation index (NDVI) data obtained through remote sensing, the model inferred the effective photosynthetic radiation (APAR) by computing the proportion of absorbed photosynthetically active radiation, and calculated the efficiency of light energy use (“ε”) by incorporating the thermal and hydric stress coefficients to determine the NPP. The specific calculation method is given below:
N P P ( x , t ) = A P A R ( x , t ) × ε ( x , t )
A P A R ( x , t ) = 0.5 S O L ( x , t ) × F P A R ( x , t )
ε ( x , t ) = T ε l ( x , t ) × T ε h ( x , t ) × W ε ( x , t ) × ε m a x
In the equation above, N P P ( x , t ) denotes the NPP of the grid cell x in the t month, A P A R ( x , t ) and ε ( x , t ) represent photosynthetically active radiation (MJ/m2) captured by the grid cell x in the t month, as well as the efficiency of light energy absorption (g C/MJ), respectively. S O L ( x , t ) represents the total solar radiation flux (MJ/m2) of the t month grid cell x . F P A R x , t quantifies the fraction of incident radiation absorbed by the plant canopy, and 0.5 indicates the ratio of radiation available for photosynthesis to total solar radiation. T ε l   and T ε h refer to the effects of temperature extremes on the efficiency of light energy absorption, while W ε ( x , t ) accounts for the impact of water deficiency, ε m a x represents the highest efficiency of light energy conversion, which fluctuates based on vegetation type. The values are shown in Table 2. Spring NPP is defined as the sum of the values from March to May, summer NPP from June to August, autumn NPP from September to November and winter NPP from December to February. To further investigate the impact of drought on plant life, NPP time series data of the seasonal growth period (April to October) were selected as the research object, aiming to effectively reveal the dynamic response of vegetation to drought stress.

2.3.2. Sen’s Trend Estimation and the Mann–Kendall Statistical Test

Theil–Sen and M-K [56] test methods are often used to detect the trend and significance of temporal data, and have been applied in many disciplines, like climatology, environmental science and agricultural research. To investigate the changing pattern of NPP and SPEI, Sen’s slope analysis was combined and M-K test to reduce the influence of outliers. Sen’s trend is computed as follows:
    β = m e d i a n ( x j x i j i ) , j > i
where β is the temporal trend; x i and x j are time series data, respectively; and i and j are year i and year j of the sequence, respectively.
The significance test method of M-K test is as follows:
S = i = 1 n   j = i + 1 n   s g n ( x i x j )
s g n ( x i x j ) + 1 , x i x j > 0 0 , x i x j = 0 1 , x i x j < 0
Trend test according to the statistic Z:
Z = S V a r ( S ) ( S > 0 ) 0 ( S = 0 ) S + 1 V a r ( S ) ( S < 0 )
The equation for calculating Var is given below:
V a r ( S ) = n ( n 1 ) ( 2 n + 5 ) 18
The M-K test was applied to determine the significance of the aforementioned trend change, and finally, the time series change trend was divided into five types (Table 3).

2.3.3. Mutation Test Methodology

The M-K mutation test methodology was utilized to identify changes in NPP values estimated through the CASA approach, aiming to analyze the mutation time points and trends of NPP on an annual scale. By examining the statistical series morphology of UFk and UBk, we can clearly identify the trend of variable X and pinpoint the time and region of mutation. If UFk > 0, it signifies a positive direction in variable X, while UFk < 0 signals a decline. A significant trend change occurs when the values exceed the critical threshold of the 0.05 significance level. If the intersection of the UFk and UBk curves falls within the critical interval, the corresponding moment marks the onset of the mutation.

2.3.4. Delay Effect of Drought on NPP

The R value was utilized to evaluate the lag effect and time scale of drought on NPP [30]. SPEI-1 is calculated from a month’s worth of pre and pet data. For every lag period (0 ≤ i ≤ 12), the individual correlation values ( R 0 , R 1 , R 2 , … R 12 ) between NPP and SPEI (SPEI-1) at a monthly scale are computed (see Formula (9)), and R i of the maximum partial correlation coefficient is selected as the maximum lag correlation coefficient, and the corresponding lag months i as the lag time scale of the specific image element (Formula (10)). To avoid analytical errors or chance due to data sources, only monthly data from 2001 to 2020 were selected to assess the time-lag and accumulated impacts of drought-induced alterations in plant communities. For example, with a lag of 0 months, SPEI-1 and NPP from 2001 to 2020 were used for monthly partial correlation analysis. If there is a one-month lag, partial correlation analysis is carried out between the SPEI-1 records spanning December 2000 to November 2019 and the NPP for 2001 to 2020, and this process continues for each subsequent lag period up to 12 months.
            R i = corr N P P , S P E I i                                 0 i 12
      R m a x _ l a g   = m a x R i                                           0 i 12
where, R i is the Pearson correlation coefficient at an i -month delay, with i varying from 0 to 12 months, and R m a x _ l a g   denotes the highest value of R i .

2.3.5. Cumulative Effect of Drought on NPP

To assess the impacts of drought on the cumulative effect of plant growth, the Pearson correlation coefficient (R) between NPP and SPEI over time intervals ranging from 1 to 12 months was computed. Specifically, the Pearson correlation value between SPEI and NPP over a 20-year time scale of 1–12 months was employed as an indicator of the accumulated impact of drought on NPP (see Formula (11)), and R j having the largest correlation coefficient was selected as the peak cumulative correlation, and j with the cumulative months of the peak cumulative correlation was selected as the specific image element cumulative time scale (Formula (12)). For example, on a 2-month time scale, the association involving NPP and cumulative SPEI is highest, indicating that the image elements for this month and the drought conditions of the previous cumulative two months have the most significant effect on vegetation growth status.
          R j = corr N P P , S P E I j                                 1 j 12
          R m a x _ c u m   = m a x R j                                       1 j 12
where, R j is the Pearson correlation coefficient accumulated for j months, j is the SPEI accumulated for 1–12 months, and R m a x _ c u m   is the maximum value of R j .
SPEI-12 is a drought indicator derived from potential evapotranspiration and precipitation data over a 12-month time scale. In order to examine the cumulative and lagging effects of drought on NPP under various water balance conditions, the average of SPEI-12 in December (that is, the yearly SPEI) was selected as the annual water balance index. An increase in the SPEI value corresponds to an increase in water resource availability. The annual average SPEI is partitioned into uniform intervals (0.1) to reflect changes in various water resource levels.

2.4. Data Processing

Through the calculation of the R language package 1–12 months time scales SPEI (https://cran.r-project.org/web/packages/SPEI/, accessed on 2 May 2024),using ArcGIS 10.8 software for batch inverse distance weighted interpolation. Grounded in the light energy efficiency model in the GEE cloud computing platform, the monthly NPP was estimated. The ArcGIS10.8 software was used to eliminate invalid values from NPP time series data.

3. Results

3.1. NPP Precision Assessment

Because the NPP in the upstream region is easily affected by many factors, it is challenging to carry out relatively uniform field investigation and measurement over extensive areas, and achieving high-precision NPP estimation is also arduous [57]. For this reason, the correspondence to the NPP estimated by the CASA method model and MODIS remote sensing satellite series MOD17A3 product data were analyzed year by year. The results showed that the correlation value was R2 = 0.8644 (p < 0.01). The verification results show that NPP can reflect the actual situation to a large extent and has a high reliability (Figure 2).

3.2. Temporal and Spatial Variation Characteristics of NPP

3.2.1. Temporal Trends and Spatial Patterns of Annual NPP

As observed in Figure 3d, the spatial difference of mean NPP in the upstream region during 2001–2022 was spatially heterogeneous. Except for Hetao Basin and Ningxia Basin, NPP mainly showed a pattern of high in the southern area and low in the northern part, decreasing from southwest to northeast. The areas with mean NPP over 300 gCm−2a−1 are primarily located in the southwest of the region, distributed above Longyang Gorge and from Longyang Gorge to Lanzhou. The yearly average of NPP increased at a rate of 2.7538 g/(m2·a) (Figure 3a). To investigate the changing pattern of NPP in the upstream region before and after the abrupt change in 2011 (Figure 3b), four representative time nodes of land cover categories in 2005, 2010, 2015 and 2020 were selected for analysis. The findings indicate that the mean yearly NPP of all land cover categories in the basin, except forest land, shows an increasing trend during 2001–2022 (Figure 3c). Further analysis showed (Figure 3e) that NPP in 47.5% (p < 0.05) and 0.9% of the upstream regions exhibited a pronounced increase and decrease trend, respectively. On the whole, the annual NPP increased by 87.9% of the entire region, mainly in the southeast of the Hetao Plain, and also in the surrounding areas, such as the origin of the Yellow River. Only 6.4 percent of the total area demonstrated a declining pattern. Although NPP in most areas remains relatively low, over the past two decades, through the execution of a range of environmental conservation strategies [58,59], the vegetation status has been significant.

3.2.2. Temporal Trends and Spatial Patterns of Seasonal NPP

The seasonal NPP showed a linear increase trend with obvious seasonal differences (Figure 4). The following results were obtained by ranking by NPP value or NPP growth slope: summer (1.6284 g/(m2·a)) > autumn (0.5806 g/(m2·a)) > spring (0.5605 g/(m2·a)) > winter (0.0395 g/(m2·a)). The growth rate of NPP in summer is the fastest, with an annual average of 187.36 gCm−2a−1; the vegetation in the upstream region has the best growth conditions in this season. The smallest and largest values of NPP in spring were 18.04 gCm−2a−1 (2001) and 42.49 gCm−2a−1 (2019), and the lowest and highest values of NPP in autumn were 26.71 gCm−2a−1 (2002) and 49.04 gCm−2a−1 (2019), respectively, with little difference between spring and autumn NPP. The annual mean values are 28.82 gCm−2a−1 and 38.45 gCm−2a−1, respectively, with a difference of only 9.64 gCm−2a−1. Due to slow plant growth or dormancy during winter, photosynthetic activity decreases, and the variation in NPP characteristics becomes less pronounced, generally fluctuating around the mean values. On the grid scale, the spatial trend of upstream seasonal NPP is shown in Figure 5, and the statistics of trend area are shown in Table 4. During the previous 22 years, the NPP in the four seasons has shown a large area of improvement, with a significant increase in spring (47.96%), Primarily found in the origin of the Yellow River and the southwest of Ningxia Plain, and a non-significant increase in summer and autumn (48.35% and 42.20%, respectively). In winter, NPP in 53.51% regions showed no change trend, found in the origin of the Yellow River and the eastern zone of the Hetao Plain.

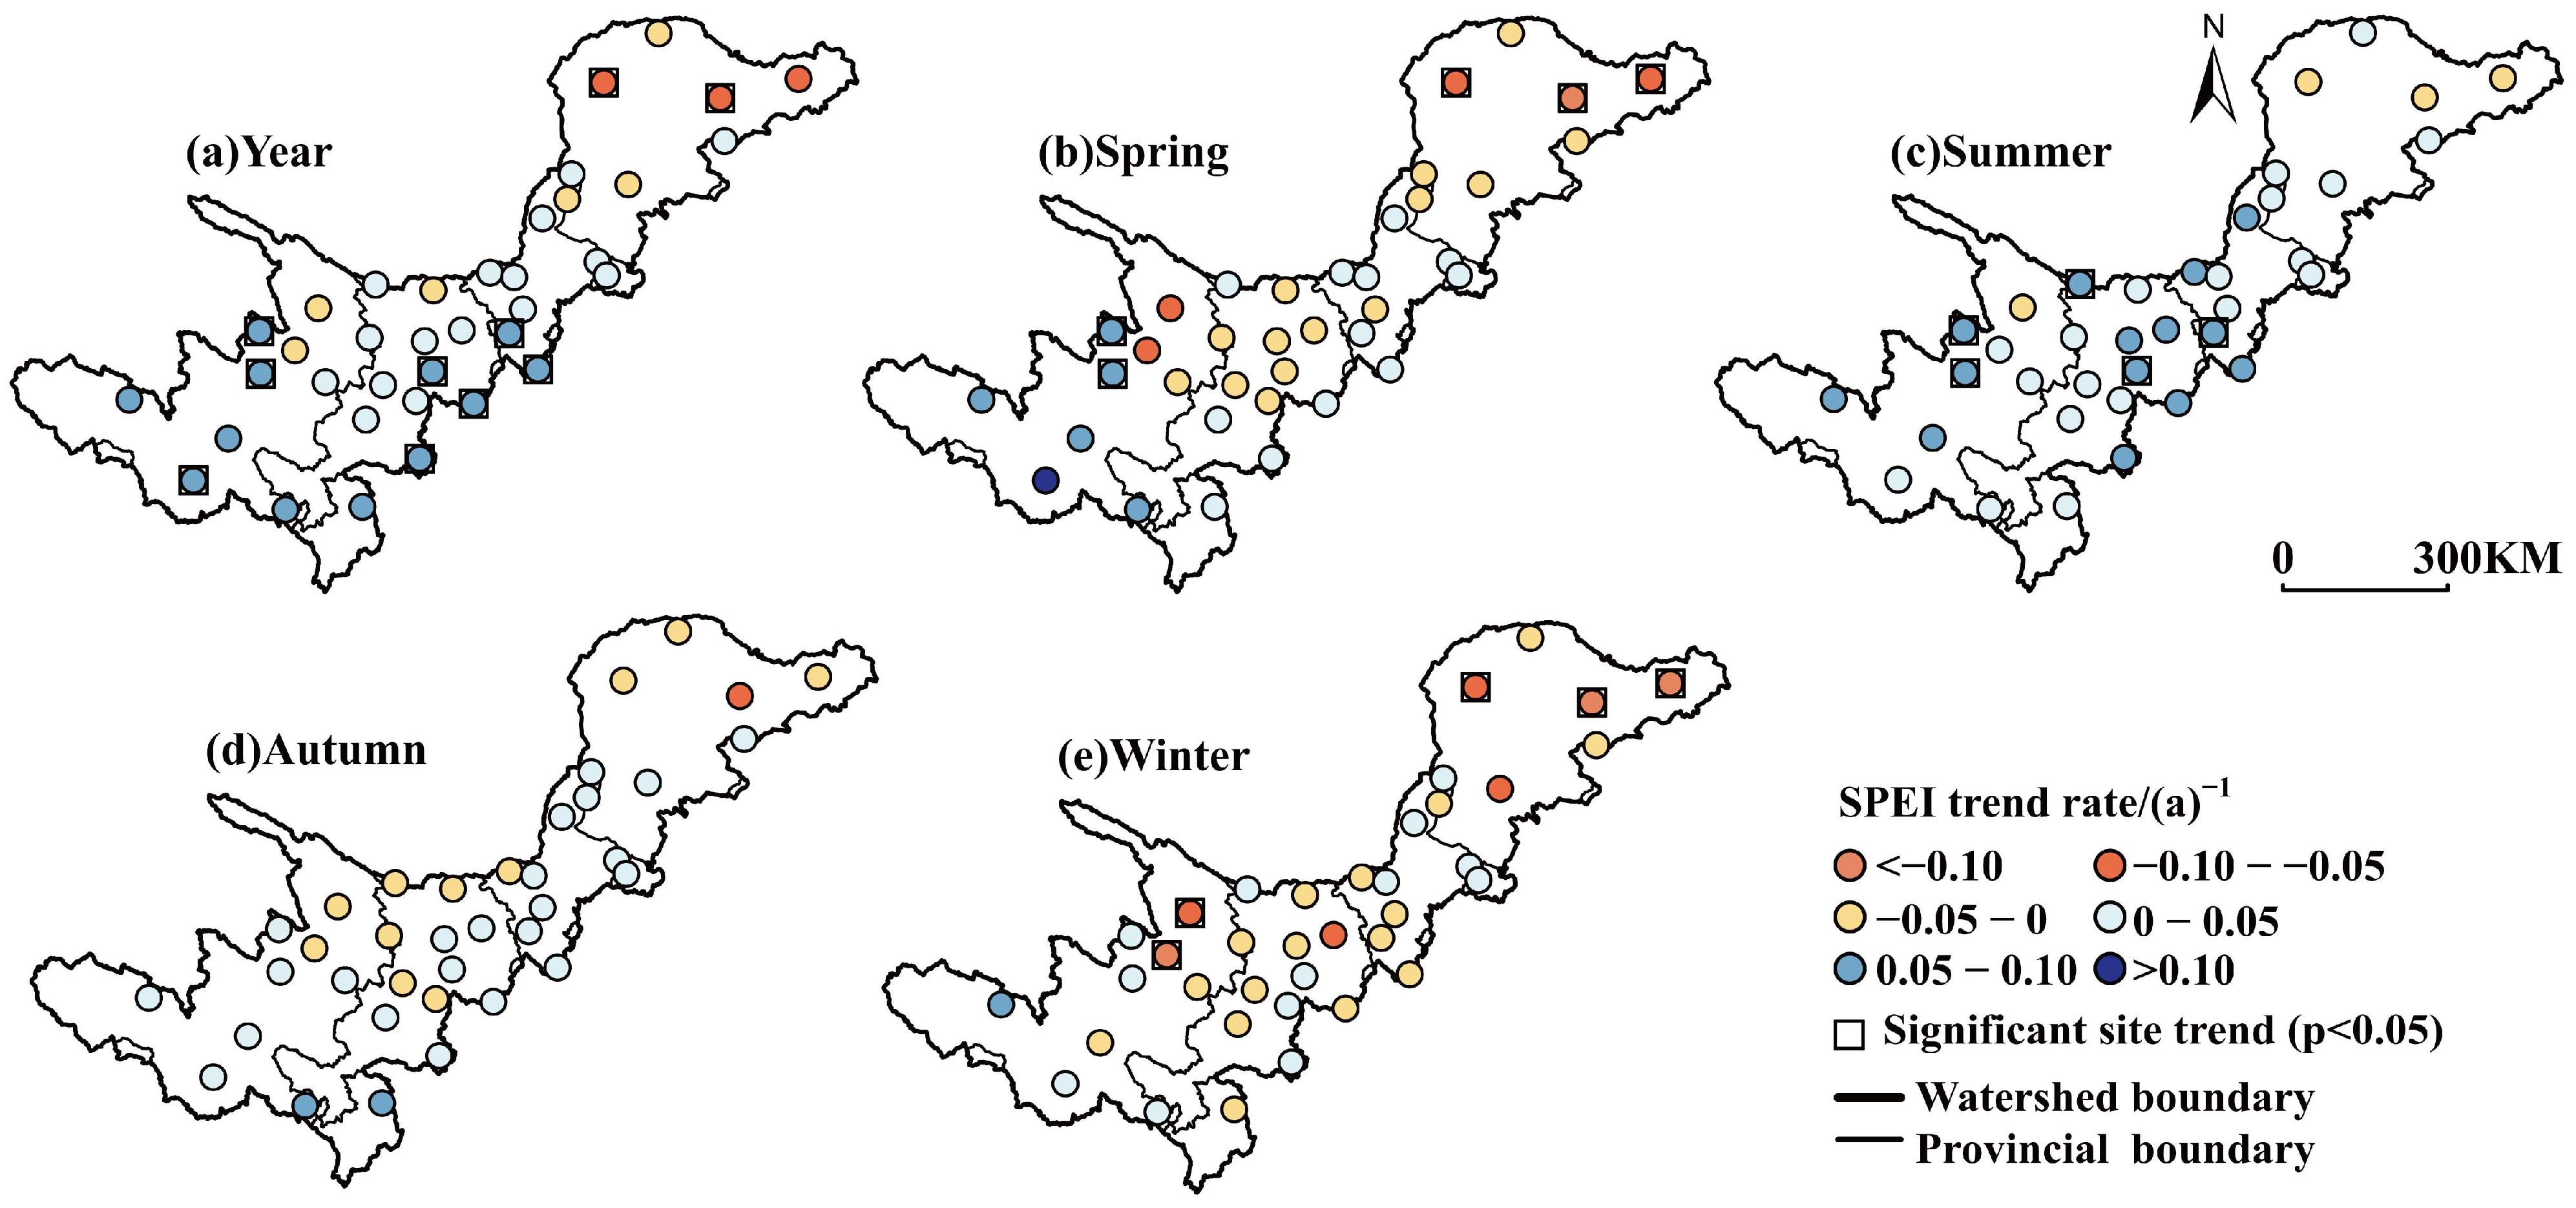
3.3. Temporal and Spatial Distribution of Drought Index

As shown in Figure 6, SPEI time series with different time scales have different change trends, which is because SPEI at varying time intervals has different sensitivity to precipitation and potential evapotranspiration. With the increase of time scale, SPEI’s reflection on short-term precipitation and potential evapotranspiration becomes less obvious. Only sustained alterations in precipitation and potential evapotranspiration can cause it to vary, which is justifiable for assessing long-term water conditions [60,61]. SPEI reflects the alternating conditions of dry and wet, and drought occurs when the SPEI is less than 0.5. According to SPEI-12, drought occurred in 2006–2007 and 2015–2016 in this region, while the average SPEI in 2019–2020 exceeded 0.7, and the average annual vegetation NPP also reached its peak throughout the research duration. Based on the categorization criteria of dry and wet in Table 1, the percentages of dry and wet events, such as moderate drought (wet), extreme drought (wet), normal drought and mild drought (wet) in SPEI1 to SPEI12 during the study period were statistically analyzed (Table 5). The results showed that the proportion of moisture and dry events decreased with the increase of wet and dry grades.
In order to study the changing pattern of seasonal and annual SPEI in the upstream region, the seasonal scales of May, August, November and February of the next year and the SPEI of December (SPEI-12) were chosen to illustrate the SPEI indexes of spring, summer, autumn, winter and year, respectively. By analyzing the interannual variation trend of each series during the study period (Figure 7), the regional annual (Figure 7a), spring (Figure 7b), autumn (Figure 7d) and winter (Figure 7e) SPEI index of 1959–2020 all showed a downward trend, that is, the trend of drought, while the SPEI of summer (Figure 7c) showed a trend of humidification and regional annual and seasonal scale changes; the trend is not significant, which is consistent with the conclusion of the study on dry and wet characteristics of the Yellow River Basin [62]. Further analysis shows that from 2001 to 2022, the regional summer, autumn and annual SPEI index demonstrate a rate of increase of 0.0332, 0.0034 and 0.0224, respectively, that is, the wetting trend. However, the climate tendency rates of spring and winter SPEI index were −0.0022 and −0.0113, respectively, showing an insignificant drying trend.
Seasonal and annual spatial distribution trends of meteorological stations in the upstream region during 2001−2022 are shown in Figure 8, showing certain spatial heterogeneity. From the inter-annual variation of seasonal scale, 51.35% of the stations (the proportion of the stations with a declining SPEI in the total number of stations) showed a drying trend in spring (Figure 8b), and only 13.51% of the stations passed the p < 0.05 significance level test, which were located in Gonghe, Guinan, Baotou, Hohhot and Linhe stations, among which the stations were mainly located in Hekou Town, Inner Mongolia Baotou, Hohhot and Linhe stations have a significant drying trend. In summer (Figure 8c), about 89.19% of the stations showed a trend of humidification. The stations that passed the significance test were Wushaoling, Gonghe, Guinan, Yuzhong and Haiyuan stations, and their humidification increases ranged from 0.05 to 0.1 (a)−1. In autumn (Figure 8d), 67.57% of the sites showed a wet trend, and no sites passed the significance test. In winter (Figure 8e), 62.16% of the sites showed a drought trend. On the annual scale (Figure 8a), 75.68% of the stations in the upstream area showed a trend of humidification, among which the stations in Gonghe, Guinan, Yuzhong, Huajialing, Baotou, Linhe, Haiyuan, Guyuan and Minxian passed the significance level test. Among the stations, Gonghe, Guinan, Yinchuan, Zhongning, Yanchi, Dingbian, Maduo, Dari, Jiuzhi and Minxian showed a trend of seasonal and annual humidification.
In conclusion, from 2001 to 2022, except for spring and winter, SPEI sites in the upstream region showed an upward trend, indicating that the basin has a wetting trend in annual, summer and autumn.

3.4. Delay Effect of Drought on NPP in Growing Season

3.4.1. Response of NPP to Drought at Different Lag Scales

As observed in Figure 9, under different lag time scales, the highest correlation coefficient (Rmax_lag) between NPP and lag SPEI shows obvious differences. In the whole lag scale, Rmax_lag is mainly concentrated in the range of 0 to 2 months, and its area percentage is 10.5%, 18.8% and 38.15%, respectively. In 1–2 months, the proportion reached 56.95%. In addition, the average lag positive correlation coefficient also shows a significant trend of change. To be specific, the lag of 2 months is associated with the strongest correlation value (r = 0.273, p < 0.05), followed by a month lag (r = 0.271, p < 0.05), and 0 months (r = 0.260, p < 0.05).

3.4.2. Spatial Distribution of Delay Effect of Drought on NPP

Building on the partial correlation assessment of NPP in growing season and SPEI (SPEI-1) on a one-month time scale, the highest lag correlation coefficient (Rmax_lag) of drought on NPP and the corresponding lag months was obtained. As shown in Figure 10, NPP and lagged SPEI across the majority of the upper Yellow River passed the significance level test of 0.05, accounting for 82.58%; there were significant positive correlation (70.71%), significant negative correlation (11.87%) and no correlation (17.42%). There is a weak negative correlation between Hetao Plain and Ningxia Plain, and the higher Rmax_lag is mainly distributed in the northeast of Hetao Plain, and also in the northeast and southwest corner of Ningxia Plain, indicating that NPP in such regions is more strongly impacted by previous meteorological droughts. During the growing season, about 63.06% of NPP showed a lag response of 0–2 months to drought, and the time lag of 1–2 months covered most areas, which were 17.67% and 36.07%, respectively. For the time lag of 3–5 months, 6–8 months and 9–12 months, the proportion is 14.33%, 2.33% and 20.28%, respectively. Table 6 shows the average lag time and dominant lag time of NPP and lag SPEI at the seasonal scale and growing season. According to seasonal scale statistics, the dominant lag time of spring, summer and autumn is 0 months, which means that NPP has a strong correlation with the drought index of 0 months, and the average lag time of spring and winter is larger than that of summer and autumn. The results of the analysis of the growing season show that the proportion of NPP and time-delay SPEI in the upstream has the highest delay of 2 months, followed by 1 month, and the average lag is 3.6 months.

3.4.3. Delay Effect of Drought on NPP Under Different Water Conditions

As observed in Figure 11, with the increase of the annual mean SPEI, the number of months delayed by drought to NPP shows an upward trend, indicating that when regional drought conditions worsen, the time-delay response of NPP to drought is usually concentrated on a shorter time scale. Furthermore, an inverse relationship exists between the mean yearly SPEI and the mean delayed positive correlation coefficient (R2 = 0.3763), which means that under different water balance gradients, the NPP in the relatively dry area (low SPEI) is more affected by the lag effect than that in the humid area (high SPEI).

3.5. Cumulative Effect of Drought on NPP in Growing Season

3.5.1. Response of NPP to Drought at Different Cumulative Scales

Figure 12 shows the area percentage allocation of the Rmax_cum between NPP and cumulative SPEI over different cumulative timescales. In general, Rmax_cum is mainly concentrated in the period of 3–5 months, and the maximum cumulative time scale of 3 months accounts for 53.7%. In addition, the average positive correlation coefficient shows a significant trend of change; At the 4-month cumulative scale, the positive correlation coefficient reached the uppermost value (r = 0.35, p < 0.05), followed by the 3-month cumulative scale (r = 0.31, p < 0.05) and the 12-month cumulative scale (r = 0.305, p < 0.05).

3.5.2. Spatial Distribution of the Cumulative Effect of Drought on NPP

Building on the SPEI partial association assessment of NPP in the growing season and different accumulation time scales, the highest cumulative correlation coefficient (Rmax_cum) and the associated cumulative months of NPP were obtained. As shown in Figure 13, the spatial pattern and cumulative months of Rmax_cum > 0 present certain spatial heterogeneity. The cumulative SPEI positively correlated with NPP accounted for 90.14% of the total area (that is, total pixels), among which the significantly positive correlated area (66.0%), passed the 0.05 significance level test. Negative correlated area (9.71%) and positive correlated area (24.14%). The accumulation of 3 to 5 months accounts for most of the areas (74.25%), and the accumulation of 3 months accounts for the largest proportion (42.41%), followed by the accumulation of 4 months (31.07%).

3.5.3. Cumulative Effect of Drought on NPP Under Different Water Conditions

As shown in Figure 14, the average annual SPEI is negatively correlated with the corresponding cumulative month. The cumulative months declined with increasing water balance gradients, suggesting that the cumulative response of NPP to drought is usually concentrated on longer timescales when regional drought conditions are aggravated. At the same time, with the increase of annual mean SPEI, the mean cumulative positive correlation coefficient was negatively correlated with SPEI (R2 = 0.4203), indicating that under different water balance gradients, the NPP in the arid region (low SPEI) was more seriously affected by the cumulative effect.

4. Discussion

In this research, the Penman–Monteith formula was applied to calculate multi-time scale SPEI to analyze the spatial-temporal variation of aridity and moisture. As a hydrologic model based on physical processes, the Penman formula not only considers temperature, but also incorporates multiple meteorological variables such as wind velocity, sunlight radiation and geographical location of the site to calculate potential evapotranspiration. By combining heat and aerodynamic components, the calculated potential evapotranspiration can more truly reflect the actual evapotranspiration of water. In addition, the assessment results of upstream NPP based on the CASA model show that its spatial distribution characteristics and change trend are largely in agreement with the NPP analysis results of MOD17A3 product data [63]. This consistency further validates the positive impact of the “Returning farmland to forest” project on vegetation restoration in the Yellow River Basin. Especially after the implementation of this project, such as in the Yellow River Source Ecological Protection Area, the vegetation coverage increased significantly [64]. This indicates that ecological protection measures have played a significant role in promoting the improvement of ecological productivity in this region [65].
Grassland is among the most significant vegetation types in the upstream region [66]. The study on the delayed and cumulative influence of drought conditions on vegetation activities across various time scales in the upper reaches found that drought exerts a delayed impact on most NPP (82.58%) in the growing season, among which the two-month time lag has the greatest impact on vegetation, indicating that the early soil water conditions largely determine the current growth status of plant communities [67,68]. In particular, the lag response of grassland to drought was obvious, and the lag months were mainly concentrated in a short time scale, indicating that the reaction speed of grassland NPP to drought was faster. Further analysis shows that NPP (66.14%) in most upstream areas has a cumulative effect on drought, and the cumulative effect tends to appear within a short cumulative scale of three to four months, which further indicates that NPP in grassland is more strongly responsive to short-term drought [31]. This result is somewhat different from the study of Zhan et al. [69], in which vegetation showed a stronger response to long-term drought. The latter adopted the normalized vegetation index (NDVI) data based on band reflection. NDVI is suitable for evaluating vegetation greenness and health status. However, it is unable to directly represent the real vegetation productivity [70,71]. In contrast, NPP based on remote sensing data and light energy rate model combined with estimation, is more sensitive to drought than NDVI and can directly reflect the reaction of the vegetation ecosystem to environmental and climatic conditions. Due to the differences in the root systems of woodland and grassland, their response characteristics to drought are significantly different. Compared with herbaceous vegetation characterized by shallow and dispersed root systems, woodland usually obtains water from deeper layers of soil, so grassland responds to drought faster than woodland. The region with a time lag of 9 to 12 months in the upper basin is mainly distributed with sparse forest and grassland, and is located at high altitude. The characteristics of the root system and possible low-temperature phenomenon at high altitude lead to different responses of vegetation to drought, which aligns with the outcomes of this research [31].
The partial correlation analysis of SPEI (SPEI-1) and NPP on a one-month time scale shows that drought conditions in most of the upstream region have a positive correlation (70.71%) with the delayed impact on vegetation development. However, some areas, such as Ningxia Plain and Hetao Plain, showed a weak inverse relationship, mainly because the inverse relationship period in these areas was jointly restricted by multiple elements, and anthropogenic actions reduced the sensitivity of NPP to drought response, resulting in relatively drastic fluctuations in vegetation status [72]. Regarding the Hetao Plain, its unique hydrological system and extensive irrigation infrastructure have played a crucial role in enhancing the drought resistance of vegetation, gradually weakening the response to drought. As for the cumulative effect, the vegetation in the central area of the upstream region, Ningxia basin, and the northeastern section of Hetao basin demonstrated a strong reaction to drought, indicating that the vegetation activity in the arid region was more restricted by previous droughts. Further analysis of the correlation between the time delay and the accumulated impact of drought on vegetation under different water conditions shows that with the intensification of drought, both the time delay and the cumulative effect increase the impact of drought on plant growth. By comparing the relationship between accumulated impact and delayed effect, it is observed that the effect of drought on plant growth accumulation is greater than that of the time-lag effect in the upstream region. The future regional drought studies should concentrate on the impact of drought accumulation on vegetation.
This research has some constraints in evaluating the impacts of drought conditions on plant growth. Multi-time scale SPEI based on upstream meteorological station data is used to analyze the association between drought and plant growth. However, due to the scarcity of sites and incomplete coverage, the interpolated SPEI may lead to bias in the study results, which will affect the evaluation of the delayed and accumulated impacts of drought conditions on plant growth in the basin. Although site-based data are still crucial for understanding local climate conditions in calculations, future research will consider the comprehensive use of meteorological stations, multi-origin satellite data and model forecast results to compute SPEI. Secondly, although the NPP data obtained from the CASA model are reliable, they are not sensitive to high spatial variability, particularly in complex ecosystems such as mountainous or high-altitude regions [73]. Moreover, the study employs correlation-based methods to analyze the response of vegetation ecosystems to drought; however, these methods may not fully capture the potential non-linear interactions between them. Future research could focus on establishing quantitative functional relationships between drought characteristic factors, such as intensity, duration and timing, and vegetation ecosystem changes in the upstream region, thereby facilitating a more comprehensive understanding of the interactions between vegetation and drought.

5. Conclusions

In this research, the monthly NPP measurements calculated through the CASA approach were used to investigate the temporal and spatial dynamics of NPP and the connection between vegetation dynamics and drought under drought stress based on the methods of univariate linear trend, MK mutation test and time-delay and cumulative correlation analysis. The following findings are derived:
(1)
From 2001 to 2022, the mean annual NPP rose with an increase of 2.7538 g/(m2·a). Within the study region, NPP increased significantly (47.5%), while NPP decreased significantly (0.85%). The four-season NPP growth slope is summer > autumn > spring > winter. In the past 22 years, NPP in spring, summer and autumn has been significantly improved.
(2)
From 2001 to 2022, the interannual variation and regional distribution of seasonal and annual SPEI in the upstream region showed a trend of wetting in summer, autumn and annual scales, except spring and winter.
(3)
Drought has a lag effect on NPP in 82.58% of the upstream region during the growing season. Mainly concentrated in 0–2 months, the 1–2 months occupy most areas (36.07% and 17.67%). When drought intensifies in the region, the influence of drought conditions on NPP has only a short time lag.
(4)
NPP in 66.14% of the region exhibited a cumulative effect in response to drought, primarily occurring over short time scales, with March and April being the key periods. As drought conditions worsened, the influence of both lag and cumulative effects on NPP became more pronounced.

Author Contributions

Conceptualization, H.X. and Z.L.; methodology, Z.L.; software, H.W.; validation, H.X. and G.D.; formal analysis, H.W. and G.D.; investigation, G.D.; resources, H.W.; data curation, G.D. and H.X.; writing—original draft preparation, H.W.; writing—review and editing, G.D.; visualization, G.D.; supervision, Z.L.; project administration, H.X.; funding acquisition, H.X. All authors have read and agreed to the published version of the manuscript.

Funding

This research was funded by the National Social Science’s Major Project (grant number 23&ZD104).

Institutional Review Board Statement

Not applicable.

Informed Consent Statement

Not applicable.

Data Availability Statement

The daily observations from 37 weather monitoring sites are retrieved from the website (https://data.cma.cn/, accessed on 18 May 2024). MODIS NDVI data come from MOD13A2 (https://lpdaac.usgs.gov/products/mod13a2v061/, accessed on 5 June 2024) remote sensing products. MCD12Q1 product is MODIS satellite remote sensing land cover types, spatial resolution of 500 m by 500 m, provided by NASA (https://ladsweb.modaps.eosdis.nasa.gov/, accessed on 13 June 2024). Solar radiation, temperature and precipitation data from the TerraClimate dataset were applied to the GEE platform. The annual validation data of NPP were selected from the 2001–2022 MOD17A3 HGF dataset and from NASA.

Conflicts of Interest

The authors declare no conflicts of interest.

References

  1. Yang, X.; Liao, X.; Di, D.; Shi, W. A Review of Drought Disturbance on Socioeconomic Development. Water 2023, 15, 3912. [Google Scholar] [CrossRef]
  2. Mani, Z.A.; Khorram-Manesh, A.; Goniewicz, K. Global health emergencies of extreme drought events: Historical impacts and future preparedness. Atmosphere 2024, 15, 1137. [Google Scholar] [CrossRef]
  3. Dai, R.; Huang, J.; Chen, Z.; Zhou, J.; Havea, P.H. Impacts of anthropogenic climate change on meteorological drought in China. Front. Earth Sci. 2024, 12, 1369523. [Google Scholar] [CrossRef]
  4. Zhou, T. New physical science behind climate change: What does IPCC AR6 tell us? Innovation 2021, 2, 100173. [Google Scholar] [CrossRef]
  5. Wang, F.; Wang, Z.; Yang, H.; Zhao, Y.; Zhang, Z.; Li, Z.; Hussain, Z. Copula-based drought analysis using Standardized Precipitation Evapotranspiration Index: A case study in the Yellow river basin, China. Water 2019, 11, 1298. [Google Scholar] [CrossRef]
  6. Gajendiran, K.; Kandasamy, S.; Narayanan, M. Influences of wildfire on the forest ecosystem and climate change: A comprehensive study. Environ. Res. 2024, 240, 117537. [Google Scholar] [CrossRef]
  7. Crocetti, L.; Forkel, M.; Fischer, M.; Jurečka, F.; Grlj, A.V.S.; Salentinig, A.; Trnka, M.; Anderson, M.; Ng, W.; Kokalj, Ž.; et al. Earth Observation for agricultural drought monitoring in the Pannonian Basin (southeastern Europe): Current state and future directions. Reg. Environ. Change 2020, 20, 123. [Google Scholar] [CrossRef]
  8. Zhao, M.; Running, S.W. Drought-induced reduction in global terrestrial net primary production from 2000 through 2009. Science 2010, 329, 940–943. [Google Scholar] [CrossRef]
  9. Wang, J.; Zhou, Z.; Zhu, M.; Wan, J.; Wu, X.; Liu, R.; Zheng, J. Study on the Response of Net Primary Productivity to Vegetation Phenology and Its Influencing Factors in Karst Ecologically Fragile Regions. Atmosphere 2024, 15, 1464. [Google Scholar] [CrossRef]
  10. Lin, Z.; Liu, Y.; Wen, Z.; Chen, X.; Han, P.; Zheng, C.; Yao, H.; Wang, Z.; Shi, H. Spatial--temporal variation characteristics and driving factors of net primary production in the Yellow River Basin over multiple time scales. Remote Sens. 2023, 15, 5273. [Google Scholar] [CrossRef]
  11. Xue, H.; Chen, Y.; Dong, G.; Li, J. Quantitative analysis of spatiotemporal changes and driving forces of vegetation net primary productivity (NPP) in the Qimeng region of Inner Mongolia. Ecol. Indic. 2023, 154, 110610. [Google Scholar] [CrossRef]
  12. PIAO, S.; FANG, J.; GUO, Q. Application of CASA model to the estimation of Chinese terrestrial net primary productivity. Chin. J. Plant Ecol. 2001, 25, 603. [Google Scholar]
  13. Yang, A.; Zhang, H.; Yang, X.; Zhang, X. Quantitative analysis of the impact of climate change and human activities on vegetation NPP in the Qilian Mountain. Hum. Ecol. Risk Assess. Int. J. 2023, 29, 202–221. [Google Scholar] [CrossRef]
  14. Field, C.B.; Behrenfeld, M.J.; Randerson, J.T.; Falkowski, P. Primary production of the biosphere: Integrating terrestrial and oceanic components. Science 1998, 281, 237–240. [Google Scholar] [CrossRef]
  15. Ma, R.; Xia, C.; Liu, Y.; Wang, Y.; Zhang, J.; Shen, X.; Lu, X.; Jiang, M. Spatiotemporal change of net primary productivity and its response to climate change in temperate grasslands of China. Front. Plant Sci. 2022, 13, 899800. [Google Scholar] [CrossRef]
  16. Svoboda, M.; Hayes, M.; Wood, D. Standardized Precipitation Index: User Guide; United States National Drought Mitigation Center: Lincoln, Nebraska, 2012; pp. 3–15. [Google Scholar]
  17. Alley, W.M. The Palmer drought severity index: Limitations and assumptions. J. Clim. Appl. Meteorol. 1984, 23, 1100–1109. [Google Scholar] [CrossRef]
  18. Beguería, S.; Vicente-Serrano, S.M.; Reig, F.; Latorre, B. Standardized precipitation evapotranspiration index (SPEI) revisited: Parameter fitting, evapotranspiration models, tools, datasets and drought monitoring. Int. J. Climatol. 2014, 34, 3001–3023. [Google Scholar] [CrossRef]
  19. Liu, C.; Yang, C.; Yang, Q.; Wang, J. Spatiotemporal drought analysis by the standardized precipitation index (SPI) and standardized precipitation evapotranspiration index (SPEI) in Sichuan Province, China. Sci. Rep. 2021, 11, 1280. [Google Scholar] [CrossRef]
  20. Dikshit, A.; Pradhan, B.; Huete, A. An improved SPEI drought forecasting approach using the long short-term memory neural network. J. Environ. Manag. 2021, 283, 111979. [Google Scholar] [CrossRef]
  21. Politi, N.; Vlachogiannis, D.; Sfetsos, A.; Nastos, P.T.; Dalezios, N.R. High resolution future projections of drought characteristics in Greece based on SPI and SPEI indices. Atmosphere 2022, 13, 1468. [Google Scholar] [CrossRef]
  22. Xu, C.; McDowell, N.G.; Fisher, R.A.; Wei, L.; Sevanto, S.; Christoffersen, B.O.; Weng, E.; Middleton, R.S. Increasing impacts of extreme droughts on vegetation productivity under climate change. Nat. Clim. Change 2019, 9, 948–953. [Google Scholar] [CrossRef]
  23. Sun, M.; Li, X.; Xu, H.; Wang, K.; Anniwaer, N.; Hong, S. Drought thresholds that impact vegetation reveal the divergent responses of vegetation growth to drought across China. Glob. Change Biol. 2024, 30, e16998. [Google Scholar] [CrossRef]
  24. Vicente-Serrano, S.M.; Gouveia, C.; Camarero, J.J.; Beguería, S.; Trigo, R.; López-Moreno, J.I.; Azorín-Molina, C.; Pasho, E.; Lorenzo-Lacruz, J.; Revuelto, J.; et al. Response of vegetation to drought time-scales across global land biomes. Proc. Natl. Acad. Sci. USA 2013, 110, 52–57. [Google Scholar] [CrossRef]
  25. Huang, W.; Wang, W.; Cao, M.; Fu, G.; Xia, J.; Wang, Z.; Li, J. Local climate and biodiversity affect the stability of China’s grasslands in response to drought. Sci. Total Environ. 2021, 768, 145482. [Google Scholar] [CrossRef]
  26. Wu, X.; Zhang, R.; Bento, V.I.L.A.; Leng, S.; Qi, J.; Zeng, J.; Wang, Q. The effect of drought on vegetation gross primary productivity under different vegetation types across China from 2001 to 2020. Remote Sens. 2022, 14, 4658. [Google Scholar] [CrossRef]
  27. Geng, G.; Yang, R.; Liu, L. Downscaled solar-induced chlorophyll fluorescence has great potential for monitoring the response of vegetation to drought in the Yellow River Basin, China: Insights from an extreme event. Ecol. Indic. 2022, 138, 108801. [Google Scholar] [CrossRef]
  28. Kong, D.; Miao, C.; Wu, J.; Zheng, H.; Wu, S. Time lag of vegetation growth on the Loess Plateau in response to climate factors: Estimation, distribution, and influence. Sci. Total Environ. 2020, 744, 140726. [Google Scholar] [CrossRef]
  29. Lu, J.; Peng, J.; Li, G.; Guan, J.; Han, W.; Liu, L.; Wang, R.; Zheng, J. Assessment of time-lag and cumulative effects of drought on gross primary productivity of grassland in Central Asia from 1982 to 2018. Acta Ecol. Sin. 2023, 43, 9745–9757. [Google Scholar]
  30. Liu, L.; Guan, J.; Zheng, J.; Wang, Y.; Han, W.; Liu, Y. Cumulative effects of drought have an impact on net primary productivity stability in Central Asian grasslands. J. Environ. Manag. 2023, 344, 118734. [Google Scholar] [CrossRef]
  31. Wei, X.; He, W.; Zhou, Y.; Ju, W.; Xiao, J.; Li, X.; Liu, Y.; Xu, S.; Bi, W.; Zhang, X.; et al. Global assessment of lagged and cumulative effects of drought on grassland gross primary production. Ecol. Indic. 2022, 136, 108646. [Google Scholar] [CrossRef]
  32. Qin, Y.; Jin, X.; Du, K.; Jin, Y. Changes in river morphology and influencing factors in the upper Yellow River over the past 25 years. Geomorphology 2024, 465, 109397. [Google Scholar] [CrossRef]
  33. Jiang, W.; Yuan, L.; Wang, W.; Cao, R.; Zhang, Y.; Shen, W. Spatio-temporal analysis of vegetation variation in the Yellow River Basin. Ecol. Indic. 2015, 51, 117–126. [Google Scholar] [CrossRef]
  34. Jiang, S.; Wang, J.; Liu, H.; Zhu, Y.; He, G.; Li, W.; Huang, H. Coordinated Development of Water, Food, and Energy in Upper and Middle Reaches of the Yellow River. Strateg. Study Chin. Acad. Eng. 2023, 25, 180–190. [Google Scholar] [CrossRef]
  35. Cui, Y.; Li, H.; Zheng, L.; Wu, M. Study of ecological environmental quality changes in the upper Yellow River basin based on remote sensing ecological index. J. Desert Res. 2023, 43, 107. [Google Scholar]
  36. Liu, C.; Zhang, X.; Wang, T.; Chen, G.; Zhu, K.; Wang, Q.; Wang, J. Detection of vegetation coverage changes in the Yellow River Basin from 2003 to 2020. Ecol. Indic. 2022, 138, 108818. [Google Scholar] [CrossRef]
  37. Mngadi, M.; Odindi, J.; Mutanga, O.; Sibanda, M. Estimating aboveground net primary productivity of reforested trees in an urban landscape using biophysical variables and remotely sensed data. Sci. Total Environ. 2022, 802, 149958. [Google Scholar] [CrossRef]
  38. Liu, X.; Wang, P.; Song, H.; Zeng, X. Determinants of net primary productivity: Low-carbon development from the perspective of carbon sequestration. Technol. Forecast. Soc. Change 2021, 172, 121006. [Google Scholar] [CrossRef]
  39. Zhang, Y.; Pan, Y.; Li, M.; Wang, Z.; Wu, J.; Zhang, X.; Cao, Y. Impacts of human appropriation of net primary production on ecosystem regulating services in Tibet. Ecosyst. Serv. 2021, 47, 101231. [Google Scholar] [CrossRef]
  40. Yang, J.; Xie, B.; Zhang, D. Spatial-temporal heterogeneity of ecosystem services trade-off synergy in the Yellow River Basin. J. Desert Res. 2021, 41, 78. [Google Scholar]
  41. Wu, L.; Zhang, Y.; Luo, G.; Chen, D.; Yang, D.; Yang, Y.; Tian, F. Characteristics of vegetation carbon sink carrying capacity and restoration potential of China in recent 40 years. Front. For. Glob. Change 2023, 6, 1266688. [Google Scholar] [CrossRef]
  42. Omer, A.; Zhuguo, M.; Yuan, X.; Zheng, Z.; Saleem, F. A hydrological perspective on drought risk-assessment in the Yellow River Basin under future anthropogenic activities. J. Environ. Manag. 2021, 289, 112429. [Google Scholar] [CrossRef] [PubMed]
  43. Yang, J.; Xie, B.; Tao, W.; Zhang, D. Ecosystem services assessment, trade-off, and bundles in the Yellow River Basin, China. Diversity 2021, 13, 308. [Google Scholar] [CrossRef]
  44. Yong, X.U.; Chuansheng, W. Ecological protection and high-quality development in the Yellow River Basin: Framework, path, and countermeasure. Bull. Chin. Acad. Sci. 2020, 35, 875–883. [Google Scholar]
  45. Xie, H.; Tong, X.; Li, J.; Zhang, J.; Liu, P.; Yu, P. Changes of NDVI and EVI and their responses to climatic variables in the Yellow River Basin during the growing season of 2000–2018. Acta Ecol. Sin. 2022, 42, 4536–4549. [Google Scholar]
  46. Allen, R.G.; Pereira, L.S.; Raes, D.; Smith, M. Crop evapotranspiration-Guidelines for computing crop water requirements-FAO Irrigation and drainage paper 56. Fao Rome 1998, 300, D05109. [Google Scholar]
  47. Vicente-Serrano, S.M.; Beguería, S.; López-Moreno, J.I. A multiscalar drought index sensitive to global warming: The standardized precipitation evapotranspiration index. J. Clim. 2010, 23, 1696–1718. [Google Scholar] [CrossRef]
  48. Lu, G.Y.; Wong, D.W. An adaptive inverse-distance weighting spatial interpolation technique. Comput. Geosci. 2008, 34, 1044–1055. [Google Scholar] [CrossRef]
  49. Zhang, H.; Yin, Y.; An, H.; Lei, J.; Li, M.; Song, J.; Han, W. Surface urban heat island and its relationship with land cover change in five urban agglomerations in China based on GEE. Environ. Sci. Pollut. Res. 2022, 29, 82271–82285. [Google Scholar] [CrossRef]
  50. Di, Y.; Zhang, G.; You, N.; Yang, T.; Zhang, Q.; Liu, R.; Doughty, R.B.; Zhang, Y. Mapping croplands in the granary of the tibetan plateau using all available landsat imagery, a phenology-based approach, and google earth engine. Remote Sens. 2021, 13, 2289. [Google Scholar] [CrossRef]
  51. Abatzoglou, J.T.; Dobrowski, S.Z.; Parks, S.A.; Hegewisch, K.C. TerraClimate, a high-resolution global dataset of monthly climate and climatic water balance from 1958–2015. Sci. Data 2018, 5, 170191. [Google Scholar] [CrossRef]
  52. Wang, J.; He, H.; Dong, J.; Guo, B. Spatio-temporal distribution of vegetation net primary productivity in the yellow river basin in 2000-2019 and its natural driving factors. J. Desert Res. 2021, 41, 213. [Google Scholar]
  53. Mao, S.; Shangguan, Z. Evolution of spatiotemporal patterns in vegetation net primary productivity and the driving forces on the Loess Plateau. Front. Environ. Sci. 2023, 11, 1134917. [Google Scholar] [CrossRef]
  54. Shi, S.; Zhu, L.; Luo, Z.; Qiu, H. Quantitative analysis of the contributions of climatic and anthropogenic factors to the variation in net primary productivity, China. Remote Sens. 2023, 15, 789. [Google Scholar] [CrossRef]
  55. Zhu, W.; Pan, Y.; Zhang, J. Estimation of net primary productivity of Chinese terrestrial vegetation based on remote sensing. Chin. J. Plant Ecol. 2007, 31, 413. [Google Scholar]
  56. Mann, H.B. Nonparametric tests against trend. Econom. J. Econom. Soc. 1945, 13, 245–259. [Google Scholar] [CrossRef]
  57. Xiao, F.; Liu, Q.; Xu, Y. Estimation of terrestrial net primary productivity in the Yellow River Basin of China using light use efficiency model. Sustainability 2022, 14, 7399. [Google Scholar] [CrossRef]
  58. Liu, S.; Shao, Q.; Ning, J.; Niu, L.; Zhang, X.; Liu, G.; Huang, H. Remote-sensing-based assessment of the ecological restoration degree and restoration potential of ecosystems in the upper yellow river over the past 20 years. Remote Sens. 2022, 14, 3550. [Google Scholar] [CrossRef]
  59. Zhang, F.; Hu, X.; Zhang, J.; Li, C.; Zhang, Y.; Li, X. Change in Alpine Grassland NPP in response to climate variation and human activities in the Yellow River Source Zone from 2000 to 2020. Sustainability 2022, 14, 8790. [Google Scholar] [CrossRef]
  60. Ahmed, K.; Shahid, S.; Nawaz, N. Impacts of climate variability and change on seasonal drought characteristics of Pakistan. Atmos. Res. 2018, 214, 364–374. [Google Scholar] [CrossRef]
  61. Laimighofer, J.; Laaha, G. How standard are standardized drought indices? Uncertainty components for the SPI \& SPEI case. J. Hydrol. 2022, 613, 128385. [Google Scholar]
  62. Gao, B.L.; Gong, J.; Li, Y.; Jin, T. Analysis of multiscalar characteristics of dry and wet conditions in the Yellow River Basin based on SPEI. AridZone Research 2022, 39, 723–733. [Google Scholar]
  63. Li, X.; Yu, K.; Xu, G.; Li, P.; Li, Z.; Shi, P. Spatial Characteristics and Driving Factors of Net Primary Productivity of Vegetation in the Upper and Middle Yellow River Basin. Environ. Sci. 2024, 45, 6448–6457. [Google Scholar]
  64. Wu, X.; Yan, Z.; Yang, H.; Wang, S.; Zhang, H.; Shen, Y.; Song, S.; Liu, Y.; Guo, Y.; Yang, D.; et al. Ecological restoration in the Yellow River Basin enhances hydropower potential. Nat. Commun. 2025, 16, 2566. [Google Scholar] [CrossRef]
  65. Cao, Y.; Li, H.; Liu, Y.; Zhang, Y.; Jiang, Y.; Dai, W.; Shen, M.; Guo, X.; Qi, W.; Li, L.; et al. Regional contribution and attribution of the interannual variation of net primary production in the yellow River Basin, China. Remote Sens. 2023, 15, 5212. [Google Scholar] [CrossRef]
  66. Wang, W.; Sun, L.; Luo, Y. Changes in vegetation greenness in the upper and middle reaches of the Yellow River Basin over 2000–2015. Sustainability 2019, 11, 2176. [Google Scholar] [CrossRef]
  67. Huang, M.; Wang, X.; Keenan, T.F.; Piao, S. Drought timing influences the legacy of tree growth recovery. Glob. Change Biol. 2018, 24, 3546–3559. [Google Scholar] [CrossRef]
  68. He, W.; Ju, W.; Schwalm, C.R.; Sippel, S.; Wu, X.; He, Q.; Song, L.; Zhang, C.; Li, J.; Sitch, S.; et al. Large-scale droughts responsible for dramatic reductions of terrestrial net carbon uptake over North America in 2011 and 2012. J. Geophys. Res. Biogeosci. 2018, 123, 2053–2071. [Google Scholar] [CrossRef]
  69. Zhan, C.; Liang, C.; Zhao, L.; Jiang, S.; Niu, K.; Zhang, Y. Drought-related cumulative and time-lag effects on vegetation dynamics across the Yellow River Basin, China. Ecol. Indic. 2022, 143, 109409. [Google Scholar] [CrossRef]
  70. Huete, A.; Didan, K.; Miura, T.; Rodriguez, E.P.; Gao, X.; Ferreira, L.G. Overview of the radiometric and biophysical performance of the MODIS vegetation indices. Remote Sens. Environ. 2002, 83, 195–213. [Google Scholar] [CrossRef]
  71. Pettorelli, N.; Vik, J.O.; Mysterud, A.; Gaillard, J.; Tucker, C.J.; Stenseth, N.C. Using the satellite-derived NDVI to assess ecological responses to environmental change. Trends Ecol. Evol. 2005, 20, 503–510. [Google Scholar] [CrossRef]
  72. Li, J.; Yan, X.; Yan, X.; Guo, W.; Wang, K.; Qiao, J. Temporal and spatial variation study of vegetation coverage in the Yellow River Basin based on GEE cloud platform. J. China Coal Soc. 2021, 46, 1439–1450. [Google Scholar]
  73. Wu, C.; Chen, K.; E, C.; You, X.; He, D.; Hu, L.; Liu, B.; Wang, R.; Shi, Y.; Li, C.; et al. Improved CASA model based on satellite remote sensing data: Simulating net primary productivity of Qinghai Lake basin alpine grassland. Geosci. Model Dev. Discuss. 2022, 2022, 1–24. [Google Scholar] [CrossRef]
Figure 1. Summary map of upper Yellow River basin (The position of China (a), distribution of elevation (b), and distribution of land use types (c)).
Atmosphere 16 00602 g001
Figure 2. Evaluation of MOD17A3 and CASA approach estimation accuracy.
Atmosphere 16 00602 g002
Figure 3. Spatial distribution and change trend of multi-year mean NPP in the upstream region from 2001 to 2022. (a) Annual average NPP, (b) M−K test, (c) mean values of different land classes, (d) multi-year average value of NPP, (e) NPP trend.
Atmosphere 16 00602 g003
Figure 4. Interannual variation trend of seasonal NPP during 2001−2022.
Atmosphere 16 00602 g004
Figure 5. Spatial variation of seasonal NPP from 2001 to 2022.
Atmosphere 16 00602 g005
Figure 6. Change trend of SPEI1-SPEI12 in the upstream region from 2001 to 2022 (the top portion of the horizontal axis indicates humid states (blue), while the bottom portion represents arid states (red)).
Atmosphere 16 00602 g006
Figure 7. Annual and seasonal SPEI trends during 2001−2022 (the dashed line is the moving average, the blue line is the 1959−2020 trend, and the green line is the 2001−2022 trend). The gray shaded area represents the period from 2001 to 2022.
Atmosphere 16 00602 g007
Figure 8. Spatial distribution of seasonal and annual SPEI climate propensity rates during 2001−2022.
Atmosphere 16 00602 g008
Figure 9. The change trend of the partial association of the time delay effect.
Atmosphere 16 00602 g009
Figure 10. Spatial distribution of drought lag effect.
Atmosphere 16 00602 g010
Figure 11. Relationship of annual mean SPEI and time−lag effect.
Atmosphere 16 00602 g011
Figure 12. The change trend of the positive partial correlation of the cumulative effect.
Atmosphere 16 00602 g012
Figure 13. Spatial distribution of drought cumulative effect in the upstream region.
Atmosphere 16 00602 g013
Figure 14. Relationship of annual mean SPEI and cumulative effect.
Atmosphere 16 00602 g014
Table 1. Categorization of drought and wet conditions in accordance with SPEI.
GradeMoisture LevelSPEI Value
1Extreme drought (Ed)≤−2.0
2Moderate drought (Mod)(−2.0, −1.0]
3Mild drought (Mid)(−1.0, −0.5]
4Normal (N)(−0.5, 0.5]
5Mildly wet (Miw)(0.5, 1.0]
6Moderately wet (Mow)(1.0, 2.0]
7Extremely wet (Ew)>2.0
Table 2. The value of ε m a x for different land use types.
Land Use Types ε m a x /(gC·MJ−1)
Evergreen needleleaf forest0.389
Deciduous needleleaf forest0.485
Deciduous broadleaf forest0.692
Mixed forest0.629
Shrubland0.429
Grasslands0.542
Cultivated land0.542
Table 3. Trend segmentation.
β Z Trend Type
β > 01.96 < Z Significantly Increase
1.96 ≥ Z Insignificant Increase
β = 0-No Trend
β < 01.96 < Z Significantly Decrease
1.96 ≥ Z Insignificant Decrease
Table 4. Seasonal NPP trend area statistics in the upstream region.
TrendSpringSummerAutumnWinter
Significantly Decrease (SD)2.59%0.98%0.97%0.29%
Insignificant Decrease (ID)6.48%12.22%9.94%7.90%
No Trend (NT)6.95%5.67%7.08%53.51%
Insignificantly Increase (II)36.02%48.35%42.20%19.36%
Significantly Increase (SI)47.96%32.78%39.81%18.93%
Table 5. SPEI1-SPEI12 dry and wet event classification statistics.
%SPEI1SPEI2SPEI3SPEI4SPEI5SPEI6SPEI7SPEI8SPEI9SPEI10SPEI11SPEI12
Mod (Mow)6.8 (7.6)7.6 (5.7)4.5 (5.3) 4.9 (4.5) 2.7 (5.3)2.7 (5.7)1.5 (4.2) 1.1 (4.5) 0.8 (3.8)0.8 (4.9)0.0 (4.5)0.8 (4.5)
Ed (Ew)0.4 0.0 0.0 0.0 0.0 0.0 0.0 0.0 0.0 0.0 0.0 0.0
N54.9 59.5 54.9 57.6 61.4 63.3 65.9 66.7 66.3 66.3 66.3 64.0
Mid (Miw)17.0 (13.3)15.5 (11.7)21.6 (13.6)18.9 (14.0)19.7 (11.0)17.0 (11.4) 16.7 (11.7)15.5 (12.1)17.4 (11.7)15.9 (12.1)17.4 (11.7)17.8 (12.9)
Table 6. Average lag and dominant lag time of SPEI on NPP seasonal scale and growing season in the upstream region.
SeasonsHysteresis CharacteristicsLag Months
SpringAverage lag time/month6
Main lag time/month0, 8
SummerAverage lag time/month4
Main lag time/month0, 1
AutumnAverage lag time/month5
Main lag time/month0, 3
WinterAverage lag time/month6
Main lag time/month6, 8
Growing SeasonAverage lag time/month4
Main lag time/month2, 1
Note: The average quantity of lag months refers to the arithmetic mean of the quantity of lag months of all grids in the region, and the dominant quantity of lag months refers to the number of grids for which the quantity of lag months occupies a large proportion of the overall quantity of grids.
Disclaimer/Publisher’s Note: The statements, opinions and data contained in all publications are solely those of the individual author(s) and contributor(s) and not of MDPI and/or the editor(s). MDPI and/or the editor(s) disclaim responsibility for any injury to people or property resulting from any ideas, methods, instructions or products referred to in the content.

