Article

A Comparison of Different Solar Radiation Models in the Iberian Peninsula

by
Catalina Roca-Fernández
1,
Xavier Pons
1,2,* and
Miquel Ninyerola
3
1
Grumets Research Group, Departament de Geografia, Edifici B, Universitat Autònoma de Barcelona, 08193 Bellaterra, Catalonia, Spain
2
CREAF, Edifici C, Universitat Autònoma de Barcelona, 08193 Bellaterra, Catalonia, Spain
3
Departament de Biologia Animal, Biologia Vegetal i Ecologia, Edifici C, Universitat Autònoma de Barcelona, 08193 Bellaterra, Catalonia, Spain
*
Author to whom correspondence should be addressed.
Atmosphere 2025, 16(5), 590; https://doi.org/10.3390/atmos16050590
Submission received: 11 April 2025 / Revised: 10 May 2025 / Accepted: 11 May 2025 / Published: 14 May 2025

Abstract

:
Solar radiation is a first-order essential climate variable like temperature and precipitation. Its significant spatiotemporal variability, mainly due to atmospheric conditions, makes modelling particularly challenging, especially in regions with complex atmospheric dynamics and sparse meteorological stations. This study evaluates 6 solar radiation models (SARAH, PVGIS, Constant Atmospheric Conditions, Physical Solar Model, CAMS Worldwide, and InsolMets) using monthly measurements from 141 ground-based stations across the Iberian Peninsula from 2004–2020. Although all models consistently captured intra-annual variability, discrepancies in absolute values arise due to factors such as the differences in their functional designs and input parameters. InsolMets, which integrates cloud optical thickness, cloud fractional cover, the diffuse radiation component, and enhanced solar illumination geometry, was the most robust model, showing relevant improvements (61.5% in January, 59.7% in November, and 52.0% in December) compared to the worst-performing model (constant atmospheric conditions). Using as a threshold three times the root-mean-square error (RMSE) proposed by the Global Climate Observing System, InsolMets achieved the highest number of months (10) under this limit, also achieving the best overall result, with only 1 month showing non-significant correlations over the same time span. Nevertheless, SARAH and PVGIS matched InsolMets’ performance during March, November, and December. The results provide insights for selecting and improving solar radiation estimations, highlighting the need to incorporate remote sensing atmospheric data to minimize uncertainties. While all models that account for atmospheric effects enhance accuracy, InsolMets stands out as the most accurate model for estimating solar radiation across the Iberian Peninsula throughout the year, achieving the lowest RMSE and normalized RMSE values.

1. Introduction

Solar radiation is a first-order essential climate variable (ECV; [1,2]), the precise estimation of which is paramount for a wide range of scientific and technological applications. From climate modelling to the management of renewable energy resources, detailed knowledge of solar radiation is crucial in understanding environmental systems. Indeed, an organized ECV repository of Global Climate Observing System (GCOS) features (ECV and Climate Data Records (CDR); [2]) exists <https://climatemonitoring.info/ecvinventory/> (accessed on 10 May 2025), which contains atmospheric data, including downward shortwave irradiance at the earth’s surface (Surface Radiation Budget), as well as land and ocean records. These records are primarily provided by the Committee on Earth Observation Satellites (CEOS) and the Coordination Group for Meteorological Satellites (CGMS).
Solar radiation directly influences the earth’s energy balance, as the amount of solar radiation received during the day directly impacts the warming of the earth’s surface [3,4], the hydrological cycle, and ecosystem behavior [5,6], as well as in the generation of photovoltaic and thermal solar energy [7,8,9,10]. Additionally, its interaction with other meteorological factors makes it a determining element in climate forecast and decision making for the management of water and agricultural resources [11,12,13,14]. Therefore, solar radiation is a critical variable in land-use planning, especially in regions vulnerable to climate change [3,15].
This process involves analyzing the amount of solar energy reaching the earth’s surface, taking into account different environmental factors and their spatiotemporal variability. It depends essentially on the solar illumination geometry relative to the terrain forms, and, in particular, on the properties of the atmosphere, requiring the implementation of different treatments of its influence on solar radiation components (direct and diffuse solar radiation). The first factor is well-known and easier to integrate, as it is primarily influenced by predictable solar vector incidence angles and geometry [16,17,18]. The second factor, including cloud cover and atmospheric optical thickness, introduces greater uncertainty and variation between models due to the high spatiotemporal variability of the atmospheric dynamic conditions, which can change rapidly and are difficult to predict in solar radiation assessments [19].
An accurate evaluation of solar radiation is essential for assessing its potential as an energy source and for the effective design and implementation of solar energy systems across diverse regions and climatic conditions, including photovoltaic panels and thermal collectors (e.g., solar concentration systems, desalination and solar water treatments), thereby ensuring optimal utilization of this renewable energy resource [20].
The importance of solar radiation is accentuated in territories with complex climatic, ecological, and geographical conditions, such as the Iberian Peninsula, characterized by the interaction of atmospheric, climatic, and topographic factors that generate the highly variable spatiotemporal behavior of solar radiation. Indeed, the Iberian Peninsula is under the influence of various factors that significantly condition the availability and geographic distribution of this resource [21], highlighting the climatic variability between regions with Atlantic influence and those with Mediterranean influence [22]. In the north and northwest areas, the Atlantic influence generates a temperate and humid climate, characterized by high cloud cover that reduces the incident solar radiation. In contrast, the south and southeast areas are dominated by arid and semi-arid conditions, with clear skies that increase the availability of solar radiation. Especially in these areas, the duration and frequency of anticyclonic systems, nowadays exacerbated by climate change, generate conditions of atmospheric stability, which favor high solar insolation and the intensification of droughts by increasing temperatures and the evaporation of available water [23]. This climatic heterogeneity, combined with topographic variability, introduces additional complexities in the precise estimation of solar radiation. Moreover, variability in vegetation cover, from dense vegetation areas to arid and desert regions, with differentiated implications for water resource availability and thermal behavior, also influences the energy dynamics of the territory and the resilience of ecosystems, according to the climate [24].
The regional context further exacerbates the relevance of this analysis due to the spatiotemporal irregularity and scarcity of precipitation in extensive areas of the Iberian Peninsula [25,26,27,28]. This increasing aridity, combined with a significant reduction in the availability of water resources, rising temperatures, and the increased evaporation of available water [23], has changed the hydrological cycle in the region and limited the potential for hydroelectric production. As a result, solar energy has emerged as a key renewable alternative to meet energy demand and mitigate the adverse effects of climate change, particularly in vulnerable regions where these effects, such as rising temperatures and altered precipitation patterns, are more evident [15]. Furthermore, the transition to clean energy sources makes the efficient utilization of solar radiation crucial. In this context, the implementation of solar systems becomes a priority strategy to ensure energy security and reduce dependence on non-renewable sources [3], supporting other energy systems and helping to mitigate climate change. Indeed, the disruption of the hydrological cycle, particularly the availability and distribution of water, further complicates water management and ecosystem resilience, as both the carbon cycle and evapotranspiration are closely linked to forest growth and are significantly impacted by global warming [6,24,29,30,31].
Following [31], the increase in temperatures, as a result of global warming, intensifies the demand for water due to potential evapotranspiration (PET), which directly affects the water resources. This hydrological demand can exacerbate soil aridity, especially in regions where temperature and evapotranspiration are high, highlighting the crucial role of evapotranspiration in the variability of droughts; the higher hydrological demand reduces the soil moisture levels and impacts forest growth and the water resources available for vegetation. As temperatures rise, driven by increased solar radiation, evapotranspiration also increases, leading to greater hydrological losses, affecting the growth of forest ecosystems and their resilience to droughts. Solar radiation, a key factor in temperature rise, reaches the earth’s surface, which in turn accelerates evapotranspiration. Moreover, atmospheric conditions and climatic variability due to climate change further influence the efficiency of this cycle.
Solar radiation provides essential information for assessing the impact of radiation on vegetation activity during the growing season [32,33]. It aids in calculating the fraction of photosynthetically active radiation absorbed by vegetation (fPAR) in combination with the remote sensing index NDVI (Normalized Difference Vegetation Index), and in establishing energy absorption patterns across different land covers [13,34,35,36,37].
Optimizing the use of solar radiation and understanding the climate-related impacts on ecosystems is essential; it is crucial to have robust and accurate solar radiation estimation models and methods for these purposes, especially in the context of global change, carried out using a range of approaches and methodologies [38,39,40,41,42,43,44,45,46]. The main objective of this study is to conduct a comprehensive comparison of six solar radiation estimation models, each based on different methodologies, to assess their performance under the climatic and geographical conditions specific to the Iberian Peninsula: satellite remote sensing models (SARAH); semi-empirical models (PVGIS and Constant Atmospheric Conditions); physical radiative transfer models (Physical Solar Model); and hybrid physical-empirical models (CAMS Worldwide and InsolMets). The selection of the Iberian Peninsula as the study area is justified by its relevance as a regional case study situated within a geographically and climatically complex environment of significant scientific interest, as previously explained. Additionally, the unique characteristics of this region present a challenging scenario for the models. Despite its regional nature, it serves as a broad and comprehensive test bed.
A comparison of these models is essential for identifying the most suitable approach for solar radiation estimation [47,48,49,50,51], considering its key role in the earth’s energy balance and influence on projected global warming [3,4]. Solar radiation is a first-order ECV [1,2], whose accurate estimation is fundamental for a wide range of scientific and technological applications. From climate modelling to the management of renewable energy resources, detailed knowledge of solar radiation is crucial for understanding environmental systems and anticipating their evolution. In this context, access to validated and up-to-date data from reliable solar radiation models is essential. The quality and robustness of these models not only enhance analytical capacity but also support informed decision making in key sectors, such as the design of sustainable and adaptive energy systems [20], particularly in the face of increasing drought and water-scarcity scenarios [23,31]. Moreover, advances in the estimation of solar radiation are crucial for practical applications [7,8] such as planning and monitoring systems for energy efficiency and their integration into energy supply networks [3,10,15]. Therefore, the development and scientific validation of solar radiation models, supported by recent and robust references, not only ensures methodological rigor but also strengthens our ability to respond to current and future environmental, climatic, and energy-related challenges.

2. Methods

In this study, a comparison of the different models within the 2004–2020 period was conducted. These years were selected for their particular climatic conditions and to provide a broad and representative representation of the different atmospheric and climatic conditions in the Iberian Peninsula.
On the one hand, the years 2005, 2008, 2012, and 2017 were identified as representative periods of the most severe droughts recorded in the Iberian region. These intense drought episodes were characterized by especially low cloud cover, attributed to a combination of reduced surface humidity and the prevalence of anticyclonic patterns, which significantly limited cloud formation and precipitations, being indicative of different solar radiation situations [23,52,53,54].
On the other hand, the years 2010, 2013, 2018, and 2020 were considered as representative of the wettest years in the study area. These years were characterized by an increase in cloud cover, associated with meteorological conditions that favored cloud formation and the occurrence of more precipitation [52].
Additionally, the years 2007, 2016, and 2019 were classified as more climatically stable periods, as they did not present extreme events in the context of the regional climate [52].
The year 2006 was also included in the analysis due to its particular climatic characteristics. Although this year was exceptionally warm, it experienced relatively normal precipitation levels, making it a singular case deserving attention [52,55].
Finally, the year 2009 was considered as an atypical period within the time span. This year recorded the highest number of sunshine hours across the entire time series (2004–2020) and coincided with very warm temperatures [52]. However, despite these conditions, the precipitation remained at normal or even abundant levels in certain regions.
The remaining years of the time series (2004, 2011, 2014, and 2015) analyzed in this work follow similar trend patterns to the aforementioned blocks, according to the annual AEMET reports. The year 2011 stands out as a year of severe drought in the Iberian Peninsula, with significant impacts on water supply, affecting water storage in reservoirs and hydroelectric production [56]. Similarly, in 2015, water resource management measures were implemented as reservoirs failed to reach optimal levels for water supply, dropping to critical levels in several regions [57]. In summary, the considered time span, 2004–2020, provides a broad and representative view of the different atmospheric conditions in the Iberian Peninsula. A more detailed analysis of the selected years, including additional data and insights, is available in Appendix A for further reference and assessment.
To ensure an accurate assessment of each model’s performance, a monthly validation was conducted using in situ data from 141 ground-based meteorological stations between 2004–2020 from AEMET (Agencia Estatal de Meteorología, Spain) and SNIRH (Sistema Nacional de Informação de Recursos Hídricos, Portugal), as presented and analyzed by [58].
The AEMET station network adheres to the specifications set by the World Meteorological Organization (WMO), forming a National Radiometric Network (NRN). This network includes the main stations of the National Radiometric Centres (NRC) as well as radiation measuring instruments from other entities, as detailed by [59]. The units used, 10 kJ·m−2·day−1 (energy per unit area and per day), are consistent with those of the World Radiometric Reference (WRR), based on the scale established in 1980 [16]. For details of the filtering processes of the AEMET network, please refer to [58].
The measuring instrument used by SNIRH in its station network is a silicon photovoltaic cell (Si-01TCext) (e-mail communication, 12 October 2023), installed at 2 m above any surface (ground or roof). This instrument measures solar energy in the form of light and heat, recording values between 0 and 2000 W·m−2 with an accuracy of ±5 W·m−2 (power per unit area). In the work of [58], units were converted to 10 kJ·m−2·day−1 to ensure comparability. Its operating temperature range is between −20 °C and +70 °C. Data are captured in 15-minute intervals and transmitted in real time via the Global System for Mobile Communications (GSM). For details of the filtering processes of the SNIRH network, please refer to [58].
Since the AEMET series and most models provide data in units of energy per unit area, all values have been converted to kWh·m−2 (energy per unit area), corresponding either to a representative day or to the monthly average of daily values. This approach also accounts for the fact that most models express solar radiation in watts (W-power-) or watt-hours (Wh-energy-). The SNIRH series and each of the considered models were converted in the appropriate direction, where required (Table A2 shows how the computation was performed in each situation).
The set of estimators calculated in this study to compare solar radiation models includes: the mean bias error (MBE); root mean square error (RMSE); the normalized form of RMSE (NRMSE, deseasonalized); and the Pearson correlation coefficient (r).
Regarding the normalization of the RMSE (NRMSE), it is important to avoid monthly bias in comparisons of results. This bias is due to the intra-annual seasonal variability of the incident solar radiation. Deseasonalizing a dataset helps to remove regular and predictable fluctuations that repeat at specific time intervals, such as months or seasons, considering the total range of observed values used in the validation and avoiding the influence of high absolute values (the monthly NRMSE is calculated by dividing the RMSE by the average of the observed data in the same month). When a variable exhibits strong seasonal behavior, such as solar radiation, direct data comparison becomes challenging. This is because solar radiation naturally varies with factors such as the time of year (longer daylight hours and higher solar altitude in summer increase radiation), geographical location (regions closer to the equator receive more radiation than those near the poles), and atmospheric conditions (cloud cover, humidity, and pollution). These natural variations not only affect the values themselves but also influence the evaluation of model performance, particularly error metrics like RMSE, which tend to increase with the magnitude of the observed values.
To guarantee that the observed data in the validation results meet optimal temporal data completeness (TDC), different quality filter processes have been carried out on the AEMET–SNIRH time series. TDC is an important indicator of data quality as expressed by [58,60,61,62,63]. On the one hand, stations with less than 45% of the data for the observed month have been removed. On the other hand, another quality filter process based on the estimated errors at the meteorological stations has been implemented, removing the stations where the error exceeded two standard deviations from the RMSE.
Finally, as it seemed interesting to know the improvement of the best-performing model with regard to the worst-performing model for each month, the difference in their RMSE was calculated and expressed with respect to the worst-performing model.
To calculate the set of estimators, the CombiCap application within the free MiraMon (MM) GIS software, v. 10 [64,65] was used, which allows for a combination of the meteorological stations layer with the estimated solar radiation layers using a nearest-neighbour or a bilinear interpolation method. To simplify the paper, only the results based on bilinear interpolation are shown, as no relevant differences were observed between the two methods.
These procedures evaluate each model’s capacity to reproduce the spatiotemporal variations of solar radiation in the Iberian Peninsula. The monthly comparison allows for the detection of seasonal patterns, assessing each model’s response under changing climatic conditions and determining their suitability for energy planning and natural resource management in the region.

2.1. Solar Radiation Models

The main objective of this study was to conduct a comprehensive comparison of six solar radiation estimation models, each based on different methodologies, to assess their performance under the climatic and geographical conditions specific to the Iberian Peninsula. The computational methods used to calculate the models are explained below; the different models to be evaluated are detailed in the following subsections. Table A2 presents additional aspects concerning both the datasets used to validate and compare solar radiation in the Iberian Peninsula and the models under comparison.
Satellite remote sensing models: SARAH [66]. These models use satellite data to estimate solar radiation on the surface. These models may combine radiative, transfer-based approaches (e.g., SARAH, CLARA [67], NASA POWER [68]) with parameterizations and empirical adjustments, or use primarily empirical methods derived from satellite observations (e.g., HelioClim [69]). These models are characterized by providing extensive and continuous spatiotemporal coverage, which is particularly useful in regions with a low density of meteorological stations. However, their accuracy may be affected under conditions of persistent cloud cover or high aerosol concentration, factors that complicate the precise estimation of incident solar radiation. To improve the accuracy of these estimates, it is common to combine them with physical radiative transfer models.
Semi-empirical models: PVGIS [70,71,72] and Constant Atmospheric Conditions [16,17]. These models combine empirical formulations with physical aspects in the estimation of solar radiation. This approach helps to improve accuracy in environments with significant topographic and atmospheric variability by considering additional factors such as the solar incidence angle, cast-shadows, cloudiness, and the presence of aerosols. Another example of these models is the one developed by [73].
Physical radiative transfer models: Physical Solar Model [74,75]. These models provide detailed descriptions of solar radiation behavior through the atmosphere. They are highly accurate, as they consider the physical interactions between solar radiation and atmospheric components such as water vapor, dust particles, and atmospheric gases [76,77]. However, their implementation is computationally demanding and requires high data-processing capacity. Although these models inherently include atmospheric correction in their computing, they can benefit from additional adjustments to optimize their accuracy under specific atmospheric conditions [78].
Hybrid physical-empirical models: CAMS Worldwide [79,80,81] and InsolMets [64,82]. These models combine physical and empirical components to optimize solar radiation estimation. This combination allows for the use of physical model accuracy and different parameterizations in simulating solar radiation behavior in the atmosphere, while also benefiting from the computational simplicity of empirical models [83,84,85]. As a result, these hybrid models achieve a balance between accuracy and computational efficiency. Their versatility makes them a robust alternative for estimating solar radiation in regions with high climatic and topographic diversity.
There are also solar radiation models based on purely empirical techniques. These models were not analyzed, as the methods previously mentioned employ more specific and detailed techniques. Empirical methods rely on mathematical relationships derived from observations [86]. Their implementation is simple and requires fewer data, making them particularly useful in areas with sparse measurements. However, their accuracy can be compromised in regions with high atmospheric variability or unpredictable climatic patterns. The Ångström–Prescott method is one example of the solar radiation models based on empirical techniques [87]. This method uses the observational data of incident solar radiation, the theoretical exoatmospheric irradiance depending on the sun’s position, the real duration of sunlight, the observed hours of sunshine, the maximum theoretical day duration depending on latitude and date, and specific empirical coefficients based on the calibration of local measurements. In this context, ref. [88] concluded that specific local factors (topography and climate) can significantly influence the accuracy of solar radiation. Promising results have recently been shown by using the Ångström–Prescott equation to estimate the atmospheric transmittances both under clear and cloudy sky conditions over time, contributing to a better understanding of the interactions between solar radiation and the atmosphere [89].

2.2. SARAH Model

The satellite-based solar radiation model SARAH v. 3.0 (Surface Solar Radiation Data Set–Heliosat) <https://wui.cmsaf.eu/safira/action/viewDoiDetails?acronym=SARAH_V003> (accessed on 10 May 2025), distributed by EUMETSAT (European Organisation for the Exploitation of Meteorological Satellites), is based on data collected by the SEVIRI sensor used with the Meteosat satellites. Its series provides instantaneous data every 30-min, as well as daily averages and monthly averages since 1983, with a spatial resolution of 0.05° (~5 km) in units of W·m−2 (power per unit area). For this work, the per-year monthly average series of the surface incoming shortwave radiation (SIS) model has been used.
The primary algorithm used is based on the Heliosat method [90,91,92,93,94] to estimate the effective albedo of clouds from satellite reflectance observations, which allows for the calculation of solar irradiance attenuated by cloud presence. This albedo is combined with clear sky radiative transfer models to calculate the solar radiation at the surface. Additionally, an autocorrection technique is implemented to address the radiometric calibration of the satellite sensors, ensuring the homogeneity of the dataset over time [66].

2.3. PVGIS Model

The semi-empirical solar radiation model PVGIS v. 5.3 (Photovoltaic Geographical Information System) <https://re.jrc.ec.europa.eu/pvg_tools/es/> (accessed on 10 May 2025), provided by the European Commission (EC), uses satellite data from the SARAH model to calculate solar radiation in regions between ±65° longitude and ±65° latitude. For areas not covered by SARAH, solar radiation is calculated from ERA5 re-analysis data. Its series provides hourly, daily, and monthly accumulated radiation since 2005, with a spatial resolution of 0.05° (~5 km) for areas covered by SARAH, and 0.25° (~30 km) for areas covered by ERA5, in units of kWh·m−2 (energy per unit area). For this work, the daily average of each per-year month has been computed by dividing the accumulated monthly data of the series by the number of days in each month.
The importance of this model is that it integrates satellite images as databases within an online tool that allows users to estimate photovoltaic system performance at specific locations across the covered regions—Europe and Africa [72]. It offers data on diffuse solar radiation (DIF), global tilted irradiation (GTI) on tilted surfaces, and other data related to the optimization and technology of solar systems. To do this, it uses photovoltaic performance models and tilted plane irradiance models [95,96,97,98]. The core of the model is the Heliosat method, which converts satellite reflectance observations into estimates of incident solar radiation, considering the cloud cover influence and refining the estimate with atmospheric models. To improve accuracy, the results are adjusted with radiative transfer models incorporating atmospheric variables such as aerosol concentration, water vapor content, and clear sky conditions.

2.4. Constant Atmospheric Conditions Model

The semi-empirical solar radiation model constant atmospheric conditions (CAC) is calculated using the InsolDia application of MM [64,82], considering the parameters established in previous works [16,17]. It uses a digital elevation model (DEM) with a spatial resolution of 100 m, a constant cloud optical thickness (COT-τ0-) throughout the day and year, set to τ0 = 0.288 for clear days, and a DIF component contribution set at 20% of the direct solar radiation (DIR). Although the DIF component may vary depending on the atmospheric conditions of the date and location [99,100,101], this study has chosen to use the value established in the original reference of the model (20% [16]). This dependence is also present in different works [102,103,104,105,106,107].
Moreover, the solar vector incidence angles have been determined using a simplified approach, setting up a single central point within the whole study area and moving the sun in 30-minute intervals from sunrise to sunset.
This model provides the results in 10 kJ·m−2·day−1 (energy per unit area and per day) for each central day of the month in every year of interest, as the central day of the month is representative of the monthly daily average [18]. CAC data for the Iberian Peninsula computed for this study are freely available at <https://www.infoambiental.grumets.cat/RadSolarPI/CAC/RadSolar_CAC_ENG.htm> (accessed on 10 May 2025).

2.5. Physical Solar Model

The physical radiative transfer solar radiation model Physical Solar Model v. 3.1 (PSM) <https://nsrdb.nrel.gov> (accessed on 10 May 2025), is a model of the National Solar Radiation Database (NSRDB) in collaboration with the National Renewable Energy Laboratory (NREL), the University of Wisconsin, and the National Oceanic and Atmospheric Administration (NOAA) [108]. The series it provides are instantaneous (15–30–60-min intervals) since 2005, with a spatial resolution of 4 km, in units of W·m−2 (power per unit area). For this work, the average of each per-year month has been computed from daily data calculated using the hourly instantaneous data.
This model was developed from the retrieval of cloud physical properties to construct a cloud mask, using satellite remote sensing images, along with meteorological models and solar physical properties [109,110]. It also considers the integration of aerosols, water vapor, and reflected radiation from the surfaces [74,75].

2.6. CAMS Worldwide Model

The hybrid physical–empirical solar radiation model CAMS Worldwide v. 4.6 <https://www.soda-is.com/pub/files/cams/CAMS-MSG-HIMAWARI-v4.6rev2/> (accessed on 10 May 2025) models solar radiation data (SoDa). Since 2005, it has provided instantaneous series (15 min intervals) with a spatial resolution of 0.2° (~20 km), in units of Wh·m−2 (energy per unit area). For this work, the average of each per-year month has been computed from daily data calculated using the instantaneous data.
To estimate solar radiation reaching the earth’s surface, this model combines advanced atmospheric models with observational data obtained from satellite images [79,80]. The calculations are based on algorithms derived from the Heliosat and McClear methods, which allow for the modelling of solar irradiance under different atmospheric conditions. In this context, the Heliosat method is used to estimate the solar radiation considering the cloud cover influence, integrating satellite reflectance and cloud observations, along with additional atmospheric parameters (aerosols, water vapor, and ozone) to refine the estimates in variable conditions. On the other hand, the McClear method [84,111,112], based on radiative transfer models, is used to calculate solar radiation under clear sky conditions.

2.7. InsolMets Model

The hybrid physical–empirical solar radiation model InsolMets is a model developed by the GRUMETS research group. It does not currently provide computed data to download; however, the software used to obtain the desired data is available (InsolDia-MM [64,82]). It is also described in [82], and reproducible in other regions of the world due to the availability of extensive satellite data time series and detailed DEM, along with its implementation through free software, enabling the production of solar radiation maps based on geoinformation. The series can be computed on an instantaneous, hourly, daily, and monthly basis and with averages for the desired period, as well as for any selected daily time interval, with a spatial resolution that depends on the resolution of the data provided (100 m in this study). Results are provided in units of 10 kJ·m−2·day−1 (energy per unit area and per day) for each central day of the month in every year of interest. InsolMets data for the Iberian Peninsula computed for this study are freely available at <https://www.infoambiental.grumets.cat/RadSolarPI/InsolMets/RadSolar_InsolMets_ENG.htm> (accessed on 10 May 2025).
In this study, calculations were conducted on a horizontal surface considering global horizontal irradiation (GHI [58]), as most of the other models to be compared provide this variable or allow for the computation of this common variable; however, InsolMets also allows for the calculation of GTI and global relief irradiation (GRI). These variables offer different approaches to solar radiation geospatial mapping for various applications. GTI is especially useful in engineering due to its integration with renewable energies (energy planning and photovoltaic system design). GRI focuses on ecological studies and precision agriculture due to the incorporation of the terrain structure, the solar vector incidence angles (slopes, aspects, and cast-shadows) and solar radiation exposure (biodiversity, ecosystem growth, and crop management).
The InsolMets model provides greater accuracy in calculating the solar illumination geometry by using a tessellated DEM approach at 100 m spatial resolution (DEM-based [18]). The solar incidence angles have been set up at the center of each tile, moving the sun in 30-minute intervals from sunrise to sunset, ensuring that relative differences in solar radiation calculation accuracy between the central point of each tile and any other point remain ≤1.00%. Thus, the model incorporates the solar vector incidence angles at all times throughout the months and years, areas with topographic concealment, and variations in the solar exoatmospheric irradiance due to changes in the earth–sun distance (in this case the ISO 21348:2007 [113] solar constant of 1366 W·m−2 has been used). This makes it possible to calculate the DIR and DIF components as incident global solar radiation; however, it does not account for the reflected radiation from surrounding surfaces as its contribution is usually low [105]. It is essential to consider both cast-shadows and solar incidence angles when modelling DIR. Otherwise, the model may incorrectly assign DIR values where it should not, resulting in systematic overestimation, particularly in geometrically unfavorable or concealed locations where only DIF should be present. If the DIF component is not included in these cases, the resulting solar radiation will be zero. An exception applies when estimating DIR that would cross the atmosphere under clear sky conditions, before it reaches the surface, in which case the relief and shadows do not need to be considered, as this estimate is used to compute the DIF component. However, even in this case, the solar incidence angles must still be taken into account.
Following [82], a COT of τ0 = 0.223 in clear sky regions for the months of November–April, and a τ0 = 0.288 for the months of May–October, is considered in the InsolMets calculation. In this context, InsolMets integrates the atmospheric situation through COT and cloud fractional cover (CFC) from satellite remote sensing data (SEVIRI CLAAS 2.1 and 3.0: COT and CFC products used are available at the EUMETSAT website <https://navigator.eumetsat.int/product/EO:EUM:DAT:0279> and <https://navigator.eumetsat.int/product/EO:EUM:DAT:0820> (accessed on 10 May 2025)), calculating DIR under both cloudy and clear sky conditions, and applying a differentiated COT treatment in both scenarios. Furthermore, it considers the estimation of the DIF component contribution as the ratio of the DIR component crossing the atmosphere under clear sky conditions (τ0 = 0.288), using observed data at different meteorological stations for interpolation and validation results. This relationship is influenced by Rayleigh scattering, which attenuates the DIR component and contributes to the generation of the DIF component [99], since completely transparent atmospheric conditions are not physically possible [114]. These characteristics make InsolMets an especially valuable tool, as it allows for the accurate assessment of solar radiation in complex terrains with changing spatiotemporal atmospheric and climatic conditions, adjusting to the specific features of each terrain.

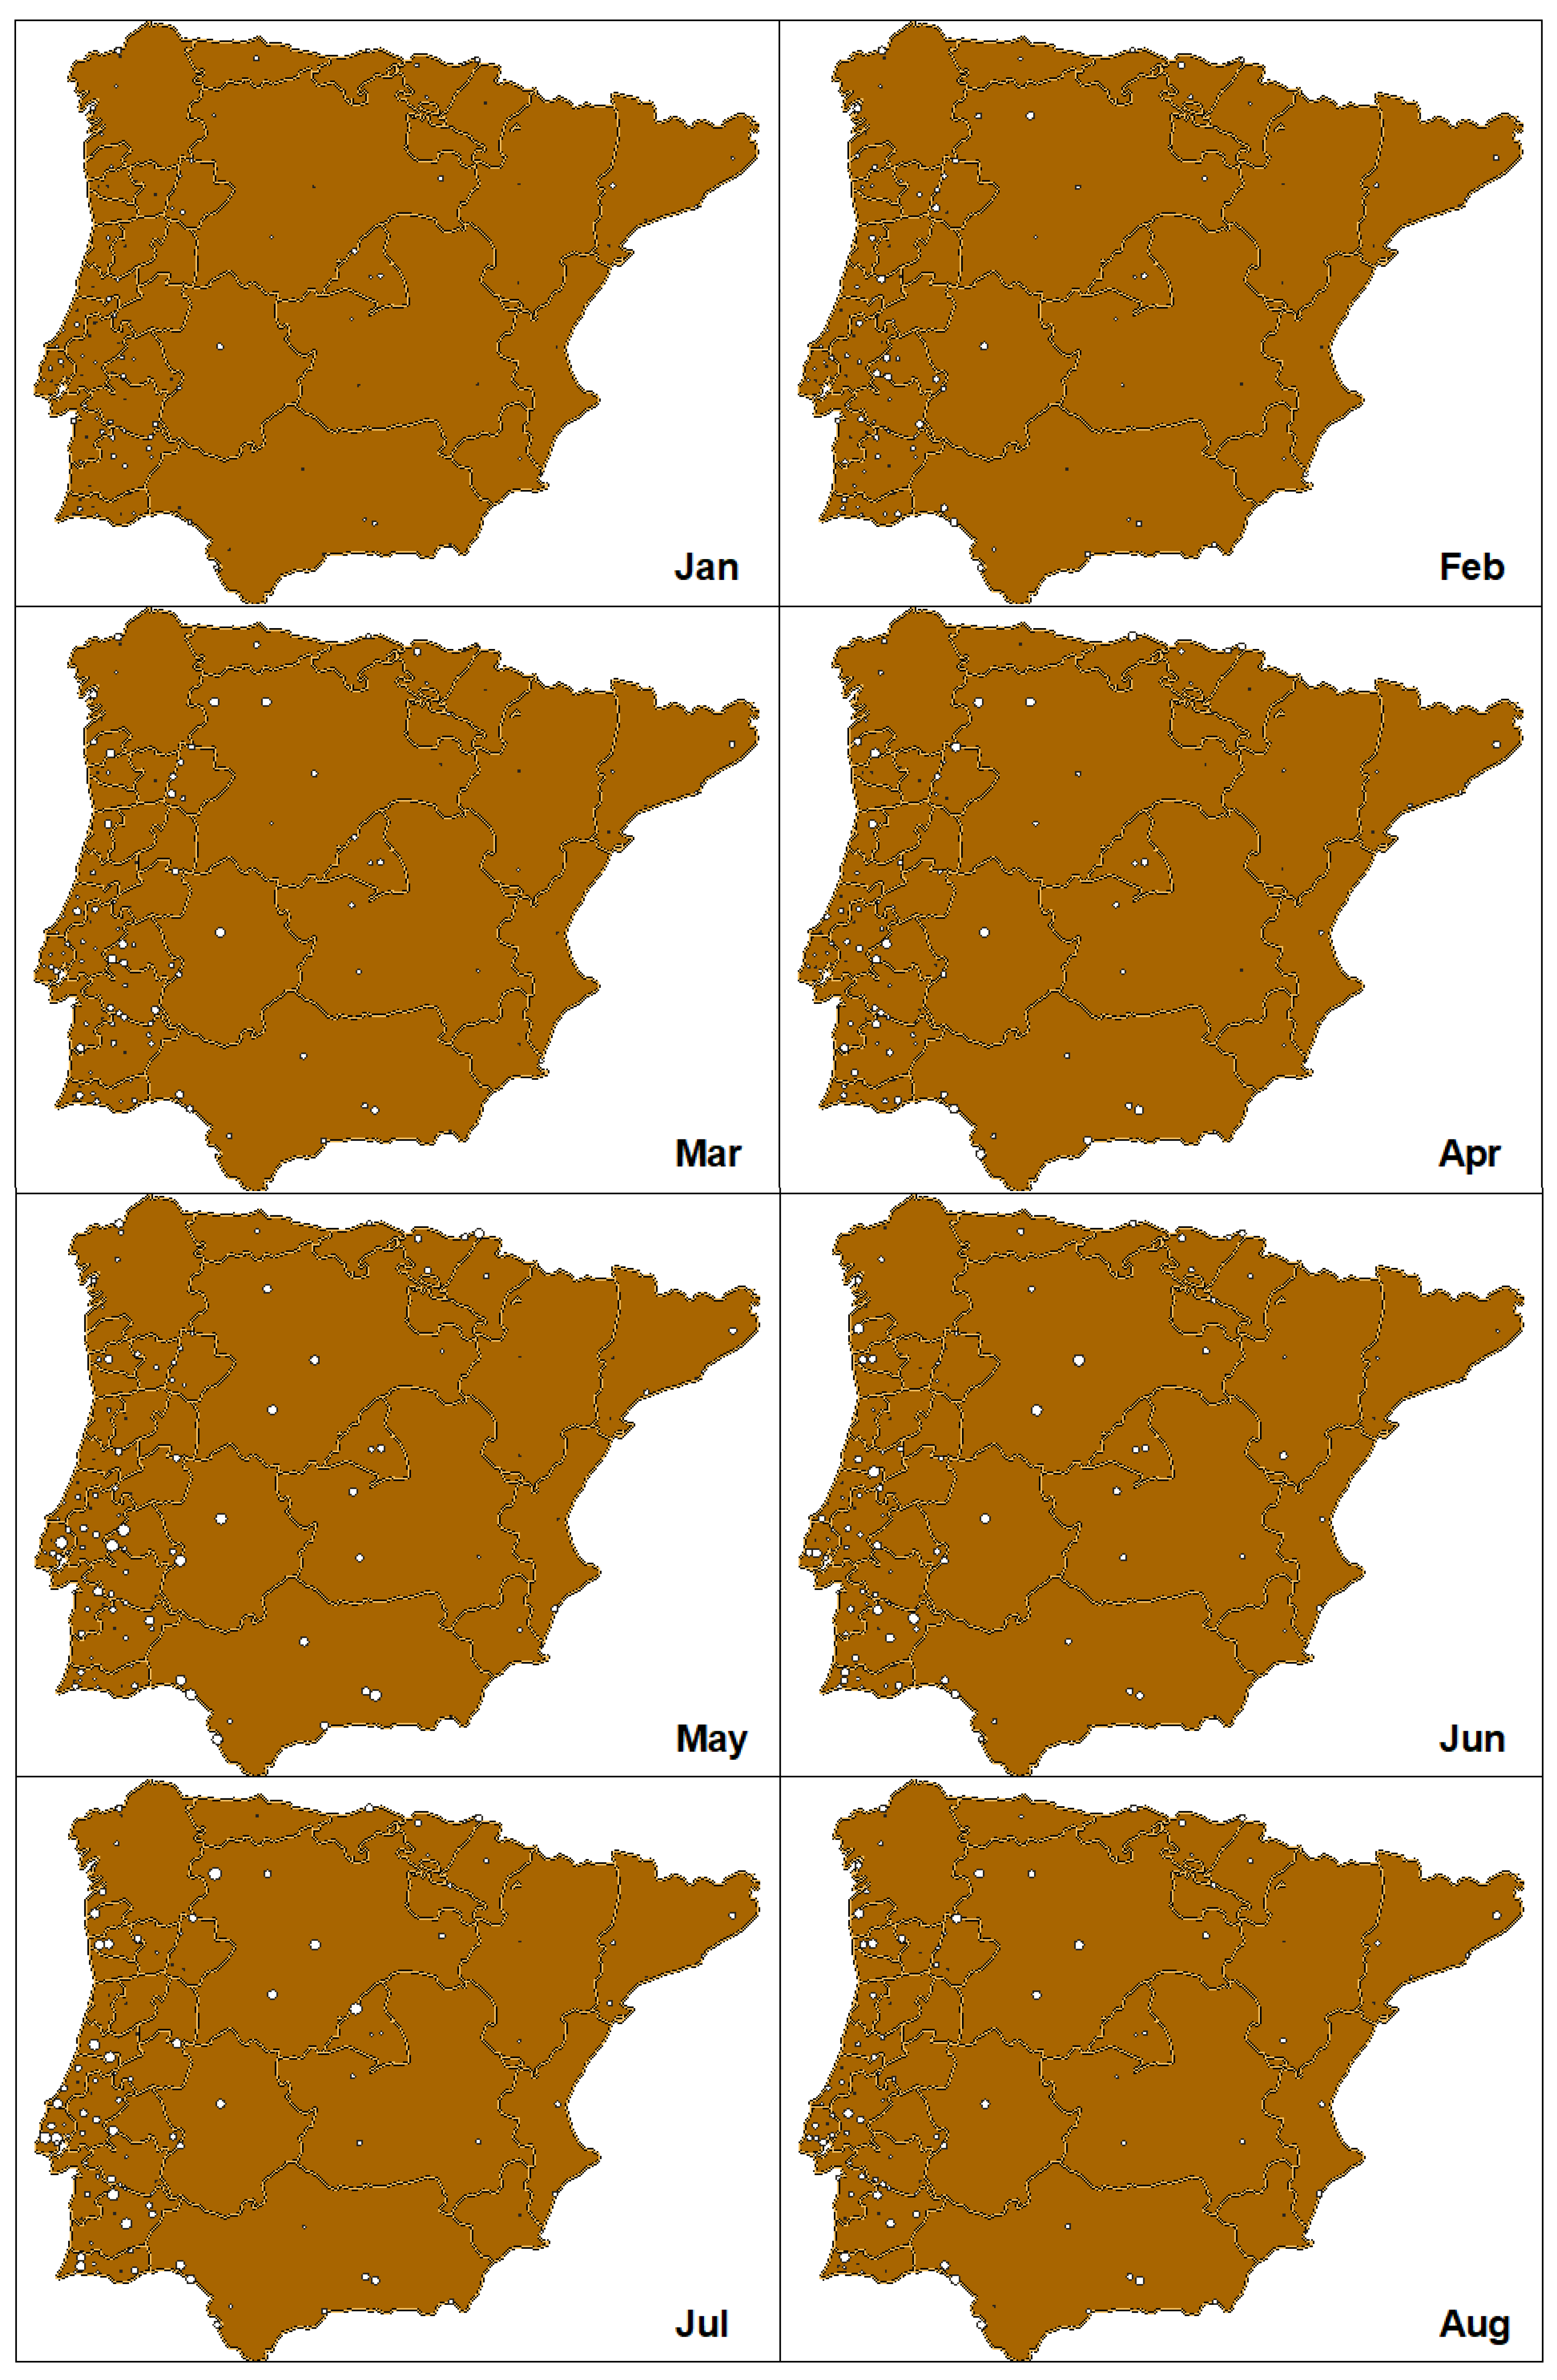
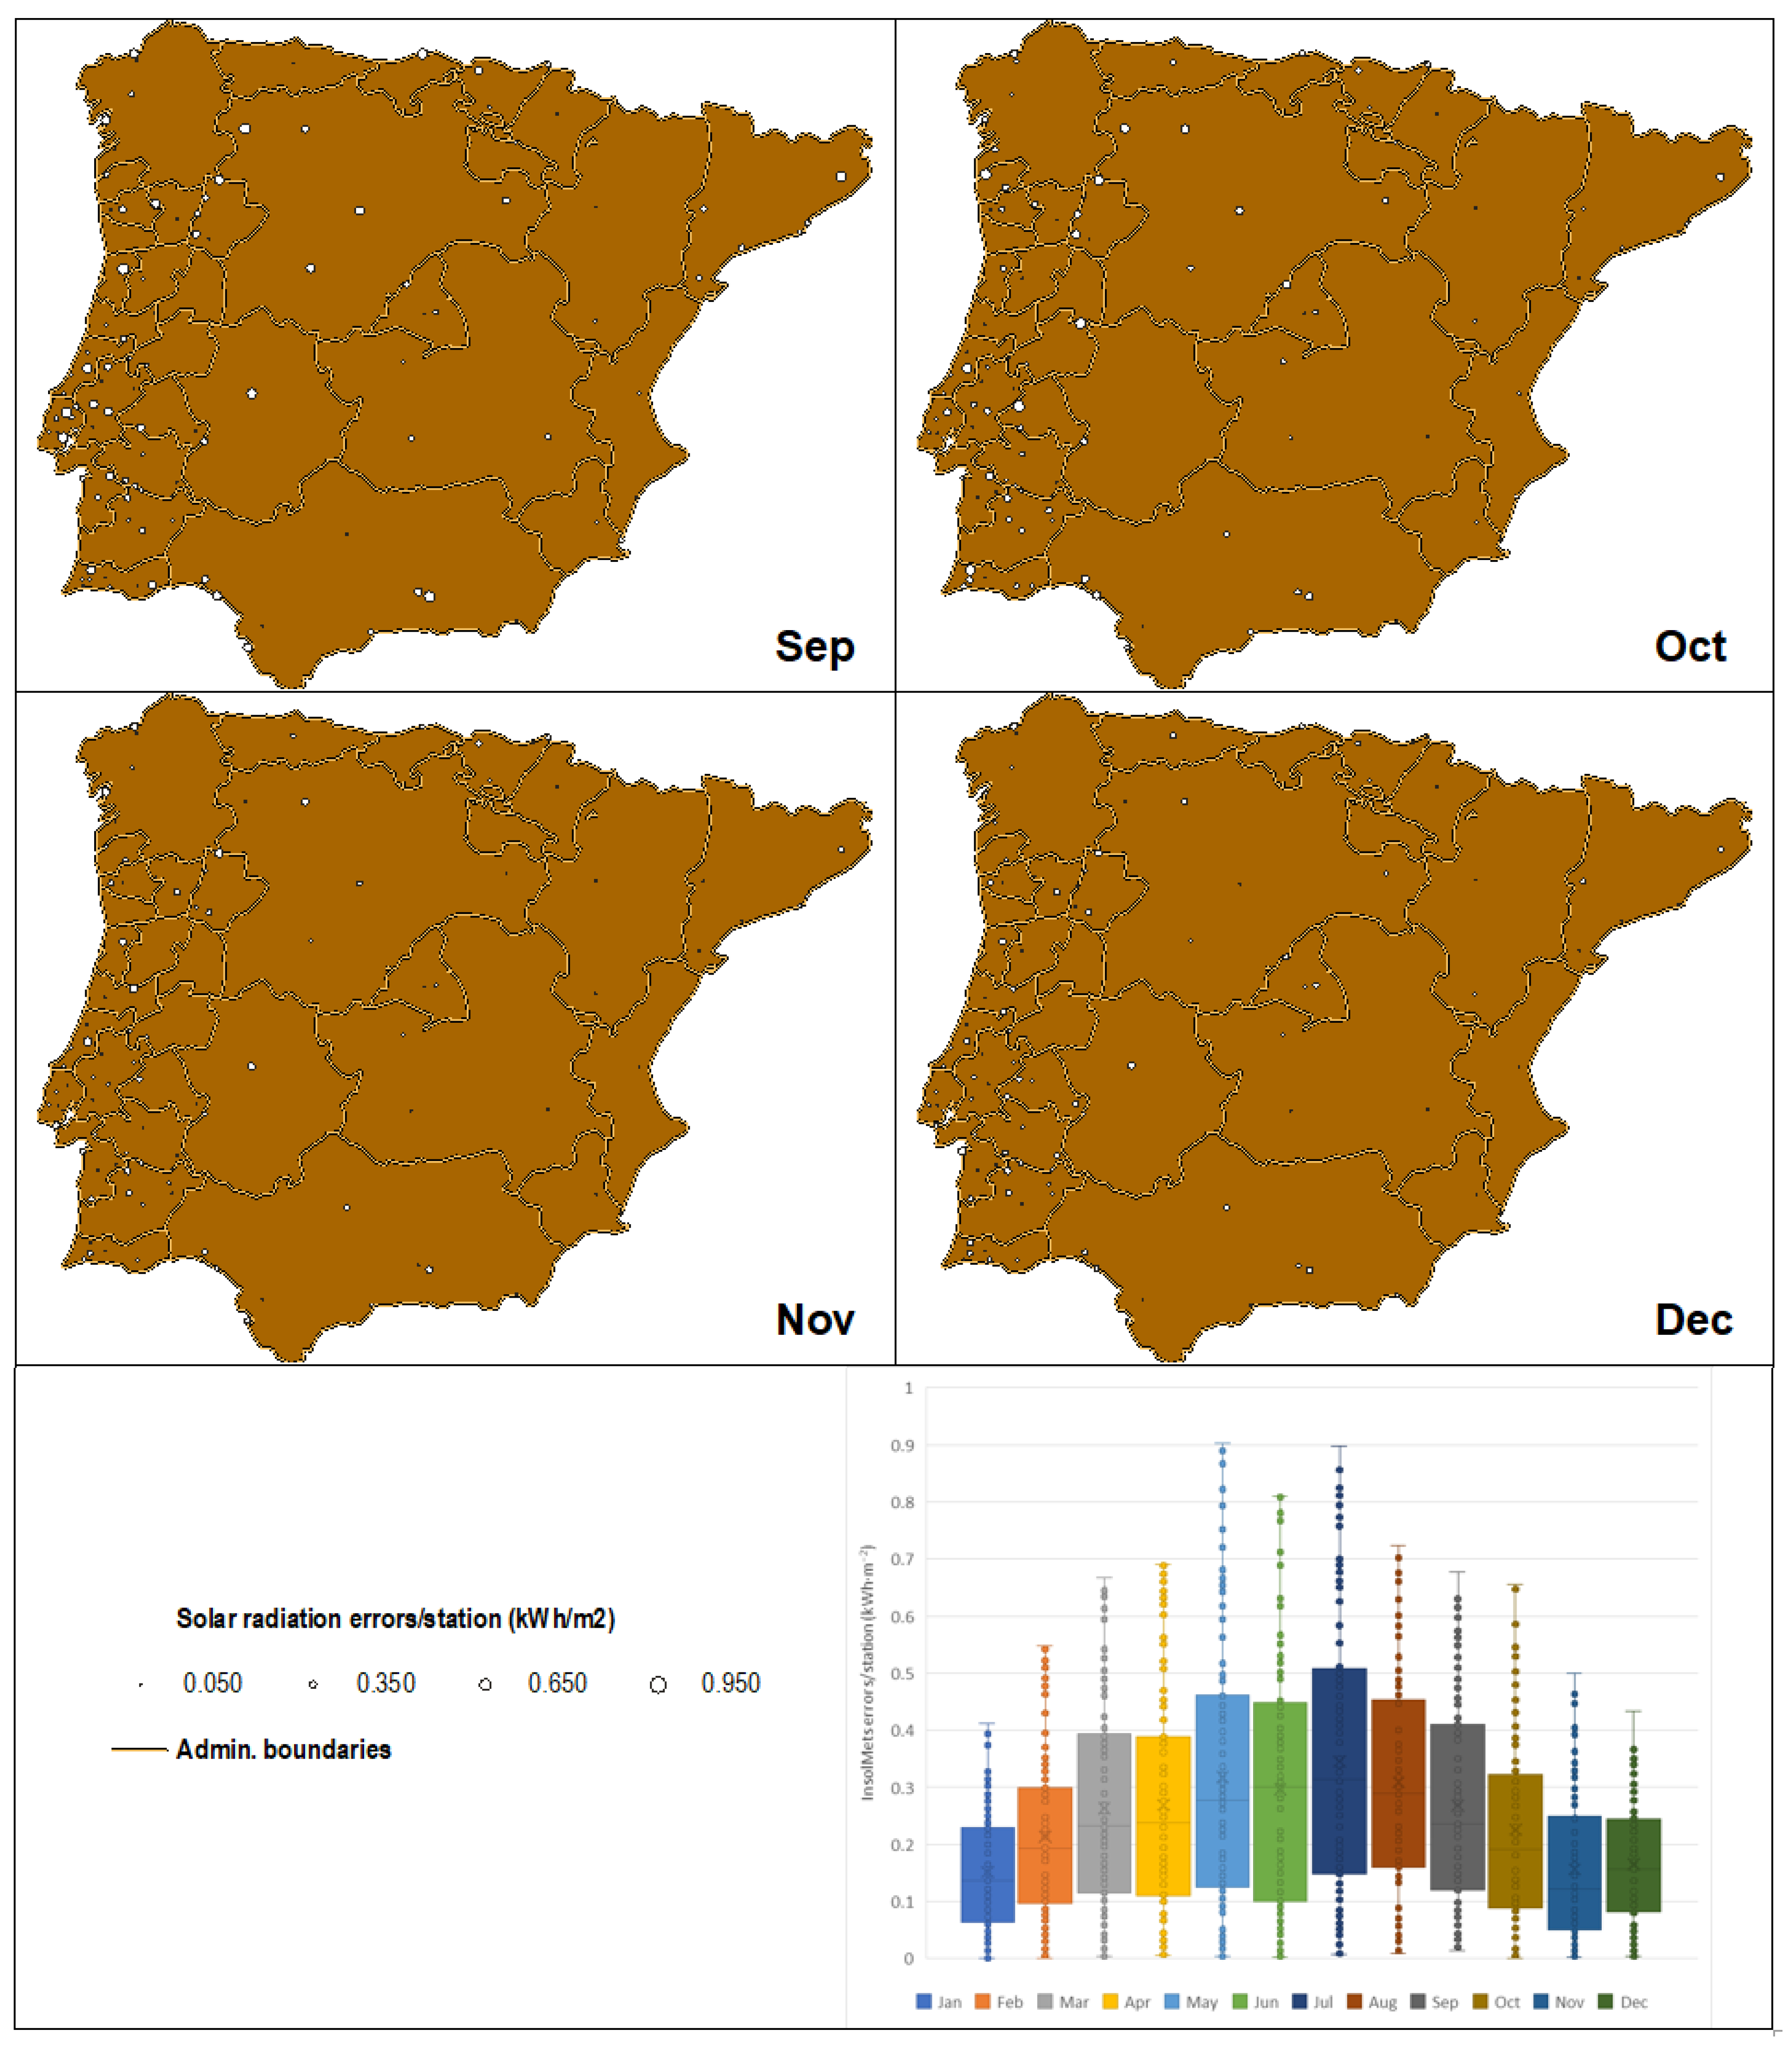
3. Results and Discussion

The comparative analysis of different solar radiation models reveals important differences in the estimation of irradiance in the Iberian Peninsula. This analysis will be twofold. First, the complete set of meteorological stations is used. Second, the quality filters described in Section 2 are applied.
When analyzing the complete set of meteorological stations, the results show that, although the methodologies used demonstrate general consistency in the intra-annual variability of solar radiation, there are discrepancies in the recorded absolute values. These differences are influenced by factors such as the different functional design of the models (radiative transfer models, etc.) and the input parameters (cloud cover, aerosol concentration, spatial resolution, etc.). In particular, it is observed that certain models tend to overestimate or underestimate the solar radiation in comparison with the reference data (Figure 1). As could be expected, the model showing the worst validation results is the one calculated with a sun position based on a central point for the entire study area, under constant atmospheric conditions for clear days (CAC).
In this context, ref. [115] further emphasize that, while models and databases can provide reasonably accurate estimates of global solar radiation, there are significant limitations regarding the accuracy of the direct and diffuse components, particularly under cloudy sky conditions. They underscore the need to improve the representation of atmospheric conditions within models. Such precision is essential not only for the design and performance of photovoltaic and thermal systems, but also for the ecological studies in which solar radiation serves as a key environmental driver. These limitations may be further exacerbated in regions characterized by high topographic and climatic heterogeneity, where ecological gradients, such as water availability, primary productivity, or vegetation cover, respond sensitively to local variations in incident solar radiation [6,30,33,116].
The MBE scatter plot for the CAC model (Figure 1) reveals significant anomalies, with a tendency to overestimate solar radiation when validated against the AEMET–SNIRH in situ dataset. This bias occurs from February to October because the CAC model is based on constant atmospheric conditions for clear sky days using fixed parameters (τ0 = 0.288 and DIF = 20%), as defined by [16,17]. Indeed, the observed average conditions across the Iberian Peninsula require greater atmospheric cover and thickness due to the presence of clouds, which must be accounted for to accurately model solar radiation. The overestimation is especially important in April to July due to the fact that days are longer; the excessively low τ0 cumulates more DIR and the excessively high DIF value, which is computed with reference to the DIR [99,102,103,104,105,106,107], cumulates more DIF. Moreover, according to [117], April and May exhibit more cloud cover than June and July, thereby making the erroneous estimation still greater. When considering NRMSE, CAC model errors are more pronounced during the winter months (Figure 1), as deseasonalization removes the influence of day length. In this context, the increased cloud cover in winter leads to greater discrepancies between this clear sky model and the in situ data. In contrast, during the summer months, the NRMSE mitigates the impact of high absolute values resulting from the longer daylight hours and higher solar altitude, especially during the clear sky periods associated with high-pressure systems when the atmosphere is usually more stable, which is particularly relevant for strongly seasonal variables. This stability reduces the influence of unpredictable factors such as scattered clouds or abrupt changes in radiation. The comparison with other models underscores the importance of integrating spatiotemporal satellite-based remote sensing data related to atmospheric conditions and the contribution of the DIF component.
In monthly terms, the estimate offering the best validation results has been InsolMets (Figure 1); however, there is a clear tendency to underestimate the solar radiation except in the months of July and August, where InsolMets shows the optimal MBE ~0 kWh·m−2. In these months, the other models generally show the worst results. The validation analyses also revealed that InsolMets and SARAH provided the best results in March (tie), while InsolMets and PVGIS performed equally well in November and December (also a tie).
Moreover, the RMSE value considering the threshold proposed by the Global Climate Observing System (GCOS) for required measurement uncertainties of downward shortwave irradiance at the earth’s surface is 10 W·m−2 (2-sigma [118]). If we take this threshold in kWh·m−2·day−1 for in situ measurements (0.12, 1-sigma), and use three times this value (0.36) as a reference for modelling results, InsolMets is the model with the highest number of months showing an RMSE below this value, presenting 4 months over this figure (May, June, July, and August; Figure 1). The RMSE values > 0.36 are highlighted in all models except for the CAC model, where all values exceed 0.36. Furthermore, for each RMSE value of the models, the best overall result was 0.35 kWh·m−2 (InsolMets), while the other models showed results ranging from 0.39 to 0.45 kWh·m−2 (SARAH, PVGIS, CAMS, PSM), and 0.51 kWh·m−2 (CAC). In this context, the InsolMets model deviates less than three times from the uncertainty measurement of the maximum threshold established by GCOS for a properly calibrated instrument, according to the specifications of the [118]. Furthermore, the 141 meteorological stations used in the validation process are representative of most points in the Iberian Peninsula, according to [58]. It is important to note that any of the models use sensor data for model construction. Therefore, the RMSE of InsolMets, in addition to being smaller than the RMSE of other models (Figure 1), remains under the established reference value.
Considering the MBE in general terms, PSM is the model that provides the best validation results (Figure 1). However, InsolMets was shown to provide the most robust estimation when considering the entire set of estimators (RMSE, NRMSE, and Pearson correlation coefficient (r)) across all months: Additionally, InsolMets ranked second when considering the MBE values.
The number of monthly scenarios with non-significant correlation coefficients (p-value ≥ 0.05), considering the annual series, amounts to 64 (Figure 1). In these cases, InsolMets stands out as the best-performing model for surface solar radiation estimation, as it only presents 1 month with non-significant correlations throughout the 2004–2020 period (year by year). The second best-performing model in this context is SARAH, which records 3 months with non-significant correlations. Furthermore, in the 63 scenarios where correlations from the other models were found to be non-significant, InsolMets offered the best validation results for 28 months, followed by SARAH, which showed optimal performance for 16 months for 61 scenarios.
These results show the variability in the performance of the different models, providing key insights for the comparative assessment of solar radiation estimation methodologies. For instance, the CAMS model consistently underestimates values throughout the year, possibly due to its coarser spatial resolution (0.2° or ~20 km), which also likely contributes to its poorer monthly RMSE results. As could be expected due to their common basis, SARAH and PVGIS show similar results; however, RMSE values are slightly lower in SARAH, while PVGIS exhibits less bias. This lower bias could be related to the use of radiative transfer models, a characteristic shared with PSM, the best model in terms of bias.
As can be seen in Figure 1, the RMSE tends to be higher in summer, while NRMSE really reflects the deseasonalized errors. Looking at the NRMSE panel, the different models perform more accurately in summer since the effects of seasonal variability, which have a greater impact on RMSE, have been avoided. Indeed, the atmosphere is usually more stable during summer, especially during the clear sky days associated with high-pressure systems. This stability reduces the presence of unpredictable factors, such as scattered clouds or abrupt changes in radiation, which theoretically should make prediction easier. Nonetheless, despite this atmospheric stability, the RMSE can increase because it is sensitive to higher absolute values, even when the model is performing reasonably well. For this reason, RMSE tends to be higher under these conditions, while NRMSE, by considering the total range of observed values used in the validation, removes the influence of high absolute values, making NRMSE smaller compared to RMSE (Figure 1). This suggests that the model might be working proportionally more accurately in summer since it eliminates the seasonal variability effects that more significantly affect RMSE.
Regarding the quality filters described in Section 2, we have selected meteorological stations with a minimum TDC of 45% for the observed month (Table 1). This threshold was preferred over 50% as a clear percentage of stations (7.9%) falls within the 5% margin between 45% and 50%.
Data completeness is one of the most relevant indicators in the quality control of meteorological and environmental datasets, particularly in the context of validating numerical models and building reliable time series [61]. This indicator refers to the percentage of available data relative to the total expected over a given period. Its proper monitoring allows for the detection of operational deficiencies, instrumental failures, or interruptions in data acquisition [58]. Low data completeness can compromise both the statistical representativeness and the validity of subsequent analyses, affecting the ability of models to capture temporal patterns. In solar radiation studies, where intra- and inter-daily variability is significant, maintaining continuous and complete time series is essential to avoid biases in the estimation of key parameters such as average irradiance, energy yield, or comparisons across different time periods [60,63]. Ref. [63] compiled daily records of global solar radiation from 70 meteorological stations operated by AEMET, ultimately selecting 13 stations that provided at least 20 years of continuous data spanning from the late 1970s to 2010. Data gaps in the selected series were filled using estimates based on the reference series showing the highest correlation with the available data. Quality-control procedures were applied to correct evident errors such as spurious missing values and outliers affecting less than 0.01% of the dataset.
Moreover, data completeness is a fundamental criterion for selecting reliable stations in cross-validation or model calibration studies. Many international protocols, such as those of the Baseline Surface Radiation Network (BSRN) and databases like CAMS, establish minimum completeness thresholds for accepting a dataset as valid [62]. The authors evaluated various solar radiation models in Petrolina station (Brazil) and emphasize the importance of applying quality-control data filters, noting that the calculation of hourly averages requires at least 20% of valid minutely global or direct solar radiation data per hour; monthly averages require a minimum of 60% of valid days.
Consistent with previously cited studies, our findings further underscore the importance of filtering data with low completeness. Indeed, systematic monitoring and documentation of this indicator not only enhance the transparency and traceability of the analysis process but also strengthen confidence in the scientific results derived from the use of such data.
An additional filtering process was also applied, based on the error distribution at the meteorological stations (Figure 2). This figure also shows the robustness of the best-performing models (notably InsolMets and PVGIS), because of their relative low error dispersion. In this case, the criterion has been to remove those stations where the error exceeded two standard deviations from the RMSE (Table 1).
As shown in Table 1, once the filtering processes were applied, the RMSE improved in all cases, with InsolMets standing out as the model with the best results. Regarding the previous comparative analysis (Figure 1), the validation results showed that InsolMets and SARAH provided the best results in March (tie), while InsolMets and PVGIS performed equally well in November and December (also a tie). The quality filtering also determined that InsolMets is the best-performing model in these months. With these treatments, the coherence and reliability of the data used in the validations are ensured, minimizing errors from incomplete data or from outliers. Additionally, mapping of the validation errors of InsolMets at the meteorological stations from AEMET–SNIRH network is presented in Figure A2, providing a spatiotemporal view of its distribution.
Finally, Table 2 presents the comparison of the RMSE obtained for the InsolMets solar radiation estimation with those from the model calculated under constant atmospheric conditions for clear days (CAC). Monthly differences between the two models are presented, along with the improvement regarding the worst-performing model (CAC). The results highlight relevant improvements of the best-performing model (InsolMets), reaching 61.5% in January, 59.7% in November, and 52.0% in December. In July (29.1%), August (29.1%), and September (27.4%), the improvements are lower. Table 2 also shows the months with an RMSE reference value > 0.36 kWh·m−2 (May and July) after applying the filtering processes. Finally, InsolMets model achieved an overall result of 0.32 kWh·m−2.
Regarding the limitations of this study, it is important to note that models with spatial resolutions of 20 km, 4–5 km, and 100 m were compared. While models with coarser resolutions yielded fewer high-accuracy results, they offer notable advantages in terms of broader applicability and spatial coverage at global or regional scales. Similarly, differences between models based on a standard atmosphere and those incorporating more advanced atmospheric treatments must also be considered. These distinctions are particularly relevant, as the results underscore the critical influence of both spatial resolution and atmospheric representation on model accuracy, especially in terms of their consistency with observations from meteorological stations, which serve as essential reference points for validation [60,115]. The findings also highlight the importance of developing high-resolution, physically based solar radiation models that integrate atmospheric variables to reflect the specific conditions of each region. Moreover, the ongoing discussion around incorporating new variables into modelling frameworks remains open and continues to evolve alongside advances in remote sensing technologies and the increasing availability of observational data.
Building on this context, ref. [62] revealed substantial differences in the accuracy of solar radiation modelling by evaluating different datasets, comprising satellite-based models and atmospheric re-analyses. Among the models assessed, CAMS demonstrated the highest monthly accuracy at Petrolina station (Brazil) with an RMSE of 0.11 and an MBE of 0.02 (kWh·m−2·day−1), while MERRA2 showed the least reliable performance (RMSE = 0.83, MBE = 0.76). In comparison, the present study reports a lower NRMSE of 0.09 for the CAMS model (Figure 1), along with a deseasonalized MBE of −0.08 (kWh·m−2·day−1), based on data from 141 meteorological stations. By contrast, the corresponding RMSE and MBE values are 0.42 and −0.40, respectively. These findings indicate that model reliability can vary significantly depending on the geographical context and its features, reinforcing the importance of conducting regional validation and intercomparison studies. Such efforts are essential for reducing uncertainties in solar resource assessments, selecting the most appropriate models for specific applications, and enhancing the design and operational efficiency of solar energy systems. Ref. [62] also reinforces the critical role of high-quality, ground-based observations in not only validating model outputs but also improving their adaptability across diverse climatic zones, particularly in tropical and semi-arid regions, where atmospheric conditions may differ markedly from the generalized assumptions used in global models.
Similarly, ref. [119] identified significant differences in the accuracy of various satellite-derived solar radiation products. While some datasets exhibited a strong correlation with in situ measurements, others showed notable deviations. For instance, the SARAH model achieved a Pearson correlation coefficient (r) of 0.88, whereas ERA5 yielded a markedly lower value of 0.37, based on data from 10 meteorological stations. In comparison, the present study reports a Pearson correlation coefficient of 0.73 for the SARAH model (Figure 1), highlighting that model validation was performed using data from 141 meteorological stations. Ref. [119] emphasized that the accuracy of satellite estimates varied with the temporal scale considered, being generally higher for annual averages and decreasing at shorter time frames. Their study further underscored the substantial influence of local atmospheric conditions on solar radiation estimates and the need for improved representation of these conditions in the modelling frameworks. As with previous studies, they reinforced the importance of validating solar radiation models using high-quality, ground-based data, particularly in regions with complex atmospheric dynamics such as central Africa.
Although the Iberian Peninsula spans a considerable area and presents complex features representative of diverse climates and geographical conditions, the findings of this study cannot be directly extrapolated to other regions. In particular, factors, such as evaporation rates and cloud patterns, may differ significantly throughout the year in other parts of the world, underscoring the necessity of validating models and assumptions with locally observed data. Recent work by [19], based on 6 years of data from satellite sensors and re-analysis products, shows the global distribution of clouds and their uneven detection across different latitudes, highlighting the strong geographical variability of cloud cover. Tropical regions exhibit a high frequency of cloudiness, whereas mid- and high-latitude regions tend to experience more stable cloud conditions. Moreover, cloud detection is influenced by the technical specifications of each sensor and the optical complexity of the underlying surface. These factors contribute to a heterogeneous representation of cloud cover at both global and regional scales.
In light of these findings, the Iberian Peninsula, characterized by its topo–climatic heterogeneity, ranging from arid to temperate zones, and its high sensitivity to global atmospheric changes, serves as a valuable reference system for investigating complex environmental interactions [24]. As outlined in the Introduction and Methods sections, the six models evaluated in the present study provide a diverse and representative set of approaches for computing solar radiation. Their performance was assessed under locally heterogeneous spatiotemporal conditions, contributing to a better understanding of solar radiation, an important variable in regions with complex climatic, ecological, and geographical features. This is particularly relevant in the Iberian Peninsula, where atmospheric, climatic, and topographic factors are strongly interrelated.

4. Conclusions

The comparative analysis of six solar radiation models has revealed relevant differences within the context of the Iberian Peninsula. By deseasonalizing the RMSE (NRMSE), the models have been compared on equal terms, removing the natural seasonal fluctuations that could make the interpretation of the results more difficult. To reduce this effect, the use of additional variables during the modelling process is recommended (e.g., the atmospheric conditions, the contribution of DIR and DIF components, the solar vector incidence angles, etc.), along with normalization techniques in the validation step.
Compared to previous works, it is important to highlight the substantially higher spatial density of the meteorological stations used for model validation in this study (141 stations). In earlier studies [62,63,119], the spatial density employed reached, at most, only 9.2% of that used in this comparative analysis of solar radiation models over the Iberian Peninsula, thereby providing greater robustness to the validation results presented here. Moreover, the construction process of the AEMET–SNIRH solar radiation network dataset is described in detail in the study by [58].
Although the methods compared show consistency in terms of intra-annual variability, discrepancies in the absolute values occur due to their different functional designs (radiative transfer models, etc.) and input parameters (cloud cover, aerosol concentration, spatial resolution, etc.). The results have also been improved thanks to the application of quality filters (a minimum threshold of 45% data, and two standard deviations from the RMSE to look for outliers). Additionally, the poor performance of the solar radiation model under constant atmospheric conditions for clear days (CAC) highlights the need for the integration of spatiotemporal satellite remote sensing data related to atmospheric conditions and the DIF component contribution.
The InsolMets model, by integrating the atmospheric conditions through COT and CFC, the consideration of the contribution of the DIF component, and an accurate representation of solar illumination geometry using a tessellated DEM approach over the Iberian Peninsula [18], has proven to be the most robust among the evaluated models. The validation results presented by SARAH and PVGIS were as good as those of InsolMets in March, November, and December. However, with the quality filters applied, InsolMets was notably the best-performing model, showing important monthly improvements with regard to the worst-performing model (CAC) (61.5% in January, 59.7% in November, and 52.0% in December).
Moreover, InsolMets stands out as the model with the fewest number (only 1 month) of non-significant monthly correlations throughout the 2004–2020 period; it excelled in offering the best validation results over 28 months, during which the other models showed non-significant correlations.
The results also revealed that InsolMets had the highest number of months showing an RMSE reference value ≤ 0.36 kWh·m−2 (10 months, with only 2 months exceeding this figure in May and July). Indeed, the RMSE of InsolMets, in addition to being smaller than the RMSE of the other models, remained below that value (0.32 kWh·m−2), which is less than three times the uncertainty measure of the threshold (10 W·m−2, corresponding to 2-sigma; [118] [the same as 0.12 kWh·m−2·day−1, corresponding to 1-sigma]) established by GCOS for in-situ measurements of downward shortwave irradiance at the earth’s surface. In conclusion, the best overall recommended model is InsolMets.
Our analysis of solar radiation modelling in the Iberian Peninsula reveals the importance of considering its significant spatiotemporal variability through approaches such as remote sensing data integration. However, the specific design of each model yields different results, underscoring the value of these comparisons, even at regional scales, in climatically complex areas.

Author Contributions

C.R.-F.: Conceptualization, Data curation, Formal analysis, Funding acquisition, Investigation, Methodology, Validation, Visualization, Writing—original draft, Writing—review and editing. X.P.: Conceptualization, Funding acquisition, Methodology, Project administration, Supervision, Writing—review and editing. M.N.: Conceptualization, Funding acquisition, Methodology, Project administration, Supervision, Writing—review and editing. All authors have read and agreed to the published version of the manuscript.

Funding

This study has been developed within the framework of the Ph.D. Program in Geography of UAB. This work has been partially funded by the Catalan Government (SGR2021-00554) and by the Spanish MCIU Ministry DynaFun project (PID2023-152719OB-C21 MCIU/AEI/ERDF,EU), developed by the GRUMETS research group. C.R.-F. is the recipient of a FI-DGR training grant (2020FI-B00669), co-financed by the AGAUR (Generalitat de Catalunya) the EU (European Social Fund), and the UAB. X.P. is the recipient of an ICREA Academia Excellence in Research Grant (2023–2027).

Institutional Review Board Statement

Not applicable.

Informed Consent Statement

Not applicable.

Data Availability Statement

SARAH model is available on the website https://wui.cmsaf.eu/safira/action/viewDoiDetails?acronym=SARAH_V003 (accessed on 10 May 2025); PVGIS model is available on the website https://re.jrc.ec.europa.eu/pvg_tools/es/ (accessed on 10 May 2025); CAC model is available on the website https://www.infoambiental.grumets.cat/RadSolarPI/CAC/RadSolar_CAC_ENG.htm (accessed on 10 May 2025); PSM model is available on the website https://nsrdb.nrel.gov (accessed on 10 May 2025); CAMS Worldwide model is available on the website https://www.soda-is.com/pub/files/cams/CAMS-MSG-HIMAWARI-v4.6rev2/ (accessed on 10 May 2025); InsolMets model is available on the website https://www.infoambiental.grumets.cat/RadSolarPI/InsolMets/RadSolar_InsolMets_ENG.htm (accessed on 10 May 2025); COT and CFC SEVIRI products are available on the websites https://navigator.eumetsat.int/product/EO:EUM:DAT:0279 (accessed on 10 May 2025) and https://navigator.eumetsat.int/product/EO:EUM:DAT:0820 (accessed on 10 May 2025).

Acknowledgments

We thank the state meteorological organization AEMET-Spain, as well as SNIRH-Portugal, for providing support and meteorological data. We would also like to thank the public distribution policy of the remote sensing data used, as well as the authors of the different models for providing comparable results and contributing to the advancement of solar radiation modelling knowledge. Finally, we are very grateful to Joan Masó (CREAF) for helping us to structure the download webpages for some of the data calculated for this study.

Conflicts of Interest

The authors declare no conflict of interest.

Appendix A. Variability of Solar Radiation and Atmospheric Conditions over the Analyzed Years

As explained in Section 2, the years 2005, 2008, 2012, and 2017 were identified as representative of the most severe droughts in the Iberian Peninsula, characterized by reduced cloud cover. The year 2008, despite recording slightly higher temperatures than the average of the reference period 1971–2000 (15.3 °C; [120]), was relatively cold compared to previous years. During this year, drought episodes were observed in certain regions of the Iberian Peninsula, associated with an especially dry winter and summer [52,121]. However, the data collected (Table A1) reveal that throughout the year, there was a cloud cover (CFC) of 54% and an atmospheric optical thickness, due to the clouds, of 9.4 (COT). These values are related to the wet conditions observed in spring, early summer, and autumn in certain areas, although these precipitations did not fully compensate for the predominantly dry episode of that year. Nevertheless, these precipitations helped to slightly improve the hydrological situation in 2009 [52].
The years 2010, 2013, 2018, and 2020 were identified as representative of the wettest periods for the Iberian Peninsula. These years recorded precipitations above the average of the reference periods 1971–2000 and 1981–2010 (601 mm and 578 mm, respectively; [120]), associated with increased cloud cover [52]. The atmospheric situation during these years is detailed in Table A1. In 2010 and 2013, the CFC was 57% and 53%, respectively, with a COT of 9.6 and 9.2. In contrast, the years 2018 and 2020 presented a notably lower CFC (43% and 42%), accompanied by higher COT values (12.6 and 10.5). It is noteworthy that the year 2010 was characterized as exceptionally wet, due to atmospheric conditions dominated by low-pressure systems that caused intense and persistent rains across large areas of the Iberian Peninsula [122].
The years 2007, 2016, and 2019 were identified as representative of a more stable climatic situation in the Iberian Peninsula, characterized by the absence of extreme drought or intense precipitation episodes in the regional climate [52]. Although the temperatures during these years were higher than the average of the reference periods 1971–2000 and 1981–2010 (15.3 °C and 15.7 °C, respectively; [120]), the precipitations remained close to the average, with slight spatiotemporal variations (601 mm and 578 mm; [120]). The atmospheric situation in 2007 and 2016 followed a similar trend to previous years, with CFCs close to 50% and COTs of 9.1 and 8.6, respectively (Table A1). Meanwhile, the year 2019 maintained a comparable trend to that of 2018 and 2020, standing out for registering the lowest CFC in the 2004–2020 period (38%), accompanied by a COT of 10.5.
The analysis also includes the year 2006, which, despite being an extremely warm year —with an average temperature higher than the maximum of the reference period 1971–2000 (20.2 °C; [120])—, was distinguished by registering relatively normal precipitations [52]. This apparent contradiction could be explained by atmospheric variations that favored the presence of humid air flows and cloud formation without significant precipitations [55]. This uniqueness makes the year 2006 an atypical case that highlights climatic diversity even in notably dry periods. The year 2009 was also considered as representative of unusual climatic behavior. This year recorded the highest number of sunshine hours of the 2004–2020 series compared to the average of the reference period 1971–2000 (~2507 sunshine hours; [52,120]). Despite the high temperatures, the precipitations remained within normal and even relatively abundant levels. In terms of atmospheric conditions, both years (2006 and 2009) presented a CFC higher than 50%, with a COT of 9.4 in 2006 and 8.8 in 2009. It is worth noting that the GHI data from AEMET meteorological stations during 2009 were the highest of the analyzed period (2004–2020; Table A1 and Figure A1).
AEMET indicates that the years 2010 [wet], 2016 [stable], 2018 [wet], and 2020 [wet] recorded a number of sunshine hours consistent with the average of the reference periods 1971–2000 and 1981–2010 (~2507 and ~2526 sunshine hours, respectively; [120]). In contrast, the remaining analyzed years recorded a higher percentage of sunshine hours, with 2009 [atypical] standing out for reaching the highest GHI of the 2004–2020 period (Table A1 and Figure A1). This behavior could be related to solar cycles of solar activity, as these cycles repeat approximately every 22 years [29], peaking around 11 years after the start of the cycle. The current solar cycle (Solar Cycle 25) began in 2019 [stable] [123,124], suggesting that the previous solar maximum coincided with 2009. This would also explain the progressive decrease in GHI in subsequent years, followed by a new increase observed in 2017 [drought], 2019 [stable], and 2020 [wet]. However, from 2009 onward, the GHI has remained slightly higher than the values recorded in previous years (Table A1 and Figure A1).
Furthermore, the relationship between the increase in GHI and the decrease in CFC from 2017 [drought] due to the persistence of anticyclonic patterns is shown, although with an important increase in COT in the years 2018 [wet], 2019 [stable], and 2020 [wet] (Table A1). This seems to be related to more abundant precipitations, highlighting the increased influence of COT on GHI starting in 2016 [stable] (Figure A1). In this context, as a result of the decrease in CFC and the effects of atmospheric conditions, many studies have shown that these factors influence the solar radiation reaching the surface, with implications for long-term temperatures such as the relationship between increased solar radiation and higher temperatures [3,4,48,53,125].
Considering the median of the time series, the CFC explains 75% of the GHI variance (15% mean absolute deviation around the median (Dmed)); the COT explains 68% of the GHI variance (16% = Dmed). These results are based on annual R2 in the 2004–2020 period between the SEVIRI values and the AEMET measurements (p-value < 0.05; Table A1). The variations in COT from SEVIRI are specific to cloudy areas (CFC) and used as a proxy of the atmospheric attenuation of solar radiation (τ0) [82]. Indeed, the CFC explains 80% of the COT variance (Pearson r = 0.90; Table A1). The influence of the CFC on GHI is more relevant, as CFC determines both the fraction of cloudy and clear skies; it has a differentiated influence on solar radiation.
Generally, it is expected that a higher COT would be linked to a higher CFC. However, it is important to note that a smaller CFC may be associated with a higher COT in certain scenarios (years 2018, 2019, and 2020; Table A1 and Figure A1). For example, this can arise due to the presence of more compact clouds or vertically developing clouds associated with specific meteorological phenomena such as convective storms or isolated cloud systems. The results indicate that precipitations are related to both variables, as the presence, extent, and physical and optical properties of clouds directly influence their formation. Nevertheless, a higher COT is linked to wetter climatic episodes (Table A1). On the other hand, the GHI, despite variations, and considering 2009 as an inflection year, remained approximately stable throughout the 2004–2020 series (Figure A1). An example of this can be seen during the years 2008, 2010, 2018, 2019, and 2020. In 2008 and 2010, similar levels of CFC and COT were recorded (54% and 57%, 9.4 and 9.6, respectively; Table A1). However, 2008 was classified as representative of a severe drought due to the decrease in precipitations during the recorded dry periods [52,121], while 2010 was characterized by an exceptionally wet episode with intense and persistent rainfall across much of the Iberian Peninsula [122]. On the other hand, during 2019 [stable], precipitation levels were within normal values of the reference period 1981–2010 (578 mm; [52,120]), with low cloudiness (38%) and high atmospheric density (10.5) (Table A1). In contrast, the years 2018 and 2020 [wet] presented similar CFC and COT values to those of 2019 (43% and 42%, 12.6 and 10.5, respectively; Table A1), although with more abundant precipitations [52].
It is noteworthy that, despite the differences in the characterization of climatic episodes, the average temperature of the years in the series has been higher than that of the reference periods 1971–2000 and 1981–2010 [52], reflecting a clear trend toward rising temperatures. Additionally, the average temperature of the reference periods has also increased (15.3 °C and 15.7 °C, respectively; [120]), which is closely linked to the effects of global climate change, including both atmospheric warming and alterations in regional climatic patterns. On the other hand, the average precipitation of the reference periods has decreased (601 mm and 578 mm [120]), a trend that, along with the increase in temperatures, is associated with the intensification of extreme climatic events; these phenomena are becoming more frequent in the context of climate change. This pattern is accompanied by a reduction in CFC, which does not necessarily imply a lower COT (Figure A1). At the same time, an increase in the average number of sunshine hours is observed (~2507 and ~2526 sunshine hours; [120]), contributing to an increase in surface solar radiation. This effect is indicative of a clearer atmosphere [126,127], resulting from the presence of fewer clouds, which intensifies temperature rise and global warming, thus reinforcing the feedback cycle associated with climate change.
The results highlight a paradigm shift in recent atmospheric patterns, characterized by a decrease in the cloud cover fraction (CFC) and an increase in atmospheric optical thickness due to clouds (COT) (Table A1 and Figure A1). There is a direct relationship with the increase in incident solar radiation, a phenomenon that, in turn, contributes to the sustained rise in observed temperatures in recent years. The combination of these factors not only intensifies global warming but also influences precipitation dynamics. In particular, there is an increasing trend toward intense rainfall episodes, characterized by a more irregular spatiotemporal distribution. This behavior, far from following traditional climatic patterns, suggests a relevant alteration in atmospheric dynamics, consistent with scientific projections that anticipate an increase in the frequency and intensity of extreme climatic events. This scenario shows a more unstable meteorological context, in which solar radiation is a key factor in atmospheric dynamics and climatic phenomena [59,63,128], making it essential to conduct studies on solar radiation to understand how this variable is influenced by these factors and to more accurately assess climatic variability.
Table A1. Atmospheric conditions (COT and CFC) and GHI based on the AEMET stations. COT units: dimensionless; CFC units: %; GHI units: 10 kJ·m−2·day−1 (energy per unit area and per day). Statistics computed for each year: median (MED); and mean absolute deviation around the median (Dmed). The total results are highlighted in bold.
YearCOT
SEVIRI
CFC
SEVIRI
GHI
AEMET
COTvsCFCGHIvsCOTGHIvsCFC
rR2rR2rR2
20049.65415480.900.81−0.710.50−0.660.43
20058.55015570.920.85−0.590.35−0.620.38
20069.45515640.870.75−0.580.33−0.690.48
20079.15115920.900.80−0.830.68−0.870.75
20089.45415690.910.83−0.920.85−0.960.92Climatic conditions AEMET *
20098.85218640.900.80−0.790.63−0.830.68stable years
20109.65716480.870.76−0.720.52−0.830.70drought years
20118.75016110.900.81−0.820.68−0.840.71atypical years
20127.95016120.880.77−0.620.39−0.640.41humid years
20139.25316000.890.79−0.930.86−0.950.91
20148.35616090.870.76−0.910.82−0.930.86* Climatic conditions according to
20158.35216160.930.86−0.930.87−0.950.91Resúmenes climatológicos, España
20168.65315920.860.74−0.920.85−0.900.81(AEMET, 2004–2020)
20177.94716560.910.82−0.880.77−0.870.76
201812.64315610.880.77−0.900.82−0.900.81
201910.53816780.920.85−0.890.79−0.900.80
202010.54216730.850.73−0.720.52−0.700.49
MED9.15216090.900.80−0.830.68−0.870.75
Dmed0.823.7145.650.020.030.100.160.090.15
Figure A1. Atmospheric conditions (COT and CFC) and GHI based on the AEMET stations. Figure based on data from Table A1. COT is represented as a percentage to CFC because the COT from SEVIRI is specific to cloudy areas (CFC from SEVIRI): COT/CFC represents the mean cloud optical thickness per unit of sky cover, providing a more accurate measure of how strongly the clouds present affect solar radiation as it passes through the atmosphere. Being COT a dimensionless variable, the percentage allows an easier comparison of the relationships with CFC data. R2 is also represented as a percentage.
Atmosphere 16 00590 g0a1

Appendix B. Additional Figures

Table A2. Additional aspects from datasets used for validating and comparing the solar radiation, as well as from the models being compared.
OBSERVED
SOLAR RADIATION DATA
-
METEOROLOGICAL
STATIONS
AEMET-Spain10 kJ·m−2·day−1kJ·m−2·day−1·10/3600 == kWh·m−2·day−1
GHI, DNI, DIF (to perform validations, the same periods of the models detailed below are computed)
Observed GHI and DIF data measured with pyranometers, and DNI data measured with pyrheliometers
SNIRH-PortugalW·m−2∑* ==> W·m−2·h−1·0.001 == kWh·m−2·day−1
it is multiplied by 0.001 because the data is hourly
GHI (to perform validations, the same periods of the models detailed below are computed)
Observed GHI data measured with silicon photovoltaic cell
SOLAR RADIATION
-
MODELS
SARAH-SEVIRI (v. 3.0)W·m−2W·m−2·day−1·0.001 == kWh·m−2·day−1
it is multiplied by 0.024 because the data is the AVG every 30-min considering 24 h
GHI, DNI, DHI, GHI.CS, DNI.CS, DHI.CS (AVG GHI of each per-year month is used: SEVIRI provides the AVG from the instantaneous data every 30-min)
Satellite remote sensing approach at 0.05° (~5 km)
PVGIS-EC (v. 5.3)kWh·m−2·day−1
GHI, DNI, DIF, GHI.CS, GTI optimal angle and given angles (AVG GHI of each per-year month is computed: PVGIS provides the accumulated monthly data)
Semi-empirical approach using remote sensing data SARAH at 0.05° (~5 km) and reanalysis data ERA5 to 0.25° (~30 km)
CAC-Grumets10 kJ·m−2·day−1kJ·m−2·day−1·10/3600 == kWh·m−2·day−1
GHI, GRI (GRI for each central day of each per-year month is computed)
Semi-empirical approach using InsolDia-MiraMon application, considering constant atmospheric conditions at 100 m
PSM-NSRDB (v. 3.1)W·m−2∑* ==> W·m−2·h−1·0.001 == kWh·m−2·day−1
it is multiplied by 0.001 because the data is hourly
GHI, DNI, DIF, GHI.CS, DNI.CS, DIF.CS (AVG GHI of each per-year month is computed: NSRDB provides the instantaneous data every 60-min)
Physical radiative transfer approach using remote sensing data at 4 km
CAMS-SoDa (v. 4.6)Wh·m−2∑* ==> Wh·m−2·0.001 == kWh·m−2·day−1
GHI, DNI, DHI, DIF, GHI.CS, DNI.CS, DHI.CS, DIF.CS (AVG GHI of each per-year month is computed: SoDa provides the instantaneous data every 15-min)
Hybrid physical-empirical approach using remote sensing data at 0.2° (~20 km)
InsolMets-Grumets10 kJ·m−2·day−1kJ·m−2·day−1·10/3600 == kWh·m−2·day−1
GHI, GRI, GTI, DHI, DRI, DIF (also for the cloudy and clear sky fractions) (GRI for each central day of each per-year month is computed)
Hybrid physical-empirical approach using InsolDia-MiraMon application, considering variable atmospheric conditions and a DEM-based at 100 m
* First, it is necessary to sum the hourly data to make the daily series. The average solar radiation of each per-year monthly series is either used or computed (AVG).
GHI: Global Horizontal Irradiation. GHI.CS: GHI under clear sky. GRI: Global Relief Irradiation. GTI: Global Tilted Irradiation. DNI: Direct Normal Irradiation. DNI.CS: DNI under clear sky.
DHI: Direct Horizontal Irradiation. DHI.CS: DHI under clear sky. DRI: Direct Relief Irradiation. DIF: Diffuse Solar Irradiation. DIF.CS: DIF under clear sky.
Figure A2. InsolMets error distribution on the AEMET–SNIRH network (2004–2020). Solar radiation error distribution of the best-performing model according to the RMSE results and to the data filtering assessed in Table 1 and Table 2.
Atmosphere 16 00590 g0a2aAtmosphere 16 00590 g0a2b

References

  1. WMO. About Essential Climate Variables. Global Climate Observing System (World Meteorological Organization). 2025. Available online: https://gcos.wmo.int/site/global-climate-observing-system-gcos/essential-climate-variables/about-essential-climate-variables (accessed on 10 May 2025).
  2. WMO. Essential Climate Variables. Global Climate Observing System (World Meteorological Organization). 2025. Available online: https://gcos.wmo.int/site/global-climate-observing-system-gcos/essential-climate-variables (accessed on 10 May 2025).
  3. Hansen, J.E.; Sato, M.; Simons, L.; Nazarenko, L.S.; Sangha, I.; Kharecha, P.; Zachos, J.C.; von Schuckmann, K.; Loeb, N.G.; Osman, M.B.; et al. Global warming in the pipeline. Oxf. Open Clim. Change 2023, 3, kgad008. [Google Scholar] [CrossRef]
  4. Trenberth, K.E.; Fasullo, J.T.; Kiehl, J. Earth’s Global Energy Budget. Bull. Am. Meteorol. Soc. 2009, 90, 311–324. [Google Scholar] [CrossRef]
  5. Dai, A.; Trenberth, K.E.; Karl, T.R. Effects of Clouds, Soil Moisture, Precipitation, and Water Vapor on Diurnal Temperature Range. J. Clim. 1999, 12, 2451–2473. [Google Scholar] [CrossRef]
  6. Wang, Q.-W.; Robson, T.M.; Pieristè, M.; Kenta, T.; Zhou, W.; Kurokawa, H. Canopy structure and phenology modulate the impacts of solar radiation on C and N dynamics during litter decomposition in a temperate forest. Sci. Total Environ. 2022, 820, 153185. [Google Scholar] [CrossRef]
  7. Carpentieri, A.; Folini, D.; Wild, M.; Vuilleumier, L.; Meyer, A. Satellite-derived solar radiation for intra-hour and intra-day applications: Biases and uncertainties by season and altitude. Sol. Energy 2023, 255, 274–284. [Google Scholar] [CrossRef]
  8. Cebecauer, T.; Suri, M.; Perez, R. High Performance MSG Satellite Model for Operational Solar Energy Applications. American Solar Energy Society. 2010. Available online: https://ases.org/wp-content/uploads/2021/11/High-Performance-MSG-Satellite-Model-for-Operational-Solar-Energy-Applications-.pdf (accessed on 10 May 2025).
  9. Suri, M.; Cebecauer, T.; Skoczek, A.; Marais, R.; Mushwana, C.; Reinecke, J.; Meyer, R. Cloud cover impact on photovoltaic power production in South Africa. In Proceedings of the SASEC 2014 Conference, Port Elizabeth, South Africa, 28 January 2014; pp. 309–317. Available online: https://solargis.com/es/publications/2014/all/intermitency-analysis (accessed on 10 May 2025).
  10. Virtuani, A.; Pravettoni, M.; Parini, L.; Morganti, L.; Skoczek, A.; Betak, J.; Mussetta, M.; Marchionna, S. Where has all the power gone? In A health check of italian solar electricity in 2016. In Proceedings of the 33rd EU PVSEC, Amsterdam, The Netherlands, 25–29 September 2017; pp. 2401–2405. Available online: https://solargis.com/publications/2017/all/regional-studies (accessed on 10 May 2025).
  11. Aalto, J.; Riihimäki, H.; Meineri, E.; Hylander, K.; Luoto, M. Revealing topoclimatic heterogeneity using meteorological station data. Int. J. Clim. 2017, 37, 544–556. [Google Scholar] [CrossRef]
  12. Domínguez-Álvarez, A.; De-Tena-Rey, M.-T.; García-Moruno, L. Modelling global solar radiation to optimise agricultural production. Span. J. Agric. Res. 2021, 19, e0201. [Google Scholar] [CrossRef]
  13. He, Y.; Wang, Z.; Sun, S.; Zhu, L.; Li, Y.; Wang, X.; Shi, J.; Chen, S.; Qi, D.; Peng, J.; et al. Using crop intercepted solar radiation and vegetation index to estimate dry matter yield of Choy Sum. Front. Plant Sci. 2023, 14, 1208404. [Google Scholar] [CrossRef]
  14. Tomas-Burguera, M.; Vicente-Serrano, S.M.; Beguería, S.; Reig, F.; Latorre, B. Reference crop evapotranspiration database in Spain (1961–2014). Earth Syst. Sci. Data 2019, 11, 1917–1930. [Google Scholar] [CrossRef]
  15. Low, S. Engineering imaginaries: Anticipatory foresight for solar radiation management governance. Sci. Total Environ. 2017, 580, 90–104. [Google Scholar] [CrossRef]
  16. Pons, X. Estimación de la Radiación Solar a partir de modelos digitales de elevaciones. Propuesta metodológica. In VII Coloquio de Geografía Cuantitativa, Sistemas de Información Geográfica y Teledetección; Juaristi, J., Moro, I., Eds.; VII Coloquio de Geografía Cuantitativa, Sistemas de Información Geográfica y Teledetección: Vitoria-Gasteiz, Spain, 1996; Available online: https://ddd.uab.cat/pub/poncom/1996/200247/Pons_1996_Estimacion_de_la_radiacion_solar_a_partir_de_modelos_digitales_de_elevaciones_Propuesta_metodologica_OCR.pdf (accessed on 10 May 2025).
  17. Pons, X.; Ninyerola, M. Mapping a topographic global solar radiation model implemented in a GIS and refined with ground data. Int. J. Clim. 2008, 28, 1821–1834. [Google Scholar] [CrossRef]
  18. Roca-Fernández, C.; Ninyerola, M.; Pons, X. Mejoras en el cálculo de los Modelos Digitales de Radiación Solar a partir del tratamiento del MDE y de la incorporación del patrón espaciotemporal de la profundidad óptica atmosférica: Resultados preliminares para la Península Ibérica. In Proceedings of the XIX Congreso de Tecnologías de la Información Geográfica–Las TIG al Servicio de los ODS (Departamento de Geografía y Ordenación del Territorio de la Universidad de Zaragoza, y la Asociación de Geógrafos Españoles), Zaragoza, Spain, 12–14 September 2022; pp. 391–400. Available online: https://www.researchgate.net/publication/390105467_Mejoras_en_el_calculo_de_los_Modelos_Digitales_de_Radiacion_Solar_a_partir_del_tratamiento_del_MDE_y_de_la_incorporacion_del_patron_espaciotemporal_de_la_profundidad_optica_atmosferica_resultados_prel (accessed on 10 May 2025).
  19. Shikwambana, L. Global Distribution of Clouds over Six Years: A Review Using Multiple Sensors and Reanalysis Data. Atmosphere 2022, 13, 1514. [Google Scholar] [CrossRef]
  20. Zarzalejo, L.F.; Domínguez, J.; Romero, M.; Ramírez-Santigosa, L. Caracterización de la Radiación Solar Como Recurso Energético. Centro de Investigaciones Energéticas, Medioambientales y Tecnológicas (Gobierno de España). 2012. Available online: https://www.researchgate.net/publication/327573936_CARACTERIZACION_DE_LA_RADIACION_SOLAR_COMO_RECURSO_ENERGETICO (accessed on 10 May 2025).
  21. Zarzalejo, L.F.; Ramírez, L.; Polo, J.; Martín, L.; Espinar, B. Estimación de la radiación solar a partir de imágenes de satélite: Nuevos mapas de evaluación de la irradiancia solar para la Península Ibérica. Av. Energy Renov. Medio Ambiente 2006, 10, 71–78. Available online: https://sedici.unlp.edu.ar/handle/10915/88424 (accessed on 10 May 2025).
  22. Calbó, J.; Sánchez-Lorenzo, A.; Martín-Vide, J.; Brunetti, M. Aspectos climatológicos y evolución temporal de la nubosidad en la Península Ibérica (1961–2004). In Proceedings of the VI Congreso Internacional de la Asociación Española de Climatología, Tarragona, Spain, 8–11 October 2008; Available online: https://www.divulgameteo.es/Aspectos-climatologicos-y-evolucion-temporal-de-la-nubosidad-en-la-Peninsula-Iberica-1961-2004/ (accessed on 10 May 2025).
  23. Vicente-Serrano, S.M.; Lopez-Moreno, J.-I.; Beguería, S.; Lorenzo-Lacruz, J.; Sanchez-Lorenzo, A.; García-Ruiz, J.M.; Azorin-Molina, C.; Morán-Tejeda, E.; Revuelto, J.; Trigo, R.; et al. Evidence of increasing drought severity caused by temperature rise in southern Europe. Environ. Res. Lett. 2014, 9, 044001. [Google Scholar] [CrossRef]
  24. Carnicer, J.; Domingo-Marimon, C.; Ninyerola, M.; Camarero, J.J.; Bastos, A.; López-Parages, J.; Blanquer, L.; Rodríguez-Fonseca, B.; Lenton, T.M.; Dakos, V.; et al. Regime shifts of Mediterranean forest carbon uptake and reduced resilience driven by multidecadal ocean surface temperatures. Glob. Change Biol. 2019, 25, 2825–2840. [Google Scholar] [CrossRef]
  25. Jordà, G.; Cacho, I.; Argüeso, D.; Ayarzagüena, B.; Ballabrera-Poy, J.; García-Rodríguez, O.E.; Hernanz, A.; Herrera, S.; Moreno, A.; Nieto, R.; et al. Informe CLIVAR-SPAIN Sobre el Clima en España. Ministerio para la Transición Ecológica y el Reto Demográfico (Gobierno de España). 2024. Available online: https://www.miteco.gob.es/content/dam/miteco/es/cambio-climatico/temas/impactos-vulnerabilidad-y-adaptacion/2024_INFORME_CLIVAR-SPAIN.pdf (accessed on 10 May 2025).
  26. Ministerio de Medio Ambiente. La Sequía en España. Directrices Para minimizar su Impacto. Comité de Expertos en Sequía del Ministerio de Medio Ambiente (Gobierno de España). 2007. Available online: https://www.miteco.gob.es/content/dam/miteco/es/agua/enlaces-de-interes/doc_sequia_espana_new_tcm30-278172.pdf (accessed on 10 May 2025).
  27. MITECO. Informe Sobre la Gestión de la Sequía en 2023. Ministerio para la Transición Ecológica y el Reto Demográfico (Gobierno de España). 2023. Available online: https://www.miteco.gob.es/es/prensa/ultimas-noticias/2023/09/el-14-6--del-territorio-esta-en-emergencia-por-escasez-de-agua-y.html (accessed on 10 May 2025).
  28. Olcina, J.; Rico, A.M. Sequías y golpes de calor en el sureste ibérico: Efectos territoriales y económicos. Investig. Geogr. 1995, 13, 47–79. [Google Scholar] [CrossRef]
  29. Bayona, G.; García, Y.C.; Sarmiento, H.R. CO2 y radiación solar: ¿causantes del calentamiento global? Rev. Acad. Colomb. Cienc. 2010, 34, 339–345. [Google Scholar] [CrossRef]
  30. Muramatsu, K.; Yoneda, E.; Soyama, N.; López-Ballesteros, A.; Thanyapraneedkul, J. Use of light response curve parameters to estimate gross primary production capacity from chlorophyll indices of global observation satellite and flux data. Sci. Remote Sens. 2024, 10, 100164. [Google Scholar] [CrossRef]
  31. Vicente-Serrano, S.M.; Beguería, S.; López-Moreno, J.I. A Multiscalar Drought Index Sensitive to Global Warming: The Standardized Precipitation Evapotranspiration Index. J. Clim. 2010, 23, 1696–1718. [Google Scholar] [CrossRef]
  32. Marín, J.F.; Parra, L.; Lloret, J.; Yousfi, S.; Mauri, P.V. Correlation of NDVI with RGB data to evaluate the effects of solar exposure on different combinations of ornamental grass used in lawns. In Proceedings of the 4th EAI International Conference on Industrial IoT Techonologies and Applications, Virtual, 11 December 2020; pp. 207–220. [Google Scholar] [CrossRef]
  33. Wang, H.; Li, Z.; Niu, Y.; Li, X.; Cao, L.; Feng, R.; He, Q.; Pan, Y. Evolution and Climate Drivers of NDVI of Natural Vegetation during the Growing Season in the Arid Region of Northwest China. Forests 2022, 13, 1082. [Google Scholar] [CrossRef]
  34. Kawaguchi-Akitsu, T.K.; Nasahara, K.N.; Ijima, O.; Hirose, Y.; Ide, R.; Takagi, K.; Kume, A. The variability and seasonality in the ratio of photosynthetically active radiation to solar radiation: A simple empirical model of the ratio. Int. J. Appl. Earth Obs. Geoinf. 2022, 108, 102724. [Google Scholar] [CrossRef]
  35. Li, L.; Xin, X.; Zhang, H.; Yu, J.; Liu, Q.; Yu, S.; Wen, J. A method for estimating hourly photosynthetically active radiation (PAR) in China by combining geostationary and polar-orbiting satellite data. Remote Sens. Environ. 2015, 165, 14–26. [Google Scholar] [CrossRef]
  36. Myneni, R.; Williams, D. On the relationship between FAPAR and NDVI. Remote Sens. Environ. 1994, 49, 200–211. [Google Scholar] [CrossRef]
  37. Rahman, M.; Lamb, D.; Stanley, J. The impact of solar illumination angle when using active optical sensing of NDVI to infer fAPAR in a pasture canopy. Agric. For. Meteorol. 2015, 202, 39–43. [Google Scholar] [CrossRef]
  38. Chou, M.D. A Solar Radiation Model for Use in Climate Studies. J. Atmos. Sci. 1992, 49, 762–772. [Google Scholar] [CrossRef]
  39. Kenny, R.P.; Huld, T.A.; Iglesias, S. Energy rating of PV modules based on PVGIS irradiance and temperature database. In Proceedings of the 21st European Photovoltaic Solar Energy Conference and Exhibition, Dresden, Germany, 4–8 October 2006; Available online: https://citeseerx.ist.psu.edu/document?repid=rep1&type=pdf&doi=ac1d9e88315abdb761b753dd3fe819f9214f2ba9 (accessed on 10 May 2025).
  40. Laguarda, A.; Giacosa, G.; Alonso-Suárez, R.; Abal, G. Performance of the site-adapted CAMS database and locally adjusted cloud index models for estimating global solar horizontal irradiation over the Pampa Húmeda. Sol. Energy 2020, 199, 295–307. [Google Scholar] [CrossRef]
  41. Pfeifroth, U.; Sanchez-Lorenzo, A.; Manara, V.; Trentmann, J.; Hollmann, R. Trends and variability of surface solar radiation in europe based on surface- and satellite-based data records. J. Geophys. Res. Atmos. 2018, 123, 1735–1754. [Google Scholar] [CrossRef]
  42. Rupp, D.E.; Daly, C.; Doggett, M.K.; Smith, J.I.; Steinberg, B. Mapping an Observation-Based Global Solar Irradiance Climatology across the Conterminous United States. J. Appl. Meteorol. Clim. 2022, 61, 857–876. [Google Scholar] [CrossRef]
  43. Suri, M.; Hofierka, J. A New GIS-based Solar Radiation Model and Its Application to Photovoltaic Assessments. Trans. GIS 2004, 8, 175–190. [Google Scholar] [CrossRef]
  44. Suri, M.; Huld, T.; Cebecauer, T.; Dunlop, E.D. Geographic Aspects of Photovoltaics in Europe: Contribution of the PVGIS Website. IEEE J. Sel. Top. Appl. Earth Obs. Remote Sens. 2008, 1, 34–41. [Google Scholar] [CrossRef]
  45. Suri, M.; Huld, T.; Dunlop, E.D.; Albuisson, M.; Wald, L. Online data and tools for estimation of solar electricity in Africa: The PVGIS approach. In Proceedings of the 21st European Photovoltaic Solar Energy Conference and Exhibition, Dresden, Germany, 4–8 October 2006. [Google Scholar]
  46. Taddei, F.; Melendez, S.; Cuestas, Y.; Collel, E. Resultados Preliminares de la Aplicación del Algoritmo HELIOSAT-2 Para la Estimación de la Irradiación Solar Global a Partir de Imágenes Satelitales GOES-13 en le Región de la Pampa Húmeda Argenti-na. Av. Energy Renov. Medio Ambiente 2014, 18, 11.09–11.21. Available online: https://portalderevistas.unsa.edu.ar/index.php/averma/article/view/2011 (accessed on 10 May 2025).
  47. Espinar, B.; Ramírez, L.; Drews, A.; Beyer, H.G.; Zarzalejo, L.F.; Polo, J.; Martín, L. Analysis of different comparison parameters applied to solar radiation data from satellite and German radiometric stations. Sol. Energy 2009, 83, 118–125. [Google Scholar] [CrossRef]
  48. García, R.D.; García, O.E.; Cuevas, E.; Cachorro, V.E.; Romero-Campos, P.M.; Ramos, R.; de Frutos, A.M. Solar radiation measurements compared to simulations at the BSRN Izaña station. Mineral dust radiative forcing and efficiency study. J. Geophys. Res. Atmos. 2013, 119, 179–194. [Google Scholar] [CrossRef]
  49. Jamil, B.; Akhtar, N. Comparative analysis of diffuse solar radiation models based on sky-clearness index and sunshine period for humid-subtropical climatic region of India: A case study. Renew. Sustain. Energy Rev. 2017, 78, 329–355. [Google Scholar] [CrossRef]
  50. Li, R.; Wang, D.; Liang, S. Comprehensive assessment of five global daily downward shortwave radiation satellite products. Sci. Remote Sens. 2021, 4, 100028. [Google Scholar] [CrossRef]
  51. Psomopoulos, C.S.; Ioannidis, G.C.; Kaminaris, S.D.; Mardikis, K.D.; Katsikas, N.G. A Comparative Evaluation of Photovoltaic Electricity Production Assessment Software (PVGIS, PVWatts and RETScreen). Environ. Process. 2015, 2, 175–189. [Google Scholar] [CrossRef]
  52. AEMET. Resúmenes Climatológicos, España. Ministerio Para la Transición Ecológica y el Reto Demográfico (Gobierno de España). 2004–2020. Available online: https://www.aemet.es/es/serviciosclimaticos/vigilancia_clima/resumenes?w=0&datos=2&n=2 (accessed on 10 May 2025).
  53. Calbó, J.; Enriquez-Alonso, A.; Sánchez-Romero, A.; González, J.A.; Sánchez-Lorenzo, A. Nubosidad y radiación solar en la Península Ibérica entre 1950 y 2050. De las evidenciaas observacionales a las simulaciones climáticas. In Proceedings of the X Congreso Internacional de la Asociación Española de Climatología: Clima, Sociedad, Riesgos y Ordenación del Territorio, Alicante, Spain, 5–8 October 2016. [Google Scholar] [CrossRef]
  54. Trigo, R.M.; Añel, J.A.; Barriopedro, D.; García-Herrera, R.; Gimeno, L.; Nieto, R.; Castillo, R.; Allen, M.R.; Massey, N. The record winter drought of 2011–12 in the Iberian Peninsula. Bull. Am. Met. Soc. 2013, 94, S41–S45. Available online: https://www.researchgate.net/publication/297275850_The_record_winter_drought_of_2011-2012_in_the_Iberian_Peninsula (accessed on 10 May 2025).
  55. Vicente-Serrano, S.M.; López-Moreno, J.I. The influence of atmospheric circulation at different spatial scales on winter drought variability through a semi-arid climatic gradient in Northeast Spain. Int. J. Clim. 2006, 26, 1427–1453. [Google Scholar] [CrossRef]
  56. MITECO. La Reserva Hidráulica Bajó un 12 por Ciento en 2011 Tras 5 Años de Aumento. In Ministerio para la Transición Ecológica y el Reto Demográfico (Gobierno de España); 2012. Available online: https://hispagua.cedex.es/documentacion/noticia/115702 (accessed on 10 May 2025).
  57. iAgua. La Sequía Acecha a España: 2015 se Cerró con un 40% Menos de la Lluvia Habitual. 2016. Available online: https://www.iagua.es/noticias/espana/ep/16/01/03/sequia-acecha-espana-2015-se-cerro-40-menos-lluvia-habitual (accessed on 10 May 2025).
  58. Roca-Fernández, C.; Ninyerola, M.; Pons, X. Diagnosis for integrating the main Iberian networks of solar radiation meteorological stations. Geofocus 2024, 33, 43–75. [Google Scholar] [CrossRef]
  59. AEMET. La Radiación Solar. Ministerio de Medio Ambiente y Medio Rural y Marino (Gobierno de España). 2024. Available online: https://www.aemet.es/documentos/es/eltiempo/observacion/radiacion/Radiacion_Solar.pdf (accessed on 10 May 2025).
  60. Forstinger, A.; Wilbert, S.; Jensen, A.; Kraas, B.; Fernández-Peruchena, C.; Gueymard, C.A.; Ronzio, D.; Yang, D.; Collino, E.; Martinez, J.P. Expert quality control of solar radiation ground data sets. In Proceedings of the SWC 2021: ISES Solar World Congress, Online, 25–29 October 2021; International Solar Energy Society: Freiburg, Germany, 2021; pp. 1037–1048. [Google Scholar] [CrossRef]
  61. Padial-Iglesias, M.; Pons, X.; Serra, P.; Ninyerola, M. Does the gap-filling method influence long-term (1950-2019) temperature and precipitation trend analyses? GeoFocus 2022, 29, 5–33. [Google Scholar] [CrossRef]
  62. Salazar, G.; Gueymard, C.; Galdino, J.B.; Vilela, O.d.C.; Fraidenraich, N. Solar irradiance time series derived from high-quality measurements, satellite-based models, and reanalyses at a near-equatorial site in Brazil. Renew. Sustain. Energy Rev. 2020, 117, 109478. [Google Scholar] [CrossRef]
  63. Sánchez-Lorenzo, A.; Calbó, J.; Wild, M. Global and diffuse solar radiation in Spain: Building a homogeneous dataset and assessing their trends. Glob. Planet. Change 2013, 100, 343–352. [Google Scholar] [CrossRef]
  64. Pons, X. MiraMon. Geographic Information System and Remote Sensing Software. Centre de Recerca Ecològica i Aplicacions Forestals (CREAF). 2024. Available online: https://www.miramon.cat/Index_eng.htm (accessed on 10 May 2025).
  65. Pons, X. CombiCap: Analytical Combination of Raster and Vector Layers in MiraMon. Centre de Recerca Ecològica i Aplicacions Forestals (CREAF). 2024. Available online: https://www.miramon.cat/help/eng/msa/combicap.htm (accessed on 10 May 2025).
  66. Pfeifroth, U.; Trentmann, J.; Kothe, S. Product User Manual. Meteosat Solar Surface Radiation and Effective Cloud Albedo Climate Data Record. SARAH-2.1 Climate Data Records. EUMETSAT CM SAF Climate Monitoring. 2019. Available online: https://www.cmsaf.eu/SharedDocs/Literatur/document/2019/saf_cm_dwd_pum_meteosat_hel_sarah_2_4_pdf.pdf?__blob=publicationFile (accessed on 10 May 2025).
  67. Karlsson, K.-G.; Stengel, M.; Meirink, J.F.; Riihelä, A.; Trentmann, J.; Akkermans, T.; Stein, D.; Devasthale, A.; Eliasson, S.; Johansson, E.; et al. CLARA-A3: The third edition of the AVHRR-based CM SAF climate data record on clouds, radiation and surface albedo covering the period 1979 to 2023. Earth Syst. Sci. Data 2023, 15, 4901–4926. [Google Scholar] [CrossRef]
  68. Stackhouse, P. POWER Data Methodology. NASA POWER Docs. 2024. Available online: https://power.larc.nasa.gov/docs/methodology/ (accessed on 10 May 2025).
  69. Blanc, P.; Gschwind, B.; Lefèvre, M.; Wald, L. The HelioClim Project: Surface Solar Irradiance Data for Climate Applications. Remote Sens. 2011, 3, 343–361. [Google Scholar] [CrossRef]
  70. EC. PVGIS User Manual. European Commission, EU Science Hub. 2024. Available online: https://joint-research-centre.ec.europa.eu/photovoltaic-geographical-information-system-pvgis/getting-started-pvgis/pvgis-user-manual_en (accessed on 10 May 2025).
  71. EC. SARAH-2 Solar Radiation Data. European Commission, EU Science Hub. 2024. Available online: https://joint-research-centre.ec.europa.eu/photovoltaic-geographical-information-system-pvgis/pvgis-data-download/sarah-2-solar-radiation-data_en (accessed on 10 May 2025).
  72. Huld, T.; Müller, R.; Gambardella, A. A new solar radiation database for estimating PV performance in Europe and Africa. Sol. Energy 2012, 86, 1803–1815. [Google Scholar] [CrossRef]
  73. Solargis. Solargis Solar Resource Database. Description and Accuracy. 2016. Available online: https://solargis2-web-assets.s3.eu-west-1.amazonaws.com/public/Uploads/279e8bb216/Solargis-database-description-and-accuracy.pdf (accessed on 10 May 2025).
  74. Sengupta, M.; Weekley, A.; Habte, A.; Lopez, A.; Molling, C.; Heidinger, A. Validation of the National Solar Radiation Database (NSRDB) (2005–2012). In Proceedings of the European PV Solar Energy Conference and Exhibition, Hamburg, Germany, 14–18 September 2015; Available online: https://www.researchgate.net/publication/298786251_Validation_of_the_National_Solar_Radiation_Database_NSRDB_2005-2012 (accessed on 10 May 2025).
  75. Sengupta, M.; Xie, Y.; Lopez, A.; Habte, A.; Maclaurin, G.; Shelby, J. The National Solar Radiation Data Base (NSRDB). Renew. Sustain. Energy Rev. 2018, 89, 51–60. [Google Scholar] [CrossRef]
  76. Lu, Y.; Zhang, R.; Wang, L.; Su, X.; Zhang, M.; Li, H.; Li, S.; Zhou, J. Prediction of diffuse solar radiation by integrating radiative transfer model and machine-learning techniques. Sci. Total Environ. 2023, 859, 160269. [Google Scholar] [CrossRef] [PubMed]
  77. Tapimo, R.; Lazard, M.; Ymeli, G.L.; Yemele, D. Radiative transfer model for ground surface irradiance estimation: Clear sky. J. Opt. Soc. Am. A 2021, 38, 1640–1646. [Google Scholar] [CrossRef]
  78. Lin, H.; Li, S.; Xing, J.; He, T.; Yang, J.; Wang, Q. High resolution aerosol optical depth retrieval over urban areas from Landsat-8 OLI images. Atmos. Environ. 2021, 261, 118591. [Google Scholar] [CrossRef]
  79. Lefèvre, M. CAMS Solar Radiation Products Regular Validation Report, Issue #34, March–May 2021; [Research Report] 34; HAL: hal-03605103; Copernicus Atmosphere Monitoring Service: 2022. Available online: https://atmosphere.copernicus.eu/sites/default/files/custom-uploads/EQC-solar/CAMS2_73_2021SC1_D1.3.1-2021Q4_RAD_validation_report_MAM2021_v1.pdf (accessed on 10 May 2025).
  80. Schroedter-Homscheidt, M.; Hoyer-Klick, C.; Killius, N.; Betcke, J.; Lefèvre, M.; Wald, L.; Wey, E.; Saboret, L. User Guide to the CAMS Radiation Service (CRS), Status December 2019. Report number: CAMS72_2018SC1_D72.4.3.1_2019_UserGuide_v1, Copernicus Atmosphere Monitoring Service. 2019. Available online: https://atmosphere.copernicus.eu/sites/default/files/2020-03/CAMS72_2018SC1_D72.4.3.1_2019_UserGuide_v1.1.pdf (accessed on 10 May 2025).
  81. SoDa. Download CAMS Radiation Volume over MSG Field of View. Solar Energy Services for Professionals. Solar Radiation Data. 2024. Available online: https://www.soda-pro.com/help/cams-services/cams-radiation-service/download-msg-volume (accessed on 10 May 2025).
  82. Pons, X. InsolDia: Computation of the Solar Radiation in a Single Day or an Instant. Centre de Recerca Ecològica i Aplicacions Forestals (CREAF). 2024. Available online: https://www.miramon.cat/help/eng/msa/insoldia.htm (accessed on 10 May 2025).
  83. Ineichen, P. A broadband simplified version of the Solis clear sky model. Sol. Energy 2008, 82, 758–762. [Google Scholar] [CrossRef]
  84. Lefèvre, M.; Oumbe, A.; Blanc, P.; Espinar, B.; Gschwind, B.; Qu, Z.; Wald, L.; Schroedter-Homscheidt, M.; Hoyer-Klick, C.; Arola, A.; et al. McClear: A new model estimating downwelling solar radiation at ground level in clear-sky conditions. Atmos. Meas. Tech. 2013, 6, 2403–2418. [Google Scholar] [CrossRef]
  85. Posselt, R.; Mueller, R.; Stöckli, R.; Trentmann, J. Remote sensing of solar surface radiation for climate monitoring—The CM-SAF retrieval in international comparison. Remote Sens. Environ. 2012, 118, 186–198. [Google Scholar] [CrossRef]
  86. Perez, R.; Ineichen, P.; Seals, R.; Michalsky, J.; Stewart, R. Modeling daylight availability and irradiance components from direct and global irradiance. Sol. Energy 1990, 44, 271–289. [Google Scholar] [CrossRef]
  87. Kambezidis, H.D.; Patelis, E.; Kavadias, K.A. An in-depth analysis of the Ångström–Prescott-type solar models: Application for Athens, Greece. Acad. Environ. Sci. Sust. 2025, 2, 7490. [Google Scholar] [CrossRef]
  88. Salazar, G.; Hernández, L.A.; Saravia, L.R.; Romero, G.G. Determinación de los Coeficientes de la Relación de Ångström-Prescott, Para la Ciudad de Salta (Argentina) a Partir de Datos Tomados Durante un Año. Av. Energy Renov. Medio Ambiente 2007, 11. Available online: https://sedici.unlp.edu.ar/bitstream/handle/10915/93432/Documento_completo.pdfPDFA.pdf?sequence=1&isAllowed=y (accessed on 10 May 2025).
  89. Paulescu, M.; Badescu, V.; Budea, S.; Dumitrescu, A. What Ångström—Prescott equation tells us about the cloud and clear-sky climatologies? Theor. Appl. Clim. 2022, 147, 239–250. [Google Scholar] [CrossRef]
  90. Cano, D.; Monget, J.; Albuisson, M.; Guillard, H.; Regas, N.; Wald, L. A method for the determination of the global solar radiation from meteorological satellite data. Sol. Energy 1986, 37, 31–39. [Google Scholar] [CrossRef]
  91. Hammer, A.; Heinemann, D.; Hoyer, C.; Kuhlemann, R.; Lorenz, E.; Müller, R.; Beyer, H.G. Solar energy assessment using remote sensing technologies. Remote Sens. Environ. 2003, 86, 423–432. [Google Scholar] [CrossRef]
  92. Ineichen, P.; Barroso, C.S.; Geiger, B.; Hollmann, R.; Marsouin, A.; Mueller, R. Satellite Application Facilities irradiance products: Hourly time step comparison and validation over Europe. Int. J. Remote Sens. 2009, 30, 5549–5571. [Google Scholar] [CrossRef]
  93. Rigollier, C.; Lefèvre, M.; Wald, L. The method Heliosat-2 for deriving shortwave solar radiation from satellite images. Sol. Energy 2004, 77, 159–169. [Google Scholar] [CrossRef]
  94. Zarzalejo, L.F.; Polo, J.; Martín, L.; Ramírez, L.; Espinar, B. A new statistical approach for deriving global solar radiation from satellite images. Sol. Energy 2009, 83, 480–484. [Google Scholar] [CrossRef]
  95. Farr, T.G.; Rosen, P.A.; Caro, E.; Crippen, R.; Duren, R.; Hensley, S.; Kobrick, M.; Paller, M.; Rodriguez, E.; Roth, L.; et al. The Shuttle Radar Topography Mission. Rev. Geophys. 2007, 45, RG2004. [Google Scholar] [CrossRef]
  96. Huld, T.; Cebecauer, T.; Šúri, M.; Dunlop, E.D. Analysis of one-axis tracking strategies for PV systems in Europe. Prog. Photovolt. Res. Appl. 2010, 18, 183–194. [Google Scholar] [CrossRef]
  97. Huld, T.; Šúri, M.; Dunlop, E.D. Geographical variation of the conversion efficiency of crystalline silicon photovoltaic modules in Europe. Prog. Photovolt. Res. Appl. 2008, 16, 595–607. [Google Scholar] [CrossRef]
  98. Suri, M.; Huld, T.A.; Dunlop, E.D. PV-GIS: A web-based solar radiation database for the calculation of PV potential in Europe. Int. J. Sustain. Energy 2005, 24, 55–67. [Google Scholar] [CrossRef]
  99. Laguarda, A. Modelado de la Irradiancia Solar Sobre la Superficie Terrestre. Modelos Físicos e Híbridos Utilizando Información Satelital Sobre la Pampa Húmeda. Ph.D. Thesis, Programa de Posgrado en Ingeniería de la Energía, Facultad de Ingeniería de la Universidad de la República de Uruguay, Montevideo, Uruguay, 2021. Available online: https://www.researchgate.net/publication/350857653_Modelado_de_la_irradiancia_solar_sobre_la_superficie_terrestre_Modelos_fisicos_e_hibridos_utilizando_informacion_satelital_sobre_la_Pampa_Humeda (accessed on 10 May 2025).
  100. Rigollier, C.; Bauer, O.; Wald, L. On the Clear Sky Model of the ESRA—European Solar Radiation Atlas—With Respect to the Heliosat Method. Sol. Energy 2000, 68, 33–48. [Google Scholar] [CrossRef]
  101. Serrano, D. Estudio del Espesor Óptico de Nubes a Partir de Radiación Solar. Ph.D. Thesis, Departament de Física de la Terra i Termodinàmica, Facultat de Física de la Universitat de València, València, Spain, 2015. Available online: https://core.ac.uk/download/pdf/71041992.pdf (accessed on 10 May 2025).
  102. Abal, G.; Aicardi, D.; Suárez, R.A.; Laguarda, A. Performance of empirical models for diffuse fraction in Uruguay. Sol. Energy 2017, 141, 166–181. [Google Scholar] [CrossRef]
  103. Baldasano, J.M.; Calbó, J.; Moreno, J. Atlas de Radiació Solar a Catalunya (Dades del Període 1964–1993); Informe RS94; Institut de Tecnologia i Modelització Ambiental de la Universitat Politècnica de Catalunya: Barcelona, Spain, 1994. [Google Scholar]
  104. Kondratyev, K.Y. Radiation in the Atmosphere; Academic Press, Inc.: Cambridge, MA, USA, 1969; Chapter 6. [Google Scholar]
  105. Kumar, L.; Skidmore, A.K.; Knowles, E. Modelling topographic variation in solar radiation in a GIS environment. Int. J. Geogr. Inf. Sci. 1997, 11, 475–497. [Google Scholar] [CrossRef]
  106. Liu, B.Y.; Jordan, R.C. The interrelationship and characteristic distribution of direct, diffuse and total solar radiation. Sol. Energy 1960, 4, 1–19. [Google Scholar] [CrossRef]
  107. Page, J. Prediction of Solar Radiation on Inclined Surfaces; Solar Energy, R&D in the European Community. Series F: Solar Radiation Data; Springer Dordrecht Publishing Company: Dordrecht, The Netherlands, 1986; Volume 3. [Google Scholar]
  108. Wilcox, S. National Solar Radiation Database 1991–2010 Update: User’s Manual. National Renewable Energy Laboratory–NREL. 2012. Available online: https://www.nrel.gov/docs/fy12osti/54824.pdf (accessed on 10 May 2025).
  109. NSRDB. International Data. 2023. Available online: https://nsrdb.nrel.gov/data-sets/international-data (accessed on 10 May 2025).
  110. NSRDB. US Data. 2023. Available online: https://nsrdb.nrel.gov/data-sets/us-data (accessed on 10 May 2025).
  111. Gschwind, B.; Wald, L.; Blanc, P.; Lefèvre, M.; Schroedter-Homscheidt, M.; Arola, A. Improving the McClear model estimating the downwelling solar radiation at ground level in cloud-free conditions—McClear-v3. Meteorol. Z. 2019, 28, 147–163. [Google Scholar] [CrossRef]
  112. Lefèvre, M.; Wald, L. Validation of the McClear clear-sky model in desert conditions with three stations in Israel. Adv. Sci. Res. 2016, 13, 21–26. [Google Scholar] [CrossRef]
  113. ISO/TC 20/SC 14; Space Environment (Natural and Artificial)—Process for Determining Solar Irradiances. International Standards Organization: Geneva, Switzerland, 2007.
  114. Rothermel, R.; Wilson, R.A.; Morris, G.A.; Sackett, S.S. Modelling Moisture Content of Fine Dead Wildland Fuels. Input to the BEHAVE Fire Prediction System. USDA For. Serv. Intermount. Res. Station, Research Paper INT-359. 1986. Available online: https://www.fs.usda.gov/rm/pubs_int/int_rp359.pdf (accessed on 10 May 2025).
  115. Psiloglou, B.; Kambezidis, H.; Kaskaoutis, D.; Karagiannis, D.; Polo, J. Comparison between MRM simulations, CAMS and PVGIS databases with measured solar radiation components at the Methoni station, Greece. Renew. Energy 2020, 146, 1372–1391. [Google Scholar] [CrossRef]
  116. Aguilar, C.; Herrero, J.; Polo, M.J. Topographic effects on solar radiation distribution in mountainous watersheds and their influence on reference evapotranspiration estimates at watershed scale. Hydrol. Earth Syst. Sci. 2010, 14, 2479–2494. [Google Scholar] [CrossRef]
  117. Royé, D.; Lorenzo, N.; Rasilla, D.; Martí, A. Spatio-temporal variations of cloud fraction based on circulation types in the Iberian Peninsula. Int. J. Climatol. 2018, 39, 1716–1732. [Google Scholar] [CrossRef]
  118. WMO. Surface Radiation Budget. Global Climate Observing System (World Meteorological Organization). 2025. Available online: https://gcos.wmo.int/site/global-climate-observing-system-gcos/essential-climate-variables/surface-radiation-budget (accessed on 10 May 2025).
  119. Ouhechou, A.; Philippon, N.; Morel, B.; Trentmann, J.; Graillet, A.; Mariscal, A.; Nouvellon, Y. Inter-comparison and validation against in-situ measurements of satellite estimates of incoming solar radiation for Central Africa: From the annual means to the diurnal cycles. Atmos. Res. 2023, 287, 106711. [Google Scholar] [CrossRef]
  120. AEMET. Guía Resmida del Clima en España (1981–2010). Ministerio Para la Transición Ecológica y el Reto Demográfico (Gobierno de España). 2024. Available online: https://www.aemet.es/es/conocermas/recursos_en_linea/publicaciones_y_estudios/publicaciones/detalles/guia_resumida_2010 (accessed on 10 May 2025).
  121. iAgua. Medidas Urgentes Para Paliar la Sequía en el Júcar, Segura, Guadiana y Guadalquivir. 2008. Available online: https://www.iagua.es/2008/10/el-gobierno-aprueba-un-real-decreto-ley-de-medidas-urgentes-para-paliar-los-efectos-de-la-sequia-en-determinados-ambitos (accessed on 10 May 2025).
  122. Vicente-Serrano, S.; Trigo, R.; López-Moreno, J.; Liberato, M.; Lorenzo-Lacruz, J.; Beguería, S.; Morán-Tejeda, E.; El Kenawy, A. Extreme winter precipitation in the Iberian Peninsula in 2010: Anomalies, driving mechanisms and future projections. Clim. Res. 2011, 46, 51–65. [Google Scholar] [CrossRef]
  123. Parra, S. Todavía no lo Hemos Visto Todo en Auroras Boreales: Lo Que Está por Llegar. National Geographic España. 2024. Available online: https://www.nationalgeographic.com.es/ciencia/todavia-no-hemos-visto-todo-auroras-boreales-que-esta-por-llegar_22270 (accessed on 10 May 2025).
  124. Ward, T. 2024 Podría Traernos las Mejores Auroras en 20 Años. National Geographic. 2023. Available online: https://www.nationalgeographic.es/espacio/2023/12/auroras-boreales-2024-mejores-en-20-anos (accessed on 10 May 2025).
  125. Wild, M.; Gilgen, H.; Roesch, A.; Ohmura, A.; Long, C.N.; Dutton, E.G.; Forgan, B.; Kallis, A.; Russak, V.; Tsvetkov, A. From Dimming to Brightening: Decadal Changes in Solar Radiation at Earth’s Surface. Science 2005, 308, 847–850. [Google Scholar] [CrossRef]
  126. Dobrowski, S.Z.; Abatzoglou, J.T.; Greenberg, J.A.; Schladow, S. How much influence does landscape-scale physiography have on air temperature in a mountain environment? Agric. For. Meteorol. 2009, 149, 1751–1758. [Google Scholar] [CrossRef]
  127. Meineri, E.; Dahlberg, C.J.; Hylander, K. Using Gaussian Bayesian Networks to disentangle direct and indirect associations between landscape physiography, environmental variables and species distribution. Ecol. Model. 2015, 313, 127–136. [Google Scholar] [CrossRef]
  128. IDEAM. Características de la Radiación Solar. Ministerio de Ambiente y Desarrollo Sostenible (Gobierno de Colombia). 2024. Available online: http://www.ideam.gov.co/web/tiempo-y-clima/caracteristicas-de-la-radiacion-solar# (accessed on 10 May 2025).
Figure 1. Comparison of the validation results of different solar radiation models (SRM) based on the AEMET–SNIRH network. Validation results units: kWh·m−2. MBE is computed as predicted-observed. The best monthly results are highlighted in green, while the worst are highlighted in grey (without considering the CAC model as these are always the worst). For each quality indicator value of the models, the best overall results are highlighted in yellow, while the worst are highlighted in purple. The different scenarios with RMSE > 0.36 kWh·m−2 are highlighted in bold. Special CAC validation results (right panel): blue highlights the similar results with other models and pink highlights non-significant (p-value ≥ 0.05) correlations. Statistics computed: median (MED); average (AVG); minimum (MIN); and maximum (MAX). The number of monthly scenarios resulting in a non-significant correlation over the time span is also shown (lower panel; nS.r), along with the best-performing model in these cases.
Atmosphere 16 00590 g001
Figure 2. Solar radiation error distribution. Solar radiation error distribution of the best-performing solar radiation model (SRM) according to the RMSE results presented in Figure 1.
Atmosphere 16 00590 g002
Table 1. Filtered according to TDC [1] and +2 RMSE STDV [2] for improving validation results. Validation results units: kWh·m−2. Filter of the best-performing models presented in Figure 1. n.days.P: number of potential days based on the monthly time span. How % TDC & + 2 RMSE STDV n.stations are computed: TDC ≤ 45% [1] = n.stations where the TDC is equal or less than 45% of the data, considering the ratio of observations to n.days.P; +2 RMSE STDV [2] = n.stations where the error is greater than two standard deviations from the RMSE; % [1]+[2] = the percentage of removed stations after filtering processes with respect to AEMET–SNIRH n.stations. The best monthly results are highlighted in green. The different scenarios with RMSE > 0.36 kWh·m−2 are highlighted in bold.
NON-FILTEREDAEMET-SNIRH
n.Stations
n.Days.P% TDC & +2 RMSE STDVFILTERED
RMSE
The Best-Performing
Model
RMSETDC ≤ 45 % [1]
n.Stations
+2 RMSE STDV [2]
n.Stations
% [1] + [2]
JanInsolMets0.2214052724 1 17.9 0.18
FebInsolMets0.2914048123 2 17.9 0.26
MarSARAH & InsolMets0.3614052725252319.320.00.340.32
AprInsolMets0.3614051028 4 22.9 0.33
MayInsolMets0.4714152725 3 19.9 0.39
JunInsolMets0.4314151027 4 22.0 0.36
JulInsolMets0.4514152727 3 21.3 0.42
AugInsolMets0.3914152735 3 27.0 0.36
SepInsolMets0.3514051028 5 23.6 0.32
OctInsolMets0.3414052733 2 25.0 0.28
NovPVGIS & InsolMets0.2714051041373231.427.90.250.20
DecPVGIS & InsolMets0.2413952737323028.823.00.220.20
58 = total stations removed; 48 = stations coincident with the total ones removed
Table 2. Comparison of InsolMets and CAC validation results: improvement in the best-performing model compared the worst-performing model. Validation results units: kWh·m−2. The different scenarios with RMSE > 0.36 kWh·m−2 are highlighted in bold. In addition, once the filtering processes are applied, the MBE, the NRMSE, and the Pearson correlation coefficient (r) of InsolMets are provided.
RMSEAEMET-SNIRHInsolMets
InsolMetsCACDIFFImprovkWh·m−2MBENRMSEr
Jan0.180.470.2961.52.05−0.110.090.93
Feb0.260.480.2245.72.96−0.140.090.83
Mar0.320.550.2342.14.24−0.310.070.81
Apr0.330.620.2946.35.29−0.160.060.85
May0.390.660.2740.56.45−0.620.060.81
Jun0.360.670.3045.37.13−0.510.050.86
Jul0.420.590.1729.17.16−0.010.060.76
Aug0.360.510.1529.16.34−0.010.060.75
Sep0.320.440.1227.45.02−0.360.060.67
Oct0.280.510.2345.43.38−0.370.080.82
Nov0.200.500.3059.72.28−0.160.090.92
Dec0.200.410.2252.01.89−0.150.100.89
DIFF (kWh·m−2) = difference between RMSE CAC (worst-performing model) and RMSE InsolMets
(best-performing model). Improv (%) = improvement considering the RMSE DIFF to RMSE CAC
Disclaimer/Publisher’s Note: The statements, opinions and data contained in all publications are solely those of the individual author(s) and contributor(s) and not of MDPI and/or the editor(s). MDPI and/or the editor(s) disclaim responsibility for any injury to people or property resulting from any ideas, methods, instructions or products referred to in the content.

